Final Project Final Work 222222222222
91
CHAPTER ONE INTRODUCTION 1.1. BACKGROUND OF THE STUDY According to Charles H. Gibson (2009), performance appraisal is a judgemental process which has a primary objective of identifying in a financial statement, major changes in trends, amounts, and relationships and investigation of the reasons underlying those changes. Pike and Neale (2006) defines performance appraisal as analysing financial statements through the use of ratios in interpreting accounts. These scholars explained that an enterprise’s or a company’s growth is best examined through a financial performance appraisal analysis. Loth (2008), also defines financial performance as a company’s ability to generate new resources, from day to day operations, over a given period of time. 1
Transcript of Final Project Final Work 222222222222
CHAPTER ONE
INTRODUCTION
1.1. BACKGROUND OF THE STUDY
According to Charles H. Gibson (2009), performance appraisal is a judgemental process which
has a primary objective of identifying in a financial statement, major changes in trends, amounts,
and relationships and investigation of the reasons underlying those changes.
Pike and Neale (2006) defines performance appraisal as analysing financial statements through
the use of ratios in interpreting accounts. These scholars explained that an enterprise’s or a
company’s growth is best examined through a financial performance appraisal analysis.
Loth (2008), also defines financial performance as a company’s ability to generate new
resources, from day to day operations, over a given period of time.
Watson and Head, (2007) refers to financial ratios as appraisal methods that are used in
analysing and interpreting financial information. That is, ratios are used to examine the various
aspects of financial position and performance which could then be used by potential stakeholders
for planning, controlling and evaluation purposes.
According to Wood (2005), performance appraisal is a scientific evaluation of the profitability
and financial strength of any business concern.
1
These ratios and other indicators of financial appraisal would be analysed, evaluated and
interpreted in detail in the next chapter (literature review).
Ghana's most important manufacturing industries include light manufacturing, aluminium
smelting, food processing, cement, and small commercial ship building. Industries in Ghana
accounts for about 25.3 per cent of total GDP. (Ghana Statistical Services 2005). The lack of
capital has slowed growth in Ghana, but foreign capital has increased in recent years. Most
products are for local consumption, and most of Ghana's exports are raw materials.
The focus of this study is on (Naachiaa Estates Limited) NEL serving sectors including the
building and construction within the country. The Government can therefore assist such
companies in the manufacturing industry in raising funds to enhance their capital assets and
instituting attractive incentive packages for those growing companies as well as start-up capital
for newer companies.
1.2 STATEMENT OF THE PROBLEM
A company’s ability to generate resources from its day to day operations is vital to the continued
growth of the company. Performance measurement is therefore very imperative in assessing the
growth and prospects of a business. Ascertaining the going concern of a company in likewise
manner requires examination of its past and current performance in order to predict the future
prospects. By using performance measures, a company’s performance can be linked more closely
with shareholder value and wealth, attention can thus be directed to ways in which companies
can create more value for shareholders.
2
Therefore, this study seeks to adopt ratio analysis and balance score card as key performance
appraisal method to examine, evaluate and interpret the growth trend of NEL over a three year
period.
1.3 PURPOSE OF THE RESEARCH
The study seeks to achieve the following objectives from the gaps identified;
i. To examine the internal control of the enterprise
ii. To measure liquidity position of the enterprise
iii. To find out the profitability trend of the enterprise given its level of investment and
turnover
iv. To examine the level of gearing and investment ratios of the enterprise
v. To suggest appropriate strategies and actions to the management of NEL to help improve
their performance in the industry.
1.4 RESEARCH QUESTIONS
i. Is there a standardize financial information for comparisons?
ii. What is the performance of NEL when compare with past performance?
iii. What is the performance on NEL when compare against other firms or industry
standards?
iv. Is NEL operations more proficient?
v. What risk is with it operation?
3

1.5. SIGNIFICANCE OF THE STUDY
This study will serve as a guide to the management of other companies in the industry as a result
of access to key success factors prevalent to NEL. Potential investors through this study could
enhance their decision making process through the analysis of data collected and the results
obtained from the critical analysis thereof. Also, it would serve as a reference guide to students,
lecturers and other researchers.
4

CHAPTER TWO
LITERATURE REVIEW
2.0 INTRODUCTION
The literature review begins with an introductory background of the Naachiaa Estates Limited
and the various definitions of key technical terms: performance measurement and financial
analysis, what scholars have discussed about performance measurement, critiques raised against
performance measurement, the importance and limitation of performance measurement.
The chapter further explains other related studies made on the subject matter and makes clear
which financial statements, factors and indicators are mostly used to assess the financial
performance.
2.1. PERFORMANCE MEASUREMENT
Moullin (2003) defines performance measurement, “As evaluating how well organizations are
managed and the value they deliver for customers and other stakeholders’’. He explained this as
assessing the health status of an organization and how best it is controlled by management to
maximize stakeholders’ wealth.
Burylo (2006) explicates performance management as a tool universally used to assess how well
someone or something has done against set objectives or peers.
5

Adams, Kennerley and Neely in their book Performance Prism (2002) also defined performance
measurement as “the process of quantifying the efficiency and effectiveness of past action” they
based their definition on quantifying the efficiency and the effectiveness dimensions of decisions
2.2. FINANCIAL ANALYSIS
There are various methods or techniques that are used in analyzing financial statements, such as
comparative statements, schedule of changes in working capital, common size percentages, funds
analysis, trend analysis, and ratios analysis.
Financial statements are prepared to meet external reporting obligations and also for decision
making purposes. They play a dominant role in setting the framework of managerial decisions.
But the information provided in the financial statements is not an end in itself as no meaningful
conclusions can be drawn from these statements alone. However, the information provided in the
financial statements is of immense use in making decisions through analysis and interpretation of
financial statements.
Oxford Dictionary of Finance and banking, 2005, defines financial analysis as the use of
financial statements and the calculation of ratios, to monitor and evaluate the financial
performance and position of a business
Financial statement analysis is a preliminary step towards the final evaluation of the results
drawn by the analyst or management accountant.
6
2.3. MANAGEMENT EFFICIENCY- (QUALITATIVE FACTOR)
The stewardship era, was the time where owners of resources, employed people to manage the
resources for them. The Mathew Effect led to the introduction of performance measurement, as
the managers were assessed based on the performance of the business. In the 1980s, shareholder
activism reached unprecedented levels and led to increased pressure on firms to maximize
shareholder value consistently as well as other stakeholders’ interest.
Generally shareholders wealth can be measured based on the financial health of the organization.
Time magazine summarized this activism as "Angry investors closed out the Decade of Greed
with demands that executive compensation should be tied to company performance"(Smolowe,
1996).
Kenkel (2001) indicated that Boards of Directors have the responsibility to evaluate the annual
audit and to track the financial successes or failures of the organization. This means the directors
need to not only be able to read the financials and see trends, but they also must be able to
understand the underlying causes of those trends. The board must be able to compare their
organization financials to industry benchmarks, peer performance, and business projections.
According to Johnson et al, 2009, the resource based view (RBV) of a strategy, the competitive
advantage and superior performance of an organisation is explained by the distinctiveness of its
capabilities and the most basic concept is that of resources comprising physical, financial, human
and intellectual resources.
7

The ways an organisation manages its valuable human resources determines to a larger extent
the success of the organisation. It is also important for organisations that seek to build
competitive advantage to have capabilities that are of value to its customers.
2.4. EXISTING PERFORMANCE MEASUREMENT FRAMEWORKS
For many years, frameworks have been used by organizations to define the measures that should
be used to assess their Financial Performance. From early in the 20th Century, DuPont used a
pyramid of financial ratios, which linked a wide range of financial ratios to return on investment.
The pyramid of financial ratios had an explicit hierarchical structure, linking measures at
different organizational levels (Neely, 1998).
Following their study of performance measurement in service industries, Fitzgerald et al. (1991)
proposed a framework classifying measures into two basic types: those relating to results
(competitiveness, financial performance) and those that focus on the determinants of those
results (quality, flexibility, resource utilization and innovation).
ChienHo and Song Zhu, (2004 ) showed in their study that most previous studies concerning
company or business performance evaluation focus merely on operational efficiency and
operational effectiveness which might directly influence the survival of a company. By using an
innovative two-stage data envelopment analysis model in their study, the empirical result of this
study is that a company with better efficiency does not always mean that it has better
effectiveness.
8
The most popular of the performance measurement frameworks has been the Balanced Scorecard
proposed by Kaplan and Norton (1992 and 1996). The Balanced Scorecard identifies and
integrates four different ways of looking at performance (Financial, Customer, Internal Business
and Innovation and Learning Perspectives). The authors identify the need to ensure that financial
performance, the drivers of it (customer and internal operational performance) and drivers of
ongoing improvement and future performance are given equal weighting.
According to Duncan et al (2004) in their paper ‘Efficiency Customer Service and Financing
Performance among Australian Financial Institutions’ showed that, all financial performance
measures as: interest margin, return on assets, and capital adequacy are positively correlated with
customer service quality scores.
2.5. MEASURING FINANCIAL PERFORMANCE
Watson and Head (2007) in their book Corporate Finance, Principles and Practice establish that
ratio analysis should be applied to financial statements in order to assess the financial
performance of a company. Analysis of financial performance can provide useful financial
information to a wide range of user groups.
Generally, the financial performance of business enterprises or companies have been measured
using a combination of financial ratio analysis, benchmarking, measuring performance against
budget or a mix of these methodologies. (Avkiran, 1995)
9

Again in measuring performance, two major devices can be employed that is common sense and
ratio analysis. (Jones, 1991) He further acknowledged that though the use of ratios was more
popular; common sense is the most important.
The most widely used financial analysis technique is ratio analysis; the analysis of relationships
between two or more line items on the financial statement. Financial ratios are usually expressed
in percentage or times. (Credit Research Foundation, 1999).
Financial statement analysis is important to boards, managers, payers, lenders, and others who
make judgments about the financial health of organizations. One widely accepted method of
assessing financial statements is ratio analysis, which uses data from the balance sheet and
income statement to produce values that have easily interpreted financial meaning.(Flex
monitoring team, 2005)
Crane (2006) asserts that an understanding of the overall financial situation and enterprise
relationships requires three key financial documents: the balance sheet, the income statement and
the cash flow statement.
2.6. FINANCIAL STATEMENTS
2.6.1 Statement of Financial Position (Balance Sheet)
This shows the financial position of an enterprise at the end of the accounting period. The
statement of financial position records the assets and liabilities of a business.
10
Assets are divided into fixed assets, which are expected to be a source of economic benefits to
the business over several accounting periods and current assets, which are consumed or sold
within an accounting period. These assets are balanced by current (short-term) liabilities, such as
trade creditors and overdraft, and long-term liabilities such as debt, shareholders fund and
preference shares. (Watson and Head, 2007).
2.6.2 Income Statement
The financial statement that details for a specific time periods the amount of revenue earned by a
firm, the cost it has incurred, the resulting profit and how it has been appropriated. (Pike, Richard
and Neale, Bill 2006).
2.6.3 Statement of Cash Flow
A cash flow statement shows how cash has been generated and disposed of by an organization
(Wood, 2002).
A cash flow statement reports the sources and uses of cash resources. Such Statements not only
show the change in a firm’s cash resources throughout the year, but also when the cash was
received or spent.
An understanding of the timing of cash receipts and expenditures is critical in managing a whole
organization. Neither an income tax return nor an income statement provides the same
information as a cash flow statement. (Crane 2006)
11

2.7 RATIO ANALYSIS
According to Loth, (2008) analyzing financial statement information (also known as quantitative
analysis), is one of, if not the most important element in the fundamental analysis process. At the
same time, the massive amount of numbers in a company's financial statements can be confusing
and intimidating to many investors. However, through financial ratio analysis, one is able to
work with these numbers in an organized fashion. Accounting ratios are used to analyse and
interpret accounting statements (Wood, 2005).
Wood (2005), ratio analysis is therefore, a first step in assessing the performance and financial
position of an entity. It removes some of the mystique surrounding the financial statements and
makes it easier to pinpoint items which would be interesting to investigate further.
Some of the indicators commonly used to assess company fundamentals include: cash flow;
return on assets; conservative gearing; history of profit retention for funding future growth; and
soundness of capital management for maximizing shareholders earnings and returns. (Atrill and
McLaney, 1997).
2.8 OBJECTIVES OF RATIO ANALYSIS (Brown Et Al)
i. Standardize financial information for comparisons
ii. Evaluate current operations
iii. Compare performance with past performance
iv. Compare performance against other firms or industry standards
v. Study the efficiency of operations
vi. Study the risk of operation.
12

2.9 CLASSIFICATION OF ACCOUNTING RATIOS
Ratios may be classified in a number of ways to suit any particular purpose. Different kinds of
ratios are selected for different types of situations. Mostly, the purpose for which the ratios are
used and the kind of data available determine the nature of analysis. The various accounting
ratios can be classified as follows:
2.9.1 Profitability Ratios
Profitability ratio indicates how successful the managers of a company have been in generating
profit. (Watson and Head, 2007). It can be considered in a form of a percentage at both the gross
and net profit level in order to facilitate making comparisons of a company’s financial
performance against past year’s performance and against the performance of other comparable
companies easier.
Profitability ratios measure the results of business operations or overall performance and
effectiveness of the firm. Some of the most popular profitability ratios are as follows; Gross
profit margin, Net profit margin, Total Asset Turnover and Return on capital employed.
2.9.1.1 Gross Profit Margin
This ratio shows how well cost of production has been controlled as opposed to distribution costs
and administration costs. Gross margin measures the direct production costs of the firm.
The higher the ratio, the higher the efficiency of the production process, as investors tend to
favour companies that are more efficient. The ratio is computed as:
13

Gross Profit margin = Gross profit x 100
Turnover
2.9.1.2. Net Profit Margin
This ratio indicates the efficiency with which costs have been controlled in generating profit
from sales. It is expressed as:
Net Profit margin = Earnings/Profit after Taxes x 100
Turnover/Sales
2.9.1.3. Return on Capital Employed (ROCE)
This ratio reveals the return on capital employed and comments on the efficiency of management
in employing the funds placed at their disposal by shareholders and lenders. (Wood, 2005).
Watson and Head, 2007, refer to ROCE as relating to overall profitability to the finance used to
generate it. A good or bad ROCE is caused by two main factors; (1) the profit on the activity not
large enough or (2) the capital employed has not been effectively managed. Capital Employed
could be defined in any of the following ways:
Capital Employed = Total assets less current liabilities
Return on capital (ROCE) can be calculated as:
ROCE= Profit (Profit before interest and tax)/ capital employed
14
2.9.1./4. Asset Turnover
Asset Turnover is a measure of how effectively the assets are being used to generate sales. That
is, it measures the efficiency of the overall investment by aggregating the joint impact of both
short- and long- term assets. It is computed as:
Assets Turnover =Sales/capital employed
2.9.2. LIQUIDITY RATIOS
This ratio assess whether an enterprise is able to meet its financial obligations as they fall due,
there is the need to compare short-term assets with short-term liabilities (Pike and Neale (2006).
Ratios used under liquidity for the study include: Current ratio, Acid test /Quick ratio and
Operating Cash flow.
2.9.2.1 Current Ratio
Current ratio may be defined as the relationship between current assets and current liabilities.
This ratio is also known as “working capital ratio”.
It is a measure of general liquidity and is most widely used to make the analysis for short term
financial position or liquidity of a firm. The current ratio is calculated as:
Current Ratio = Current Assets
Current Liabilities
2.9.2.2 Quick (Acid Test) Ratio
This ratio is identical to current ratio comparing current assets, excluding inventory, with current
liabilities. Inventory is omitted as it is considered to be relatively illiquid, because it depends
15
upon prevailing and future market forces and may be impossible to convert to cash in the
relatively short time. (Wood, 2005). By excluding inventories, the quick ratio is a more loud
liquidity measure than the current ratio. It is a more appropriate measure for industries that
involve long product production cycles, such as in manufacturing.
The ratio is computed as follows:
Acid Test = Current Assets- Inventory
Current Liabilities
2.9.2.3 Operating Cash Flow Ratio
This ratio measures how well current liabilities are covered by the cash flow generated from a
company’s operations, without having to seek recourse to other sources of funds. This ratio
avoids the issues of actual convertibility to cash, turnover and the need for minimum levels of
working capital (cash) to maintain operations. It is expressed as:
OCF = Cash Flow from Operations
Current Liabilities
2.9.3. GEARING (LEVERAGE) RATIO
Gearing ratios relates to how a company or an enterprise is financed with respect to debt and
equity and can be used to assess the financial risk that arises with increasing debt.
16
2.9.3.1. Interest cover and Interest gearing
Interest cover shows how many times a company can cover its current interest payments out of
current profits and indicates whether servicing debt may be a problem. It measures the protection
available to creditors as the extent to which earnings available for interest “cover” interest
expense. It is expressed as:
Interest cover ratio = Profit/Earnings before interest and Tax (EBIT) x100
Interest Expense
2.9.3.2. Debt/ Equity ratio
The debt/equity ratio determines the entity’s long-term debt- paying ability. The computation
compares the total debt with the total shareholders’ equity. This ratio helps determine how well
creditors are protected in case of insolvency. It is calculated as follows:
Debt/Equity Ratio = Total Debt
Total Equity
2.9.3.3. Debt to assets ratio
As financial leverage reflects the amount of debt used in the capital structure of the firm, debt to
assets ratio measures leverage being used by a company debt in relation to assets of a company.
Debt to Assets ratio = Total Debt
Total Assets
17

2.9.4. INVESTOR RATIOS
Shareholders are more interested in the return they obtain on their investment rather than the
return the company makes on the total business (Pike & Neale) The following investor ratios are
discussed.
2.9.4.1. Earnings per share (EPS)
This identifies the dividend that could be paid on investment to investors for a particular period.
That is, it is a way of expressing the investor’s return on investment on the share. Also, it is the
amount of income earned on a share during an accounting period. The ratio is estimated as:
Earnings per share = Earnings after tax
Number of ordinary share issue
2.9.4.2. Return on Shareholders’ fund (return on equity)
This ratio indicates how profitable the company has been for its shareholders. It excludes debt in
the denominator and uses either pre-tax income (after interest costs) or net income. It is
calculated as:
Return on Equity = Earnings after tax
Shareholders’ fund
2.10 USE AND USERS OF RATIO ANALYSIS (Gibson H. Charles, 2009)
18
There are basically two uses of financial ratio analysis: to track individual firm performance over
time, and to make comparative judgments regarding firm performance. Firm performance is
evaluated using trend analysis—calculating individual ratios on a per-period basis,
and tracking their values over time. This analysis can be used to spot trends that may be cause
for concern, such as an increasing average collection period for outstanding receivables or a
decline in the firm's liquidity status. In this role, ratios serve as red flags for troublesome issues,
or as benchmarks for performance measurement.
2.11. ADVANTAGES OF RATIOS ANALYSIS (Gibson H. Charles, 2009)
Ratio analysis is an important and age-old technique of financial analysis. The following are
some of the advantages / Benefits of ratio analysis:
i. Simplifies financial statements. It simplifies the comprehension of financial statements.
Ratios tell the whole story of changes in the financial condition of the business
ii. Facilitates inter-firm comparison: It provides data for inter-firm comparison. Ratios
highlight the factors associated with successful and unsuccessful firm. They also reveal
strong firms and weak firms, overvalued and undervalued firms.
iii. Helps in planning: It helps in planning and forecasting. Ratios can assist management, in
its basic functions of forecasting. Planning, co-ordination, control and communications.
iv. Makes inter-firm comparison possible: Ratios analysis also makes possible comparison of
the performance of different divisions of the firm. The ratios are helpful in deciding about
their efficiency or otherwise in the past and likely performance in the future.
v. Help in investment decisions: It helps in investment decisions in the case of investors and
lending decisions in the case of bankers etc.
19
2.12. LIMITATIONS OF RATIOS ANALYSIS (Gibson H. Charles, 2009)
The ratios analysis is one of the most powerful tools of financial management. Though ratios are
simple to calculate and easy to understand, they suffer from several limitations.
i. Limitations of financial statements: Ratios are based only on the information which has
been recorded in the financial statements. Financial statements themselves are subject to
several limitations. Thus ratios derived, there from, are also subject to those limitations.
For example, non-financial changes though important for the business are not relevant by
the financial statements. Financial statements are affected to a very great extent by
accounting conventions and concepts. Personal judgment plays a great part in
determining the figures for financial statements.
ii. Comparative study required. Ratios are useful in judging the efficiency of the business
only when they are compared with past results of the business. However, such a
comparison only provide glimpse of the past performance and forecasts for future may
not prove correct since several other factors like market conditions, management policies,
etc. may affect the future operations.
iii. Problems of price level changes: A change in price level can affect the validity of ratios
calculated for different time periods. In such a case the ratio analysis may not clearly
indicate the trend in solvency and profitability of the company.
iv. Lack of adequate standard: No fixed standard can be laid down for ideal ratios. There are
no well accepted standards or rule of thumb for all ratios which can be accepted as norm.
It renders interpretation of the ratios difficult.
20

v. Incomparable: Not only industries differ in their nature, but also the firms of the similar
business widely differ in their size and accounting procedures etc. It makes comparison
of ratios difficult and misleading.
2.13. TREND ANALYSIS
Trend analysis consists of computing financial ratios of a firm at various points in time to
determine if it is improving or deteriorating (Elliot, 2006). The annual growth rate is an
important account such as operating expenses, total revenues, cash and compensation. Generally
shareholders, Board of Directors, management, staff, customers, the public and government look
for positive and sustained growth of an enterprise. The trend analysis of the ratios studies ratios
of several years and isolates the exceptional ones occurring in one or two periods. Trend analysis
is particularly applicable to the items of profit and loss account. The trend of sales and net
income can be studied within two factors; the rate of fixed expansion or secular trend in the
growth of the business and the general price levels.
A number of firms would depict a persistent growth over a period of years. However, to get the
true trend of growth, the sales figure should be adjusted by a suitable index of general price.
Trends of growth can also be found by tabulating and plotting the output or physical volume of
sales expressed in suitable unit of measure. If the general price level is not considered in the
analysis trend growth, it can be misleading.
2.14. INDUSTRY AVERAGE AND COMPARISON WITH COMPETITORS
The analysis of an entity’s financial statements is more meaningful if the results are compared
with industry average and with results of competitors.
21

Several financial services provide composite data on various industries. The analyst faces a
problem when the industry reported cannot clearly include the company being examined because
the company is diversified into many industrial areas. Since many companies do not clearly fit
into any one industry, it is often necessary to use an industry that befits the firm. (Gibson H.
Charles, 2009)
2.15 ASSESSMENT ON RELATED WORKS
The analysis on other works of some research groups of KNUST on the topic ‘Financial
Performance Appraisal’ of DBS Industries and Nwabiagya Rural Bank in the year, May 2010.
The following gabs were identified from their objectives and findings.
2.15.1 Objectives of the Study (Nwabiagya Rural Bank)
The general objective of their research work was to assess and analyze the financial performance
of Nwiabigya Rural Bank, a financial intermediary in the performance of its function as Rural
Bank.
i. To find out the profitable of Nwabiagya Rural Bank.
ii. To establish the viability and liquidity positions of the bank and to ascertain whether the
bank can meet customers and creditors demand as and when required/fall due. That is the
liquidity ratios of the bank will be assessed.
iii. To assess the efficiency of the bank.
iv. To assess savings mobilization and to propose a strategy to improve its performance.
v. To ascertain problems militating against the performance of Nwabiagya R/B’s activities
as financial institution.
22
A policy recommendation will be given to management as to how to move the bank forward in
the midst of keen competition from the Commercial and Development Banks, Non-Bank
Financial Institutions and other rural banks in Ashanti region.
2.15.2 Summary of findings
Nwabiagya Rural Bank, which started at Barekese had been successful in its deposit mobilization
and their high performance is based on some of the strengths which could serve as catalyst for
driving its profits. Some of these strengths and profit drivers are good corporate governance
culture which enhances accuracy, authenticity and timeliness of information disclosure,
remaining very focused as a Rural Bank, continuous demonstration of superior quality service
delivery, effective communication strategy to differentiate itself for clients to see and feel the
difference. (KNUST School of Business, Department of Accounting and Finance; Topic:
Financial Performance of Nwabiagya Rural Bank, Barekese, 2009)
2.15.3 Objectives of the Study (DBS Industry)
Their study seeks to achieve the following objectives
i. To measure liquidity position of the enterprise
ii. To find out the profitability trend of the enterprise given its level of investment and
turnover
iii. To examine the level of gearing and investment ratios of the enterprise
iv. To suggest appropriate strategies and actions to the management of DBSIL to help
improve their performance in the industry.
23
2.15.4 Summary of findings
i. The need for specialised skills is necessary to operate the sophisticated machines and
equipment used for production.
ii. One of the major focus of this research was to examine how profitable DBSIL has been
over the five year period ending December 2008. From the data and analysis made, the
overall profitability of the DBSIL has been favourable in spite of the soaring business
environment and unfavourable economic conditions during the years under review.
iii. The hallmark of DBSIL over the years has been continuous demonstration of superior
quality service delivery through management’s investment in modern and sophisticated
equipment to meet the changing needs of its customers.
iv. Another objective was to examine the level of gearing of the company. The debt to equity
ratio increased in only the first two years and decline substantially for years 2006 through
2008. It can be inferred from the debt to equity over the subsequent years (2006 -2008)
was favourable in that the ratios recorded were less than one. This was due to
management’s ability to finance most of its operations through letters of credit from its
bankers and not necessarily relying on long term loans.
v. The liquidity ratio for the years is not very impressive but for Current ratio which equals
the industry average. This is so because the enterprise relies heavily on letters of credit
and short term loans.
vi. Shareholders can use the investor ratio to assess the wealth creating ability of DBSIL. It
recognizes that the effects of earning to the investors are significant. The investor ratio
continues to rise in the case of return on equity and has an average above that of the
industry, hence the wealth of investors are being maximized. The earnings per share is
24
however insignificant and is way below the industry average. The investment is however
secured as profit is able to cover the current year’s dividends. These can be attributed to
factors such as High after tax profits that are attributed to ordinary shareholders.
(KNUST School of Business, Department of Accounting and Finance; Topic: Financial
Performance of DBS limited, 2010)
2.15.5 Gap identified
Reviewing Financial Performance Appraisal of DBS Industry and Nwabiagya Rural Bank, we
realised that most of their work was centred on the numerical aspect of the studies (i.e. liquidity
position, profitability trend, gearing and investment ratio) neglecting the impact management
contributes to the health status of the organisation.
The most popular of the performance measurement frameworks has been the Balanced
Scorecard proposed by Kaplan and Norton (1992 and 1996). The Balanced Scorecard identifies
and integrates four different ways of looking at performance (Financial, Customer, Internal
Business and Innovation and Learning Perspectives). The authors identify the need to ensure that
financial performance, the drivers of it (customer and internal operational performance) and
drivers of ongoing improvement and future performance are given equal weighting. The
Balanced Scorecard reflects many of the attributes of other measurement frameworks but more
explicitly links measurement to the organization’s strategy.
25

2.15.6 Conclusion
Looking at the gap identified, we seek to balance the financial and management performance of
Naachiaa Estate Ltd by emphasizing on the concept of balance score card (i.e. financial
performance, position and non-financial performance activities).
The literature review seeks to provide us with the framework to our study, as to which specific
area(s) we are looking to analyze performance and also provides as with various methods or
techniques used in analyzing financial statement.
We therefore seek to evaluate the internal operational performance and innovation which
contributes to the health status of the organization and how best it is controlled by management
to maximize shareholders wealth and value.
26

CHAPTER THREE
METHODOLOGY
3.0. INTRODUCTION
This chapter identifies the population and sampling, methods of data collection, data analysis and
limitation. It also presents the organizational profile of NEL. The organizational profile includes
the brief history of NEL, its ownership, corporate mission and vision as well as corporate
objectives. There is also a focus on the management, clientele and services offered by NEL.
3.1. RESEARCH DESIGN
The research design seeks to address the purpose of the research in terms of the questions the
group wishes to answer and the research objectives. This therefore takes into account how the
research questions asked would result in descriptive, descriptive and explanatory, or explanatory
answers.
The researchers under this study therefore seek to adopt descriptive study as the research design
since data collected, quantitatively or qualitatively, from management of NEL will be analysed
through analytical tools in order to get a clearer view of the relationship.
This study uses both primary and secondary data sources in the form of personal interview of
management of NEL. Annual financial statements for the period under study were obtained for
the analysis.
27

3.2. DATA COLLECTION
Two categories of data were collected, that is primary data and secondary data supplemented
with the use of face to face interview with management. Primary data includes a self-
administered interview guide made to management. Various questions were posed, aimed at
gathering information into the operations and performance of NEL. There were personal
interview especially with the Financial Controller of NEL and the key management personnel.
The interviews conducted were used in forming opinions, conclusions and recommendations.
Secondary data used were annual financial statements of NEL and industrial average for the
period under study.
3.3. DATA ANALYSIS
Data collected from the sample was put into qualitative and quantitative analysis. Statistical tools
such as percentage, tables, and graph were employed to analyse the data. The performance
indicators of management were analysed to see whether they were meeting set objectives. Trend
analysis of the financial performance of NEL was also be plotted on a graph and analysed.
Various ratios analytical methods such as liquidity, profitability, market and leverage ratios were
also used to assess the company’s performance.
3.4. LIMITATION
Internal audit as a whole will be too broad an area to be looked at or be treated. For this purpose,
the researchers limited themself to costs and benefits associated with internal audit/controls
within the selected organization.
28
The research work carried out had some short falls. The foremost was the inadequate source of
finance. Since there was no enough help in funding the project.
Another limitation comes from the information gathering for information to help in the writing of
the project.
Even though the researchers encountered all these limitations, it is assured that the limitations do
not affect the authenticity of the study and have no effect on it findings.
3.5. BACKGROUND OF COMPANY UNDER REVIEW
3.5.1.Naachiaa Estate Limited
The company was incorporated under the company’s code act 179, 1963 on 10 th April, 1997 but
was issue with a certificate to commence business on 14th may, 1997 to go into real estate
business in order to bridge the housing deficit gap in the country.
It was then realise that, to go into this real estate business and to do it well, and also due to the
location of the company it became necessary to start the manufacturing division of producing
concrete products. The manufacturing activities started in may 1999 in the manufacturing of
acrylic roofing tiles and concrete block (solid and hollow) of difference sizes. Later the
pavement blocks of different shapes were added.
Naachiaa Estate Limited (NEL) also manufactures quality and guaranteed kerbs, culverts and
slabs, perfect for the tropical homes and commercial properties.
29

3.5.2 Objectives
NEL believes that its success depends, for the most part, on its ability to maintain a pool of
diverse, resourceful and dynamic workforce to serve its customers. NEL also believes in
perseverance, determination, resolve, fortitude in the manufacturing industry considered to be
one of the main focal points of the Ghanaian economy. The business has a policy that seeks to
source, attract, develop and retain the best talents. Consequently NEL continuously strives to:
i. Provide an environment that identifies, encourages, and rewards excellence, innovation
and quality customer service.
ii. Provide the climate and resources that enable staff to advance on merit as far as their
talents and competence will take them.
3.5.3 Mission statement
The company’s mission is “To provide low cost affordable housing and concrete materials for
the general public”. So to achieve this, our daily objective is to provide the best in customers
demand. (http://naachiaagroup.com)
3.5.4 Vision statement
NEL’s vision is “to bridge the housing deficit gap in Ghana”
3.5.5 Competitors
Major competitors are foreign importers and local manufacturers. Some of these companies are
Adom Super Blocks Limited, Eno Mma Company Limited, Fycroph Industries and Nana
Kwadwo Gyasi Company Limited all in Kumasi.
30

CHAPTER FOUR
FINDINGS AND ANALYSIS
4.0 INTRODUCTION
This chapter focuses on data collected from the audited financial statements; these include the
trading, profit and loss account (income statement) the balance sheet (statement of financial
position) and Statement of Cash flow of Naachiaa Estate limited and industrial average
(Compiled by KNUST School of Business, Department of Accounting and Finance; Topic:
Financial Performance of DBS limited, 2010). The findings and analysis were performed with
regard to the following:
i. Trend analysis of NEL, by comparing its financial performance from 2007 to 2009.
ii. Financial analysis- Ratios and graphical analysis of NEL within the three year period of
study.
iii. A comparison of NEL performance with an industrial average in the manufacturing
sector with reference to Adom Super Blocks Ltd, Eno Mma Company Ltd, Nana
Kwadwo Gyasi Company Ltd. This analysis will cover a three year period starting from
2007 to 2009 due to information restrain.
4.1. TREND ANALYSIS OF NEL
Critical look was given to turnover or sales trend, gross profit margin, net profit margin before
and after interest and taxation, assets, shareholders fund and liabilities. This is because, the
turnover or sales is the major source of revenue derived from the core activities of the business
31
for survival and growth. This analysis unveiled the most productive activity that adds value to
the business in terms of revenue generation for decision purposes.
Decisions taken regarding cost of sales were reliant on the trend of the gross profit margin. One
major aspect of concern to management of NEL was the effective management of its operating
expenses because their control was much extended to the operating section of the business. This
led to emphasis on the net profit before tax and interest.
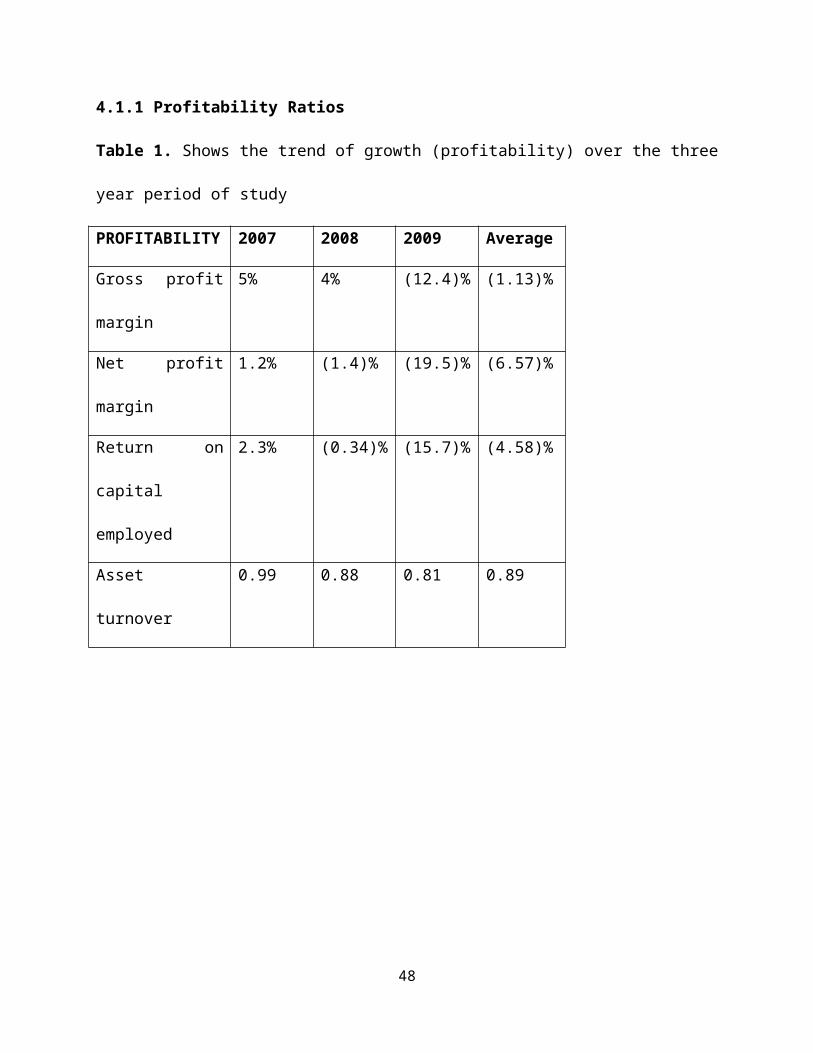
4.1.1 Profitability Ratios
Table 1. Shows the trend of growth (profitability) over the three year period of study
PROFITABILITY 2007 2008 2009 Average
Gross profit margin 5% 4% (12.4)% (1.13)%
Net profit margin 1.2% (1.4)% (19.5)% (6.57)%
Return on capital
employed
2.3% (0.34)% (15.7)% (4.58)%
Asset turnover 0.99 0.88 0.81 0.89
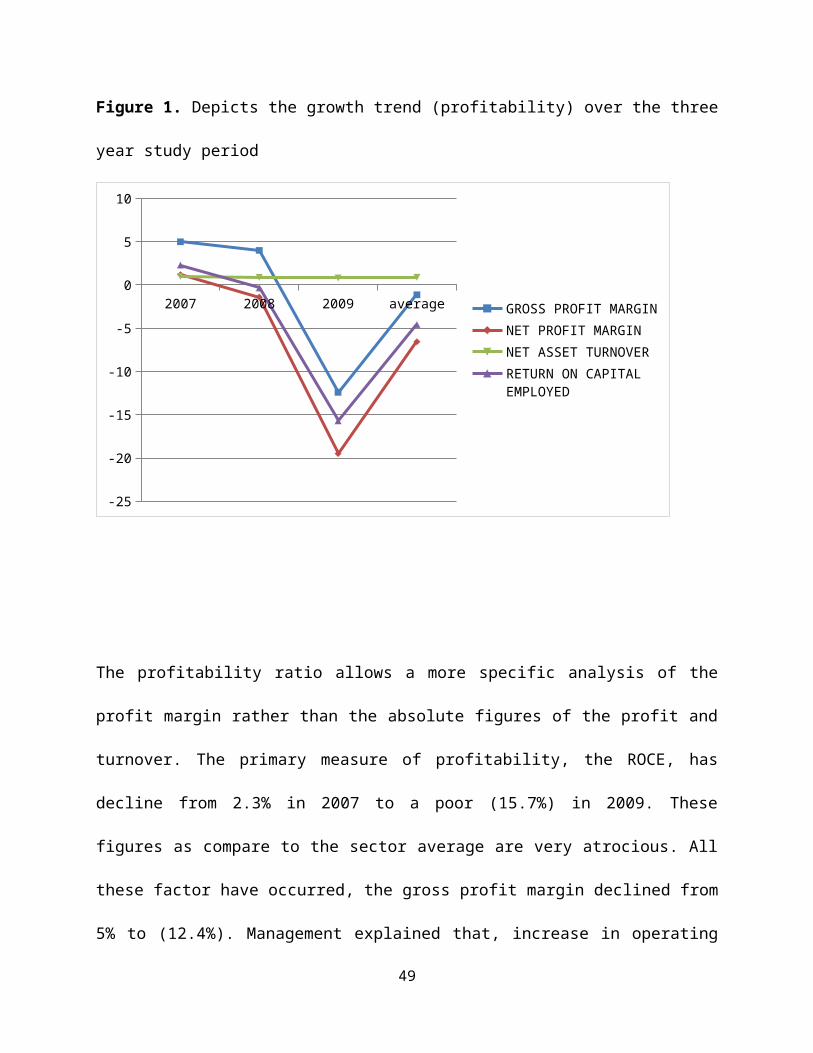
Figure 1. Depicts the growth trend (profitability) over the three year study period
32
The profitability ratio allows a more specific analysis of the profit margin rather than the
absolute figures of the profit and turnover. The primary measure of profitability, the ROCE, has
decline from 2.3% in 2007 to a poor (15.7%) in 2009. These figures as compare to the sector
average are very atrocious. All these factor have occurred, the gross profit margin declined from
5% to (12.4%). Management explained that, increase in operating cost such as salaries, wages,
fuel and lubricants during the period led to the unfavourable gross profit margin. It was
explained further that, the subsequent years fall in sales was influenced by entry of new
competitors in the industry, less expenses on advertising and economic factors such as increase
in fuel prices, electricity and inflation. Net profit margin, for the first year was little over 1% and
it considerably reduced for the three years. In 2008, an increase from (1.4%) to (19.5%) occurred
resulted in a percentage rise of (18.1%).
33
2007 2008 2009 average
-25
-20
-15
-10
-5
0
5
10
GROSS PROFIT MARGINNET PROFIT MARGINNET ASSET TURNOVERRETURN ON CAPITAL EMPLOYED
Mr. Arhin Kwame John, the financial manager explained that, the decline in the profit margin
was directly allocated to low sales, increase in wages and salaries and marginal rise of
production cost due to inflation. . In 2009, expenses such as Audit fees, Motor running expense,
Canteen, to mention a few had risen and that led to a fall from 1.2% in 2007 to a negative figure
of (19.5)% in 2008.
The ROCE can be said to be the measure of how management are efficiently using the assets
under their control. From the above graph, it is eminent that the return on capital employed was
impressive for the first year recording 2.3%. In 2008, the ROCE recorded a negative figure of
(0.34)% representing a decline by 1.96%.
Total asset turnover in 2007 was 0.99. It recorded 0.88 and 0.81 in 2008 and 2009 respectively.
The fall in return on capital employed and the asset turnover was due to, according to
management, the underutilisation of assets within the period under review. Management
subsequently realised the need to meet up the changing demand of customers and therefore
employed sophisticated machines and equipment for production. This decision is expected to
yield positive results as many sales will be generated from the efficient utilisation of the acquired
assets in the subsequent years.
34
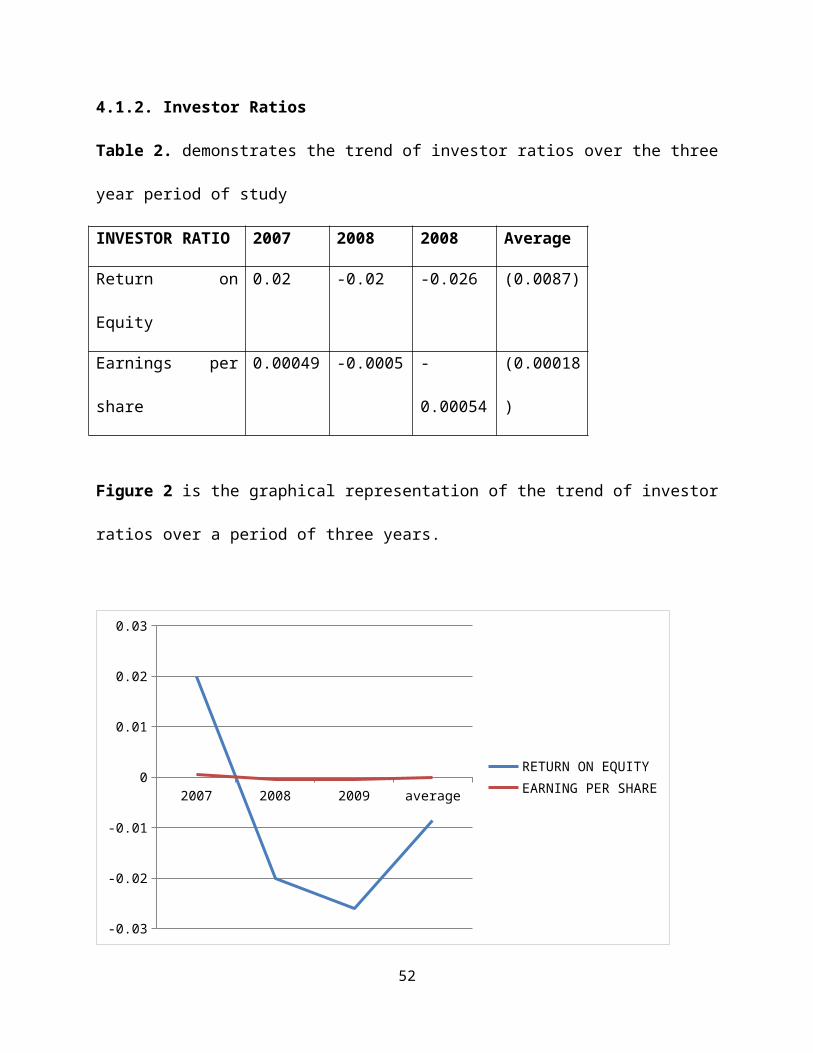
4.1.2. Investor Ratios
Table 2. demonstrates the trend of investor ratios over the three year period of study
INVESTOR RATIO 2007 2008 2008 Average
Return on Equity 0.02 -0.02 -0.026 (0.0087)
Earnings per share 0.00049 -0.0005 -0.00054 (0.00018)
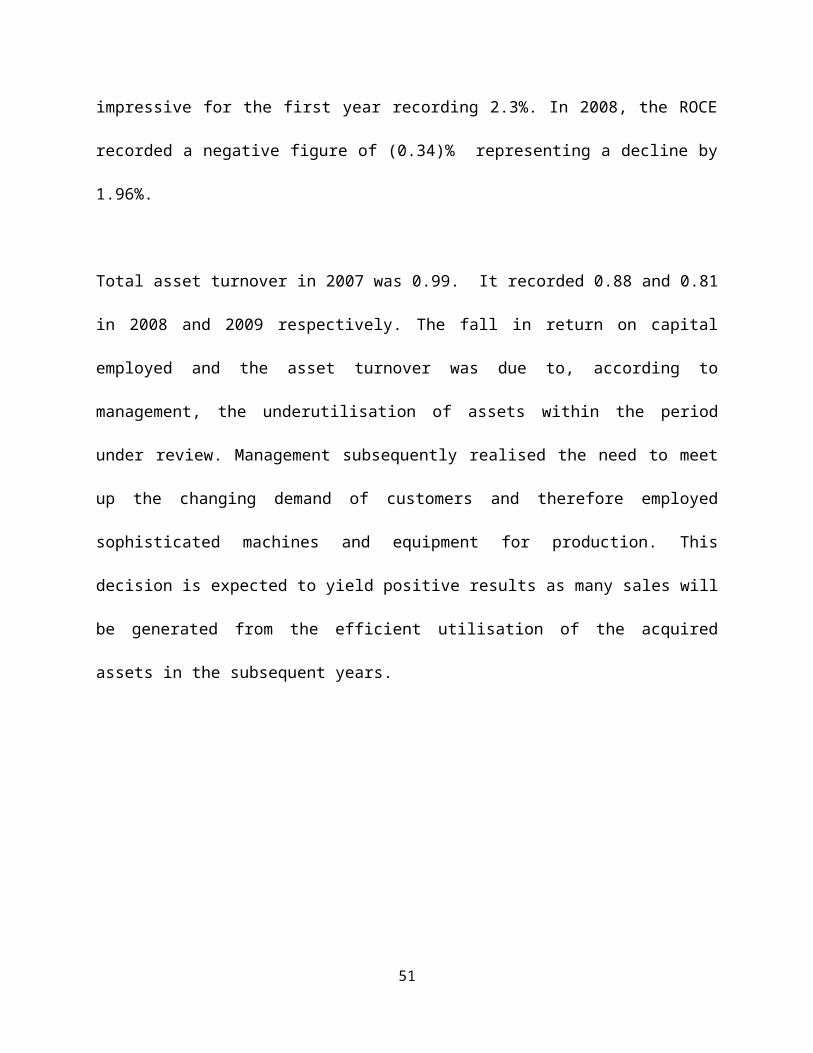
Figure 2 is the graphical representation of the trend of investor ratios over a period of three
years.
2007 2008 2009 average
-0.03
-0.02
-0.01
0
0.01
0.02
0.03
RETURN ON EQUITYEARNING PER SHARE
Return on equity measures how well management is doing for the investor because it tells how
much earning they are getting for each of the investor’s invested wealth. From the graph, the rate
of return in 2007 stood at 0.02%. In 2008 and 2009, the rate of return on equity fell to (0.02) %
and (0.026) % respectively.
35
From the information gathered from the interview with Mr. Arhin Kwame John, the financial
manager, the company as a policy does not distribute its profit as dividends to investors. Thus,
almost all of profits earned within a period are retained in the business.
4.1.3. Gearing /Leverage Ratio
TABLE 3. Shows the trend of gearing over the three year study period
GEARING RATIO 2007 2008 2009 Average
Interest cover 7.3 (2.9) (78) (24.53)
Debt to Equity 8% 86% 92% 62%
Debt to Total Assets 0.5 0.5 0.4 0.47
Figure 3 below is the graphical representation of the trend of gearing ratios over a period of
three years.
36

2007 2008 2009 average
-100
-50
0
50
100
150
INTEREST COVER RATIODEBT/EQUITY RATIODEBT TO TOTAL ASSETS
Interest cover measures the company’s ability to meet its finance cost or interest expense out of
the period’s profit before interest and tax. The higher the ratio, the more productive and efficient
the company is. From the graph, it is evident that, the company recorded an unimpressive
performance on profit during the period. Mr Arhin kwame John, the financial manager
elaborated that, the poor performance for interest cover was due to the fact that the company had
to reduce sales margin so as to penetrate the market and also for competition purpose. This
resulted in a decline in profit in the period and hence such an unfavourable performance.
He stated in addition that, the Naachiaa Estate Limited mostly relies on its subsidiary for funds
(Plant Pool) and bank overdraft. Since the company relies mostly on its subsidiary for funds, it is
able to avoid huge interest payment.
37

Debt to equity ratio measures the proportion of the company’s capital structure financed by debt
in relation to equity. The higher the ratio, the more the company is highly geared and vice versa.
From the information gathered, NEL funding from its subsidiary kept on increasing from year to
year recording an all time increase in 2009 of 0.92. This according to management, it was as a
result of a long term loan (deferred liability) secured from the plant pool for asset acquisition.
Though the company has a deferred liability to meet, its performance as compared to the
industrial average of 2.46 is very impressive.
The debt to assets ratio measures the percentage of the company’s assets financed by debt. The
trend of the debt to assets ratio depicts a productive results over the years expect in 2009 where
there was a slight decrease in margin. According to Mr Arhin Kwame John the financial
manager, the impressive performance was as a result of its reliance on retained earnings for the
acquisition of asset and other operational functions.
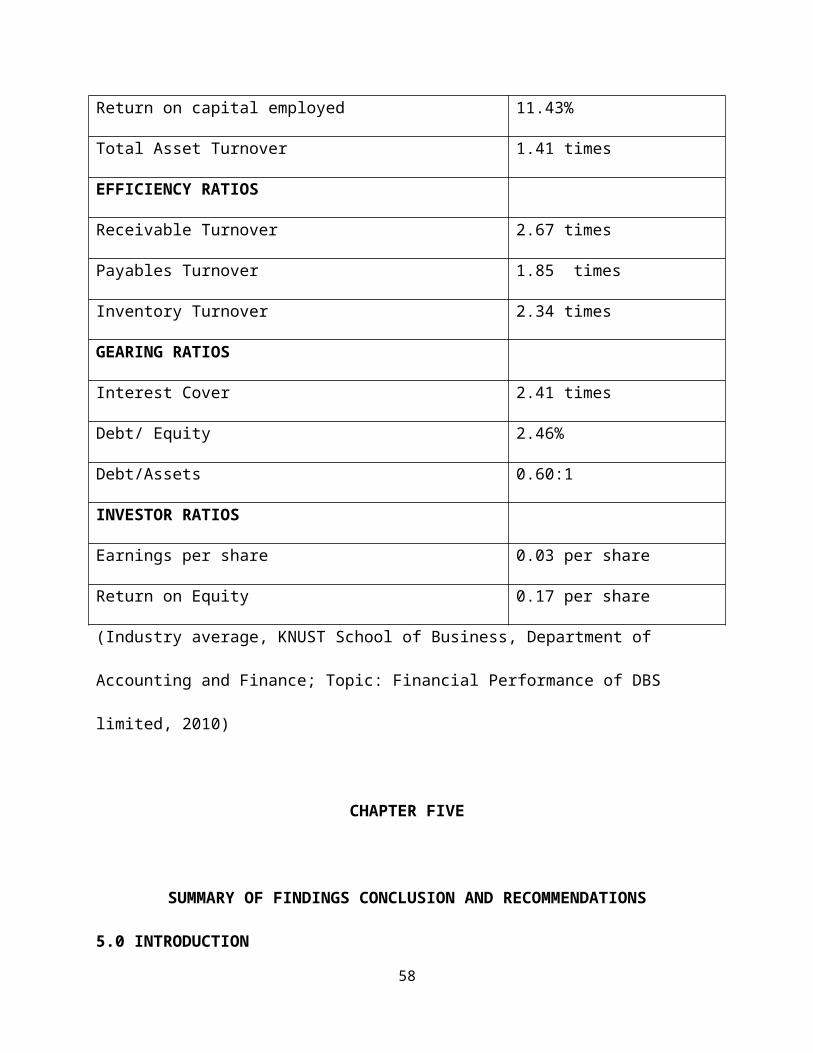
Table 4. Below shows the computed industrial average’s for the ratio categories indicated in the
manufacturing industry. The companies used in the computation of the industrial average were
Adom Super Blocks Ltd, Eno Mma Company Ltd, Nana Kwadwo Gyasi Company Ltd. The
calculation of the industrial average is attached to the appendix of this study.
LIQUIDITY RATIO INDUSTRIAL AVERAGE
Current ratio 1.15:1
Operating Cash flow 0.13:1
Quick ratio 0.31:1
38

PROFITABILITY RATIO
Gross profit margin 10.09%
Net profit margin 4.08%
Return on capital employed 11.43%
Total Asset Turnover 1.41 times
EFFICIENCY RATIOS
Receivable Turnover 2.67 times
Payables Turnover 1.85 times
Inventory Turnover 2.34 times
GEARING RATIOS
Interest Cover 2.41 times
Debt/ Equity 2.46%
Debt/Assets 0.60:1
INVESTOR RATIOS
Earnings per share 0.03 per share
Return on Equity 0.17 per share
(Industry average, KNUST School of Business, Department of Accounting and Finance; Topic:
Financial Performance of DBS limited, 2010)
CHAPTER FIVE
SUMMARY OF FINDINGS CONCLUSION AND RECOMMENDATIONS
5.0 INTRODUCTION
39
Golden age of business has been the focus of the Ghanaian economy from the year 2001, this is
to promote business and industrial growth. At the core of this dream is the private sector, which
is supposed to be the springboard for the development of industries and the nation. Over the
years, the private sector has proven to be a force to contend with the government as the number
one employer. This requires that the concerns and obstacle to their growth be addressed and
policies championed to promote the growth of the Ghanaian industry and the private sector.
This chapter concludes the study. The chapter gives a summary on the findings and analysis
made on the data gathered. It makes recommendation on how NEL can further improve on its
financial performance by taken in consideration the balance score card.
5.1 SUMMARY OF FINDINGS
The study has revealed some interesting paradigm in the general and specific application of
financial performance analysis to corporate performance especially to NEL. Ratios and graphs
were used as the main models of analysing the financial statement.
NEL which establish from Naachiaa plant pool on the Kumasi lake road, was the first to produce
acrylic roofing tiles in the country (1999) and later added concrete block (solid and hollow) of
difference sizes, pavement blocks of different shapes, quality and guaranteed kerbs, culverts and
slabs, perfect for the tropical homes and commercial properties.
Early years from 1999 were successful in its production and their high performance was based
on some of the strengths which could serve as a vehicle for driving its profit. Some of these
40
strengths which can serve as profit drivers are discussed below: Enjoying of monopoly in the
beginning years help the company to generate higher profit from it high demand for sales. There
were demands from all over the country.
The need for specialised skills is necessary to operate the sophisticated machines and equipment
used for production. NEL has been able to succeed in this area because of management’s
commitment to human resource training and development. The skills of the staff have enabled
the company to develop customized products and services to meet the classy needs of its
customers.NEL over the years have been able to increase its accounting for segregation of duties.
One of the major focus of this research was to examine how profitable NEL has been over the
three year period ending December 2009. From the data and analysis made, the overall
profitability of the NEL has been unfavourable in light with the soaring business environment
and unfavourable economic conditions during the years under review. This was due to entry of
competitors into the market. This affected the demand of sales and eventually reduces it profit
margin.
The hallmark of NEL over the years has been continuous demonstration of superior quality
service delivery through management’s investment in modern and sophisticated equipment to
meet the changing needs of its customers.
Another objective was to examine the level of gearing of the company. The debt to equity ratio
increased substantially for years, interview with the financial manager review to us that the debt
41

is free from interest and will in future be favourable to the company when fully paid off.
Management relied more on it subsidiary and bank overdraft to finance most of its operations.
The liquidity ratio for the years is very impressive. Current ratio and acid test ratio were above
the industry average. This is so because, the enterprise current asset can meet its short- term
liabilities as they fall due.
Shareholders can use the investor ratio to assess the wealth creating ability of NEL. It
recognizes that the effects of earning to the investors are significant. The investor ratio continues
to fall in the case of return on equity and earnings per share and it is far below the industrial
average, hence the wealth of investors are not being maximized. The investment is however
unsecured as profit is not able to cover the current year’s dividends.
5.2 CONCLUSION
NEL, a company in the concrete products manufacturing industry has contributed immensely
towards the growth of the nation. It was the first company to introduce acrylic roofing tiles in the
industry. Financial support is the most vital area to promote industries in Ghana. Apparently, the
foregoing analysis suggests that, the government has since independence been making
impressive efforts to assist businesses in the form of credit. Banks must be encouraged to review
42
interest rates charged on loans granted to manufacturing companies such as NEL to help them
engage on expansionary projects. Despite of the turbulent market conditions the company faces
in its business environment, the company has generally performed well.
5.3 RECOMMENDATION
NEL has shown a good performance as the study shows. Yet there is a greater opportunity to
succeed as the Ghanaian economy moves from extraction to processing. Recommendations are
hereby made, in order to help improve upon it activities as the company seeks to be the market
leader among its competitors.
i. The company needs to continually have a competent management team in place to
enable it to develop excellent products and services to sustain its operations.
ii. Recruiting, developing and retaining the best talents seem a challenge area for the
company. It is recommended that the business reviews its Human Resource policies
to address this trend.
iii. The current product portfolio should be reorganised, while all business processes
should continue to be reviewed to increase productivity and enhance efficiency. The
company should find out how much different customer groups are willing to pay for
its products so as to ensure products are developed to meet their needs.
iv. Since the company is in an industry with keen competition and none of its
competitors has expanded its market boundaries across the sub region, the company
can take the leading role in exporting to other West African countries to increase
turnover and market share after conducting the required feasibility studies. As a way
of helping NEL increases its capital base to embark on expansion, it is suggested that
43
NEL should be prepared to go to the stock exchange to float shares. The issue of
floating shares could help NEL to get enough capital to embark on expansion
programmes.
v. The company needs to confront the challenge of changing customer demand and
enhance its learning and innovative perspective, this will enable the company to
diversify its operations and stamp its position as the market leader.
5.4 RECOMMENDATION FOR FURTHER RESEARCH
The researchers do not claim to have fully exhausted the topic under study, as there are more
ways to explore financial and management performance. Owing to the limited resources and
time, the researchers only concentrated on few areas to gather their data. We therefore suggest
that further studies on this topic should be extended to gather more information from
nonfinancial indicators of performance appraisal since it’s the basis for assessing the holistic
performance measurement of an entity.
BIBLIOGRAPHY
1. Atrill, P. and McLaney, E. (1997) "Accounting and Finance for Non-Specialists"
(Prentice Hall,).
2. Avkiran, N.K. (1995).” Developing an instrument to measure customer service quality.
3. Burylo, J. (2006). The Importance of Performance Measurement.
4. Charles H. Gibson (2009) Financial Reporting & Analysis using Financial Accounting
Information, 11th edition, pp. 93-113, 145-155, 177-194, 201-226, 253-308, 365-381.
44
5. Crane, L.M. (2006). Measuring Financial Performance: A Critical Key to Managing
Risk.
6. Credit research foundation (1999). Performance management on farms.
7. Duncan, E. and Elliot, G. (2004),” Efficiency, customer service and financial
performance among Australian financial institutions”, International Journal of Bank
marketing, Vol.22, No. 5, -342.
8. Elliot, B. and Elliot, J. (2006). Financial Accounting, Reporting and Analysis:
international edition (2nd Edition). Prentice Hall.
9. Fitzgerald, L.and Johnston, R. Brignall, T. J., Silvestro, R. & Voss, C. (1991),
Performance measurement in service industries.
10. Flex Monitoring Team Briefing Paper No. 7 may 2005.
11. Gibson H. Charles 2009, Chien Ho and Song Zhu(2004), Duncan et al 2004, Joshua
Kennon Beginner’s Investment Guide.
12. Industry average, KNUST School of Business, Department of Accounting and Finance;
Topic: Financial Performance of DBS limited, 2010.
13. Jones, E. (1991). Understanding business finance: a guide for managers. Pitman
publishing.
14. Kaplan, R. S. and Norton, D. P., (1992). “The Balanced Scorecard – Measures that Drive.
Harvard Business School Press: Boston, MA.
15. Kenkel, P. (2001) financial performance for directors Oklahoma Cooperative Extension
Service (http://indiabudget.nic.in/es2001-02/chapt2002/chap35.
16. Kennerley, F. Adams, M. and Neely, A. (2000). Centre for Business Performance,
Cranfield School of Management, UK, Performance Prism.
45

17. KNUST School of Business, Department of Accounting and Finance; Topic: Financial
Performance of Nwabiagya Rural Bank, Barekese, 2009
18. KNUST School of Business, Department of Accounting and Finance; Topic: Financial
Performance of DBS limited, 2010
19. Loth, M. (2008).Financial analysis. investopedia.com./finstate/ratios>working capital.
20. Moullin, M. (2003) Defining performance measurement: Perspectives on Performance
(pdf 199KB) Vol.2, Issue 2, p.3. Performance Measurement Association.
21. Naachiaa Estate Limited financial Records (from 2007 to 2009)
22. Neely, A. D., (1998), “Performance Measurement: Why, What and How” Economist
Books, London.
23. Oxford Dictionary Of Finance and banking oxford university press 3rd edition 2005
24. Pike, R & Neale, B. (2006). Corporate Finance and Investment, 5th edition, pp48-56, 337-
342, 480-489.
25. Smolowe, J. (1996). "Reap as Ye Shall Sow," Time, vol, 147, no. 6 (February 5):45.
(http://www.agecon.purdue.edu/extensio/finance/EC-712section1.pdf.).
26. Watson, D. and Head, A. (2007) Corporate Finance Principles And Practice 4th
edition Financial Times Prentice Hall imprint.
27. Wood (2005) Business Accounting 2, 10th edition prentice hall, pp241-402, 422-430.
Useful Website
1. http://naachiaagroup.com
2. Loth, M. (2008).Financial analysis. investopedia.com./finstate/ratios>working capital
3. www.companieshouse.gov.uk
4. www.economist.com
46
5. www.FT.com
Abbreviation
1. Adom Super Blocks Limited(ASBL)
2. Eno Mma Constraction Limited(EMCL)
3. Naachiaa Estate Limited(NEL)
4. Nana Kwadwo Gyasi Limited(NKGCL)
APPENDEX
FINANCIAL RATIO CALCULATION
Profitability Ratio
1. Return on Capital Employed = Profit before Interest and Tax (PBIT)
Capital Employed
2007 18,859 x100
47
806,389 = 2.3%
2008 (2,732) x100
796,414 = (0.34%)
2009 (107,611) x100
687,426 = (15.7%)
2. Gross profit margin = Gross profit × 100
Turnover
2007 37,393 × 100
801,447 = 5%
2008 24,975 × 100
703,406 = 4%
2009 (69,394) × 100
557,591 = (12.4%)
3. Net Profit Margin = Earnings/PAT × 100
Turnover
2007 9,892 × 100
801,447 = 1.2%
2008 (9,974) × 100
70, 3406 = (1.4%)
2009 (108,989) × 100
48
557,591 = (19.5%)
4. Total Asset Turnover =Turnover
Capital Employed
2007 801,447
806,389 =0.99 times
2008 703406
796,414 =0.88 times
2009 557,591
687,426 = 0.81times
Liquidity / Solvency Ratios
5. Current Ratio = Current Asset
Current liability
2007 318,430
114,945 =2.7:1
2008 412,654
49
187,976 =2.2:1
2009 318,490
173,351 =1.8:1
6. Acid Test ratio = Current Asset – Inventory
Current Liability
2007 318,430 – 50,273
114,945 =2.3:1
2008 412,654 – 61,979
187,976 =1.9:1
2009 318,490 – 24,409
173,351 =1.7:1
7. Operating Cash Flow=Cash Flow from Operating
Current Liability
2007 15,837
114,945 =0.14:1
2008 (93,148)
187,976 = (0.5):1
50
2009 5758
173,351 = 0.03:1
Gearing Ratio
8. Interest Cover= Profit before Interest and Tax
Interest Expense
2007 18,859
2,575 =7.3 times
2008 (2,732)
941 = (2.9) times
2009 (107,611)
1,378 = (78.1) times
9. Debt to Asset Ratio = Total Debt
Total Asset
2007 442,175
921,334 = 0.5:1
2008 456,800
984,390 = 0.5:1
51
2009 383,769
860,777 = 0.4:1
10. Debt/Equity = Total Debt
Total Equity
2007 442,175 ×100
537,564 = 82%
2008 456,800 ×100
527,591 = 86%
2009 383,769 ×100
418,602 = 92%
Investor Ratios
11. Earnings per Share = Profit after Tax
No of Ordinary Share Issue
2007 9,892
20,000,000 = GHC 0.00049 per share
2008 (9,974)
52

20,000,000 = GHC (0.0005) per share
2009 (10, 8989)
20,000,000 = GHC (0.00054) per share
12. Return on Shareholders Fund (Return on Equity) = Profit after Tax
Shareholder Fund
2007 9,892
53, 7564 = 0.02 times
2008 (9,974)
527,591 = (0.02) times
2009 (108,989)
418,602 = (0.026) times
13. Gearing = Long Term Debt
Long Term Debt +Equity
2007 268824
268824 + 537564 = 0.3 times
2008 268824
268824 +527591 = 0.3 times
53

2009 268824
268824 +418,602 = 0.4 times
Efficiency Ratios
14. Stock Turnover = cost of Sales
Average Stock
2007 360,944
50,273 = 7.2 times
2008 282,090
61,979 = 4.6 times
2009 274,823
24,409 = 11.3 times
15. Debtors Collection Period = Total Trade Receivables × 365
Credit Sales
2007 261,405 × 365
801447 = 119 days
2008 330,539 × 365
703,406 = 172 days
54

2009 276,314 × 365
557,591 = 181 days
16. Creditors Payment Period = Total Trade Payables × 365
Credit Purchases
2007 111,648 × 365
334,803 = 122 days
2008 80,708 × 365
296,578 = 99 days
2009 72,400 × 365
263,733 = 100 days
Industrial Average
55

(Industry average, KNUST School of Business, Department of Accounting and Finance; Topic: Financial Performance of DBS limited, 2010)
NAACHIAA GROUP OF COMPANIES LIMITED
INTERVIEW GUIDE TO MANAGEMENT
Dear Sir,
We would be grateful if the required information is extended to us for completion of this
research study. We hold it a concern to ensure confidentiality of whatever material you provide
to us by not making extension of the information provided, in whatever form, to any person
unauthorized.
1. When was Naachiaa Group of Company formed?
56

.……………................................................................................................................................
2. How many people own Naachiaa Group of Companies?
….……………………………………………………………………………………………….…
3. When did Naachiaa move into real Estate development? ………………..
……………………………..………………………………………………………
4. What is the vision and mission of Naachiaa Estate Limited?
………………………………………………………………………………………………………
5. How is Naachiaa Estate being financed?
………………………………………………………………………………………………………
6. What is the major activity of Naachiaa Estate limited?
………………………………………………………………………………………………………
7. Any other activities apart from those mentioned.
………………………………………………………………………………………………………
8. What is the history of Naachiaa Estate Ltd?
………………………………………………………………………………………………………
9. Which kind of people invest in Naachiaa Estate Ltd?
………………………………………………………………………………………………………
10. What are the qualification, experience and quality of management?
………………………………………………………………………………………………………
11. What are your products and services and the operating characteristics of the business?
………………………………………………………………………………………………………
12. What are the industrial norms of the business?
………………………………………………………………………………………………………
57
PROFITABILITY
13. Profit (GP) declined for the past three years. What factors accounted for that?
………………………………………………………………………………………………………
14. What measures could be put in place to remedy the situation above?
………………………………………………………………………………………………………
15. Operating expenses increase from 2007 to 2008 but did decrease in 2009 as the trend depicts,
what account for it?
………………………………………………………………………………………………………
16. What can be done about it?
………………………………………………………………………………………………………
17. There was a continuous decline of return on capital employed (ROCE). What might possibly
cause this?
………………………………………………………………………………………………………
18. The company was not able to use it asset effectively to generate sales from 2007 through to
2009. Any reason(s) for the fall?
………………………………………………………………………………………………………
LIQUIDIY
19. There was a consistent trend positively in current ratio, what factors accounted for this?
………………………………………………………………………………………………………
20. Acid test ratio declines over the years. What possibly accounted for this?
………………………………………………………………………………………………………
21. The cash cycle tends to be unfavourable. What possible reasons accounted for this despite
the reduction trend?
58
………………………………………………………………………………………………………
22. The ability of the company to pay its current obligation has decline over the years. Are there
any reasons for this?
………………………………………………………………………………………………………
EFFICIENCY
23. Interest charged was healthy in 2007 but plunged into negative figures in subsequent years.
a) What indicators resulted in the fall in 2008 and 2009?
………………………………………………………………………………………………………
b) What approaches are being adopted by management for the unfavourable trend thereafter
(2008 to 2009)?
………………………………………………………………………………………………………
24. The company is seen to have more debt finance in 2008 and 2009 as the trend shows. Why
so (please)?.................................................................................................................................
25. What was done to realize the fall in the debt to equity ratio (fall in debt) in 2008 and 2009
………………………………………………………………………………………………………
26. NEL within the period has contracted long term liability (deferred liability) and is due to the
pant pool. What might be the reasons?
………………………………………………………………………………………………………
INVESTOR
27. Return on equity reduces continuously for the three years (2007-2009)
Reasons for this (please)?
………………………………………………………………………………………………………
59
28. Though, the number of ordinary shares in issue remained the same at two thousand (20,000)
for all the years, the earning per share ratio reduced from 2008 and 2009. Why so (please)?
………………………………………………………………………………………………………
29. What general problems confront the company’s operations?
………………………………………………………………………………………………………
30. Any expectations for growth with regards to…
a) Investment
………………………………………………………………………………………………………
b) Expansion
………………………………………………………………………………………………………
c) Customer service
……………………………………………………………………………………………………
d) Production
……………………………………………………………………………………………………
31. What is the company doing to review it strategic policy statement and the strategy process to
avert it downward trend?
………………………………………………………………………………………………………
32. What measures are being put in place for efficient and effective segregation of duties and
internal controls?
………………………………………………………………………………………………………
THANK YOU.
60

61