Final Presentation Thesis
37
Study of Earthworm Compost in Fukushima I Made Agus Dwi GINARTHA Master Double Degree Program Regional and Environmental Science Ibaraki University-Udayana University Udayana University
-
Upload
made-agus-bsp -
Category
Documents
-
view
7 -
download
0
Transcript of Final Presentation Thesis

Study of Earthworm Compost in Fukushima
I Made Agus Dwi GINARTHA
Master Double Degree Program Regional and Environmental Science
Ibaraki University-Udayana University
Udayana University

Introduction
• Nuclear accident on March 11, 2011, caused widespread radiocesium (Cs-134 and Cs-137) contamination of farmlands, mainly in the eastern part of Japan, especially in Fukushima.
• Utilization of leaf molds was limited because showed contain high Cesium contamination
• Vegetables waste is a great source become compost material, because contain high nutrient and low Cesium contamination
• Vermicomposting could be appropriate technologies to produce organic fertilizer, primarily owing to its low cost and applicable in Fukushima.
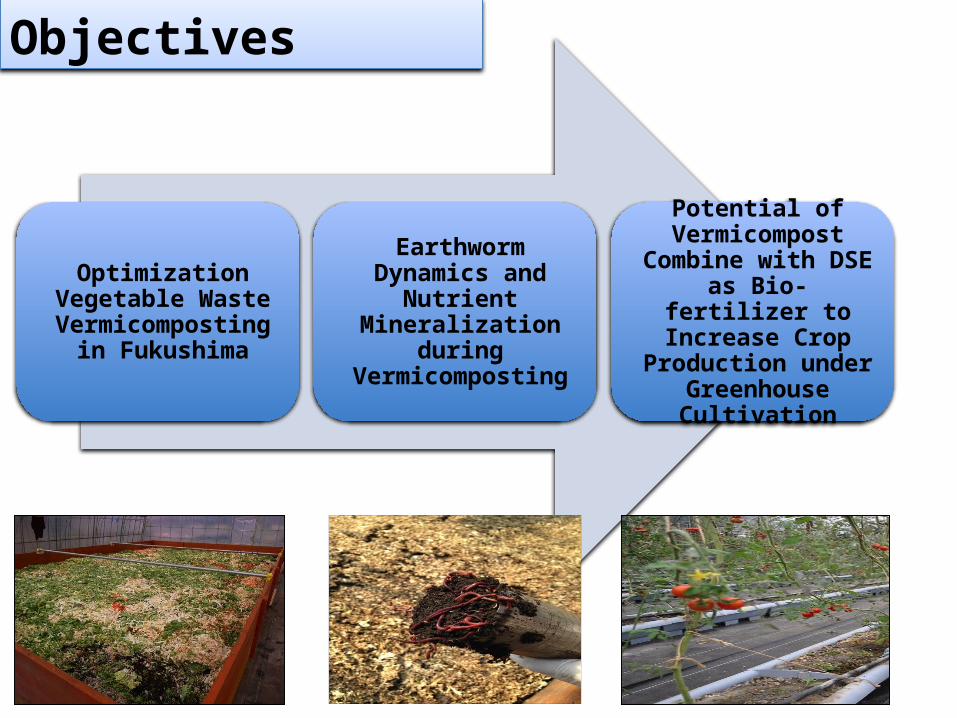
Research Objectives
Optimization Vegetable Waste Vermicomposting
in Fukushima
Earthworm Dynamics and Nutrient
Mineralization during Vermicomposting
Potential of Vermicompost Combine with DSE as Bio-fertilizer
to Increase Crop Production under
Greenhouse Cultivation
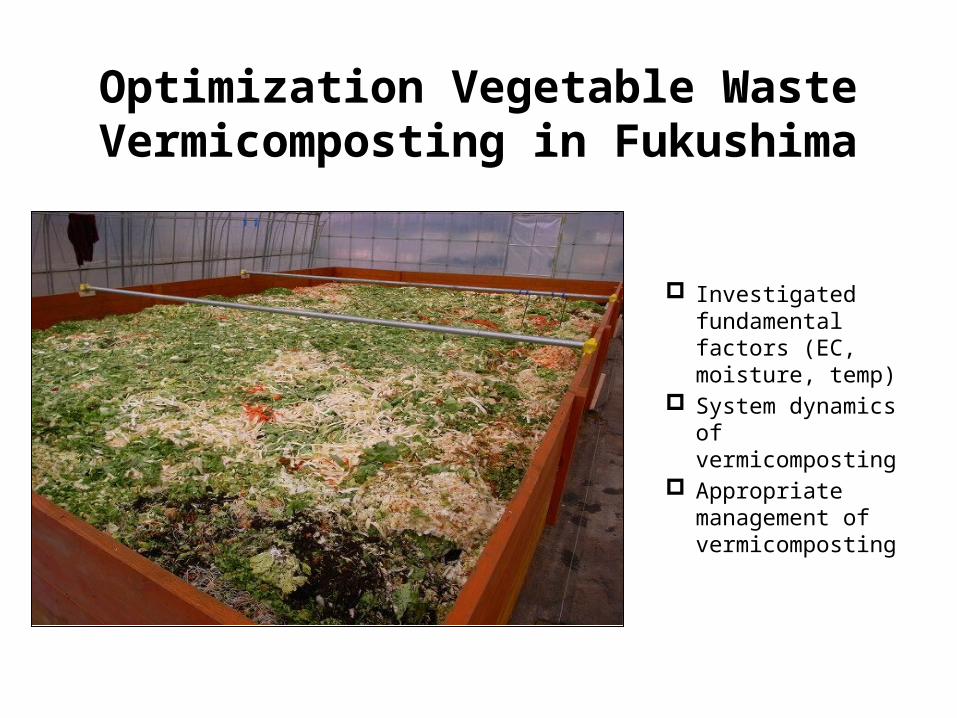
Optimization Vegetable Waste Vermicomposting in Fukushima
Investigated fundamental factors (EC, moisture, temp)
System dynamics of vermicomposting
Appropriate management of vermicomposting

Materials and Methods
Earthworm compost reactor was assembled in a greenhouse of farmer since February 2013 until February 2014
The content of vermicompost reactor from bottom-to-up layer were wood chip (Japanese cedar), cow manure, initial vermicompost (Eisenia fetida), and vegetable residue, respectively
In addition, there were soil heater establish in composting box to ensure the activity of earthworms during winter season
100 mm
100 mm
200 mm

• Earthworm population was counted manually by sampling 10 times with 30 cm (d=13.4 cm) core sampling since March 2013 until February 2014
• EC, moisture, and temperature data during
vermicomposting process in the reactor was obtained from Decagon 5TE (EM50) which was placed in 2.5 cm, 5 cm, 7.5 cm and 15 cm depth from the surface.
• 2 mm mesh litter bag 10 × 10 cm in size, containing a mixture of vegetable waste, was placed on the surface layer of vermicompost reactor (10 cm from the surface) with three replicates, and was analysis during 2 weeks with decay model of litter bag decomposition to obtained the decomposition rate
Materials and Methods

Vegetable waste input
• Vegetable waste in this research was obtained from Delica Food Company in Date city,
• Fresh weight of Daily vegetable waste input was measured by farmer in Fukushima
3/18
4/14/1
54/2
95/1
35/2
76/1
06/2
47/8
7/22
8/58/1
99/2
9/16
9/3010/1
410/2
811/1
111/2
512/9
12/23
1/61/2
02/3
2/17
0
100
200
300
400
500
600
700
leafrootonion
time (day)
Veg
etab
le w
aste
inpu
t (kg
)
Materials and Methods
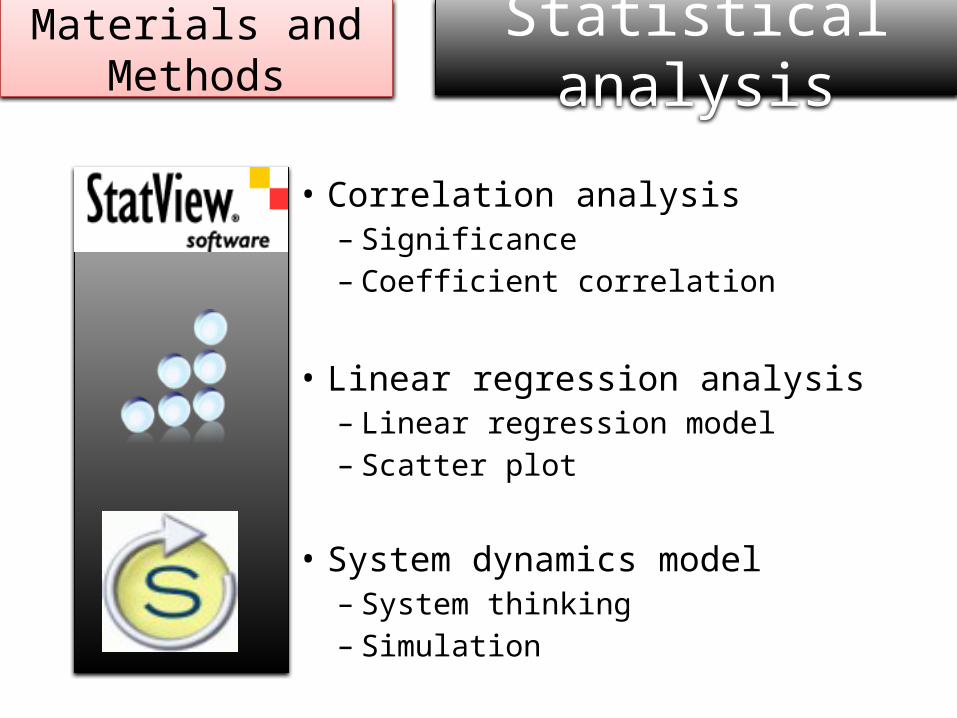
Statistical analysis
• Correlation analysis– Significance– Coefficient correlation
• Linear regression analysis– Linear regression model– Scatter plot
• System dynamics model– System thinking– Simulation
Materials and Methods
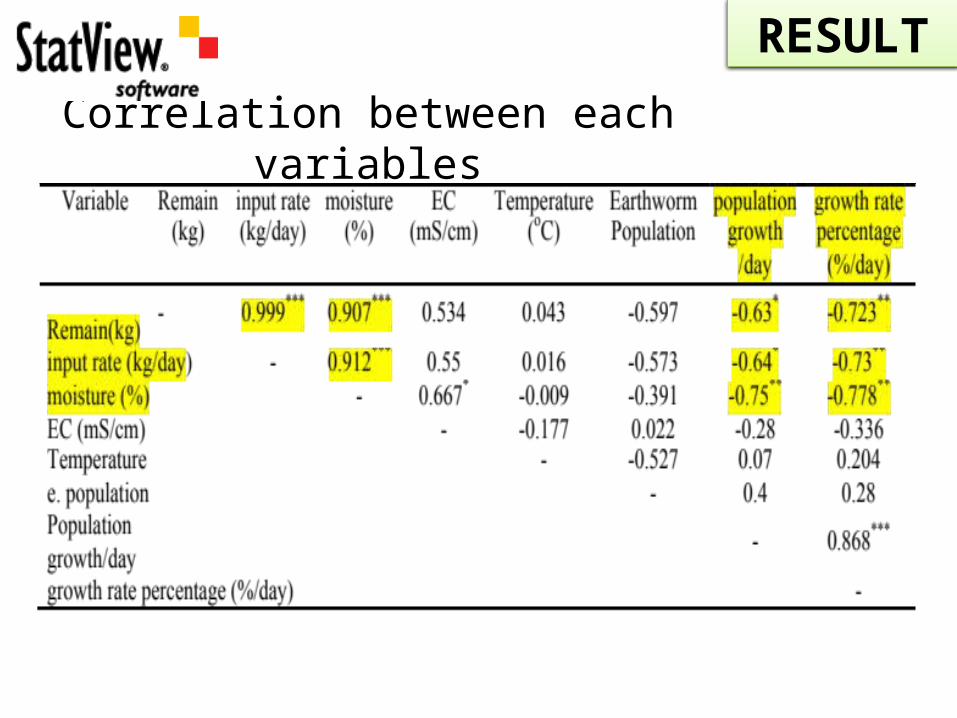
Correlation between each variables
RESULT
1 3 5 7 9 11 13 15 17 19 21 23 25 27 29 31 33 35 37 390
2
4
6
8
10
12
0
20
40
60
80
100
120
week
inpu
t (kg
)
Moi
stur
e (%
)
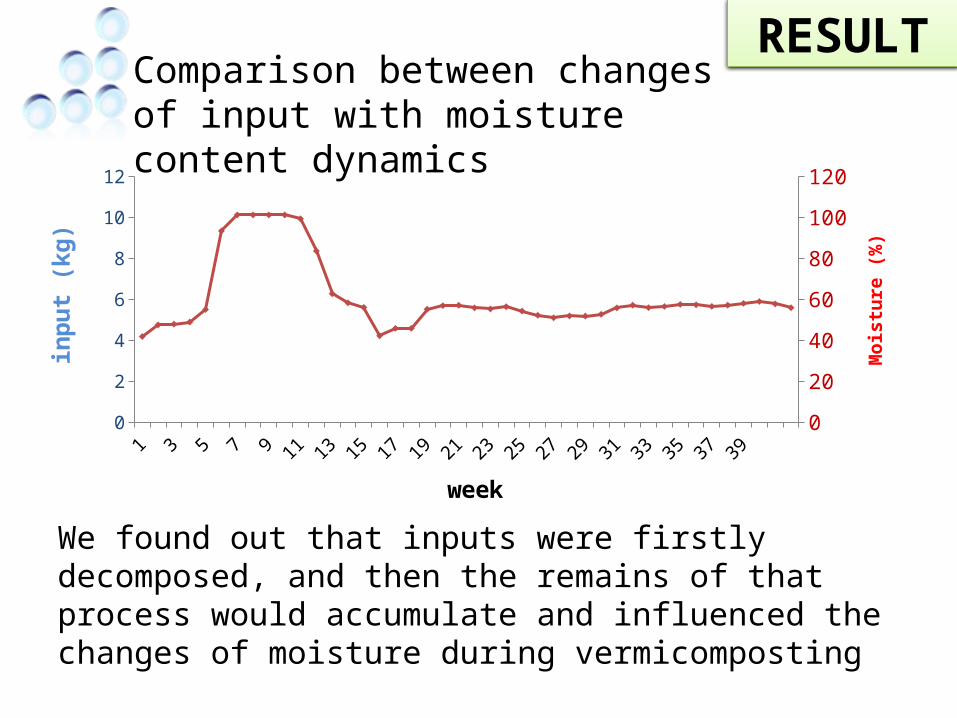
We found out that inputs were firstly decomposed, and then the remains of that process would accumulate and influenced the changes of moisture during vermicomposting
RESULTComparison between changes of input with moisture content dynamics

System dynamics of Vermicomposting RESULT
Earthworm population
Remaining accumulation
Vegetable waste input
Moisture
Feeding activities
decomposition
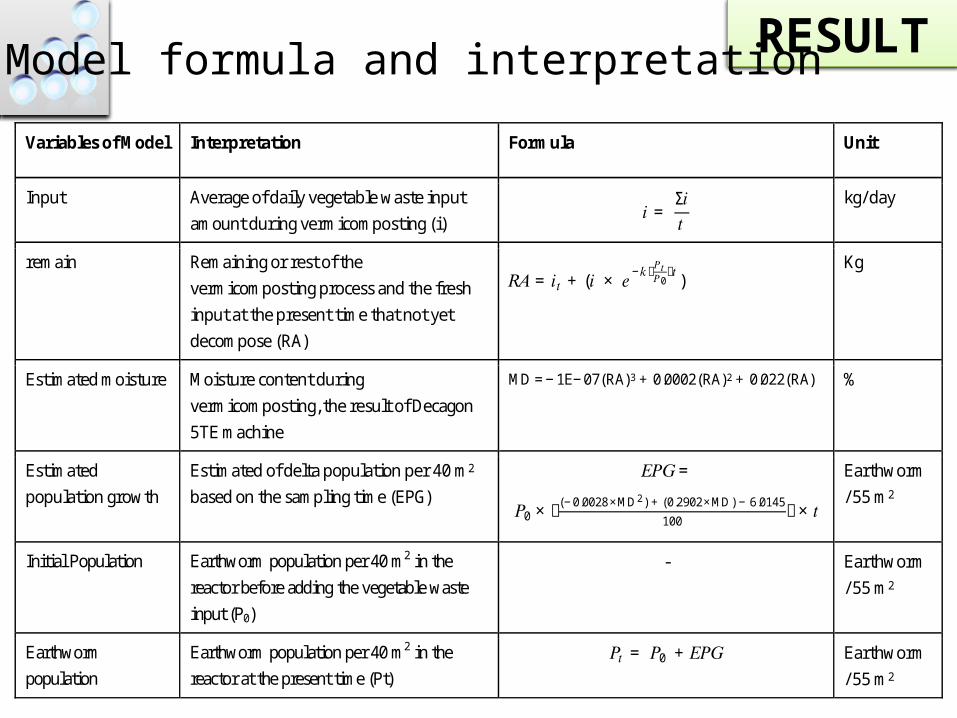
RESULTModel formula and interpretation
Variables of Model Interpretation Formula Unit
Input Average of daily vegetable waste input
amount during vermicomposting (i) 𝑖 = Σ𝑖𝑡
kg/day
remain Remaining or rest of the
vermicomposting process and the fresh
input at the present time that not yet
decompose (RA)
𝑅𝐴= 𝑖𝑡 + (𝑖 × 𝑒−𝑘ቀ𝑃𝑡𝑃0ቁ𝑡)
Kg
Estimated moisture Moisture content during
vermicomposting, the result of Decagon
5TE machine
MD=−1E−07(RA)3 + 0.0002(RA)2 + 0.022(RA)
%
Estimated
population growth
Estimated of delta population per 40 m2
based on the sampling time (EPG)
𝐸𝑃𝐺= 𝑃0 × ቀ
(−0.0028×MD2) + (0.2902×MD) − 6.0145100 ቁ× 𝑡
Earthworm
/55 m2
Initial Population Earthworm population per 40 m2 in the
reactor before adding the vegetable waste
input (P0)
- Earthworm
/55 m2
Earthworm
population
Earthworm population per 40 m2 in the
reactor at the present time (Pt)
𝑃𝑡 = 𝑃0 + 𝐸𝑃𝐺 Earthworm
/55 m2
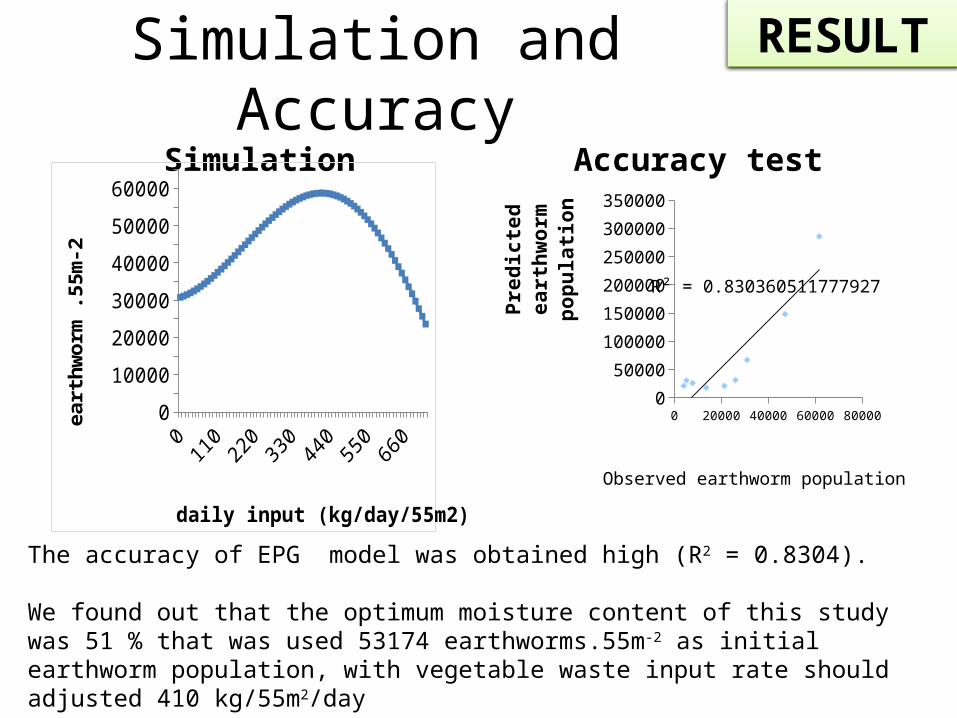
Simulation and AccuracySimulation Accuracy test
0 100002000030000400005000060000700000
50000
100000
150000
200000
250000
300000
350000
R² = 0.830360511777927
Observed earthworm population
Pred
icte
d ea
rthw
orm
pop
u-la
tion
The accuracy of EPG model was obtained high (R2 = 0.8304).
We found out that the optimum moisture content of this study was 51 % that was used 53174 earthworms.55m-2 as initial earthworm population, with vegetable waste input rate should adjusted 410 kg/55m2/day
0 80160
240320
400480
560640
7200
10000
20000
30000
40000
50000
60000
daily input (kg/day/55m2)
eart
hwor
m .5
5m-2
RESULT
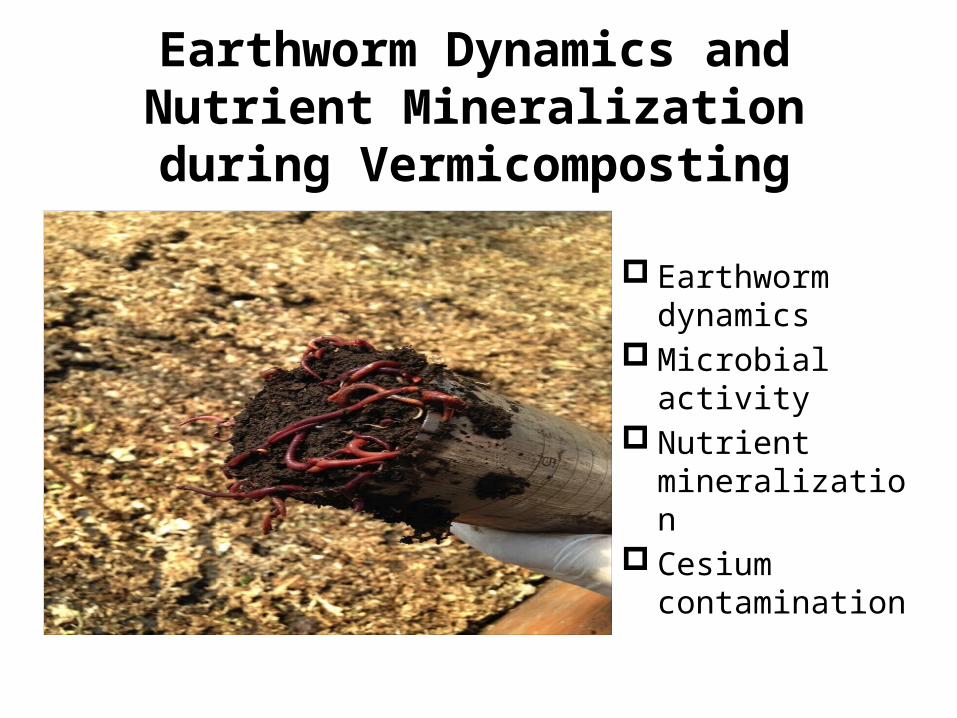
Earthworm Dynamics and Nutrient Mineralization during Vermicomposting
Earthworm dynamics
Microbial activity Nutrient
mineralization Cesium
contamination
Materials and Methods
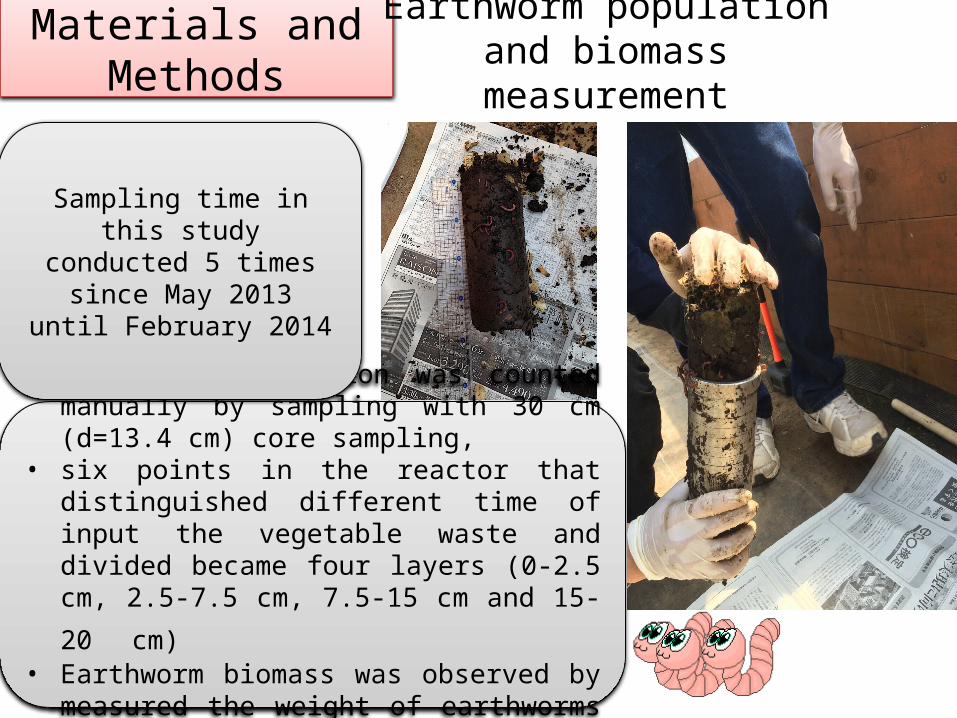
• Earthworm population was counted manually by sampling with 30 cm (d=13.4 cm) core sampling,
• six points in the reactor that distinguished different time of input the vegetable waste and divided became four layers (0-2.5 cm, 2.5-7.5 cm,
7.5-15 cm and 15-20 cm) • Earthworm biomass was observed by measured
the weight of earthworms in each depth
Sampling time in this study conducted 5 times since May
2013 until February 2014
Earthworm population and biomass measurement
Materials and Methods
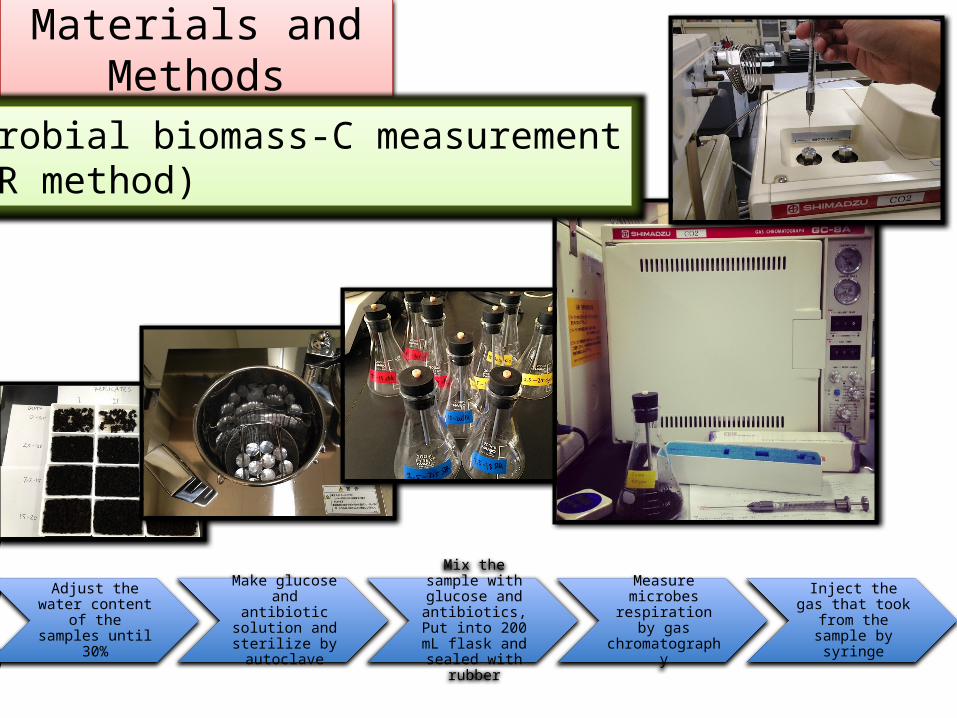
Adjust the water content of the
samples until 30%
Make glucose and antibiotic solution
and sterilize by autoclave
Mix the sample with glucose and
antibiotics, Put into 200 mL flask and
sealed with rubber
Measure microbes respiration by gas chromatography
Inject the gas that took from the
sample by syringe
Microbial biomass-C measurement(SIR method)
Nutrient content measurement
Materials and Methods
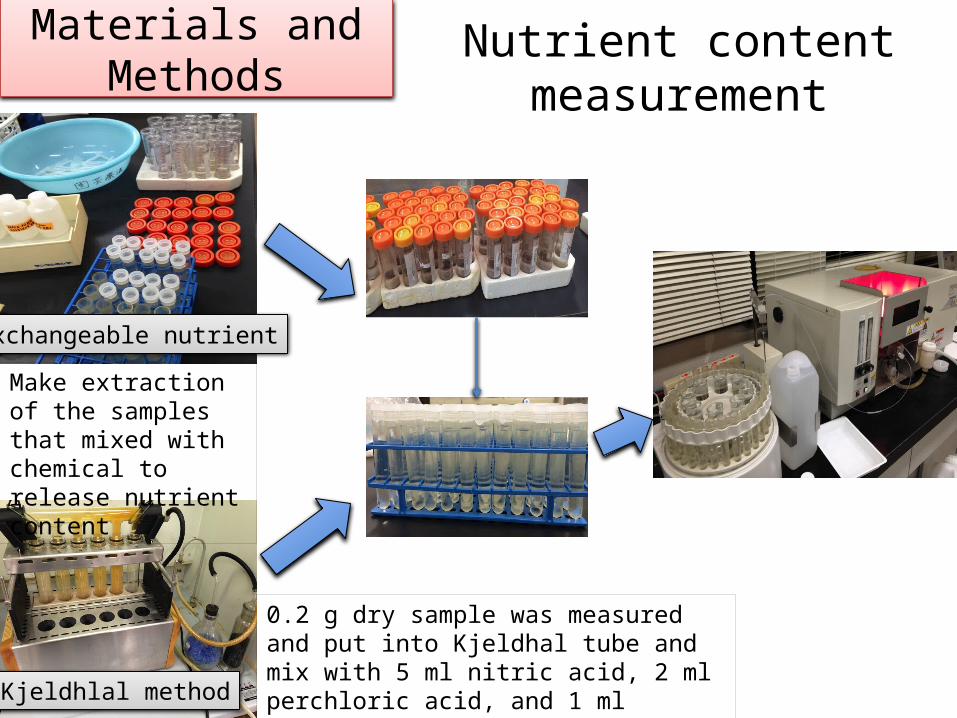
0.2 g dry sample was measured and put into Kjeldhal tube and mix with 5 ml nitric acid, 2 ml perchloric acid, and 1 ml sulfuric acid. The solution was heat by Buchi-426 Digestion Unit
Make extraction of the samples that mixed with chemical to release nutrient content
Kjeldhlal method
Exchangeable nutrient

Cesium and C/N ratio measurement
Materials and Methods
The samples should be oven dry and measured the water content. Then the cesium contamination of the samples was determined by cesium measurement using Germanium semiconductor machine
Total carbon (C) and total nitrogen (N) was measured by C/N analyzer machine. 200-400 mg dry oven samples were measured and then analyzed using C/N ratio measurement machine (JM3000CN)

Type of WC Dry samples Wet samples
Vegetable waste (%) Cs134(Bq/kg)
Cs137(Bq/kg)
Cs134 (Bq/kg)
Cs137 (Bq/kg)
Lettuce 95 7.67 ± 2.14 6.65±2.10 0.38 ± 0.11 0.33 ± 0.10
Radish 95 1.10 ± 1.54 6.08±1.32 0.06 ± 0.08 0.30 ± 0.07
Radish + carrot 95 1.10 ± 1.54 7.03±1.94 0.06 ± 0.08 0.35 ± 0.10
Initial vermicompost - 24- 31 41 - 44
Cow manure - 14- 21 31 - 43
Woodchip - 0.74 3.26
Chemical properties, radio-cesium (Cs) contamination of vegetable wastes and radiocesium (Cs) contamination
Type of vegetable wastes
Water content
(%)
C (%) N (%) Ca (%) Mg (%) K (%) P (%)
Lettuce 95 39.48 3.89 3.17 0.58 3.73 1.50
Radish 95 42.24 3.18 3.18 0.57 3.21 1.053
Radish + carrots 95 40.58 3.32 3.03 0.63 3.93 1.75
Materials and Methods
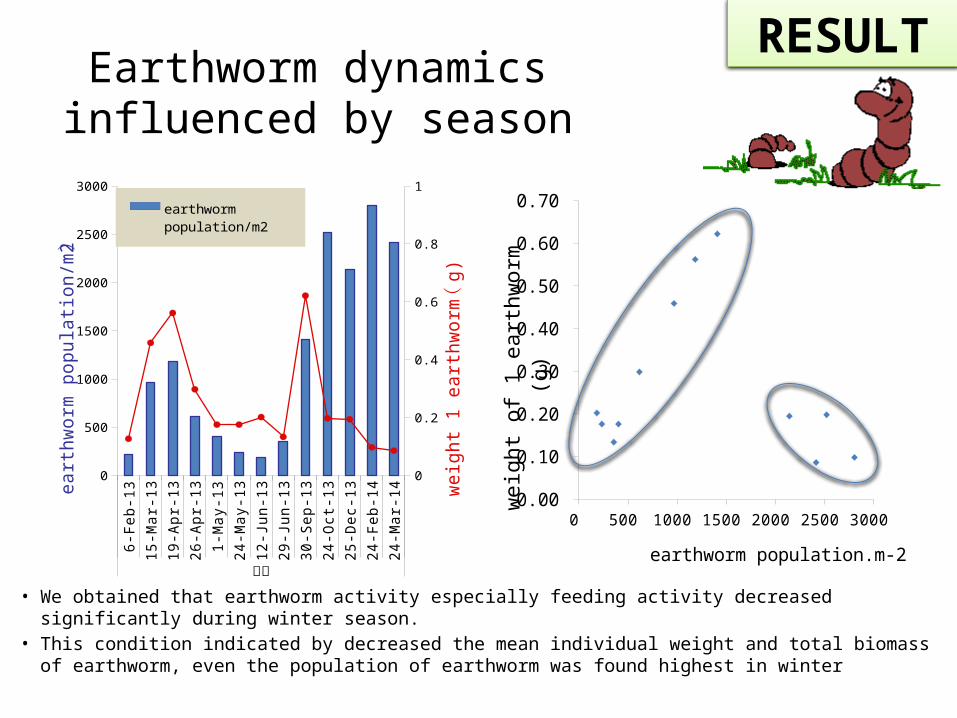
Earthworm dynamics influenced by season
• We obtained that earthworm activity especially feeding activity decreased significantly during winter season.
• This condition indicated by decreased the mean individual weight and total biomass of earthworm, even the population of earthworm was found highest in winter
6-Fe
b-13
15-M
ar-1
3
19-A
pr-1
3
26-A
pr-1
3
1-M
ay-1
3
24-M
ay-1
3
12-J
un-1
3
29-J
un-1
3
30-S
ep-1
3
24-O
ct-1
3
25-D
ec-1
3
24-F
eb-1
4
24-M
ar-1
4
福島
0
500
1000
1500
2000
2500
3000
0
0.2
0.4
0.6
0.8
1earthworm population/m2weight 1 earth-worm ( gr )
ea
rth
wo
rm p
op
ula
tio
n/m
2)
we
igh
t 1
ea
rth
wo
rm(
g)
0 500 1000 1500 2000 2500 3000 0.00
0.10
0.20
0.30
0.40
0.50
0.60
0.70
earthworm population.m-2
wei
ght o
f 1
eart
hwor
m (
g)
RESULT

Earthworm biomass dynamics influenced by Nitrate amount
• The result of this present study showed that earthworm biomass pronounced negative correlation with nitrate (NO3-N) concentration.
0 500 1000 1500 2000 2500 30000
100
200
300
400
500
600
700
800
NO3-N (mg/kg )
eart
hwor
m b
iom
ass
(kg/
55m
-2)
R² = 0.15538P = 0.0306
RESULT
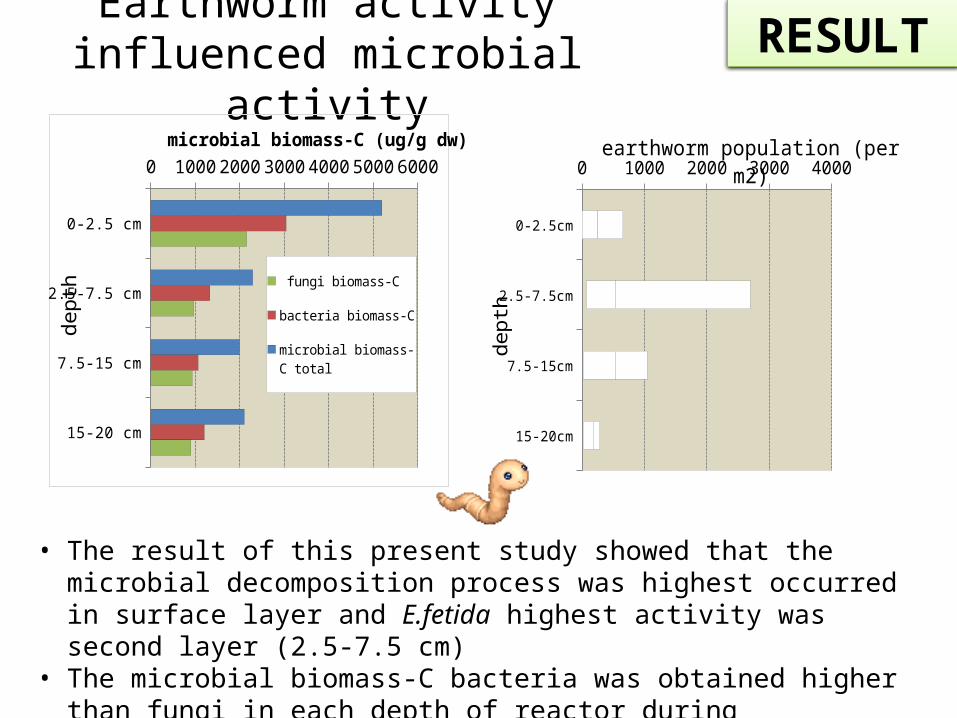
Earthworm activity influenced microbial activity
0-2.5cm
2.5-7.5cm
7.5-15cm
15-20cm
0 1000 2000 3000 4000earthworm population (per m2)
dept
h
• The result of this present study showed that the microbial decomposition process was highest occurred in surface layer and E.fetida highest activity was second layer (2.5-7.5 cm)
• The microbial biomass-C bacteria was obtained higher than fungi in each depth of reactor during vermicomposting
RESULT
0-2.5 cm
2.5-7.5 cm
7.5-15 cm
15-20 cm
0 1000 2000 3000 4000 5000 6000
fungi biomass-C
bacteria biomass-C
microbial biomass-C total
microbial biomass-C (ug/g dw)
dept
h

May-13Jul-1
3
Sep-13
Nov-13
Jan-14
Mar-14
0.00100.00200.00300.00400.00500.00600.00700.00800.00900.00
1000.00
Mg
(mg/
kg)
May-1
3Jun-13
Jul-13
Aug-13
Sep-13
Oct-13
Nov-13
Dec-13
Jan-14
Feb-14
02000400060008000
100001200014000160001800020000
K (m
g/kg
)
Nutrient Mineralization RESULT
Feb-13
Mar-13
Apr-13
May-13
Jun-13Jul-1
3
Aug-13
Sep-13
Oct-13
Nov-13
Dec-13
Jan-14
Feb-14
Mar-14
0200400600800
1000120014001600
inor
gani
c N
itrog
en
(mg/
kg)

• Earthworm compost as final result of vermicomposting process showed high nutrient content especially total carbon, total nitrogen, nitrate, ammonium, calcium, magnesium, potassium and phosphorus
• The ingestion, digestion
and assimilation of the organic material in the gut and then casting play a crucial role in substrate mineralization (Dominguez et al., 2013)
Nutrient content of earthworm compost
Earthworm compost
Nutrient content (mg/kg)
NO3-N 2114.5NH4-N 19.80
Ca 294.24
Mg 572.90
K 13903
P 465.60
EC 4.50
pH 7.61
Total Nutrient (%)
C 14.28
N 1.39
Ca 2.29
Mg 0.37
K 2.72
P 8.45
RESULT

C/N ratio during vermicomposting
• The lowest C/N ratio during vermicomposting was obtained in the surface layer, indicate that high decomposition was occurred in that layer
0-2.5
2.5-7.5
7.5-15
15-20
9.9 9.95 10 10.05 10.1 10.15 10.2 10.25
C/N ratio de
pth
from
the
sur
face
(cm
)
Materials C (%) N (%) C/N
Vegetable waste
lettuce39.5 3.9 10.16
radish42.2 3.2 13.31
Radish + carrot40.6 3.3 12.23
During Vermicomposting
0-2.5 cm16.52 1.65 10.02
2.5-7.5 cm15.24 1.49 10.23
7.5-15 cm16.18 1.56 10.27
15-20 cm12.68 1.08 11.78
Finished product compost14.28 1.39 10.25
RESULT

Cesium (Cs-134 and Cs-137) Contamination
• The highest cesium (Cs-134 and Cs-137) contamination during vermicomposting in Fukushima was observed on 2.5-7.5 depth from layers, and the lowest cesium contamination was observed on the surface layer (0-2.5 cm)
• The appropriate compost should be take from the surface layer of the vermicompost box
Earthworm compost
0-2.5
2.5-7.5
7.5-15
15-20
0 40 80 120160
Cs 134
Cs 137
Bq/kg
RESULT
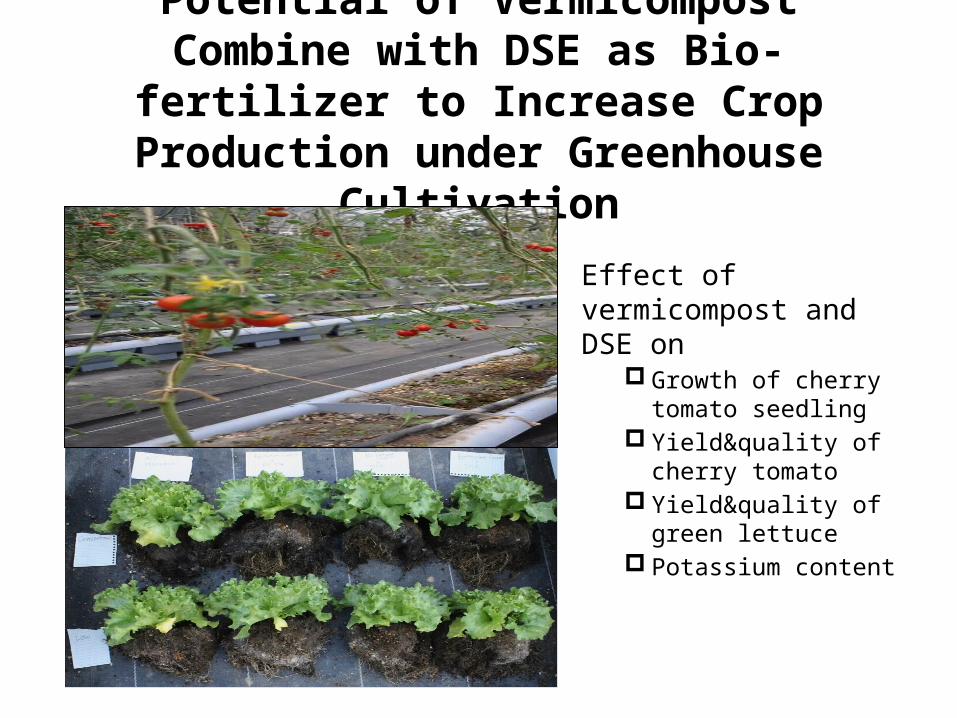
Potential of Vermicompost Combine with DSE as Bio-fertilizer to Increase Crop Production
under Greenhouse Cultivation
Effect of vermicompost and DSE on
Growth of cherry tomato seedling
Yield&quality of cherry tomato
Yield&quality of green lettuce
Potassium content

Cherry tomato and Lettuce Cultivation in Greenhouse
Organic Fertilizer
(g/container)N P2O5 K2O CaO MgO
Conventional 45.7 41.6 57.5 21.9 11.5
50% reduced 22.9 20.8 28.8 11.0 5.7
Cherry tomato (cultivar PEPE) : - cultivation was started on May 2013- harvested on 9/10/2013,
7/10/2013,27/10/2013Lettuce : - cultivation was started on October 2013 - harvested on 24th February 2014This study used split-split plot design were amount of fertilizer became main treatment, DSE (V.simplex) became sub treatment, and earthworm compost became sub-sub plot, and each container was contain 50 g earthworm compost and 500 g kanuma soil.
Materials and Methods

Yield and quality measurement
• Yield of cherry tomato and lettuce was measured the fresh weight immediately on the harvest time
• The quality of yield that was measured in this study including sugar content that was measured by refractometer and potassium content that was measured by LAQUAtwin K+
Materials and Methods

Vermicompost and DSE enhanced growth of cherry tomato seedling
• The highest seedling was obtained in DSE and vermicompost treatment. • DSE with vermicompost treatment was obtain enhanced the plant height of
cherry tomato seedling about 104.57 %, compared with control (no-DSE and no-vermicompost).
DSE DSE no-DSE no-DSEVermicompost no-vermicompost Vermicompost no-vermicompost
0
2
4
6
8
10
12
14
16
18
plan
t hei
ght (
cm)
RESULT
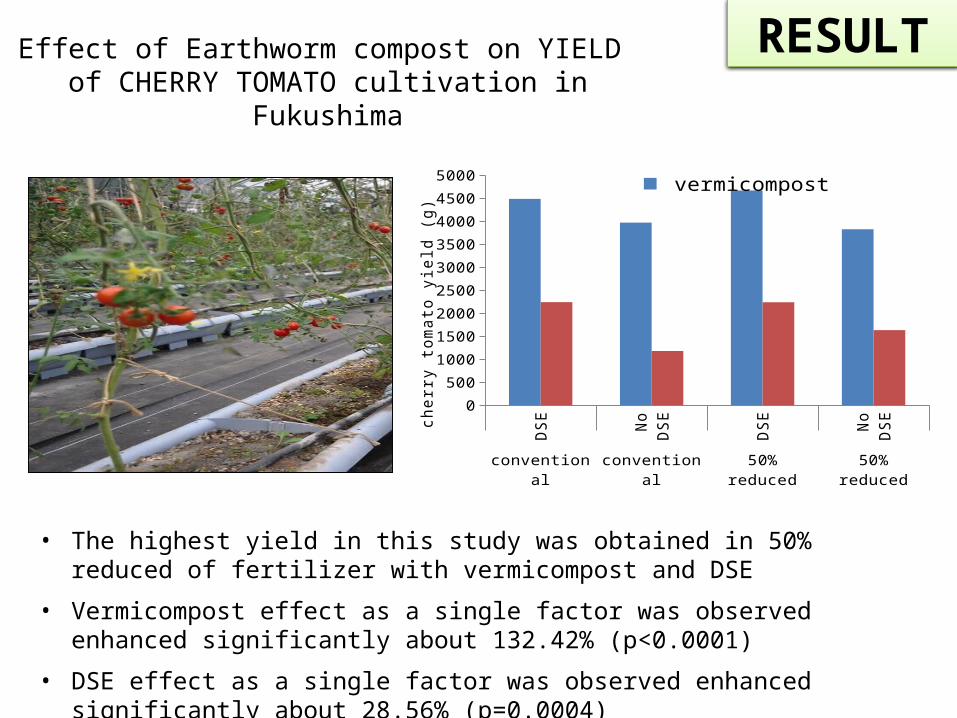
Effect of Earthworm compost on YIELD of CHERRY TOMATO cultivation in Fukushima
• The highest yield in this study was obtained in 50% reduced of fertilizer with vermicompost and DSE
• Vermicompost effect as a single factor was observed enhanced significantly about 132.42% (p<0.0001)
• DSE effect as a single factor was observed enhanced significantly about 28.56% (p=0.0004)
DSE No DSE DSE No DSEconventional conventional 50% reduced 50% reduced
0
500
1000
1500
2000
2500
3000
3500
4000
4500
5000 vermicompost no vermicompost
cher
ry to
mat
o yi
eld
(g)
RESULT

Effect of Earthworm compost on SUGAR CONTENT of CHERRY TOMATO cultivation in
Fukushima
DSE No DSE DSE No DSEconventional conventional 50% reduced 50% reduced
4
4.5
5
5.5
6
6.5
7 vermicompost no vermicompost
Suga
r con
tent
(%)
RESULT
• The highest sugar content was obtained in 50% reduced of fertilizer with vermicompost and no DSE, that was 6.41 %
• Vermicompost effect as a single factor was observed enhanced significantly about 6.21 % compared with without vermicompost treatment (p=0.0091)
• DSE effect as a single factor was observed enhanced 1.72 % compared with without DSE, although the effect was statistically no significant (p=0.4143)

Effect of Earthworm compost on YIELD of LETTUCE cultivation in Fukushima
0
2
4
6
8
10
12
14 Earthworm compostNo Earthworm compost
suga
r co
nten
t (%
)
RESULT
• The highest yield of green lettuce in this study was obtained in conventional fertilizer with no vermicompost and DSE
• The highest sugar content was obtained in 50% reduced of fertilizer with vermicompost and no DSE
• But the effect of earthworm compost on yield and sugar content of lettuce in this present study was observed statistically non-significant
DSE No DSE DSE No DSEconventional conventional 50% reduced 50% reduced
0
10
20
30
40
50
60
70
80
90 vermicompost no vermicompost
lett
uce
yiel
d (g
)
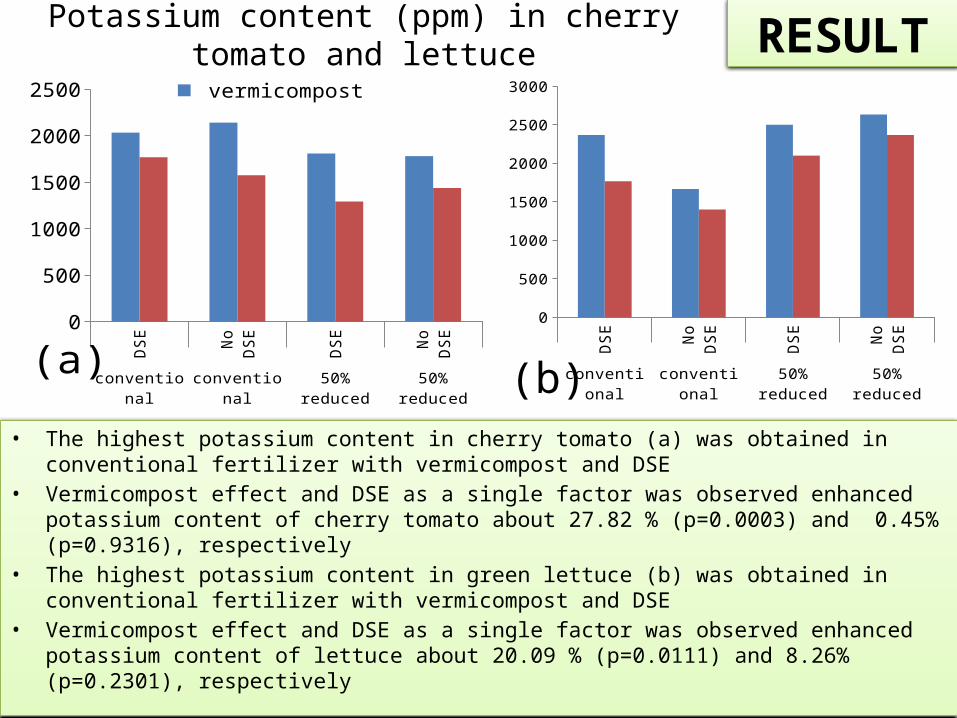
Potassium content (ppm) in cherry tomato and lettuce
• The highest potassium content in cherry tomato (a) was obtained in conventional fertilizer with vermicompost and DSE
• Vermicompost effect and DSE as a single factor was observed enhanced potassium content of cherry tomato about 27.82 % (p=0.0003) and 0.45% (p=0.9316), respectively
• The highest potassium content in green lettuce (b) was obtained in conventional fertilizer with vermicompost and DSE
• Vermicompost effect and DSE as a single factor was observed enhanced potassium content of lettuce about 20.09 % (p=0.0111) and 8.26% (p=0.2301), respectively
DSE No DSE DSE No DSEconventional conventional 50% reduced 50% reduced
0
500
1000
1500
2000
2500 vermicompost no vermicompost
(a) DSE No DSE DSE No DSE
conventional conventional 50% reduced 50% reduced
0
500
1000
1500
2000
2500
3000
(b)
RESULT

SUMMARY The optimum input rate of vegetables waste in compost box was expected to adjust
410 kg/55m2/day for vermicomposting process (compost reactor = 11mx5mx0.4m) with 51 % that was used 53174 earthworms.55m-2 as initial earthworm population.
Earthworm population and activity during vermicomposting process was influenced by seasonal changes and chemical condition especially nitrate. Optimum nitrate amount regarding to increase earthworm activity should be adjust in 376 mg/L
Earthworm compost using vegetable waste was observed contain high nutrient content, such as C, N, Ca, Mg, K and P was observed 14.28 %, 1.39 %, 2.29 %, 0.37 %, 2.72 % and 8.45%, respectively
Radiocesium (Cs134 and Cs137) contamination of earthworm compost in Fukushima during vermicomposting process was observed lowest in the surface layer, so appropriate compost should be take from the surface layer (0-2.5 cm).
Earthworm compost combine with DSE in this present study was observed significantly increased production of cherry tomato in greenhouse at Fukushima, but non-significantly affected lettuce production. That combination also observed increased potassium content in cherry tomato and lettuce significantly

AcknowledgementThanks to all the supports especially for:• My supervisor in Ibaraki University, Prof. Dr. Masakazu Komatsuzaki, Prof. Dr.
Kazuhiko Narisawa, Prof. Dr. Okayama for their kindness in guidance me always.
• My supervisor in Udayana University, Prof. Dr. Ir. I Made Sudana, Dr. I Gusti Alit Susanta Wirya, Prof. Dr. Ir. Dewa Ngurah Suprapta for all supports and kind attention for me
• Rahmatullah Hashimi, Takahiro Ito, and all my laboratory member for the all supports during this study
• Danny from Tsukuba University, Abdurachman from Tokyo University of Agriculture and Technology for all supports especially to analyze and construct the model
• Dr. Nobuo Sakagami and Arisawa san for all supports especially in Double Degree Program
• Mr. Manuel Aira from Universidad de Vigo, Spain and Mr. Heidi Anderson from Institut fur Bodenbiologie, Germany, for all information and help especially to constructed and establish SIR methods
THANK YOU