Automated surface sampling and imaging systems under ambient conditions
US ARMY CORPS OF ENGINEERS NEW ENGLAND DISTRICT
Total Environmental Restoration Contract USACE CONTRACT NUMBER: DACW33-03-D-0006
Task Order No. 0007
FINAL PLAN FOR THE SAMPLING OF AMBIENT AIR PCB CONCENTRATIONS
DURING LOWER HARBOR CAD CELL (LHCC) CONSTRUCTION
New Bedford Harbor Superfund Site, New Bedford, MA
October 2013
Prepared by Jacobs Engineering Group New Bedford, MA 02746
ACE-J23-35BG0708-M17-0016
ACE-J23-35BG0708-M17-0016 Final Plan for the Sampling of Ambient Air PCB 10/2013 Concentrations During LHCC Construction
i
TABLE OF CONTENTS
ACRONYMS AND ABBREVIATIONS .......................................................................... iii
1.0 INTRODUCTION .................................................................................................. 1-1
2.0 BACKGROUND .................................................................................................... 2-1
3.0 AMBIENT AIR MONITORING PROGRAM ...................................................... 3-1
3.1 CUMULATIVE EXPOSURE BUDGETS ........................................................ 3-1
3.2 AIR DISPERSION MODELING....................................................................... 3-2
4.0 AIR MONITORING LOCATIONS AND FREQUENCY .................................... 4-1
4.1 AIR MONITORING EQUIPMENT .................................................................. 4-2
4.2 ANALYTICAL METHODS .............................................................................. 4-2
4.3 METEOROLOGICAL DATA ........................................................................... 4-2
5.0 REFERENCES ....................................................................................................... 5-1
Figures
Figure 1 New Bedford Harbor Site Location Map
Figure 2 Lower Harbor Showing EPA CAD Cells
Figure 3 Key Receptor Locations and Monitoring Stations

ACE-J23-35BG0708-M17-0016 Final Plan for the Sampling of Ambient Air PCB 10/2013 Concentrations During LHCC Construction
ii
(intentionally blank)
ACE-J23-35BG0708-M17-0016 Final Plan for the Sampling of Ambient Air PCB 10/2013 Concentrations During LHCC Construction
iii
ACRONYMS AND ABBREVIATIONS
CAD confined aquatic disposal
CY cubic yards
EPA U.S. Environmental Protection Agency
Jacobs Jacobs Engineering Group, Inc.
LHCC lower harbor CAD cell
mm millimeter
NBH Site New Bedford Harbor Superfund Site
ng/m3 nanograms per cubic meter of air
PCB polychlorinated biphenyl
PUF Polyurethane Foam

ACE-J23-35BG0708-M17-0016 Final Plan for the Sampling of Ambient Air PCB 10/2013 Concentrations During LHCC Construction
iv
(intentionally blank)

ACE-J23-35BG0708-M17-0016 Final Plan for the Sampling of Ambient Air PCB 10/17/2013 Concentrations During LHCC Construction 1-1
1.0 INTRODUCTION
The Environmental Protection Agency (EPA) is preparing to construct a Lower Harbor
confined aquatic disposal (CAD) cell (LHCC) at the New Bedford Harbor Superfund Site
(NBH Site). In June 2010, Jacobs Engineering Group, Inc. (Jacobs) submitted a report
titled Final Evaluation of the Impact of Dredging and CAD Cell Disposal on Air Quality,
New Bedford Harbor Superfund Site, New Bedford, MA (Jacobs 2010). This modeling
report described the air dispersion modeling that was conducted to estimate the air quality
impacts of mechanically dredging, transporting by scow, and disposing of harbor
sediments into the LHCC.
As part of the LHCC preparations, the EPA is proposing to remove the polychlorinated
biphenyl (PCB)-impacted sediment from the footprint of the LHCC prior to the
construction of the CAD cell. The EPA estimates that approximately 20,000 cubic yards
(CY) of PCB-impacted material will be removed during this seven to nine week activity.
This Air Plan presents the rationale for the locations and the overall sampling strategy for
collecting ambient air PCB concentration data at sampling station locations. These
samples will be collected only during the Phase I and Phase II top of CAD cell removal
of the PCB-impacted sediments from the footprint of the LHCC. A separate sampling
plan may be developed for the remedial dredging, transport, and disposal activities
associated with the placement of PCB-impacted sediments into the LHCC based on the
results of this data collection effort.
The development of the health-based cumulative exposure budgets is presented in the
Draft Final Development of PCB Air Action Levels for the Protection of the Public
(Foster Wheeler 2001a) (the Development Document). The principal components
associated with the implementation of the cumulative exposure tracking program are
described in the document Draft Final Implementation Plan for the Protection of the
Public from Volatilized PCBs During Contaminated Sediment Remediation at the New
Bedford Harbor Superfund Site (Foster Wheeler 2001b) (the Implementation Plan).

ACE-J23-35BG0708-M17-0016 Final Plan for the Sampling of Ambient Air PCB 10/17/2013 Concentrations During LHCC Construction 1-2
The Implementation Plan provided guidelines for implementing the principal components
of an air sampling program including: locating sampling stations, collecting air samples,
evaluating air sample data, tracking cumulative exposures, and recommending
appropriate responses to reduce or mitigate potential PCB inhalation exposures to the
public. The tracking of cumulative exposures includes identifying when “triggers” occur
i.e., conditions that indicate when follow-up analysis of projected emissions sources or
their potential impact on exposures to the public is warranted.
This Plan is divided into five sections. Section 1.0 is the Introduction. Section 2.0
provides a brief background of the site along with a discussion of the LHCC. Section 3.0
provides an overall summary of cumulative exposure budgeting and tracking. A
discussion of the role of atmospheric dispersion modeling also is presented in
Section 3.0. Section 3.0 describes how the time series of airborne PCB concentrations
will be developed and the use of a network of sampling station locations to collect the
data needed to track projected exposures relative to the established budgets. Section 4.0
specifies the locations, sampling schedules and sampling frequencies for the sampling
station locations. Section 5.0 lists the references cited in this Plan.
ACE-J23-35BG0708-M17-0016 Final Plan for the Sampling of Ambient Air PCB 10/2013 Concentrations During LHCC Construction 2-1
2.0 BACKGROUND
The NBH Site is located in Bristol County, Massachusetts, approximately 55 miles south
of Boston, and is bordered by the Towns of Acushnet and Fairhaven on the east side, and
by the City of New Bedford on the west. From north to south, the NBH Site extends
from the upper reaches of the Acushnet River estuary, through New Bedford’s
commercial port, and into Buzzards Bay (Figure 1). Background information on the PCB
contamination at the NBH Site is described in detail in Final Evaluation of the Impact of
Dredging and CAD Cell Disposal on Air Quality, New Bedford Harbor Superfund Site,
New Bedford Harbor, Massachusetts (Jacobs 2010).
The NBH Site is geographically divided into three areas. The “Upper Harbor” refers to
that portion of the Harbor north of the Coggeshall Street Bridge. The “Lower Harbor”
refers to that part of the Harbor south of the Coggeshall Street Bridge and north of the
Hurricane Barrier. The “Outer Harbor” is that portion of the Harbor south of the
Hurricane Barrier.
For modeling purposes, the three areas of the NBH Site (Upper Harbor, Lower Harbor,
and Outer Harbor), were subdivided into six zones based on PCB concentrations detected
in sediment samples during investigation activities. These investigations were performed
by Foster Wheeler as part of its pre-design field activities (Foster Wheeler 2001a). Zone
five is the general location of the LHCC. The average concentration of PCBs in the
sediment is approximately 155 parts per million (ppm) (Foster Wheeler 2001a).
The June 2010 Jacobs report titled Final Evaluation of the Impact of Dredging and CAD
Cell Disposal on Air Quality, New Bedford Harbor Superfund Site, New Bedford, MA
details the air dispersion modeling that was conducted to estimate the air quality impacts
of mechanically dredging, transporting by scow, and disposing of these sediments into
the LHCC (Jacobs 2010).
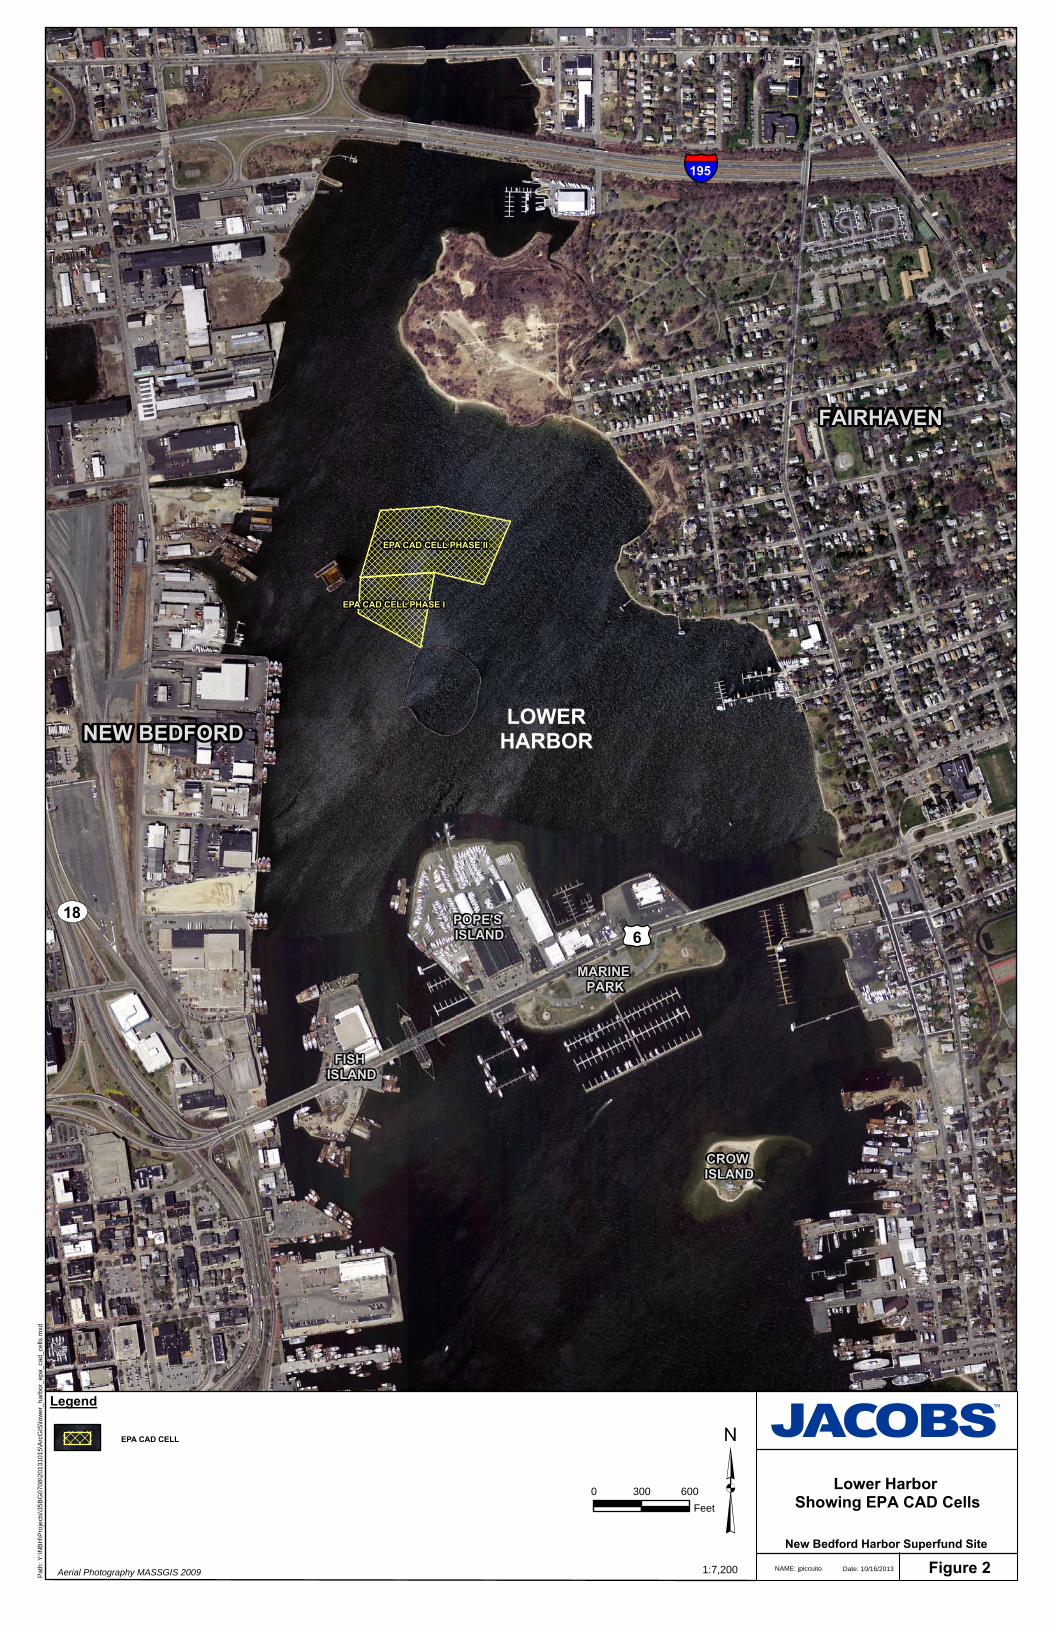
The proposed LHCC is sited in the lower harbor (Figure 2). The cell has a design
capacity of about 300,000 CY to accommodate the dredging volume. An engineered
ACE-J23-35BG0708-M17-0016 Final Plan for the Sampling of Ambient Air PCB 10/2013 Concentrations During LHCC Construction 2-2
excavation would be created and filled with sediment dredged from an area extending
from Sawyer Street south to the Route 6 Bridge. It is assumed that an open top scow
would be towed to the CAD cell, and that the dredged sediment would be placed into the
LHCC by either (a) opening a split-hull scow or (b) using a clam shell bucket. After the
CAD is filled to its design depth, a cover of clean sandy material would be placed to
prevent contact with aquatic life and to prevent migration of contaminants out of the cell.
Figure 2 shows the planned areas to be dredged and the assumed LHCC location.

ACE-J23-35BG0708-M17-0016 Final Plan for the Sampling of Ambient Air PCB 10/2013 Concentrations During LHCC Construction 3-1
3.0 AMBIENT AIR MONITORING PROGRAM
This section reviews the overall approach currently being used to track potential
cumulative public exposures to PCB concentrations in ambient air during remedial
activities at New Bedford Harbor (Jacobs 2006). In general, this includes the
measurement of ambient air PCB concentrations around New Bedford Harbor. The
process for defining the cumulative exposure budget for a sampling location is reviewed
in Section 3.1. The role of air dispersion modeling in the overall air management effort is
discussed in Section 3.2, and the approach for tracking cumulative exposures to PCBs in
air to the public is summarized in Section 3.3. The description of the current program is
provided as this approach will be used for the LHCC air sampling program.
3.1 CUMULATIVE EXPOSURE BUDGETS
As described in the Development Document an exposure budget is a target ambient air
concentration trend over time that, if achieved, will document that potential public
exposures to PCBs are below acceptable health-based target levels established for PCB
exposure at the NBH Site. The adverse health effects associated with PCB inhalation are
associated in the literature with long-term, or chronic, exposure. As such, the exposure
budget is designed to be cumulative to reflect that the measured concentrations and
projected inhalation exposures should be managed over time as the remediation
operations are performed.
As is presented in the Development Document, the slope of the cumulative exposure
budget line is the allowable ambient PCB concentration at the sampling station that is
protective of the most sensitive target receptor. This slope is quantitatively dependent on
three primary established risk assessment criteria factors (as defined in the Development
Document):
1. the Allowable Ambient Limit assuming a Target Risk of 1 x 10⁻⁵; a Cancer Slope Factor of 0.4 milligrams per kilogram per day (mg/kg/day)-1; and an exposure duration of 5 years (EPA-estimated project duration presented in the LHCC modeling effort);
ACE-J23-35BG0708-M17-0016 Final Plan for the Sampling of Ambient Air PCB 10/2013 Concentrations During LHCC Construction 3-2
2. the Annual Average Background Concentration of airborne PCBs at the point of potential exposure; and
3. the Air Dispersion Factor between the sampling station and the assumed point of exposure.
Each of the three primary factors affecting the slope of the budget line for a particular
sampling location is briefly discussed below.
The Development Document presents the development and calculation of the Allowable
Ambient Limits used in cumulative exposure budget calculations (Foster Wheeler
2001a). The health-based Allowable Ambient Limits forming the basis of the cumulative
exposure budgets were developed for exposures by both a resident and a commercial
worker Each receptor has their own limit based on exposure duration On-site worker
protection is regulated by the Occupational Safety and Health Administration (OSHA)
and has been addressed in the Site-Specific Health and Safety Plan (SSHP). Both child
and adult residents were considered in developing an Allowable Ambient Limit.
Appropriate body weights, breath (lung) volumes, and breathing rates were assumed for
each receptor. The Allowable Ambient Limits are also seen above to be a direct function
of the potential exposure period.
However, in 2005, at the request of the EPA, the estimated duration of the New Bedford
Harbor remediation was increased to 26 years. This increase in project duration was
based upon the projected annual funding for the project. Subsequently, for the 2005
remediation season, the Allowable Ambient Limit, daily average exposure of PCBs for a
child resident and commercial worker were re-calculated for a 26-year exposure period
and were calculated as 202 and 344 nanograms per cubic meter of air (ng/m3),
respectively. The PCB baseline concentration used in current calculations for the Lower
Harbor is 16.7 ng/m3.
3.2 AIR DISPERSION MODELING
The Final Evaluation of the Impact of Dredging and CAD Cell Disposal on Air Quality,
New Bedford Harbor Superfund Site, New Bedford, Massachusetts (Jacobs 2010)
ACE-J23-35BG0708-M17-0016 Final Plan for the Sampling of Ambient Air PCB 10/2013 Concentrations During LHCC Construction 3-3
modeling report described the air dispersion modeling that was conducted to estimate the
air quality impacts of mechanically dredging, transporting by scow, and disposing of
these sediments into the LHCC. Based on the results of the modeling, the predicted
maximum concentration is less than 10, 0.25 and 25 ng/m3, respectively, for each
operation.
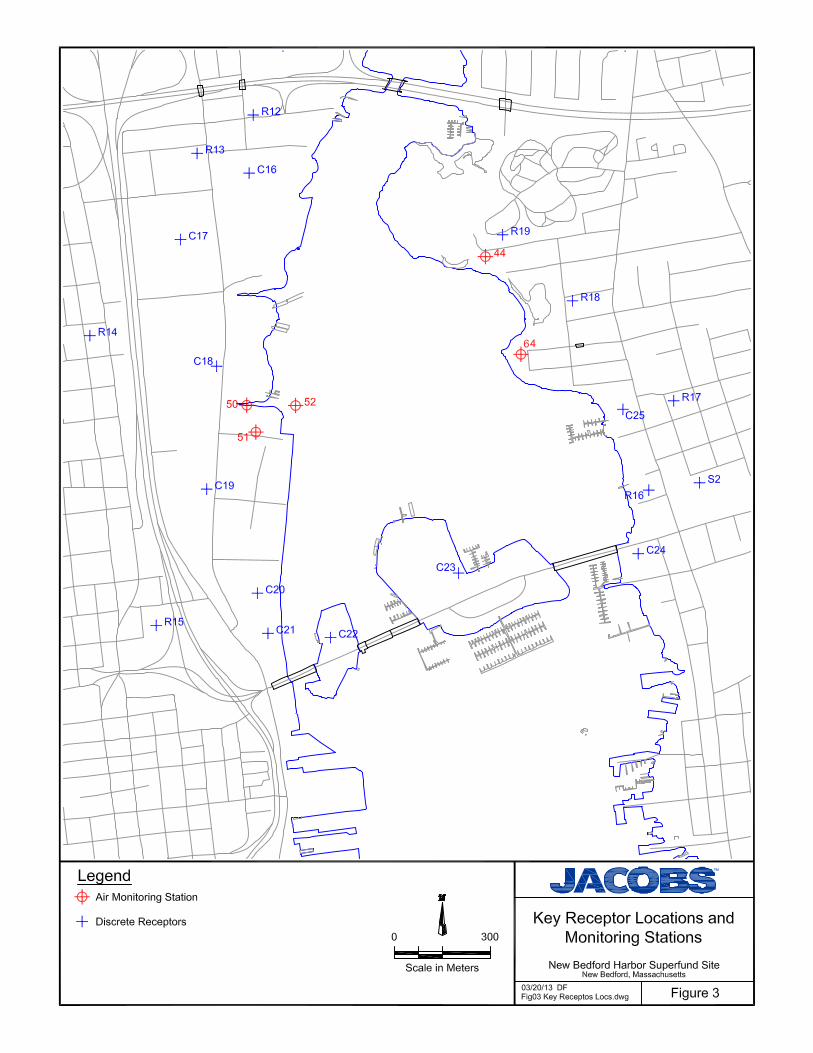
As part of the LHCC modeling effort, discrete receptors were used in the air dispersion
model to represent the air monitoring stations and sensitive residential, school, and
industrial locations. The air monitoring locations from the 2008 LHCC modeling effort
are presented on Figure 3 with the receptor locations from previous studies.

ACE-J23-35BG0708-M17-0016 Final Plan for the Sampling of Ambient Air PCB 10/2013 Concentrations During LHCC Construction 3-4
(intentionally blank)
ACE-J23-35BG0708-M17-0016 Final Plan for the Sampling of Ambient Air PCB 10/2013 Concentrations During LHCC Construction 4-1
4.0 AIR MONITORING LOCATIONS AND FREQUENCY
This Air Plan only covers monitoring during the excavation of the top of the CAD cell,
which is presented on Figure 2. The two existing station locations to be used for this
portion of the CAD cell excavation include Station #44 (Taber Street Pumping Station)
and Station #64 (Pilgrim). Stations #44 and #64 are located along the eastern side of the
New Bedford Harbor in Fairhaven. Along the New Bedford shoreline, one of three
sampling locations at Area D (Stations #50, #51, or #52), will be sampled. Area D is
where the EPA dewatering facility is located. Each sampling event will be chosen based
on the upcoming weather forecast during that week. Selection parameters include higher
temperature, low wind conditions and low probability of precipitation. During each
sampling event, the Area D sampling location will be selected dependent upon the
forecasted wind direction. The samples collected from the mechanical dredging platform
will be assigned a new station number, Station #65, to uniquely identify the location.
Shore-based samples will be collected over a 24-hour period, while the dredge sample
will be collected for the work shift of eight hours. Figure 3 shows the proposed sampling
locations in relation to previously identified receptors.
During the removal of the PCB-impacted material from the top of the LHCC footprint,
the following sampling frequency will be followed:
• Prior to the initiation of mobilization activities, one sampling round consisting of the three shore based locations to collect pre-dredge data;
• During mechanical dredging, bi-weekly sampling events at the stations sampled during the pre-dredge sampling events, plus the dredge location; and
• One post-demobilization round of sampling at the same locations as the pre-dredge sampling round.
The majority of receptors in this area are commercial in nature. The exception is the
eastern side of the harbor which has mostly residential receptors. Thus, due to the higher
number of commercial to residential receptors, the rationale is for one sample location in
the City of New Bedford, one on the dredge proper and two sample collection locations
in the Town of Fairhaven, one due east and one north-northeast of the LHCC.
ACE-J23-35BG0708-M17-0016 Final Plan for the Sampling of Ambient Air PCB 10/2013 Concentrations During LHCC Construction 4-2
4.1 AIR MONITORING EQUIPMENT
Each of the air samples will be collected using a calibrated BGI brand PQ-100 air
sampling pump programmed to run for a 24-hour time period for the land-based locations
and a maximum of 8 hours for the dredge location (#65). The sampling pump has a mass
flow controller to accurately (± 2 percent of total air volume) adjust the 5-liter per minute
flow rate based on the calibrated standard temperature and pressure. Media placement
will be approximately 1.5 to 2 meters above ground/walking surface. The media used
consists of two parts, a 22 millimeter (mm) Supelco Orbo-1500 PUF/XAD-2/PUF sample
tube and a 32 mm quartz microfiber filter. Both sections of the media are analyzed
together in order to quantify the particulate and vapor fractions of the samples. For each
sample round, a trip blank will be submitted for quality control. A duplicate sample will
be randomly selected and collected at the frequency of approximately on sample per ten
samples collected (10%). A standard chain of custody will be maintained for each
sample collected.
4.2 ANALYTICAL METHODS
Air samples will be analyzed for the ten PCB homologue groups by Test America, Inc. in
Knoxville, Tennessee using EPA method TO-10A, Determination of Pesticides and
Polychlorinated Biphenyls in Ambient Air Using Low Volume Polyurethane Foam (PUF)
Sampling Followed by Gas Chromatographic/Multi-Detector Detection (GC/MD) (EPA,
1999). The analytical method used is EPA-22 1668A. Sample turn-around-time will be
scheduled at two weeks. The collected mass of each homologue group will be quantified
and normalized to the total volume of air collected to develop concentrations for each
homologue group by the laboratory. The homologue group concentrations will then be
summed by Jacobs to obtain the ambient air concentration for total PCBs.
4.3 METEOROLOGICAL DATA
The on-site meteorological station, located near the end of Sawyer Street, adjacent to the
New Bedford Upper Harbor, is operated continuously. The data being collected at the
on-site meteorological station includes wind speed and direction, ambient temperatures at
ACE-J23-35BG0708-M17-0016 Final Plan for the Sampling of Ambient Air PCB 10/2013 Concentrations During LHCC Construction 4-3
heights of 2 meters and 10 meters, relative humidity, barometric pressure, solar radiation,
and precipitation. The wind speed and direction data will be recorded at five-minute
intervals. Complete sets of parameters will be recorded in 60-minute intervals. The
meteorological data collected on the days of the air sampling events will be tabulated
along with solar radiation data and tide cycle data.
The data for total PCB concentration and the meteorological station will be tabulated and
reported to the EPA at the end of the project.
ACE-J23-35BG0708-M17-0016 Final Plan for the Sampling of Ambient Air PCB 10/2013 Concentrations During LHCC Construction 4-4
(intentionally blank)
ACE-J23-35BG0708-M17-0016 Final Plan for the Sampling of Ambient Air PCB 10/2013 Concentrations During LHCC Construction 5-1
5.0 REFERENCES
EPA (U.S. Environmental Protection Agency). 1999 (January), Determination of Pesticides and Polychlorinated Biphenyls in Ambient Air Using Low Volume Polyurethane Foam (PUF) Sampling Followed by Gas Chromatographic/Multi-Detector Detection (GC/MD). Method TO-10A, EPA/625/R-96/010b. U.S. Environmental Protection Agency, Center for Environmental Research Information, Office of Research and Development, Cincinnati, OH.
Foster Wheeler (Foster Wheeler Environmental Corporation), 2001a (August), Draft Final Development of PCB Air Action Levels for the Protection of the Public. New Bedford Harbor Superfund Site, New Bedford Harbor, Massachusetts.
———. 2001b (August). Draft Final Implementation Plan for the Protection of the Public from Volatilized PCBs During Contaminated Sediment Remediation at the New Bedford Harbor Superfund Site. New Bedford Harbor.
Jacobs (Jacobs Engineering Group). 2010 (June). Final Evaluation of the Impact of Dredging and CAD Cell Disposal on Air Quality, New Bedford Harbor Superfund Site, New Bedford Harbor, Massachusetts. ACE-J23-35BG0702-M17-0011
———. 2006 (November). Final Plan for the Sampling of Ambient Air PCB Concentrations to Support Decisions to Ensure the Protection of the Public during Remediation Activities. New Bedford Harbor Superfund Site, New Bedford Harbor, Massachusetts. ACE-J23-35BG0107-M7-0003

ACE-J23-35BG0708-M17-0016 Final Plan for the Sampling of Ambient Air PCB 10/2013 Concentrations During LHCC Construction 5-2
(intentionally blank)

FIGURES

NEW BEDFORD
FAIRHAVEN
LOWERHARBOR
18
£¤6
§̈¦195
FISH ISLAND
POPE'S ISLAND
MARINE PARK
CROW ISLAND
EPA CAD CELL PHASE II
EPA CAD CELL PHASE I
Legend
1:7,200 NAME: jpiccuito
New Bedford Harbor Superfund Site
Lower Harbor Showing EPA CAD Cells
0 600300Feet ³
Date: 10/16/2013
Path
: Y:\N
BH
\Pro
ject
s\35
BG
0708
\201
3101
5\A
rcG
IS\lo
wer
_har
bor_
epa_
cad_
cells
.mxd
A
Figure 2Aerial Photography MASSGIS 2009
EPA CAD CELL
-$- Air Monitoring Station
+ Discrete Receptors 0 300
Scale in Meters
uc
Key Receptor Locations and Monitoring Stations
New Bedford Harbor Superfund Site Nsw Bedford, Maaaachuaatls
03120/13 OF Fig03 Kay Racaplos Locs.dwg Figure 3