FINAL No deficiency in left-to-right processing of words in dyslexia ...
33
1 No deficiency in left-to-right processing of words in dyslexia but evidence for enhanced visual crowding. Maaike Callens 1 , Carol Whitney 2, Wim Tops 1,3 & Marc Brysbaert 1 1 Ghent University, Belgium 2 University of Maryland, USA 3 Thomas More University College, Belgium Address corresponding author Maaike Callens Department of Experimental Psychology Ghent University Henri Dunantlaan 2 B-9000 Gent Belgium Tel. +32 9 264 94 31 Fax. +32 9 264 64 96 [email protected] Address other authors Carol Whitney Department of Linguistics University of Maryland College Park, MD 20740 Maryland, USA [email protected] Wim Tops Department of Experimental Psychology Ghent University Henri Dunantlaan 2 B-9000 Gent Belgium [email protected] Marc Brysbaert Department of Experimental Psychology Ghent University Henri Dunantlaan 2 B-9000 Gent Belgium [email protected]
Transcript of FINAL No deficiency in left-to-right processing of words in dyslexia ...

1
No deficiency in left-to-right processing of words in dyslexia but evidence for
enhanced visual crowding.
Maaike Callens1, Carol Whitney
2, Wim Tops
1,3 &
Marc Brysbaert
1
1Ghent University, Belgium
2 University of Maryland, USA
3Thomas More University College, Belgium
Address corresponding author
Maaike Callens
Department of Experimental Psychology
Ghent University
Henri Dunantlaan 2
B-9000 Gent
Belgium
Tel. +32 9 264 94 31
Fax. +32 9 264 64 96
Address other authors
Carol Whitney
Department of Linguistics
University of Maryland
College Park, MD 20740
Maryland, USA
Wim Tops
Department of Experimental Psychology
Ghent University
Henri Dunantlaan 2
B-9000 Gent
Belgium
Marc Brysbaert
Department of Experimental Psychology
Ghent University
Henri Dunantlaan 2
B-9000 Gent
Belgium

2
Abstract
Whitney and Cornelissen (2005) hypothesized that dyslexia may be the result of problems
with the left-to-right processing of words, particularly in the part of the word between the
word beginning and the reader’s fixation position. To test this hypothesis, we
tachistoscopically presented consonant trigrams in the left and the right visual field (LVF,
RVF) to 20 undergraduate students with dyslexia and 20 matched controls. The trigrams
were presented at different locations (from -2.5° to + 2.5°) in both visual half fields.
Participants were asked to identify the letters and accuracy rates were compared. In line
with the predictions of the SERIOL model of visual word recognition (Whitney (2001), a
typical U-shaped pattern was found at all retinal locations. Accuracy also decreased the
further away the stimulus was from the fixation location, with a steeper decrease in the LVF
than in the RVF. Contrary to the hypothesis, the students with dyslexia showed the same
pattern of results as the control participants, also in the LVF, apart from a slightly lower
accuracy rate, particularly for the central letter. The latter is in line with the possibility of
enhanced crowding in dyslexia. In addition, in the dyslexia group but not in the control
group the degree of crowding correlated significantly with the students’ word reading
scores. These findings suggest that lateral inhibition between letters is associated with word
reading performance in students with dyslexia.
Key words: dyslexia – visual word recognition - letter position encoding - SERIOL model -
crowding - lateral inhibition

3
Introduction
Although advanced readers experience little difficulty deciphering words and text, reading is a
complex process. It involves the rapid integration of orthographic, phonological, morphological,
and semantic information. Problems with any of these elements may lead to a failure or a delay
in the entire process. The complexity becomes particularly clear when we are confronted with
children having difficulties in learning to read and/or write. When no sensory deficit can explain
the reading and/or writing difficulties and when adequate tuition has been given but fails to
result in an adequate level of performance, developmental dyslexia is diagnosed.
There is strong evidence that individuals with dyslexia have phonological difficulties (de Jong &
van der Leij, 1999; Griffiths & Snowling, 2002; Vellutino, Fletcher, Snowling, & Scanlon, 2004;
Wagner & Torgesen, 1987). These deficits have been described extensively in both children and
adults with dyslexia (Bruck, 1992; Vellutino et al., 2004; Wilson & Lesaux, 2001; Wolff &
Lundberg, 2003). There is discussion, however, on a number of fronts, including whether
phonological deficits are the only problem, whether they are the basic cause of dyslexia or a
symptom of other underlying deficits (see Bishop, 2006; Blomert & Willems, 2010; Castles &
Coltheart, 2004; Dehaene et al., 2010; Ramus & Szenkovits, 2008 for more information ).
Various authors argue that a single cognitive level account of dyslexia cannot explain its
heterogeneity (Heim et al., 2008), nor can it explain the fact that some children with dyslexia do
not exhibit phonological impairments (Bosse, Tainturier, & Valdois, 2007; White et al., 2006).
Several authors have proposed models alternative to the phonological deficit hypothesis, and
models containing more than one failing component. For example, Bishop (2006) set out a

4
multifactorial view of dyslexia, in which several perceptual and cognitive impairments interact.
Menghini et al. (2010) ran a study to test this multifactorial hypothesis and concluded that
dyslexia is indeed a complex disorder that can be caused by multiple neuropsychological
deficits. They observed that only 19% of the children with dyslexia in the sample they tested
had a pure phonological deficit. Most of the children showed impairments at different levels
such as executive functioning, visual-spatial perception, attention allocation, and combinations
of the above. A similar conclusion was reached by Ramus et al. (2003) who observed that many
participants with dyslexia had sensory and motor problems in addition to a phonological
impairment.
There is some evidence to suggest differences in the earliest stages of visual word processing in
people with dyslexia. Using MEG technology, Helenius, Tarkiainen, Cornelissen, Hansen, and
Salmelin (1999) observed that the divergence in cortical activation between normal and
dyslexic readers is apparent in the earliest brain signals specific to words: 80% of the dyslexic
readers did not show the typical left hemisphere infero-temporal activation 150 ms post-
stimulus when confronted with letter strings (as opposed to other symbols or faces). This brain
area is often referred to as the visual word form area (Cohen et al., 2000; Dehaene, Cohen,
Sigman, & Vinckier, 2005; Warrington & Shallice, 1980). Taroyan and Nicolson (2009) also
reported abnormal brain activity in the visual word form area when participants with dyslexia
were confronted with words and pseudowords. One cause of these abnormalities may be a
deficit in the visual attention span of individuals with dyslexia (Bosse et al., 2007; Lobier,
Zoubrinetzky, & Valdois, 2012). A second cause may be enhanced lateral masking (reduced

5
performance on target identification when flanked by nearby stimuli), as proposed by several
authors (Bouma & Legein, 1977; Martelli, Di Filippo, Spinelli, & Zoccolotti, 2009; Pernet,
Andersson, Paulesu, & Demonet, 2009). Indeed, there is evidence that increased spacing of
letters may be beneficial to readers with dyslexia (Perea, Panadero, Moret-Tatay, & Gomez,
2012; Zorzi et al., 2012).
Whitney and Cornelissen (2005) formulated another reason why early visual processes could be
the core deficit in dyslexia, based on the SERIOL model of visual word recognition. This SERIOL
(Sequential Encoding Regulated by Inputs to Oscillations within Letter Units) model is a detailed
model of word processing, describing how the visual signals from the retina are converted into
abstract representations that can activate lexical representations (Whitney, 2001; Whitney &
Cornelissen, 2005). Such conversion must explain two aspects of visual word recognition: (1)
how words are recognized independent of their position in the visual field (and the retina), and
(2) how letter positions within words are retained. In the SERIOL model this is achieved by
means of five hierarchical layers. For a full account of the SERIOL model, see Whitney (2001).
We focus on those aspects that are related to the proposed impairment in dyslexia.
How can the SERIOL model contribute to the understanding of dyslexia? To understand this, it is
necessary to know that the SERIOL model postulates a left-to-right word recognition process at
the highest level, the lexical level. The letters of the words are encoded in such a way that the
signals of the first letter fire before those of the second letter, which in turn fire before those
related to the third letter, and so on, resulting in a letter activation pattern from left to right,

6
adequate for lexical retrieval. The left-to-right firing of letters is called the location gradient.
When a word is fixated at the first letter or presented in the right visual field (RVF), the location
gradient is in line with the signals coming from the retina (called the acuity gradient). Indeed, it
is well documented that stimuli require more time to be processed the further they are from
the centre of the visual field, because visual acuity drops steeply away from the fixation point
(Brysbaert & Nazir, 2005). The increase in processing time can already be observed for letters
presented one or two positions away from the fixation location. The right part of Figure 1
shows the correspondence between the acuity gradient and the location gradient when a word
is presented in the RVF.
7
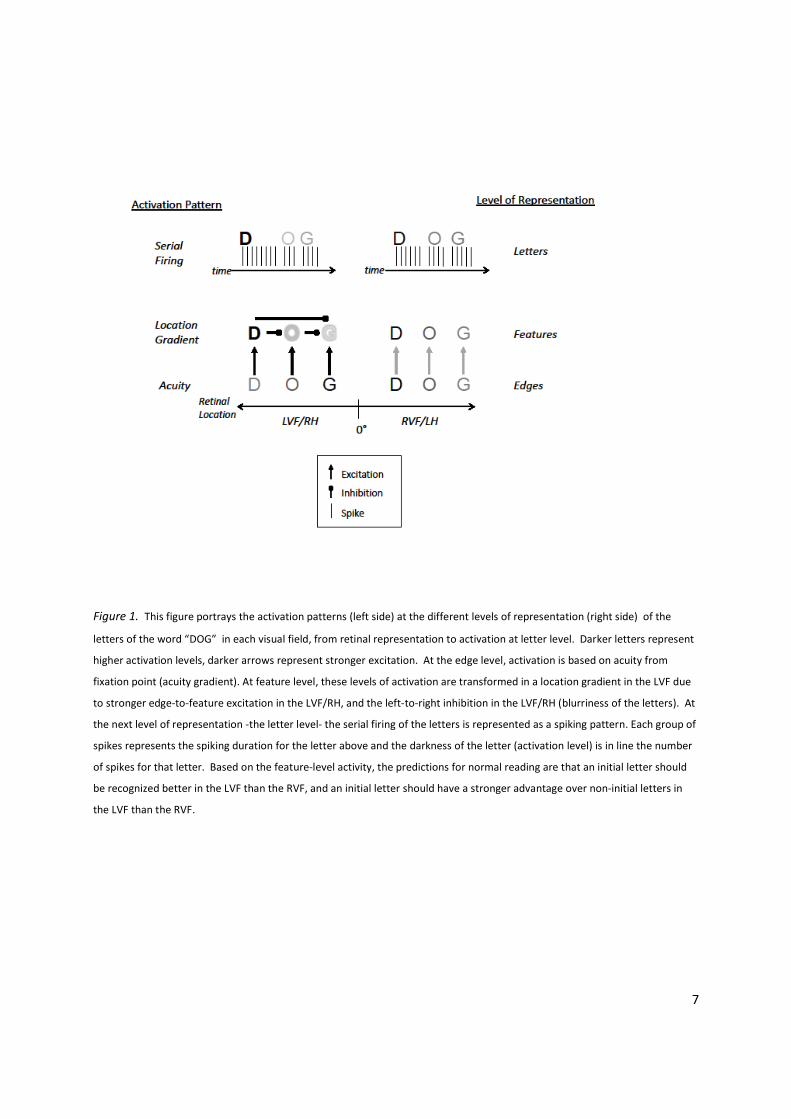
Figure 1. This figure portrays the activation patterns (left side) at the different levels of representation (right side) of the
letters of the word “DOG” in each visual field, from retinal representation to activation at letter level. Darker letters represent
higher activation levels, darker arrows represent stronger excitation. At the edge level, activation is based on acuity from
fixation point (acuity gradient). At feature level, these levels of activation are transformed in a location gradient in the LVF due
to stronger edge-to-feature excitation in the LVF/RH, and the left-to-right inhibition in the LVF/RH (blurriness of the letters). At
the next level of representation -the letter level- the serial firing of the letters is represented as a spiking pattern. Each group of
spikes represents the spiking duration for the letter above and the darkness of the letter (activation level) is in line the number
of spikes for that letter. Based on the feature-level activity, the predictions for normal reading are that an initial letter should
be recognized better in the LVF than the RVF, and an initial letter should have a stronger advantage over non-initial letters in
the LVF than the RVF.

8
When the word is fixated at the last letter or presented in the left visual field (LVF), the acuity
gradient is in contradiction with the location gradient, because under these circumstances the
retinal signal is clearest/fastest for the last letter of the word, less so for the second-last letter,
and so on. To reverse the acuity gradient into the location gradient, an inhibition process is
postulated, such that the signals of the letters are inhibited until the signals of the preceding
letters have fired. The left part of Figure 1 shows how the acuity gradient of a word presented
in the LVF is reversed into the appropriate location gradient.
Further factors taken into account by the SERIOL model are that the retinal signals not only
depend on the distance from fixation, but also on whether they come from letters on the
outside of a word or from inner letters. The signals from exterior letters are stronger/faster
because they are not fully surrounded by other letters. In addition, the firing of the last letter is
not terminated by a subsequent letter.
A strong aspect of the SERIOL model is that it is mathematically formulated, so that it makes
precise predictions about the chances of identifying the letters of tachistoscopically presented
letter strings in both hemifields1. In the LVF, strong left to right inhibition is needed to turn the
acuity gradient into the location gradient. In addition, there are the stronger signals from the
exterior letters. Together these factors predict that the first letter of a word presented in the
LVF will have the highest activation (even though it is furthest away from fixation), followed by
the last letter, and the inner letters. There are two factors that influence the predictions on
1 We restrict ourselves to the predictions made for small eccentricities, within -5°/5° of fixation, as these pertain to the present
study. The letter perceptibility weights are slightly different for larger eccentricities.

9
identification patterns in the RVF, namely the presence of the acuity gradient and the higher
activation levels for the exterior letters. Because the acuity gradient is less steep than the serial
inhibition in the LVF, the pattern of results is expected to be more symmetric.
The predictions from the SERIOL model were confirmed in a tachistoscopic trigram
identification experiment performed by Legge, Mansfield, and Chung (2001). These authors
observed that in the LVF the first letter of the trigram had a much higher chance of being
identified than the third letter, which in turn was identified more often than the middle letter.
In the RVF, there was less difference between the accuracies for the first and the last letter, and
both were better than the middle letter. The asymmetry between LVF and RVF is a function of
the reading direction and reverses for languages read from right to left (Adamson & Hellige,
2006; Eviatar, 1999).
Because the conversion from the acuity gradient to the location gradient (for letters presented
to the left of fixation) is a process specific to reading, Whitney and Cornelissen (2005)
hypothesized that problems with its acquisition would lead to deficits very similar to those
observed in dyslexia. More specifically, if people with dyslexia have a deficient location
gradient, they would only be able to process the letters of the words in the right order when
they are fixating on the first letter. Given that most words in reading are fixated towards the
middle, the order of the letters to the left of fixation would be jumbled up and they would
interfere with the processing of the letters to the right of fixation.

10
In summary,Whitney and Cornelissen (2005) hypothesized that the reading problems of
individuals with dyslexia could be caused by a deficiency in the formation of the location
gradient. Some empirical evidence consistent with this hypothesis was published by Pitchford,
Ledgeway, and Masterson (2009). In a visual search task they reported that dyslexics reacted
more slowly than skilled readers to target letters located on the left of the stimulus array. This
could be interpreted as evidence for a deficient conversion of the acuity gradient to the
location gradient in the LVF. In the present paper, we performed a more direct test of the
hypothesis by comparing the performance of students with and without dyslexia on Legge et al.
(2001) trigram recognition study. If the location gradient formation is indeed underdeveloped
in students with dyslexia, the SERIOL model makes a straightforward prediction of how the
pattern of results will differ in readers with dyslexia, as shown in Figure 2. Given that the acuity
gradient agrees with the location gradient in the RVF and no inversion is needed, dyslexic
readers should perform very similar to normal readers here, with better performance for the
first and the last letter than for the middle letter. In contrast, given the importance of the
location gradient formation in the LVF, the performance of the dyslexic readers should differ
from that of the controls. In particular, they are not expected to show the strong advantage for
the first letter of the trigram. Because of the acuity gradient we even predict that the last letter
will be indentified more often than the other two letters.
11
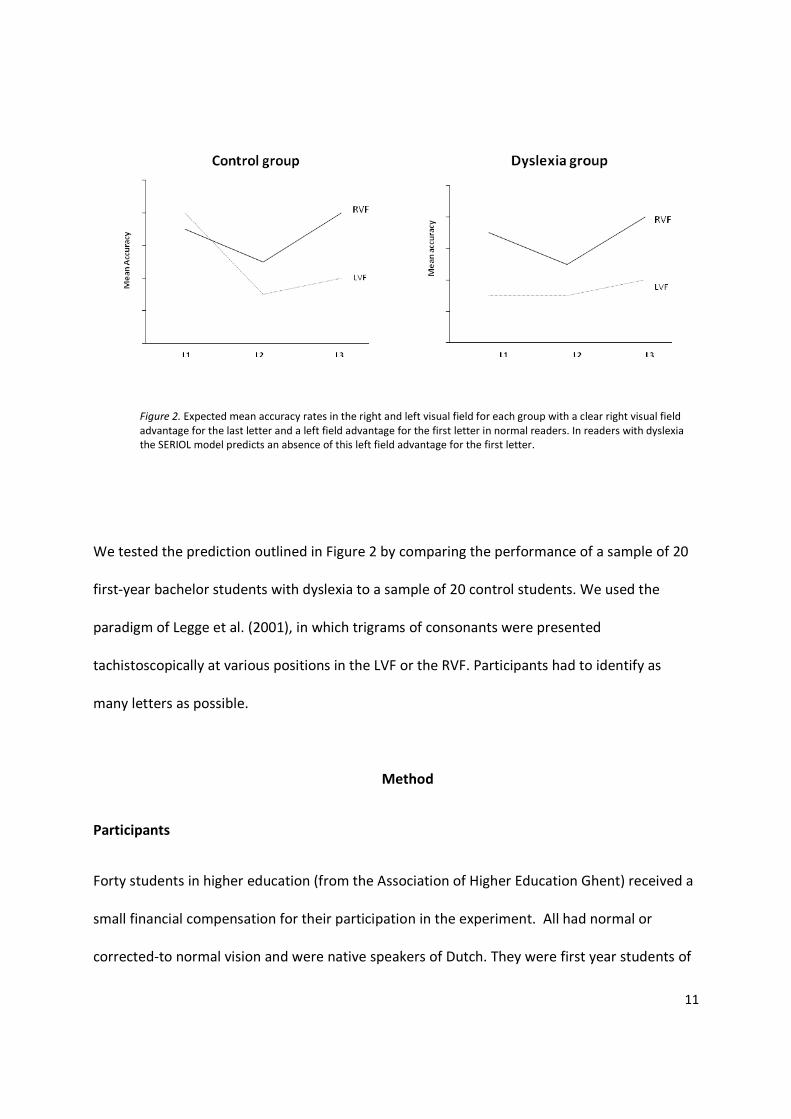
Figure 2. Expected mean accuracy rates in the right and left visual field for each group with a clear right visual field
advantage for the last letter and a left field advantage for the first letter in normal readers. In readers with dyslexia
the SERIOL model predicts an absence of this left field advantage for the first letter.
We tested the prediction outlined in Figure 2 by comparing the performance of a sample of 20
first-year bachelor students with dyslexia to a sample of 20 control students. We used the
paradigm of Legge et al. (2001), in which trigrams of consonants were presented
tachistoscopically at various positions in the LVF or the RVF. Participants had to identify as
many letters as possible.
Method
Participants
Forty students in higher education (from the Association of Higher Education Ghent) received a
small financial compensation for their participation in the experiment. All had normal or
corrected-to normal vision and were native speakers of Dutch. They were first year students of

12
either an academic bachelor (university and some academic colleges for higher education) or a
professional bachelor (other colleges for higher education with less theory-driven teaching).
The group consisted of 20 students diagnosed with dyslexia and a control group of 20 students
with no known neurological impairments. All students were selected from the participants of a
large scale study on dyslexia in higher education conducted at Ghent University, in which 100
students with dyslexia were compared to 100 matched control students on a battery of tests
(Callens, Tops, & Brysbaert, 2012). Diagnoses of dyslexia were based on three criteria which are
used by the Stichting Dyslexie Nederland (2008) [Foundation Dyslexia Netherlands]: (1) reading
and/or spelling abilities are significantly below the level of performance expected for their age;
(2) resistance to instruction despite effective teaching; (3) impairment cannot be explained by
extraneous factors, such as sensory deficits. Table 1 shows the main characteristics of the
groups. They were matched for age [t(38)= - 0.32 , p = .75] and intelligence [t(38) = 1.03 , p
=.75] as measured with the Kaufmann Adult Intelligence Test (Dekker, Dekker, & Mulder, 2004).
Reading skills were assessed with a word reading and a pseudoword reading test. The word
reading test was the Dutch One Minute Test (Brus & Voeten, 1991). A list of 116 Dutch words of
increasing difficulty is presented in four columns. Participants have to accurately read as many
words as possible in one minute. The pseudoword reading test was the Klepel (van den Bos,
Spelberg, Scheepsma, & de Vries, 1999). The principle is the same as in the One Minute Test but
instead of words pseudowords are presented. Writing skills were assessed with a standardized
word spelling test for adolescents and adults, comprising of 30 words (De Pessemier & Andries,
2009). On all three tests the control group obtained scores within the normal range, whereas
the students with dyslexia on average had scores more than 1.5 standard deviations below this

13
level (see the effect sizes in Table 1).2 Of the 20 students with dyslexia, two had a comorbid
hyperactivity disorder.
Table 1
Characteristics of the 20 Control Students and the 20 Students with Dyslexia
Control students Dyslexia students
Gender Male 8 7
Female 12 13
Institution University 13 9
College 7 11
Handedness Right 19 14
Left 1 6
Mean (SD) Mean (SD) Effect size (d)
Age 19.20 (0.69) 19.20 (0.79) NA
TIQ 110.75 (9.70) 109.85 (7.88) 0.10
OMT 59.2 (28.12) 18.22 (21.47) -1.70
Klepel 57.34 (30.28) 17.09 (19.43) -1.61
Word dictation 59.75 (27.00) 17.6 (18.90) -1.65
Note. TIQ= Total IQ score; OMT= Dutch word reading, calculated from centile scores of the number of words read correctly in 1 minute time;
Klepel= pseudoword reading, calculated from centile scores of the number of pseudowords read correctly in 1 minute time. Effect size
calculated according to Cohen’s d.
Design and stimuli
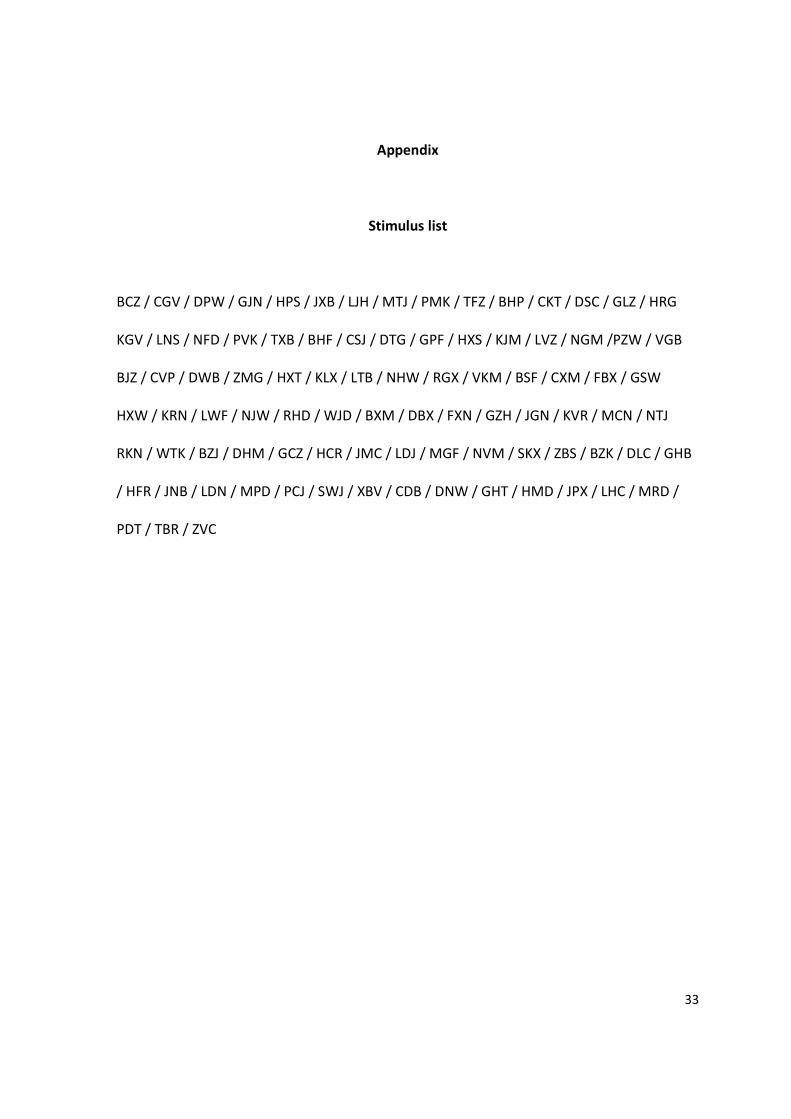
The stimuli consisted of consonant trigrams typed in upper case Courier New Font, size 24,
composed of 3 consonants (see the appendix). The trigrams never contained two of the same
2 Five students from the group with dyslexia performed significantly worse on the spelling test than on the reading tests. To
make sure that our findings were not distorted by this subgroup, we repeated the analyses with the scores of the remaining 15
dyslexic participants. The results were the same as the ones reported here.

14
consonants and no two visually similar consonants were juxtaposed. By using trigrams, we
minimized top-down contributions from phonology, lexicality, or semantics, so that the results
maximally reflect the contribution of orthographic (visual) processing. The stimuli were
presented at 11 horizontal retinal locations going from 5 letter positions to the left of fixation
to 5 letter positions to the right of fixation (distances measured to the letter in the middle of
the trigram). Participants were sitting at a distance of 60 cm from the screen, so that each letter
subtended 0.5° of visual angle and the stimuli were presented from -3.0° in the LVF (the first
letter of the most leftward stimulus location) to +3.0° in the RVF (the last letter of the most
rightward stimulus location). The stimuli were presented briefly and participants were asked to
type in the letters they perceived. Because interactions are difficult to interpret in the presence
of large main effects (Loftus, 1978), we decided to work with individually adjusted stimulus
presentation times. This also avoided ceiling and floor effects (Adamson & Hellige, 2006). The
experiment began with practice blocks, each consisting of 18 trials. Trials in the first block used
a stimulus duration equivalent to one refresh cycle of the monitor, namely 14 ms. After each
block, the stimulus duration was increased by one refresh cycle until an accuracy rate of 70 %
was reached. Once the threshold was acquired, the experiment started, using this presentation
duration. Two blocks of 90 trials were presented. Per participant, the mean accuracy per letter
and location was calculated.
Procedure
Participants completed the experiment individually in a quiet, well-lit room. They were seated
in front of a computer screen at a distance of 60 cm. Detailed instructions were given on three

15
subsequent screens. The participants were asked to concentrate on the fixation location,
indicated by a flashing fixation cross (“+”). This fixation cross was obtained by six times
presenting a “+” for 90 ms followed by a blank interval of 90 ms. The trigram stimulus was
presented after the last blank interval, followed by a string of hash marks to mask the stimulus.
The mask remained on the screen until the participant responded. The task of the participants
was to type in the letters they had perceived. They were told that the speed of the response
and the order of letters were unimportant. After the response was entered, there was a one
second interval before the next trial was presented. Whenever the participants wanted to take
a rest, they could pause the block.
Results
Presentation duration
For each participant, the presentation duration needed to obtain an accuracy level of 70%
during the practice trials was noted. To compare the presentation times (expressed in
milliseconds) of the groups, the data was first tested for normality using a Kolmogorov-Smirnov
test expressed with the test statistic D. Data distributions for the control group [M = 70.6 ms,
SD = 17.3 ms; D(20) = .301, p < .01,] and the group of participants with dyslexia [M = 78.2 ms,
SD = 13.4 ms; D(20) = .27, p < .01] were significantly non-normal, so we used the non-
parametric Mann-Whitney-U test for data analysis. The presentation durations between the
two groups needed to reach 70% levels of accuracy were not significantly different [U = 243, p =
.244].3
3 In the next sections it will become clear that our procedure did not completely succeed in getting equivalent levels of
performance in the group with dyslexia and the controls. If full equivalence is required, it may be better to adjust the stimulus
duration as a function of the accuracy level throughout the entire experiment. Another way to better match the performance

16
Results for the main hypothesis
To test the main hypothesis of this study - namely that readers with dyslexia have a different
letter identification pattern in the LVF due to impaired inversion of the acuity gradient into the
location gradient - we ran an ANOVA with letter position (initial letter L1, middle letter L2, final
letter L3) and trigram location (Location 1 to Location 9: Loc1 to Loc9) as repeated measures
variables and group (normal, dyslexic) as a between subjects factor on the mean percentage
correct scores. The assumption of homogeneity of variance was found valid on the basis of the
Levene test. Our hypothesis predicted an interaction between letter position, trigram location,
and group, but this effect was not significant [F(16,23) = 1.290, p = .282].
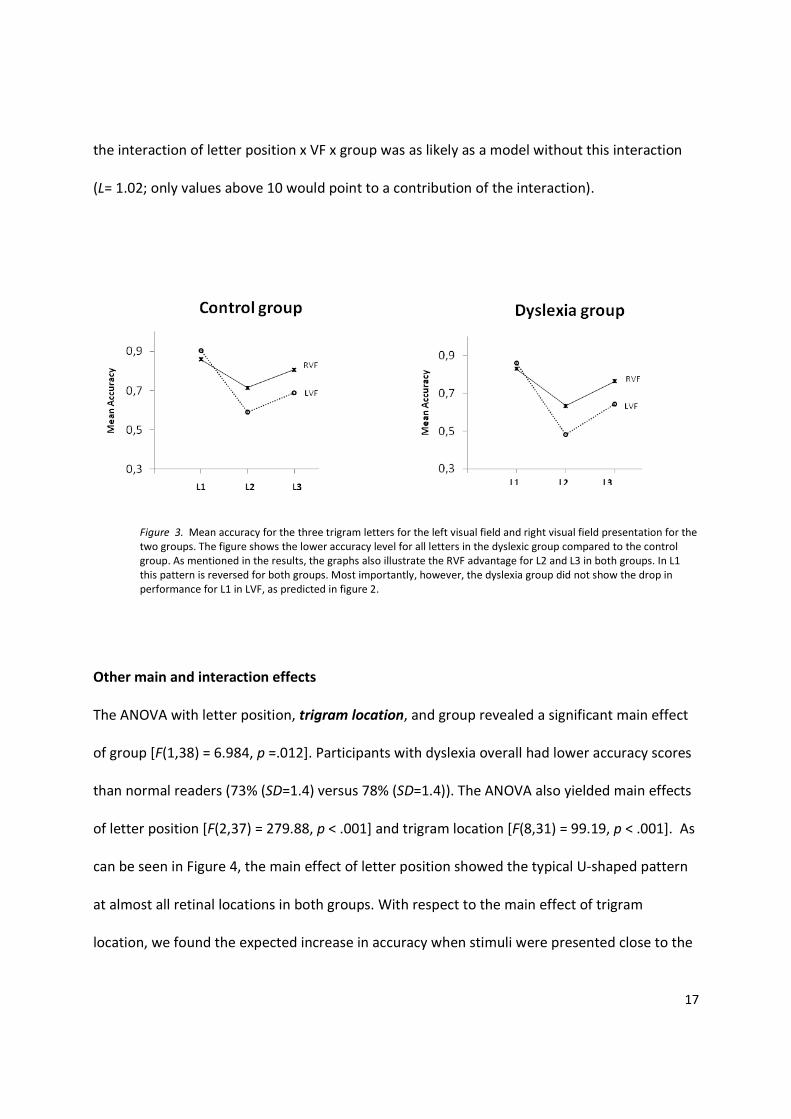
To better test the prediction outlined in Figure 2, we averaged the data per visual field. For the
LVF we calculated the mean accuracies of trigram locations 1 to 4; for the RVF we grouped the
trigram locations 6 to 9. An ANOVA on this new variable was run with visual half field (RVF, LVF)
and letter position (initial letter L1, middle letter L2, final letter L3) as repeated measures and
group (normal, dyslexic) as a between subjects variable. As can be seen in Figure 3, the
performance of the participants with dyslexia was very similar to that of the control
participants, both in the LVF and the RVF. In particular, the participants with dyslexia did not
perform less well on the first letter (L1) in the LVF, as expected on the basis of Whitney and
Cornelissen (2005). The interaction group x visual half field x letter position was not significant
[F(2,37)= 0.252, p= .78] and a likelihood ratio test (Dixon, 2003) confirmed that a model with
levels may be to use a screen with a higher refresh rate than the presently used 70 Hz, so that finer adjustments can be made.
Our adjustments were inspired by the consideration that large differences in overall performance would make the
interpretation of interaction effects difficult, and we succeeded in the objective of avoidance them.
17
the interaction of letter position x VF x group was as likely as a model without this interaction
(L= 1.02; only values above 10 would point to a contribution of the interaction).
Figure 3. Mean accuracy for the three trigram letters for the left visual field and right visual field presentation for the
two groups. The figure shows the lower accuracy level for all letters in the dyslexic group compared to the control
group. As mentioned in the results, the graphs also illustrate the RVF advantage for L2 and L3 in both groups. In L1
this pattern is reversed for both groups. Most importantly, however, the dyslexia group did not show the drop in
performance for L1 in LVF, as predicted in figure 2.
Other main and interaction effects
The ANOVA with letter position, trigram location, and group revealed a significant main effect
of group [F(1,38) = 6.984, p =.012]. Participants with dyslexia overall had lower accuracy scores
than normal readers (73% (SD=1.4) versus 78% (SD=1.4)). The ANOVA also yielded main effects
of letter position [F(2,37) = 279.88, p < .001] and trigram location [F(8,31) = 99.19, p < .001]. As
can be seen in Figure 4, the main effect of letter position showed the typical U-shaped pattern
at almost all retinal locations in both groups. With respect to the main effect of trigram
location, we found the expected increase in accuracy when stimuli were presented close to the

18
fixation location. The decrease in performance as a function of eccentricity was steeper in the
LVF than in the RVF. Turning to the main effect of letter position, performance was better on L1
than on L2 [t(39) = 22.012, p < .001], on L3 than on L2 [t(39) =8.470, p < .001] and on L1 than on
L3 [t(39) = 15.06, p< .001].
Retinal position

19
Figure 4. Mean accuracy of each of the three trigram letters at different locations from -2.5° to 2.5° of fixation point.
In addition to these main effects, there were two significant interaction effects: letter position x
group [F(2,37) = 4.168, p = .023] and trigram location x letter position [F(16,23) = 20.818,
p<.001]. The letter position x group interaction was explored with follow-up ANOVAS; these
indicated that performance between the groups did not differ on L1 [t(38) = 1.679, p=.101, d =
.5], was marginally worse on L3 [t(38)= 2.120 , p = .041, d = .6], but differed significantly on L2
[t(38) = 3.539, p = .001, d = 1.4]. Because the observed trigram location x letter position
interaction [F(16,23) = 20,818, p < .001] is in line with the SERIOL predictions and is not of
particular interest to the idea tested in this paper, we do not present a detailed description.
Retinal position

20
The ANOVA with letter position, visual half field, and group replicated the main effect of group
[F(1,38)= 7.153, p= .01]. It further revealed a clear RVF advantage [F(1.38) = 58.609, p < .001],
which was present in both groups as the interaction group x visual field (VF) was not significant
[F(1,38) =0 .728, p = .399]. A RVF advantage for letter perception has been reported several
times before (e.g., Hellige, Taylor, and Eng (1989) Hellige, Cowin, and Eng (1995) and is related
to the typical left hemisphere dominance for language processing (Hunter & Brysbaert, 2008).
There was a main effect of letter position [F(2,37)= 291.21, p < .001], which interacted with
visual half field [F(2,37)= 46.02, p < .001] and with group [F(2,37)= 4.52, p= .017]. The
interaction between letter position and visual half field was caused by the fact that the RVF
advantage was only present for L2 [t(39) = - 8.852, p < .001] and L3 [t(39) = - 7.213, p < .001].
For L1, there was a reversed visual field advantage: The first letters of the trigrams were
reported more accurately in the LVF than in the RVF [t(39) = 2.773, p = .008]. The interaction
between letter position and group was due to the relatively worse performance on L2 in the
dyslexic group. This finding is further examined in the next section.
The crowding effect
To further examine the worse performance on L2 in the dyslexic group and the crowding to
which it could point, a new variable was constructed to express how much worse L2 was
identified compared to L1 and L3. This was calculated per participant by subtracting the overall
accuracy on L2 from the average accuracies on L1 and L3 across all stimulus locations [i.e.,
crowding= (L1 mean accuracy + L3 mean accuracy)/2 – L2 mean accuracy]. As expected on the basis of the
previous ANOVAs, a t-test on this crowding variable showed a larger difference between

21
performance on the inner letter and the outer letters in the dyslexia group [M=0.18, SD =0.05]
than in the control group [M=0.14, SD= .05; t(38)= -2.602, p=.013]. To gauge the potential
importance of the difference, we calculated a Cohen’s d effect size, which equalled to d = 0.8,
so potentially a large effect (although one has to take into account the large confidence
interval, given the small numbers of participants involved in the between-group comparison).
The same variable was calculated for the two visual fields separately, and showed a larger
crowding effect in the LVF (locations 1 to 4) than in the RVF (locations 6 to 9) [F(1,38)= 41.311,
p<.001]. The larger crowding effect in the LVF was found for both groups (as the interaction
with participant group was not significant; F(1,38) = 0.441, p = .511).
Correlations and linear regressions with reading scores
To see whether the enhanced crowding was connected to the reading skills in general, Pearson
correlations were calculated between the crowding variable and the scores on the One Minute
Test (word reading), the Klepel (pseudoword reading), and the word dictation test for the 40
participants. These revealed significant correlations with crowding for the reading tests (OMT:
r= -.507, N = 40, p= .001; Klepel: r= -.393, N = 40, p=.012; word dictation: r=-.23, N = 40, p=.151).
Further multiple regression analysis on the data from the dyslexia group with the scores on the
OMT, the Klepel, and word dictation as predictors, indicated that only the OMT was a
significant independent predictor of crowding in this group [β = -0.002, CI95% lower bound = -
0.003, CI95% upper bound = -0.0001, p = .001].4 The scores on the Klepel did not provide a
4 To make sure that the correlation with OMT could be interpreted as the outcome of crowding, we additionally looked at the
correlations between OMT and performance on each of the letter positions. This analysis conformed that the correlation OMT
performance and L2 accuracy in the dyslexic group was significantly larger than the correlation between OMT performance and
L1 accuracy (p=.006, Hotelling-Williams test, see (Steiger, 1980)) or the correlation between OMT and L3 accuracy (p=.059).

22
significant increase in prediction precision [β=0.136, p=.452], nor did the scores on the word
dictation test [β=-0.105, p=.582]. The overall model fit was R = .257. A similar analysis on the
data of the control group did not provide a significant predictor. Figure 5 illustrates the
difference between the two groups.
Figure 5. Scatter plots of the control group and the dyslexia group with on the X-axis the crowding effect and on the
Y-axis the scores on the One Minute Test (Brus & Voeten, 1991). A linear trend line was added.

23
To further check whether problems with the formation of the location gradient could be a
factor in the worst performing participants, we also calculated the correlations between a
location variable defined as L1–L3 in the LVF (i.e., on stimulus locations 1-4) and the reading
and writing scores. If the absence of the L1 advantage is the origin of reading problems, we
should find that the difference between L1 and L3 is particularly small for poor readers. In other
words, for the dyslexics we should find a positive correlation between reading skill and the
difference between L1 and L3 in the LVF. No such correlation was found. As a matter of fact, the
correlations trended in the opposite direction, with a slightly smaller difference for good
readers than for poor readers, although the correlations were not significant (correlation
between OMT and L1-L3 difference: r = -.30, p=.197, N = 20; Klepel: r = -.17, p=.391; word
dictation: r = -.06, p=.474).
Discussion
In this paper we tested a hypothesis about the origin of dyslexia put forward by Whitney and
Cornelissen (2005)on the basis of the SERIOL model of visual word recognition. According to the
SERIOL model, visual word recognition involves a reading-specific skill (the inversion of the
acuity gradient into the location gradient for letters presented to the left of fixation). Whitney
and Cornelissen hypothesized that failure in acquiring this skill could be the true origin of
reading problems (and the accompanying phonological deficits). To test this proposal, we
repeated a study of Legge et al. (2001), in which consonant trigrams presented in the LVF and
the RVF produced a pattern of results that was in line with simulations of the SERIOL model.
Whitney and Cornelissen’s (2005) hypothesis predicted a crucial difference between
participants with dyslexia and controls for this particular task, as participants with dyslexia were

24
expected not to show the high identification rate for the first letter in the LVF. For the rest, the
performances were expected to be very similar (see the predictions laid out in Figure 2).
To test the hypothesis, two groups of participants were examined: one with normal
reading/writing skills, and one with deficient reading/writing skills (Table 1). We were able to
replicate the findings of Legge et al. (2001) in the group with normal skills (first part of Figure 3),
providing evidence for the SERIOL model as a model of visual word recognition. However,
contrary to the predictions of Whitney and Cornelissen (2005) we obtained very much the same
pattern of results in the group with dyslexia (second part of Figure 3), suggesting that for the
group of dyslexics we tested problems with the formation of the location gradient were not the
origin of the reading problems. This is different from the finding with the visual search task
reported by Pitchford et al. (2009), which pointed in the direction of reduced performance in
the LVF for dyslexic readers.
The only significant difference we found between the dyslexic and the control group was worse
performance on the middle letters of the trigrams (L2), suggesting an enhanced crowding effect
in poor readers. Bouma (1970) was amongst the first to report inferior identification of
embedded letters compared to letters in isolation, a phenomenon referred to as lateral
masking or crowding (Bouma, 1973; Brysbaert & Nazir, 2005; Huckauf, Heller, & Nazir, 1999;
Huckauf & Nazir, 2007; Massaro & Cohen, 1994; Pelli et al., 2007). Lateral masking is thought to
occur at the first stages of visual processing before the letters are identified (Huckauf et al.,
1999; Huckauf & Nazir, 2007). The extent of lateral masking is influenced by three factors: (1)

25
the distance of the stimulus from fixation, (2) the distance between adjacent letters, and (3) the
similarity between letters. Lateral masking is largest when the stimulus is far from fixation, the
letters are close to each other and similar to one another. Bouma and Legein (1977) further
reported an enhanced crowding effect in readers with dyslexia, a finding replicated by several
authors (Goolkasian & King, 1990; Klein, Berry, Briand, Dentremont, & Farmer, 1990; Martelli et
al., 2009; Pernet, Valdois, Celsis, & Demonet, 2006). Moores, Cassim, and Talcott (2011) argued
that the enhanced crowding effect in dyslexia could be due to a deficit in attention allocation or
to an unusually high lateral inhibition. For an alternative hypothesis of crowding in terms of
letter position encoding see also Collis, Kohnen, and Kinoshita (2012).
An obvious next step was to correlate the crowding effect of the participants to their reading
and writing scores as measured with a word reading test (OMT), a nonword reading test (the
Klepel), and a word dictation test. We indeed observed in our dyslexic students (but not in
controls; Figure 5) that enhanced crowding correlated with word reading performance (more
than with nonword reading performance and word dictation), further suggesting a link between
both variables, in line with the recent demonstration that increased letter spacing helps
children with dyslexia more than control children (Perea et al., 2012; Zorzi et al., 2012). Further
analyses confirmed that the correlation was limited to the crowding effect, as the correlation
between word reading performance and accuracy scores on the middle letter in the dyslexic
group was significantly larger than the correlation between word reading performance and
accuracy on the first letter and last letter. Thus performance on the middle letter correlated
best with the reading scores.

26
Although it is tempting to interpret the correlation between dyslexia and degree of crowding as
suggesting that crowding is the cause of dyslexia, it is important to keep in mind that this
interpretation may not be correct. Grainger, Tydgat, and Issele (2010) reported a larger
crowding effect for symbols than for letters in normal readers and hypothesized that the
smaller crowding effect for letters is letter-specific and the consequence of a specialized system
acquired as part of learning to read. On the basis of this finding, a plausible, alternative
interpretation of the larger crowding effect for dyslexics in our experiment may be that it is a
consequence of less reading experience, rather than a cause of the reading problem.
Returning to the main question addressed in this study, we were unable to find evidence for
Whitney and Cornelissen’s (2005) hypothesis that the reading problem in dyslexia is due to a
deficit in the left-to-right processing of words. There was no indication that students with
dyslexia were less efficient at inversing the acuity gradient in the LVF than the controls. As a
result we can conclude that problems with the location gradient are not the only cause of
dyslexia. Whether we should conclude that it plays no role at all depends on the extent to
which the participants we tested are representative of all people with dyslexia. Our sample
performed considerably below expected levels on tests of reading and spelling, and all had a
confirmed diagnosis of dyslexia. Nevertheless, they were a relatively high-achieving group,
having compensated sufficiently to have started undergraduate studies. In terms of a
multifactorial view of dyslexia, it remains possible that for some people, an impairment in the
ability to inverse an acuity gradient into a location gradient for letters to the left of fixation is a

27
possible cause of their dyslexia. As this might be associated with more severe reading
difficulties, future studies should repeat our test with younger people with dyslexia, to see
whether they all show the normal pattern, as seen in the adults with dyslexia in this
experiment, and if not, to monitor the reading progress in children showing a deviant pattern.

28
Acknowledgements
We would like to thank the anonymous reviewers for their helpful comments on the
manuscript. In particular, we would like to thank the editor, prof. Kate Nation for her
valuable contribution to the improvement of this research paper.

29
References
Adamson, M. M., & Hellige, J. B. (2006). Hemispheric differences for identification of words and
nonwords in Urdu-English bilinguals. Neuropsychology, 20(2), 232-248. doi: 10.1037/0894-
4105.20.2.232
Bishop, D. V. M. (2006). Dyslexia: what's the problem? Developmental Science, 9(3), 256-257. doi:
10.1111/j.1467-7687.2006.00484.x
Blomert, L., & Willems, G. (2010). Is There a Causal Link from a Phonological Awareness Deficit to
Reading Failure in Children at Familial Risk for Dyslexia? Dyslexia, 16(4), 300-317. doi:
10.1002/dys.405
Bosse, M. L., Tainturier, M. J., & Valdois, S. (2007). Developmental dyslexia: The visual attention span
deficit hypothesis. Cognition, 104(2), 198-230. doi: 10.1016/j.cognition.2006.05.009
Bouma, H. (1970). Interaction effects in parafoveal letter recognition. Nature, 226(5241), 177-&. doi:
10.1038/226177a0
Bouma, H. (1973). Visual interference in parafoveal recognition of initial and final letters of words. Vision
Research, 13(4), 767-782. doi: 10.1016/0042-6989(73)90041-2
Bouma, H., & Legein, C. P. (1977). Foveal and parafoveal recognition of letters and words by dyslexics
and by average readers. Neuropsychologia, 15(1), 69-80. doi: 10.1016/0028-3932(77)90116-6
Bruck, M. (1992). Persistence of dyslexics phonological awareness deficits. Developmental Psychology,
28(5), 874-886. doi: 10.1037/0012-1649.28.5.874
Brus, B., & Voeten, M. (1991). Een-minuut-test vorm A en B, schoolvorderingstest voor de technische
leesvaardigheid bestemd voor groep 4 tot en met 8 van het basisonderwijs. Verantwoording en
handleiding. Lisse, The Nederlands: Swets & Zeitlinger.
Brysbaert, M., & Nazir, T. (2005). Visual constraints in written word recognition: evidence from the
optimal viewing-position effect. Journal of Research in reading, 28(3), 216-228. doi:
10.1111/j.1467-9817.2005.00266.x
Callens, M., Tops, W., & Brysbaert, M. (2012). Cognitive profile of students who enter higher education
with an indication of dyslexia. PLos One, 7(6). doi: 10.1371/journal.pone.0038081
Castles, A., & Coltheart, M. (2004). Is there a causal link from phonological awareness to success in
learning to read? Cognition, 91(1), 77-111. doi: 10.1016/S0010-0277(03)00164-1
Cohen, L., Dehaene, S., Naccache, L., Lehericy, S., Dehaene-Lambertz, G., Henaff, M. A., & Michel, F.
(2000). The visual word form area - Spatial and temporal characterization of an initial stage of
reading in normal subjects and posterior split-brain patients. Brain, 123, 291-307.
Collis, N. L., Kohnen, S., & Kinoshita, S. (2012). The role of visual spatial attention in adult developmental
dyslexia. The Quarterly Journal of Experimental Psychology, 1-16. doi:
10.1080/17470218.2012.705305
de Jong, P. F., & van der Leij, A. (1999). Specific contributions of phonological abilities to early reading
acquisition: Results from a Dutch latent variable longitudinal study. Journal of Educational
Psychology, 91(3), 450-476. doi: 10.1037/0022-0663.91.3.450
De Pessemier, P., & Andries, C. (2009). GL&SCHR Dyslexie bij +16-jarigen. Test voor Gevorderd Lezen en
Schrijven. Antwerpen, Belgium: Garant.
Dehaene, S., Cohen, L., Sigman, M., & Vinckier, F. (2005). The neural code for written words: a proposal.
Trends in Cognitive Sciences, 9(7), 335-341. doi: 10.1016/j.tics.2005.05.004
Dehaene, S., Pegado, F., Braga, L. W., Ventura, P., Nunes, G., Jobert, A., . . . Cohen, L. (2010). How
Learning to Read Changes the Cortical Networks for Vision and Language. Science, 330(6009),
1359-1364. doi: 10.1126/science.1194140

30
Dekker, R., Dekker, P. H., & Mulder, J. L. (2004). Kaufman Adolescent and Adult Intelligence Test -
Nederlandstalige versie: Handleiding. Leiden, The Nederlands: PITS.
Dixon, P. (2003). The p-value fallacy and how to avoid it. Canadian Journal of Experimental Psychology-
Revue Canadienne De Psychologie Experimentale, 57(3), 189-202. doi: 10.1037/h0087425
Eviatar, Z. (1999). Cross-language tests of hemispheric strategies in reading nonwords. Neuropsychology,
13(4), 498-515. doi: Doi 10.1037//0894-4105.13.4.498
Goolkasian, P., & King, J. (1990). Letter identification and lateral masking in dyslexic and average
readers. American Journal of Psychology, 103(4), 519-538. doi: 10.2307/1423322
Grainger, J., Tydgat, I., & Issele, J. (2010). Crowding Affects Letters and Symbols Differently. Journal of
Experimental Psychology-Human Perception and Performance, 36(3), 673-688. doi:
10.1037/a0016888
Griffiths, Y. M., & Snowling, M. J. (2002). Predictors of exception word and nonword reading in dyslexic
children: The severity hypothesis. Journal of Educational Psychology, 94(1), 34-43. doi:
10.1037//0022-0663.94.1.34
Heim, S., Tschierse, J., Amunts, K., Wilms, M., Vossel, S., Willmes, K., . . . Huber, W. (2008). Cognitive
subtypes of dyslexia. Acta Neurobiologiae Experimentalis, 68(1), 73-82.
Helenius, P., Tarkiainen, A., Cornelissen, P., Hansen, P. C., & Salmelin, R. (1999). Dissociation of normal
feature analysis and deficient processing of letter-strings in dyslexic adults. Cerebral Cortex, 9(5),
476-483. doi: 10.1093/cercor/9.5.476
Hellige, J. B., Cowin, E. L., & Eng, T. L. (1995). Recognition of CVC syllables from LVF, RVF, and central
locations -hemispheric differences and interhemispheric interaction. Journal of Cognitive
Neuroscience, 7(2), 258-266. doi: 10.1162/jocn.1995.7.2.258
Hellige, J. B., Taylor, A. K., & Eng, T. L. (1989). Interhemispheric Interaction When Both Hemispheres
Have Access to the Same Stimulus Information. Journal of Experimental Psychology-Human
Perception and Performance, 15(4), 711-722.
Huckauf, A., Heller, D., & Nazir, T. A. (1999). Lateral masking: Limitations of the feature interaction
account. Perception & Psychophysics, 61(1), 177-189. doi: 10.3758/bf03211958
Huckauf, A., & Nazir, T. A. (2007). How odgcrnwi becomes crowding: Stimulus-specific learning reduces
crowding. Journal of Vision, 7(2). doi: 10.1167/7.2.18
Hunter, Z. R., & Brysbaert, M. (2008). Visual half-field experiments are a good measure of cerebral
language dominance if used properly: Evidence from fMR1. Neuropsychologia, 46(1), 316-325.
doi: 10.1016/j.neuropsychologia.2007.07.007
Klein, R., Berry, G., Briand, K., Dentremont, B., & Farmer, M. (1990). Letter identification declines with
increasing retinal eccentricity at the same rate for normal and dyslexic readers. Perception &
Psychophysics, 47(6), 601-606. doi: 10.3758/bf03203112
Legge, G. E., Mansfield, J. S., & Chung, S. T. L. (2001). Psychophysics of reading XX. Linking letter
recognition to reading speed in central and peripheral vision. Vision Research, 41(6), 725-743.
doi: 10.1016/s0042-6989(00)00295-9
Lobier, M., Zoubrinetzky, R., & Valdois, S. (2012). The visual attention span deficit in dyslexia is visual
and not verbal. Cortex, 48(6), 768-773. doi: 10.1016/j.cortex.2011.09.003
Loftus, G. R. (1978). Interpretation of interactions. Memory & Cognition, 6(3), 312-319. doi:
10.3758/bf03197461
Martelli, M., Di Filippo, G., Spinelli, D., & Zoccolotti, P. (2009). Crowding, reading, and developmental
dyslexia. Journal of Vision, 9(4). doi: 10.1167/9.4.14
Massaro, D. W., & Cohen, M. M. (1994). Visual, orthographic, phonological and lexical influences in
reading. Journal of Experimental Psychology-Human Perception and Performance, 20(6), 1107-
1128. doi: 10.1037/0096-1523.20.6.1107

31
Menghini, D., Finzi, A., Benassi, M., Bolzani, R., Facoetti, A., Giovagnoli, S., . . . Vicari, S. (2010). Different
underlying neurocognitive deficits in developmental dyslexia: A comparative study.
Neuropsychologia, 48(4), 863-872. doi: 10.1016/j.neuropsychologia.2009.11.003
Moores, E., Cassim, R., & Talcott, J. B. (2011). Adults with dyslexia exhibit large effects of crowding,
increased dependence on cues, and detrimental effects of distractors in visual search tasks.
Neuropsychologia, 49(14), 3881-3890. doi: 10.1016/j.neuropsychologia.2011.10.005
Nederland, S. D. (2008). Diagnose dyslexie. Brochure van de Stichting Dyslexie Nederland. Herziene
versie. Bilthoven, The Nederlands: Stichting Dyslexie Nederland.
Pelli, D. G., Tillman, K. A., Freeman, J., Su, M., Berger, T. D., & Majaj, N. J. (2007). Crowding and
eccentricity determine reading rate. Journal of Vision, 7(2). doi: 10.1167/7.2.20
Perea, M., Panadero, V., Moret-Tatay, C., & Gomez, P. (2012). The effects of inter-letter spacing in
visual-word recognition: Evidence with young normal readers and developmental dyslexics.
Learning and Instruction, 22(6), 420-430. doi: DOI 10.1016/j.learninstruc.2012.04.001
Pernet, C., Andersson, J., Paulesu, E., & Demonet, J. F. (2009). When All Hypotheses are Right: A
Multifocal Account of Dyslexia. Human Brain Mapping, 30(7), 2278-2292. doi:
10.1002/hbm.20670
Pernet, C., Valdois, S., Celsis, P., & Demonet, J. F. (2006). Lateral masking, levels of processing and
stimulus category: A comparative study between normal and dyslexic readers.
Neuropsychologia, 44(12), 2374-2385. doi: DOI 10.1016/j.neuropsychologia.2006.05.003
Pitchford, N. J., Ledgeway, T., & Masterson, J. (2009). Reduced orthographic learning in dyslexic adult
readers: Evidence from patterns of letter search. Quarterly Journal of Experimental Psychology,
62(1), 99-113. doi: 10.1080/17470210701823023
Ramus, F., Rosen, S., Dakin, S. C., Day, B. L., Castellote, J. M., White, S., & Frith, U. (2003). Theories of
developmental dyslexia: insights from a multiple case study of dyslexic adults. Brain, 126, 841-
865. doi: 10.1093/brain/awg076
Ramus, F., & Szenkovits, G. (2008). What phonological deficit? Quarterly Journal of Experimental
Psychology, 61(1), 129-141. doi: 10.1080/17470210701508822
Taroyan, N. A., & Nicolson, R. I. (2009). Reading words and pseudowords in dyslexia: ERP and
behavioural tests in English-speaking adolescents. International Journal of Psychophysiology,
74(3), 199-208. doi: 10.1016/j.ijpsycho.2009.09.001
van den Bos, A., Spelberg, H., Scheepsma, A., & de Vries, J. (1999). De Klepel vorm A en B: een test voor
leesvaardigheid van pseudowoorden. Verantwoording, handleiding, diagnostiek en behandeling.
Lisse, The Nederlands: Swets & Zeitlinger.
Vellutino, F. R., Fletcher, J. M., Snowling, M. J., & Scanlon, D. M. (2004). Specific reading disability
(dyslexia): what have we learned in the past four decades? Journal of Child Psychology and
Psychiatry, 45(1), 2-40. doi: 10.1046/j.0021-9630.2003.00305.x
Wagner, R. K., & Torgesen, J. K. (1987). The Nature of Phonological Processing and its Causal Role in the
Awquisition of Reading Skills. Psychological Bulletin, 101(2), 192-212. doi: 10.1037//0033-
2909.101.2.192
Warrington, E. K., & Shallice, T. (1980). Word-form dyslexia. Brain, 103(MAR), 99-112. doi:
10.1093/brain/103.1.99
White, S., Milne, E., Rosen, S., Hansen, P., Swettenham, J., Frith, U., & Ramus, F. (2006). The role of
sensorimotor impairments in dyslexia: a multiple case study of dyslexic children. Developmental
Science, 9(3), 237-255. doi: 10.1111/j.1467-7687.2006.00483.x
Whitney, C. (2001). How the brain encodes the order of letters in a printed word: The SERIOL model and
selective literature review. Psychonomic Bulletin & Review, 8(2), 221-243.
Whitney, C., & Cornelissen, P. (2005). Letter-position encoding and dyslexia. Journal of Research in
reading, 28(3), 274-301.

32
Wilson, A. M., & Lesaux, N. K. (2001). Persistence of phonological processing deficits in college students
with dyslexia who have age-appropriate reading skills. J Learn Disabil, 34(5), 394-400. doi:
10.1177/002221940103400501
Wolff, U., & Lundberg, I. (2003). A technique for group screening of dyslexia among adults. Annals of
Dyslexia, 53, 324-339.
Zorzi, M., Barbiero, C., Facoetti, A., Lonciari, I., Carrozzi, M., Montico, M., . . . Ziegler, J. C. (2012). Extra-
large letter spacing improves reading in dyslexia. Proceedings of the National Academy of
Sciences of the United States of America, 109(28), 11455-11459. doi: DOI
10.1073/pnas.1205566109
33
Appendix
Stimulus list
BCZ / CGV / DPW / GJN / HPS / JXB / LJH / MTJ / PMK / TFZ / BHP / CKT / DSC / GLZ / HRG
KGV / LNS / NFD / PVK / TXB / BHF / CSJ / DTG / GPF / HXS / KJM / LVZ / NGM /PZW / VGB
BJZ / CVP / DWB / ZMG / HXT / KLX / LTB / NHW / RGX / VKM / BSF / CXM / FBX / GSW
HXW / KRN / LWF / NJW / RHD / WJD / BXM / DBX / FXN / GZH / JGN / KVR / MCN / NTJ
RKN / WTK / BZJ / DHM / GCZ / HCR / JMC / LDJ / MGF / NVM / SKX / ZBS / BZK / DLC / GHB
/ HFR / JNB / LDN / MPD / PCJ / SWJ / XBV / CDB / DNW / GHT / HMD / JPX / LHC / MRD /
PDT / TBR / ZVC