FINAL Nitrogen control in wastewater treatment plants v4 · Forms of nitrogen found in wastewater:...
37
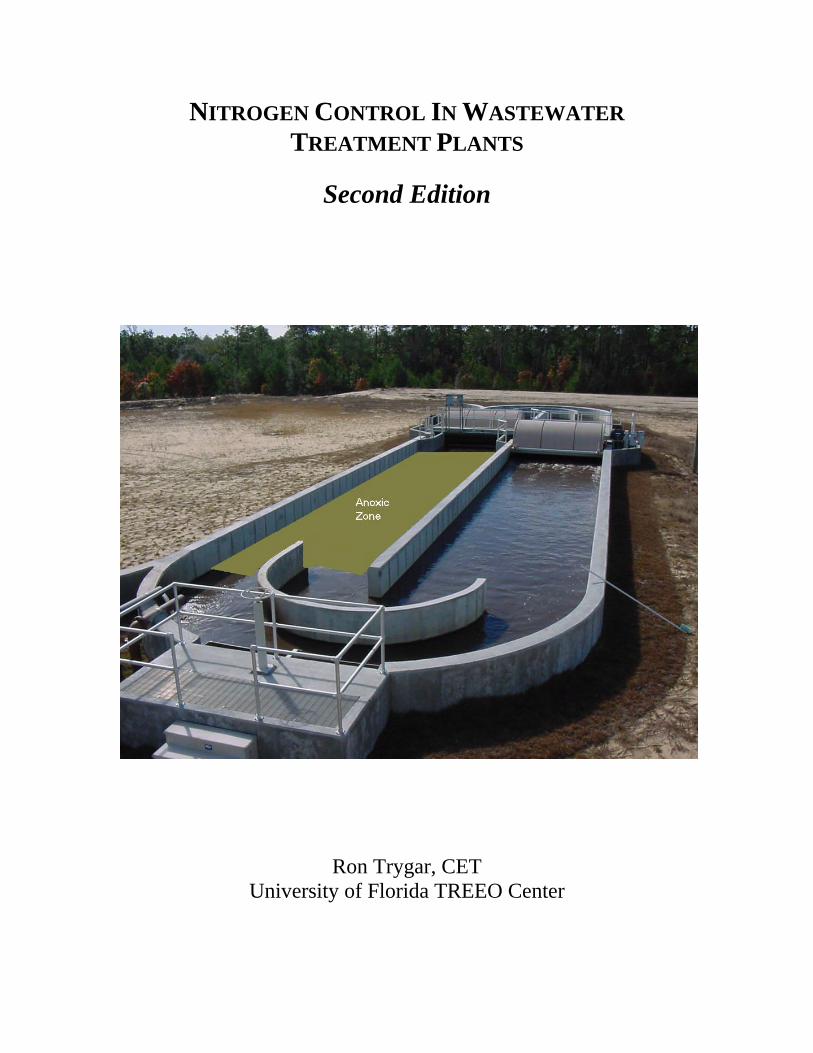
NITROGEN CONTROL IN WASTEWATER TREATMENT PLANTS Second Edition Ron Trygar, CET University of Florida TREEO Center
Transcript of FINAL Nitrogen control in wastewater treatment plants v4 · Forms of nitrogen found in wastewater:...
i
NITROGEN CONTROL IN WASTEWATER TREATMENT PLANTS
Second Edition
Ron Trygar, CET University of Florida TREEO Center
i
NITROGEN CONTROL IN WASTEWATER TREATMENT PLANTS
Second Edition
Copyright © 2009 by Ron Trygar, CET and the University of Florida Center for Training, Research and Education for Environmental Occupations
(TREEO)
All rights reserved. No part of this publication may be reproduced by any means, electronic, mechanical, photocopying, recording or otherwise, without the prior written permission of the copyright owner (s).
ii
Preface to the Second Edition The original edition of this manual was written in November of 2000 as a study guide for wastewater operators preparing for their Florida class C state exam. It seemed at the time that operators needed a little extra reference material about nitrification and denitrification that they did not get from the required coursework for the state exam. The State of Florida Department of Environmental Protection (FDEP) Operator Certification Program asked for assistance in preparing a short technical manual that could be given to exam applicants as supplemental study information. I wrote the first edition of this manual while working for the Florida Rural Water Association as a Wastewater Circuit Rider. Once the manual was completed, many copies were distributed by the FDEP to operators upon receiving their exam applications. Over the years the exams have changed, the required coursework has been revised and the need to send operators a nitrogen control supplement manual has ebbed. I realized that the first edition was still being used by operators for studying, but moreover to help them in operation of their wastewater treatment facilities. Since state and federal regulations have become more stringent, the need for updated information written for operators about this subject became apparent. Technology has progressed, methods of monitoring have improved and specific plant operational information has become available. The first edition did not appear to adequately cover all the recent changes. It is my hope that operators of wastewater treatment plants will find this information useful in their quest to remove nitrogen from the waste stream, meet regulatory limits and continue to enhance the environment. Ron Trygar, CET March, 2009
iii
Acknowledgements I wish to thank the Florida Department of Environmental Protection Operator Certification Program and the Florida Rural Water Association for the opportunity to write the first edition, and the University of Florida TREEO Center for its assistance with this second edition. I also wish to personally thank the following people for their review and edits of the technical information contained within:
• Dr. Bill Engel, PhD, CET, Director, UF TREEO Center • Mr. Edward M. Toby III, CET • Mr. Michael Cherniak, CET, Senior VP, Woodard Curran • Mr. James Clifton, Superintendent, Simsbury, Connecticut
iv
About the Author Ron Trygar is the Senior Training Specialist for Water and Wastewater programs at the University of Florida TREEO Center, and is responsible for most all water and wastewater related training. Ron instructs courses related to energy conservation at treatment facilities, activated sludge process control and troubleshooting, biological nutrient removal, microscopy, and a variety of exam review courses that help operators prepare for the state exams. Ron teaches sections of the Water Facility Security and Water Distribution System courses, and also is the instructor of the UF Dept. of Continuing Education correspondence and on-line Class C Drinking Water Operator course. Ron has worked in the water and wastewater treatment industry for more than twenty five years in a variety of locations and jobs. He also worked for several years as Training and Education Coordinator in the US Virgin Islands for a contract O&M company based on St. Thomas and St. John. While there, he helped many operators become licensed through the Association of Boards of Certification (ABC) certification program. Ron returned to Florida in 2004 and started Trygar Consulting Services, a corporation aimed at training and troubleshooting for water and wastewater system operators before he joined TREEO full-time in 2008. Ron has been a Certified Environmental Trainer (CET) since 1998 and has provided training for associations and regulatory agencies such as the FDEP, at FW&PCOA Short Schools, the USABlueBook Company, FWEA training events and at local school environmental programs. Along with the FDEP Northeast District in Jacksonville, Ron helped begin the FRWA/FDEP joint wastewater operator certification review classes that are still given around the state today. Ron holds a Florida class A wastewater license and a Florida class B drinking water operator’s license. He has experience in many types of treatment processes such as trickling filters, RBC’s SBR’s, oxygen activated sludge; from small package plant operation to advanced waste treatment including nitrogen and phosphorus removal. The majority of his experience has been in Florida, but Ron began his wastewater treatment career in Virginia Beach, Virginia and his home state of New Jersey. Ron is a member of the FDEP Operator Certification Program Exam Review Committee, a member of WEF, FWEA and FW&PCOA, and on the CET Board of Certification for NESHTA.
v
Table of Contents Section One: Introduction Page What is Nitrogen? 8 Why do we Remove Nitrogen from Wastewater? 8 Forms of Nitrogen in Wastewater 9 Section Two: Nitrogen Conversion Ammonification 10 Nitrification 11 Summary of Conditions Required for Nitrification 13 Denitrification 14 Nitrification/Denitrification Process Description 15 Ammonification, Summary 15 Nitrification, an Oxidative Process 16 Denitrification, a Reduction Process 16 Section Three: Common Problems That Nitrogen Can Cause Rising Sludge 18 Ashing 19 Foam/scum 20 Nitrite Lock 21 Section Four: Methods of Converting Nitrogen The Wurhmann Process 22 The Modified Ludzack-Ettinger Process 23 The Four Stage Bardenpho Process 24
vi
Table of Contents, continued Section Five: Measuring and Monitoring Nitrogen Sludge Settleability 25 Nitrogen Series Testing 26 Dissolved Oxygen (DO) 27 Oxidation Reduction Potential (ORP) 28 Alkalinity, as Calcium Carbonate (CaCO3) 32 Section Six: A Few Suggestions on Overall Plant Operation Plants with Aerobic Digestion 34 Plants with Anaerobic Digestion 34
vii
References The following resources were used in producing this manual:
EPA: Package Treatment Plants MO-12, EPA 430/9-77-005, April 1977 EPA: Summary Report: The Causes and Control of Activated Sludge Bulking and Foaming, EPA 625/8-87/012, July 1987 EPA: Manual: Nitrogen Control, EPA 625/R-93/010, September 1993 EPA: Handbook: Retrofitting POTWs, EPA 625/6-89/020, July 1989 EPA: Nitrification and Denitrification Facilities/Wastewater Treatment, EPA 625/4-73-004a, August 1973 EPA: Aerobic Biological Wastewater Treatment Facilities, EPA 430-9-77-006, March 1977 Bitton, Gabriel; Wastewater Microbiology, 1994 University of Florida, TREEO Center, Troubleshooting Activated Sludge Problems in Wastewater Treatment, June 1997 University of Florida, TREEO Center, How to Improve Wastewater Package Plant Operations, 1996 University of Florida, TREEO Center, Troubleshooting and Optimizing Wastewater Treatment Systems for Small Communities, Nutrient Removal Diagger, G., CH2M Hill. Paper: Nutrient Addition and Nutrient Removal in Biological Systems, presented at WEFTEC, Anaheim, CA, October 2000 Muirhead, W., Appleton, R. Keys to Better Nitrification, WE&T 12/2007 Barnard, J., Black & Veatch, Paper: Biological Nutrient Removal: Where We Have Been, Where We Are Going?, 2007 Water Environment Federation Press, MOP 29, Biological Nutrient Removal Operation
in Wastewater Treatment Plants, 2005 Jenkins, D; Richards, M; Daigger, G. Manual on the Causes and Control of Activated Sludge Bulking, Foaming and Other Solids Separation Problems, 3rd Edition, (2004) CRC Press Dabkowski, R. Applying Oxidation Reduction Potential Sensors in Biological Nutrient Removal Systems, Hach Company, 2007
viii
List of Illustrations Figure 1 Cover photo; oxidation ditch wwtp 7 Figure 2 Algae growing in a small creek 8 Figure 3 Relationship between ammonia and ammonium at various pH levels 10 Figure 4 Mechanical aeration unit 12 Figure 5 Electric timer for aeration blower control 15 Figure 6 Sludge pop-ups in a small plant clarifier 17 Figure 7 Rising sludge pop-ups on small plant clarifier 18 Figure 8 Ashing on clarifier surface 19 Figure 9 Light scum on clarifier surface 20 Figure 10 Wuhrmann process 22 Figure 11 Modified Ludzack-Ettinger process 23 Figure 12 Four stage Bardenpho process 24 Figure 13 Settleometer with mixed liquor that has risen 25 Figure 14 Colorimeter showing influent ammonia nitrogen result 26 Figure 15 Dissolved oxygen meter 27 Figure 16 ORP meter and DO meter 29 Figure 17 ORP table 30 Figure 18 ORP meter and DO meter 31 Figure 19 Alkalinity testing in a lab 33
7
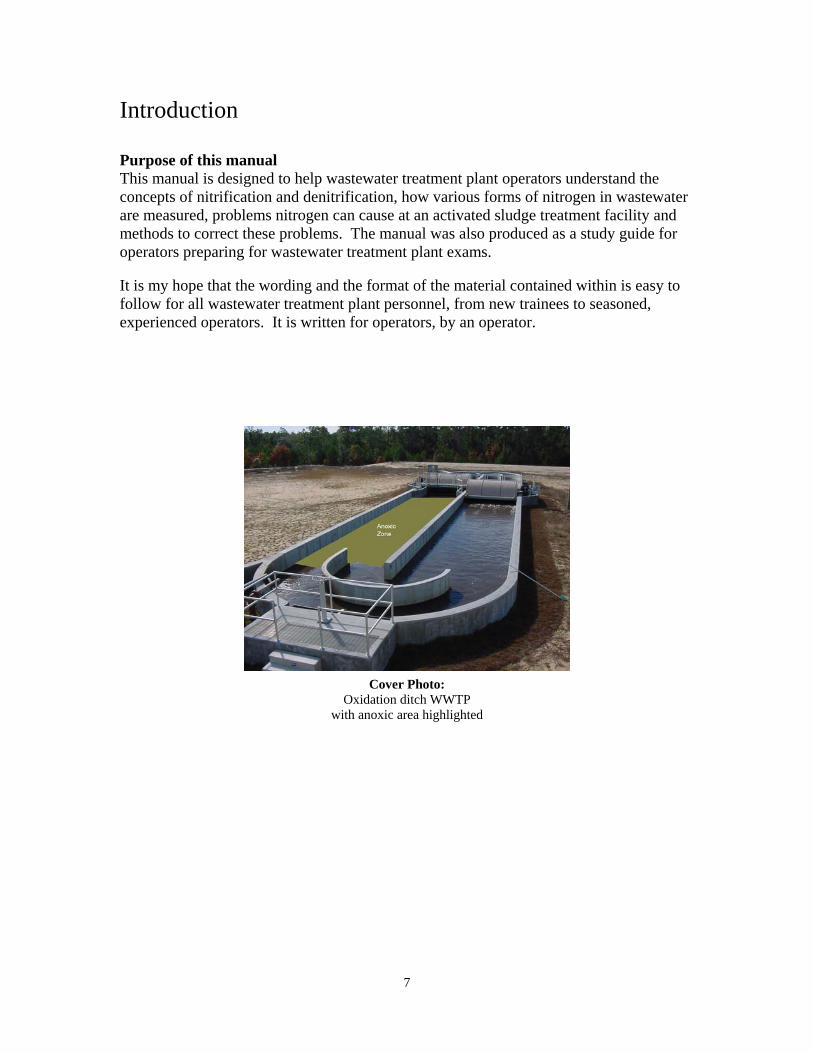
Introduction Purpose of this manual This manual is designed to help wastewater treatment plant operators understand the concepts of nitrification and denitrification, how various forms of nitrogen in wastewater are measured, problems nitrogen can cause at an activated sludge treatment facility and methods to correct these problems. The manual was also produced as a study guide for operators preparing for wastewater treatment plant exams. It is my hope that the wording and the format of the material contained within is easy to follow for all wastewater treatment plant personnel, from new trainees to seasoned, experienced operators. It is written for operators, by an operator.
Cover Photo:
Oxidation ditch WWTP with anoxic area highlighted
8
What exactly is nitrogen? • Nitrogen is an element, and listed on the periodic table of elements at period 2 as a
gas • Nitrogen was discovered in 1772 by Daniel Rutherford in Scotland • An atom of nitrogen has 7 electrons, 7 protons and 7 neutrons • A molecule of nitrogen (N2) is made up of two atoms of nitrogen • An atom of nitrogen has an atomic weight of 14.0067 • The molecular weight of N2 is 28.0134 • Nitrogen gas makes up about 78% of the air we breathe • Nitrogen gas is not toxic, however… • Nitrogen compounds such as ammonia gas (NH3) are toxic in high concentration,
and… • Nitrogen containing compounds like cyanide (CN-) are lethal in very small amounts • When dissolved nitrogen gas comes out of a solution, such as human blood, the
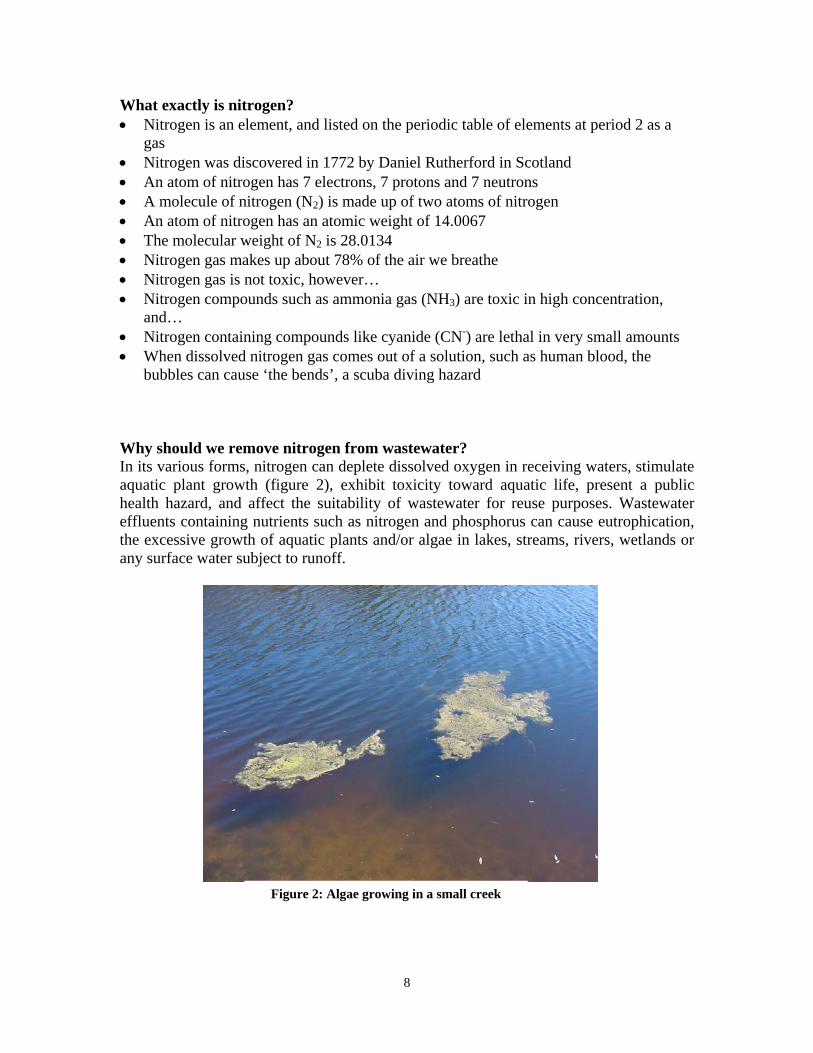
bubbles can cause ‘the bends’, a scuba diving hazard Why should we remove nitrogen from wastewater? In its various forms, nitrogen can deplete dissolved oxygen in receiving waters, stimulate aquatic plant growth (figure 2), exhibit toxicity toward aquatic life, present a public health hazard, and affect the suitability of wastewater for reuse purposes. Wastewater effluents containing nutrients such as nitrogen and phosphorus can cause eutrophication, the excessive growth of aquatic plants and/or algae in lakes, streams, rivers, wetlands or any surface water subject to runoff.
Figure 2: Algae growing in a small creek
9
Forms of nitrogen found in wastewater: • Nitrogenous gasses (N2O, N2) • Organic nitrogen (urea, amino acids, fecal material) • Ammonia (NH3 as a dissolved gas) • Ammonium (NH4
+ ions in solution) • Nitrate (NO3
-) and nitrite (NO2-) ions in solution
• Total Kjeldahl Nitrogen (TKN) is the sum of the ammonia and organic nitrogen • Total Nitrogen (TN) is the sum of TKN and nitrate and nitrite Nitrate (NO3
-) is a primary contaminant in drinking water and can cause a human health condition called methemoglobinemia (blue baby syndrome). This is due to the conversion of nitrate to nitrite (NO2
-) by nitrate reducing bacteria in the human gastrointestinal tract. Oxygen bound in the nitrite can oxidize the iron in hemoglobin to form methemoglobin. Since methemoglobin is incapable of binding molecular oxygen, the result is a bluish coloration of the skin and suffocation or death may occur if left untreated. As part of the Safe Drinking Water Act (SDWA), EPA has set the maximum contaminant level (MCL) for nitrate in drinking water at 10 mg/L. Typical effluent permit limits for nitrogen compounds in wastewater effluent vary, but most all are based on the location of final effluent discharge. A wastewater plant that discharges to a spray field may not have a limit on nitrogen while a plant that discharges to rapid infiltration basins (percolation ponds) may have an effluent nitrate limit of 12 mg/L. A treatment plant discharging to a nearby stream, river or wetland may have a total nitrogen limit of 3 mg/L, or an unionized ammonia (NH3) limit of 0.2 mg/L. In order to meet these limits, we must operate treatment plants to not only remove carbonaceous biochemical oxygen demand (CBOD) and total suspended solids (TSS), but to convert nitrogen compounds to less noxious forms. This requires operators to use processes that they may not be entirely familiar with. Many new package wastewater treatment plants are built with anoxic tanks, which require different process control methods than a basic extended aeration treatment plant. If a wastewater treatment plant does not have an anoxic tank, cycling the aeration blowers on and off may be needed to create an anoxic zone or time to allow for denitrification in the aeration tank. These concepts will be discussed further in the following sections. A side benefit of cycling the blowers is a reduction of electricity consumption, thus saving some money on the electric bill.
10
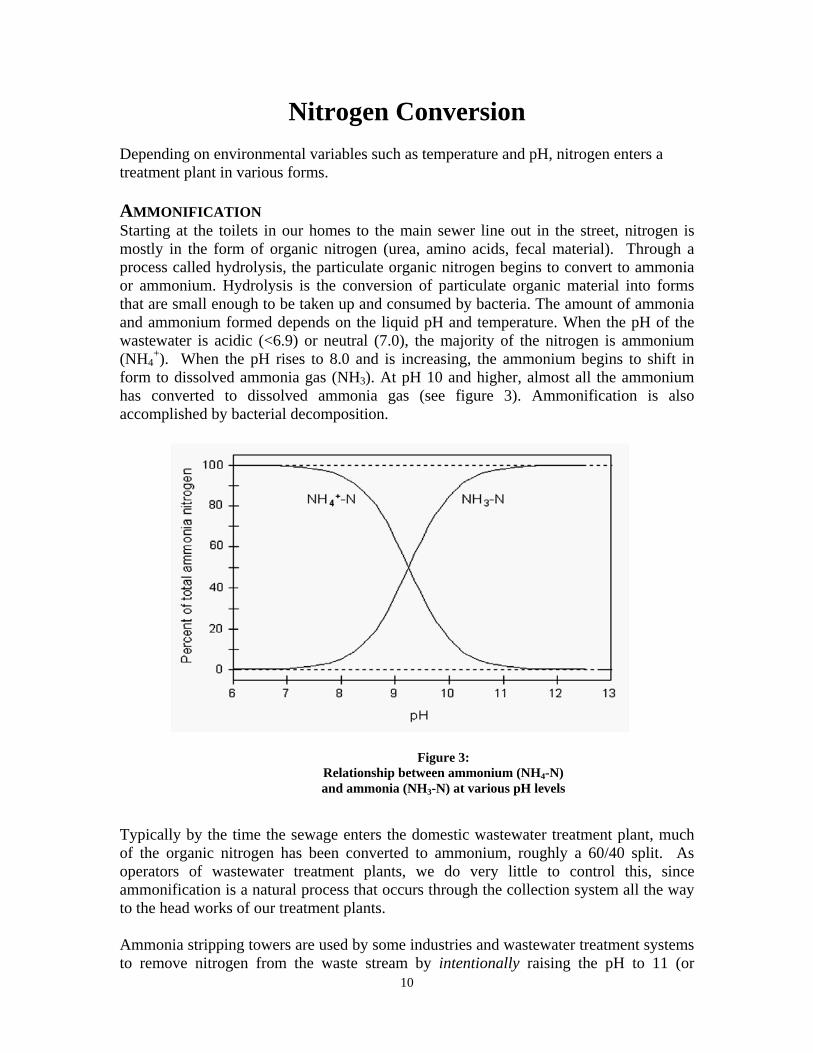
Nitrogen Conversion Depending on environmental variables such as temperature and pH, nitrogen enters a treatment plant in various forms. AMMONIFICATION Starting at the toilets in our homes to the main sewer line out in the street, nitrogen is mostly in the form of organic nitrogen (urea, amino acids, fecal material). Through a process called hydrolysis, the particulate organic nitrogen begins to convert to ammonia or ammonium. Hydrolysis is the conversion of particulate organic material into forms that are small enough to be taken up and consumed by bacteria. The amount of ammonia and ammonium formed depends on the liquid pH and temperature. When the pH of the wastewater is acidic (<6.9) or neutral (7.0), the majority of the nitrogen is ammonium (NH4
+). When the pH rises to 8.0 and is increasing, the ammonium begins to shift in form to dissolved ammonia gas (NH3). At pH 10 and higher, almost all the ammonium has converted to dissolved ammonia gas (see figure 3). Ammonification is also accomplished by bacterial decomposition.
Typically by the time the sewage enters the domestic wastewater treatment plant, much of the organic nitrogen has been converted to ammonium, roughly a 60/40 split. As operators of wastewater treatment plants, we do very little to control this, since ammonification is a natural process that occurs through the collection system all the way to the head works of our treatment plants. Ammonia stripping towers are used by some industries and wastewater treatment systems to remove nitrogen from the waste stream by intentionally raising the pH to 11 (or
Figure 3: Relationship between ammonium (NH4-N) and ammonia (NH3-N) at various pH levels
11
higher) with calcium oxide (lime), pumping the wastewater/lime solution into a tower packed with plastic or wood media and allowing the ammonia gas to be released from the solution as the treated wastewater splashes over the media and flows downward through the tower. This type of physical/chemical method of nitrogen removal is not common in domestic wastewater treatment plants, but may be found at industrial waste treatment plants. NITRIFICATION Nitrification is the biological conversion of the ammonium to nitrate nitrogen, and is a two-step process. In the first step, aerobic bacteria known as Nitrosomonas convert ammonium to nitrite. Another group of aerobic bacteria called Nitrobacter finish the conversion of nitrite to nitrate. The reactions are generally coupled and proceed rapidly to the nitrate form; therefore nitrite levels at any given time are usually low. These bacteria known as ‘nitrifiers’ are strict aerobes, which means they must have free dissolved oxygen (O2) to perform their work, and are active only under aerobic conditions. Complete nitrification requires approximately 4.6 pounds of oxygen for every pound of ammonium converted to nitrate. In comparison, CBOD can be consumed with only about 1.5 pounds of oxygen. The growth rate of nitrifiers is affected by the concentration of dissolved oxygen (DO), and at DO less than 0.5 mg/L the growth rate is minimal. Typical operational guidelines call for a minimum DO concentration of 1.0 mg/L at peak flow and an average daily DO concentration of 2.0 mg/L. For nitrification to proceed the oxygen should be well distributed throughout the aeration tank and its level should not be below 1.0 mg/L. Similar to humans, activated sludge organisms need nutrients to survive and reproduce. Nitrifying bacteria are no different, and need calcium in their diet. Luckily, there is usually enough calcium in the raw wastewater in the form of calcium carbonate (CaCO3) to allow nitrifiers to survive nicely. Later in this manual, we will discuss the consequences of insufficient calcium (alkalinity) in the wastewater. As the nitrifiers use the ammonium as an energy source, they consume the calcium carbonate as a carbon source. The process of nitrification produces acids. This acid formation, along with the calcium carbonate reduction, can lower the pH of the MLSS and cause a decline in the growth rate of nitrifying bacteria. The optimum pH for Nitrosomonas and Nitrobacter organisms is between 7.5 and 8.5 and nitrification stops at pH levels at or below 6.0. Approximately 7.14 pounds of alkalinity (as CaCO3) are consumed per pound of ammonia oxidized to nitrate. Water temperature also affects the rate of nitrification. Nitrification reaches a maximum rate at liquid temperatures between 30 and 35 degrees C (86oF and 95oF). At temperatures of 40oC (104oF) and higher, nitrification rates fall to near zero. Conversely, cold water temperatures can also affect the rate of nitrification. As water temperature decreases, the nitrifiers slow down. Many wastewater treatment plants increase the
12
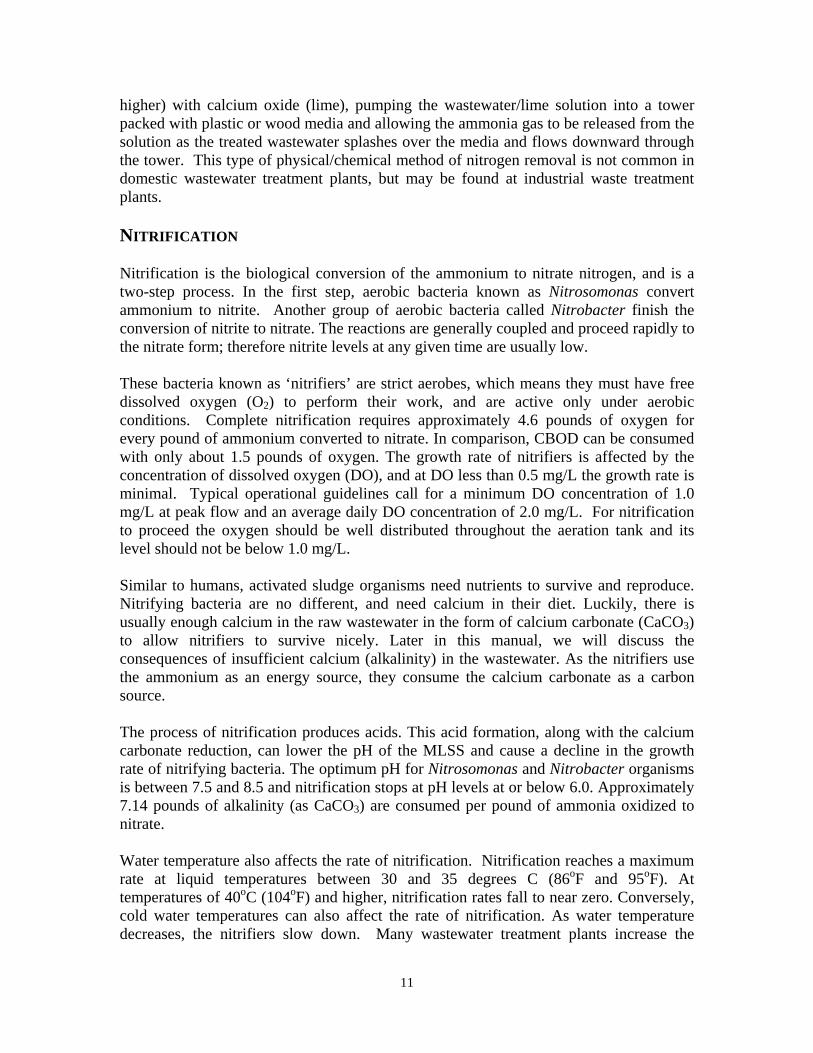
MLVSS amounts during the winter months to increase the amount of aerobic autotrophic bacteria available to perform nitrification efficiently. Nitrifying bacteria are sensitive organisms, and react quickly to environmental changes. Rapid changes in liquid temperature can shock nitrifiers and other organisms we rely upon to treat our wastewater. As seasons change, cold fronts can bring swift changes in air temperatures. Water temperatures change fast as well, and treatment plants with mechanical aeration equipment where the MLSS is thrown into the air (figure 4) can see temperature decreases much faster than facilities with submerged, compressed air diffusers. We can see the effects of a MLSS temperature drop of one degree or more per day as cloudiness in secondary clarifiers, and an increase in effluent ammonium levels.
Sludge Age and Mixed Liquor amounts are also integral components in the nitrification process. When performing sludge age calculations (MCRT or SRT) to determine the detention time required for nitrification, the capacity of the oxic (aerated) portion of the plant should be used. Since anoxic or fermentation basins are not aerated and nitrifying organisms are strict aerobes, the capacity of these basins should not be included in calculations for oxic SRT. Extended aeration (package type) wastewater plants are more capable of nitrification than contact-stabilization and some other activated sludge modifications due to the high sludge age and long periods of aeration. Toxicity and sources of inhibition to microorganisms present problems to operators and nitrifying organisms. Some of the most toxic compounds to nitrifiers include cyanide, thiourea, phenol and heavy metals such as silver, mercury, nickel, chromium, copper and zinc. Some of these compounds can enter a wastewater treatment plant from landfill leachate and septage. Nitrifying bacteria can also be inhibited by high concentrations of free forms of their own substrate. Nitrite oxidizing bacteria are sensitive to free nitrous acid, and ammonium oxidizing bacteria are sensitive to free ammonia (NH3). Increased levels of free ammonia can decrease nitrifier growth rates. Some treatment plants that may have increased influent organic nitrogen and ammonia levels include plants that serve highway rest areas and wastewater plants serving schools.
Figure 4: Mechanical aeration unit
13
Summary of conditions required for effective nitrification Oxic SRT, days: There must be enough time in the aeration tanks to
complete nitrification. Typically SRT higher than 10 days will allow for nitrification.
MLSS, mg/L: Since nitrifying bacteria make up a small percentage (about
5%) of the total organisms in the MLSS, there must be enough MLSS to allow nitrification. Most extended aeration facilities have no problem providing sufficient MLSS.
Alkalinity, mg/L as CaCO3: There needs to be enough alkalinity to allow nitrifiers to
complete their work. Influent alkalinity should be 200 – 250 mg/L, and aeration tank effluent should have at least 50 mg/L as CaCO3 remaining.
Influent Ammonia, mg/L: Ammonia present as a dissolved gas can
inhibit nitrifying bacteria if present in high levels. Ammonia concentrations of 60 mg/L as NH3 and higher can harm these sensitive bacteria.
Toxic or inhibitory compounds: Cyanide, heavy metals and other organic
and inorganic chemicals can inhibit nitrification. Be careful when using chlorine for filament control!
Dissolved Oxygen, mg/L: DO should be in the range of 1.0-2.0 mg/L Oxidation Reduction Potential, mV: ORP should be +100 mV or higher pH., su: Optimum pH for nitrifiers is 7.5 to 9.0,
nitrification can stop at pH less than 6.0
14
DENITRIFICATION Denitrification is an anaerobic respiration process in which nitrate serves as the electron acceptor. In simpler terms, denitrification occurs when free dissolved oxygen levels are depleted and nitrate becomes the primary bound oxygen source for facultative heterotrophic microorganisms. Heterotrophic organisms can obtain their carbon and energy from the same source – by biodegrading influent wastewater containing carbon. We measure the influent carbon by sampling for and running a carbonaceous biochemical oxygen demand (CBOD) test. When bacteria break apart nitrate (NO3
-) to gain the oxygen (O2), the nitrate is reduced to nitrite (NO2
-) then quickly to nitrous oxide (N2O), and finally nitrogen gas (N2) as the oxygen is stripped away by the microorganisms. Since nitrogen gas has low water solubility, it tends to escape as gas bubbles once the surrounding liquid is saturated with nitrogen. These gas bubbles can become bound in the settled sludge floc in clarifiers and cause the sludge to rise to the surface. Conditions Required for Effective Denitrification Conditions that affect the efficiency of denitrification include nitrate concentration, anoxic conditions, presence of organic matter, pH, temperature, alkalinity and the effects of trace metals. Since denitrifying bacteria are facultative organisms, they can use either dissolved oxygen or nitrate or sulfate as an oxygen source for metabolism and oxidation of organic matter. If dissolved oxygen and nitrate are present, facultative bacteria prefer to use the dissolved oxygen. This will occur since dissolved oxygen is readily available and yields more energy to the organisms. Therefore it is imperative to keep dissolved oxygen levels as close to zero as possible in anoxic basins or timed anoxic cycles. Excessive dissolved oxygen in basins designed as anoxic is possible through aerated return sludge (air lift type RAS), excessive splashing of liquid streams into anoxic basins, and air diffusion being used for tank mixing instead of using mixing pumps or mixing devices. Another important aspect of denitrification is the presence of organic matter to drive the denitrification reaction. Organic matter may be in the form of raw wastewater, food-processing wastes, or chemical sources such as methanol, ethanol, acetic or citric acid. When these sources are not present, bacteria may depend on internal (endogenous) carbon reserves as the source of organic matter. This material is released during the death phase of organisms, and may not be a consistent enough source of carbon to drive denitrification to completion. Whatever organic source is used to drive the denitrification reaction, it should be fed consistently and at a rate to keep denitrification levels maximized. Conversely, it is important to avoid raising effluent CBOD values and avoid spending excessive money on organic sources such as methanol. An advantage of denitrification is the production of alkalinity and an increase of pH. Approximately 3.0 to 3.6 mg of alkalinity (as CaCO3) is produced per milligram of nitrate reduced to nitrogen gas. Optimum pH values for denitrification are 7.0 to 8.5.
15
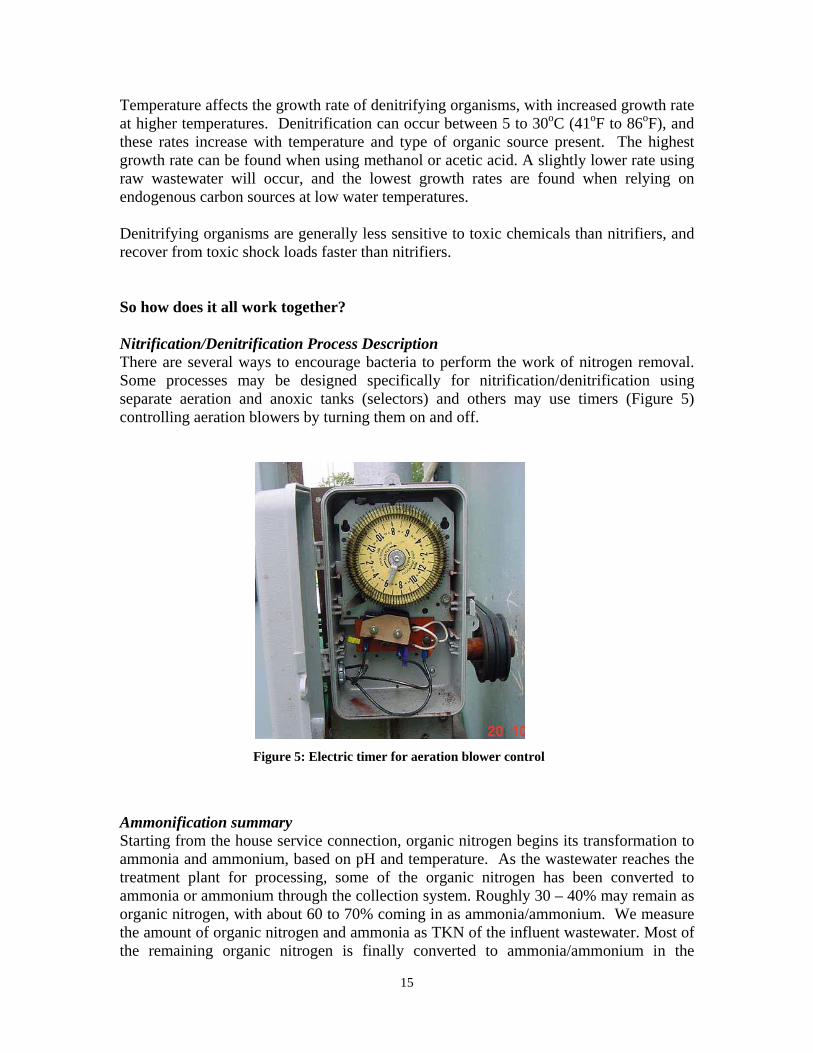
Temperature affects the growth rate of denitrifying organisms, with increased growth rate at higher temperatures. Denitrification can occur between 5 to 30oC (41oF to 86oF), and these rates increase with temperature and type of organic source present. The highest growth rate can be found when using methanol or acetic acid. A slightly lower rate using raw wastewater will occur, and the lowest growth rates are found when relying on endogenous carbon sources at low water temperatures. Denitrifying organisms are generally less sensitive to toxic chemicals than nitrifiers, and recover from toxic shock loads faster than nitrifiers. So how does it all work together? Nitrification/Denitrification Process Description There are several ways to encourage bacteria to perform the work of nitrogen removal. Some processes may be designed specifically for nitrification/denitrification using separate aeration and anoxic tanks (selectors) and others may use timers (Figure 5) controlling aeration blowers by turning them on and off.
Ammonification summary Starting from the house service connection, organic nitrogen begins its transformation to ammonia and ammonium, based on pH and temperature. As the wastewater reaches the treatment plant for processing, some of the organic nitrogen has been converted to ammonia or ammonium through the collection system. Roughly 30 – 40% may remain as organic nitrogen, with about 60 to 70% coming in as ammonia/ammonium. We measure the amount of organic nitrogen and ammonia as TKN of the influent wastewater. Most of the remaining organic nitrogen is finally converted to ammonia/ammonium in the
Figure 5: Electric timer for aeration blower control
16
treatment plant, but a very small amount of organic nitrogen may make it all the way through the processes and give us some problems in the chlorine contact tank, which we will learn more about later. Nitrification, an oxidation process Once the ammonium reaches the aeration tank, the aerobic autotrophic bacteria (nitrifiers) get to work. As long as there is enough DO left over after CBOD removal by aerobic and facultative bacteria, the nitrifiers will consume calcium carbonate while oxidizing the ammonium as an energy source. Nitrosomonas bacteria take the lead by converting the ammonium (NH4
+) to nitrite (NO2-), then the Nitrobacter step in to finish
off the conversion of nitrite to a final fully oxidized form called nitrate (NO3-). While the
calcium carbonate is being consumed, nitrous acid is being formed and the total alkalinity of the liquid begins to decline. By the time the wastewater has reached the end of the aeration tank system,
• The CBOD has been oxidized to low levels by aerobic and facultative bacteria as a carbon food source
• The incoming ammonia/ammonium has been oxidized to nitrite, then to nitrate • Ammonia (NH3) and ammonium (NH4
+) levels have decreased, nitrate (NO3-)
levels have increased • Dissolved oxygen demand has decreased, residual DO has increased • Total alkalinity (as calcium carbonate) has decreased • pH may have decreased • A total of 6.1 pounds of oxygen has been consumed by aerobic and facultative
bacteria to oxidize CBOD and ammonia • Significant bacterial floc has been formed, trapping suspended and colloidal
solids, including particulate organic nitrogen Denitrification, a reduction process Here’s where the process gets a little tricky. After the aeration tank, the MLSS normally enters a secondary clarifier for settling and separation of the solids from the treated water. If there is a carbon source available for bacteria to consume, little or no dissolved oxygen and nitrate is present, denitrification can take place. In the settled activated sludge that becomes the sludge blanket in the clarifier, the free available dissolved oxygen is rapidly used up by aerobic and facultative bacteria. Once free DO is gone, nitrification basically stops. If there is sufficient carbon present in the form of CBOD or carbon from within the bacteria itself, facultative organisms will continue to thrive. Since there is little to no free DO present, they use a different internal enzyme to allow the use of a combined oxygen source instead of free oxygen. The most readily available and easily reduced oxygen is found within the nitrate compound, NO3
-.
17
Facultative bacteria are able to consume carbon in a oxygen depleted environment, using nitrate as an alternative oxygen supply. A bacterium reduces the nitrate molecule by taking one oxygen atom off the nitrate (NO3
-), reducing it to nitrite (NO2-). Another
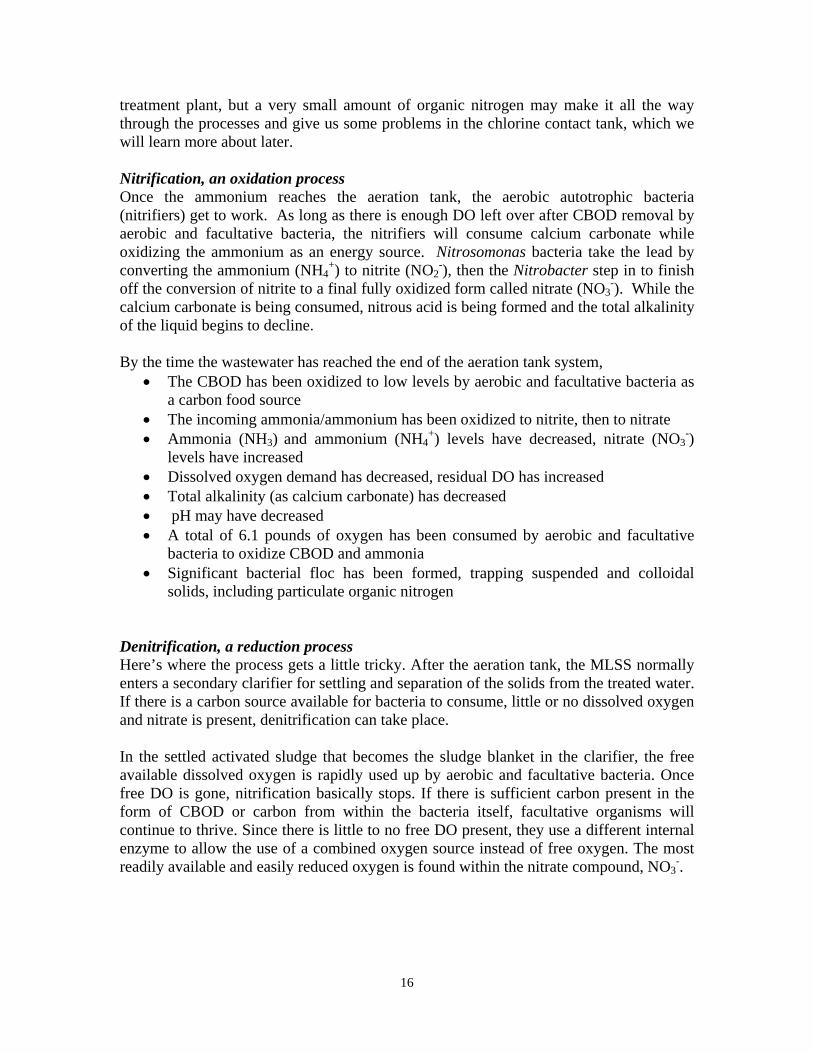
bacterium takes one more oxygen atom from the nitrite, reducing it to nitrous oxide (N2O). Finally, another bacterium takes the last oxygen reducing it to nitrogen gas (N2). Where does the nitrogen gas go? Some of it dissolves into the liquid solution, however once the water is saturated with nitrogen gas, no more nitrogen can be dissolved in the water. Microscopic bubbles of nitrogen form, becoming larger bubbles as they bump into each other. Some of the bubbles rise directly to the tank surface, some of the bubbles remain trapped in the MLSS floc they formed inside of. Once enough of these bubbles accumulate inside the floc particle, the bubbles make the floc particle positively buoyant causing the particle to rise to the surface. Some of the floc may be neutrally buoyant, where it remains suspended mid-water, neither rising nor settling. If enough of these nitrogen bubbles accumulate inside a dense floc particle, or inside a clump of sludge, the whole clump of sludge may rise to the surface. This is commonly referred to as sludge ‘pop-ups’ or clumping. It has been noted that nitrification and denitrification can take place simultaneously within an aeration tank (Hope, GRU, 1999). Since the outer layer of bacteria making up a floc particle are exposed directly to oxygen from aeration, this layer stays mostly aerobic. Oxygen may not penetrate deep within the floc particle, causing this area to become oxygen deficient or anoxic.
Figure 6: sludge pop-ups in a small plant clarifier
18
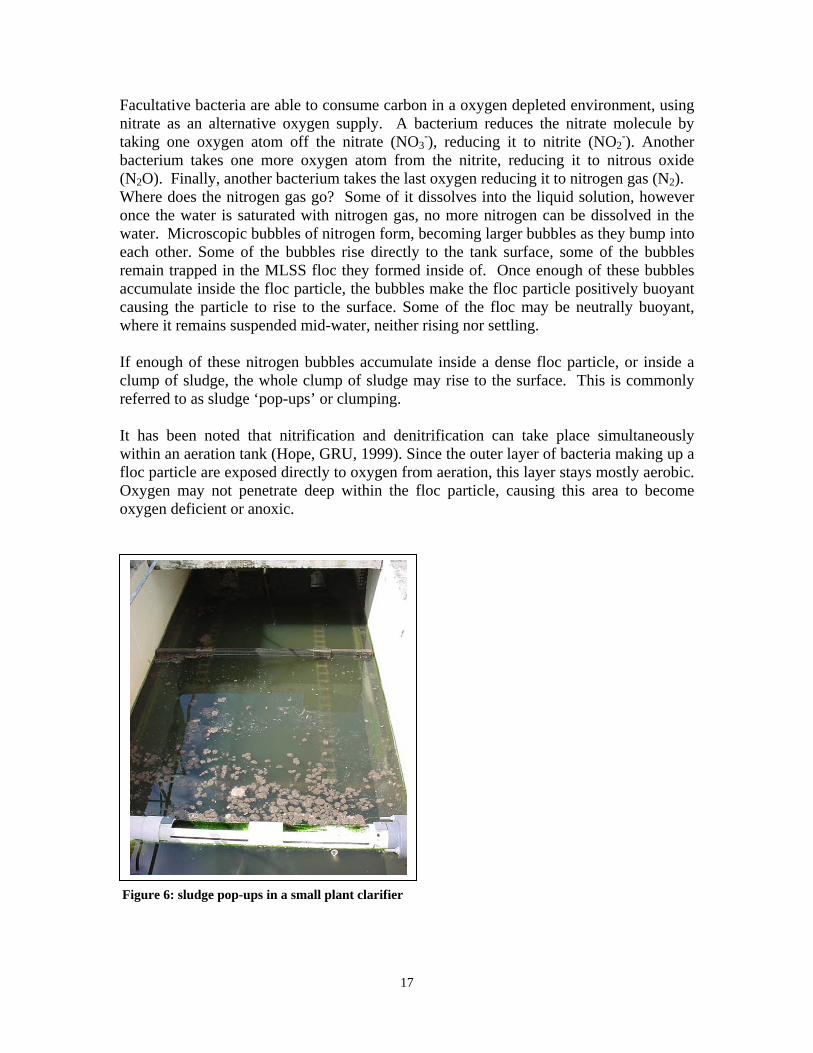
Common Problems That Nitrogen Can Cause Rising sludge Rising sludge (‘pop-ups’) are particles or chunks of sludge floating to the surface of the clarifier. The sludge can be carried over the effluent weir, which results in elevated effluent TSS levels. The sludge is carried to the surface by bubbles of gas formed in the sludge blanket at the bottom of the clarifier or from sludge hung up on the walls of the clarifier. The gas may be either nitrogen or hydrogen sulfide gas (H2S) formed from the biological decomposition of the sludge. Some differences of the gas can be used to determine if the sludge is denitrifying or going septic at the bottom of the tank. Pop-ups caused by nitrogen are usually light brown to brown in color, and have no odor when broken up by a hose or cleaning brush. When pop-ups are caused by septic conditions, a classic “rotten egg” odor is noticeable when the sludge is hosed down or otherwise broken up, due to release of the hydrogen sulfide gas. The pop-ups are usually dark brown to black in color.
Figure 7: Rising sludge ‘pop-ups’ on small plant clarifier
Denitrification in the clarifier is the most probable cause of the rising sludge in the example shown in Figure 7. To remedy this situation, an increase in sludge wasting rates by no more than 10% per day, will help reduce or eliminate the degree of nitrification. Waste sludge rates should be maintained to keep the process within proper MCRT and F/M ratios. Maintaining a minimum DO at peak flow (1.0 mg/L) while ensuring that proper mixing is still being provided may also help. Adjust RAS rates to maintain a sludge blanket depth of 1 to 3 feet (or 25% of depth) in clarifier. Brushing or otherwise pushing settled solids in the clarifier to RAS hoppers on a regular basis will help reduce rising sludge due to denitrification or septicity occurring in clarifier.
19
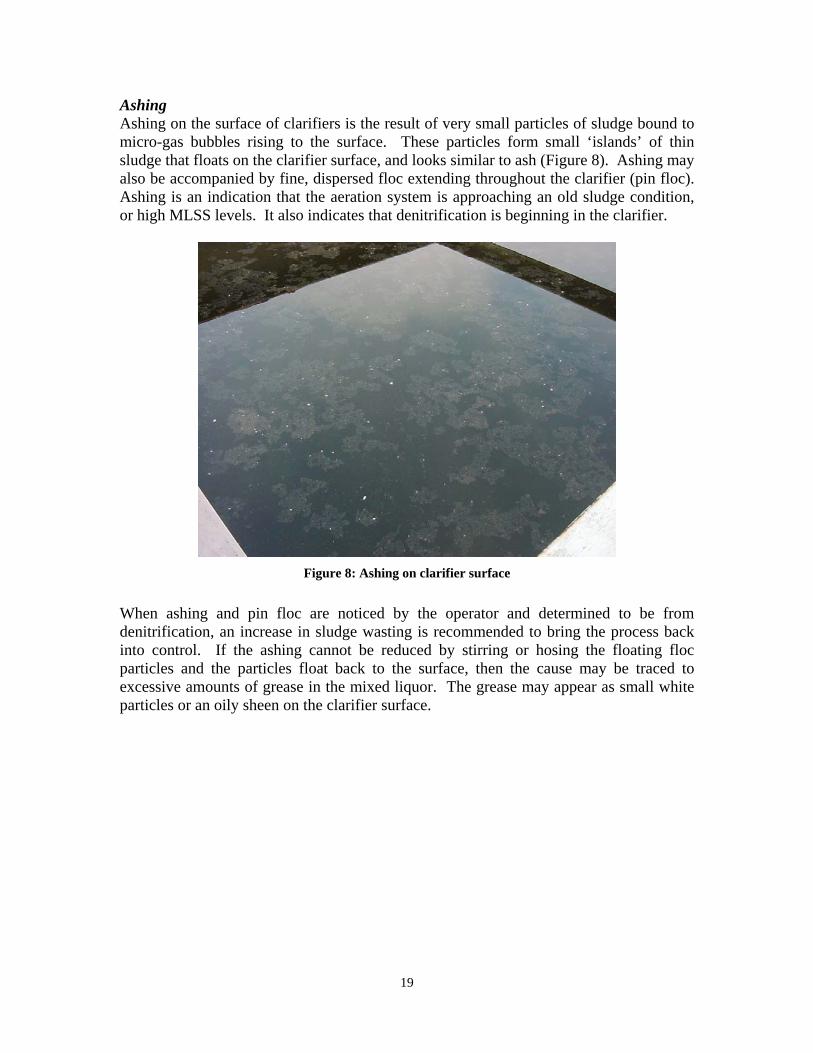
Ashing Ashing on the surface of clarifiers is the result of very small particles of sludge bound to micro-gas bubbles rising to the surface. These particles form small ‘islands’ of thin sludge that floats on the clarifier surface, and looks similar to ash (Figure 8). Ashing may also be accompanied by fine, dispersed floc extending throughout the clarifier (pin floc). Ashing is an indication that the aeration system is approaching an old sludge condition, or high MLSS levels. It also indicates that denitrification is beginning in the clarifier.
Figure 8: Ashing on clarifier surface
When ashing and pin floc are noticed by the operator and determined to be from denitrification, an increase in sludge wasting is recommended to bring the process back into control. If the ashing cannot be reduced by stirring or hosing the floating floc particles and the particles float back to the surface, then the cause may be traced to excessive amounts of grease in the mixed liquor. The grease may appear as small white particles or an oily sheen on the clarifier surface.
20
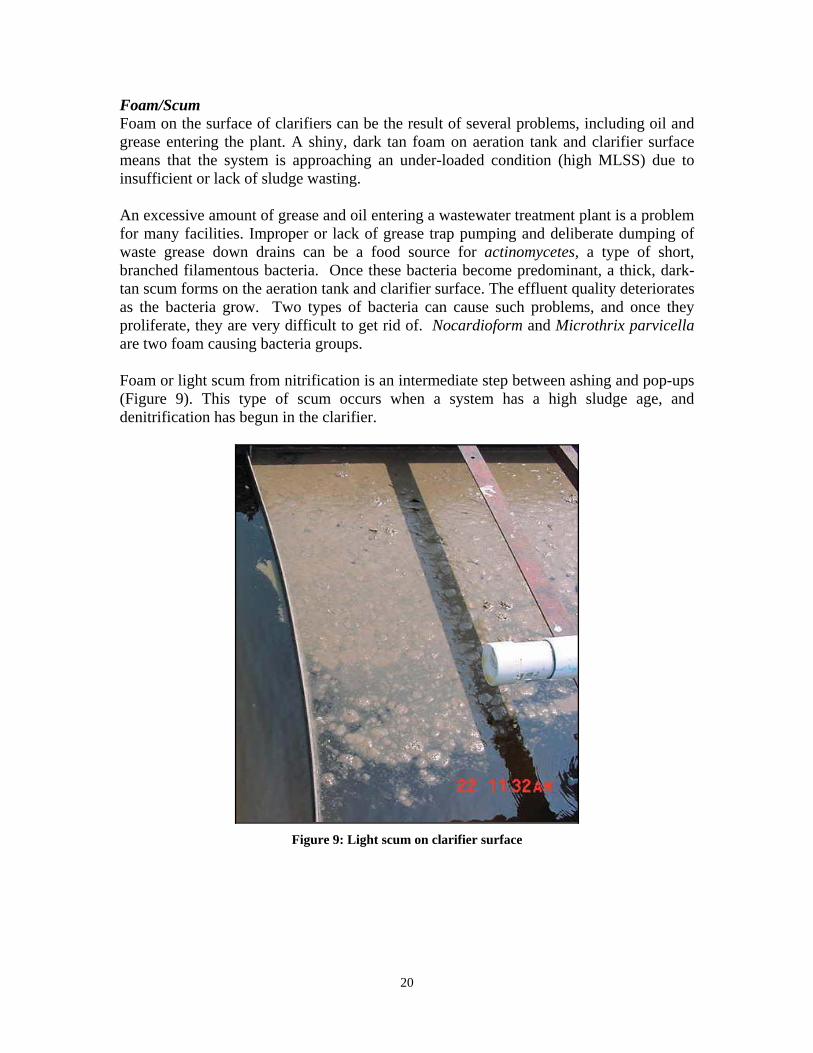
Foam/Scum Foam on the surface of clarifiers can be the result of several problems, including oil and grease entering the plant. A shiny, dark tan foam on aeration tank and clarifier surface means that the system is approaching an under-loaded condition (high MLSS) due to insufficient or lack of sludge wasting. An excessive amount of grease and oil entering a wastewater treatment plant is a problem for many facilities. Improper or lack of grease trap pumping and deliberate dumping of waste grease down drains can be a food source for actinomycetes, a type of short, branched filamentous bacteria. Once these bacteria become predominant, a thick, dark-tan scum forms on the aeration tank and clarifier surface. The effluent quality deteriorates as the bacteria grow. Two types of bacteria can cause such problems, and once they proliferate, they are very difficult to get rid of. Nocardioform and Microthrix parvicella are two foam causing bacteria groups. Foam or light scum from nitrification is an intermediate step between ashing and pop-ups (Figure 9). This type of scum occurs when a system has a high sludge age, and denitrification has begun in the clarifier.
Figure 9: Light scum on clarifier surface
21
Nitrite Lock In previous sections of this manual, we have discussed conditions necessary for complete nitrification and denitrification. But what happens if we don’t have all the right conditions, or things go wrong during treatment? Typically, the process of nitrification occurs rapidly. Nitrifying bacteria convert ammonium to nitrite and finally to nitrate quickly, given the right conditions. But sometimes the job doesn’t quite finish completely. Several things can interrupt nitrification, causing a small amount of nitrite to make its way through the treatment system and into the disinfection unit process. Nitrite has a large demand on chlorine, and if the treatment plant uses chlorine as a disinfectant, it may be very difficult to maintain chlorine residual as the nitrite enters the chlorine contact tank. When chlorine (100% chlorine gas, sodium hypochlorite or calcium hypochlorite) is mixed with water to produce a chlorine solution, acids are formed. Hypochlorous (HOCl) acid is a powerful disinfectant, and leaves a residual that can be measured once the chlorine demand is met. When a chlorine solution is applied to the water to be treated, the HOCl reacts quickly with substances found in the effluent, oxidizing any iron, sulfides, manganese and nitrite it comes in contact with. Nitrite has a large demand on the chlorine. One part of nitrite can effectively reduce five parts of HOCl, converting it to a final form of hydronium and chloride. The reactions are as follows: H2O + Cl2 = HOCl + OCl-
(water + chlorine = hypochlorous acid and hypochlorite ion) NO2
- + HOCl = NO3- + HCl
(nitrite + hypochlorous acid = nitrate and hydrochloric acid) HCl + H2O = H3O+ + Cl-
(hydrochloric acid + water = hydronium ion and chloride) As you can see, just one mg/L of nitrite can cause a lot of problems with chlorine disinfection. If there are two milligrams of nitrite in the effluent, 10 milligrams of chlorine per liter can be rendered useless as a disinfectant. This event occurs in many treatment plants and can cause effluent toxicity, coliform and/or total residual chlorine violations. Nitrite lock is often experienced during a specific time of day or week. Quite often, the chlorine contact tank may take on a cloudy, hazy appearance or even a tea-like coloration during times of nitrite lock. In some facilities, it has been attributed to high influent flow periods with reduced DO (Trygar, 1998). Insufficient influent alkalinity and elevated ammonia levels can also contribute to nitrite lock. Some other causes include reduced nitrifying bacteria population, toxic inhibition and high or low temperature shock.
22
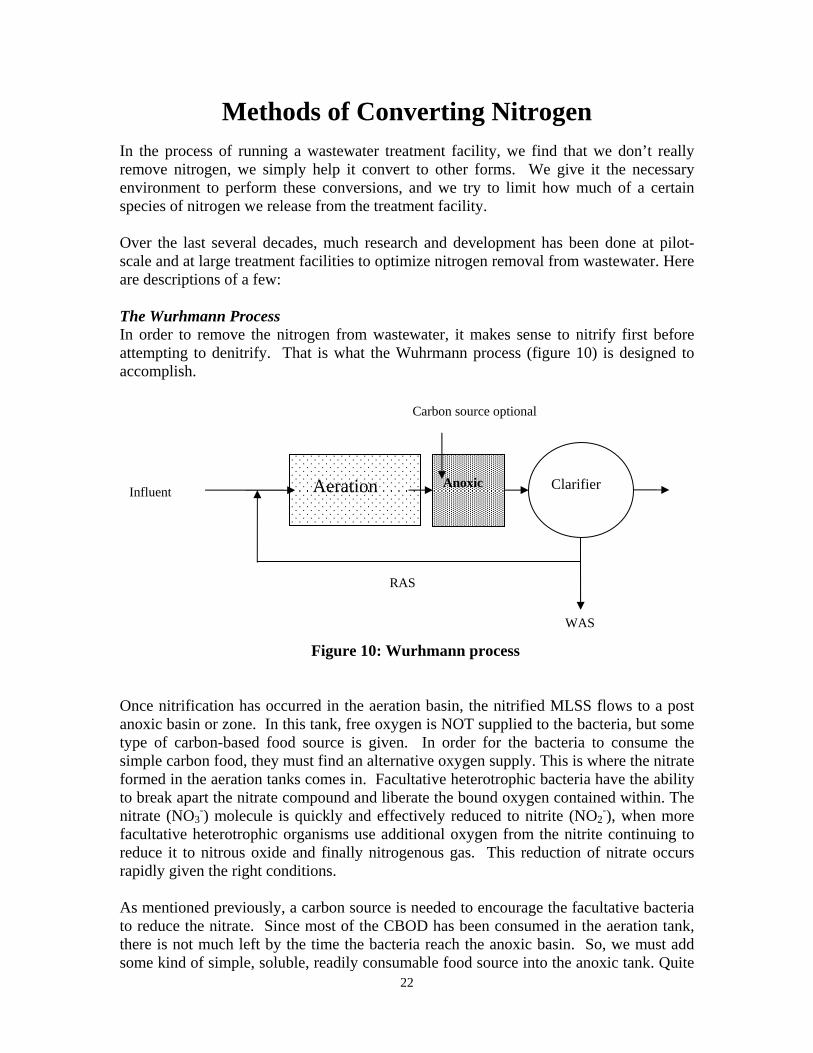
Methods of Converting Nitrogen In the process of running a wastewater treatment facility, we find that we don’t really remove nitrogen, we simply help it convert to other forms. We give it the necessary environment to perform these conversions, and we try to limit how much of a certain species of nitrogen we release from the treatment facility. Over the last several decades, much research and development has been done at pilot-scale and at large treatment facilities to optimize nitrogen removal from wastewater. Here are descriptions of a few: The Wurhmann Process In order to remove the nitrogen from wastewater, it makes sense to nitrify first before attempting to denitrify. That is what the Wuhrmann process (figure 10) is designed to accomplish.
Figure 10: Wurhmann process
Once nitrification has occurred in the aeration basin, the nitrified MLSS flows to a post anoxic basin or zone. In this tank, free oxygen is NOT supplied to the bacteria, but some type of carbon-based food source is given. In order for the bacteria to consume the simple carbon food, they must find an alternative oxygen supply. This is where the nitrate formed in the aeration tanks comes in. Facultative heterotrophic bacteria have the ability to break apart the nitrate compound and liberate the bound oxygen contained within. The nitrate (NO3
-) molecule is quickly and effectively reduced to nitrite (NO2-), when more
facultative heterotrophic organisms use additional oxygen from the nitrite continuing to reduce it to nitrous oxide and finally nitrogenous gas. This reduction of nitrate occurs rapidly given the right conditions. As mentioned previously, a carbon source is needed to encourage the facultative bacteria to reduce the nitrate. Since most of the CBOD has been consumed in the aeration tank, there is not much left by the time the bacteria reach the anoxic basin. So, we must add some kind of simple, soluble, readily consumable food source into the anoxic tank. Quite
Anoxic
Aeration
Clarifier
RAS
WAS
Carbon source optional
Influent
23
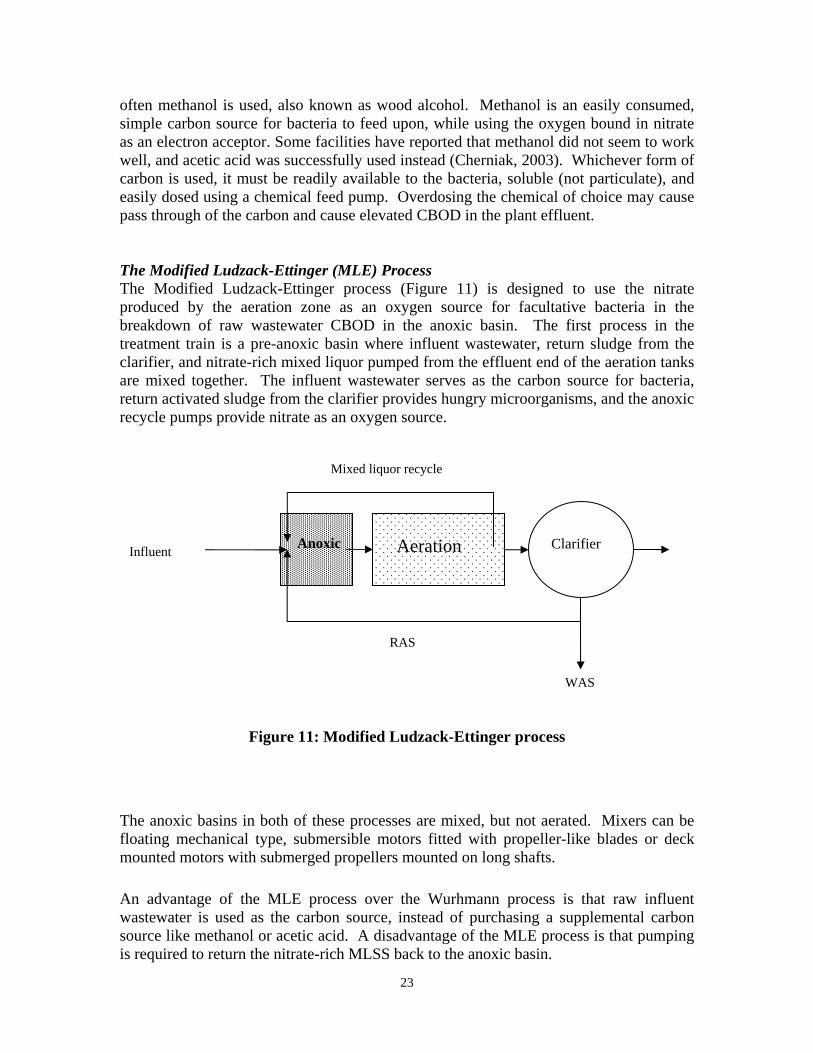
often methanol is used, also known as wood alcohol. Methanol is an easily consumed, simple carbon source for bacteria to feed upon, while using the oxygen bound in nitrate as an electron acceptor. Some facilities have reported that methanol did not seem to work well, and acetic acid was successfully used instead (Cherniak, 2003). Whichever form of carbon is used, it must be readily available to the bacteria, soluble (not particulate), and easily dosed using a chemical feed pump. Overdosing the chemical of choice may cause pass through of the carbon and cause elevated CBOD in the plant effluent. The Modified Ludzack-Ettinger (MLE) Process The Modified Ludzack-Ettinger process (Figure 11) is designed to use the nitrate produced by the aeration zone as an oxygen source for facultative bacteria in the breakdown of raw wastewater CBOD in the anoxic basin. The first process in the treatment train is a pre-anoxic basin where influent wastewater, return sludge from the clarifier, and nitrate-rich mixed liquor pumped from the effluent end of the aeration tanks are mixed together. The influent wastewater serves as the carbon source for bacteria, return activated sludge from the clarifier provides hungry microorganisms, and the anoxic recycle pumps provide nitrate as an oxygen source.
Figure 11: Modified Ludzack-Ettinger process
The anoxic basins in both of these processes are mixed, but not aerated. Mixers can be floating mechanical type, submersible motors fitted with propeller-like blades or deck mounted motors with submerged propellers mounted on long shafts. An advantage of the MLE process over the Wurhmann process is that raw influent wastewater is used as the carbon source, instead of purchasing a supplemental carbon source like methanol or acetic acid. A disadvantage of the MLE process is that pumping is required to return the nitrate-rich MLSS back to the anoxic basin.
Anoxic
Aeration
Clarifier
RAS
WAS
Influent
Mixed liquor recycle
24
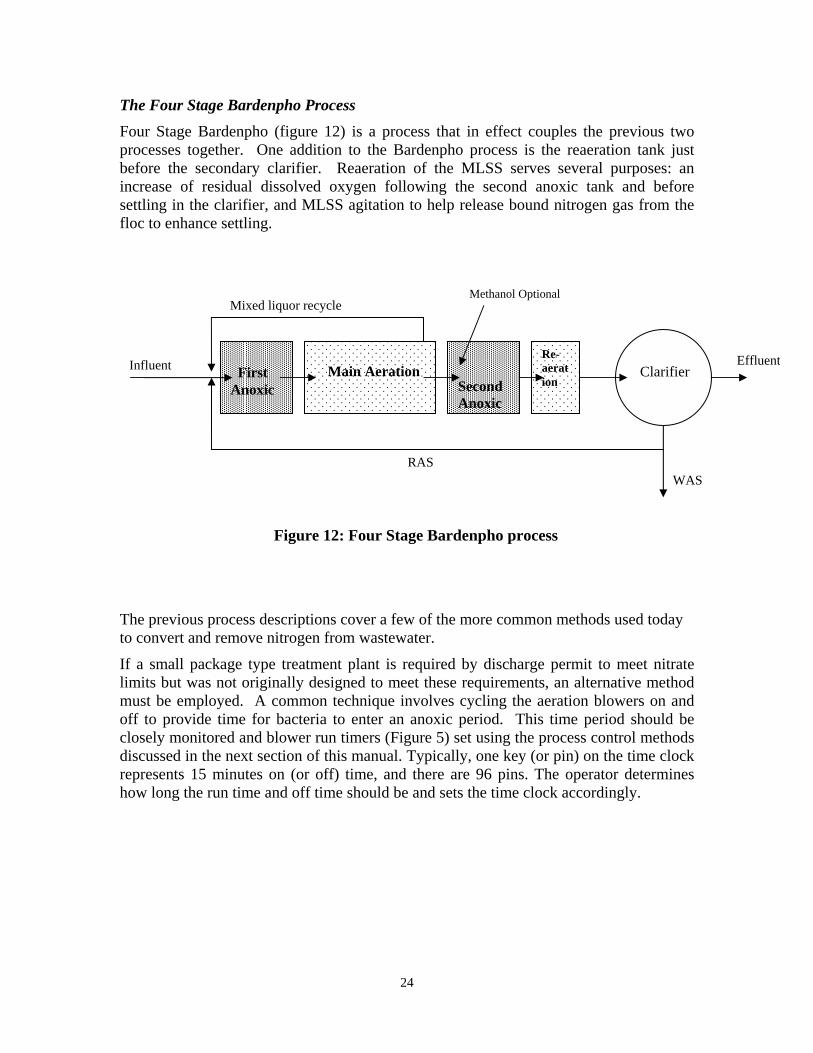
The Four Stage Bardenpho Process Four Stage Bardenpho (figure 12) is a process that in effect couples the previous two processes together. One addition to the Bardenpho process is the reaeration tank just before the secondary clarifier. Reaeration of the MLSS serves several purposes: an increase of residual dissolved oxygen following the second anoxic tank and before settling in the clarifier, and MLSS agitation to help release bound nitrogen gas from the floc to enhance settling.
The previous process descriptions cover a few of the more common methods used today to convert and remove nitrogen from wastewater.
If a small package type treatment plant is required by discharge permit to meet nitrate limits but was not originally designed to meet these requirements, an alternative method must be employed. A common technique involves cycling the aeration blowers on and off to provide time for bacteria to enter an anoxic period. This time period should be closely monitored and blower run timers (Figure 5) set using the process control methods discussed in the next section of this manual. Typically, one key (or pin) on the time clock represents 15 minutes on (or off) time, and there are 96 pins. The operator determines how long the run time and off time should be and sets the time clock accordingly.
Methanol Optional
Second Anoxic
First Anoxic
Main Aeration
Clarifier
Re-aeration
Influent
Mixed liquor recycle
RASWAS
Effluent
Figure 12: Four Stage Bardenpho process
25
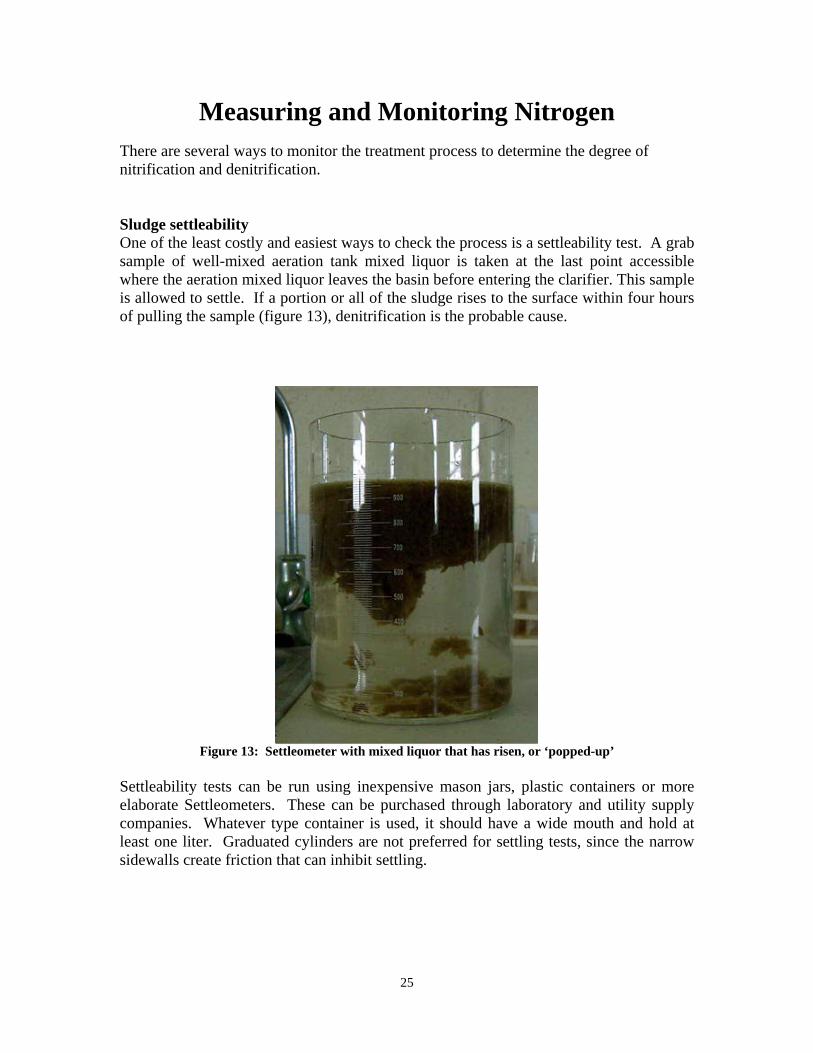
Measuring and Monitoring Nitrogen There are several ways to monitor the treatment process to determine the degree of nitrification and denitrification. Sludge settleability One of the least costly and easiest ways to check the process is a settleability test. A grab sample of well-mixed aeration tank mixed liquor is taken at the last point accessible where the aeration mixed liquor leaves the basin before entering the clarifier. This sample is allowed to settle. If a portion or all of the sludge rises to the surface within four hours of pulling the sample (figure 13), denitrification is the probable cause.
Figure 13: Settleometer with mixed liquor that has risen, or ‘popped-up’
Settleability tests can be run using inexpensive mason jars, plastic containers or more elaborate Settleometers. These can be purchased through laboratory and utility supply companies. Whatever type container is used, it should have a wide mouth and hold at least one liter. Graduated cylinders are not preferred for settling tests, since the narrow sidewalls create friction that can inhibit settling.
26
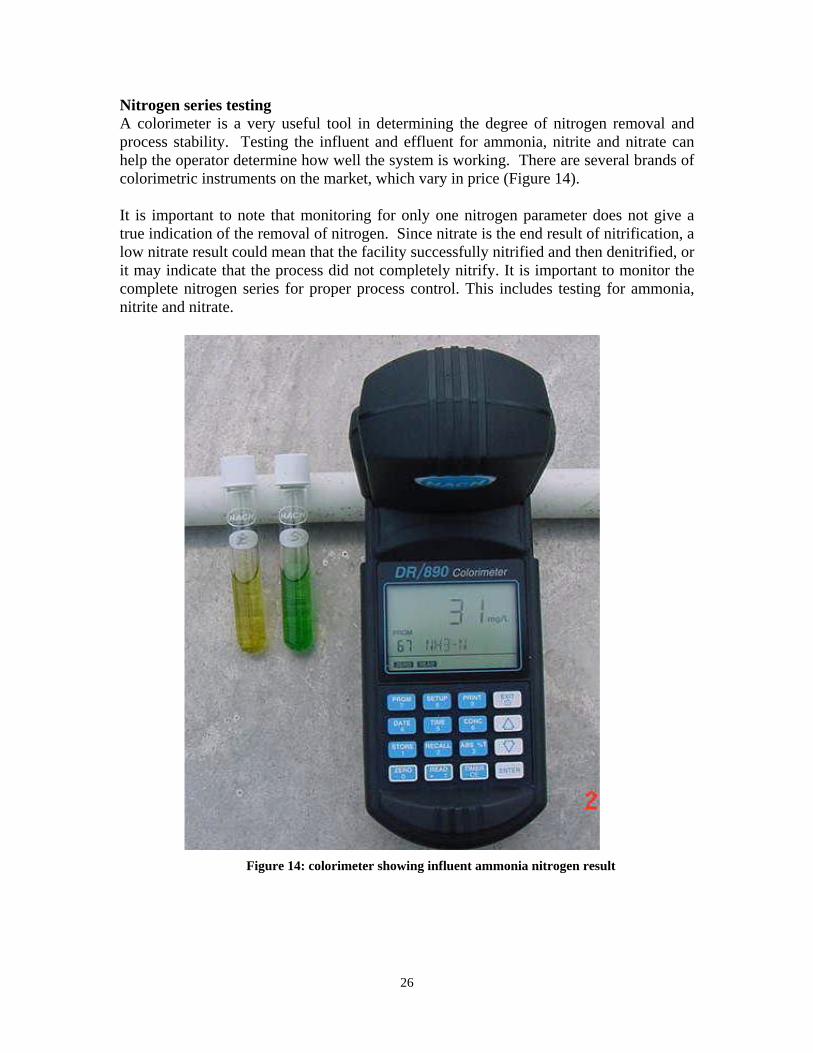
Nitrogen series testing A colorimeter is a very useful tool in determining the degree of nitrogen removal and process stability. Testing the influent and effluent for ammonia, nitrite and nitrate can help the operator determine how well the system is working. There are several brands of colorimetric instruments on the market, which vary in price (Figure 14). It is important to note that monitoring for only one nitrogen parameter does not give a true indication of the removal of nitrogen. Since nitrate is the end result of nitrification, a low nitrate result could mean that the facility successfully nitrified and then denitrified, or it may indicate that the process did not completely nitrify. It is important to monitor the complete nitrogen series for proper process control. This includes testing for ammonia, nitrite and nitrate.
Figure 14: colorimeter showing influent ammonia nitrogen result
27
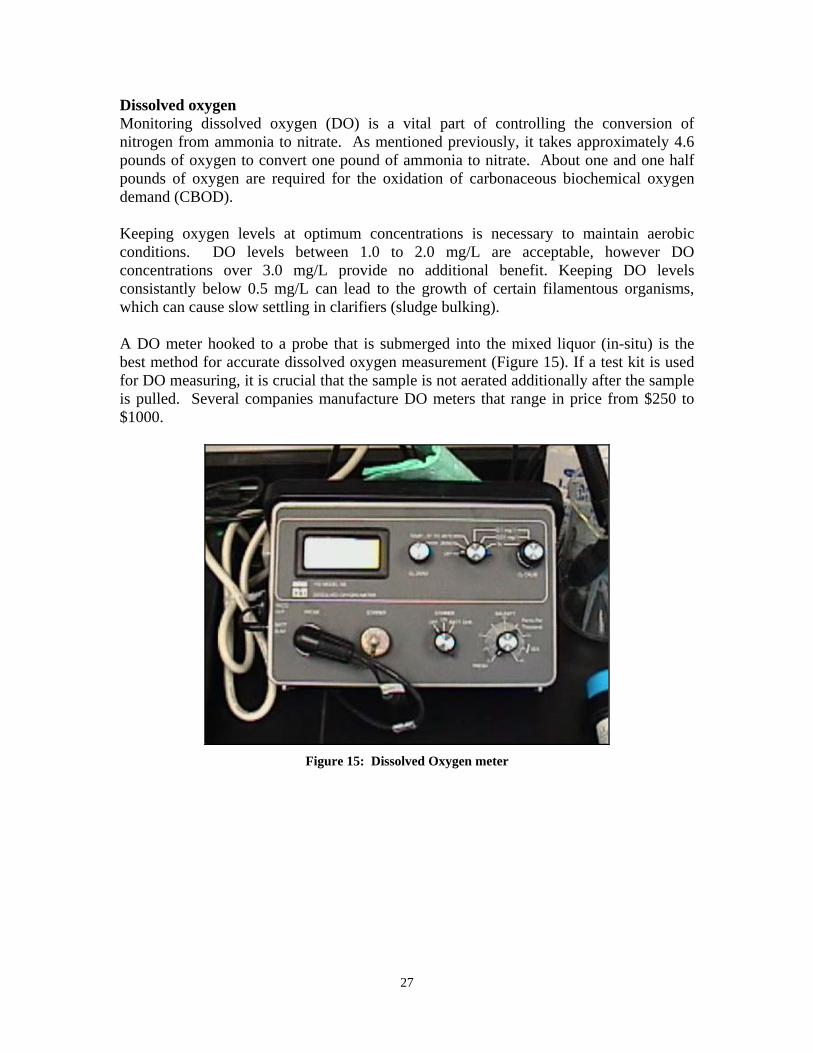
Dissolved oxygen Monitoring dissolved oxygen (DO) is a vital part of controlling the conversion of nitrogen from ammonia to nitrate. As mentioned previously, it takes approximately 4.6 pounds of oxygen to convert one pound of ammonia to nitrate. About one and one half pounds of oxygen are required for the oxidation of carbonaceous biochemical oxygen demand (CBOD). Keeping oxygen levels at optimum concentrations is necessary to maintain aerobic conditions. DO levels between 1.0 to 2.0 mg/L are acceptable, however DO concentrations over 3.0 mg/L provide no additional benefit. Keeping DO levels consistantly below 0.5 mg/L can lead to the growth of certain filamentous organisms, which can cause slow settling in clarifiers (sludge bulking). A DO meter hooked to a probe that is submerged into the mixed liquor (in-situ) is the best method for accurate dissolved oxygen measurement (Figure 15). If a test kit is used for DO measuring, it is crucial that the sample is not aerated additionally after the sample is pulled. Several companies manufacture DO meters that range in price from $250 to $1000.
Figure 15: Dissolved Oxygen meter
28
Oxidation Reduction Potential (ORP) Oxidation Reduction Potential is an effective way of measuring the potential for the liquid to be oxidative or reductive. While a DO meter is a good way of measuring residual dissolved oxygen, it doesn’t give an accurate representation of the potential of that liquid to allow for nitrate reduction. It is important for the operator to realize that ORP is not measuring dissolved oxygen; it is however measuring the balance between oxidizing and reducing chemical species. For instance, we know that chlorine is an oxidizer. A tank with high chlorine residual shows a high ORP millivolt value, greater than +250 mV. As sulphur dioxide is added to neutralize the chlorine residual, the ORP decreases since the sulfur dioxide acts as a reducer. If the chlorine residual is neutralized and there is residual sulphur dioxide present, the ORP value falls below -100 mV. For purposes of this discussion, we will look at the ORP ranges required for nitrification and denitrification. An ORP reading of +50 to about +225 mV taken during aeration tank operation indicates adequate oxidizers are present, usually dissolved oxygen (O2). Historically, ORP readings in the range of +50 to –50 mV indicated that the balance of oxidizers to reducers is roughly equal. Readings in this range suggest the liquid is in transition, and is considered an anoxic condition. This is normally a good range for anoxic tanks and timed anoxic cycles. There should be no free DO present in this zone, and a DO meter would be reading close to zero mg/L. However, recent studies suggest that ORP values of less than -50 mV are needed to effectively denitrify (Hach Co./Cumberland, NOTC, 2007). To reach a point where all nitrate has been reduced during denitrification, ORP readings of -75 mV to -100 mV have been observed. ORP meters vary in price, from about $100 to several hundred dollars. Be sure to purchase and use an ORP standard to ensure correct ORP meter performance.
29
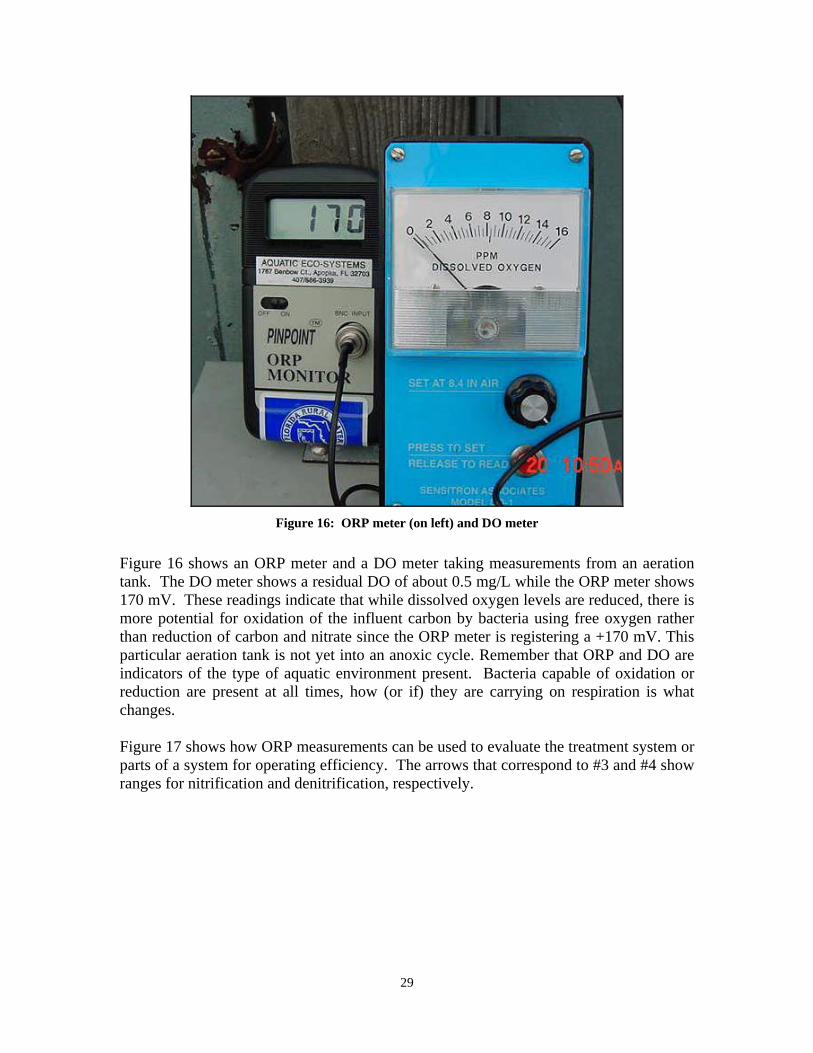
Figure 16: ORP meter (on left) and DO meter
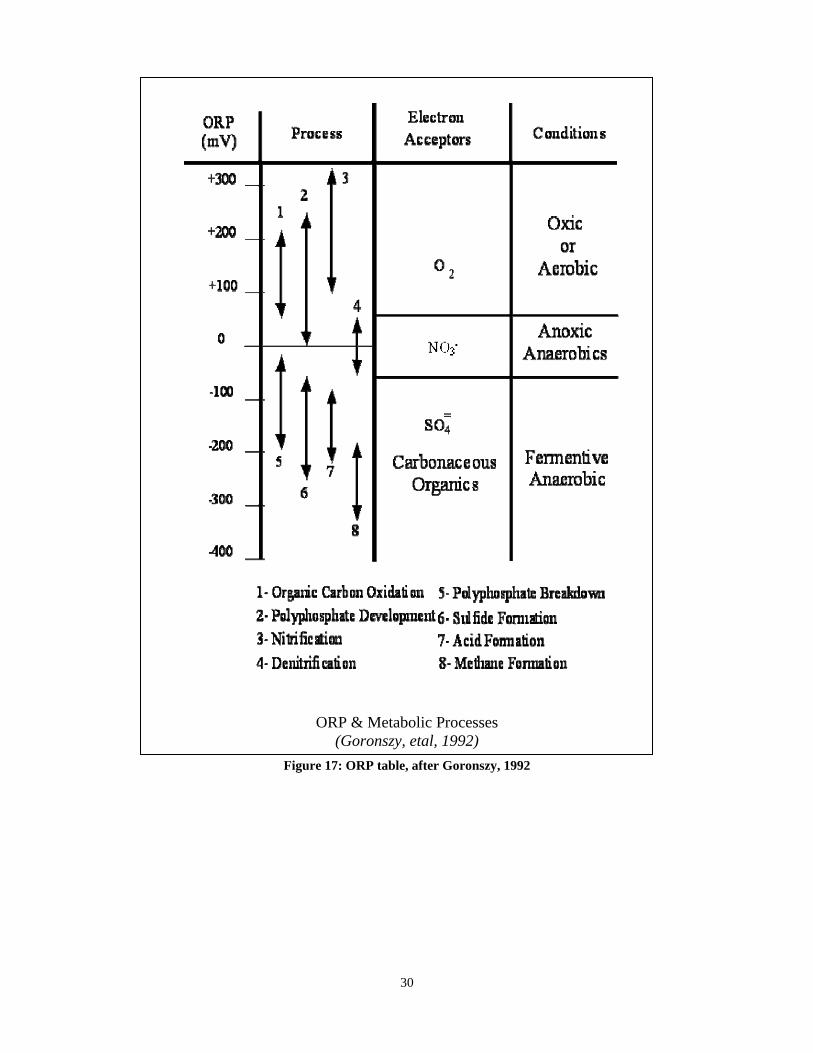
Figure 16 shows an ORP meter and a DO meter taking measurements from an aeration tank. The DO meter shows a residual DO of about 0.5 mg/L while the ORP meter shows 170 mV. These readings indicate that while dissolved oxygen levels are reduced, there is more potential for oxidation of the influent carbon by bacteria using free oxygen rather than reduction of carbon and nitrate since the ORP meter is registering a +170 mV. This particular aeration tank is not yet into an anoxic cycle. Remember that ORP and DO are indicators of the type of aquatic environment present. Bacteria capable of oxidation or reduction are present at all times, how (or if) they are carrying on respiration is what changes. Figure 17 shows how ORP measurements can be used to evaluate the treatment system or parts of a system for operating efficiency. The arrows that correspond to #3 and #4 show ranges for nitrification and denitrification, respectively.
30
ORP & Metabolic Processes
(Goronszy, etal, 1992) Figure 17: ORP table, after Goronszy, 1992
31
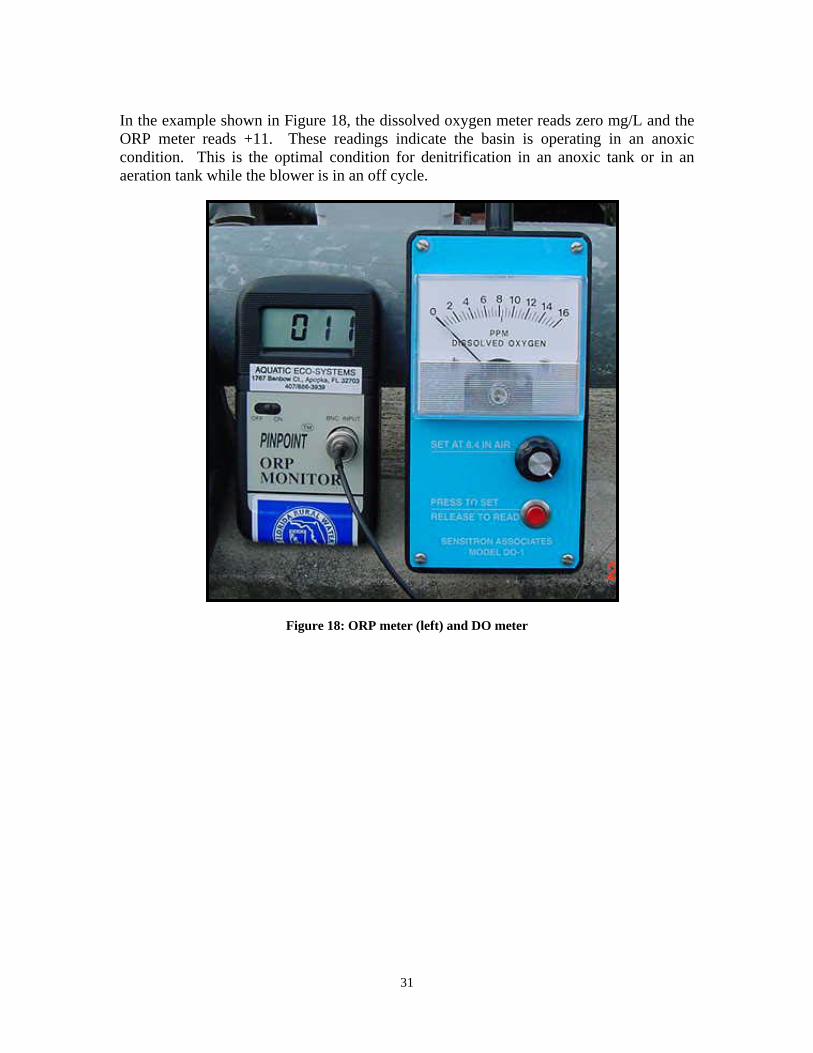
In the example shown in Figure 18, the dissolved oxygen meter reads zero mg/L and the ORP meter reads +11. These readings indicate the basin is operating in an anoxic condition. This is the optimal condition for denitrification in an anoxic tank or in an aeration tank while the blower is in an off cycle.
Figure 18: ORP meter (left) and DO meter
32
Alkalinity, as Calcium Carbonate (CaCO3) Along with the previous mentioned process control tests, the alkalinity test can be used to reinforce the data that indicates nitrification has occurred in an aeration tank. Since we know that the nitrification process consumes about 7.1 parts of alkalinity for each part of ammonia oxidized to nitrate, we can calculate the progress of nitrification. For instance, if there is 30 mg/L of ammonia entering the aeration tank, we can assume that about 213 mg/L of alkalinity as CaCO3 will be needed to allow the nitrifying organisms to completely convert the ammonia to nitrate (30 mg/L NH3 x 7.1 mg/L of alkalinity consumed per one mg/L NH3 = 213 mg/L of alkalinity needed). Nitrifiers are classified as aerobic autotrophic bacteria. According to the Merriam-Webster dictionary, autotrophic is defined as “requiring only carbon dioxide or carbonates as a source of carbon and a simple inorganic nitrogen compound for metabolic synthesis of organic molecules (as glucose). To simplify, this means that if nitrifiers are present with sufficient dissolved oxygen, they will get their carbon source from either carbon dioxide saturated in the wastewater, or from the alkalinity present in the waste stream. While the nitrifiers oxidize influent ammonium to obtain energy, they consume some of the influent CBOD. It is important to note that while the nitrifying bacteria are consuming the alkalinity, they are also producing a byproduct of acid. This can have a negative effect on the efficiency of nitrification; influent wastewater with low alkalinity can be a performance limiting factor, allowing only a portion of the ammonia to be completely converted to nitrate. Some facilities find themselves with problems downstream of the secondary treatment processes when this occurs in the aeration tanks. Symptoms include depleted alkalinity in the effluent, depressed pH values due to lack of alkalinity to buffer acids formed, high chlorine demand, increased coliform counts and effluent toxicity issues. Nitrite lock, as discussed previously, may also be seen during this period of incomplete nitrification. As you can see, it is important to monitor alkalinity through the treatment process to ensure complete nitrification and provide enough buffering capability downstream to prevent further pH reduction. If influent alkalinity is consistently less than 250 mg/L, it may be necessary to add an alkaline source to the waste stream such as lime, soda ash, or sodium hydroxide as an alkalinity supplement. Influent alkalinity in the area of 250 mg/L as CaCO3 usually provides enough alkalinity to allow complete nitrification. A nice feature of denitrification is the recovery of approximately half of the alkalinity that is consumed during nitrification. About 3.5 mg/L of alkalinity as CaCO3 can be recovered from successful denitrification in an anoxic basin, or during an anoxic time period in an aerated tank. Many operators have experienced this first hand in the operation of their aerobic sludge digesters. It is common practice to aerate the aerobic digester for extended periods of time only shutting down aeration to allow for settling and decanting. This long aeration time usually allows a significant amount of nitrification to occur in the digester, consuming the limited amount of alkalinity present, which causes the pH to drop. pH and alkalinity begin to recover once the aeration is shut off to allow for settling. While the
33
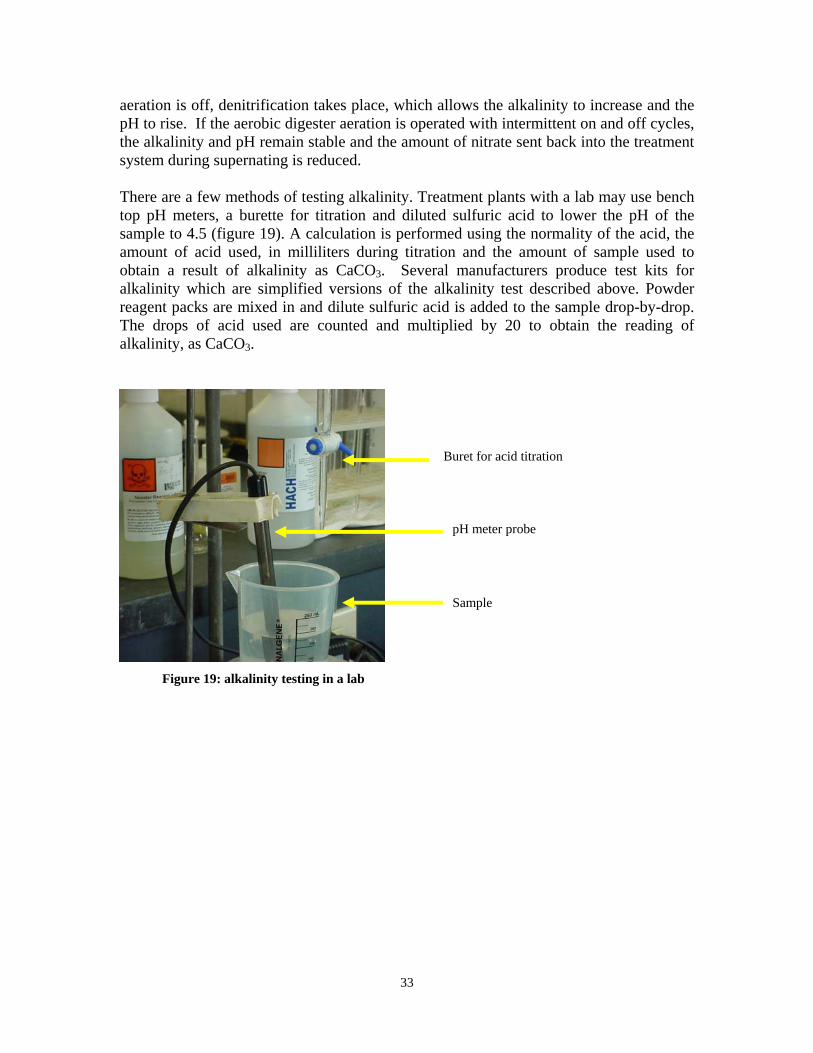
aeration is off, denitrification takes place, which allows the alkalinity to increase and the pH to rise. If the aerobic digester aeration is operated with intermittent on and off cycles, the alkalinity and pH remain stable and the amount of nitrate sent back into the treatment system during supernating is reduced. There are a few methods of testing alkalinity. Treatment plants with a lab may use bench top pH meters, a burette for titration and diluted sulfuric acid to lower the pH of the sample to 4.5 (figure 19). A calculation is performed using the normality of the acid, the amount of acid used, in milliliters during titration and the amount of sample used to obtain a result of alkalinity as CaCO3. Several manufacturers produce test kits for alkalinity which are simplified versions of the alkalinity test described above. Powder reagent packs are mixed in and dilute sulfuric acid is added to the sample drop-by-drop. The drops of acid used are counted and multiplied by 20 to obtain the reading of alkalinity, as CaCO3.
Buret for acid titration
pH meter probe
Sample
Figure 19: alkalinity testing in a lab
34
A Few Suggestions on Overall Plant Operation Plants with Aerobic Digestion When operating a wastewater treatment facility that has an aerobic digester for waste sludge stabilization and plant hydraulic capacity is not limited, it can be beneficial to return digester supernatant during high daily flow periods. Since aerobic digester supernatant is usually high in nitrate, the nitrate can be reduced more effectively during times of simultaneous influent carbon loading (CBOD), especially in facilities that have anoxic basins or during timed anoxic cycles. This same digester supernatant can also be the cause of high nitrate lab results during regular effluent sampling required by the operating permit. Plants with Anaerobic Digestion When operating a treatment facility with anaerobic digesters, or aerobic digesters operated in anaerobic conditions, it is beneficial to return this digester supernatant during periods of low influent flow. Anaerobic supernatant can be high in BOD and ammonia, and returning this liquid during low flows provides food for bacteria during times when the food source is normally reduced. Feeding this strong waste stream into the plant during peak flow can organically overload the biological treatment system, depleting dissolved oxygen levels in aeration tanks and adversely effect treatment efficiency.