Final Jomat Jomat Jan – June 2017 5 No 2 January June 2017.pdfjomat vol. 5 no.2 january – june...
80
Transcript of Final Jomat Jomat Jan – June 2017 5 No 2 January June 2017.pdfjomat vol. 5 no.2 january – june...


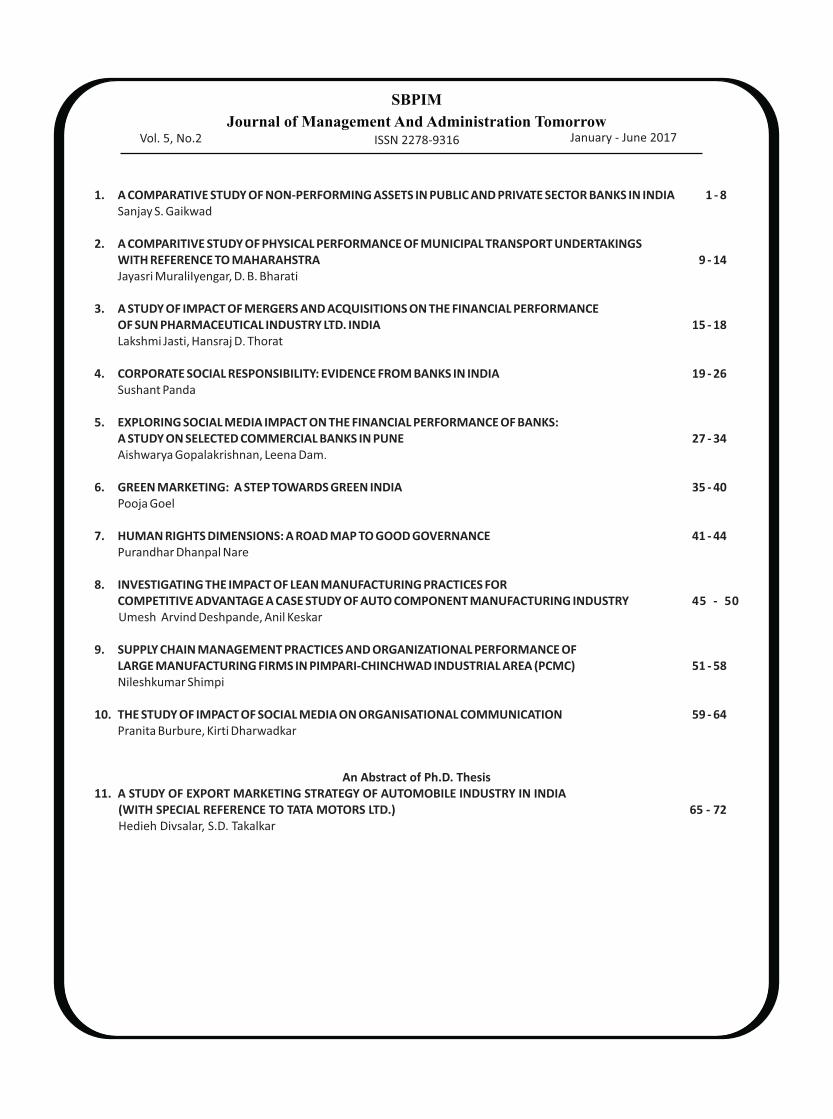


JOMAT Vol. 5 No.2 January – June 2017 ISSN No. 2278-9316
(1)
A COMPARATIVE STUDY OF NON-PERFORMING ASSETS
IN PUBLIC AND PRIVATE SECTOR BANKS IN INDIA
Sanjay S. Gaikwad,
ABSTRACT
An efficient and professional banking system is a characteristic of an advance economy. Commercial banks are set up with
the intention of earning profit along with provide means of economic development through providing credit to different sectors
of economy. While lending money to borrowers there is always risk that borrower may not refund loan amount. The credit risk is
inherent to any bank who provide loans and advances. On account of different reasons borrower may not able to repay its
principle and interest amount. If such condition persist for over a period of 90 days that loan become non-performing.
Non-performing Asset (NPA) in commercial banks become prime focus in recent days. Commercial banks constitute Public Sector
Banks, Private Sector Banks and Foreign Banks. Public Sector Banks holds approximately 70% of total advances of banking
system in India. Naturally these banks are more exposed to non-performing assets. Over past few years non-performing assets of
banks has increased sharply despite measures taken by Government and Reserve Bank of India. Rising level of NPA's are
deteriorating profitability of Public as well as Private Sector Banks. In this scenario banks has to be more cautious while lending
money to borrowers. Present paper evaluates the trends and progress of Public and Private Sector Banks in India for the period
2012-13 up to 2016-17. This paper analysed the relation between non-performing assets and profitability of Public and Private
Sector Banks. It also highlighted the suggestions by which banks can make an attempt to minimise the overall level of NPA's.
Keywords: Gross NPA, Net NPA, Public Sector Banks, Private Sector Banks, Profitability.
1. Introduction:
Banks play a very significant role in the economic
development of every country. In a well organised financial
system banks has the key role to perform. They are like the
blood vanes circulating money within the economy. It is
central to a nation’s economy as it caters to the needs of
credit for all the sections of the society. Banking in India has
seen several changes over the period of 200 hundred years.
Establishment of RBI was the first step toward the organised
banking system in India which regulates all banking industry.
Since banks were nationalized in 1969, they have been
playing a major role in the socio-economic life of the country.
A major overhaul take place after 1991 when Indian economy
taste the privatisation of industries. Banking industry was also
not exceptional to it. Private sector and foreign banks
emerged as one of the important contributor for economic
growth along with public sector banks in India.
With immense growth in economy attracted many
entrepreneurs to start new ventures which require huge
funds. Government also come up with different schemes for
manufacturing, service and agricultural sector. Indian banks
succeed to meet the requirement of everyone by financing
various activities. Everything was going on well till 2008 but
since then Indian banks are facing a radical problem of Non-
Performing Assets (NPA). The meltdown in recent years of
economy causes increase in proportion of bad advances
which subsequently become big problem of banking system.
Bad loans or NPA affect the overall profitability of banks in
last few years. Public Sector Banks (PSB’s) becomes the major
victim of it. These are loans on which interest and installment
remain unpaid. According to report of IMF 36.9% of total
debt in India is at risk. If the problem of bad loans not
resolved in short period then it will cause in deterioration of
creditworthiness of Indian economy.
According to RBI report on Trend and Progress of Banking
in India 2016-17, the total stressed assets (gross
non-performing assets + restructured standard advances) as
per cent of gross advances were placed at 12.6% and 12.2%
during Q1 and Q2 of 2017-18, respectively. Among bank
groups, stressed assets of Public Sector Banks hovered
© SBPIM
Assistant Professor, Department of Business Administration (MBA), Pimpri Chinchwad College of Engineering,
Contact no.: 7720822937 Email Id: [email protected]
JOMAT Vol. 5 No. 2 January – June 2017 ISSN No. 2278-9316
(2)
around 16%, while stressed assets of Private Sector Banks
remained below 5 %. The enactment of the Insolvency and
Bankruptcy Code (IBC), 2016 and promulgation of the
Banking Regulation (Amendment) Act, 2017 has significantly
altered the financial landscape and imbued with optimism
and resolve the concerted efforts that are underway for
resolution of stress in balance sheets of banks and
corporations in a time-bound and effective manner. An
Internal Advisory Committee (IAC) constituted by the Reserve
Bank decided on an objective, non-discretionary framework
for referring some of the large stressed accounts for
resolution under the IBC. Based on the IAC’s
recommendations, the Reserve Bank issued directions on
June 13, 2017 to certain banks for referring some accounts
with fund and non-fund based outstanding amounts greater
than ` 50 billion – with 60% or more qualifying as non-
performing as on March 31, 2016 – to initiate insolvency
processes under the IBC, 2016. With respect to that RBI, in
the month of January 2018 has given a list of 28 big
defaulters of which insolvency proceedings against 24 will be
starting soon. As per report of RBI the share of large
borrowers both in total Scheduled Commercial Banks loans as
well as Gross NPA’s stood at 56% and 86.5% respectively as
on 31st
March 2017.
Current paper is the attempt to reveal the trend of NPA's
of commercial banks in India by focusing on Public Sector
Banks (PSB's) and Private Sector Banks (PVB's) over a period
of 5 years. (2012-13 to 2016-17). As NPA will have the impact
on profitability of banks hence attempt is also made to bring
out effect of NPA's on net profit of commercial banks.
2. Non-Performing Assets – Conceptual Background:
2.1 Meaning of NPA:
(i) As per RBI definition, an asset, including a leased asset,
becomes non-performing when it ceases to generate
income for the bank.
(ii) A non-performing asset (NPA) is a loan or an advance
where; Interest and/or installment of principal remain
overdue for a period of more than 90 days in respect of a
term loan, the account remains ‘out of order’, in respect
of an Overdraft/Cash Credit (OD/CC),
(iii) The bill remains overdue for a period of more than 90
days in the case of bills purchased and discounted,
(iv) The installment of principal or interest thereon remains
overdue for two crop seasons for short duration crops,
(v) The installment of principal or interest thereon remains
overdue for one crop season for long duration crops,
(vi) The amount of liquidity facility remains outstanding for
more than 90 days, in respect of a securitisation
transaction undertaken in terms of guidelines on
securitisation dated February 1, 2006.
(vii) In respect of derivative transactions, the overdue
receivables representing positive mark-to-market value
of a derivative contract, if these remain unpaid for a
period of 90 days from the specified due date for
payment.
In case of interest payments, banks should, classify an
account as NPA only if the interest due and charged during
any quarter is not serviced fully within 90 days from the end
of the quarter.
NPA's are categorized as Gross NPA (GNPA) and Net NPA
(NNPA). GNPA includes all loan assets which are categorized
as non-performing as per RBI directions, whereas NNPA is the
net of provisions made on GNPA's.
2.2 Asset Classification
Banks are required to classify nonperforming assets
further into the following three categories based on the
period for which the asset has remained non-performing and
the realisability of the dues:
(1) Substandard Assets:
With effect from March 31, 2005, a substandard asset
would be one, which has remained NPA for a period less than
or equal to 12 months. Such an asset will have well defined
credit weaknesses that jeopardise the liquidation of the debt
and are characterised by the distinct possibility that the banks
will sustain some loss, if deficiencies are not corrected.
(2) Doubtful Assets:
With effect from March 31, 2005, an asset would be
classified as doubtful if it has remained in the substandard
category for a period of 12 months. A loan classified as
doubtful has all the weaknesses inherent in assets that were
classified as sub-standard, with the added characteristic that
the weaknesses make collection or liquidation in full, – on the
basis of currently known facts, conditions and values –highly
questionable and improbable.
(3) Loss Assets:
A loss asset is one where loss has been identified by the
bank or internal or external auditors or the RBI inspection but
the amount has not been written off wholly. In other words,

JOMAT Vol. 5 No. 2 January – June 2017 ISSN No. 2278-9316
(3)
such an asset is considered uncollectible and of such little
value that its continuance as a bankable asset is not
warranted although there may be some salvage or recovery
value.
2.3 Provisioning norms for NPA:
Type of Asset Provision required
Standard Assets (a) Direct advances to agricultural and Small and Micro Enterprises (SMEs) sectors at
0.25 per cent;
(b) Advances to Commercial Real Estate (CRE) Sector at 1.00 per cent;
(c) Advances to Commercial Real Estate – Residential Housing Sector at 0.75 per cent;
(d) All other loans and advances not included in (a) (b) and (c) above at 0.40 per cent.
Substandard Assets (i) A general provision of 15 percent on total outstanding should be made without making any
allowance for ECGC guarantee cover and securities available.
(ii) The ‘unsecured exposures’ which are identified as ‘substandard’ would attract additional
provision of 10 per cent, i.e., a total of 25 per cent on the outstanding balance.
Doubtful Assets (i) 100 percent of the extent to which the advance is not covered by the realisable value of the
security to which the bank has a valid recourse and the realisable value is estimated on a
realistic basis.
(ii) In regard to the secured portion, provision may be made on the following basis, at the rates
ranging from 25 percent to 100 percent of the secured portion depending upon the period
for which the asset has remained doubtful:
(a) Up to one year – 25%
(b) One to three years – 40%
(c) More than three years – 100%
Loss Assets Loss assets should be written off. If loss assets are permitted to remain in the books for any
reason, 100 percent of the outstanding should be provided for.
(Source: RBI Master Circular - Prudential norms on Income Recognition, Asset Classification and Provisioning pertaining to
Advances, July 2014.)
3. Literature Review:
Dr. Miyan, M. (2017), he found NPAs are showing a
downward trend over the study period, but Non-Performing
Assets of public sector banks are still higher than private
sector banks. The core management of private sector banks is
more professional, much competent and expertise than the
PSU banks.
Sagar, A. (2016) in his review paper, “Rising Non-
Performing Assets in India Genuine Business Failure?”
Focused on malpractices on siphoning of money willfully. He
alarmed urgent need for an independent enquiry by the
neutral agency like CBI to ascertain the real cause of the rising
bad loans.
Dr. V. N. Sailaja and Dr. N. Bindu Madhavi (2016), found
that there is decline in NPA’s of selected private sector banks
leads to improvement in asset quality of these banks,
whereas NPA’s of selected public sector banks are increased
during study period. They suggested public sector banks
should have reliable credit policy to reduce NPA’s.
A Keynote address delivered by Shri R. Gandhi, Deputy
Governor, Reserve Bank of India at The Economic Times
Remodel in India – Asset Reconstruction & NPA Management
Summit, Mumbai on Sep 15, 2015, provided his thoughts on
NPA management by applying Enhancing Credit Appraisal
Capacity, Pricing of NPAs and role of securitisation companies
/ reconstruction companies (SCs/RCs) registered under the
SARFAESI Act.
Sharma, D. (2015), in his paper expressed asset quality of
selected Nationalised Banks in India. As per his study there is
significant relationship between asset quality i.e. relationship
between total asset to total investment, Net NPA to Net
Advances and Net NPA to Total Assets. He also concluded
that level of NPA is declining in Indian banking system.
Preetha. C (2015), highlighted the impact of NPA on
different sectors of selected banks. Study focused on NPA’s of
priority and non-priority sector where it was observed that
priority sector have more impact of NPA as compare to non-
priority sector.

JOMAT Vol. 5 No. 2 January – June 2017 ISSN No. 2278-9316
(4)
Dr. S. Rajamohan and Mr. D. Durairaj (2015), in their
paper “Comparative Analysis of the Non Performing Assets of
Banks in India – Structural Equation Model” studied level of
NPA through Structural Equation Model. Study covers credit
portfolio of public sector banks and private sector banks in
India for 11 years. They concluded that both public and
private sector banks have effective credit management but
their doubtful assets have high level influencing factor
towards the total asset of the banks. It was suggested that
banks should try to convert their doubtful debts into standard
assets. Along with that PSB should have efficient
management information system to compete with private
sector banks.
Mondal, S. (2015), analysed non-performing assets of
foreign banks in India. Author observed there is increase in
gross and net advances foreign banks. Gross NPA’s and Net
NPA’s of these banks are showing decreasing trend. It was
concluded that profitability of foreign banks is increasing due
to decrease in NPA’s.
Ramakrishna, S. and Kurian, R. (2014), concluded NPA
assets of public sector banks are showing higher trend as
compare to foreign banks.
Srinivas K T (2013) in his research paper on “A Study on
Non-Performing Assets of Commercial Banks in India”,
highlighted trend of NPA in Public sector banks, old private
sector banks, new private sector banks and foreign banks. He
concluded that, the banks should take certain measures to
avoid sanctioning loans to the borrowers whose credibility is
low.
Samir and Kamra, D. (2013), in their work “A
Comparative Analysis of Non- Performing Assets (NPAs) of
Selected Commercial Banks in India”, focuses on trend
analysis of NPAs and evaluates the financial health of SBI,
PNB and CBI. They concluded that, the incidence of non-
performing assets (NPAs) is affecting the performance of
banks both financially and psychologically. Along with that
SARFAESI Act and the debt recovery tribunals (DRTs) has
proved to be very affective in recovery of bad loans through
different channels.
Kaur, K. and Singh, B. (2011) in their research paper titled
“Non Performing Assets of Public and Private Sector Banks –
A Comparative Study” highlighted that level of NPA in public
sector banks are high compare to private sector banks. While
analyzing sector-wise NPA, they found that public sector
banks have high proportion of NPA in priority and
non-priority sector as compare to private sector banks.
Recovery of NPA’s stands high in private sector banks.
4. Research Methodology
4.1 Research Design:
The descriptive research design is used for the analysis
and it is essentially a fact finding approach. Commercial banks
in India includes public sector banks, private sector banks and
foreign banks. Present study is an attempt to describe the
trend of NPA’s among Public Sector Banks (SBI & Associate
banks and Nationalised Banks) and Private sector banks (Old
and New). An attempt is also made to evaluate the impact of
NPA’s on profitability of banks.
4.2 Significance of Study
Non-Performing Assets are causing significantly to
commercial banks in India. NPA’s deteriorating the quality of
assets of banks and subsequently affecting the profitability
banks. The last five years are considered important from
commercial banks point of view as Government has taken
considerable initiatives toward revitalizing the performance
of banks specifically for public sector banks which includes
capital infusing for PSB’s, Insolvency and Bankruptcy Code
etc. RBI has given important directives for reducing non-
performing assets and improving asset quality. Present study
analyse the trend of NPA’s over a period of five years. The
study also focuses upon change in asset quality and effect of
NPA’s on profitability of banks. It could be stressed out
whether initiatives taken by authorities are really providing
fruitful result for banks or not.
4.3 Objectives of Study
To study the trend of Gross NPA and Net NPA of Public
Sector banks and Private Sector Banks during 2012-13 to
2016-17.
To assess and evaluate asset classification of Public
Sector Banks and Private Sector Banks.
To evaluate sectorial non performing assets of Public and
Private Sector Banks.
To analyse the relation of Net NPA’s with Net Profit of
Public and Private Sector Banks.
4.4 Hypothesis of Study
(1) (Ha0): There is no significant correlation between Net
NPA’s and Net Profit of Public Sector Banks during study
period.
(Ha1): There is significant correlation between Net NPA’s
and Net Profit of Public Sector Banks during study period.
(2) (Hb0): There is no significant correlation between Net
NPA’s and Net Profit of Private Sector Banks during study
period.
(Hb1): There is significant correlation between Net NPA’s
and Net Profit of Private Sector Banks during study
period.
4.5 Data Collection
The study is purely based on secondary data. The data
for analysis is collected from different publication of Reserve
Bank of India which is available on official website of RBI.
Online research journals available at J-gateplus, other journal
websites referred along with books.

JOMAT Vol. 5 No. 2 January – June 2017 ISSN No. 2278-9316
(5)
4.6 Study Period
The present study covers data of 5 years period starting
from financial year 2012-13 to 2016-17.
4.7 Scope and Limitations of Study
The present study covers trend of NPA’s of Public and
Private Sector banks in India for 5 years.
Data for public sector banks excludes Regional Rural
Banks.
5. Data Analysis
The data is presented in suitable tabular form which
includes Gross Advances, Gross NPA’s, Net Advances, Net
NPA, Asset Classification, Sectorial classification of NPA’s and
Net profit. Statistical measures like standard deviation,
co-variance and correlation are used for analyzing data.
Hypothesis is tested by using t-test.
Table 5.1: Gross Advances and Gross Non-Performing Assets of Public and Private Sector Banks
(Amount in `̀̀̀ Million)
Public Sector Banks Private Sector Banks Year
Gross Advances GNPA GNPA (%) Gross Advances GNPA GNPA (%)
2016-17 58663733.85 6847323.08 11.67 22667206.86 919146.47 4.05
2015-16 58219510.87 5399563.35 9.27 19726588.17 558531.2 2.83
2014-15 56167174.8 2784679.8 4.96 16073393.6 336903.5 2.10
2013-14 52159196.5 2272639.1 4.36 13602527.7 241835 1.78
2012-13 45601686.02 1644615.64 3.61 11512463.4 203816.72 1.77
Mean 54162260.41 3789764.19 6.77 16716435.95 452046.58 2.51
SD 5432309.02 2227871.47 3.51 4518405.39 295205.94 0.97
CV 0.10 0.59 0.52 0.27 0.65 0.39
r 0.82 0.96
(Source: RBI, Statistical Tables Relating to Banks in India, 2013-2017.)
Table 5.1 shows that, Gross NPA's percentage of Public
Sector Banks are rise from 3.61% to 11.67% over the period
of 2012-13 to 2016-17, whereas the same in Private Sector
Banks are increased from 1.77% to 4.05%. As compare to
Private Sector Banks there is stiff increase in Gross NPA's of
Public Sector Banks. It is seen from standard deviation and
coefficient of variation that Public Sector Banks are less
consistence and highly exposed to risk in maintaining Gross
NPA as compare to Private Sector Banks. The correlation
coefficient of Public Sector Banks and Private Sector Banks
are showing strong correlation i.e. 0.82 and 0.96 respectively
between Gross NPA and gross advances.
Table 5.2: Net Non-Performing Assets of Public and Private Sector Banks
(Amount in `̀̀̀ Billion)
Public Sector Banks Private Sector Banks Year
Net Advances NNPA NNPA (%) Net Advances NNPA NNPA (%)
2016-17 55520.14 3830.89 6.90 21718.18 477.8 2.20
2015-16 55935.77 3203.76 5.73 19393.39 266.77 1.38
2014-15 54762.5 1599.51 2.92 15843.12 141.28 0.89
2013-14 51011.37 1303.62 2.56 13429.35 88.62 0.66
2012-13 44728.45 899.52 2.01 11432.48 79.94 0.70
Mean 52391.65 2167.46 4.02 16363.30 210.88 1.17
SD 4706.35 1276.46 2.16 4214.49 166.81 0.64
CV 0.09 0.59 0.54 0.26 0.79 0.55
r 0.77 0.94
(Source: RBI, Statistical Tables Relating to Banks in India, 2013-2017, RBI, Handbook of Statistic on the Indian Economy)
Public Sector Banks witnessed high growth in Net NPA's
in last five years, overall Net NPA's increased by 4.89% from
2012-13 to 2016-17. At a same time Private Sector Banks
shown increasing trend in Net NPA's but it is comparatively
less than Public Sector Banks. Net NPA's of Private Sector
Banks stood at 2.20% of Net Advances for the year ending
2016-17. Private Sector Banks looks professional in managing
their non-performing assets. There is strong positive
correlation coefficient between Net NPA and Net Advances of
Public Sector Banks and Private Sector Banks.
JOMAT Vol. 5 No.2 January – June 2017 ISSN No. 2278-9316
(6)
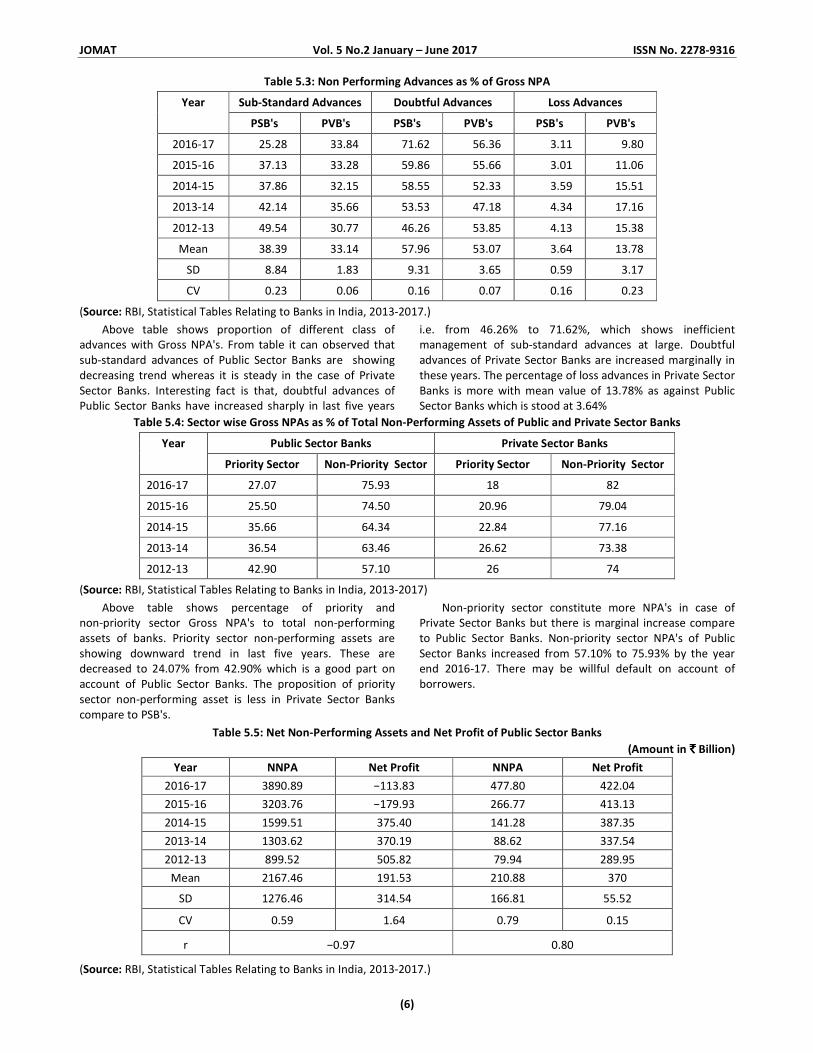
Table 5.3: Non Performing Advances as % of Gross NPA
Sub-Standard Advances Doubtful Advances Loss Advances Year
PSB's PVB's PSB's PVB's PSB's PVB's
2016-17 25.28 33.84 71.62 56.36 3.11 9.80
2015-16 37.13 33.28 59.86 55.66 3.01 11.06
2014-15 37.86 32.15 58.55 52.33 3.59 15.51
2013-14 42.14 35.66 53.53 47.18 4.34 17.16
2012-13 49.54 30.77 46.26 53.85 4.13 15.38
Mean 38.39 33.14 57.96 53.07 3.64 13.78
SD 8.84 1.83 9.31 3.65 0.59 3.17
CV 0.23 0.06 0.16 0.07 0.16 0.23
(Source: RBI, Statistical Tables Relating to Banks in India, 2013-2017.)
Above table shows proportion of different class of
advances with Gross NPA's. From table it can observed that
sub-standard advances of Public Sector Banks are showing
decreasing trend whereas it is steady in the case of Private
Sector Banks. Interesting fact is that, doubtful advances of
Public Sector Banks have increased sharply in last five years
i.e. from 46.26% to 71.62%, which shows inefficient
management of sub-standard advances at large. Doubtful
advances of Private Sector Banks are increased marginally in
these years. The percentage of loss advances in Private Sector
Banks is more with mean value of 13.78% as against Public
Sector Banks which is stood at 3.64%
Table 5.4: Sector wise Gross NPAs as % of Total Non-Performing Assets of Public and Private Sector Banks
Public Sector Banks Private Sector Banks Year
Priority Sector Non-Priority Sector Priority Sector Non-Priority Sector
2016-17 27.07 75.93 18 82
2015-16 25.50 74.50 20.96 79.04
2014-15 35.66 64.34 22.84 77.16
2013-14 36.54 63.46 26.62 73.38
2012-13 42.90 57.10 26 74
(Source: RBI, Statistical Tables Relating to Banks in India, 2013-2017)
Above table shows percentage of priority and
non-priority sector Gross NPA's to total non-performing
assets of banks. Priority sector non-performing assets are
showing downward trend in last five years. These are
decreased to 24.07% from 42.90% which is a good part on
account of Public Sector Banks. The proposition of priority
sector non-performing asset is less in Private Sector Banks
compare to PSB's.
Non-priority sector constitute more NPA's in case of
Private Sector Banks but there is marginal increase compare
to Public Sector Banks. Non-priority sector NPA's of Public
Sector Banks increased from 57.10% to 75.93% by the year
end 2016-17. There may be willful default on account of
borrowers.
Table 5.5: Net Non-Performing Assets and Net Profit of Public Sector Banks
(Amount in `̀̀̀ Billion)
Year NNPA Net Profit NNPA Net Profit
2016-17 3890.89 −113.83 477.80 422.04
2015-16 3203.76 −179.93 266.77 413.13
2014-15 1599.51 375.40 141.28 387.35
2013-14 1303.62 370.19 88.62 337.54
2012-13 899.52 505.82 79.94 289.95
Mean 2167.46 191.53 210.88 370
SD 1276.46 314.54 166.81 55.52
CV 0.59 1.64 0.79 0.15
r −0.97 0.80
(Source: RBI, Statistical Tables Relating to Banks in India, 2013-2017.)

JOMAT Vol. 5 No.2 January – June 2017 ISSN No. 2278-9316
(7)
From the above table we can see that there is loss for
Public Sector Banks in two consecutive year i.e. 2015-16 and
2016-17. Net profit of Public Sector Banks has decreased on
account of increase in Net NPA. Though Private Sector Banks
are earning net profit but if we analyse it critically we can see
that the Net NPA of these banks has also increased over the
years.
Correlation coefficient between Net NPA and Net Profit
of Public Sector Banks is showing strong negative relation
which means Net Profit is decreasing with increasing Net
NPA's of banks. In case of Private Sector Banks correlation if
positive means Net NPA are increasing with increased Net
Profit.
(6) Hypothesis Testing:
Two tailed t- test is used to test the hypothesis. Test is
performed in both cases i.e. between Net NPA and Net profit
of Public Sector Banks and Net NPA and Net profit of Private
Sector Banks.
(a) (Ha0): There is no significant correlation between Net NPA’s and Net Profit of Public Sector Banks during study period.
Net NPA Net Profit
Mean 2167.46 191.53
Variance 1629343.91 98933.26
t-stat 3.3608
P(T<=t) two tail 0.02828
t critical two tail 2.7764
(Source: Researchers Computation)
Calculated value (3.3608) is more than table value
(2.7764) at 0.05 significant level results in rejecting
hypothesis and we can say that there is significant relation of
Net NPA and Net Profit of Public Sector Banks. As we can
observe that there is decrease in net profit as increase in Net
NPA' s of Public Sector Banks, which shows NPA's are
declining the profitability of Public Sector Banks.
(b) (Hb0): There is no significant correlation between Net NPA’s and Net Profit of Private Sector Banks during study period.
Net NPA Net Profit
Mean 210.882 370.002
Variance 27826.73 3082.75
t-stat -2.0238
P(T<=t) two tail 0.09889
t critical two tail 2.5706
(Source: Researchers Computation)
Calculated value (-2.0237) is less than table value
(2.5705) at 0.05 significant level results in accepting
hypothesis and we can say that there is no significant
relation of Net NPA and Net Profit of Private Sector Banks. It
can observe that the net profit of Private Sector Banks is
increasing along with increase in Net NPA's.
7. Findings:
The study observed that, the Gross NPA's of Public Sector
banks have increased to great extent as compared to Private
Sector Banks over the period of 2012-13 to 2016-17. Similar
trend can be observed in case of Net NPA's. NPA's of both
type of banks have increased along with the increase in
advances of the banks.
The proportion of doubtful advances in overall non-
performing asset is more in case of Public Sector Banks as
compare to Private Sector Banks. Interesting fact is that the
proportion of loss advances in overall NPA is higher in Private
Sector Banks compare to Public Sector Banks.
Non-priority sector holding more NPA's as compare to
priority sector in total non-performing assets in both types of
bank. Public Sector Banks non-priority sector NPA's have
increased over the years but it shows steady position in case
of Private Sector Banks.
It is also observed that the non-performing assets are
deteriorating the profitability of Public Sector Banks are large.
Even in recent years Public Sector Banks have suffered losses
on account of increase in NPA level at high rate.
8. Suggestions:
Banks have to give more focus upon reducing the NPA
level by taking corrective actions on time which may include -
Intensive care at the time of sanctioning new loan by
analyzing past records of the borrowers related to financial
matters, performance of companies in case of corporate
sector advances.
Banks have to set up an effective mechanism to identify
the reasons behind converting of standard advances in to
sub-standard advances or sub-standard advances in to
doubtful or loss advances.
As non-priority sector is major contributor in overall non-
performing assets of the banks hence banks have to find out
the reasons behind it. At a same time efficient post sanction
credit monitoring system will help the banks to reduce the
NPA's in non-priority sector.
Banks can use different recovery channels effectively like
Lok Adalat, Debts Recovery Tribunals (DRT's), SARFAESI Act to
recover loans from default borrowers. Even banks could take
corrective actions under Insolvency and Bankruptcy Code
(IBC), 2016 to recover bad loans from corporate borrowers.
9. Conclusion:
One of the important condition in improving financial
health of the banks is to reduce the level of NPA. Non-
performing assets are not only degrading the asset quality of
the banks but also it causing the economy of the country.
JOMAT Vol. 5 No. 2 January – June 2017 ISSN No. 2278-9316
(8)
Common people have undisputed faith in banks hence it is
the prime responsibility of the banks that they should
maintain it by taking appropriate steps in bringing down the
level of NPA.
The rising level of NPA in Public Sector Banks is getting
attention of everyone, hence they have to take corrective
steps to reduce it. The role of Government is also significant
in entire process of NPA management of Public Sector Banks.
Though Government is providing action plan to fight with
NPA but still there is scope to do more. Ultimately it is
combined and continual efforts of Government, banks and
the borrowers to reduce the level of Non-performing assets.
10. References:
• Patel, U. (2017), “Resolution of Stressed Assets: Towards the Endgame”, Inaugural Session of the “National Conference on
Insolvency and Bankruptcy: Changing Paradigm”. Mumbai, August 19, 2017.
[https://www.rbi.org.in/scripts/BS_SpeechesView.aspx?Id=1044]
• Reserve Bank of India, Trend and Progress of Banking in India, various issues (2012-13 to 2016-17).
• RBI Master Circular - Prudential norms on Income Recognition, Asset Classification and Provisioning pertaining to Advances,
July 2014. [https://rbi.org.in/Scripts/BS_ViewMasCirculardetails.aspx?id=9009]
• Dr. Miyan, M. (2017), “A Comparative Statistical Approach towards NPA of PSU and Private Sector Banks in India”,
International Journal of Advanced Research in Computer Science, Vol. 8(1), Jan-Feb 2017.
[http://dx.doi.org/10.26483/ijarcs.v8i1.2850]
• Sagar, A. (2016), “Rising Non-Performing Assets in India Genuine Business Failure?”, Research Journal of Management
Science, Vol. 5(7), 12-14 July, 2016. [http://www.isca.in/IJMS/Archive/v5/i7/3.ISCA-RJMS-2016-051.pdf]
• Dr. Sailaja, V.N. & Dr. N. Bindu Madhavi (2016), “A Comparative Study on NPAS in Public Sector and Private Sector Banks in
India”, The International Journal Of Business & Management(ISSN 2321–8916), Vol. 4(4), April 2016.
[http://www.theijbm.com/wp-content/uploads/2016/04/17.-BM1603-097.pdf]
• Shri Gandhi, R. Deputy Governor, Reserve Bank of India, speech at the The Economic Times ReModel in India – Asset
Reconstruction & NPA Management Summit, Mumbai, RBI Bulletin October 2015.
[https://www.rbi.org.in/scripts/BS_ViewBulletin.aspx?Id=15837]
• Sharma, D. (2015), “An Analysis of Assets Quality of Nationalised Banks”, International Journal of Research in Finance and
Marketing, Volume 5(10), October, 2015. [http://euroasiapub.org/wp-content/uploads/2016/09/11FMOct-2712-1.pdf]
• Preetha.C (2015), “Impact of NPA on Different Sectors- A Comparative Study on Selected Banks”, Intercontinental Journal of
Finance Research Review, Volume 3(8), August 2015. [http://www.icmrr.org/aug_2015/IJFRR/20158204.pdf]
• Dr. S. Rajamohan & Mr. D. Durairaj (2015), “Comparative Analysis of the Non Performing Assets of Banks in India –
Structural Equation Model”, International Journal of Research in Finance and Marketing, Volume 5(3), March 2015.
[http://euroasiapub.org/wp-content/uploads/2016/09/2MarchFM-2030-1.pdf]
• Mondal, R. (2015), “A Study on Non-Performing Assets of Foreign Banks in India”, Scholars Journal of Economics, Business
and Management, 2(7B):768-772, 2015. [http://saspjournals.com/wp-content/uploads/2015/07/SJEBM-27B768-772.pdf]
• Ramakrishna, S. & Kurian, R. (2014), “A Comparative Study of Foreign Banks and Public Sector Banks with reference to Non-
Performing Assets”, Abhinav - National Monthly Refereed Journal of Research In Commerce & Management, Volume III,
February 2014. [https://abhinavjournal.com/journal/index.php/ISSN-2277-1166/article/download/39/pdf_12]
• Srinivas, K. T. (2013), “A Study on Non-Performing Assets of Commercial Banks in India”, Abhinav International Monthly
Refereed Journal of Research In Management & Technology, Volume II December 2013.
[https://www.abhinavjournal.com/images/Management_&_Technology/Dec13/10.pdf]
• Samir & Kamra, D. (2013), “A Comparative Analysis of Non-Performing Assets (NPAs) of Selected Commercial Banks in
India”, Opinion: International Journal of Management, Vol. 3, (1), June 2013.
[http://www.cpmr.org.in/opinion/vol3/issue1/Articles/9.pdf]
• Kaur, K. & Singh, B. (2011). “Non Performing Assets of Public and Private Sector Banks – A Comparative Study, South Asian
Journal of Marketing and Management Research, Vol.1(3), December 2011.
• RBI, Statistical Tables related to Banks in India (2013 to 2017), [https://dbie.rbi.org.in/DBIE/dbie.rbi?site=publications]
���
JOMAT Vol. 5 No.2 January – June 2017 ISSN No. 2278-9316
(9)
A COMPARITIVE STUDY OFPHYSICAL PERFORMANCE OF MUNICIPAL TRANSPORT
UNDERTAKINGS WITH REFERENCE TO MAHARAHSTRA
Jayasri Murali Iyengar
D. B. Bharati
ABSTRACT
In India the road transport undertakings plays a vital role in the economic development. State transport undertaking and
Municipal transport undertaking contribute 51,748.34 crores to GDP and provide employment to 727,990 during 2015-16 (CIRT
Reports).In spite of their contribution, Central and State government ignores these undertakings. They fail to strengthen these
undertakings; hence they suffer from financial and working capital crunch. This gap between demand and supply is grabbed by
Uber and Ola players and increase in the number of vehicles plying on road and lead to traffic congestion. This study is carried
out to understand the physical performance of municipal transport undertaking with reference to Maharashtra.
Key Words: Urban Passenger Transport, Physical performance, PMPML, BEST
INTRODUCTION
Even in this era of ICT transport is the life blood of the
economy which undertakes movement of people and goods.
In fact the Industry, Trade and Commerce need a well laid
foundation of transportation. Hence effective transportation
system is required for economic development.
Of all the types of transport, Passenger transportation
has been commended most important. Passenger Road
transport is a public utility service and it is the duty of a state
welfare to provide economical and comfortable service to
Public.
The following factors are some of the important factors
making this sector an essential sector contributing towards
the growth of the economy.
� It is a public utility service having social obligation
towards welfare of the citizen.
� It is labour intensive sector provides employment
� State Government and Municipal Corporation
generate revenue by means of passenger transport.
� This sector yields good returns on the investment.
� It acts a basis for overall development by
accelerating the economic activities.
� This sector involves huge investment and hence
public private partnership.
The main focus of this study is to analyze and compare
the performance Maharashtra’s Municipal Transport
Undertakings (MTUs) based on physical, financial and
operational parameters.
REVIEW OF LITERATURE
Dr. R.K. Agarwal and Mr. Promod Bhargava in his article
titles “Profitability Analysis of State Transport Undertakings
(A Case study of RSRTC and UPSRTC)” have studied the
operational efficiency of two major STUs on the basis of ratio
analysis and statistical tests.
Mrs. Shilpa M. Trivedi’s in her doctoral thesis “An
Analysis of Financial Performance of State Road Transport
Corporation in Gujarat” has analysed the financial health
from the four perspectives such as Working Capital Analysis,
Financial Structure Analysis, Activity Analysis and Profitability
Analysis.
Parisar Sanrakshan Sanvardhan Sanstha in their report
“Comparison of bus services in Indian cities” compared
PMPML’s performance with bus services from four other
Indian cities: BEST (Mumbai); MTC (Chennai); BMTC
(Bangalore) and DTC (Delhi) to understand where PMPML
stands in relation to other bus systems in India. They
compared the services under three heads: Quality of Service,
Operational Efficiency and Financial Performance.
© SBPIM
Assistant Professor, D. Y. Patil Institute of Management, Ambi
Contact no.: 9890283287 Email Id: [email protected]
Director, Rajgad Institute of Management Research & Development, Pune
Contact no.: 9822186229 Email Id: [email protected]

JOMAT Vol. 5 No.2 January – June 2017 ISSN No. 2278-9316
(10)
NEED OF THE STUDY
Municipal Transport Undertakings are operating with two
conflicting goals of providing outstanding public transport
services for citizens and at the same time to manage financial
viability. In order to meet the financial losses due to
operations, these transport undertakings increases the fare.
Hence they lose their market share to unauthorized private
players and Uber and Ola in the market. The researcher was
interested to know how these transport undertakings are
performing and whether they are well equipped to face the
challenge of increase of 15% increase in every annum(India
Transport Moving India to 2032, 2014)
OBJECTIVES OF THE STUDY
• To know the parameters of Physical Performance of
Municipal Transport Undertakings.
• To evaluate the Physical performance of Municipal
Transport Undertakings.
HYPOTHESIS
Ho: There is no significance difference in the Physical
performance of Municipal Transport Undertakings within
Maharashtra.
H1: There is significance difference in the Physical
performance of Municipal Transport Undertakings within
Maharashtra.
RESEARCH METHODOLOGY
The paper is purely based on the secondary data were
collected from CIRTi ‘s State Transport Undertakings Profile
reports and the physical performance reports from
www.data.gov.in.
SCOPE OF THE STUDY
Current list of Municipal undertakings in Maharashtra as
31-03-2015.
1. Brihan Mumbai Electric Supply and Transport
Undertaking (BEST) − 4247 buses.
2. Pune Mahanagar Parivahan Limited (PMPL) − 2087
buses.
3. Thane Municipal Transport Undertaking (TMTU) –
328 Buses.
4. Kolhapur Municipal Transport Undertaking (KMTU).
5. Navi Mumbai Municipal Transport (NMMT) – 360
buses.
6. Solapur Municipal Transport Undertaking (SMTU) −
183 buses.
The scope of the study will pertain to analyze the physical
performance of the transport undertakings for five years
ranging from assessment years 2010-11, 2011-12, 2012-13,
2013-14 and 2014-15. Moreover Solapur and Kolhapur
Municipal Transport Undertaking (SMTU) are not taken into
consideration due to non-availability of data.
DATA ANALYSIS AND INTERPRETATION
Table 1: Descriptive Statistics of Fleet Utilization
Sr.
No.
Name of (MTU) 2010-11 2011-12 2012-13 2013-14 2014-15 Mean S.D
1. BEST 87.75 84.02 89.20 87.00 85.61 86.72 1.99
2. NMMT 55.85 71.43 66.67 62.36 67.50 64.76 5.93
3. PMPML 79.02 72.40 68.45 70.34 65.36 71.11 5.12
4. TMTU 60.11 60.62 67.45 65.07 58.54 62.36 3.74

JOMAT Vol. 5 No.2 January – June 2017 ISSN No. 2278-9316
(11)
Graph I: Fleet Utilization of MTU for the period 2010-15.
Interpretation
All these undertakings need 10-15% buses for workshop,
squad checking etc. But other than BEST, other undertakings
are not utilizing the optimum utilization of buses. Situation in
other transport is alarming. Fleet utilization ratio got
decreased during 2014-15 than all the years, this depicts that
maintenance department is not functioning as per the
standard. In PMPML due to the negative working capital, they
can invest much money on spares. Since payment is delayed
supplier do not supply the spares in the required time. BEST is
more consistent than other transport undertakings.
Table No 2 : Descriptive Statistics of Average Age Profile of fleet in Years
Sr. No. Name of (MTU) 2010-11 2011-12 2012-13 2013-14 2014-15 Mean S.D
1. BEST 6.1 6.1 6.6 7.55 8.36 6.95 0.98
2. NMMT 5.6 4.76 5.86 5.3 5 5.30 0.44
3. PMPML 7.3 7.3 7.2 8 8 7.6 0.4
4. TMTU 4.68 4.5 5.65 5.07 5.09 5.00 0.44
Graph 2: Average Age Profile of fleet in Years of MTU for the period 2010-15.
Table 3: Descriptive Statistics of Over aged bus in % MTU for the period 2010-15
Sr. No. Name of (MTU) 2010-11 2011-12 2012-13 2013-14 2014-15 Mean S.D
1. BEST 0 0 0 0 0 0 0
2. NMMT 26 7.4 7.44 12.20 4.16 11.11 3.86
3. PMPML 2.9 0 0 0 0 0.58 0.58
4. TMMT 0 0 0 0 0 0 0
Interpretation:
Standard Average age of fleet should be less than or equal to 8. It implies that average ages of the fleets are within the limit.
Moreover over aged buses of three undertakings are within the limit expect NMMT.

JOMAT Vol. 5 No.2 January – June 2017 ISSN No. 2278-9316
(12)
Table 4: Descriptive Statistics of Staff Bus Ratio
Sr. No. Name of (MTU) 2010-11 2011-12 2012-13 2013-14 2014-15 Mean S.D
1. BEST 6.49 7.57 8.6 8.4594 8.4071 7.91 0.89
2. NMMT 5.17 8.18 7.88 6.2303 6.9194 6.88 1.23
3. PMPML 6.31 5.9 5.94 5.685 4.8807 5.74 0.53
4. TMTU 7.07 12.14 12.04 7.3291 6.8598 9.09 2.75
Graph 3: Staff Bus Ratio of MTU for the period 2010-15.
Interpretation:
PMPML was having lowest staff bus ratio followed by NMMT. BEST ranks 3rd
position followed by TMTU, whose staff bus
ratio is the highest.
Table 5: Descriptive Statistics of Staff Productivity
Sr. No. Name of (MTU) 2010-11 2011-12 2012-13 2013-14 2014-15 Mean S.D
1. BEST 23.74 19.77 19.84 19.1496 18.7093 20.24 2.01
2. NMMT 26.48 26.52 26.44 28.609 27.0046 27.01 0.92
3. PMPML 28.91 28.46 26.6 28.7111 30.8433 28.70 1.51
4. TMTU 16.16 16.55 16.55 16.8516 15.3145 16.29 0.60
Graph 4: Staff Productivity of MTU for the period 2010-15.
Interpretation PMPL ranks no 1 in staff productivity followed by NMMT. BEST ranks 3 and TMTU ranks 4. This also matches
the staff bus ratio.
Table 5: Descriptive Statistics of Occupancy Ratio in %
Sr. No. Name of (MTU) 2010-11 2011-12 2012-13 2013-14 2014-15 Mean S.D
1. BEST 69.9 72.45 65.39 58.47 56.37 64.52 6.99
2. NMMT 84 NA NA 73.70 75.99 77.90 5.41
3. PMPML 56.2 62.4 75.1 74.64 76.29 68.93 9.08
4. TMTU 73.51 77.09 73.42 58.37 58.78 68.23 8.94

JOMAT Vol. 5 No.2 January – June 2017 ISSN No. 2278-9316
(13)
Graph 4 : Occupancy ratio in % of MTU for the period 2010-15.
Interpretation:
PMPML ranks no 1 in occupancy followed by NMMT. TMTU ranks 3 and BEST ranks 4. This implies that BEST is poor in
occupancy when compared to other undertakings.
Table 6: Descriptive Statistics of Passenger carried in Lakhs
Sr.
No.
Name of Municipal Transport
Undertaking (MTU)
2010-11 2011-12 2012-13 2013-14 2014-15 Mean S.D
1. BEST 15352 14395 14096 13068 12216 13825.4 1213.67
2. NMMT 812.03 856.25 857.54 746 801 814.564 46.0328
3. PMPML 4499.68 4496.98 4351.96 4248.94 4443.57 4408.23 107.271
4. TMTU 808.5 887.98 878.44 734.42 625.75 787.018 109.301
Graph 5 : No of Passengers carried in Lakhs for the period 2010-15.
Interpretation:
BEST ranks no 1 Total number of passengers carried
followed by PMPML. NMMT ranks 3 and TMTU ranks 4.
FINDINGS AND CONCLUSION:
BEST undertaking is the best than others in fleet
utilization and scrapping the old buses and in the total
number of passengers carried. PMPML position is best than
others in Staff bus ratio and Man power productivity. There is
lot of scope of improvement for other transport
undertakings. Thus physical performance comparison helps to
gauge the productivity. Physical performance cannot only
give overall picture of performance. These undertaking can
also compared based on the financial as well as operational
and utility parameters.

JOMAT Vol. 5 No.2 January – June 2017 ISSN No. 2278-9316
(14)
Reference
1. Mr. Bagade M.V. “A new look at Performance Appraisal of STU’s ", JTM, April 1986, Pune, CIRT, pg 15-20. Mr. G. John
Gunaseelam’s Public Sector Road Transport Corporation a comparative study with Private Sector, Deep and Deep
Publication page No 1-25.
2. Dr. R.K. Agarwal and Mr. Promod Bhargava “Profitability Analysis of State Transport Undertakings (A Case study of RSRTC
and UPSRTC)” in Indian Journal of Transport Management July – Sep 2010 issue page no. 180 -196.
3. Mrs. Shilpa M. Trivedi’s Doctoral thesis “An Analysis of financial performance of State Road Transport Corporation in Gujrat”
page no. 80 to 270
4. Parisar Sanrakshan Sanvardhan Sanstha’s report “Comparison of bus services in Indian cities”
5. India Transport Moving India to 2032. New Delhi: Routledge Taylor and Francis Group, 2014.
i CIRT – Central Institute of Road Technology Pune.

JOMAT Vol. 5 No.2 January – June 2017 ISSN No. 2278-9316
(15)
A STUDY OF IMPACT OF MERGERS AND ACQUISITIONS ON THE
FINANCIAL PERFORMANCE OF SUN PHARMACEUTICAL INDUSTRY LTD. INDIA.
Lakshmi Jasti 1
Dr. Hansraj D Thorat2
ABSTRACT
Merger and Acquisition is a key part of corporate growth strategy. MandA is a tool used by companies for the purpose of
expanding their operations often aiming at an increase of their profitability. This paper aims to examine the impact of mergers
and acquisitions on the financial performance in Sun pharmaceutical industry. The merger and acquisition for the year 2013-2017
have been taken for the analysis. The analysis was done using the data of two years before and after mergers and acquisitions
with the help of paired sample t-test. Pre and post-mergers and acquisitions financial ratios have been examined by using paired
sample t-test. The result shows that there is a significant impact on.
Keywords: Mergers and Acquisitions, Financial Performance, Pharmaceutical Industry, India.
Introduction:
The Indian pharmaceuticals market is the third largest in
terms of volume and thirteenth largest in terms of value, as
per a report by Equity Master. India is the largest provider of
generic drugs globally with the Indian generics accounting for
20 per cent of global exports in terms of volume. The Indian
pharmaceutical industry ranks 13th in the world by value of
pharmaceutical products and is highly fragmented, currently
having more than 20,000 registered companies. India enjoys
an important position in the global pharmaceuticals sector.
The country also has a large pool of scientists and engineers
who have the potential to steer the industry ahead to an
even higher level. The Indian pharma industry, which is
expected to grow over 15 per cent per annum between 2015
and 2020, will outperform the global pharma industry, which
is set to grow at an annual rate of 5 per cent between the
same periods. The market is expected to grow to US$ 55
billion by 2020, thereby emerging as the sixth largest
pharmaceutical market globally by absolute size. The Indian
domestic pharmaceutical players enjoy certain advantages
which attract MandA in the country: Lower cost of
operations, RandD and capital expenditure, proven track
record in bulk drug and formulation patents, strong domestic
support in production, from raw material requirements to
finished goods, and an attractive Indian market.
The merger of Ranbaxy and Sun pharma led to the
emergence of one of the biggest pharma companies in India.
The deal valued at US$4 billion is also one of the biggest
Merger and Acquisition transactions in India. The transaction
was completed on 25 March 2015almost one year post its
announcement in April 2014. As is the case with most high-
value transactions, the transaction had to overcome various
hurdles as it came under the scanner of various legal and
regulatory authorities in India and overseas and required
approvals from these authorities to proceed with the
transaction.
The primary motive for this acquisition by SunPharma
was penetration into new markets and increasing the product
portfolio of the company as both Ranbaxy and SunPharma
complimented each other in areas of expertise – SunPharma
was globally recognized as a major specialist pharma
company while Ranbaxy was known for its global presence in
the generic segment. A combined Sun Pharma and Ranbaxy
were slated to have a diverse, highly complementary
portfolio of specialty and the generic products marketed
globally.
Merger and acquisition are global phenomena which
many organizations employed to grow internally, by
expanding its operations both globally and domestically.
© SBPIM 1Research Scholar - S. B. Patil Institute of Management, Nigdi, Pune 411044
Contact no.: 9960621266 Email Id: [email protected] 2Head Research, PCET’s S. B. Patil Institute of Management
Contact no.: 9822214776 Email Id: [email protected]

JOMAT Vol. 5 No.2 January – June 2017 ISSN No. 2278-9316
(16)
Mergers and acquisitions (MandA) are transactions in
which the ownership of companies, other business
organizations or their operating units are transferred or
combined. A merger is a legal consolidation of two entities
into one entity, whereas an acquisition occurs when one
entity takes ownership of another entity's stock, equity
interests or assets.
Financial Performance:
Financial performance is a subjective measure of how
well a firm can use assets from its primary mode of business
and generate revenues. This term is also used as a general
measure of a firm's overall financial health over a given
period of time, and can be used to compare similar firms
across the same industry or to compare industries
or sectors in aggregation.
Growth of Pharmaceutical Industry in India:

JOMAT Vol. 5 No.2 January – June 2017 ISSN No. 2278-9316
(17)
OBJECTIVES OF THE STUDY:
1. To study and understand the effect of Mergers and
Acquisitions on the financial performance of the
company.
2. To analyze the liquidity positions of sun
pharmaceutical industry.
3. To measure the profitability positions of sun
pharmaceutical industry.
HYPOTHESES:
H0: There is no significant difference between the
liquidity positions of the companies before and after the
mergers and acquisitions.
H1: There is a significant difference between the liquidity
positions of the companies before and after the mergers
and acquisitions.
H0: There is no significant difference between the
profitability positions of the companies before and after
the mergers and acquisitions.
H1: There is a significant difference between the
profitability positions of the companies before and after
the mergers and acquisitions.
RESEARCH METHODOLOGY:
Descriptive Research Design is used in the present study.
The researcher collected the secondary data from various
annual reports of money control, Journals, magazines, books,
Ph.D. thesis, M.Phil. Dissertation and websites. The study is
mainly focused to evaluate the financial performance of
merger and acquisition of companies two years before and
two years after mergers. In order to evaluate the financial
performance various ratios has been calculated and to
measure the impact of merger and acquisition on the liquidity
position and profitability position of sun pharmaceutical
industry Ltd, paired t-test is used.
Literature Review: To gain an insight about the impact of
mergers and acquisitions on the financial performance of
pharmaceutical industry in India and an extensive review of
literature has been carried out to formulate the research
problem.
(DEWAN), The main objective of this study is to evaluate
the post-merger financial performance of the acquirer
companies in India. The researcher had considered merger
cases for the year 2003 for the analysis. The financial data has
been collected for six years from 2000-06.
• By using paired sample t-test Pre-merger and post-
merger financial ratios have been examined. The
results show that there is a significant difference
between the financial performance of the companies
before and after the merger.
(PAWASKAR, 2001) examined the impact of mergers on
corporate performance. The sample of 36 cases is considered
in the year 1992-1995.It shows that there are no significant
differences in the financial characteristics of the two firms
involved in merger.
(MISHRA and TAMAL CHANDRA, 2010) shed some light
on the profitability of a firm depends directly on its size,
selling efforts and exports and imports intensities but
inversely on their market share and demand for the products.
However, MandA do not have any significant impact on
profitability of the firms in the long run possibly due to the
resultant X-inefficiency and entry of new firms into the
market.
(SINHA and DR. K. P. KAUSHIK, 2010) identified the
impact of mergers and acquisitions on the financial efficiency
of the selected financial institutions in India. The analysis was
conducted on 2 stages.
• By using nonparametric Wilcoxon signed rank test
the researcher examine changes in the efficiency of
the companies during the pre and post-merger
periods. There is a significant change in the earnings
of the shareholders. There is no significant change in
liquidity position of the firms.
• By using the ratio analysis approach, the researcher
calculated the change in the position of the
companies during the period 2000-2008.
(V and SATYANARAYAN, 2013) examined the
comparative difference between pre and post-merger and
acquisition in terms of financial analysis. The sample of ten
major companies was taken from a list of merger and
acquisition in india-2010.The results indicated that there is a
significant positive value creation to the acquired firms. The
profitability position of the companies has positively
increased in terms of return on capital employed, return on
long term funds, and return on assets and it declines in terms
of return on net worth. the financial performance of the firms
improved after merger in terms of current ratio, liquidity
ratio, ROCE, ROA, return on long term funds but most of the
ratios are statistically insignificant, there is a need to further
study on the motive behind the merger and acquisition.
(Dr. K. B. SINGH, 2013) studied a sample of 20 pair of
public listed companies which have undergone MandA during
2005 were taken for analysis. Averages of the financial ratios
calculated for the data of three years prior to (Pre-merger)
and three year subsequent to the merger (Post-merger).
These ratios were compared and tested for any statistical
significant difference, using paired ‘t’ test. The study found
that there was a long-term improvement in the financial

JOMAT Vol. 5 No.2 January – June 2017 ISSN No. 2278-9316
(18)
performance of merging companies. Thus we conclude that
mergers and acquisitions is an effective methods of corporate
restructuring, and should become an integral part of the long-
term business strategy of corporates in India. An analysis of
pre- and post-merger operating performance ratios of
mergers shows that while there was significant increase in
the mean operating profit margin, net profit margin ratios,
return on net worth and return on capital employed after the
merger.
Results and Discussions:
Liquidity Ratio Pre-Merger
(2 years before mean)
Post-Merger
(2 years after mean)
P-value (2-tailed)
Current Ratio 0.59 2.38 0.32
Quick Ratio 0.37 1.88 0.29
Cash Turnover 45.97 12.82 0.12
Profitability Ratio Pre-Merger
(2 years before mean)
Post-Merger
(2 years after mean)
P-value
(2-tailed)
Gross Profit 3.09 −31.98 0.69
Net Profit −7.28 −39.38 0.72
Operational Profit −2.68 −35.55 12.71
The difference between pre-merger and post-merger is tested statistically by using the paired t-test. The value of two tail
significance is 0.32 is greater than .05(p>.05), as such the
difference between the means is not significant. The test
output indicates that there is a significant difference between
the liquidity positions of the companies before and after the
mergers and acquisitions.
The difference between pre-merger and post-merger is
tested statistically by using the paired t-test. The value of two
tail significance is 0.7 is greater than .05(p>.05), as such the
difference between the means is not significant. The test
output indicates that there is a significant difference between
the profitability positions of the companies before and after
the mergers and acquisitions.
CONCLUSION:
The study was done to measure the impact of mergers
and acquisition on the financial performance of sun
pharmaceutical industry in terms of liquidity positions and
profitability positions. The result has proved that companies
succeeded to perform well after mergers and acquisitions in
terms of liquidity positions and profitability positions.
References:
1. DEWAN, M. (n.d.). Effect of Mergers and Acquisitions on Operating Performance: A Study of Acquiring Firms in India.
2. Dr. K. B. Singh. (2013). The impact of Mergers and acquisitions on corporate financial performance in India. Indian Journal of
Research in Management, Business and Social Sciences.
3. MISHRA, P., and TAMAL CHANDRA. (2010). Mergers, Acquisitions and Firm's Performance:Experience of Indian
Pharmaceutical industry. Eurasian Journal of Business and Economics.
4. PAWASKAR, V. (2001, JANUARY). Effect of Mergers on Corporate Performance in India. VIKALPA, 26(1).
5. SINHA, D., and DR.K.P.KAUSHIK. (2010, NOVEMBER). Measuring Post Merger and Acquisition Performance: An Investigation
of select financial sector organizations in India. INTERNATIONAL ECONOMICS, 2.
6. V, M. K., and SATYANARAYAN. (2013, MARCH). Comparative Study of Pre and Post Corporate Integration through Mergers
and Acquisition. INTERNATIONALJOURNAL OF BUSINESS AND MANAGEMENT INVENTION, 2(3).
7. https://blog.ipleaders.in/top-ten-acquisitions-in-the-pharmaceutical-sector-in-india/
8. http://www.edupristine.com/blog/mergers-acquisitions
9. https://www.ibef.org/industry/pharmaceutical-india.aspx
10. https://www.globallegalinsights.com/practice-areas/mergers-and-acquisitions/global-legal-insights---mergers-and-
acquisitions-6th-ed./india
11. http://www.economywatch.com/mergers-acquisitions/india.html
12. https://www.investopedia.com/articles/investing/022415/worlds-top-10-economies.asp
13. http://www.ipekpp.com/admin/upload_files/Knowledge_2_39_Impact_2575324832.pdf
14. https://www.ibef.org/industry/pharmaceutical-india/infographic
���

JOMAT Vol. 5 No. 2 January – June 2017 ISSN No. 2278-9316
(19)
CORPORATE SOCIAL RESPONSIBILITY: EVIDENCE FROM BANKS IN INDIA
Mr. Sushant Panda,
ABSTRACT:
Corporate Social Responsibility is no longer just a term or a fad. It is about a company assuming its responsibilities to pursue
goals of profit maximization as well as understanding its responsibility towards its stakeholders. CSR is about affecting the
community, environment and economy in a very positive manner. The banking sector is the major contributor to the economy of
any country and the performance of the economy can be measured on the basis of the growth in these banks. Many Indian Banks
are involved in providing CSR activities to the society they operate in. The various kinds of services they participate in are majorly
in education, healthcare, skill development, sanitation services, disaster relief, environmental protection etc.
5 banks were selected for the study. This paper mainly focuses on activities that the Banks have undertaken in the current
era.
Keywords: Corporate Social Responsibility, Banks, CSR Practices, Banking Sector, CSR Reporting.
Introduction:
Corporate Social Responsibility (CSR): A new way of life
The United Nations Industrial Development Organisation
(UNIDO) has defined corporate social responsibility (CSR) as,
“a management concept whereby companies integrate social
and environmental concerns in their business operations and
interactions with their stakeholders. CSR is a way in which
companies achieve a balance of economic, environmental
and social imperatives.”
CSR is concerned with treating the stakeholders of the
firm ethically or in a Stakeholder responsible manner.
‘Ethically or Social responsible’ means treating stakeholders
in Economic a manner deemed acceptable in civilized
societies. Social includes economic responsibility.
Stakeholders exist both within a firm and outside. The wider
aim of social responsibility is to create higher and higher
standards of living, while preserving the profitability of the
corporation, for peoples both within and outside the
corporation (Hopkins, 2003)
CSR is defined as the notion that corporations have an
obligation to Stakeholder constituent groups in society other
than stockholders and beyond that prescribed by law or
union contract, indicating that a stake may go beyond mere
ownership (Jones, 1980)
The World Business Council defines Corporate social
responsibility as, “Corporate social responsibility is the
continuing commitment by business to behave ethically and
contribute to economic development while improving the
quality of life of the workforce and their families as well as of
the local community and society at large.’’
Banks and Corporate Social Responsibility:
A study by agricultural and rural lender Nabard shows
that private sector banks lent an aggregate of about ` 4,000
crore directly to the bottom of the pyramid through self-help
groups and indirectly through micro finance institutions. They
lent a little over ` 7,000 crore in FY15. But a little less than 2%
of these loans turned bad during the year, the study states. A
report. – (ET Jan 6, 2016 p 16).
Under the Companies act, it is mandatory for companies
with a turnover of 500 crore and above to spend at least 2%
of its average net profit for CSR activities. Very few
companies were able to meet the requirements. An article in
the Economic Times on 30 Sept, 2015 states that only 14 Nifty
companies managed to spend the mandatory 2% of their
profits on CSR activities. The bottom 5 spenders as per the
table below were Hero MotoCorp who spent only 0.1% of its
net profit, PNB who spent only 0.12% of its net profit, Kotak
Mahindra Bank who spent only 0.6% of its net profit and
Lupin who spent only 0.7% of its net profit.
© SBPIM
Key Client Manager- IT Sales, Konika Minolta
Contact no.: 9011738539 Email Id: [email protected]
JOMAT Vol. 5 No.2 January – June 2017 ISSN No. 2278-9316
(20)
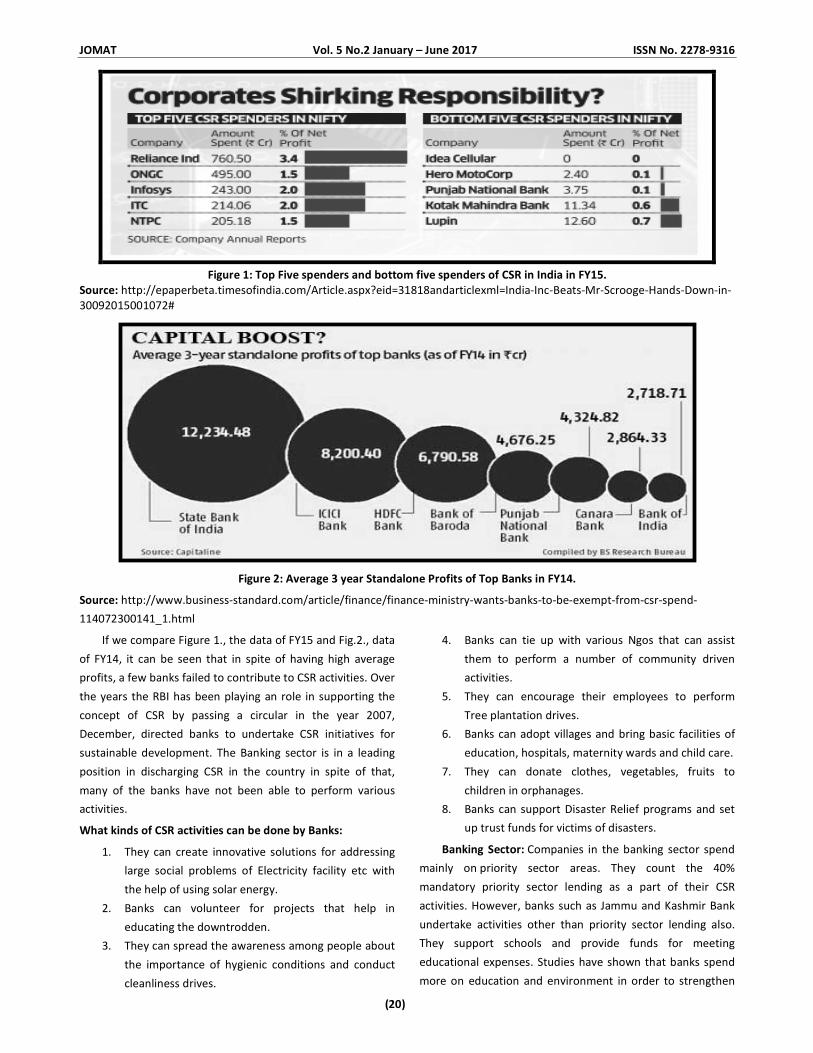
Figure 1: Top Five spenders and bottom five spenders of CSR in India in FY15.
Source: http://epaperbeta.timesofindia.com/Article.aspx?eid=31818andarticlexml=India-Inc-Beats-Mr-Scrooge-Hands-Down-in-
30092015001072#
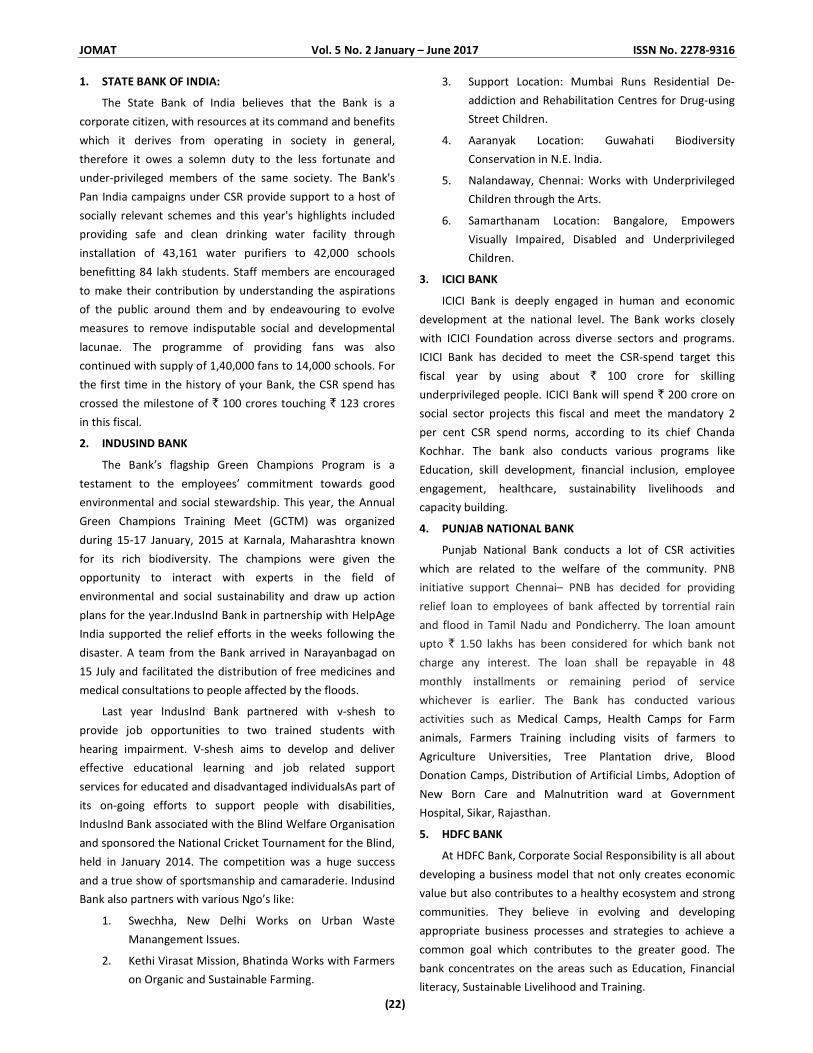
Figure 2: Average 3 year Standalone Profits of Top Banks in FY14.
Source: http://www.business-standard.com/article/finance/finance-ministry-wants-banks-to-be-exempt-from-csr-spend-
114072300141_1.html
If we compare Figure 1., the data of FY15 and Fig.2., data
of FY14, it can be seen that in spite of having high average
profits, a few banks failed to contribute to CSR activities. Over
the years the RBI has been playing an role in supporting the
concept of CSR by passing a circular in the year 2007,
December, directed banks to undertake CSR initiatives for
sustainable development. The Banking sector is in a leading
position in discharging CSR in the country in spite of that,
many of the banks have not been able to perform various
activities.
What kinds of CSR activities can be done by Banks:
1. They can create innovative solutions for addressing
large social problems of Electricity facility etc with
the help of using solar energy.
2. Banks can volunteer for projects that help in
educating the downtrodden.
3. They can spread the awareness among people about
the importance of hygienic conditions and conduct
cleanliness drives.
4. Banks can tie up with various Ngos that can assist
them to perform a number of community driven
activities.
5. They can encourage their employees to perform
Tree plantation drives.
6. Banks can adopt villages and bring basic facilities of
education, hospitals, maternity wards and child care.
7. They can donate clothes, vegetables, fruits to
children in orphanages.
8. Banks can support Disaster Relief programs and set
up trust funds for victims of disasters.
Banking Sector: Companies in the banking sector spend
mainly on priority sector areas. They count the 40%
mandatory priority sector lending as a part of their CSR
activities. However, banks such as Jammu and Kashmir Bank
undertake activities other than priority sector lending also.
They support schools and provide funds for meeting
educational expenses. Studies have shown that banks spend
more on education and environment in order to strengthen

JOMAT Vol. 5 No.2 January – June 2017 ISSN No. 2278-9316
(21)
their image and increase consumer satisfaction (Narwal
2007). Large banks tend to take on more CSR activities to
signal better market performance, while relatively less
profitable or smaller banks may want to increase their CSR
initiatives to build stronger relationships with its stakeholders
(Narwal 2007).
In a content analysis study, it has been found that Indian
banks differ in their CSR orientation with respect to their
ownership structure, number of employees, and date of its
incorporation (Singh and Agarwal 2011). It has been found
that there is a significant difference in orientation in the areas
of environment and rural development (when comparing
banks with respect to ownership), in community welfare and
environment and rural development (when comparing banks
with respect to number of employees), and in environment
and market place (when comparing banks with respect to the
date of incorporation of the bank) (Singh and Agarwal 2011).
Indian banks no longer see CSR as charity, but they see it as a
way of building their image and marketing their products.
Objectives of the present Study:
1. To understand the concept of Corporate Social
Responsibility.
2. To study the major areas of CSR initiatives in Indian
Banking Sector.
3. To focus on the present status of CSR in Banking.
METHODOLOGY
The Research design used in this study is Descriptive in
nature. The Data is collected from secondary sources such as
Websites, newsletters Annual Report, research papers etc.
The banks which have been chosen for the study are State
Bank of India, HDFC Bank, Punjab National bank, ICICI Bank,
Indusind Bank.
Review of Literature:
CSR is about how companies manage the business
process to produce an overall impact on society. More
generally, a distinction has been drawn between CSR seen as
philanthropy as opposed to CSR as a core business activity
(Jones et al., 2007). Wood(1991) suggests that, “The Basic
idea of CSR is that business and society are interwoven rather
than distinct entities.
Caroll (1979) found that the social responsibility of
business encompasses the economic, legal, ethical and
discretionary expectations that society has of organization at
a given point in time. Lea (2002) found that CSR can be
roughly defined as the integration of social and
environmental concerns in the business operations including
dealings with stakeholders.
Pinney (2001): CSR or Corporate Citizenship can most
simply be defined as a set of management practices that
ensure the company minimizes the negative impacts of its
operations on society while maximizing its positive impacts.
Mc Williams and Siegel (2001) said, "Actions that appear to
further some social good, beyond the interest of the firm and
that which is required by law”, Baker (2004) defines CSR as ,
“How many companies manage the business processes to
produce an overall positive impact on society.”
Banks and CSR : The Relation
Through financing practices the Banks are supporting
commercial activity that ultimately degrades the natural
environment (Smith, 1993) So banks should take the
responsibility of CSR on their shoulders. It is not just
philanthropy and obeying the laws rather an attempt to
ensure their own sustainability and profitability (Wanless,
1995) Sanjay Kanti Das(2012) found that the Government of
India keeps guiding and encouraging the Indian Banks and
organisations to indulge in CSR activities by drafting various
guidelines and acts from time to time.
CSR ACTIVITIES CONDUCTED BY BANKS:
Indian banks have been conducting a lot of CSR activities since a long time. A few of the activities, they take part in are
related to Community, marketplace, Environment, Employee Welfare, Social Activities.
Table 1: List of Activities conducted byIndian banks
Indian banks and their involvement in CSR
Bank Community Environment Employee Social
State Bank of India � � � �
ICICI Bank � � � �
Indusind Bank � � � �
HDFC bank � � � �
Punjab National Bank � � � �
JOMAT Vol. 5 No. 2 January – June 2017 ISSN No. 2278-9316
(22)
1. STATE BANK OF INDIA:
The State Bank of India believes that the Bank is a
corporate citizen, with resources at its command and benefits
which it derives from operating in society in general,
therefore it owes a solemn duty to the less fortunate and
under-privileged members of the same society. The Bank's
Pan India campaigns under CSR provide support to a host of
socially relevant schemes and this year's highlights included
providing safe and clean drinking water facility through
installation of 43,161 water purifiers to 42,000 schools
benefitting 84 lakh students. Staff members are encouraged
to make their contribution by understanding the aspirations
of the public around them and by endeavouring to evolve
measures to remove indisputable social and developmental
lacunae. The programme of providing fans was also
continued with supply of 1,40,000 fans to 14,000 schools. For
the first time in the history of your Bank, the CSR spend has
crossed the milestone of ` 100 crores touching ` 123 crores
in this fiscal.
2. INDUSIND BANK
The Bank’s flagship Green Champions Program is a
testament to the employees’ commitment towards good
environmental and social stewardship. This year, the Annual
Green Champions Training Meet (GCTM) was organized
during 15-17 January, 2015 at Karnala, Maharashtra known
for its rich biodiversity. The champions were given the
opportunity to interact with experts in the field of
environmental and social sustainability and draw up action
plans for the year.IndusInd Bank in partnership with HelpAge
India supported the relief efforts in the weeks following the
disaster. A team from the Bank arrived in Narayanbagad on
15 July and facilitated the distribution of free medicines and
medical consultations to people affected by the floods.
Last year IndusInd Bank partnered with v-shesh to
provide job opportunities to two trained students with
hearing impairment. V-shesh aims to develop and deliver
effective educational learning and job related support
services for educated and disadvantaged individualsAs part of
its on-going efforts to support people with disabilities,
IndusInd Bank associated with the Blind Welfare Organisation
and sponsored the National Cricket Tournament for the Blind,
held in January 2014. The competition was a huge success
and a true show of sportsmanship and camaraderie. Indusind
Bank also partners with various Ngo’s like:
1. Swechha, New Delhi Works on Urban Waste
Manangement Issues.
2. Kethi Virasat Mission, Bhatinda Works with Farmers
on Organic and Sustainable Farming.
3. Support Location: Mumbai Runs Residential De-
addiction and Rehabilitation Centres for Drug-using
Street Children.
4. Aaranyak Location: Guwahati Biodiversity
Conservation in N.E. India.
5. Nalandaway, Chennai: Works with Underprivileged
Children through the Arts.
6. Samarthanam Location: Bangalore, Empowers
Visually Impaired, Disabled and Underprivileged
Children.
3. ICICI BANK
ICICI Bank is deeply engaged in human and economic
development at the national level. The Bank works closely
with ICICI Foundation across diverse sectors and programs.
ICICI Bank has decided to meet the CSR-spend target this
fiscal year by using about ` 100 crore for skilling
underprivileged people. ICICI Bank will spend ` 200 crore on
social sector projects this fiscal and meet the mandatory 2
per cent CSR spend norms, according to its chief Chanda
Kochhar. The bank also conducts various programs like
Education, skill development, financial inclusion, employee
engagement, healthcare, sustainability livelihoods and
capacity building.
4. PUNJAB NATIONAL BANK
Punjab National Bank conducts a lot of CSR activities
which are related to the welfare of the community. PNB
initiative support Chennai– PNB has decided for providing
relief loan to employees of bank affected by torrential rain
and flood in Tamil Nadu and Pondicherry. The loan amount
upto ` 1.50 lakhs has been considered for which bank not
charge any interest. The loan shall be repayable in 48
monthly installments or remaining period of service
whichever is earlier. The Bank has conducted various
activities such as Medical Camps, Health Camps for Farm
animals, Farmers Training including visits of farmers to
Agriculture Universities, Tree Plantation drive, Blood
Donation Camps, Distribution of Artificial Limbs, Adoption of
New Born Care and Malnutrition ward at Government
Hospital, Sikar, Rajasthan.
5. HDFC BANK
At HDFC Bank, Corporate Social Responsibility is all about
developing a business model that not only creates economic
value but also contributes to a healthy ecosystem and strong
communities. They believe in evolving and developing
appropriate business processes and strategies to achieve a
common goal which contributes to the greater good. The
bank concentrates on the areas such as Education, Financial
literacy, Sustainable Livelihood and Training.
JOMAT Vol. 5 No.2 January – June 2017 ISSN No. 2278-9316
(23)
HDFC Bank supports the concept of Environmental
Sustainability and works towards various initiatives like the
'Teach for India' movement which is a nationwide campaign
aiming to bridge the educational gap in India by placing young
professionals in low-income schools to teach full-time for two
years, advocating educational equality. The bank provides
financial assistance to people from the lower income group
and has helped a lot of villagers with loans for them to start
new entrepreneurship ventures.
The HDFC Bank believes that the benefits of economic
growth must flow to all sections of the society and that
education is one of the main factors enhancing the overall
economic and social development of a nation. Out of them,
the Educational Crisis Scholarship Support (ECSS) programme
has been envisaged to provide interim support to children
who face a personal or financial exigency. The Bank also has a
Sustainable Livelihood Banking program (SLI) that operates
across the country and has created significant impact on the
lives of the people it touches. SLI adopts a holistic approach
that ensures that it develops a deep understanding of the
needs of each of the women.
HDFC Bank also has a Capacity Building Program (CBP)
that helps to improve the income of the family and also
focuses over building the confidence of these women by
providing a way to earn a livelihood. The program teaches
them how to manage their money and loan repayments in a
prudent manner.
HDFC Bank conducts one of India's largest single day
blood donation drives. The Bank started this initiative in 2007
when over 4000 volunteers came forward to donate blood.
Over the past eight years, this initiative has grown in size and
stature. On 5th December 2014, HDFC Bank's All India Blood
Donation Drive was attended by 1,55,599 volunteers, with
1,28,642 units collected.
Recent News Articles related to CSR in Banks:
Finance Ministry wants banks to be exempt from CSR spend
The finance ministry has written to the corporate affairs
ministry, asking the latter to exempt banks from the
corporate-social responsibility (CSR) spending mandated by
the Companies Act. The Act, which came into effect from the
current financial year, mandates companies to spend at least
two per cent of their average net profit for the immediately
preceding three financial years on CSR activities. The CSR
provisions within the Act are applicable to companies that
have annual turnover of ` 1,000 crore or more, or net worth
of ` 500 crore or more, or net profit of ` 5 crore or more.
Almost all commercial banks have made profits of more than
` 5 crore in the past three financial years. The Act also
requires companies to set up CSR committees comprising
their board members, including at least one independent
director. Profitability growth of bank groups differed
significantly last financial year. The new private banks were
able to maintain a healthy growth rate of 19.7 per cent in
their profit after tax during 2013-14, compared to a
contraction of 30.7 per cent in the net profits of public-sector
banks during the year. According to the finance ministry,
since the country is considered a bank-led economy and as
the economy is not doing well, banks should be exempted
from spending on CSR activities till the economic conditions
improve. All private-sector banks, both old- and new-
generation ones, are incorporated under the Companies Act,
and so are foreign banks' branches. Nationalized banks are
incorporated under the Nationalized Bank Act. Though it is
not clear if public-sector banks also need to spend on CSR
activities - Reserve Bank of India laws allow them to make
donations - the finance ministry wants all banks to be
exempted from the stipulation for now. If the corporate
affairs ministry agrees to the request, it will be a big relief for
banks, particularly the public-sector ones. The move comes at
a time when the government is constrained in infusing capital
into state-run banks. According to the government's own
estimates, public-sector banks will need ` 2.4 lakh crore of
capital infusion over the next five years, mainly to meet the
Basel-III norms and to fund their business growth. Banks'
capital positions are under pressure due to mounting non-
performing assets (NPAs) and this is putting pressure on
profitability. Also, from April 1 next year, banks will have to
treat restructured assets as NPAs, for which provisioning
requirement will go up sharply. At present, standard
restructured assets require a provisioning of five per cent,
while sub-standard assets need provisioning of 15-20 per
cent, depending on whether a loan is secured or not.
ArunJaitley - led corporate affairs ministry rejects proposal
by finance ministry over banks' CSR norms
The corporate affairs ministry has rejected a proposal by
the finance ministry to exempt banks from 2 per cent
mandatory corporate social responsibility (CSR) norms owing
to their capital constraints. Both the ministries are headed
by Arun Jaitley, who is also the defence minister. Earlier this
year, the finance ministry had written a letter to MCA seeking
temporary relief from mandatory CSR for banks till
the economy improved. MCA received similar requests from
representatives of non-banking financial companies too. The
ministry had cited "poor economic growth and increasing
capital requirements of commercial banks". According to the
Reserve Bank of India, scheduled commercial banks will

JOMAT Vol. 5 No.2 January – June 2017 ISSN No. 2278-9316
(24)
together need an additional capital of ` 5 lakh crore to
comply with Basel-III capital adequacy regulations. Of this,
equity capital requirement will be of ` 1.75 lakh crore and
non-equity capital of ` 3.25 lakh crore.Under the present
structure, private sector banks, old private sector banks and
foreign bank branches are incorporated under the Companies
Act whereas state-run banks are incorporated under
the Nationalised Bank Act. The gross non-performing assets
or NPAs in private sector banks stood at ` 22,744 crore at the
end of March, an increase of 13.76 per cent over the previous
year. RBI has not earmarked any amount that needs to be
spent towards CSR, leaving it to the wisdom of the bank
boards.
Most of top listed firms fail to meet minimum CSR spending:
Report
About 32 of the Nifty 50 companies have missed this
target, according to data compiled by CimplyFive Corporate
Secretarial Services. It has reported that most of India’s top
listed firms did not manage to meet the minimum spending
requirement on corporate social responsibility (CSR) as laid
down in the New Companies Act 2013, even though
aggregate CSR spending was high as some of them spent
more than the mandated amount. About 32 of the Nifty 50
companies have missed this target, according to data
compiled by CimplyFive Corporate Secretarial Services Pvt.
Ltd, a firm provides services and technology to improve
regulatory compliance across firms. Three of the Nifty 50
firms are loss making and are exempt from this provision. The
data has been compiled from annual reports filed by these
firms. Twelve of the 32 non-compliant companies, in their
annual reports, explained that the mandated amount could
not be spent as it was the first year of the CSR mandate and
capacities to spend on are still being built. Explaining the
reason for non-compliance, nine of the Nifty 50 firms said
they have sanctioned spending on CSR projects but the
implementation has spilled over to the next financial year.
Another four of these companies said they have sanctioned
expenditure towards CSR projects but the execution would
happen over multiple years. Of the Rs.3,989 crore spent in
financial year 2014-15, more than 50% of the funds have
been spent on causes such as education and related
activities, health care and sanitation, and poverty and hunger
eradication.
YES Bank to Set Up over 1000 Community Water Purification
Systems in Railway Stations
YES Bank India’s 5th
largest private sector bank has joined
hands with the Indian Railways to provide safe and clean
drinking water at Railway station by setting up 1000
community water purification systems across India by 2019.
In the first phase of the project, the Bank will set up 100 such
systems across D’ and ‘E’ category railway stations in the
Konkan belt and other locations in Maharashtra by March
2016.The initiative is being rolled out at the smaller stations
with basic water connection and an average footfall of 1000
passengers per day. Close to 50 such systems have been
already installed across the Konkan region as of now.This
initiative from YES BANK caters to population in the lower
strata of the society.”
SBI donates medical devices to GH:
The State Bank of India park town donated 50 pieces of
medical Equipments to the Rajiv Gandhi Government general
Hospital. The donation comes as a part of the CSR activity of
the SBI Bank, Region I. The equipments were handed over by
the Regional Manager, R. Tamilvaanan to the dean of MMC
Dr. Vimala.
Suggestions and Conclusion:
CSR should be considered as very important activity of
every organization or bank since it is their duty to give back to
the society in which they are operating on a very large scale
and with the help of whom they earn profits. It has been
seen in a few surveys in the U.S that customers preferred to
choose a brand that has created a positive impact in the
society than choosing a company that does not do any kind of
community service. It was also seen that customers paid a
higher price for the products offered by a company or bank if
they promised to donate a certain percentage of their profits
to the society. With the advent of technology, there is an
increase in the number of new banking services being
offered, banks need to devise new ways and strategies to
retain their customers. Other than offering efficient services,
Banks must focus on creating a positive image in the society
by adopting CSR activities for the general good of the
community, health and environment. This will attract more
and more conscious customers who will want to do their little
part for the society through choosing various banking
services. This Researcher has made a humble effort towards
understanding the concept of CSR in banks and hopes this
work will help pave ways for future research in this area for
the academic community.

JOMAT Vol. 5 No.2 January – June 2017 ISSN No. 2278-9316
(25)
References:
1. A Three-Dimensional Conceptual Model of Corporate Performance, Archie B. Carroll, The Academy of Management Review,
Vol. 4, No. 4 (Oct., 1979), pp. 497-505
2. Crittenden, Victoria L., William F. Crittenden, Linda K. Ferrell, O.C. Ferrell, and Christopher C. Pinney (2011), “Market-
Oriented Sustainability: A Conceptual Framework and Propositions,” Journal of the Academy of Marketing Science, 39
(August), 71-85.
3. CSR practices and CSR reporting in Indian banking Sector International Journal of Scientific and Research Publications,
Volume 3, Issue 12, December 2013 1 ISSN 2250-3153 Namrata Singh*, RajlaxmiSrivastava**,RajniRastogi***
4. Corporate Social Responsibility: A Theory of the Firm Perspective,Abagail McWilliams and Donald SiegelThe Academy of
Management Review,Vol. 26, No. 1 (Jan., 2001), pp. 117-127
5. CSR Initiatives of Indian Banking Industry", Social Responsibility, MahabirNarwal, (2007) ", Journal, Vol. 3 Iss: 4, pp.49 - 60
6. Corporate and public responsibility, stakeholder theory and the developing world, David Lea, Article first published online:
16 DEC 2002,DOI: 10.1111/1467-8608.00143
7. \Hopkins M. 2003.The Planetary Bargain – CSR Matters.Earthscan: London.
8. http://economictimes.indiatimes.com/news/company/corporate-trends/corporate-shirking-responsibility-only-14-nifty-cos-
spent-2-of-net-gain-on-csr-in-fy15/articleshow/49160140.cms
9. http://www.indiacsr.in/en/yes-bank-to-set-up-over-1000-community-water-purification-systems-in-railway-stations/
10. http://www.thehindu.com/todays-paper/tp-national/tp-tamilnadu/sbi-donates-medical-devices-to-gh/article8200603.ece
11. https://www.google.co.in/url?sa=iandrct=jandq=andesrc=sandsource=imagesandcd=andcad=rjaanduact=8andved=0ahUKE
wje5dnq4OfKAhXLj44KHSLxC1EQjB0IBgandurl=http%3A%2F%2Fepaperbeta.timesofindia.com%2FArticle.aspx%3Feid%3D31
818%26articlexml%3DIndia-Inc-Beats-Mr-Scrooge-Hands-Down-in-
30092015001072andbvm=bv.113370389,d.c2Eandpsig=AFQjCNFH9sNQzmcTF7X29GVaEf13aYR8zgandust=1455006750411
506
12. https://www.google.co.in/url?sa=iandrct=jandq=andesrc=sandsource=imagesandcd=andcad=rjaanduact=8andved=andurl=
http%3A%2F%2Fforbesindia.com%2Farticle%2Fboardroom%2Findia-inc-needs-to-wake-up-to-its-social-
responsibilities%2F34891%2F0andbvm=bv.113370389,d.c2Eandpsig=AFQjCNFH9sNQzmcTF7X29GVaEf13aYR8zgandust=145
5006750411506
13. http://www.business-standard.com/article/finance/finance-ministry-wants-banks-to-be-exempt-from-csr-spend-
114072300141_1.html
14. http://archive.financialexpress.com/news/top-cos-to-shell-out-rs-10k-cr-for-csr-ongc-reliance-industries-big-
spenders/1231600
15. http://articles.economictimes.indiatimes.com/2014-09-12/news/53851306_1_finance-ministry-private-sector-banks-lakh-
crore
16. http://profit.ndtv.com/stock/state-bank-of-india_sbin/reports-chairman-speech
17. http://epaperbeta.timesofindia.com/Article.aspx?eid=31818andarticlexml=India-Inc-Beats-Mr-Scrooge-Hands-Down-in-
30092015001072
18. http://epaperbeta.timesofindia.com/Article.aspx?eid=31818andarticlexml=India-Inc-Beats-Mr-Scrooge-Hands-Down-in-
30092015001072#
19. https://www.sbi.co.in/
20. http://www.icicibank.com/
21. http://www.hdfcbank.com/

JOMAT Vol. 5 No.2 January – June 2017 ISSN No. 2278-9316
(26)
22. http://www.indusind.com/
23. India CSR Outlook Report 2015
24. National institute of Bank Management: Banker’s Brief, An Online Weekly news and Views Digest., Vol. XXXI No. 15, January
11, 2016.
25. Prasanna Chandra, Financial Management: An overview-, Page-15, publication- Tata McGraw Hill
26. “RECRUITING FOR IDEAS: HOW F IRMS EXPLOIT THE PRIOR INVENTIONS OF NEW HIRES,” J. SINGH and A. AGRAWAL (2011)
27. Sanjay Kanti Das, CSR Practices and CSR Reporting in Indian Financial Sector, International Journal of Business and
Management Tomorrow ,Sept 2012, Vol. 2 No. 9.
28. Sep 30 2015 : The Economic Times (Mumbai),India Inc Beats Mr. Scrooge Hands Down in Art of Giving
���

JOMAT Vol. 5 No. 2 January – June 2017 ISSN No. 2278-9316
(27)
EXPLORING SOCIAL MEDIA IMPACT ON THE FINANCIAL PERFORMANCE OF BANKS: A STUDY
ON SELECTED COMMERCIAL BANKS IN PUNE
Aishwarya Gopalakrishnan1
Leena Dam2
ABSTRACT
Banking being a part of a well developed financial system, is an intermediary between the people who save and the people
who spend. Social media helps organizations to meet a huge customer base on a common platform that facilitates one to one
interaction, marketing of products, gaining valuable feedback from them in turn allowing them to realize the needs of their
customers. It does play an important role in the financial performance of a bank. The independent variables used are sales
volume, customer acquisition cost, risk management and mitigation and the dependent variable used is financial performance.
Twenty two commercial banks have been selected among banks using social media as a platform to interact with customers. The
data is collected using a structured questionnaire. Descriptive statistics like standard deviation, mean and percentage are used.
Multiple linear regression models are used to assess the financial performance of commercial banks. The study finds and
concludes that social media interaction decreased commercial banks’ cost of acquiring new customers significantly increasing
their revenue.
Keywords: Social Media, impact, financial performance, Commercial Bank.
Introduction:
Ancient banking was very simple and involved exchange
of grains, coins, crops, precious metals and cattle. The
conditions were less complicated and the repercussions of
non-repayment was very straightforward. With the advent of
Globalization and new technologies, banking has taken a 360
degree turn. Modern day banking is all about attracting your
customers and retaining them. Opening and closing an
account with a bank does not take more than an hour
anymore. Hence, retaining customers and catering to their
needs has become the need of the hour. There are a lot of
diverse financial products available and the customer is
required to make the right investment decisions. Customers
have become more alert and have learnt to extract
information through research and weigh the pros and
consbefore investing their money in a safe financial
institution. A well developed financial system helps in the
smooth allocation of funds from the people who save to the
people who spend. Indian banks have become more robust
even in times when the world is facing a financial crisis. They
are becoming more competitive and setting up branches
abroad. The financial performance is the main indicator of a
company’s financial health and helps in understanding the
bank’s efficiency in terms of its degree of risk and
profitability. Traditionally a bank’s financial performance was
measured in terms of the various models such as CAMEL’s,
Meyer Markiewicz approach, Data envelopment analysis,
Dupont system etc. The only basis for analysis while using
these models was considering financial ratios for calculations.
Today, it has become difficult to justify the financial
performance of a firm only by using financial parameters.
Non-Financial parameters such as Customer satisfaction,
Employee performance, Community participation, Social
Media interactions also do play a major role. Social media has
now changed how traditional marketeers comprehend the
term marketing strategy.
According to Oxford dictionary social media means,
“Websites and applications that enable users to create and
share content or to participate in social networking.” Social
media websites come under the purview ofthe state Web 2.0
which speaks about how the web pages will be designed and
created into user generated content and Web 3.0 introduced
by Berners-Lee that speaks about a method used to measure
© SBPIM
PhD Research Scholar, Dr. D. Y. Patil Vidyapeeth, Global Business School & Research Centre
Contact no.: 8796501471 Email Id: [email protected]
Associate Professor & Research Guide, Dr. D. Y. Patil Vidyapeeth, Global Business School & Research Centre
Contact no.: 8638863328 Email Id: [email protected]

JOMAT Vol. 5 No. 2 January – June 2017 ISSN No. 2278-9316
(28)
the user generated content through machines and its impact
on target groups. With changing business environments,
banks have to use aggressive marketing strategies to capture
target markets and at the same time enjoy presence on the
worldwide web. New strategies can be devisedusing social
media tools. Social Media interactions help the banks to
create a common platform where they can advertise their
products to a group of target consumers and future
consumers. These communities help them to connect with a
huge customer base and solve similar doubts on individual
levels without one-on-one interactions.
The researchers have aimed to study the role of Social
media on financial performance, by studying the independent
variables (i) Sales volume (ii) Customer acquisition cost (iii)
Risk management and mitigation.
Fig. 1: Model showing the relationship between social media and financial performance
Need of the study:
There has been a rapid growth in the use of social media
due to high usage of information technology by the world“.
By 2017 India will have the largest mobile phone user base at
145.9 million followed by the US at 138.8 million”. Very few
customers visit banks today; they prefer to avail the services
of the bank in the comfort of their home or workplace. Social
media marketing facilitates in bridging this gap. With the help
of web based platforms, banks can reduce their customer
acquisition costs. Indian banks are adopting social media
tools to maintain the communication with their customers.
There are many active users on these social media platforms.
This paper intends to study the role of social media on the
financial performance of banks in India.
Objective of the study:
1. To study the role of social media on financial
performance of selected commercial banks in Pune.
2. To study the reasons for using social media sites.
Hypothesis:
Social Media does not have a significant impact on the
financial performance of the selected commercial banks in
Pune.
Research Methodology
Descriptive research design is used in the present study.
For the study 16 public sector banks and 6 private sector
banks have been selected by using random sampling from
Pune.Data has been collected through a structured
questionnaire to understand the role of social media on
financial performance of the commercial banks.The
questionnaire consists of likert scale, multiple choice
questions and frequency questions. Financial performance is
measured in terms of revenue generation of banks. In the
study revenue generation is the dependent variable and
volume of sales, customer acquisition cost and risk
management and mitigation are the independent variables.
The study was conducted during August to September 2017.
For the analysis SPSS software has been used and regression
is used to verify the hypothesis.
Literature Review:
Social Media Networking and Financial performance
According to Oxford dictionary, social networking is, “The
use of dedicated websites and applications to interact with
other users, or to find people with similar interests to one's
own”. Whatsapp, LinkedIn, Facebook, Twitter, Instagram,
MySpace, YouTube, Google plus, Blogs etc. are a few of the
Social media platforms. LinkedIn, Face book and Twitter are
used for this study.
(Birkner, 2011) in his study stated that social media sites can
be used by businesses of all types and sizes for Marketing
purposes. With changing times, customers have become
more demanding and picky since there are numerous
products available with similar attributes in the market. To
compete with this demand, marketers have to change the
way they communicate with them. This is where the role of
social media comes into picture.(Kirtis, Karahan, 2011)
studied how the costs of marketing reduce due to the use of
social media and how important its use has become in order
to reach a huge customer base by spending less. All of a
sudden Social media is being accepted by banks and they are
working dedicatedly on creating user friendly spaces for
customers to interact on the web, it is a transformation.
Impact of
Social Media
Bank’s financial
performance
(Revenue
Generation)
Sales Volume
Customer
Acquisition cost
Risk Management
and Mitigation

JOMAT Vol. 5 No. 2 January – June 2017 ISSN No. 2278-9316
(29)
(Gensler, Volckner, Liu-Thompkins & Wiertz,. 2013) found
that social media platforms facilitate the SMEs to market
their products, increase client service and sales which in turn
will help impact the financial position of the firm
positively.(Kaplan, Haenlein, 2010) said that, “Social media is
a group of Internet based applications that build on the
ideological and technological foundations of Web 2.0, and
allow the creation and exchange of user generated
content.”(Kaplan, Haenlein, 2010) state that, “social media is
unique since it allows participants to unite by generating
personal information profiles and inviting friends and
colleagues to have access to those profiles”. It can be
concluded that, use of social media has encouraged
customers to share information in turn influencing the buying
behavior decisions of their peers.
The financial system of a country deals with the
allocation of funds from the people who save to the people
who spend. Banks contribute immensely for improving the
country’s financial system. The financial performance of
banks has been of much interest to researchers till date.
Financial performance of the bank is affected due to certain
internal as well as external factors. Traditionally only the
financial parameters were taken into consideration to
measure the financial performance of a bank, however with
changing times it is necessary to understand that attracting
customers to the business is a very important to the revenue
growth. Social media will help the banks to understand the
needs of their customers and then introduce the products as
per their needs instead of keeping unachievable targets of its
employees every month just to increase their business.
Social media helps organizations to meet a huge
customer base on a common platform that facilitates one to
one interaction, marketing of products, gaining valuable
feedback from them in turn allowing them to realize the
needs of their customers. Other than traditional parameters,
social media has been affecting the financial performance of
a bank. Banks can use SNS as a mode to communicate and
spread information through electronic word of mouth of
customers. Posting of user generated content is promoted as
compared to advertising content which has been developed
by the marketeer himself.
The researchers have attempted to analyse the
relationship between volume of sales, reputational risks,
customer acquisition cost, CRM and feedback from customers
that may affect the financial performance of banks. Little
literature is available on the effect of social media usage on
financial performance of banks. To bridge this gap, this study
is a humble attempt to study the impact of social media on
revenue generation and financial performance of banks.
Using social media, banks market the financial products;
customers can then repost their views and satisfaction levels
based on the choice of products purchased. The banks can
also post messages such as season’s greetings, financial
position of the company, growth statistics etc., which help in
creating a very good image in the minds of the buyer. Banks
can thus provide better services and satisfy and retain those
customers in the long run. It is all about creating long term
valuable relationships and respecting their space.
The researchers attempted to study the relationship
between social media and financial performance of banks and
found that all the commercial banks had their own team
working separately on social media and also had a separate
social media policy in place. Face book is the most preferred
website; Twitter and LinkedIn are given second and third
preference respectively. Since the time the banks have begun
to use social media websites, the number of followers on all
these platforms have increased tremendously. The top three
banks using social media extensively are State Bank of India,
YES bank and ICICI bank in descending order of ranking. It is
commendable to see that although YES bank is the newest in
terms of establishment as compared to SBI and ICICI bank,
they have become more popular than ICICI bank in terms of
followers. On 27 October 2017 it was found that State Bank
of India had 13642833 followers on Facebook, 2635433
followers on Twitter and 533362 followers on LinkenIn
amounting to 16811628 followers on social media, followed
by YES Bank 7022618 followers on Facebook, 3423351
followers on Twitter and 214475 followers on LinkedIn
amounting to 10660444 followers on selected social media
sites. It is also found that the customer acquisition costs of
the chosen banks have reduced due to usage of social media
tools. It is cheaper to acquire customers through social media
sites, provided the bank’s appointed staff work dedicatedly
towards controlling and maintaining information social media
sites. The regression model used showed that the impact of
social media on the bank’s financial performance is found to
be positive in terms of revenue generation. The independent
variables are found to have a positive effect on the revenue
generation of the banks.
Results and discussion:
Out of the total 22 samples, the majority of 73% banks
are established above 31 years, and 23% are in between 21-
30 years, 5% lie in the less than 20 years category. It was
found that 32% banks are private sector banks and 68%
majorly fall under the public sector banks category. Since

JOMAT Vol. 5 No. 2 January – June 2017 ISSN No. 2278-9316
(30)
these banks are majorly found to be established above 31
years, it is assumed that they have opened their arms to the
social media and have adopted it. 55% of banks review their
social media policy yearly, 18%of banks half yearly, 14% of
banks quarterly and 14% of banks conduct reviews monthly.
Majority 54% of the banks update their social media sites
monthly, 27% of the banks do it weekly, 14% of the banks
daily and 5% of the banks update their sites on an hourly
basis, which means banks are realizing the importance of
keeping their websites updated and increasing their web
presence.
From Table.1it is found that all the 22 banks use
Facebook, Twitter and LinkedIn except for the Central Bank of
India which does not have a LinkedIn account. For Facebook
46% of the banks had followers above 200000, 14% of the
banks had followers between 100001-150000, 32% of the
banks had followers below 50000 and only 9% of the banks
had followers between 50001-100000. For Twitter, 68% of
the banks majorly have followers below 50000, 18% of the
banks above 200000, 9% of the bank’s fell in the category of
150001-200000 followers and 5% of the banks between
100001-150000. For LinkedIn, 73% of the banks had followers
below 50000 and only 18% of the banks had followers above
200000. Facebook was used primarily as compared to Twitter
and LinkedIn.
Table.1: Details of followers by Facebook, LinkedIn, Twitter
Facebook Twitter LinkedIn
Number of Followers Frequency Percentage Frequency Percentage Frequency Percentage
Less than 50000 7 32 15 68 16 73
50001-100000 2 9 0 0 1 5
100001-150000 3 14 1 5 0 0
150001-200000 0 0 2 9 1 5
200000 and above 10 46 4 18 4 18
Total 22 100 22 100 22 100
Source: Primary Data
Reasons for using Social media sites: 96% of the banks
agreed that their aim to use social media is to build customer
relationships. 73% of the banks opined that they use social
media to enter new markets and create a good customer
base. Market research analysis was the reason why 82% of
the chose to adopt social media strategies. 92%of the banks
agreed they use social media to increase the volume of their
sales and 95%of the banks use it for advertising new financial
products, 86% of the banks aim for revenue generation
through social media and 96%of the banks are interested in
collecting a genuine feedback from customers through the
use of social media.
Table 2: Reasons for using Social media sites
Customer
Relationship
Entering
new
markets
Market
research
analysis
Volume of
Sales
Advertisement
of new
products
Revenue
Generation
Feedback
from
Customers Responses
F % F % F % F % F % F % F %
Strongly Disagree 0 0 0 0 0 0 0 0 0 0 0 0 0 0
Disagree 0 0 0 0 0 0 1 5 0 0 1 5 0 0
Neutral 1 5 6 27 4 18 1 5 1 5 2 9 1 5
Agree 16 73 12 55 12 55 10 46 8 36 6 27 14 64
Strongly Agree 5 23 4 18 6 27 10 46 13 59 13 59 7 32
Total 22 100 22 100 22 100 22 100 22 100 22 100 22 100
Source: Primary Data

JOMAT Vol. 5 No. 2 January – June 2017 ISSN No. 2278-9316
(31)
Customers acquired through social media have contributed to revenue of bank: The findings show if the banks believe that
customers acquired through social media contribute to the revenue of the bank. 55% banks agree, 27% strongly agree and only
9% strongly disagree.
Table 3: Customers acquired through social media have contributed to revenue of bank
Sr. No. Responses Frequency Percentage
1 Strongly Disagree 2 9
2 Disagree 0 0
3 Neutral 2 9
4 Agree 12 55
5 Strongly Agree 6 27
Total 22 100
Source: Primary Data
Risks that arise while using Social media sites:
Informational risks could include the risks related with the
misuse of confidential information disclosed. 64% banks
agreed there are information regulatory risks involved in the
use of social media, whereas 36% disagreed that any such
risks exist. Maintaining the Reputation of a bank is most
important to safeguard customer interests. 73% banks
believe that use of social media involves Reputational risks
and 27% disagreed. Banks who agreed that use of social
media involves Operational risks is 68% and 32% do not agree
that any such risks are present. Operational risks can be due
to breakdown of in-house processes, structures and members
of the staff.
Table 6 : Analysis of Variance (ANOVA)
Model Sum of Squares df Mean Square F Sig.
Regression 11.332 3 3.777 17.060 .000b
Residual 3.986 18 .221 1
Total 15.318 21
a. Dependent Variable: RG, b. Predictors: (Constant), VS, CAC, RM
Table. 6 is an analysis of the model used. The value at 5
percent level of significance is 17.060. The p value at 5
percent level of significant is 0.000, which is less than
0.05(p<0.05). Hence, the null hypothesis social media does
not have a significant impact on the financial performance of
the selected commercial banks in Pune is rejected. It can be
inferred that social media has significant impact on the
financial performance of the selected banks. Table 7
demonstrates the linear regression analysis determining the
relationship between the dependant variable revenue
generation with the independent variables volume of sales,
customer acquisition costs and risk management and
mitigation.
Y = 1.00 + 0.26X1 + 0.25X2 + 0.13X3
Where Y = Dependent Variable
X1 = Volume of Sales
X2 = Customer Acquisition Costs
X3 = Risk Management, Mitigation
Taking all factors into consideration and constant at
zero, performance will increase by 1 unit. The analysis of
data shows that the performance of banks is affected
majorly by volume of sales followed by customer acquisition
costs and risk management and mitigation.
Table. 7: Model Summary
Unstandardized Coefficients Standardized Coefficients
Model
B Std. Error Beta
t Sig.
(Constant) −1 0.953 -1.05 0.308
Volume Sales 0.892 0.132 0.815 6.763 0
Customer Acquisition Costs 0.308 0.114 0.338 2.701 0.015
Risk Mgmt & Mitigation 0.057 0.104 0.068 0.544 0.593

JOMAT Vol. 5 No. 2 January – June 2017 ISSN No. 2278-9316
(32)
Table.4: Risks that arise while using Social media sites
Information regulatory risk Reputational Risk Operational Risk Responses
Frequency Percentage Frequency Percentage Frequency Percentage
Yes 14 64 16 73 15 68
No 8 36 6 27 7 32
Source: Primary Data
Regression Analysis: A Regression equation is used to determine the relationship between the dependent and independent
variables. As shown in Table.5, the three independent variables explain 74% of the dependent variable revenue generation
represented by R2 which means that 16% of factors that contribute to the performance of banks in Pune, have not been studied
in this research. Hence, future research should be to find out the additional factors affecting social media (16%) affecting bank’s
financial performance.
Table 5: Model Summary
pvalue is 0.000 is less than 0.05, it can be stated that the
model used to determine the performance of banks is
statistically significant at 5 percent significance level.
Dependent Variable: Revenue Generation
Considering the regressor variables as zero, if there is an
increase in volume of sales, revenuewill increase by 0.892
units and if there is a decrease in customer acquisition costs
revenue will increase by 0.308 units. A unit increase in risk
management and mitigation will increase revenue by 0.057
units.
Implication of the study:
The results of the research shall assist thebank managers
and the bank’s social media marketing teams to recognize
how the usage of social media helps increase revenue
generation and that social media strategies impact volume of
sales, customer acquisition costs and risk management and
mitigation in a positive way. This study shall facilitate social
media policy reviewers to assimilate the most important
elements required to gain positive response from target
markets.
Conclusions:
It is inferred that social media use can help in reducing
customer acquisition costs and increase revenue generation
of the banks. With reduction of costs, revenue increased by
30.8 percent. Volume of sales, customer acquisition costs
and risk management and mitigation do affect the financial
performance on the banks. Hence, social media has a
significant impacton the financial performance of banks in
Pune. Further, it is concluded that the major reasons for using
social media sites are advertisement of new products,
revenue generation, increasing volume of sales and building
customer relationships.
References
1. Birkner, C.(2011). Sharing the Love.Marketing News, 45(3), 11-12.
2. Boyd, D. & Ellison, N. (2008). Social Network Sites: Definition, History and Scholarship. Journal of Computer Mediated
Communication.
3. Charoensukmongkol, P., &Sasatanun, P. (2016), Social media use for CRM and business performance satisfaction: The
moderating roles of social skills and social media sales intensity, Asia Pacific Management Review 22 (2017) 25-34.
4. Gensler, S., Volckner, F., Liu-Thompkins, Y., & Wiertz, C. (2013), Managing brands in the social media environment, Journal
of Interactive Marketing, 27(4), 242-256.
5. Hassana S., Nadzimb, S.Z.A., and Shiratuddinc, N. (2015), Strategic Use of Social Media for Small Business Based on the
AIDA Model, Procedia - Social and Behavioral Sciences 172, 262 – 269.
Model R R2 Adjusted R
2 Std. Error of the Estimate
1 .860a .740 .696 .47056
a. Predictors: (Constant), RM, VS, CAC

JOMAT Vol. 5 No. 2 January – June 2017 ISSN No. 2278-9316
(33)
6. Kirtis, A.K., &Karahan, F. (2011) To be or not to be in Social Media arena as the most cost-efficient marketing strategy after
the global recession, Procedia Social and Behavioral Sciences 24 (2011) 260–268.
7. Kaplan,A.M.,&Haenlein, M. (2010), Users of the World, Unite! The Challenges and Opportunities of Social Media, Business
Horizons, 53 (1),59-68.
8. Kaplan A. M. & Haenlein, M. (2012), Social media: back to the roots and back to the future, Journal of Systems and
Information technology.
9. Reyneke, M., Pitt, L. & Berthon, P.R. (2011) Luxury wine brand visibility in social media: An exploratory study, International
Journal of Wine Business Research, 23 (1), 21-35.
10. Repository Citation Lim, Wendy. (2010), The Effects of social media networks in the hospitality industry, UNLV Theses,
Dissertations, Professional Papers, and Capstones, 693.
11. Smith, H. (1999), Quality Aspects of Services Marketing, Marketing Intelligence & Planning, 8: 25-32.
12. Tajvidi, R. & Karami, A. (2017), The effect of social media on firm performance, Computers in Human Behavior.
13. Palkar, A., & Jadhav, A. (2015).In Internet Age- marketing with social media, Fundamentals of marketing with new age
Media(pp.7-9). HPH, India, Pune.
14. https://en.wikipedia.org/wiki/Web_2.0
15. https://en.wikipedia.org/wiki/Semantic_Web
16. https://en.wikipedia.org/wiki/Social_media
17. https://en.oxforddictionaries.com/definition/social_networking
18. https://en.oxforddictionaries.com/definition/social_media
19. https://ac.els-cdn.com/S1877042815004000/1-s2.0-S1877042815004000-main.pdf?_tid=4efdbc2a-be70-11e7-8147-
00000aab0f26&acdnat=1509477702_98ca3ab701ee9f31231bff0aba58b8c8
20. https://www.researchgate.net/publication/222403703_Users_of_the_World_Unite_The_Challenges_and_Opportunities_of
_Social_Media
21. https://en.wikipedia.org/wiki/Facebook
22. https://en.wikipedia.org/wiki/Twitter
23. https://en.wikipedia.org/wiki/LinkedIn
24. http://www.investopedia.com/terms/o/operational_risk.asp
25. http://ceoworld.biz/2017/07/27/why-luxury-brands-should-use-social-media-for-brand-awareness-and-user-engagement/
26. http://www.emeraldinsight.com/doi/abs/10.1108/ITP-08-2013-0144?journalCode=itp
27. https://en.wikipedia.org/wiki/Social_media_marketing
28. https://www.forbes.com/sites/jaysondemers/2014/08/11/the-top-10-benefits-of-social-media-marketing/#4c4470291f80
29. https://momentfeed.com/blog/meals-media-marketing-social-platform-best-restaurants/
30. https://www.forbes.com/sites/forbescommunicationscouncil/2016/12/15/how-to-boost-your-brand-through-an-effective-
social-media-strategy/#53f4a53f7334
31. https://press.linkedin.com/about-linkedin
32. http://fortune.com/2017/04/24/linkedin-users/
33. https://digitalscholarship.unlv.edu/cgi/viewcontent.cgi?article=1694&context=thesesdissertations
34. http://digitalscholarship.unlv.edu/thesesdissertations/693
35. http://www.scielo.br/scielo.php?script=sci_arttext&pid=S1808-23862016000600260

JOMAT Vol. 5 No. 2 January – June 2017 ISSN No. 2278-9316
(34)
36. https://www.omicsonline.org/open-access/customer-oriented-marketing-capabilities-and-firm-performancemediated-by-
new-product-development-capabilities-and-moderated-byenvironmental-turbulence-2162-6359-1000282.php?aid=63051
37. https://economictimes.indiatimes.com/magazines/panache/india-to-have-the-largest-number-of-facebook-users-on-
mobile-by-2017-report/articleshow/45978668.cms
38. http://gadgets.ndtv.com/social-networking/news/india-to-have-largest-facebook-user-base-on-phones-by-2017-report-
652728
39. http://www.bgr.in/news/facebook-to-have-more-mobile-users-in-india-than-the-us-by-2017-report/
40. http://indiatoday.intoday.in/technology/story/Ã%20ndia-to-have-more-facebook-users-than-the-us-by-
2017/1/414945.html
���

JOMAT Vol. 5 No.2 January – June 2017 ISSN No. 2278-9316
(35)
GREEN MARKETING: A STEP TOWARDS GREEN INDIA
Dr. Pooja Goel
ABSTRACT
Save earth is the need of the hour and every country across globe is willing as well as bound to protect the environment.
Industrialisation is considered as a major cause for the climate change which is emerging as a biggest challenge for the human
kind. Green marketing seems as a solution for this problem which is a matter of concern. Green marketing incorporates a broad
range of activities which includes product modification, changes to the production process, packaging changes as well as
modifying advertising. The present paper is a small endeavor to highlight the various initiatives taken by the government of India
and the big Indian corporate houses to save the environment and minimize the carbon credits. However there are some
challenges also to fulfill the dream of green India. This paper also provides some possible solutions for overcoming the problems
which are country specific and impeding the way of green India.
Keywords: Big Corporate house initiatives, Challenges for green marketing, Government initiatives, Green marketing.
1. INTRODUCTION
Unprecedented economic growth triggered by
technology revolution, globalization has led market-driven
growth in consumption pattern in the emerging economies
(Biswas, 2016). In the present era the concern over
environmental downturn, reduction of environmental impact
and sustainable development, has become the cynosure of
research among the academicians, practitioners and even
industrial entities (Rex & Baumann, 2007, Biswas & Roy,
2015). In India too, environmentalism, has started gaining
ground. Maintaining ecological balance is a major issue
confronting the corporate world today. Damage done to the
environment has already crossed the threshold and reached
alarming limits. Non replenishable natural resources are
getting depleted at a rapid pace. Generation of waste,
including biodegradable pollutants is increasing enormously.
All these negative development have forced mankind to think
more seriously about conserving the environment. Green
Marketing is one such initiative towards environment
protection, which is gaining popularity.
Green marketing was first introduced by Lazer (1969) as
a societal dimension of marketing that addresses limited
availability of environmental resources, environmental
impacts of conventional marketing and greening of the
different aspects of traditional marketing. Kotler and
Armstrong (2009) define green marketing as “marketing that
meets the present needs of consumers and businesses while
also preserving or enhancing the ability of future generations
to meet their needs”. Over the last 25 years, several aspects
of green marketing have garnered serious attention of
researchers and have prominently featured in literature.
Green marketing has gradually emerged as a philosophy to
develop, practice and communicate environmental mission-
focused business operations that result in improved
corporate reputation and market performance (lu et al.,
2013, Stainer & Stainer 1997).
Green marketing incorporates a broad range of activities,
including product modification, changes to the production
process, packaging changes as well as modifying advertising.
Marketing products and services based on environmental
factors or awareness. Companies involved in green marketing
make decisions relating to the entire process of the
company’s products such as methods of processing,
packaging and distribution. According to the American
Marketing Association, “Green marketing is the marketing of
products that are presumed to be environmentally safe.”
Green marketing which is also termed as environmentally or
sustainable marketing is the effort made by any business
organization large or small to design and promote products
that are eco friendly. Green marketing consists of all activities
designed to generate and facilities any exchange intended to
satisfy human needs and wants occurs with minimal
determinants impact on natural environment. It should look
at minimizing environmental harm not necessarily eliminating
it. Promotional activities aimed at taking advantage of the
changing consumer attitude towards a brand. These changes
are increasingly being influenced by a firm’s policies and
© SBPIM
Assistant Professor, Shaheed Bhagat Singh College (M), University of Delhi, New Delhi, 110017
Contact no.: 9311437085 Email Id: [email protected]
JOMAT Vol. 5 No.2 January – June 2017 ISSN No. 2278-9316
(36)
practices that affect the quality of the environment and
reflect the level of its concern of community. Some of the
other green marketing aspects are as follows:
(A) “ the Process of selling products and/or services based
on their environmental benefits”
(B) “Green marketing incorporates a broad range of
activities, including product modification, changes to the
production process, packaging changes, as well as
modifying advertising”.
(C) “ Green marketing is mostly about making
(breakthrough) green stuff seems normal-not about
making normal stuff seem green”
2. REVIEW OF LITERATURE
Polonsky (1995) defined green marketing as all activities
designed to generate and facilitate any exchanges intended
to satisfy human needs or wants, such that the satisfaction of
these needs and wants occur, with minimal detrimental
environment impact on the natural environment. Lynes and
Dredge (2006) analyzed that in spite of the importance of
green marketing, researchers and managers know relatively
less about how the green/eco-friendly activities, corporate
communication of green practices and green image elicit
corporate image, which in turn, affect behavioral intention.
Corporate image is crucial for a firm’s success as it provides
competitive advantage and differentiation leading to success
(Yeo & Youssef, 2010).Green marketing acts as a
communication tool for the companies to project themselves
as green in consumers’ mind and also helps in building the
relationship between the consumer and the company. It is
also very much evident through studies that environmental
strategies are now an important component of business
strategy and hence more and more companies are integrating
these issues into their business concerns. (Davis, 1991;
Kangis, 1992;Grant, 2008; Pujari et al., 2003) Green
advertising is an important facet of green marketing that
communicates greenness in products, services, practices and
processes of organizations. It refers to the appeals that
include ecological, environmental sustainability, or nature-
friendly messages targeting the needs of environmentally
sustainability, or nature-friendly messages targeting the
needs of environmentally friendly consumers (Banerjee et al.
1995, Zinkhan and Carlson, 1995). Messages in green
advertisements intend to describe product features, prices
and value for money, product availability and accessibility,
and availability and accessibility of product- related
information (Kumar 2014, Leonidou et al. 2013).
3. OBJECTIVE OF THE STUDY
The purpose of this study is to identify various initiatives
taken by the Indian companies for green marketing in their
core business values and also the challenges and way forward
to make green India happen through green marketing.
4. RESEARCH METHODOLOGY
The present study is exploratory in nature to provide a
clear guidance to the industries and government for applying
green marketing in more effective way. For this purpose
secondary data was collected through newspaper, magazines,
books, journals, government reports and websites.
5. NEED FOR GREEN MRKETING
The mankind has limited resources on the earth to satisfy
their unlimited wants. As firms face limited natural resources,
they must develop new or alternative ways of satisfying these
unlimited wants. Green marketing looks at how marketing
activities utilize these limited resources. Different group of
consumers have different levels of environmental concerns
andthus different attitudes towards green marketing. There
are some reasons for which a marketer should go for the
adoption of green marketing
5.1 SOCIAL RESPONSIBILITY
All types of consumers, both individual and industrial are
becoming more concerned and a ware about the natural
environment. So firms are realizing to behave in an
environmentally responsible manner and integrating
environmental issues into the firm's corporate culture
(Chauhan et al. 2012). Companies take their all resources
from the society itself and it becomes the duty of the
organizations to be concerned for environmental issues and
integrate it into company’s culture.
5.2 LAW COMPLIANCE
As with all marketing related activities, governments
want to "protect" consumers and society; this protection has
significant green marketing implications. The governments all
over the globe are pressurizing organizations and industries
to implement clean technologies as well as green practices
(Yadav & Pathak 2013). Governmental regulations relating to
environmental marketing are designed to protect consumers
in several ways,
• To reduce production of harmful goods or by-products.
• To ensure that the consumers have the ability to
evaluate the environmental composition of goods.
• To modify industry's consumption of harmful goods.
5.3 COMPETITIVE PRESSURE
Environmental technology can be used to gain
competitive advantage (Shrivastava1995). In many cases
firms observe competitors promoting their environmental
behaviors and attempt to emulate this behavior. In some
instances this competitive pressure has caused an entire
industry to modify and thus reduce its detrimental
environmental behavior. For example “Yagna”, an Incense
product has come up with eco friendly 100% Composite
JOMAT Vol. 5 No.2 January – June 2017 ISSN No. 2278-9316
(37)
packaging, which addresses the problem of disposing off the
packaging of worship commodities having God figures, has
given the company a better strategic position over the
competitors.
5.4 COST OR PROFIT ISSUES
Firms may also use green marketing in an attempt to
address cost or profit related issues. Disposing of
environmentally harmful by-products, such as
polychlorinated biphenyl (PCB) contaminated oil are
becoming increasingly costly and in some cases difficult.
Therefore firms that can reduce harmful wastes may incur
substantial cost savings. When attempting to minimize waste,
firms are often forced to re-examine their production
processes. In these cases they often develop more effective
production processes that not only reduce waste, but reduce
the need for some raw materials. This serves as a double cost
savings, since both waste and raw material are reduced.
6. INITIATIVES TAKEN BY THE GOVERNMENT
The following are the initiatives taken by the Government
of India:
6.1 VARIOUS LAWS AND REGULATIONS
Even before India’s independence in 1947, several
environmental legislations existed but the real impetus for
bringing about a well-developed framework came only after the
UN Conference on the Human Environment (Stockholm, 1972).
Under the influence of this declaration, the National Council for
Environmental Policy and Planning within the Department of
Science and Technology was setup in 1972. The council later
evolved into a full-fledged Ministry of Environment and Forests
(MoEF) in 1985 which today is the apex administrative body in
the country for regulating and ensuring environmental
protection. Since the 1970s an extensive network of
environmental legislation has grown in the country. The MoEF
and the pollution control boards (CPCB i.e. Central Pollution
Control Board and SPCBs i.e. State Pollution Control Boards)
together form the regulatory and administrative core of the
sector. Other than these there are various legislations for
environment protection in India such as Water (Prevention and
Control of Pollution) Act, 1974, Water (Prevention and Control
of Pollution) Cess Act, 1977, Air(Prevention and Control of
Pollution) Act, 1981, Air(Prevention and Control of Pollution)
Rules formulated in 1982, The Wildlife (Protection) Act 1972,
Amendment 1991, The Forest (Conservation) Act, 1980,
Environment (Protection) Act, 1986 (EPA), The National
Environment Appellate Authority Act, 1997, Factories Act, 1948
and its Amendment in 1987, Public Liability Insurance Act (PLIA),
1991, National Environment Tribunal Act, 1995, various
International agreements on environmental issues such as
latest one is Paris agreement 2015. Formulation of National
Green Tribunal in 2010 under the National Green Tribunal Act
2010, is another attempt to provide jurisdiction in
environmental matters shall provide speedy environmental
justice and help reduce the burden of litigation in the high
courts. This is the first body of its kind that is required by its
parent statue to apply the “Polluter pays” principle and the
principle of sustainable development. The Government has set
up various standards for environment protection such as
energy efficiency standards for appliances (refrigerators, air
conditioners, tube lights, transformers, and other electrical
appliances), energy conservation building code (ECBC), and
fuel efficiency/emission norms for vehicles.
6.2 Incentives
The Ministry of Corporate Affairs (MCA), Government of
India has taken a 'Green Initiative in the Corporate
Governance' Which enables the entity to deliver all important
documents to shareholders in the electronic form (i.e. to their
e-mail address) that have been registered with the depository
participants, including the notice of extra ordinary general
meeting, annual general meeting, director's reports, audited
financial statements, and so forth. The Finance Minister
announced ` 600 crore for green initiatives in the Union
Budget, 2011 mainly for the protection and regeneration of
forests and for environmental management. The central
government allocated for solar energy in budget (2015-2016)
was ̀ 2708 crore. While in latest union budget 2017,
Government has announced to exempt custom duty on solar
tempered glass used for manufacturing of solar cells/panel.
6.3 WASTE MANAGEMENT INITIATIVES
Solid waste management (SVM) has been an integral part
of every human society. The approaches for SVM should be
compatible with the nature of a given society. The trend
towards proactive environmental management is being
accelerated by public pressures on governments almost
everywhere to assure a cleaner environment. (Shekhdar, 2009).
One of the foremost regulations in the waste management
sector was Hazardous Waste (Management & handling) Rules,
1989 followed by Bio-Medical Waste Handling Rules, 1998. In
2014 Government of India has come up with Swatch Bharat
Mission which is a landmark plan in this regard followed by Atal
Mission Rejuvenation and Urban Transformation (AMRUT) in
2015. In the latest Union Budget 2017, Government announced
that Delhi and Jaipur will have solid waste management plants
and location of five other plants will be decided in near future.
7. BIG CORPORATES’ INITIATIVES FOR GREEN MARKETING
Many organizations want to turn to green, as an increasing
number of consumers’ want to associate themselves with
environmental friendly products. Below are the some examples
of green marketing in India by various companies:
WIPRO TECHNOLOGIES
There are various initiatives which Wipro has taken to
contribute to sustainable and Green IT. Wipro “EcoEye” was

JOMAT Vol. 5 No.2 January – June 2017 ISSN No. 2278-9316
(38)
initiated in 2008 as a comprehensive charter for ecological
sustainability. The purpose was to enable the company to
become a carbon neutral and water positive organization,
achieve defined levels of biodiversity footprints, set new
standards in recycling waste, and help employees achieve a
smaller ecological footprints in their personal lives. Wipro Green
leaf is another green initiative taken by Wipro, which is an
Intelligent Automated Power Management to identify savings,
measurement of carbon reductions and implementation of
customer organization’s Green Goals. Wipro launched its e-
waste disposal service in 2006 which provided more than
fifteen collection centers across India for e-waste. Company also
offer a green product namely Greenware which offers radiation
free monitors and energy conserving components (Krishandas
& Pillai, 2013).
TATA GROUP
India’s oldest industrial house is stepping up efforts to
reduce its carbon footprint across the value chain- from
manufacturing processes to distribution networks to eco
friendly consumer products. Tata group has specially dedicated
Tata Sustainability Group (TSG) formed in 2014 which guides,
supports and provides thought leadership to Tata group
companies in embedding sustainability in their business
strategies. In 2016, Bombay House, the group’s headquarters,
became the first and only heritage building in India to be
awarded the “Platinum Rating” of the Indian Green Building
Council (IGBC). Almost 40 Tata companies have undertaken
sustainability reporting consistent with global reporting
fireworks such as the United Nations Global Reporting Initiative
(GRI), Tata steel has gone further and reported under the new
International Integrated Reporting Council (IIRC) framework.
ADITYA BIRLA GROUP
Aditya Birla Group pioneered the idea to use hydrogen (a
by-product of the manufacturing process of caustic soda), as a
fuel to power Idea Cellular’s telecom towers. The ‘Green Idea’
initiative was launched in Nagda, to provide uninterrupted
power supply to Idea’s telecom towers, which would otherwise
consume diesel to run its generators in the absence of grid
supply. Apart from water mapping, sewage treatment and rain
water harvesting systems, the Grasim Chemical Division (GRDC),
has implanted various process to save waters. According to
Tony Henshaw, chief sustainability officer, “we are improving
our business management systems to prepare us for the
transformation of our businesses to a two- degree world”.
JINDAL STAINLESS CORP MANAGEMENT SERVICES PRIVATE
LIMITED
Various initiatives are being taken by the group such as
regular tree plantation drives are being done in the community,
to conserve water and also tap rain water, roof top water
harvesting is being promoted in the community. Organic
farming is being promoted in 24 villages in Hisar. The project
motivates farmers to grow, eat and sell organic food and reduce
the use of fertilizers in farming. Group is also promoting clean
energy by promoting bio-gas plants and Jatropha plantation.
DCM SHRIRAM INDUSTRIES
DCM Shriramindustries also dedicated to meeting their
responsibility towards protection of environment and
conserving scarce natural resources. DCM has taken various
measures such as boilers modified for multi-fuel arrangements
and can be run on various renewable fuels like bagasse, rice –
husk, and eco friendly bio-gas (methane). Effluent treatment
plants are set up in all factories to not only control discharge
pollutants within prescribed limit but also generates bio gas
which is used as a clean fuel in the boilers. Green Belt in and
around the factory and residential complexes is also
maintained. Newer technology are adopted to minimize
consumption of energy and water in the complex.
RELIANCE INDUSTRIES
Reliance Foundation has made significant efforts in
promoting ecological sustainability through resource
conservation, promotion of biodiversity and use of cleaner
energy sources. Recron Green is a result of processing post-
consumer waste into new products to prevent wastage of
potentially useful materials and resources. Reliance has
developed its own technology to convert post-consumer PET
bottles into a high quality polyester staple fiber and tow having
the properties nearly identical to the fiber produced from virgin
PET Polymer.
8. CHALLENGES AHEAD
Inspite of having different laws and incentives by
government, there are still very few companies which are
actually giving green products to the consumers. And also it
was found that only 5 percent of the marketing messages
from green campaigns are entirely true and there is a lack of
standardization to authenticate these claims (Mohan-
sundaram, 2012). There are few challenges explained below
which are blocking the way to green India.
8.1 Ineffective Monitoring of Regulations
Government is good in making laws but its
implementation part is sometimes trapped under various
legislative problems, beaurucratic attitude, legal hurdles such
as in the case of Bharat III fuel case, political willingness,
environmental issues etc. Because of weak implementation of
policies, green marketing is deceptively used by the
marketers to promote the perceptions that an organization’s
aim and policies are environmentally friendly just to increase
profits (Yadav 2013). For example few companies print the
picture of fruits on the packing of their juices just to show
that the fruit is made up of fresh fruits while it is all
concentrated chemicals and artificial flavors only. A world
without Water, emphasized on exploring the issue of water
scarcity and highlighted the water stressed areas in third-
world countries. Coca-Cola, the famous multinational
company has been accused of dehydrating communities in its

JOMAT Vol. 5 No.2 January – June 2017 ISSN No. 2278-9316
(39)
pursuit of water resources to feed its own plants, drying up
farmers' wells and destroying local agriculture. The company
has also violated workers' rights in countries such as
Colombia, Turkey, Guatemala and Russia.
8.2 LIMITED INVOLVEMENT
Indian industrial sector is made up of unorganized and
organized sector as well. Organized sector is also further
divided into large scale industries, Micro, Small and Medium
enterprises. It has been observed that maximum green
marketing efforts has been taken by the large scale industries
only. The reason behind this is the lack of resources, research
and development, awareness, willingness, soft government
policies towards MSME (Micro, Small and Medium
enterprises). In 1991, Government of India introduced
voluntary labeling scheme “Eco-Mark”, which was a kind of
certification for the environmental friendly products by the
Bureau of Indian Standards (BIS). However, the industries did
not respond to this initiative, and very few companies took
licenses.
8.3 LIMITED AWARENESS
Consumers are one of the main components of the
marketing concept. But because of low awareness level
among consumers about green products or green marketing
companies seems in no mood to provide greener options of
the products. Because as an industry green marketing would
involve lot of initial investment and research and
development cost.
8.4 PRICE CONCIOUSNESS
Green products come with a premium pricing. Pricing is
among one of the important attributes for which consumers
are concerned while purchasing the products (Pillai, 2013).
Indian market is price conscious market and most of the
consumers are not willing to pay extra (Pandurangarao et al.
2011).
9. SUGGESTIONS
9.1 EFFECTIVE WASTE MANAGEMENT
The situation of solid waste management has certainly
improved over the years. However there is still long way to
go. By greening the waste sector is expected to generate
substantial economic, environmental and social benefits such
as natural resources and energy saving, creation of new
business and jobs, energy production from waste etc. There
should be efforts to institutionalize informal sector and
modernization of recycling techniques. Informal waste
recyclers can be trained to collect the waste from
households, do decentralized waste processing and trade
recyclable waste as in demonstrated by Stree Mukti
Sangathan in Mumbai.
9.2 CONSUMER INCENTIVES
Consumers are the one of the main stakeholders and
they should get some more incentives to buy green products.
As in China, a project has been implemented for promotion of
energy-efficient products for benefits of people and
Government duly provided subsidies on electronic and
energy efficient vehicles. Some incentives can be given in the
form of rebates and deduction while filling the income tax
returns.
9.3 GREEN RATING
As we have credit rating for the companies to ensure the
credit worthiness of the company, in the same line we can
have the green rating for the company to make sure that
where a company stands in terms of their contribution
towards environment by following green marketing. With the
help of ISO 14000 international standard series, which
promotes effective environmental management systems in
organizations and organizations can get certification too. The
standard seeks to provide cost-effective tools that make use
of best practices for organizing and applying information
about environmental management. The latest version of
14001 (2015) updates and extends globally recognized
requirements for establishing, implementing, maintaining and
continually improving an Environmental Management System
(EMS) for any organization, regardless of type or size.
9.4 Environment Tax
Government can also levy additional environment tax on
the company’s which are not able to reduce its carbon
emission over the period of time as a penalty or they pollute
more than a specified limit decided by the government. China
has passed a law that will levy specific environmental
protection taxes on industry from 1 January, 2018 as part of a
renewed focus on fighting the country’s pollution woes.
9.5 CONSUMER AWARENESS PROGRAMME
Government can launch dedicated green marketing
awareness programme for general public as they have done
for skill India, Sawatch Bharat, Remonetisation, Beti Bachao
Beti Padhao, LPG Subsidy Surrender Initiative etc. So that
people can be aware of personal benefits from green
consumption.
9.6 EDUCATING CONSUMERS
Corporate entities may undertake communication
strategies that should focus on explaining their
environmental measures to their various stakeholders. This
would help in justification of prices escalation for products
with zero environmental impact. This will further help in
enhanced knowledge among consumers and may tilt their
consumption habits towards greener, cleaner and energy
saving alternatives.
9.7 MORE RESEARCH AND DEVELOPMENT
Research and development is a type of systematic
activity conducted by a company, which combines basic and
applied research in an attempt to discover solution to
problems, or to create or update goods and services. In an
environment with constant change, it’s integral for a
company to remain on the blending edge of innovation. In
2016 India spent only 0.85% of GDP on research and
development which is an issue of concern.
10. CONCLUSION
It can be said that India grapple with unbounded
environmental problems like air pollution, water pollution

JOMAT Vol. 5 No.2 January – June 2017 ISSN No. 2278-9316
(40)
and deforestation right from software to chemicals from
clothing to hospitality, it seems that the Indian industries are
ready to actively save the ecology as India moves towards
development. Green marketing phenomenon is well accepted
by Indian business community. It is well evident that people
are considerably well aware of green products. To attract
customers towards green products, the marketer must create
promotions which are both realistic and follow the ethics.
Consumers’ manifestation of intention and quantum of
willingness to pay the green price premium will open future
avenues of research.
REFRENCES
1. Banerjee, S., Gulas, C.S. and Iyer, E. (1995), Shades of Green: A Multinational Analysis of Environmental Analysis of
Environmental Advertising, Journal of Advertising, Vol. 24No(2), 21-31.
2. Biswas A. and Roy M. (2015), Green Products: An Exploratory Study on the Consumer Behaviour in Emerging Economies of
the East, Journal of Cleaner Production, Vol. 87, 463-468
3. Biswas A. (2016), A Study of Consumers’ Willingness to Pay for Green Products, Journal of Advanced Management Science,
Vol. 4 No.3, 211-215.
4. Davis, J.J.(1991), A Blueprint for Green Marketing, Journal of Business Strategy, Vol.12 No 4, 14-17
5. Grant. J.(2008), Green Marketing, Strategic Direction, Vol. 24 No 6, 25-27
6. Kanwar Naresh (2014), Green Marketing and the Indian Consumer, International Journal of Business and Management
Invention, Vol. 3, Issue 3
7. Kangis, P. (1992), Concerns about Green Marketing, International Journal of Wine Marketing, Vol.4 No 2, 21-24.
8. Kotler, P. and Armstrong, G. (2009), Principles of Marketing, 13th
ed. Pearson, Englewood Cliffs, NJ.
9. Kumar, P. (2014), Greening Retail: An Indian Experience, International Journal of Retail and Distribution Management, Vol.
24 No7, 613-625
10. Lazer, W. (1969), Marketing’s Changing Social Relationships, Journal of Marketing, Vol. 33 No.1, 3-9.
11. Leonidou, C. N. Katsikeas, C.S. and Morgan, N.A.(2013), Greening’ the Marketing Mix: Do Firms Do It and Does It Pay Off?,
Journal of Academy of Marketing Science, Vol. 34 No 2, 7-20
12. Lu, L., Bock, D. and Joseph, M. (2013), Green Marketing: What the Millennial Buy, Journal of Business Strategy, Vol. 34
No 1, 3-10
13. Lynes, J.K. and Dredge, D. (2006), Going Green: Motivations for Environmental Commitment in the Airline Industry, A Case
Study of Scandinavian Airlines, Journal of Sustainable Tourism, Vol. 14 No.2, 116-138
14. Mohansundaram, V. (2012), Green Marketing: Challenges and Opportunities, International Journal of Multidisciplinary
Research, Vol.2 No.4, 66-73.
15. N. Krishandas & Pillai R. Radhakrishna (2013), Green IT at Wipro: A Sustainable Solution?, IIMK/WPS/138/IT/2013/24
16. Pandurangarao, D., Basha S.C., & Satyakumar, K.V.R. (2011), Consumer’s Perception and Purchase Intention towards Green
Products, International Journal of Research in Commerce, IT & Management, Vol. 1 No.7, 63-66
17. Pillai, R. P.(2013), It’s time to Green with Pride : A conceptual study of green marketing, Indian Journal of Marketing, Vol. 43
No.4, 30-34
18. Polonsky, M.J. (1995), “A Stakeholder Theory Approach to Designing Environmental Marketing”, Journal of Business and
Industrial Marketing, Vol. 10 No 3, 29-46
19. Pujari, D., Wright, G. and Peattie, K. (2003), Green and Competitive: Influences on Environment New Product Development
Performance, Journal of Business Research, Vol. 56, 657-671.
20. Rex E. and Baumann H. (2007), Beyond Eco Labels: What Green Marketing Can Learn from Conventional Marketing, Journal
of Cleaner Production, Vol. 15 No. 6, 567-576.
21. Shrivastava, P. (1995), Environmental Technologies and Competitive Advantage, Strategic Management Journal, Vol. 16 (SI),
183-200.
22. Shekdar Ashok V.(2009), Sustainable Solid Waste Management: An Integrated Approach for Asian Countries, Waste
Management, Vol. 29 No.4, 1438-1448.
23. Stainer, A. and Stainer, L. (1997), Ethical Dimensions of Environmental Management, European Business Review, Vol. 97
No. 5, 224-230
24. Yadav Rambalak & Pathak Govind Swaroop (2013), Green Marketing: Initiatives in the Indian Context, Indian Journal of
Marketing, October 2013.
25. Yeo, R.K. & Youssef, M.A.(2010), Communicating Corporate Image into Existence the Case of the Saudi Banking Industry,
Corporate Communications: An International Journal, Vol. 15 No. 3, 263-280.
26. Zinkhan, G.M. and Carlson, L. (1995), Green Advertising and the Reluctant Consumer, Journal of Advertising, Vol. 24 No.2,
1-6.
���

JOMAT Vol. 5 No. 2 January – June 2017 ISSN No. 2278-9316
(41)
HUMAN RIGHTS DIMENSIONS: A ROAD MAP TO GOOD GOVERNANCE
Purandhar Dhanpal Nare
ABSTRACT
Human rights are rights inherent in all human beings, are interrelated, interdependent and indivisible. All nations in the
world have obligation to ensure the same to its people. India has also accepted the human rights as basic rights of its citizens and
the state is committed to guarantee these rights to every subject of this country. As we aware, Human rights belong to everyone,
everywhere, regardless of nationality, sexuality, gender, race, religion or age. The foundation of modern human rights is
the Universal Declaration of Human Rights (UDHR). The 30 articles of the Declaration were adopted in 1948 by the United
Nations General Assembly, and over time these have been integrated into national laws and international treaties. The core
values of the UDHR - human dignity, fairness, equality, non-discrimination - apply to everyone, everywhere. The Constitution of
India provides for Fundamental rights, which include freedom of religion. Clauses also provide for freedom of speech, as well as
separation of executive and judiciary and freedom of movement within the country and abroad.Presently there is a widespread
acceptance of the importance of human rights in the international structure. However, one will not hesitate to admit that there is
a confusion prevailing as to its precise nature and scope and the mode of International Law as to the protection of these
rights.“Corruption threatens the rule of law, democracy and human rights; undermines good Governance, fairness and social
justice; distorts competition, hinders economic development.
Keywords: HUMAN RIGHTS, Corruption in Governance: Human Rights Dimensions, Human Rights Must Be Protected by the
Rule of Law.
INTRODUCTION:
Human rights are rights inherent in all human beings,
irrespective of nationality residence, sex, origin, colour,
religion, language or any other status i.e., without any
discrimination.
These rights are interrelated, interdependent and
indivisible. The human rights jurisprudence is shaped
internationally by three major documents of United Nations
(i) Universal Declaration of Human Rights, 1948 (ii)
International Covenant on Civil and Political Rights 1966 (iii)
International Covenant on Social Economical and Cultural
Rights, 1996.
There are a lot more human rights documents relating to
different areas which are made part of the international
human rights jurisprudence and provide a common
understanding of meaning and content of human rights
internationally.
All nations in the world have obligation to ensure the
same to its people. India has also accepted the human rights
as basic rights of its citizens and the state is committed to
guarantee these rights to every subject of this country.
India is a democratic country governed by the
constitutional principles in all its deeds. Indian Constitution
provides mission and vision of this country. Preamble,
chapters on fundamental rights (Part III) and Directive
Principles of State Policy (Part IV) project the fundamental
policies of governance.
These parts lay down the basic constitutional values and
ultimate social goals of the country.
By ensuring protection of civil and political rights of
people as fundamental socio-economic rights and as
fundamental principles of governance, Indian constitution is
trying to balance the protection of rights of the subjects in all
perspective.
Indian judiciary has also contributed in its own way by
interpreting the provisions guaranteeing fundamental rights
in the light of the norms laid down in the directive principles.
The human rights jurisprudence in India also revolves
around these parts and their interpretations.
Indian courts examined the human rights content in the
constitution in many instances.
By using the tool of harmonious construction for
interpreting fundamental rights and directive principles, the
judiciary developed the jurisprudence founded on human
rights in India.
© SBPIM
Principal, Night College of Arts and Commerce, Ichalkaranji, Kolhapur - 416115
Contact no.: 8087598793 Email Id: [email protected]
JOMAT Vol. 5 No.2 January – June 2017 ISSN No. 2278-9316
(42)
When this human rights perspective is transported to
governance, it poses many challenges.
At the same time no democracy is efficient, if it does not
protect the basic rights of its subjects.
Hence, protection of human rights is nothing but part
and parcel of good governance in India.
WHAT ARE THE HUMAN RIGHTS?
In order to live with dignity certain basic rights and
freedoms are necessary, which all Human beings are entitled
to, these basic rights are called Human Rights
Human rights demand recognition and respect for the
inherent dignity to ensure that everyone is protected against
abuses which undermine their dignity, and give the
opportunities they need to realize their full potential, free
from discrimination.
Human rights include civil and political rights, such as:
# The right to freedom of expression
# The right to freedom of religion or conscience
# The right to property # The right to freedom of assembly
# The right to privacy # The right to vote.
Human rights also cover economic and social rights, such as:
# The right to an adequate standard of living
# The right to adequate food, housing, water and sanitation
# The rights you have at work # The right to education
As we aware, Human rights belong to everyone,
everywhere, regardless of nationality, sexuality, gender, race,
religion or age. The foundation of modern human rights is
the Universal Declaration of Human Rights (UDHR). The 30
articles of the Declaration were adopted in 1948 by the
United Nations General Assembly, and over time these have
been integrated into national laws and international treaties.
The core values of the UDHR - human dignity, fairness,
equality, non-discrimination - apply to everyone, everywhere.
HUMAN RIGHTS IN INDIA:
It is an issue complicated by the country's large size and
population, widespread poverty, lack of proper education and
its diverse culture, even though being the world's largest
sovereign, secular, democratic republic. The Constitution of
India provides for Fundamental rights, which include freedom
of religion. Clauses also provide for freedom of speech, as
well as separation of executive and judiciary and freedom of
movement within the country and abroad. The country also
has an independent judiciary [ and well as bodies to look into
issues of human rights.
The 2016 report of Human Rights Watch accepts the
above-mentioned faculties but goes to state that India has
"serious human rights concerns. Civil society groups face
harassment and government critics face intimidation and
lawsuits. Free speech has come under attack both from the
state and by interest groups. Muslim and Christian minorities
accuse authorities of not doing enough to protect their rights.
But in the recent years, more emphasis is given to minority
rights and freedom of speech. The government is yet to
repeal laws that grant public officials and security forces
immunity from prosecution for abuses."
HUMAN RIGHTS VIOLATION
The Founding Fathers of the Indian Constitution had a
vision of the Indian society, which they wanted to realize
through the Constitution. That vision was primarily reflected
in the Preamble, the chapters on Fundamental Rights and
Directive Principles of State Policy is the product of human
rights movement in the country. It is the duty of the State to
guarantee what is said in the Constitution. But the shocking
evidence that the State is itself the culprit, according to Mr.
J.S. Verma, the former chairman of the NHRC. According to a
statement made by him on Jan. 15, 2003, just a few days
before his demitting the office: It is often the State which is
violator of Human Rights in maximum cases in the country.
But the maximum responsibility to protect and safeguard the
rights of its citizens also lies with the State.
A terrorist attack is not only an attack on innocent
individuals but it is an attack on our sovereignty,
Unity and Integrity and our feeling of Nationalism.
Unlawful Activities (Prevention) Act, 1967:
Some laws enacted due to Terrorism
# Terrorist and Disruptive Activities (Prevention) Act, 1987:
# Maharashtra Control of Organized Crime Act, 1999
# Prevention of Terrorism Act, 2002
REALIZATION OF HUMAN RIGHTS AND ROLE OF NGO:
Human rights as the ‘Rights relating to life, liberty,
equality, and dignity of individuals guaranteed by the
constitution or embodied in international covenants and
enforceable by the courts in India’.
The term non-governmental or, more accurately
non-profit is normally used to cover the range of
organizations which go to make up civil society. Such
organizations are characterized, in general, by having as the
purpose of their existence something other than financial
profit. However, this leaves a huge multitude of reasons for
existence and a wide variety of enterprises and activities.
NGOs range from small pressure groups on, for example,
specific environmental concerns or specific human rights
violations, through educational charities, women's refuges,
cultural associations, religious organizations, legal
foundations, humanitarian assistance programs. The

JOMAT Vol. 5 No.2 January – June 2017 ISSN No. 2278-9316
(43)
Economic and Social Council maymake suitable arrangements
for consultation with nongovernmental organizations which
are concerned with matters within its competence.
Such arrangements may be made with international
organizations and, where appropriate, with national
organizations after consultation with the Member of the
United Nations concerned.
NGO’s have a vital role to play in the promotion and
protection of human right specially in the developing country,
has the largest number of NGO’s whose activates are spared
in different fields for the welfare of human being including
the promotion and protection of human right.
Why Human Rights Must Be Protected by the Rule of
Law:
Human Rights have a projection of universality but as a
matter of ground reality they are not the same for all people
and societies. For some, especially the well-advanced west,
they are predominantly matters of civil and political liberty
while for others, the developing and under-developed Asian,
Africa and Latin America, predominantly they are also
matters of survival. Human Rights are therefore about being
citizen of the earth, being part of an earth family. Human
Rights in my view are exercised to their fullness through
participating in earth democracy-the democracy of all life.
And as earthlings, our human duties to protect the earth and
all her beings are the ground from which Human Rights
emerge.
"All humanity is one undivided and indivisible family, and
each one of us is responsible for the misdeeds of all others. I
cannot detach myself from the wickedest soul." Mahatma
Gandhi.
CORRUPTION IN GOVERNANCE: HUMAN RIGHTS
DIMENTSIONS
“Corruption threatens the rule of law, democracy and
human rights; undermines good Governance, fairness and
social justice; distorts competition, hinders economic
development, and endangers the stability of democratic
institutions and moral foundations of society.” –The
Preamble of the Council of Europe Criminal Conventionon
Corruption.
“Ignorance, forgetfulness or contempt for human Rights
are the only causes of public misfortune and the corruption of
Governments.” - The Preamble of the Declaration of Human
and Citizens Rights, 1789.
MAJOR CAUSES OF CORRUPTION:
The Santhanam Committee constituted by the Central
Government of India, has identified certain procedural causes
of corruption like red tape and administrative delay,
unnecessary regulations, scope of personal discretion,
cumbersome procedures, scarcity of goods and services, and
lack of transparency. In India there are two dimensions of
corruption. One is exploitative corruption where the public
servant or the private party entrusted to perform the specific
tasks exploits the helpless poor citizen. The second one is
collusive corruption where the citizen corrupts the public
servant by bribe and avails better benefits. In fact both
perpetuates inequality thus striking at the very concept of
rule of law-the bed rock of democracy, which is
acknowledged as the best system of governance to ensure
respect for human rights.
IMPACT OF CORRUPTION ON HUMAN RIGHTS
Modern state wedded to the principle of general public
welfare is duty bound to provide such governance which can
guarantee to one and all without discrimination, the basic
human rights. Thus state has three levels of obligations in
relation to human rights: obligation to respect, to protect and
to fulfill. The obligation to respect requires the state to
refrain from any measure that may deprive individuals of the
enjoyment of their rights or their ability to satisfy those rights
by their efforts The obligation to protect requires the state to
prevent violations of human rights by third parties. The
obligation to fulfill requires the state to take measures to
ensure that people under its jurisdiction can satisfy basic
needs (as recognized in human rights instruments) that they
cannot secure by their own efforts. Hence violation of human
rights occur when state’s action or omission fails to confirm
with its obligation to respect, protect or fulfill recognized
human rights of its person under its jurisdiction.
While analyzing the link between corruption and human
rights violation, it is of three fold. Corruption may amount to
direct violation of human rights, when state or an official acts
or omits in a way that prevents individuals from having access
to that right. It may be indirect violation when even without a
direct connection; corruption may be an essential
contributing factor (a necessary condition) in a chain of
events that lead to violation of human rights. For instance,
Corruption may be an indirect cause where corrupt
authorities seek to prevent the exposure of corruption or
may turn blind eye to corruption. It may be remote when
corruption is one factor among others for human rights
violation.
JOMAT Vol. 5 No.2 January – June 2017 ISSN No. 2278-9316
(44)
CORRUPTION AND SPECIFIC HUMAN RIGHTS
The idea of reconciling corruption and human rights
violation can be seen in several human rights instruments like
UDHR, ICCPR, ICESCR etc. These instruments reveal that right
to corruption free governance is a basic human right and
corruption is really a human rights violation especially right to
life, liberty, equality and non discrimination, right to political
participation, right to information, several economic social
and cultural rights like, right to food, water, housing,
education, environment, right to law enforcement and fair
trial and access to justice.
CONCLUSION
Presently there is a widespread acceptance of the
importance of human rights in the international structure.
However, one will not hesitate to admit that there is a
confusion prevailing as to its precise nature and scope and
the mode of International Law as to the protection of these
rights. One valuable lesson that the history of human rights
teaches us is that they are not static but are developed in
response to new modes of political thought and changes in
the international environment.
REFERENCES:
1. Times of India, 15 November 2013
2. UN Report 26th May 2005
3. Jump up^ "India". Retrieved 2016-08-02
4. Jump up^ "India". 2016-01-08. Retrieved 2016-08-02
5. www.chrgj.org “Hidden Apartheid: Caste Discrimination against India’s Untouchables (2007
6. www.dailypioneer.com/state-editions/act-in-block-grant-teachers-issue-nhrc-to-ohrc.html
7. www.freepressjournal.in/hands-off-supreme-court-tells-govt-reaffirming-its-primacy-in-judicial-appointments/743321
8. www.monitor.upeace.org 32 www.amnesty.org/en/region/india/report/2012 33 Report from the economic Intelligence
Unit available at www.eiu.com
9. www.ndtv.com/india-news/no-worry-till-judiciarys-independence-is-maintained-chief-justice-of-india-1251654
10. www.worldbank.org/en/country/india/overview 2013 October country updates says 133 million people are relieved out of
poverty between 2005- 2012.
���

JOMAT Vol. 5 No. 2 January – June 2017 ISSN No. 2278-9316
(45)
INVESTIGATING THE IMPACT OF LEAN MANUFACTURING PRACTICES FOR COMPETITIVE
ADVANTAGE – A CASE STUDY OF AUTO COMPONENT MANUFACTURING INDUSTRY
Umesh Arvind Deshpande 1
Anil Keskar 2
ABSTRACT
The auto component manufacturing industries are facing severe challenges for their survival. Thus many firms have started
implementing lean manufacturing. Lean helps the firms to identify the non-value added activities and value added activities by
eliminating wastes, where waste is anything for which customer is not ready to pay. This research is undertaken with an aim to
evaluate the impact of lean manufacturing practices for competitive advantage in the auto component manufacturing industry.
The research objective are to identify lean manufacturing practices adopted by the auto component industries, to determine the
effects of lean manufacturing practices for the competitive advantage, and to propose strategies for enhancing lean
manufacturing practices as a competitive advantage. A formalized, unconcealed, close-ended questionnaire for collecting cross-
sectional data from sample of 42 respondents from Pune is used. This research results in the importance of value concept, flow
and customers as principal, supporting lean manufacturing practices. Majority of the firms were found to follow different
principles of lean manufacturing. Value concept, value stream mapping, Kanban, Flow, Waste elimination, maintenance,
customers, JIT, consumer cooperation, development of excellent suppliers and development of lean design seems to be the most
preferable techniques in lean manufacturing.
Keywords: Lean Manufacturing, Competitive Advantage, Value Concept
1. INTRODUCTION
1.1 BACKGROUND OF THE STUDY
The auto component manufacturing industries are facing
severe challenges for their survival, thus many firms have
started implementing lean manufacturing practices with a
goal of doing more in less time, less inventory, less resources,
less effort with lesser infrastructure, for achieving maximum
customer satisfaction by delivering more value. Lean
manufacturing system involves effective and efficient
manufacturing system to create the same outputs as those
created by traditional system but contributing to increased
value for customer.
Lean helps the firms to identify the non-value added
activities and value added activities by eliminating wastes,
where waste is anything for which customer is not ready to
pay. The different lean tools that eliminate waste are kaizen,
kanban, work standardization, cellular manufacturing, single
minute exchange of dies, value stream mapping etc. The lean
manufacturing is adopted by many firms as a potential
solution to eliminate the waste generation. The auto
component manufacturing industry has experienced
tremendous growth over the last few years in the Indian
economy. The demand for automobiles has expanded since
the 1980, increasing the need for effective usage of resources
available. Lean manufacturing was adopted by auto
component industry as a suitable method to fulfill the
demands of the customers, which reduces waste in all forms
and helps to maintain adequate availability of resources.
According to Jadhav, et al. (2015) to match the
competition on the global level, the Indian auto component
industry has shifted their thinking in favour of lean
manufacturing in order to improve the production
capabilities, quality and the overall productivity. Small and
medium enterprises (SMEs) entered into the rapidly
expanding market of auto components. Although large
enterprises with foreign and technical collaboration have
maintained major share of critical components. SMEs which
started business in the 1980s and 1990s, have also grown and
some of them becoming large enterprises. In the 2000s, the
© SBPIM
1PhD Research Scholar, Dr. D. Y. Patil Vidyapeeth, Global Business School & Research Centre, Pune
Contact no.: 9822080214 Email Id: [email protected]
2Professor & Advisor, Dr. D. Y. Patil Vidyapeeth, Pune
Contact no.: 9890298140 Email Id: [email protected]

JOMAT Vol. 5 No. 2 January – June 2017 ISSN No. 2278-9316
(46)
need to use high end technology raised initial investment
levels, acting as an entry barrier for SMEs. At the same time
exports of auto components to replacement market also
increased during these years. Many SMEs concentrated only
on exports. In addition to SMEs, tiny enterprises took the
machining of components and catering to domestic
replacement market faced severe price competition.
According to Schonberger, 2007 lean manufacturing was
initiated by a Japanese automotive company, Toyota, during
1950’s. Lean manufacturing was transferred across the
countries and industries because of its superiority in cost,
quality and faster response. Lean manufacturing has been
widely accepted and adopted as the best manufacturing
practice. Womack et. al. (1990) concludes that primarily, the
motives of lean manufacturing were to reduce the cost of
product and to improve the productivity by excluding wastes
and non- value added activities. Moreover, the success in
implementing lean manufacturing varies according to various
factors. The prior study has put forth four success factors:
proper leadership, financial system, skills and supportive
organization (Achanga et al, 2006). A proper implementation
of set of lean principles and equipment’s also result in the
success of lean manufacturing as suggested by other
researchers. However, not many organizations are successful
in adapting this system on a global level (Balle, 2005).
Moreover, as per Oliver (1996) the previous researchers
conclude that there is no ‘help book’ to refer to follow lean
manufacturing process and the procedure that explains the
tools and techniques required. Several companies have
implemented lean manufacturing practices through many
different ways according to their respective environment and
needs which further contributed in their competitive
advantage over the others. Therefore, it is essential to
conduct the research to find out the impact of lean
manufacturing practices for competitive advantage, that
varied from organization to organization. This study will help
in identifying the improvements in the companies that
adopted lean manufacturing process which helped them as a
competitive advantage. The study will also propose the plans
for enhancing lean manufacturing practices as a competitive
advantage booster for auto component manufacturing
industry.
1.2 PROBLEM STATEMENT
In the explosion of development era, lean manufacturing
has emerged as a successful process in the domain of auto
component manufacturing industry. Forrester, (1995)
asserted that lean manufacturing usually leads to a shift from
exposure to problem solving.
In India, the problem of broad production has been there
for last few years but after adapting advanced technology
some industries have been focusing on demand for quality
output which can be accomplished by adapting effective
production systems. This study sought to assess the impact of
lean manufacturing practices for competitive advantage in
case of auto component manufacturing industry. The study is
designed to determine effect of lean manufacturing as
competitive advantage. It also suggests some strategies for
waste reduction and the challenges in adopting lean
manufacturing. Global competition has forced every
production sector to rethink over their strategies to achieve
competitive advantage. This research aims to give a glance at
the essentiality of these advanced strategies and lean
manufacturing as important one among them. In an
advanced and technical era, the study highlights the benefits
of advanced concepts to increase the productivity. The study
explains that improving management style as well as better
inventory management can lead to a more effective practice
of lean manufacturing practices. Keitany P. and Riwo-Abudho
M., (2014) conclude that, material management and physical
distribution are positively related and are therefore critical
determinants of successful lean production practice within
the organization. The research determines the effects of lean
manufacturing practices on the competitive advantage in
auto component industry. The study aims to suggest
enhancing lean manufacturing practices as a competitive
advantage booster for auto component manufacturing
industry with its effects.
1.3 AIM AND OBJECTIVES OF THE STUDY
The research is undertaken with an aim to evaluate the
impact of lean manufacturing practices for competitive
advantage in the auto component manufacturing industry.
The study was carried with following objectives
1. To identify lean manufacturing practices adopted by the
auto component industry.
2. To determine the effects of lean manufacturing practices
for the competitive advantage in auto component
industry.
3. To propose strategies for enhancing lean manufacturing
practices as a competitive advantage booster for auto
component manufacturing industry.
1.4 RESEARCH QUESTIONS
1. What are the lean manufacturing practices adopted by
the auto manufacturing industry?

JOMAT Vol. 5 No. 2 January – June 2017 ISSN No. 2278-9316
(47)
2. What are the effects of lean manufacturing practices on
the competitive advantage in auto component industry?
3. What are the strategies for enhancing lean
manufacturing practices as a competitive advantage
booster for auto component manufacturing industry?
1.5 SIGNIFICANCE OF THE RESEARCH
Lean manufacturing is a technique really essential for the
industrial growth. This academic studywill be significant for
its observations on the impact of lean manufacturing for
competitive advantage. Its aim is to provide a conceptual
understanding to develop a framework to improve the
concept of lean manufacturing and its importance in
developing new entrants in auto component manufacturing
industry in specific. This study will be beneficial for the
growth of auto component industry. The study will help to
increase awareness about lean concepts and its applicability
to different organizations and managers to enhance
productivity, quality and eliminate waste. Moreover these
organizations gain a deeper understanding about the ways to
improve and enhance the use of lean manufacturing for the
welfare of the society. Further clarity can be generated on
lean manufacturing by expanding the areas under research
related to this study.
2. LITERATURE REVIEW
The aim of this study is to provide an overview on the
impact of lean manufacturing for competitive advantage in
auto manufacturing industry. Researcher proposes the
conceptual framework to understand the impact of lean
manufacturing in its entirety. Over the last 15 years, a
number of scholarly articles have been published on lean
manufacturing with its philosophies, tools, and techniques
(Shah and Ward 2003). An extensive study is available on lean
manufacturing advancements (Holweg 2007, Womack1990).
Shah (2007) asserts that the evolution of lean has resulted in
different terms and descriptions regarding lean
manufacturing because there is no single invention. Shah also
explains a definition that involves many components of lean:
Lean manufacturing is an integrated socio technical system
whose main objective is to eliminate waste by concurrently
reducing and minimizing supplier, customer, and
internalvariability.
The lean philosophy works on minimizing or eliminating
the waste or any excess. (Claycomb, etal. 1999). Lean can be
summarized in five principles: specify value by specific
product, find the value concept for every product, make value
flow without any problems, let the customer pull value from
the source and pursue perfection (Womack and Jones (1996).
Further, Jones (2013) mentioned that lean manufacturing
uses various tools to help in achieving the desired outcomes
on lean manufacturing. Some of the tools which were
mentioned are 5S, Kanban or pull system, error proof
concepts and visual systems as well. Using such techniques,
the industry aims to decrease waste in their production
practices and hence focus their attention on Value added
operations. Further, studies by some researchers have found
a lack of significant connection between JIT practices and
performance (Dean and Snell 1996), while others identified
significant positive relationships between them (Shah and
Ward 2003). According to Ohno (1988), there are seven
significant tools in implementing the lean manufacturing:
Overproduction, Time on hand (waiting), Over-processing,
Transportation, Stock on hand, Movement & Making
defective products.
Additionally, the concepts of choosing between all the
techniques that are needed in lean manufacturing differ from
organization to organization. The preference of lean
principles also varies according to researchers. The company
must believe in delivering greater value to its customers or
should be able to create comparable value at a lower cost, or
both (Porter 1996). Some strategists also believe that
competitive advantage in lean manufacturing is not obtained
from adopting certain principlesthat others can easily imitate,
but they should be different, in other words, a different set of
activities should be used to deliver a unique mixture. In order
to accomplish an advantage and significant barriers to
implementation must be created (Porter 1996). Further Ohno
(1988) asserts that an effective implementation of these
principles will help to deliver product to a customer faster by
removing the non-value added waste. According to Ubale S.S.
(2016) improved coordination in supply chain and lean
production technique will be a key to success for small firms.
The irony is, units think about their own supply chains and
manufacturing problems only. Many times due to lack of
coordination between supply chain and lean production
technique results in to high inventory, and supplier
problems, further results in to dissatisfied customers.
Moreover lean will help owners of small firms to come out of
situations where they find themselves in a very real tug of
war pulled one way by customers mounting demands and the
opposite way by the company’s need for growth and
profitability.
All of this suffices to say that lean principles can lead an
organization to a company-wide focus on the customer’s

JOMAT Vol. 5 No. 2 January – June 2017 ISSN No. 2278-9316
(48)
needs and on continuous improvement. Further, the study
explains the proportion of the respondents those expressed
their organizations willingness to adopt lean manufacturing
for a competitive advantage with the proportion those
expressed the denial in the adaption of lean manufacturing
for the same.
3. RESEARCH METHODOLOGY
The research has been conducted using a specific
framework in mind to coverall the objectives and theme of
the study. This research has broadly replicated the descriptive
research design which aims to ‘portray an accurate profile of
persons, events or situations’ (Saunders et al., 2009).
Researcher has used a base of understanding gained from
earlier research on lean manufacturing as a competitive tool
in auto component manufacturing industry then used that
understanding to collect data.
Research paradigms fall into a Positivism category since it
also uses tests by investigating numerical data gathered from
42auto components manufacturing firms where primary
respondents were working on or above managerial level.
Payne and Payne (2004) points out that positivism is the word
that is originally developed to oppose negativity but now it is
used in the negative way. Few researchers describe
themselves as positivists and they will tend to focus on the
positive aspects. The early nineteenth-century French
philosopher Auguste Comte introduced the term ‘positivism’.
A formalized, unconcealed, closed-ended questionnaire
for collecting cross-sectional data from sample of 42
respondents from Pune is used. Convenience random
sampling was used for sample selection, thereby providing
the researcher a reliable and representative dataset. Likert
scale is the major tool employed for collecting information
from the samples. This has been used since the study aims at
assessing the performance of the various companies who
followed lean manufacturing among the firms under study,
and has divided the evaluation of performance levels into 5
categories, namely, Strongly disagree, Disagree, No opinion
or uncertain, Agree, and Strongly agree. Finally, SPSS
software has been applied for performing a statistical analysis
of the data collected.
4. RESULTS AND DISCUSSIONS
The questionnaire was tested for reliability using
Cronbach’s method which showed good reliability (0.775).
The researcher chose 42 respondents, out of which 39 were
males and remaining were females. The results showed that a
majority of the respondents (29.2%) belonged to the age
group category of 40 and above age group, while another
26.5% of the respondents belonged to the age group of 25-30
years. Among these, a clear majority, i.e., 31% of the
respondents were highly educated up to post graduate
degree, 29% were under graduate, 21% possessed a diploma,
while 19% were doctorate. Further, 66% respondents had
working experience between1to5 years. The majority of firms
i.e., 36.3% were established since less than 5 years but it is
also seen that 13.2% of the firms were established from last
10-15 years. Further, about 57% of the respondents
expressed that their organization is willing to use / adopt lean
manufacturing practices in their organization whereas 40%
expressed denial for the adaptation of lean manufacturing
practices in their organization. A majority (i.e., 55%) of the
respondents expressed that lean manufacturing practices
help to gain competitive advantage to their organization but
clearly a majority of 40% were not of a view that lean
manufacturing helps in gaining competitive advantage to
their organization.
Moreover, about 11% respondents expressed that value
concept in the lean manufacturing has ability to gain
competitive advantage. This was followed by flow, customers,
development of excellent supplies were reported by a close
10.5%, 10.2% and 9.8% of the respondents respectively,
whereas maintenance (8.3%) and customer cooperation
(8.3%) value stream mapping (7.1%) and Kanban (7.1%) were
considered lesser important after them. Additionally, this
study also focusses on the role of value concept in the lean
manufacturing practices. The importance of value flow is also
brought out in the lean manufacturing process. Moreover,
this study involves customers, development of excellent
supplies and development of lean design as important
principles after the value concept which is considered most
important. This research results in the importance of value
concept, flow and customers as principal supporting lean
manufacturing practices which matches the research by
Womack and Jones (1996).
The beta coefficients corresponding to the association
between the dependent variable competitive advantage and
value concept, value stream mapping, Kanban, Flow, Waste
elimination, maintenance, customers, JIT, consumer
cooperation, development of excellent suppliers and
development of lean design had positive and significant
relationship since the p value corresponding to them is less
than 0.05and is mentioned as a very essential tool in lean
manufacturing by Jones (2013). In support of this, Jones
(2013) asserts that the important tools in lean manufacturing

JOMAT Vol. 5 No. 2 January – June 2017 ISSN No. 2278-9316
(49)
are 5S, SPC, Kanban or pull system and error proof processes.
The current study corresponds with the outcome of the
research done by Jones (2013) in which the researcher has
mentioned importance of Kanban. Hence, this study
highlights all the principles included in lean manufacturing for
competitive advantage in auto component industry.
5. CONCLUSION AND RECOMMENDATIONS
The inventory classification done by researchers based
on various different criterions is becoming increasingly
common among Indian auto component firms, to efficiently
recognize the impacts of lean manufacturing for competitive
advantage in auto component industry. The most frequently
used classification for the relative important; very important,
average important, and unimportant, has helped these firms
in managing their time and resources in a better way (Rezaei,
2010). This has been possible due to the adequate degree of
attention given to the more important items. As evident from
the study results discussed above, a majority of the firms
were found to follow different principles of lean
manufacturing. Value concept, value stream mapping,
Kanban, Flow, Waste elimination, maintenance, customers,
JIT, consumer cooperation, development of excellent
suppliers and development of lean design seems to be the
most preferable techniques in lean manufacturing from the
present study, out of which value concept, flow, customers,
Kanban and JIT principles are considered positive by other
researchers mentioned in the paper.
This research has been done on the basis of sample
pieces. It is an academic research associated with time and
financial constraints. The study is only related to lean
manufacturing practices for competitive advantage in auto
component industry. The urgent requirement for other firms
is to identify these important principles that have an impact
on lean manufacturing as competitive advantage. Further,
this study encourages the extensive empirical research on the
impact of lean manufacturing practices on a larger scale. A
further study on “why other particular components have not
been incorporated efficiently in these firms for lean
manufacturing”? can be a useful source of knowledge. A
comparable study could also be done with respect to an
impact of lean manufacturing as competitive advantage in
automobile and auto component industries. Identifying the
major challenges faced by these auto component companies,
and further suggesting the solutions/recommendations for
the same, can significantly improve the overall status of lean
manufacturing as competitive advantage.
REFERENCES
1. India Brand Equity Foundation, 2017 www.ibeg.org
2. R. J. Schonberger, "Japanese production management: An evolution - with mixed success," Journal of Operations
Management, vol. 25, pp. 403-419, 2007.. J. P.Womack, D. T. Jones, and D. Roos, The Machine That Change The World New
York: Rawson Associates Scribner, 1990.
3. Asanuma, Banri (1989): “Manufacturer-Supplier Relationships in Japan and the Concept of Relation-Specific Skill”, Journal of
the Japanese and International Economics, 3 (1): 1-30.
4. Herron, C. and Christian, H. (2008), The transfer of selected lean manufacturing techniques from Japanese automotive
manufacturing into general manufacturing (UK) through change agents, Robotics and Computer-Integrated Manufacturing,
24, pp. 524-531.
5. Yadav, O. P., Nepal, B., Goel, P. S., Jain, R. and Mohanty, R. P. (2010), Insights and learnings from lean manufacturing
implementation practices, Int. J. Services and Operations Management, Vol. 6, pp. 398-422.
6. J. R. Jadhav S. S. Mantha S. B. Rane (2015) Roadmap for Lean implementation in Indian automotive component
manufacturing industry: comparative study of UNIDO Model and ISM Model
7. P. Achanga, E. Shehab, R. Roy, and G. Nelder, "Critical Success Factors for Lean Implementation within SMEs," Journal of
Manufacturing Technology Management, vol. 17, pp. 460-471, 2006.
8. M. Balle, "Lean attitude - Lean application often fail to deliver the expected benefits but could the missing link for successful
implementations be attitude?," in Manufacturing Engineer. vol. 84, 2005, pp. 14-19
9. N. Oliver, "Lean production practices," British Journal of Management, pp. 1-10, 1996. Payne, G. and Payne, J. (2004) Key
Concepts in Social Research, London, Sage.

JOMAT Vol. 5 No. 2 January – June 2017 ISSN No. 2278-9316
(50)
10. Shah, R., "Lean manufacturing: context, practice bundles, and performance." Journal of Operations Management 21 (2003):
129-149.
11. Womack, J. P., and D. T. Jones. Lean Thinking: Banish Waste and Create Wealth in Your Corporation. New York: Free Press,
1996.
12. Holweg, M. "The Genealogy of Lean Production." Journal of Operations Management, 2007: 420-437.
13. Claycomb, C., R. Germain, and C. Droge. "Total system JIT outcomes: inventory, organization and financial effects."
International Journal of Physical Distribution & Logistics Management 29, no. 10 (1999): 612-630.
14. Womack, J. P., and D. T. Jones. Lean Thinking: Banish Waste and Create Wealth in Your Corporation. New York: Free Press,
1996.
15. Ohno, T. The Toyota Production System: Beyond Large Scale Production. Portland, OR: Productivity Press, 1988.
Louis G. Jones 2013, The Sustainability of Lean Manufacturing as a Competitive Advantage Brigham Young University –
Provo
16. Shah, R., P. T. Ward. "Lean Manufacturing: Context, Practice Bundles, and Performance." Journal of Operations
Management 21 (2003): 129-149.
17. Porter, 1996 M. E., “What Is Strategy?” Harvard Business Review, 00178012, Nov/Dec96, Vol. 74, Issue 6
18. Razaei, J. (2010). A note on multi-criteria inventory classification using weighted linear optimization. Yugoslav Journal of
Operations, 20(2), pp. 293-299.
19. Jannis Angelis, Bruno Fernandes.” Innovative Lean: Wok Practices and Product and Process Improvements” International
Journal of Lean Six Sigma Vol. 3 No. 1, 2012 pp. 74-84 q Emerald Group Publishing Limited 2040-4166 Ubale. S.S, Lean
Supply Chain for Small Scale Manufacturing Units, Published in ISBN-978-93-24457-20-4, PP-321-323
20. Rosalind Forrester, (1995) "Implications of lean manufacturing for human resource strategy", Work Study, Vol. 44 Issue: 3,
pp.20-24,
21. Keitany P. and Riwo-Abudho M., (2014) “Effects of Lean Production on Organizational Performance: A Case Study of Flour
Producing Company in Kenya”, European Journal of Logistics Purchasing and Supply Chain Management, Vol 1.2, No. 2,
PP 1-14.
���

JOMAT Vol. 5 No. 2 January – June 2017 ISSN No. 2278-9316
(51)
SUPPLY CHAIN MANAGEMENT PRACTICES AND ORGANIZATIONAL PERFORMANCE OF LARGE
MANUFACTURING FIRMS IN PIMPARI-CHINCHWAD INDUSTRIAL AREA (PCMC)
Nileshkumar Shimpi
ABSTRACT
This examination was done to decide the impact of supply chain management practices on organizational performance
among large manufacturing firms. The examination had two targets, to set up supply chain management practices embraced by
manufacturing firms, and to decide the impact of supply chain management practices on organizational performance of these
firms. The study involved 5 large manufacturing firms from PCMC industrial area. Information was gathered utilizing a
questionnaire that was directed through "drop and pick" strategy. Mean and standard deviation were utilized to break down
target one though relapse investigation was utilized to dissect the impact of supply chain management practices and
organizational performance among these firms. Plainly there is a significant connection between supply chain management
practices and organizational performance clarified by the seven factors key supplier partnership, customer relationship, level of
data sharing, nature of data, degree of outsourcing, lean practices and postponement. The examination just centered around the
manufacturing firms in PCMC industrial area.
Keys Words: Organizational performance, Supply Chain Management, relapse investigation
1. Introduction
Throughout the years the idea of rivalry has changed to
the degree that organizations never again go up against each
other based on quality as customarily rehearsed in the 80`s
(Faweet, 2007). However the new wellspring of business
rivalry connect their activity with their production network
accomplices; providers, merchants, wholesalers, retailers and
end clients (Petrovic, 2007). Having the capacity to make
business associations with clients, providers and other key
accomplices secured on trust and long haul responsibility at
that point turns into an essential aggressive parameter
(Mattson, 2002). For this and different elements like shorter
item lifecycle and client desire, organizations have needed to
contribute and re-concentrate on association with clients and
providers. Therefore an association production network has
turned into a vital motivation driving basic leadership at
senior administration level.
In the 1990's rivalry strengthened and advertises wound
up worldwide coming about to challenges related with
getting an item and administration to the correct place at the
ideal time and at the least cost. Associations started to
understand that it isn't sufficient to enhance efficiencies
inside an association yet their entire store network must be
made focused. The comprehension and rehearsing of
inventory network administration hones has turned into a
fundamental for remaining aggressive in the worldwide
market and for improving gainfulness (Story, 2005).
Powerful store network administration rehearses are
essential to assemble and support rivalry in items and
administrations of the firm. Gunaseken and Ngai (2004)
express that the execution of the store network is impacted
by overseeing and incorporating key component of data into
their inventory network. To accomplish viable store network
mix the organizations need to actualize data innovation which
will see them increase upper hand through various inventory
network measurements, for example, quality, cost,
adaptability, conveyance and benefit.
1.1.1 Supply Chain Management Practices
SCM rehearses has been characterized as an
arrangement of exercises attempted by an association to
advance compelling administration of its production
network" (Li, 2006).He proposed SCM hones as a multi-
dimensional develop that incorporates both upstream and
downstream sides of the inventory network. Donlon (1996)
thought about outsourcing, provider association, data
sharing, process duration pressure, and consistent process
stream, as SCM hones. Tan (1998) utilized quality, buying, and
client relations to speak to SCM hones, in their experimental
examination.
© SBPIM
General Manager, Process Planning & Projects, Marcedes - Benz India Private Limited, Pune
Contact no.: 9011041775 Email Id: [email protected]

JOMAT Vol. 5 No. 2 January – June 2017 ISSN No. 2278-9316
(52)
Alvarado and Kotzab (2001) concentrated on between
authoritative framework utilize, center capabilities, and end
of abundance stock through deferment, as SCM rehearses.
Utilizing factor investigation, Tan et al. (2002) recognized:
production network reconciliation, data sharing, client
benefit administration, geographic vicinity, and JIT capacity,
as the key parts of SCM rehearse. Lee (2004) for his situation
ponder based research recognized five practices at the
production network level that are a vital component to
making store network responsiveness. They include:
outsourcing, vital provider organizations, client connections,
data sharing, and item particularity.
Chen and Paulraj (2004) utilized long haul relationship,
cross-useful groups, provider base decrease, and provider
association. Min and Mentzer (2004) recognized long haul
relationship, data sharing, vision and objectives, hazard and
honor sharing, participation, process joining, and inventory
network initiative hidden the idea of SCM. Li et al. (2006)
distinguished vital provider organization, client relationship,
and data sharing as key SCM rehearses.This examination
embraces similar practices (these are: key provider
organization, client relationship, and data sharing) as sub-
develops for the SCM hones build. Li et al. (2005) built up a
substantial and solid instrument to gauge SCM rehearses. A
similar instrument has been embraced in this investigation. In
this way the writing portrays SCM hones from alternate
points of view with a shared objective of enhancing
authoritative execution.
1.1.2 Organizational Performance
Execution in associations takes numerous structures
relying upon whom and what the estimation is implied for.
Diverse partners require distinctive execution pointers to
empower them settle on educated choices (Manyuru, 2005).
As indicated by Richard et al. (2009) hierarchical execution
incorporates three particular territories of firm results:
(a) monetary execution (benefits, return on resources,
degree of profitability, and so on.);
(b) product advertise execution (deals, piece of the overall
industry, and so on.); and
(c) investor return (add up to investor return, financial
esteem included, and so on.) Mahapatro, (2009)
characterizes Organizational Performance as the capacity
of an association to satisfy its central goal through sound
administration, solid administration and a relentless
rededication to accomplishing comes about. Viable
philanthropies are mission-driven, versatile, client
engaged, entrepreneurial, results arranged and
supportable.
Thompson et al, (2007), noticed that utilizing budgetary
measures alone neglects the way that what empowers an
organization to accomplish or convey better money related
outcomes from its activities is the accomplishment of key
targets that enhance its intensity and market quality. Non
budgetary measures incorporate inventiveness (Goldsmith
and Cluterbuck, 1998) and showcase standing (Saunders and
Wong, 1995, Hooley and Lynch, 1995). Execution is
accordingly estimated by both monetary and non-money
related measures.
Kaplan and Morton (1992) recorded different techniques
to gauge the general hierarchical execution which are;
bookkeeping measures (productivity measures, development
measures, use, liquidity and income measures), operational
execution (piece of the overall industry, changes in elusive
resources, for example, licenses or HR, consumer loyalty and
partner execution advertise based measures (return on
investor execution), showcase based measures (return on
investor, showcase esteem included, holding period returns),
survival measures (requires significant investment skylines of
five years and less) and financial esteem measures (remaining
salary, financial aspects esteem included and income return
speculation)
1.1.3 Supply Chain Management Practices and
Organizational Performance
Past investigations propose that compelling SCM
rehearses directly affect the general budgetary and
showcasing execution of an association (Shin et al. 2000;
Prasad and Tata 2000). To be sure, SCM hones is required to
build an association's piece of the overall industry,
quantifiable profit and enhance general focused positions.
For example, Tan et al. (1998) declared that client relations
and obtaining rehearses affect the viability of SCM
methodology and prompt monetary and market execution.
Froehlich and Westbrook (2001) then again proposed that
organizations with more extensive production network
incorporations with providers and clients demonstrated the
biggest execution change in business accomplishments.
SCM rehearses affect general authoritative execution, as
well as upper hand of an association. They are required to
enhance an association's upper hand through value/cost,
quality, conveyance steadfastness, time to market, and item
development. Earlier examinations have shown that the
different segments of SCM rehearses, (for example, key
provider organization) affect different parts of upper hand,
(for example, value/cost). For instance, vital provider
association can enhance provider execution, lessen time to

JOMAT Vol. 5 No. 2 January – June 2017 ISSN No. 2278-9316
(53)
advertise (Hanfield, 1997), and increment the level of client
responsiveness and fulfillment (control, 2001).
1.1.4 Manufacturing Firms in PCMC industrial area
Mumbai is called the financial and commercial capital of
India. It is one of the world’s top 10 centres for commerce in
terms of global financial flows. It houses India’s biggest
conglomerates such as L&T, Tata Group, Godrej and also the
largest financial institutions like RBI, SBI, NSE& BSE. It is the
ultimate hub for businesses offering the perfect environment
and an unrestricted potential for all kinds of businesses,
considered as the wealthiest city in the country. Mumbai
accounts for 25% industrial output, 5% of India’s GDP and
also 70% of the capital transactions in Indian economy.
One of the sectors that contributes 5-6% to the country’s
GDP is the automotive industry. Maharashtra Industrial
Development Corporation (MIDC) is a project of the
government of Maharashtra state in India and is the leading
corporation of Maharashtra. In the period FY 2008-2020, the
market size of this sector is expected to increase at a
Compound Annual Growth Rate (CAGR) of 11.2 per cent.
Pimpri – Chinchwad – a twin city located in the suburbs
of Pune happens to be one the biggest Industrial areas in
Asia. It has a rapid growth in terms of the industries and most
of the major automobile companies and their headquarters
are located here. To name a few: Bajaj Auto, BEL Optronic
Devices Ltd, TATA Motors, Kinetic Engineering, Force Motors
and Daimler Chrysler. It is also a home to India’s premier
antibiotics research institute Hindustan Antibiotics Limited
(HAL) along with heavy industries such as Forbes-Marshall,
Thyssen Krupp, Alfa Laval & Sandvik Asia have their
manufacturing units here. There is rapid growth in the
software and IT department also
1.2 Problem Statement
The idea of SCM has gotten expanding consideration
from academicians, advisors and business supervisors alike.
Numerous associations have started to perceive that SCM is
the way to building feasible focused edge. Notwithstanding
this expanded consideration, the writing has not possessed
the capacity to offer much method for direction to help the
act of SCM (Perona, 2004).
A significant part of the current theoretical and flow
hypothetical/Empirical research in SCM centers around just
downstream or upstream side of the production network or
certain viewpoints/points of view of SCM. Universally
concentrates, for example, those of (Clark and lee, 2000)
center around the downstream linkages amongst fabricates
and retailers. A couple of late investigations have considered
both upstream and downstream at the same time (Tan, 2004)
did an examination that investigated the connection between
provider administration hones, client relationship practices
and association execution. Frohlich and Westbrook (2001)
researched the impacts of provider client combination on
association execution among numerous others. These
examinations are illustrative of endeavors to address the
assorted yet fascinating parts of SCM rehearses. However the
absence of a coordinated structure joining every one of the
exercises both upstream and downstream sides of the
inventory network and connecting such exercises to both
upper hand and association execution does not enable much
in thinking of a system of actualizing past outcomes on
SCM.This to ponder goes for concocting a tried system
recognizing the relationship among SCM hones, upper hand
and association execution
Kamau (2011) directed an examination on purchaser
provider relationship and association execution where she
discovered that there is a reasonable connection between the
two factors. Mose (2012) led an investigation on the
appropriation of E-acquirement in huge fabricating firms. He
discovered that numerous assembling firms have received
different e-acquisition hones. This means there is absence of
study completed locally to draw out a comprehension of the
exhaustive arrangement of SCM practices and how they can
empower an association enhance its execution and increase
upper hand. This investigation along these lines went for
spanning this hole and looking for answers to explore
questions which were, What are production SCM received by
manufacturing firms and what the impact the supply chain
management practices adopted have on the performance of
large manufacturing firms.
1.3 Objective of the research work
The investigation had two primary targets that have been
gotten from the exploration questions.
1. To set up supply chain management practices adopted by
large manufacturing firms in PCMC industrial area
2. To decide the impact of Supply Chain Management
practices on the performance of large manufacturing
firms in PCMC industrial area
1.4 Significance of the study
The investigation will help the assembling firms in PCMC
industrial area to build up the impact supply chain
management practices on their organizational performance.
Other non-producing foundations will likewise profit by
the discoveries of this investigation since it will reveal more
insight into the impact of supply chain management practices
on their organizational performance.

JOMAT Vol. 5 No. 2 January – June 2017 ISSN No. 2278-9316
(54)
2. Literature Review
3. RESEARCH METHODOLOGY
3.1 Research Design
This examination configuration utilized was a cross
sectional review of the vast assembling organizations working
in PCMC mechanical region. As per Emory (1995), an
overview was possible when the populace is little and
variable and thus the scientists could cover every one of the
components of the populace. Along these lines a review is
thought to be more productive and efficient.
3.2 Population
The number of inhabitants in the examination in this
exploration comprised of all the expansive scale fabricating
organizations that are situated in PCMC modern zone. As per
PCMC modern region. As per MICCA catalog, June, 2013,
there are 1000+ vast scale fabricating firms in PCMC modern
zone. This region was picked in light of the fact that it is the
place the majority of the substantial scale fabricating firms in
different divisions are thought accordingly giving a major
populace where a proportionate example was to be inferred.
3.3 Sampling
Stratified arbitrary examining strategy was connected to
think of the example estimate, since the populace in various
vast assembling firms does not speak to a homogeneous
gathering, in this way the technique is for the most part
connected with a specific end goal to get a delegate test. This
as indicated by Kothari (2004) will guarantee that each
assembling subsector is spoken to. As indicated by Mugenda
and Mugenda (2003) watched that where an investigation is
managing a heterogeneous populace, a base focus of 5% is
required. The investigation subsequently will include 46 huge
assembling firms in PCMC mechanical territory.
3.4 Data Collection
The investigation utilized essential information that was
gathered through a self-directed survey that comprised of
both open and shut finished inquiries that were intended to
inspire particular reactions for subjective and quantitative
examination separately. The surveys had three segments. The
primary area contained inquiries on the general information
of the assembling firms, the second part; then again
addressed inquiries on target one while the third will
addressed inquiries on target two. The polls were regulated
by drop and pick later strategy. The investigation picked head
of inventory network/acquirement, head of back and head of
data innovation office or their reciprocals every one of the
assembling firms that partook in the examination.
3.5 Data Analysis
Before preparing the reactions, the finished polls were
altered for fulfillment and consistency. Target one which is to
set up the store network hones embraced by the
organizations was dissected utilizing enlightening
measurements where mean and standard deviation were
utilized Inferential insights was utilized to examine target
two. Particularly a measurement level investigation will be
performed utilizing relapse examination which was
instrumental in demonstrating whether the free factors SCM
hones essentially anticipate the reliant variable association
execution.
4. Data analysis and discussion
4.1 General Information
An aggregate of 46 surveys were conveyed to huge
assembling firms in PCMC mechanical zone. Out of the 46
polls, 27 were come back to the scientist. This speaks to a
reaction rate of 63%. This rate was viewed as adequate for
this investigation. The 35% who stayed away forever the polls
referred to occupied calendars as the primary explanation
behind lacking time to fill them.
The initial segment of the survey contained general data
with respect to the association and the respondent. The
regions sited in this part were: span the organization has
been in activity, the situation of the respondent in the
association, the term the respondent has worked in that
position and the sexual orientation of the respondent.
4.1.1 Position of the Respondent
The respondents were requested to demonstrate the
positions they held in the particular organizations and the
term they had served in those positions. They were given
alternatives to look over. 30% of the respondents who took
an interest in the investigation are inventory network chiefs
while 35 were associate store network supervisors. This
affirms they are well familiar with inventory network
administration rehearses and their impact on hierarchical
execution. It was additionally obvious as appeared in table
4.3 that 33%of the respondents have served in their
particular positions for under five years. The production
network idea is moderately new in PCMC mechanical region
and this likely clarifies the motivation behind why the
majority of the respondents had filled in as inventory network
administrators for a brief timeframe.
4.2 Extent to which Manufacturing Firms in PCMC
mechanical territory have received Supply Chain
Management Practices
The investigation looked to build up the degree to which
huge assembling firms in PCMC modern territory have
embraced store network administration hones. Various
inquiries were fronted to the respondents who gave their
reactions on a size of 1-5 where 1 speaks to a little degree
and 5 vast degree. Table 4.1 demonstrates the mean and

JOMAT Vol. 5 No. 2 January – June 2017 ISSN No. 2278-9316
(55)
standard deviation of elements that were utilized by the
analyst to demonstrate the degree to which extensive
assembling firms in PCMC mechanical region had received the
different inventory network administration rehearses. A
mean of 3-5, demonstrates that the factor being referred to
has been embraced by the reacting associations to a vast
degree. A mean of 1-2, demonstrates the factor being
referred to has been received by the reacting associations to
a little degree.
Table 4.1 underneath demonstrates the investigation of the reactions where the mean and standard deviation show the
degree to which different production network administration hones have been received.
Table 4.1: Extent of adoption of supply chain management practices
SUPPLY CHAIN MANAGEMENT PRACTICES MEAN STD DEV
Strategic supplier partnership
Including key suppliers in planning and goal setting activities 4.185 0.611
Quality considered as a number one criterion in selection of suppliers 4.148 0.590
Actively involving key suppliers in new product development process 3.83 0.88
Continuous improvement programs that include key suppliers 3.667 0.943
Helping suppliers improve their product quality 3.444 0.629
Customer relationship
Periodically evaluate the importance of relationship with customers 4.609 0.570
Facilitating customer's ability to seek assistance 4.609 0.650
Frequently determining future customer expectations 4.522 0.650
Frequently interacting with customers to set reliability, responsiveness and other standards 4.391 0.706
Level of information sharing
Supply chain partners share business knowledge of core business 3.833 0.850
Our supply chain partners share core information with us 3.704 0.808
Exchange of information between supply chain partners that help establishment of business 3.625 0.904
Supply chain partners keep us fully informed about issues affecting our business 3.519 0.874
Supply chain partners share proprietary information 3.444 0.875
Informing supply chain partners in advance of changing needs 3.333 0.777
Quality of information sharing
Accurate exchange of information between supply chain partners 4.5 0.645
Reliable information exchanged among supply chain partners 4.417 0.820
Timely information sharing among supply chain partners 4.370 0.618
Complete information exchanged between supply chain partners 4.333 0.687
Adequate information exchanged among supply chain partners 4.208 0.815
Extent of outsourcing
Firms outsources logistics 3.708 1.109
Firms outsources pre-sales customer services 2..542 1.190
Firm outsources after-sales customer services 2.333 1.312
Firm outsources information systems 2.222 0.875
Firm outsources manufacturing 2 0.707
Lean practices
Firms delayering, downsizing and outsourcing 2.459 1.258
Firm does not rely on inspecting products procured 2 1.040
Firm continually improve their own performance with small incremental lean procurement
improvements(Kaizen)
2.444 0.994
Firms buy products in small batches only when they are needed 1.833 0.745
Firm outsources product design 1.583 0.759
Postponement
Delay of final product assembly activities until customer orders have actually been received 1.148148 0.44752
Products are designed for modular assembly 1.125 0.330
Delay of final product assembly activities until customer orders have actually been received 1.083 0.276
JOMAT Vol. 5 No. 2 January – June 2017 ISSN No. 2278-9316
(56)
From the table above it turns out unmistakably that huge
assembling firms in PCMC mechanical territory have received
different inventory network administration hones however at
various degrees. For example client relationship is a training
that has been very received on the grounds that every one of
the components under it fall under 4 which implies it is
embraced by a huge degree according to the likert scale. This
could be because of the solid rivalry inside the business
because of the way that the greater part of the associations
are putting forth the same or close products and ventures
along these lines receiving this training in order to guarantee
expanded piece of the overall industry and client
maintenance.
Data quality and key provider administration are
additionally hones that have been embraced by the
organizations under the examination which could be credited
to the way that organizations have understood that
production network contend and not associations in this
manner including their providers and different accomplices in
the running of the association. Data quality is by all accounts
considered important by these associations since they could
have understood that data assumes an extremely enter part
in the accomplishment of associations and the production
network in general. It is the blood of the inventory network to
such an extent that without it the anchor will undoubtedly
come up short.
Lean works on, outsourcing and delay are hones that
have been embraced to a little degree on the grounds that
from the outcomes in table 4.1 we see that there mean lie in
the vicinity of 1 and 2.This could be because of these
organizations not being in a situation to execute them or they
couldn't have understood the huge positive effect that these
practices can have on their execution. Deferment is the
minimum embraced rehearse which could be ascribed to the
way that possibly the organizations trust that for instance
they can't postpone last item gathering until the point that
clients make arrange because of dread of vulnerabilities that
can prompt them losing their clients to rivals.
The discoveries from this table are somewhat in
concurrence with the writing audit that was directed. As per
Donlon (2006), key provider organization, data sharing and
outsourcing as the principle store network administration
hones. This is by all accounts the case for vast assembling
firms in PCMC mechanical region put something aside to
outsource that is embraced to a little degree excluding it as a
fundamental production network rehearse in the assembling
business.
Li et al distinguished vital provider association, client
relationship and data sharing as key store network
administration hones. This has turned out to be a similar case
for substantial assembling firms in PCMC mechanical zone as
the outcomes from the table above demonstrate that every
one of these practices have been adjusted to a vast degree.
4.3 Effect of production network administration on the
execution of substantial assembling firms in PCMC
modern zone, PCMC mechanical territory
Respondents were requested to demonstrate whether
the different production network administration rehearses
received affected the different parts of authoritative
execution.
5. Summary of Findings
The investigation set up that most vast assembling firms
that work in PCMC modern region have been in presence for
over ten years. The investigation affirmed that most
assembling organizations in PCMC modern territory had
embraced the different store network administration
relationship. It was likewise obvious from the examination
that the seven free factors; vital provider administration,
client relationship, data sharing, data quality, outsourcing,
lean practices and deferment decidedly affect association
execution; However, client relationship and vital provider
administration had the best effect. Through the investigation
of the connection between production network
administration practices and association execution, it was
shown that the practices may specifically affect association
execution. The discoveries of this exploration along these
lines point the significance of production network
administration to associations.
JOMAT Vol. 5 No. 2 January – June 2017 ISSN No. 2278-9316
(57)
5.3 Conclusions
The investigation presumes that most huge assembling
organizations in PCMC mechanical zone have received the
different production network administration hones. The
practices have helped the extensive assembling organizations
to improve the execution of their associations. This is upheld
by the outcomes from a relapse examination led that showed
that there is a solid connection between production network
administration rehearses and authoritative execution. The
investigation has affirmed that vital store network
administration rehearses are exceptionally noteworthy in
upgrading the execution of associations and as we probably
am aware today's rivalry is moving from among associations
to between supply chains. An ever increasing number of
associations are receiving SCM in the expectation of lessening
inventory network costs and securing upper hand.
6. Suggestions
The investigation has affirmed that production network
administration hones are exceptionally critical in upgrading
association execution. All assembling organizations and
different associations ought to be encouraged to grasp the
idea with the goal that they can have the capacity to receive
the rewards of embracing these practices. Association are
additionally encouraged to receive the practices that are as of
now embraced at a little degree since they can fundamentally
enhance association execution from the present position.
They incorporate practices like outsourcing, lean practices
and deferment which have demonstrated to have enormous
outcomes in different associations like Toyota for instance.
7. Limitations of the Study
The discoveries of this examination and application thusly
are restricted to vast assembling organizations in PCMC
mechanical territory. They may not be pertinent specifically
to different associations working outside the PCMC
mechanical arean producing industry. It is along these lines
critical to take note of that they must be utilized for similar
purposes and no immediate application in another industry
or nation.
The exploration just centered around the huge
assembling firms in PCMC modern territory. It didn't highlight
the huge assembling firms in different parts of the nation.
This was a result of constrained time and assets. It was such a
tough assignment for the analyst to persuade the
respondents to take an interest in the examination.
Assembling organizations are exceptionally bustling
associations were by getting a respondent was testing. A
large portion of the respondents consented to take part on
condition that the data won't be unveiled to some other
gathering other than for scholastic purposes as it were.
REFERENCES
1. Aitken, J. Christopher, M. and Towill, D. (2002) understanding the supply chains.
2. Alvarado, U. Y. and Kotzab, H. (2001), “Supply Chain Management: The Integration of Logistics in Marketing”, Industrial
Marketing Management, 30(2), pp. 183–98
3. Anderson, J. C., Hakansson, H., and Johanson, J. (1994), “Dyadic Business Relationships within A Business Network Context”,
Journal of Marketing.
4. Beamon BM. Supplychain design and analysis: models and methods. International Journal of Production Economics 1998;
55(3):281–94.
5. Bhasin, S. & Burcher, P. (2006), Lean viewed as a philosophy, Journal of Manufacturing Technology Management.
6. Boddy, D., Cahill, D., Charles, M., Fraser-Kraus, H., and Macbeth, D. (1998), “Success and Failure in Implementing
Partnering”, European Journal of Purchasing and Supply Management.
7. Boddy, D., Macbeth, D., and Wagner, B. (2000), “Implementing Collaboration between Organizations: An Empirical Study of
Supply Chain Partnering”, Journal of Management Studies

JOMAT Vol. 5 No. 2 January – June 2017 ISSN No. 2278-9316
(58)
8. Chen, I. J. and Paulraj, A. (2004), “Towards A Theory of Supply Chain Management: The onstructs and Measurements”,
Journal of Operations Management
9. Childhouse, P. and Towill, D. R. (2003), “Simplified Material Flow Holds the Key to Supply Chain Integration”, OMEGA
10. Choi T.Y. and Hartley J.L. (1996), “An Exploration of Supplier Selection Practices Across the Supply Chain”, Journal of
Operations Management
11. Churchill, G. A. (1979), “A Paradigm for Developing Better Measures of Marketing Constructs”, Journal of Marketing Studies
12. Donlon, J. P. (1996), “Maximizing Value in the Supply Chain”, Chief Executive.
13. Fawcett, S. (2007) Supply Chain Management: From Vision to Implementation. Upper Saddle River, New Jersey, Pearson
Practice-Hall.
14. Frohlich, M.T. and Westbrook, R. (2001), “Arcs of Integration: An International Study of Supply Chain Strategies”, Journal of
Operations Management,
15. Gattorna, J. L. (Ed.) (1998), Strategic Supply Chain Alignment, Gower, Aldershot.
16. Gibson, B. J., Mentzer, J. T., and Cook, R. L. (2005), “Supply Chain Management: The Pursuit of a Consensus Definition”,
Journal of Business Logistic
���

JOMAT Vol. 5 No. 2 January – June 2017 ISSN No. 2278-9316
(59)
THE STUDY OF IMPACT OF SOCIAL MEDIA ON ORGANISATIONAL COMMUNICATION
Pranita Burbure1
Kirti Dharwadkar2
ABSTRACT
In this paper the researcher discusses the influence of social media on internal organisational communication. The internal
organisational communication is highly vital and today social media is playing a huge role in channelizing internal as well as
external organisational communication. However, its effects are still under recognized even in this modern era. Due to the rapid
advancement in today’s information and communication technology, the internal organizational communication landscape has
changed significantly. The paper discusses how social media can affect management in terms of formal communication and
information flow caused by the proliferation of social media usage in the workplace. The findings suggest that social media has
the capability to distort and damage the management of formal communication and information flow in an organisation. The
findings are based on literature reviewed. Therefore further empirical research is needed to validate the findings. An organisation
should be well aware of the effect of social media on internal organizational communication. Without proper ‘Communication
Management’ and policies, social media communication could possibly negatively affect the management in terms of formal
communication and information flow in an organisation. This paper offers contribution to the on-going discussion of the effect of
social media on the internal organizational communication landscape.
Key Words: Social media, Communication, Informal communication, Information flow, Information and communication
technology.
INTRODUCTION
Internal organizational communication refers to
communication between organisational members and is
mainly for the purpose of task completion, i.e. achieving the
goals of the organisation as well as relationship building
among employees in the workplace, Furthermore, as
contended by D.P. Modaff, S. DeWine and Butler,
“Organisational communication is considered the process of
creating, exchanging, interpreting (correctly or incorrectly)
and storing messages within a system of human
interrelationships”. Santra and Giri, noted that this dynamic
process goes beyond the simple transference of information,
but rather seeks to influence a specific behaviour. However,
today’s internal organizational communication landscape has
been greatly affected by the proliferation of information and
communication technology (ICT), particularly social media
such as Facebook, Twitter and WhatsApp alike. While
traditional methods of communication, such as face to face
communication, email, telephone and meetings, are still the
preferred form of formal communication in organisations,
communication in an organisation is no longer limited to only
these forms or methods. Instead, it has been seen that formal
interactions can take place online as well. Moreover, informal
communication, which used to take place during office tea or
coffee sessions between organisational members, is now also
significantly changing its location to become online.
A review of the literature indicates that social media is
now considered as one of the accepted mediums of
interaction in today’s organisations and the number of
organisations utilising this media is argued to be rising,
Nevertheless, despite the many advantages of social media,
the emergence of social media as a medium of internal
organizational communication is argued to potentially affect
the organisation’s control over how information is released
and disseminated. This is because once the conversation is
taken online; organisations appear to lose their control over
the information that is being discussed. Organisational
absence or control over the information and the inability to
confirm the accuracy of the information may cause the
information to be distorted, which consequently heightens
the possibility of misunderstandings occurring with
consequent possible damage to the organization.
© SBPIM
1 Assistant Professor, PCET’s S. B. Patil Institute of Management, Nigdi, Pune 411044
Contact no.: 9145019486 Email Id: [email protected] 2Professor & Head Academics, PCET’s S. B. Patil Institute of Management
Contact no.: 8928294775 Email Id: [email protected]

JOMAT Vol. 5 No. 2 January – June 2017 ISSN No. 2278-9316
(60)
Formal Vs Informal Communication:
Formal communication can be referred to as
communication which is related to the structure and
hierarchy of an organisation. According to Johnson, Donohue,
Atkin, and Johnson formal communication is accepted to be
official communication by whatever means of medium of
transmission, while informal communication is the
communication between employees which is not in line with
the structure of the organization and is most likely to be
personal. Formal communication in the workplace takes the
form of meetings, roundtable discussions, talk etc., while
informal communication takes the form of personalised
relationships between employees. It may occur during coffee
breaks and social office activities.
Over the years, efforts by scholars of communication
have focused on perfecting the deliverance of formal
communication messages. This means to find a
comprehensive internal organizational communication model
to improve message dissemination to employees.
Studies of business and corporate communication have
proposed various communication models to enhance internal
organizational communication. For example Lewis proposed
message transparency when communicating new
developments to organisational members. Barrett on the
other hand suggested an integrated communication strategy
which included the strategic positioning of staff, effective
management support and an efficient use of media.
Meanwhile, Klien integrated communication principles which
helped him to create a communication strategy for an
effective organisation.
However, formal communication is viewed as being
unable to deal with all the major uncertainties and questions
among the members of an organisation, as formal
communication is sometimes tied with the policies and
procedures of an organisation. This could possibly prevent
employees from giving accurate and reliable feedback to
management. Employees may feel sceptical that their
feedback would be accepted. Therefore, they turn to informal
communication channels.
According to Fishsbacher-Smith and Fischbacher-Smith
informal communication is capable of influencing the
organisational decision-making process as well as
performance. This could occur because messages
disseminated across organisations and shared between
organisations are often shared via informal communication
and not captured effectively through the formal decision-
making processes. Some decisions made by organisations
could also be discussed by members using informal channel,
which sometimes leads to adjustment or withdrawal from the
original decision due to receiving negative feedback from the
members.
Even though some authors explain the positive part of
informal communication especially to gather feedback,
however, in contrast, informal communication is reported to
be vulnerable and a threat to formal communication.
Messages originating from informal communication are at
risk of distortion, damage and fragmentation and even
speculation. For instance, irresponsible parties could damage
the information by making baseless speculations.
In addition, informal communication creates a
“grapevine”, where employees communicate doubtful
messages i.e. rumour and gossip. This may influence and
hinder the effective transmission of formal communication.
The informal communication that takes place in this context
could also be speculated upon or sensationalised and
therefore has a negative impact on the organisation.
One aspect that determines a clear differentiation
between formal and informal communication in traditional
internal organizational communication is the element of
authority, credibility and filtering of messages passing
through the network of the organisation. Formal
communication has credibility, authority and control of the
message disseminated to the members of the organisation as
the message has gone through the process of filtering and
control before it is released. However, informal
communication is a doubtful message, without a clear source
of information and authority. Anybody in the organisation
could create something with a positive and even negative
sentiment towards any message that originally came from
formal communication.
Uncertainty Reduction Theory:
The Uncertainty Reduction Theory was first introduced
by Charles Berger and his associates in 1975. The Uncertainty
Reduction Theory rests on several basic assumptions. The
main assumption is that uncertainty creates cognitive
discomfort, which people will try to reduce. Uncertainty
reduction occurs primarily by questioning others in an
attempt to gather information about others or issues that do
not satisfy a person’s understanding. This information can
then be used to predict the behaviour of people, or the
outcome of a discussion or decision. In other words, the
theory elaborates the information seeking behaviour of
individuals, which it contends that when dealing with
ambiguous information then individuals tend to gauge

JOMAT Vol. 5 No. 2 January – June 2017 ISSN No. 2278-9316
(61)
additional information from alternative sources in order to
increase their understanding and consequently, reduce the
vagueness of the information.
In this study, the Uncertainty Reduction Theory will help
to explain the transition of formal communication to informal
communication in an organisation. As contended by Vuuren
and Elving, individuals in organisations will seek information
from other sources particularly from informal communication
channels when the information they receive from formal
communication does not satisfy their need for understanding.
This usually occurs when communication obtained using the
formal channels fails to adequately communicate appropriate
information. Furthermore, according to Mckay, A. Kali and
Kuntz, J.R.C. Naswall, the members of an organisation will
seek each other’s reactions and clarification from their
informal communication network for the purpose of checking
their own understanding, as well as the understanding of
others. By gathering this reaction, individuals may make
sense of their intentions, attitudes and behavior. The
advantage of this is that their uncertainties may be reduced.
However, the effect could backfire. This takes place when the
uncertainties among the members of an organisation may
escalate and turn into negative communication where
speculation and baseless assumptions could occur.
In today’s internal organizational communication
landscape, the informal communication platforms used by
members of an organisation are not constrained to tea-coffee
break sessions, over lunch conversations etc. Instead these
informal conversations are rigorously moving online. This
present development requires a deeper assessment of how
social media affects the reliability, validity and accuracy of the
alternative sources used by organisational members in their
conversations and how organisations are able to manage and
control these conversations as a preventive action in
protecting the image of the organisation as well as its
processes.
As mentioned by Vuuren and Elving, in the process of
reducing uncertainties, individuals seek additional
information from the informal communication network which
coincides with the Uncertainty Reduction Theory. The
assumptions of the Uncertainty Reduction Theory are still
very much applicable to this development. However, the
effect of individual information seeking behaviour due to the
use of social media may be more detrimental to organisations
than the previous informal communication platforms. Social
media may have the capability to direct the actions of users
as well as their judgment.
Social Media as a Communication Tool in an Organisation:
According to Jones, Watson, Gardner and Gallois, social
media has advantages in terms of media richness and channel
preference. Therefore, most organisations prefer social
media as a platform to communicate effectively with
members of the organization. Even though the usage of social
media was initially intended for personal space, however, the
usage has expanded as a communication tool in internal
communication within an organisation such as applications
like WhatsApp, Facebook and Twitter. In the workplace,
social media encourages informal collaboration and spurs
knowledge sharing among employees. In fact, a recent study
of the usage of social media in team-working in a company in
the United States indicated that social media posits to
become an influential mechanism for team communication in
the future and could be a major factor to improve the ability
to coordinate work tasks.
Additionally, the number of organisations who use social
media to improve internal communication has increased
significantly since it has been found to improve internal
efficiency, team collaboration, innovation and organisational
alignment as well as cultural transformation. In a global study
by McKinsey Global in 2013, 90 percent of executives whose
companies used social technologies reported measurable
benefits from using such social media technology.
In terms of Social media usage, according to Mckinsey
Global Survey Result in a sixth annual survey of business use
of technologies, 83 percent of respondents said that their
companies were using at least one social technology and 65
percent said employees accessed at least one communication
application of a mobile device.
A recent study of a group of employees in the sales
division of a global manufacturing organisation indicated that
informal communication using Internet applications was a
significant factor in shaping the culture (cultural dynamic) and
functionality of an organization. This indicates that
organisations can no longer depend on formal hierarchical
structures as the primary tool for managing information flow,
as informal relationships are equally powerful in changing the
shape of an organization. A study of the effect of social media
on the public relations of local government found that social
media can be a significant communication tool. One of the
results indicated that the stakeholder can participate in the
decision making or other operational activities without having
to physically attend a programme or event. In addition a
study in Korea indicated that social media such as Facebook is
an important communications’ channel that could
complement web-based e-government systems. Another
study of a group of university students found that the social
media role is significant in organisations facing crisis
management.
To further escalate the challenge, the advancement of
smart-phone technology has become a catalyst for the
extensive use of social media as it is mobile friendly. Healthy
competition between smart-phone producers has made the
price and technology highly competitive. People can be side-
lined from the current trend because of not owning a smart-
phone. It is reported that smart-phone penetration in the
developing world now exceeds two subscriptions for every
JOMAT Vol. 5 No. 2 January – June 2017 ISSN No. 2278-9316
(62)
three people, driven by expanding networks in Asia and in
Africa. In the context of Malaysia it is reported that
sophisticated and affordable smart-phones have contributed
significantly to the rise of the communication subsector to
9.3% in 2012 compared to 7.6 % in 2011.
Therefore, due to the capabilities and the advantages of
the usage of social media as a channel for employees to
communicate, makes social media highly usable to improve
the daily operations of an organisation. Its role is now turning
from being just in the personal space to being in the
professional space as well, especially when organisation
matters are discussed and shared using social media
applications i.e. WhatsApp, Facebook and Twitter.
However, social media has also become a channel that
encourages a “grapevine” and the effect may result in
extensive dissemination to the masses in which gossip can
become “viral”. Results from a study on the effect of informal
communication against formal communication in social
media indicated that informal communication in social media
does have the capability of influencing the perceptions of the
masses. “The visibility afforded by social media may
undermine organizational efforts to provide a distinct
socialization strategy. For instance, because social media
used in organizations have been demonstrated to support
widespread informal communication, even among people
who do not know each other personally.”
From the perspective of internal organisational
communication, the emergence of social media may hinder
effective communication and the process of information flow.
Firstly, the employees may face difficulties to distinguish
between informal and formal communication. For example
messages could be written in an informal manner. This could
cause employees to confuse formal or informal messages due
to the lack of control of information. In social media the role
of controller or “gatekeeper” is not established. Therefore,
uncorroborated messages could be accidently released and
widely spread. To make it worse, social media allows the
interaction of users whether one-to-one or one-to-many.
Thus any message, genuine or unsubstantiated, can be widely
spread in a split second. There is a high potential for
purposeful or accidental release of information that could be
damaging to other people or organisations due to
misunderstandings and other human factors. The users can
also freely interact by giving opinions on certain postings and
may create negative or positive sentiments among users.
Additionally, according to Kaplan and Haenlein before the era
of social media, organisations could strategically frame and
control the information delivered. However, with the
emergence of social media the strategy does not effectively
take place.
Secondly, social media is initially setup for personal
space. Therefore, employees may perceive that messages
communicated through the social media are not deemed to
be compulsory. Further, it is not possible to monitor every
message communicated. This could also escalate into a
situation of “information overload”, the situation of too much
information at one time. Confusion and misinformation could
result.
Thirdly, distraction of employees could also occur as
users do not want to miss receiving and viewing their
messages. This explains the phenomenon of more and more
employees spending too much time communicating using
social media compared to traditional media.
CONCLUSION
Informal communication originates from internal
organisational communication which has changed location
from the traditional communication platform to a social
media platform. This may affect the efforts of an organisation
to manage the information flow of the organisation.
Employees presently turn to social media as an alternative
source of information to reduce uncertainty when previously
they were informed through formal communication. Even
though social media is designed to be used as personal space,
due to the various advantages of social media it is now used
as one of the primary communication mediums used by an
organisation to communicate with its employees and
stakeholders. Nevertheless, despite its various advantages,
social media may have dire consequences for an organisation
which is unable to manage and control its information. A
study of organisation governance of social media usage
indicates that organisations tend to perceive and portray the
effect of social media primarily as a source of risk which may
harmful to the reputation of an organization. Therefore, an
organisation must formulate a comprehensive
communication strategy without neglecting the use social
media strategically and as a formal medium when
communicating with its employees and stakeholders. This is
because according to the utilisation of social media in an
organisation is mostly not strategically planned and
integrated with other organisational communication
methods. The communication strategy of an organisation
should be outlined and enforced as a policy. Consequently,
the element of communication control could be
implemented. Without a doubt, the members of the
organisation themselves must also be educated to embrace
the policy as users may have their own judgment on certain
issues or messages posted in social media.
Finally, future empirical studies should be conducted to
determine the effect of social media as a platform for
informal communication from the perspective of internal
organisation communication. This will therefore, shed light
on how to improve communication within the organisation
and consequently facilitate the development of a clear policy
for better management of internal organisation information
flow.

JOMAT Vol. 5 No. 2 January – June 2017 ISSN No. 2278-9316
(63)
REFERENCES
1. Tang, C. and Y. Gao, 2012. Intra-department communication and employees’ reaction to organizational change: The
moderating effect of emotional intelligence. Journal of Chinese Human Resource Management, 3(2): 100-117.
http://doi.org/ 10.1108/20408001211279210.
2. Modaff, D.P., S. DeWine and J. Butler, 2007. Organizational communication: Foundations, challenges and misunderstandings
(2nd ed.). Boston: Pearson.
3. Santra, T. and V.N. Giri, 2009. Analyzing Computer-Mediated Communication and Organizational Effectiveness. Review of
Communication,9(1): 100-109. http://doi.org/10.1080/ 15358590701772259.
4. Mckinsey Global Survey Result, 2013. Evolution of the networked enterprise:McKinsey Global Survey results. Retrieved June
30, 2015, from http://mckinsey.com/insights/business_technolog y/evolution_of_the_networked_enterprise.
5. Jennings, S.E., J.R. Blount and M.G. Weatherly, 2014. Social Media-A Virtual Pandora’s Box: Prevalence, Possible Legal
Liabilities and Policies. Business and Professional Communication Quarterly, 77(1): 96-113.
http://doi.org/10.1177/2329490613517132
6. Bovee, C. and J. Thill, 2000. Business Communication Today (6th ed.). New Jersey: Prentice Hall International, Inc.
7. Mazzei, A., 2010. Promoting active communication behaviours through internal communication. Corporate
Communications: An International Journal, 15(3): 221-234. http://doi.org/10.1108/ 1356328101106809.
8. Johnson, J.D., W.A. Donohue, C.K. Atkin and S. Johnson, 1994. Differences Between Formal and Informal Communication
Channels. Journal of Business Communication, 2(31): 111-122.
9. Lewis, L., 2011. Organizational Change: Creating Change Through Strategic Communication. United Kingdom.: A John Wiley
and Sons, Ltd., Publication.
10. Barrett, D.J., 2002. Change communication: using strategic employee communication to facilitate major change. Corporate
Communications: An International Journal, 7(4), 219-231. http://doi.org/10.1108/ 13563280210449804.
11. Klien, S.M., 1996. A management communication strategy for change. Journal of Organizational Change Management, 9(2):
32-46. Retrieved from http://0-search.proquest.com.wam.leeds.ac.uk/docview/197630170/fulltext/1408C058A342492230F
/3accountid=14664#
12. Fishsbacher-Smith, D. and M. Fischbacher-Smith, 2014. What Lies Beneath?? The Role of Informal and Hidden Networks in
the Management of Crises. Journal of Accountability and Management, 30(August): 259-278.
13. Bovee, C. and J. Thill, 2000. Business Communication Today (6th ed.). New Jersey: Prentice Hall International, Inc.
14. Vuuren, M. Van and W.J.L. Elving, 2008. Communication, sensemaking and change as a chord of three strands: Practical
implications and a research agenda for communicating organizational change. Corporate Communications: An International
Journal, 13(3): 349-359. http://doi.org/10.1108/ 13563280810893706.
15. Bordia, P., E. Jones, C. Gallois, V.J. Callan and N. Difonzo, 2006. Management Are Aliens!: Rumors and Stress during
Organizational Change. Group and Organization Management, 31(5): 601-621. http://doi.org/10.1177/1059601106286880.
16. DeVito, J.A., 2003. Human Communication, The Basic Course (9th ed.). New York: Pearson Education.
17. DeVito, J.A., 2015. Human Communication: The Basic Course (13th ed.). New York.
18. Wood, J.T., 2004. Communication Theories in Action: An Introduction (3rd ed.). Boston, USA: Wadsworth, Cengage Learning.
19. Mckay, Kali, A., J.R.C. Kuntz and K. Naswall, 2013. The Effect of Commitment, Communication and Participation on
Resistance to Change. New Zealand Journal of Psychology, 42(1): 55-66.
20. Antheunis, M.L., P.M. Valkenburg and J. Peter, 2010. Getting acquainted through social network sites: Testing a model of
online uncertainty reduction and social attraction. Computers in Human Behavior, 26(1): 100-109.
http://doi.org/10.1016/j.chb.2009.07. 005.
21. Wood, J.T., 2011. Communication mosaics, an introduction to the field of communication (6th ed.). USA: Wadsworth,
Cengage Learning.
22. Jones, B.E., B. Watson, J. Gardner and C. Gallois, 2004. Organizational Communication?: Challenges for the New Century.
Journal of Communication, (December), pp: 722-750. http://doi.org/10.1111/j.1460-2466.2004.tb02652.x.
23. Leonardi, P.M., M. Huysman and C. Steinfield, 2013. Enterprise social media: Definition, history and prospects for the study
of social technologies in organizations. Journal of Computer-Mediated Communication, 19(1): 1-19. http://doi.org/10.1111/
jcc4.12029.
24. Treem, J.W. and P.M. Leonardi, 2012. Social Media Use in Organizations: Exploring the affordances of visibility, editability,
persistence and association. In Communication yearbook, pp: 143-189.
JOMAT Vol. 5 No. 2 January – June 2017 ISSN No. 2278-9316
(64)
25. Cardon, P. and B. Marshall, 2014. The Hype and Reality of Social Media Use for Work Collaboration and Team
Communication. Journal of Business Communication, 52(3): 273-293. http://doi.org/10.1177/ 2329488414525446.
26. Young, A.M. and M.D. Hinesly, 2014. Social Media Use to Enhance Internal Communication: Course Design for Business
Students. Business and Professional Communication Quarterly, 77(4): 426-439. http://doi.org/10.1177/ 2329490614544735.
27. Mckinsey Global Survey Result, 2013. Evolution of the networked enterprise: McKinsey Global Survey results. Retrieved
June 30, 2015, from http://mckinsey.com/insights/business_technolog y/evolution_of_the_networked_enterprise.
28. Orbach, M., M. Demko, J. Doyle, B.N. Waber and A. Pentland, 2014. Sensing Informal Networks in Organizations. American
Behavioral Scientist. http://doi.org/10.1177/0002764214556810.
29. Park, M.J., H. Choi and J.J. Rho, 2014. Citizen patronage behavior of government social media services: Extended perspective
of perceived value with the moderating effect of media synchronicity. Information Development. http://doi.org/10.1177/
0266666914543959.
30. Graham, M.W., 2014. Government communication in the digital age: Social media’s effect on local government public
relations. Public Relations Inquiry, 3(3): 361-376. http://doi.org/10.1177/ 2046147X14545371.
31. Gilbert, E. and K. Karahalios, 2009. Predicting Tie Strength with Social Media. Chi 2009. http://doi.org/
10.1145/1518701.1518736.
32. Jin, Y., B.F. Liu and L.L. Austin, 2011. Examining the Role of Social Media in Effective Crisis Management: The Effects of Crisis
Origin, Information Form and Source on Publics’ Crisis Responses. Communication Research. http://doi.org/
10.1177/0093650211423918
33. Hazita, A., S. Ali, A.R. Norizan and H. Supyan, 2014. Determining digital maturity among ICT users in Malaysia. Jurnal
Komunikasi, 30(1): 23-35.
34. Abdel-Ghany, M.M.M., 2014. Readiness for change, change beliefs and resistance to change of extension personnel in the
New Valley Governorate about mobile extension. Annals of Agricultural Sciences, 59(2): 297-303.
http://doi.org/10.1016/j.aoas.2014.11. 019.
35. Economic Report, 2012. Putrajaya.
36. Dominick, J.R., 2009. The dynamics of mass communication; media in the digital age (10 ed.). University of Georgia:
McGraw-Hill Global Education.
37. Weimann, G. and N. Weiss-blatt, 2014. Reevaluating “The End of Mass Communication?” MassCommunicationandSociety,
17(6):803-829. http://doi.org/10.1080/15205436.2013.851700
38. Jennings, S.E., J.R. Blount and M.G. Weatherly, 2014. Social Media-A Virtual Pandora’s Box: Prevalence, Possible Legal
Liabilities and Policies. Business and Professional Communication Quarterly, 77(1): 96-113.
http://doi.org/10.1177/2329490613517132.
39. Kaplan, A.M. and M. Haenlein, 2010. Users of the world, unite! The challenges and opportunities of Social Media. Business
Horizons, 53(1): 59-68. http://doi.org/10.1016/j.bushor.2009.09.003.
40. Qiu, L., J. Lu, S. Yang, W. Qu and T. Zhu, 2015. What does your selfie say about you? Computers in Human Behavior, 52: 443-
449. http://doi.org/10.1016/j.chb.2015.06.032.
41. Flew, T., 2008. New Media and introduction (3 ed.). Sydney: Oxford university press.
42. Jameson, D.A., 2014. Crossing Public-Private and Personal-Professional Boundaries: How Changes in Technology May Affect
CEOs’ Communication. Business and Professional Communication Quarterly, 77(1): 7-30.
http://doi.org/10.1177/2329490613517133
43. Vaast, E. and E. Kaganer, 2013. Social media affordances and governance in the workplace: An examination of organizational
policies. Journal of Computer-Mediated Communication, 19(1): 78-101. http://doi.org/10.1111/jcc4.12032.
44. Macnamara, J. and A. Zerfass, 2012. Social Media Communication in Organizations: The Challenges of Balancing Openness,
Strategy and Management. International Journal of Strategic Communication, 6(4): 287-308.
http://doi.org/10.1080/1553118X.2012. 711402.
45. Husin,N.K.M., A.R. Romle, S. Pohyae, Z.N.M. Husin, N. Saberi and M.S. Abdullah, 2015. The level of understanding on
corporate image among university students: A case of Malaysian public university, International Journal of Administration
and Governance, 1(14): 68-72.
46. Manzuma-Ndaaba, N.M., Y. Harada, A.R. Romle and M.K.R.S. Abdullah, 2015. The drivers of service loyalty in homogeneous
market: Conceptualizing brand loyalty in Malaysia public universities, Australian Journal of Basic and Applied Sciences, 9(30):
67-73.
47. Jin, L.Y., A. Osman and A.R. Romle, 2015. Attitude towards online shopping activities in Malaysia public university,
Mediterranean Journal of Social Sciences, 6(2): 456-462.
���

JOMAT Vol. 5 No. 2 January – June 2017 ISSN No. 2278-9316
(65)
A STUDY OF EXPORT MARKETING STRATEGY OF AUTOMOBILE INDUSTRY IN INDIA
(WITH SPECIAL REFERENCE TO TATA MOTORS LTD.)
Hedieh Divsalar
S.D. Takalkar
1. Introduction:
The automotive industry is facing new and pressing
challenges. Globalization, individualizations, Digitalization and
increasing competition are pressing the face of the industry.
In addition, increasing safety requirements and voluntary
environmental commitments by the automotive industry has
also contributed to the changes ahead. Size is no longer a
guarantee of success.
Only those companies that find new ways to create value
will prosper in the future. The purpose of this research is to
present a short overview of the automotive industry today
and highlight Challenges facing the industry. Based on this
perspective, some strategic methodologies which enable
them transform themselves for the competition.
The evolving automotive landscape the global
automotive industry is subjected to a range of factors that are
increasing in complexity and influencing the economic
options available to automobile manufacturers.
The majorities of these factors interact with one another
and has strong interdependencies. However, some of these
factors are market-induced and, consequently, cannot be
influenced directly by the automobile manufacturers.
2. Research Problem:
One of the important economic issues in developing
countries, balance of payments deficit and trade deficit,
which in turn exchange, foreign exchange and reduce the
imbalance in developed national monetary value. Various
ways of supplying foreign currency deficit exists, but among
them, increase exports and diversify export items with higher
added value, economic and considered a principled way.
Regarding exports, in addition to being the source of foreign
exchange earnings has increased the productivity of factors of
production, increasing employment and technology transfer
will be there. However, export activity is complex and
sensitive. In between, what is of special importance, different
methods to enter and penetrate global markets, the right
choice and how to grow and continue to work in target
markets that form the marketing process? Thus, studies
carried out with scientific methods to evaluate the role of
marketing and effective marketing factors in the
development of industrial exports, seems to be necessary.
3. Relevance of the study:
Business has a purpose to serve the customer. Marketing
is the strategist of pricing, promotion and distribution of
product which satisfy the customers. For this purpose we
have to study the existing system from the select automobile
industries. For them define a suitable Export Marketing
Strategy model. At the same time compare ideal Export
Marketing Strategy with existing Export Marketing Strategy.
Also find out what problems faced by industries to manage
the existing Export Marketing Strategy. Finally analyze effect
of proper and improper Export Marketing Strategy on these
industries.
4. Research Objective:
The objectives of the study are as follows:
The main goal of this research is to identify and prioritize
the factors affecting export marketing strategies in order to
achieve optimal strategy at Tata Motors exports and identify
weaknesses, strengths, threats and opportunities for the
export of Tata Motors, stated.
© SBPIM
2Head of Department, Art, Commerce & Science College, Narayangaon, Dist: Pune.
Contact No.: 9890525040 Email Id: - [email protected]

JOMAT Vol. 5 No. 2 January – June 2017 ISSN No. 2278-9316
(66)
Sr. No Objective Justification
1. Identify Internal factors influencing the export
marketing strategy on Tata Motor.
The present study came out with listing of present
export marketing strategy system of Tata Motors.
2. Prioritize internal factors affecting export marketing
strategies in Tata Motors.
The present study came out with listing of internal
factors affecting existing export marketing strategies in
Tata motors.
3. Priority of the external factors influencing the export. The present study came out with listing of external
factors affecting existing export marketing strategies in
Tata motors.
4. Identify resources and production skills required of
marketing management tools required for export
production at Tata Motors.
Studied different skill required for proper management
for export production.
5. Identify how to manage prices and manufacturing
costs for products manufactured at Tata Motors.
Different factors studied for manage prices and
manufacturing cost for products.
6. Identify of macro-economic and political factors in
Tata Motors of India for export products.
Strategic review for macro-economic and political
factors.
7. Identify international marketing mechanism for the
export of products in Tata Motors.
The study came out with proper international marketing
mechanism for export of products.
5. Hypothesis:
The study is based on following hypotheses:
The Main Hypotheses
Sr. No. Hypothesis Justification
1. Internal factors, are appropriate the export products of
Tata Motors.
For testing hypothesis one, questions were asked to
export official about their experience and observation
in conventional market; as consumers are in contact
with distribution channel member as well as direct
export official. In this connection; variables are
considered for collecting export market information.
2. External factors, are appropriate for export production
at Tata Motors.
The questions were asked to export official about
external factors those affecting export products.
3. Resource management and production skills and
marketing management tools are appropriate for
exporting products of Tata Motors.
Observation and questions were considered related to
resource management and production skills to improve
export product.
4. Management costs and the cost of production are
appropriate for export production at Tata Motors.
The study came out with different factors related to
cost.
5. Economic and political factors macroeconomic area in
India, are appropriate for export production at Tata
Motors.
Researcher has considered different economic and
political factors related to export market.
6. Factors, and international marketing mechanism, are
appropriate for the export of products in Tata Motors.
Researchershas considered different factors and
mechanism for study export marketing.
6. Scope of the study:
Marketing is very vast subject. Similarly export marketing
is also a vast in size and diverse subject. In the above personal
view of researcher the study limits its scope to selected
automobile industries in Pune city. The study data will be
helpful in developing export marketing strategy which shall
be best suitable to automobile industry. The study of
automobile industry export marketing‘s attributes, market

JOMAT Vol. 5 No. 2 January – June 2017 ISSN No. 2278-9316
(67)
awareness, decision making helpful in framing export
marketing. This study wide scope to make use of export
marketing strategy to develop even better export marketing
strategy for automobile industry.
7. Significance of the study:
The study is relevant for following important
considerations:
(a) There is a phenomenal growth of auto sector in India
at annual growth rate of 12 to 157.
(b) The auto-industry is contributing simplicity to over
all development of economy.
(c) The auto-industry has shown strenuoustrends of
innovation and development in last decades.
8. Literature review:
Marketing strategy takes a company’s mission statement
and the marketing environment into account in order to
come up with a plan for creating and improving products and
for determining price, promotion, position, and package and
target market.
A company’s mission statement not only details the
purpose of the company, but gives a bit of insight into how a
company is run and what activities are appropriate.
Marketing strategies must stay within the realm of the
mission statement or risk the chance of damaging a
company’s reputation.
Developing a marketing strategy includes defining the
appropriate target market. If a company does not properly
identify its target market, it’s virtually impossible to market a
product effectively.
Marketing strategy involves two parts: planning and
implementation. Implementation is taking a planned activity,
such as pricing discounts, and putting it into the target
market's hands. All activities should be measurable.
Some types of marketing strategy include dominance,
innovation, and growth, aggressive and warfare-based
strategies.
Companies resort to surveys, polls and focus groups and
spend a considerable amount of time reviewing sales and
profit figures after a part of their marketing strategy is
launched. Marketing strategies provide the detailed blueprint
on how to achieve the marketing objective. Strategies list
which steps to take, specific action necessary to achieve each
step and the expected timeline by which to accomplish each
stage. While the management team is responsible for
devising the marketing objectives, workers at the supervisory
level and below are in charge of completing the actual steps.
An example of a marketing strategy could be hosting a
sweepstakes. Details of the strategy include determining a
prize for the top five winners, establishing promotional
outlets for the sweepstakes including commercials and
newspaper print and writing the fine print of the rules of
entry.
* A List of Marketing Strategies
Marketing focuses on the planning aspects of bringing
products to market, more so than the actual implementation
of selling them. Setting a sale price, for example, helps you
not only cover your costs, but also helps you target a specific
type of consumer. Creating a product for senior women limits
your customer base, but might result in greater overall sales
as these women find your product less generic and more
attractive. Focusing on your price, position in the marketplace
and methods of distribution generates effective advertising,
promotion and public relations campaigns.
* Pricing Strategies
The price you set for your product or service affects not
only your business but also your competitor’s business. If
your competitor has a higher overhead than you do, dropping
your price forces your competitor to decrease his profit
margins to compete, even if he matches your sales. If your
competitor doesn’t lower his price, you may gain market
share at his expense, decreasing his revenues. Setting a lower
or higher price can position you as a better bargain or give
the perception that you offer more value. However, this
strategy can backfire on you if consumers apply these
attributes to your competitor.
* Distribution Strategies
Where you sell your product is key to increasing sales.
Selling your product in a big-box store gives you access to
more customers than if you sell in select boutique retailers,
but you’ll need to lower your price and might lose any
distinction you have in the marketplace as a high-end
product. Some businesses sell different versions of their
products, offering higher-priced versions in specialty stores
and bargain versions at mass retail outlets.
* Branding Strategies
To appeal to a specific demographic in the marketplace,
position your product as one that is made for a particular
group of consumers. Do this through the use of graphics,
slogans, endorsements by peers and other means that send a
message the product is designed specifically for men, women,
seniors, mothers or other narrower groups of consumers. For
example, hire senior celebrities to endorse products for older
buyers. Sponsor a women's 10K run or breast-cancer
fundraiser if you want women to buy from you. Hire a
pediatrician to promote your product if mothers are your
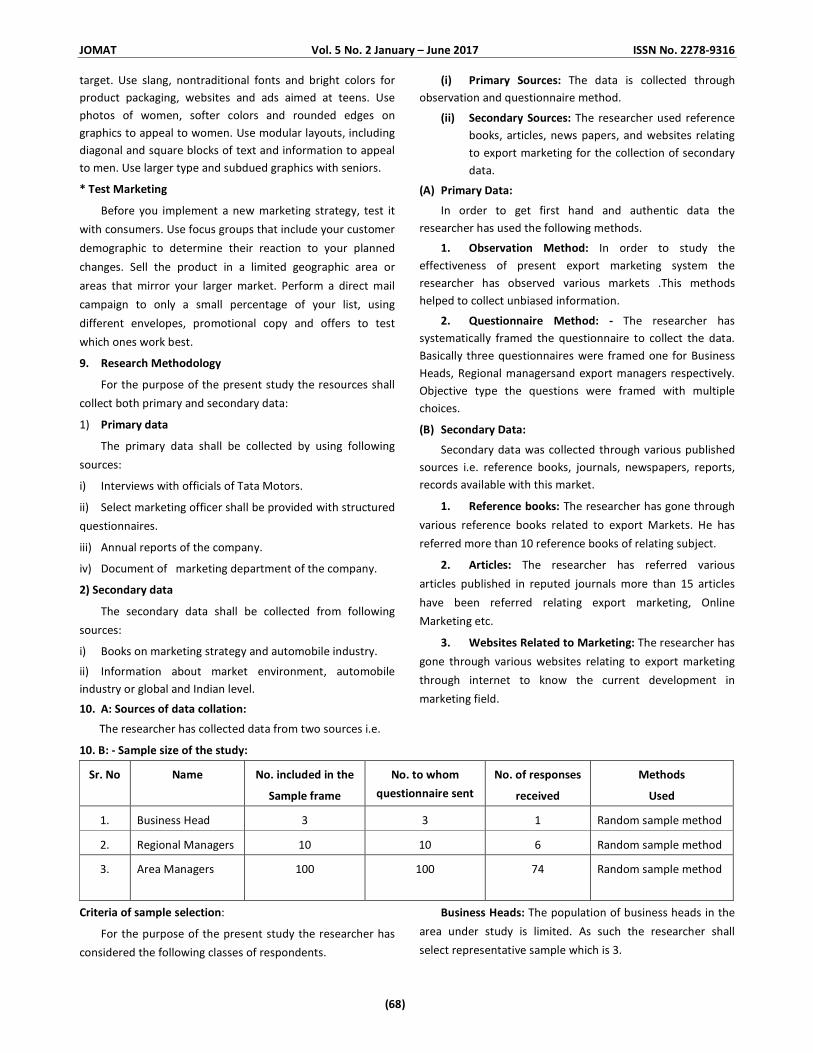
JOMAT Vol. 5 No. 2 January – June 2017 ISSN No. 2278-9316
(68)
target. Use slang, nontraditional fonts and bright colors for
product packaging, websites and ads aimed at teens. Use
photos of women, softer colors and rounded edges on
graphics to appeal to women. Use modular layouts, including
diagonal and square blocks of text and information to appeal
to men. Use larger type and subdued graphics with seniors.
* Test Marketing
Before you implement a new marketing strategy, test it
with consumers. Use focus groups that include your customer
demographic to determine their reaction to your planned
changes. Sell the product in a limited geographic area or
areas that mirror your larger market. Perform a direct mail
campaign to only a small percentage of your list, using
different envelopes, promotional copy and offers to test
which ones work best.
9. Research Methodology
For the purpose of the present study the resources shall
collect both primary and secondary data:
1) Primary data
The primary data shall be collected by using following
sources:
i) Interviews with officials of Tata Motors.
ii) Select marketing officer shall be provided with structured
questionnaires.
iii) Annual reports of the company.
iv) Document of marketing department of the company.
2) Secondary data
The secondary data shall be collected from following
sources:
i) Books on marketing strategy and automobile industry.
ii) Information about market environment, automobile
industry or global and Indian level.
10. A: Sources of data collation:
The researcher has collected data from two sources i.e.
(i) Primary Sources: The data is collected through
observation and questionnaire method.
(ii) Secondary Sources: The researcher used reference
books, articles, news papers, and websites relating
to export marketing for the collection of secondary
data.
(A) Primary Data:
In order to get first hand and authentic data the
researcher has used the following methods.
1. Observation Method: In order to study the
effectiveness of present export marketing system the
researcher has observed various markets .This methods
helped to collect unbiased information.
2. Questionnaire Method: - The researcher has
systematically framed the questionnaire to collect the data.
Basically three questionnaires were framed one for Business
Heads, Regional managersand export managers respectively.
Objective type the questions were framed with multiple
choices.
(B) Secondary Data:
Secondary data was collected through various published
sources i.e. reference books, journals, newspapers, reports,
records available with this market.
1. Reference books: The researcher has gone through
various reference books related to export Markets. He has
referred more than 10 reference books of relating subject.
2. Articles: The researcher has referred various
articles published in reputed journals more than 15 articles
have been referred relating export marketing, Online
Marketing etc.
3. Websites Related to Marketing: The researcher has
gone through various websites relating to export marketing
through internet to know the current development in
marketing field.
10. B: - Sample size of the study:
Sr. No Name No. included in the
Sample frame
No. to whom
questionnaire sent
No. of responses
received
Methods
Used
1. Business Head 3 3 1 Random sample method
2. Regional Managers 10 10 6 Random sample method
3. Area Managers 100 100 74
Random sample method
Criteria of sample selection:
For the purpose of the present study the researcher has
considered the following classes of respondents.
Business Heads: The population of business heads in the
area under study is limited. As such the researcher shall
select representative sample which is 3.

JOMAT Vol. 5 No. 2 January – June 2017 ISSN No. 2278-9316
(69)
Regional Managers: A representative sample is 10
regional managers who facilitate the export marketing
covered in the study.
Area Managers: The marketing process has influenced
the export customers ; the researcher has studied large
number of customers who preferred to TATA product with
the help of Area mangers. Totally 100 area managers are
considered for the study.
Justification:
The above sample size is justified on the following
grounds:
Business Heads: The population of business heads in the
area under study is limited. As such the researcher shall
select representative sample which is 3. It is enough to cover
the different facts of export marketing factors from 1
business heads.
Regional Managers: A representative sample is 10
regional managers who facilitate the export marketing
covered in the study. This sample of 6 respondents shall help
to know their views and opinions as to the merits and
limitations of export marketing.
Area Managers: The marketing process has influenced
the export customers; the researcher has studied large
number of customers who preferred to TATA product with
the help of Area mangers. Totally 100 area managers are
considered for the study. In this study the researcher has
identified the ideas, views and opinions of consumers
towards export marketing with their economic implication.
11. Method of analysis and Statistical Tools Used:
All completed questionnaires were scrutinized carefully;
the list of required tables and output was prepared. After
thorough discussion with computer experts, program for
computerization was prepared and finally all data were
computerized with great precaution to avoid errors in
computerization. After getting data computerized they were
presented in different tables with the help of SPSS software.
Mean, Mediation, variance, mode and distribution are
calculated. The statistical tools like tabulation, average,
percentage, std. deviation, mean, are used for analyzing the
data.
12. Research Findings
Related to Business Head and Head of sales:
1. They are offering god services in market identification,
territory research, customer research and segmentation,
market scanning, marketing strategy development,
pricing and promotion, dealership network development,
logistics and distribution, developing relationship with
government agencies, legal framework analysis and
cultural and political analysis of external market.
2. With good experience in automobile industry, he also
handled successfully sales marketing and product
launching activities in Singapore, Russia and Africa.
3. During product launching, they focused on market
demand, customer satisfaction, economical environment
economic system and population. Also studied favorable
factors like market potential for rate of market growth,
growth trends for nature of change in the market, system
develop for growth value of economy and customer
prefers for cultural variables. Unfavorable factors like
crime index on priority, government stability on second
and tax structure on last priority respectively.
4. Researcher studied international market competitors
analysis with the help of business head considering
technology, brand and price . As per that he found
technology on first, brand on second while price on
third.
5. Again technology and price are the strength of Tata
product while entering into foreign market.
6. Competition and network development are the
constrains t of market demand projection
7. For export promotion, exercised on export incentives, fix
competitive environment, market acceptance,
customer’s perception and taxes. Tata motors never
experienced any hindrances.
8. Tata motors found success rate in area of success is
durability.
Some issues related with export automobile product:
1. Marketing Environment in India :
(a) The present marketing environment is encouraging
both; producers and consumers in a free and open
manner.
(b) The new marketing environment encourage
competitive approach
2. Automobile Market in India
(a) The automobile market in India is expanding and
growing.
(b) The growth of automobile industry has encourage -
innovation and creativity to a large extent.
3. Export Market
(a) The change in the marketing scenario in automobile
industry has also changed the composition of both;
domestic and export market.
(b) Indian automobile products are recognized as
competitive in international market.
JOMAT Vol. 5 No. 2 January – June 2017 ISSN No. 2278-9316
(70)
4. Export of TATA Automobile products
(a) Tata represents India’s leadership in automobile
sector in the overseas market
(b) Tata automobile policy is proactive and forward
looking
(c) In the near future, Tata will be established as
market leader
5. Perception about automobile market
(a) The key factors for success in international market
in automobile industry are quality, cost and creative
product development
Related to Regional Managers (Sales and Marketing)
As per the view taken by Regional Managers, related to
issues related with export automobile product:
Marketing Environment in India:
(a) The present marketing environment is encouraging
both; producers and consumers in a free and open
manner.
(b) The new marketing environment encourage
competitive approach.
Automobile Market in India
(a) The automobile market in India is expanding and
growing.
Export Market
(a) Increased production and qualitative aspects have
helped Indian automobile producers to enhance
their exports.
Export of TATA Automobile products
(a) In the near future, Tata will be established as
market leader.
(b) Tata automobile policy is proactive and forward
looking.
Perception about automobile market
(a) The key factors for success in international market
in automobile industry are quality, cost and creative
product development.
(b) The international automobile market is in maturity
stage.
(c) Major players in the international market in
international market are in a withdrawal mode due
to growing competition and low profitability
Related to Area Mangers (Sales and Marketing)
The view of Area Mangers related to export market:
Vision wise : From the responses from the respondents,
52.5% of respondents given preference to experience and
value, 27.5% of respondents given preference to enhance
market issues while 20% of respondents chosen customer
conductive to improve the vision of Tata Motors export
market.
Mission wise : From the responses from the respondents,
From the responses from the respondents, 52.5% of
respondents given preference to providing the best vehicles,
7.5% of respondents given preference to every customer is
valued while 40% of respondents neutral in this decision.
Integrates its activity view point : From the responses
from the respondents, 32.5% of respondents given
preference to quality services, 20% of respondents prefer
uniform experience at all touch points , 7.5% of respondents
given preference to composition and combination while 40%
of respondents neutral in this decision.
From view point of spelt out the marketing goals : From
the responses from the respondents, 20% of respondents
given preference to CSI/DSI to be in touch, 12.5% of
respondents prefer best available solutions ensuring CSI/DSI,
20% of respondents given preference to loyalty of customers,
7.5% of respondents chosen create new market while 40% of
respondents neutral in this decision.
From view point of goals of the marketing department :
From the responses from the respondents, 20% of
respondents given preference to volume growth, 12.5% of
respondents prefer companies mission, 20% of respondents
given preference to base on shipment value, 7.5% of
respondents chosen market environment analysis while 40%
of respondents neutral in this decision.
Environmental factors wise : From the responses from
the respondents, 20% of respondents given preference to
industry volume, 7.5% of respondents prefer economic
growth and stability of the company, 32.5% of respondents
given preference to macro-economic factors while 40% of
respondents neutral in this decision.
Target wise : From the responses from the respondents,
20% of respondents given preference to part performance,
20% of respondents prefer market share segmentation,
12.5% of respondents given based on shipment value, 7.5% of
respondents chosen demand estimate while 40% of
respondents neutral in this decision.
Time bound target/span wise : From the responses from
the respondents, 32.5% of respondents given preference to
monthly targets, 20% of respondents prefer half yearly
targets, 40% of respondents preferring quarterly targets,
while 7.5% of respondents thinking any type of target.
From view point of team/subgroup/targets are
integrated : From the responses from the respondents, 12.5%
of respondents given preference to companies’ long term
strategy, 20% of respondents prefer AMC target, 20% of
JOMAT Vol. 5 No. 2 January – June 2017 ISSN No. 2278-9316
(71)
respondents preferring team-wise targets, 7.5% of
respondents thinking goal setting for target while majority
40% of respondents thinking value in terms as target.
Performance appraisal system : From the responses
from the respondents, 7.5% of respondents given preference
to regularly based performance appraisal strategy, majority
92.5% of respondents prefer time specific period based
performance, while nobody is interested into other norms to
be followed for performance appraisal.
As per the all respondents Tata Motors export market
division thinking market is segment to the marketing activity
for motor division.
Determine the criteria of segmentation : From the
responses from the respondents, 60% of respondents given
preference to pay load criteria of segmentation, 20% of
respondents prefer application of CV, 12.5% of respondents
thinking market specified into CV while 7.5% of respondents
prefer customer class analysis to be considered as criteria of
segmentation.
Segmentation is reviewed by organization : From the
responses from the respondents, 60% of respondents given
first rank to tonnages, 20% of respondents prefer second rank
to segmentation, 12.5% of respondents preferred third rank
to horse power while 7.5% of respondents preferred fourth
rank to regulation.
13. Scope for the future:
Further research can be conducted on a single product
while taking into consideration the more variables. At the
same time study can be conducted by considering some of
respondent.
This study is conducted only Tata Motors’ Export Market.
For comprehensive and detailed understanding of export
market, studies should be conducted at national level by
taking larger sample size.
Many automobile industries should have been successful,
have failed miserably. Therefore, marketers need to
understand the social dynamics, economical factors, political
factors and attitude variations within each automobile
industries though nationally it follows a consistent pattern.
As far as organization is connected, the key change to
support business models serving has to do with structural
modification. Marketing organizations sketch parallels from
the way networks changed the power of automobile export
market by facilitating decoupling ( storage, processing, and
display) and reconfiguring (by quickly mobilizing ).
The export market architecture, through its core of
specified and saleable knowledge in areas such as customer
segmentation, distribution logistics etc must support the
front-end customer services teams that are highly contextual
and manage relationships. Another important organizational
intervention lies in how knowledge is managed. People and
the database must be networked to address customer needs
effectively.
14. Limitations
• This study is limited for Tata Motors export division.
• The respondents are also limited as business head,
Regional and Area managers (Export Division).
• Outcomes and result can’t applicable with other
products.
• The conclusions are drawn on the basis of limited
sample selected for the study purpose.
REFERENCES
1. Kotler, Philip; Gary Armstrong, Veronica Wong, John Saunders (2008). "Marketing defined". Principles of marketing (5th
Ed.).
p. 7.
2. http://books.google.com/books?id=6T2R0_ESU5ACandlpg=PP1andpg=PA7#v=onepageandq=andf=true. Retrieved 2009-10-
23.
3. http://www.marketingpower.com/AboutAMA/Pages/DefinitionofMarketing.aspx. Retrieved 2009-10-30.
4. Kantar, P.M, (1987), The change masters, New York; Simon and Schuster.
5. McLean G. N, (2006), National Human Resource Development: A Focused Study in Transit, Advances in Developing Human
Resources Volt 6 (#3) August 2004 and Volt 8, #3.
6. http://ann.sagepub.com/cgi/content/abstract/520/1/42
7. http://www.tatamotors.com/our_world/press_releases.php?ID=356andaction=Pull. Retrieved 2008-03-27.
8. http://web.archive.org/web/20080209022809/http://www.autolineind.com/our_story.htm
9. Guiltinan et al.,(1996) Marketing Management: Strategies and Programs", McGraw Hill/Irwin.

JOMAT Vol. 5 No. 2 January – June 2017 ISSN No. 2278-9316
(72)
10. Joshi, Rakesh Mohan, (2005) International Marketing, Oxford University Press, New Delhi and New York, ISBN 0195671236.
11. Adcock, Dennis; Al Halborg, Caroline Ross (2001), Marketing: principles and practice (4th ed.). p. 16. Retrieved 2009-10-23.
12. Kevin Lane Keller, (2009), A Framework for Marketing Management (4th ed.). Pearson Prentice Hall. ISBN 0136026605.
13. Paul H. Selden, (1997), Sales Process Engineering: A Personal Workshop. Milwaukee, WI. p. 23.
14. http://www.edisonawards.com/Winners2010.
Research scholar Research Guide
Ms. Hedieh Divsalar Dr. Shivaji Takalkar
���