FINAL IDP REVIEW 2019/20 PLANNING 2020/21
124
SOL PLAATJE MUNICIPALITY Integrated Development Plan (IDP) FINAL IDP REVIEW 2019/20 PLANNING 2020/21
Transcript of FINAL IDP REVIEW 2019/20 PLANNING 2020/21

SOL PLAATJE MUNICIPALITY
Integrated Development Plan (IDP)
FINAL IDP REVIEW 2019/20
PLANNING 2020/21

TABLE OF CONTENTS
PREFACE ....................................................................................................................... 1
VISION AND MISSION OF SOL PLAATJE MUNICIPALITY ............................................................................................ 1
STRATEGIC PRIORITIES ............................................................................................................................................. 2
CHAPTER 1: EXECUTIVE SUMMARY ........................................................................... 10
1.1 INTRODUCTION ............................................................................................................................................... 10
1.2 LEGAL BACKGROUND.................................................................................................................................. 10
1.3 IDP REVIEW PROCESS ................................................................................................................................. 11
CHAPTER 2: STRATEGIC ANALYSIS ............................................................................ 12
2.1 MUNICIPAL PROFILE ................................................................................................................................... 12
2.2 CONTEXTUALISING THE ISSUES RELATING TO DEMOGRAPHIC AND SOCIO-ECONOMIC INFORMATION ... 32
CHAPTER 3: SITUATIONAL ANALYSIS ........................................................................ 35
3.1 STATUS QUO PER KEY PERFORMANCE AREA ............................................................................................. 35
3.1.1 STRATEGIC ECONOMIC DEVELOPMENT AND PLANNING ............................................................................ 35
3.1.2 BASIC AND SUSTAINABLE SERVICE DELIVERY AND INFRASTRUCTURE DEVELOPMENT .............................. 45
INFRASTRUCTURE SERVICES ....................................................................................................................... 45
COMMUNITY AND SOCIAL DEVELOPMENT SERVICES ................................................................................. 58
3.1.3 MUNICIPAL FINANCIAL VIABILITY AND MANAGEMENT .............................................................................. 62
3.1.4 MUNICIPAL INSTITUTIONAL DEVELOPMENT AND TRANSFORMATION ..................................................... 69
3.1.5 GOOD GOVERNANCE AND PUBLIC PARTICIPATION ................................................................................... 72
CHAPTER 4: INTEGRATION OF THE IDP...................................................................... 80
4.1 LINKAGE OF THE IDP TO OTHER STRATEGIC DOCUMENTS ........................................................................... 80
CHAPTER 5: SECTORAL PLANS ................................................................................. 85
5.1 EXISTING SECTORAL PLANS AND THE RELEVANCE THEREOF ...................................................................... 85
5.2 THE LOGIC OF SECTOR PLANS ..................................................................................................................... 91
CHAPTER 6: MONITORING OF THE IDP AND BUDGET .............................................. 95

ANNEXURES
ANNEXURE 1 : HIGH LEVEL PROCESS PLAN
ANNEXURE 2 : PUBLIC PARTICIPATION PROGRAM
ANNEXURE 3 : MULTI-YEAR CAPITAL PLAN
ANNEXURE 4 : WARD PRIORITIES
TABLES
Table 1: National KPA’s and IDP Objectives
Table 2: Key Statistics Objectives
Table 3: Total Populations- Sol Plaatje, Frances Baard, Northern Cape and National Total
2005-2016 (Numbers / Percentage)
Table 4: Population Projections - Sol Plaatje, Frances Baard, Northern Cape and National Total
2005-2016 (Numbers / Percentage)
Table 5: SA and LED History
Table 6: Water Losses – Action Plan
Table 7: Electrical Losses – Action Plan
Table 8: Estimated Housing Backlog
Table 9: Capital Infrastructure Projects
Table 10: Capital funding sources over the MTREF
Table 11: Ward Priorities
Table 12: State of the Budget – 2020/21 Tariff Increases
Table 13: Main Cost Drivers
Table 14: Roles and Responsibilities of Political Structures
Table 15: Existing Sectoral Plans
FIGURES
Figure 1: Municipal Financial Sustainability
Figure 2 : Priority Housing Development Areas
Figure 3: Kimberley 66 KV Network
Figure 4: IDP/Budget/SDBIP Process
Figure 5: Governance Structure
Figure 6: Executive Management Structure
Figure 7: The National Development Plan – Vision 2030
Figure 8: NDP Outcomes Based Approach
Figure 9: The GDS in the Planning (IDP( and Budgeting Context
Figure 10: Logic of Sectoral Plans
Figure 11: Alternative Funding Methodologies
Figure 12: IDP/Budget/PMS Linkage
CHARTS
Chart 1: Population Community Survey 2016
Chart 2: Population Structure 2015 vs 2020
Chart 3: Labour Market and Education Statistics 2011 compared to 2001
Chart 4: Highest Level of Education 15+ (2005 vs 2015)
Chart 5: Involvement in the economy

Chart 6: EAP as a percentage of total population
Chart 7: Unemployment Rates
Chart 8: Labour Force and Unemployment Rates
Chart 9: Types of dwellings
Chart 10: Households by type of toilet
Chart 11: Sanitation Backlog
Chart 12: Households by level of access to water
Chart 13: Water Backlog
Chart 14: Households by electricity usage
Chart 15: Electricity Connections
Chart 16: Households with access to refuse removal
Chart 17: Households with no access to refuse removal
Chart 18: GVA – Broad Sector Composition, 2015
Chart 19: Gross Domestic Product (GDP) Forecast, 2005 -2015
Chart 20: Economic Growth in 4th Q: 2019
Chart 21: Industry Growth in 4th Q: 2019
Chart 22: SA’s Consumer Price Inflation, January 2020
Chart 23: SA’s Youth Unemployment Rate Q4 : 2018 to Q1 2019
Chart 24: The “Poverty-Gap”
Chart 25: Average Tariff Increases
Chart 26: Rates Tariff Increases
Chart 27: Current Value of G.V. Roll – R35 503 108 070.00
Chart 28: Growth in Number of Properties in SPLM

LIST OF ACRONYMS
B2B Back To Basics
BBBEE Broad-Based Black Economic Empowerment
BNG Breaking New Ground
CBD Central Business District
CLCB Centre for Local Capacity Building
COGHSTA Department of Co-operative Governance, Human Settlement and Traditional
Affairs
DMS Disaster Management Framework
DTI Department of Trade and Industry
DOE Department of Energy
DWA Department of Water Affairs
EAP Employee Assistance Programme
EEDSM Energy Efficiency and Demand Side Management
EPWP Expanded Public Works Programme
EU Europian Union
FBDM Frances Baard District Municipality
FY Financial Year
GDP Gross Domestic Product
GDS Growth and Development Strategy
GV General Valuation
GVA Gross Value Added
HRM Human Resource Management
IDP Integrated development Plan
IGR Inter-Governmental Relations
INEP Integrated National Electrification Programme
IPP Independent Power Producer
ISDG Infrastructure Skills Development Grant
IT Information Technology
IUDF Integrated Urban Development Framework
KPA Key Performance Area
LA Local Administeation
LED Local Economic Development
LGMIM Local Government Management Improvement Model
LUMS Land Use Management Scheme
MAYCO Mayoral Committee
MIIF Municipal Infrastructure Investment Framework
MPC Monetary Policy Committee
MSA Municipal Structures Act

MTREF Medium Term Revenue Expenditure Framework
NDP National Development Plan
NDPG Neighbourhood Development Partnership Grant
NERSA National Energy Regulator of South Africa
OPCAR Operational Clean Audit Report
PMS Performance Management System
RDP Reconstruction and Development Programme
RBIG Regional Bulk Infrastructure Grant
SARB South African Reserve Bank
SCM Supply Chain Management
SDBIP Service Delivery Budget Implementation Plan
SDF Spatial Development Framework
SDG Sustainable Development Goals
SECCU Sustainable Energy and Climate Change Unit
SLP Social Labour Plans
SMME Small, Medium and Micro-Sized Enterprise
SPLM Sol Plaatje Local Municipality
SPLUMA Spatial Planning and Land Use Management Act
SSEG Small Scale Embedded Generators
TOD Transit Orientated Development
UDS Urban Network Strategy
UDZ Urban Development Zone
WSA Water Service Authority
WWTW Waste Water Treatment Works
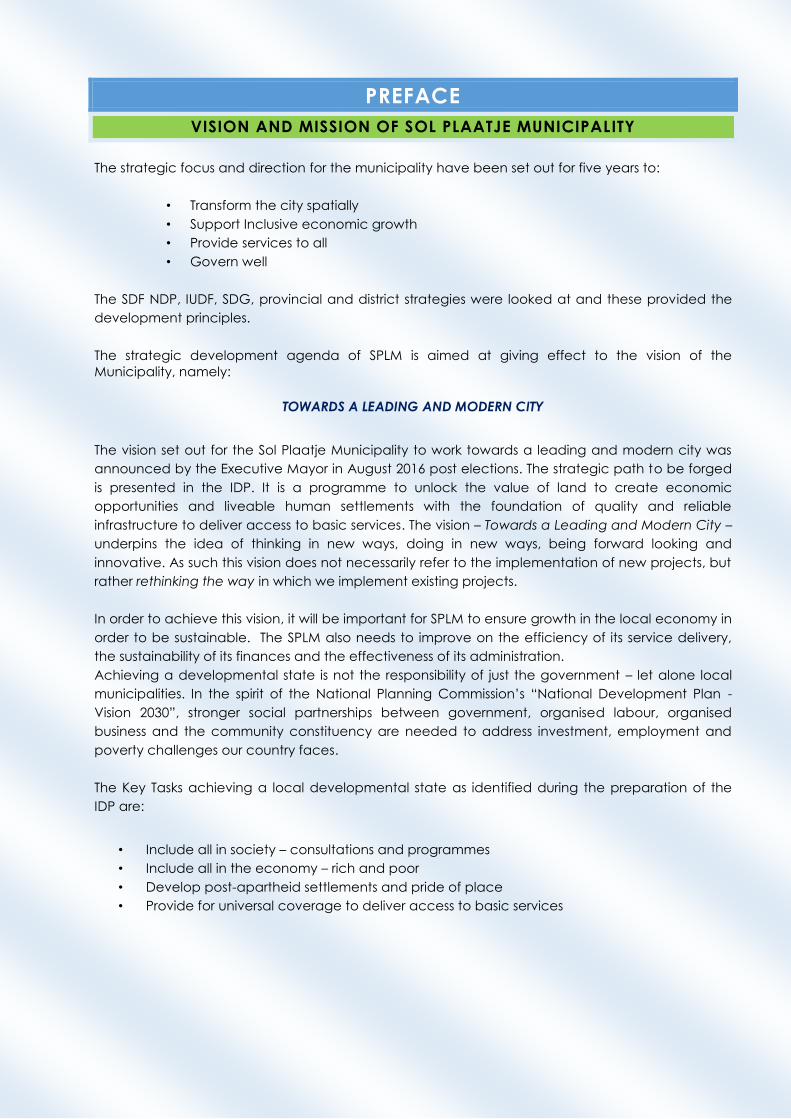
PREFACE
VISION AND MISSION OF SOL PLAATJE MUNICIPALITY
The strategic focus and direction for the municipality have been set out for five years to:
• Transform the city spatially
• Support Inclusive economic growth
• Provide services to all
• Govern well
The SDF NDP, IUDF, SDG, provincial and district strategies were looked at and these provided the
development principles.
The strategic development agenda of SPLM is aimed at giving effect to the vision of the
Municipality, namely:
TOWARDS A LEADING AND MODERN CITY
The vision set out for the Sol Plaatje Municipality to work towards a leading and modern city was
announced by the Executive Mayor in August 2016 post elections. The strategic path to be forged
is presented in the IDP. It is a programme to unlock the value of land to create economic
opportunities and liveable human settlements with the foundation of quality and reliable
infrastructure to deliver access to basic services. The vision – Towards a Leading and Modern City –
underpins the idea of thinking in new ways, doing in new ways, being forward looking and
innovative. As such this vision does not necessarily refer to the implementation of new projects, but
rather rethinking the way in which we implement existing projects.
In order to achieve this vision, it will be important for SPLM to ensure growth in the local economy in
order to be sustainable. The SPLM also needs to improve on the efficiency of its service delivery,
the sustainability of its finances and the effectiveness of its administration.
Achieving a developmental state is not the responsibility of just the government – let alone local
municipalities. In the spirit of the National Planning Commission’s “National Development Plan -
Vision 2030”, stronger social partnerships between government, organised labour, organised
business and the community constituency are needed to address investment, employment and
poverty challenges our country faces.
The Key Tasks achieving a local developmental state as identified during the preparation of the
IDP are:
• Include all in society – consultations and programmes
• Include all in the economy – rich and poor
• Develop post-apartheid settlements and pride of place
• Provide for universal coverage to deliver access to basic services

2 | P a g e
STRATEGIC PRIORITIES
Sol Plaatje is a pilot for the “new deal” - the Integrated Urban Development Framework. This is a
unique opportunity for the municipality and the residents of Sol Plaatje. In the course of making
the “Back to Basics” program of local government a reality, a new vision “Towards a leading and
modern city” is presented in the current IDP. The Future is a new deal wherein all stakeholders will
work towards developing a:
Clean city
City that attracts investment, manufacturers and tourists
City with good infrastructure
Safe and secure City - A city that cares
City where there is security- jobs, shelter
City that facilitates the creation of jobs
City that houses people
City with youth involved productively
City that harnesses integrated development
City that facilitates skills development
City that invests in public participation, is connected with the people
City that works together
City with good IGR harnessed to build integrated human settlements
The goal is to lead the city towards modernization. To achieve this, the following strategic
objectives will guide the city towards the future:
Spatial Transformation:
To transform the spatial structure of the City towards an equitable, inclusive, efficient and compact
form consisting of a series of integrated and well-connected economic corridors, nodes and
attractive mixed-use/mixed-income sustainable human settlements of varying densities. The
overarching strategy for the development of the Sol Plaatje Municipality proposes looking at the
IDP through the lens of geographical “space-economy”.
The “space-economy” means the geographic distribution of settlements (large and small), the
activities within them (residential, commercial, institutional, recreational, etc.) and the relationship
of these settlements and activities to the infrastructure that connects and supports them and links
in turn to surrounding agriculture and nature areas.
People live their lives in geographic space; how activities and infrastructure are organized in
space, fundamentally impacts on people’s access to economic and social opportunities. For
example, locating housing for the poor far away from work opportunities, impacts on disposable
income, work productivity and transport infrastructure provision. People have to pay a
disproportionately high percentage of their incomes to move to and from work, journeys take a
long time, and infrastructure and vehicles have to be provided and maintained to transport them.
Also, locating business opportunities far from infrastructure increases the cost of products and
diminishes the chances of success for large and small businesses. An informal trader or small café
owner cannot hope to succeed without necessities such as water or a reasonable flow of passers-
by.

3 | P a g e
The apartheid spatial legacy is the foundation for much of the inequity in society. A primary
strategy of Apartheid was to manipulate the space-economy of towns, to provide good
opportunities for whites and the rich and to deny opportunities for blacks and the poor. The best
land and most viable locations, the best infrastructure and networks, have traditionally been
offered to the minority of citizens. Only through restructuring the space-economy of our settlements
can we hope to overcome our divided legacy.
Secondly, municipal strategy has over the last decade taken a strong “sectoral” approach. The
approach looks at development in sectors such as Local Economic Development Plans, plans for
‘creative industries’, small enterprises, tourism, and so on. Unfortunately, much of this work is silent
on the impact of space on specific sectors and has assisted to hide spatial inequity in our
settlements. For example, very few, if any, Local Economic Development Plans will look at the
relationship between transport infrastructure, economic opportunity and job creation.
Thirdly, municipal government has considerable influence over the space economy of settlements.
By virtue of its mandate, local government can determine the nature and location of key
infrastructure and where settlement is to occur and where not. Local government cannot grow the
economy, but it impacts on economic success through the provision and maintenance of
infrastructure and how activities are organized in space
Inclusive Growth:
To establish a competitive economic position that attracts diverse investments, increases
economic growth and creates targeted number of jobs.
Service Provision:
To plan for, install, maintain and operate infrastructure, and provide services more efficiently and
on a sustainable basis that adequately supports:
o transformed spatial structure
o economic growth objectives
o universal access to basic services,
o differentiated service requirements of households and human settlements and
economic activity
Governance:
To enhance the capacity of the state and its citizens to work together to achieve spatial
and social integration.
To lead, direct and manage spatial growth of the City robustly, enhance revenue
generation and improve operational efficiency.
The municipality has taken steps over the past years to rebuild and stabilize the internal processes
of delivery and build financial sustainability but due to the temporary suspension of the Municipal
Manager and the Chief Financial Officer in June 2018 as well as strike actions, it contributed to the
decline in investments and financial constraints. The Section 106 report need to be finalized in
order for Sol Plaatje Municipality to move forward and become financially stable. The Sol Plaatje
Municipality was without leadership and ED’s were acting on a three-monthly basis.

4 | P a g e
The Premier of the Northern Cape has thus seconded Messrs MT Mabija and Z Cader during
November 2019 to Act as Municipal Manager and Chief Financial Officer, respectively for a period
of three months, which were extended in February 2020 until April 2020.
Even though the current situation is not ideal for the institution Sol Plaatje Municipality is still
committed to exploit its full potential to:
Reverse inefficient land use patterns
Tackle the aging infrastructure of the city
Deal with the results of the relatively stagnant economic landscape in a systematic way
Increase debt collection
Critical service delivery
Although the current needs are not fully funded, it is envisaged that a momentum on delivery will
be developed to attract funding and additional investments to reach the goal and strategic
objectives set out.
The focus is on developing thriving township economies and integrating the various organic urban
nodes and economic corridors to make the appropriate linkages between urban and rural
settlements. Once this strategic spatial vision is planned, implementation will follow through the
development of urban management mechanisms and precinct developments.
At present land locked spaces and sprawling informal settlements dominate the spatial
landscape. The land use patterns within the urban centres are not conducive to investment and
robustness. This situation has led to crime, grime and dilapidation. This IDP places a higher value
and importance on spatial governance and local economic development programs playing a
bigger role in transforming the spatial landscape and resultant consequences.
The strong elements of inequality in the form of racial or class exclusion in the spatial form will be
attended to through programs of public participation and intergovernmental relations. Community
involvement will include participation in developing pride of place and in incoming generating
projects. The areas of highest population densities in locations furthest away from economic
opportunities with the least access to basic services will be targeted for inclusion. In achieving
inclusion, subsidized housing and provision thereof will be located close to the urban core. This will
require robust intergovernmental relations as the government housing developments provide
platforms for people to develop and exit the trap of inter-generational poverty.
Low density areas enjoy the privilege of owning large tracts of land that are located in very close
proximity to economic opportunities. The divide between high and low density areas will be linked
through a coordinated effort of spatial planning, local economic development and access to
services.
The program to eradicate the housing backlogs will be undertaken in a manner that creates
integrated human settlements. In this respect a partnership with the province and national
department of Human Settlements will be the main focus of intergovernmental relations. 30% of the
Northern Cape housing backlog exists in Sol Plaatje, thus the focus would be to ramp up the
planning and delivery of houses, with clear economic spin offs to boost the local economy.

5 | P a g e
Housing developments that will build the future should take pride in creating spaces for recreation,
sports, and community gathering. These developments should encompass elements that combat
crime, promote social cohesion and improve the quality of life for the poor. The stubborn problem
of the inability to reach universal coverage on basic services to all will be tackled with integrated
infrastructure plans that link to spatial planning and local economic development potentials.
A special attempt will be made to attract investment to grow the economy over time with the
tourism being developed as the anchor. At the same time, the informal sector and small and micro
enterprises will be supported to participate in the industrial value chain. A substantial number of
households are dependent on social grants. These households will be targeted to be involved in a
range of income generating activities to enable community development, social upliftment and
personal growth. These efforts will begin to fundamentally address the challenges of poverty,
vulnerability, inequality and social exclusion.
The biggest challenge confronting many municipalities in South Africa including the Sol Plaatje
Municipality is on addressing service delivery backlogs whilst at the same time meeting the
demands arising from continuous local population growth (combination of natural growth and in-
migration) with the concomitant growth in the number of households.
The problem of cable theft, vandalism of properties and land grab are also huge challenges that
Sol Plaatje Municipality must dealt with for which there are no easy and quick solutions.
The historical backlog together with the resultant demand from growth for new infrastructure,
services and housing surpasses the fiscal capacity of many municipalities. The equitable share and
conditional financial grants as well as own revenue generation are insufficient to meet
infrastructure investment requirements. Own revenue generation by municipalities is constrained
by weak local fiscal bases due to low economic growth and very low employment and household
income levels.
o As the local state is a developmental state, a special focus on the involvement of all
stakeholders will be developed. All communities will be involved in working to make
Sol Plaatje a clean, livable and vibrant city. The future focus is about leaving a
legacy for the next generation, the building blocks of skills, leveraging local resources
and maintaining active engagements with all citizens will modernize the city and
provide the necessary platform for Sol Plaatje leaders to lead the “new deal” for all
citizens.
SPLM’s IDP Objectives and strategies are indicated in the table below:
Table 1: National KPA’s and IDP Objectives
National KPA
National Outcome 9: A responsive, accountable, effective and efficient local
government system
Strategic Objectives to reach the Vision
"Towards a Leading and Modern City"
Key Strategic Focus
IDP Strategies Detail Project related objectives as per the
SDBIP
Strategic
Economic
Development
and Planning
Outcome: A spatially
transformed,
equitable and
productive city
Inclusive Growth: To
establish a competitive
economic position that
attracts diverse
investments, increases
economic growth and
Land
Development
Accelerate preparation,
approvals and release of
land for development
supporting integrated
human settlement,
agricultural production,
To develop sustainable
living through job creation
(EPWP and other
initiatives)

6 | P a g e
National KPA
National Outcome 9: A responsive, accountable, effective and efficient local
government system
Strategic Objectives to reach the Vision
"Towards a Leading and Modern City"
Key Strategic Focus
IDP Strategies Detail Project related objectives as per the
SDBIP
creates targeted number
of jobs.
Spatial
Transformation: To
transform the spatial
structure of the City
towards an equitable,
inclusive, efficient and
compact form consisting
of a series of integrated
and well connected
economic corridors,
nodes and attractive
mixed-use/mixed-
income sustainable
human settlements of
varying densities
redevelopment of mining
land and regional
economic targets
Skills
Development
and Income
Generation
Facilitate skills
development,
encourage incubation
hubs for enterprise
development and
employment placement
programmes in
partnership with the
private sector. Facilitate
household income
generating activity linked
to various sectors in the
economy
To capacitate SMME's and
local entrepreneurs
Place
Marketing
Undertake a rigorous
and consistent
investment facilitation
and place marketing
programme to attract
investment and promote
tourism underpinned by
strongly positioned and
managed Brand
Marketing the municipality
as premier destination for
tourism and investment
City Centre Create an activity spine
with a number of mixed
use land uses that will
extend upon the corridor
emerging from the
Kimberly CBD
To ensure effective spatial
planning and development
in order to establish a
competitive economic
position
New urban
nodes
Identify and develop
new urban nodes as
mixed use sustainable
human settlements that
will integrate the City.
Galeshewe to
become a
post-apartheid
town
Undertake upgrading,
formalisation and
institute better spatial
governance so that
majority of people are
able to carry out income
generating activity and
live work and play in an
integrated human
settlement

7 | P a g e
National KPA
National Outcome 9: A responsive, accountable, effective and efficient local
government system
Strategic Objectives to reach the Vision
"Towards a Leading and Modern City"
Key Strategic Focus
IDP Strategies Detail Project related objectives as per the
SDBIP
Economic
nodes
Massively expand
agricultural production
and agro-processing by
developing an agro-
export corridor, unlock
the value of degraded
mining land and heritage
and tourist attractions.
To promote agricultural
development within the Sol
Plaatje municipal area
through agricultural
support initiatives; To
place marketing as a
productive and profitable
section of the municipality
Basic and
Sustainable
Service
delivery and
Infrastructure
Development
Outcome: Access to
quality and affordable
basic services for all
Service Provision: To
plan for, install, maintain
and operate
infrastructure, and
provide services
more efficiently and on a
sustainable basis that
adequately supports:
• transformed spatial
structure
• economic growth
objectives
• universal access to
basic services,
• differentiated service
requirements of
households and human
settlements and
economic activity
Basic Services Install adequate and
well managed
infrastructure and
deliver basic services in
a consistent and
sustainable manner
To ensure the adequate
provision, upgrading and
maintenance of water and
sanitation services
infrastructure
Community
Services
Provide and operate
community services
according to sustainable
human settlement
norms and standards
To ensure the adequate
provision, upgrading and
maintenance of solid
waste services
infrastructure
Social
Services
Work with provincial and
national government for
adequate provisioning of
social services
To ensure a basic
standard of living for all
through the provision of
basic sanitation, water,
electricity and refuse
delivery services
Production Provide necessary
infrastructure for
economic production
purposes and for
income generating
activity in households
including city-wide as
well as regional
connectivity
To ensure the adequate
provision, upgrading and
maintenance of electricity
services infrastructure.
Economic
Sectors
Raise the contribution of
each sector to the local
economy according to
agreed plans and
targets in respect of
growth and job creation
with the private sector
To improve public
transport system and
services
Basic
Services
To address the poor
condition of the roads in
the Sol Plaatje area
through maintenance and
upgrading projects

8 | P a g e
National KPA
National Outcome 9: A responsive, accountable, effective and efficient local
government system
Strategic Objectives to reach the Vision
"Towards a Leading and Modern City"
Key Strategic Focus
IDP Strategies Detail Project related objectives as per the
SDBIP
Development of suitably
located and affordable
housing (shelter) and
decent human
settlements;
To build equitable,
cohesive, sustainable and
caring communities with
improved access to work
and social amenities,
including sports and
recreational facilities
(community development
and optimal
access/inclusion).
To ensure sustainable
delivery of community
services (including
environmental health,
emergency and traffic
services) to all residents of
SPLM.
To ensure the availability
of critical service delivery
tools at all times (fleet
management)
Municipal
Financial
Viability and
Management
Outcome: Improved
financial
sustainability and
administrative
capacity
Governance: To lead,
direct and manage
spatial growth of the City
robustly, enhance
revenue generation and
improve operational
efficiency
Financial
Governance
Revenue enhancement
and operational
efficiency
Promote sound financial
management and financial
sustainability of Sol Plaatje
Municipality through
prudent fiscal
management
Grow the rates base and
grow revenue collection;
and undertake municipal
functions in a cost
effective manner
Enhance revenue through
leveraging alternate
sources of funding and
identifying new revenue
streams
Municipal
Institutional
Development
and
Transformation
Outcome:
Implemented
differentiated
approach to financial
planning and support
Governance: To
enhance the capacity of
the state and its citizens
to work together to
achieve spatial and
social integration. To
lead, direct and manage
spatial growth of the City
robustly, enhance
revenue generation and
improve operational
efficiency.
Spatial
Governance
Regulate the entire City
space according to a
common spatial
development vision and
single land use
management system
To provide a basis for
sustainable municipal
performance improvement
IGR and
Stakeholder
Relations
Improve IGR and
stakeholder relations
targeted towards
developing integrated
human settlements and
local economic growth
To improve effective
human resource
development to staff and
Councillors

9 | P a g e
National KPA
National Outcome 9: A responsive, accountable, effective and efficient local
government system
Strategic Objectives to reach the Vision
"Towards a Leading and Modern City"
Key Strategic Focus
IDP Strategies Detail Project related objectives as per the
SDBIP
To ensure continuous
maintenance and
replacement of furniture,
office and computer
equipment and create a
secure environment within
the municipality
To enable effective
training and skills
development through
various initiatives and
partnering with the private
sector.
Good
Governance
and Public
Participation
Outcome: Good
Governance and
public participation
Governance: To
enhance the capacity of
the state and its citizens
to work together to
achieve spatial and
social integration.
To lead, direct and
manage spatial growth
of the City robustly,
enhance revenue
generation and improve
operational efficiency.
Ward
Committees
Focus on outreach and
meaningful involvement
of the wards in
improving the quality of
life
To promote community
participation and
communication
To facilitate and promote
Inter-governmental
relations programmes and
projects on a continuous
basis.
To ensure an improved
audit opinion through
continuous assessment of
risk.

10 | P a g e
CHAPTER 1: EXECUTIVE SUMMARY
1.1 INTRODUCTION
The Sol Plaatje Municipal (SPLM) Council adopted its 5-year Integrated Development Plan for its term
of office on 31 May 2017. This is the third review of the 2017/18 – 2021/22 IDP and is therefore not a
“new” IDP. This reviewed IDP indicates the changes to the adopted IDP and the implementation of
the Plan thus far – at mid-year 2019/20 as well as new information, both internal and external that will
have an effect on the further implementation of the IDP. The IDP will also be reviewed in terms of the
relevance of its strategic objectives in line with shifts in national and provincial policies and plans.
This is a draft document which is tabled to Council for public consultation and to finalise the IDP
Review for submission and adoption by not later than 31 May 2020.
1.2 LEGAL BACKGROUND
The IDP process is guided by various legislation, policies and guidelines which require careful
consideration when the document is compiled. These include amongst others the following:
o SA Constitution, Act 108 of 1996 White paper on Local Government
o Municipal Structures Act, 117 of 1998, Municipal Systems Act, 32 of 2000
o Municipal Planning & PMS Regulations (2001) Municipal Finance Management Act,
Act 56 of 2003
o Intergovernmental Relations Framework Act, Act 13 of 2006
The Constitution of the Republic of South Africa outlines the type of local government needed.
Sections 152 and 153 of the Constitution prescribe local government being in charge of the
development process and municipal planning, and describe the following objectives of local
government:
o To ensure the sustainable provision of services;
o To provide democratic and accountable government for all communities;
o To promote social and economic development;
o To promote a safe and healthy environment;
o To give priority to the basic needs of communities; and
o To encourage involvement of communities and community organisations in matters of
local government.
The Municipal Structures Act (MSA) Act 32 of 2000 requires municipalities to develop Integrated
Development Plans that should be single, inclusive and strategic in nature. Once adopted, the IDP
of a municipality will guide development within the relevant council‘s area of jurisdict ion, and should
also be reviewed annually. In addition, the Act also stipulates the IDP process and the components
to be included.
11 | P a g e
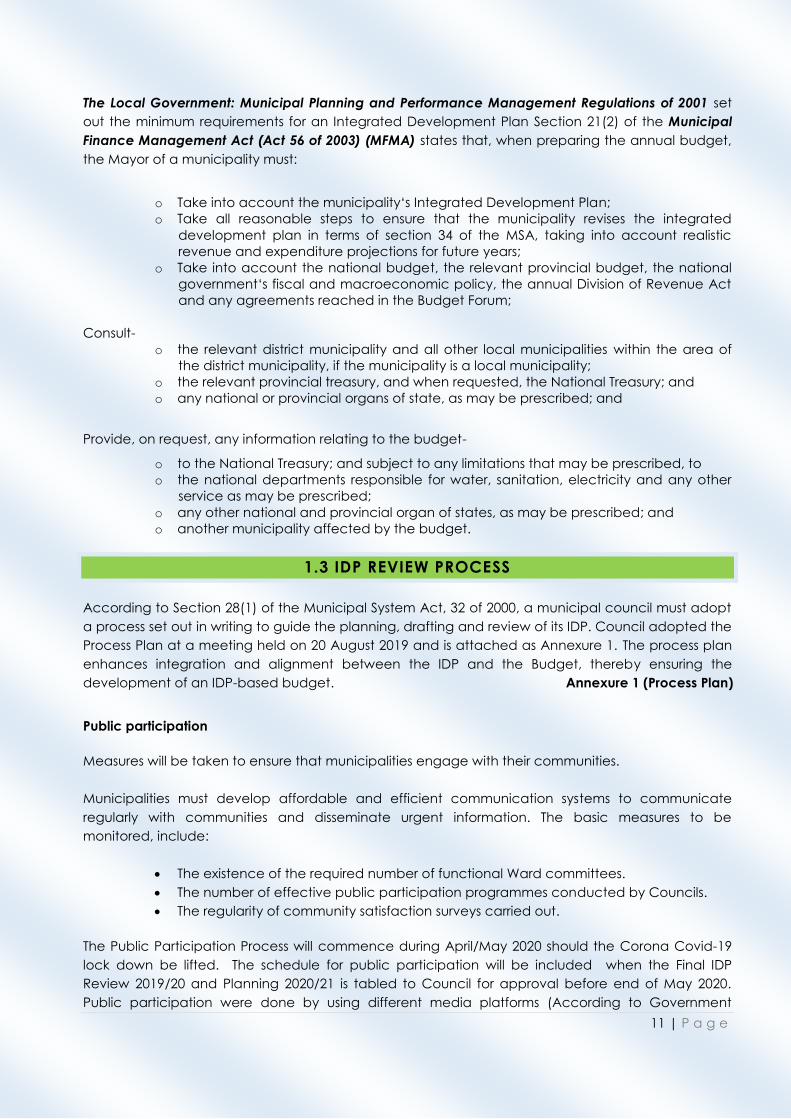
The Local Government: Municipal Planning and Performance Management Regulations of 2001 set
out the minimum requirements for an Integrated Development Plan Section 21(2) of the Municipal
Finance Management Act (Act 56 of 2003) (MFMA) states that, when preparing the annual budget,
the Mayor of a municipality must:
o Take into account the municipality‘s Integrated Development Plan;
o Take all reasonable steps to ensure that the municipality revises the integrated
development plan in terms of section 34 of the MSA, taking into account realistic
revenue and expenditure projections for future years;
o Take into account the national budget, the relevant provincial budget, the national
government‘s fiscal and macroeconomic policy, the annual Division of Revenue Act
and any agreements reached in the Budget Forum;
Consult-
o the relevant district municipality and all other local municipalities within the area of
the district municipality, if the municipality is a local municipality;
o the relevant provincial treasury, and when requested, the National Treasury; and
o any national or provincial organs of state, as may be prescribed; and
Provide, on request, any information relating to the budget-
o to the National Treasury; and subject to any limitations that may be prescribed, to
o the national departments responsible for water, sanitation, electricity and any other
service as may be prescribed;
o any other national and provincial organ of states, as may be prescribed; and
o another municipality affected by the budget.
1.3 IDP REVIEW PROCESS
According to Section 28(1) of the Municipal System Act, 32 of 2000, a municipal council must adopt
a process set out in writing to guide the planning, drafting and review of its IDP. Council adopted the
Process Plan at a meeting held on 20 August 2019 and is attached as Annexure 1. The process plan
enhances integration and alignment between the IDP and the Budget, thereby ensuring the
development of an IDP-based budget. Annexure 1 (Process Plan)
Public participation
Measures will be taken to ensure that municipalities engage with their communities.
Municipalities must develop affordable and efficient communication systems to communicate
regularly with communities and disseminate urgent information. The basic measures to be
monitored, include:
The existence of the required number of functional Ward committees.
The number of effective public participation programmes conducted by Councils.
The regularity of community satisfaction surveys carried out.
The Public Participation Process will commence during April/May 2020 should the Corona Covid-19
lock down be lifted. The schedule for public participation will be included when the Final IDP
Review 2019/20 and Planning 2020/21 is tabled to Council for approval before end of May 2020.
Public participation were done by using different media platforms (According to Government

12 | P a g e
Gazette No. 43291 dd 7 May 2020) such as SPM’s website, Facebook, WhatsApp, newspaper
adverts, radio talk shows, suggestion boxes placed at main pay points for formal submissions and an
e-mail portal. The program for public participation is attached as Annexure 2.
CHAPTER 2: STRATEGIC ANALYSIS
2.1 MUNICIPAL PROFILE
Below are some key statistics relating to demographic and socio-economic trends in the Sol Plaatje
Municipality. This information comes from STASSA 2011 Census, the 2016 Community Survey, Sol
Plaatje Statistical Overview performed by IHS Information and Insight in 2015 and IHS Markit Regional
eXplorer version 1570. The statistics included in the IDP document were obtained mainly form the
Census 2011 outcomes. However, for the purposes of the IDP review, and taking cognisance of the
fact that the Community Survey 2016 is used as a basis for the budget assumptions, this chapter also
includes statistical information from these two additional sources. At the end of this section some
conclusions and contextual issues are mentioned relating to this information.
2.1.1 Person Statistics
The table below present relevant assumptions that were used in the development of the IDP and IDP
review.
Table 2: Key Statistics Summary
Key Statistics summary
People 2011 Census 2016 CS
Region area (sq km) 3 145 3 160
Population 248 041 255 351
Population density (nr of people per sq km) 79 81
Population growth rate (pa 2001-2011) 2.04% 0.6%
Economically active population (as % of total pop.) 66,2%
No schooling age 20+ 10%
Higher education aged 20+ 9%
Matric aged 20+ 21% 72 593
Households
No of households 60 297 72 012
Average household size 3.9 3.5
Percentage female headed households 41% n.a
Formal Dwellings 81.6% 85.9%
Houses owned/paying off 61.2% n.a
Flush toilet connect to sewerage 82.8% 88.1%
Weekly refuse removal 84.3% n.a
Piped water inside dwelling 61.9% n.a
Electricity for lighting 84.9% 91.8%
Disposable income (Rand, current prices) 10 824 n.a

13 | P a g e
Key Statistics summary
People 2011 Census 2016 CS
Economy
Formal sector employment estimates 60 457 n.a
Informal sector employment estimates 15 297 n.a
Unemployment rate (official) 31.9% n.a
Youth unemployment rate (official) 15-34 41.7% n.a
Economic output in 2013 ( GDP, R’ million current prices) 16 531 23 170
Share of economic output (GDP% of SA in current prices) 0.6% 0.58%
Gross domestic fixed investment (Rm constant prices) 1904 n.a
Economic growth performance 1995-2013 (GVA at basic prices) 0.6% 1.51%
Source: Stats SA and Quantec
The chart below shows the population growth from 2011 to 2016 in the Sol Plaatje and surrounding
municipal areas.
Chart 1: Population Community Survey 2016
The municipality has experienced a positive growth of 2.94% in the population from 2011 to 2016
while Magareng and Phokwane experienced a negative growth.
Table 3: Total population - Sol Plaatje, Frances Baard, Northern Cape and National Total,
2011-2016 [Numbers percentage]
POPULATION
050 000
100 000150 000200 000
250 000300 000350 000400 000
Sol Plaatje 248 041 255 351 2.94%
Dikgatlong 46 841 48 164 2.82%
Magareng 24 204 24 059 -0.71%
Phokwane 63 000 60 168 -4.49%
2011 2016 % growth

14 | P a g e
Sol Plaatje Frances Baard
Northern Cape National Total Sol Plaatje as %
of district municipality
Sol Plaatje as % of
province
Sol Plaatje as % of national
2015 260,000 393,000 1,200,000 54,900,000 66.2% 21.8% 0.47%
2016 255,351 387,741 1,193,780 55,653,654 65.8% 21.3% 0.45%
2017 265,000 399,000 1,230,000 56,500,000 66,6% 21.5% 0.47%
Average Annual growth
2007-2017 2.19% 1.83% 1.69% 1.56%
Source: HIS Markit Regional eXplorer version 1570
With 265 000 people, the Sol Plaatje Local Municipality housed 0.5% of South Africa's total population
in 2017. Between 2007 and 2017 the population growth averaged 2.19% per annum which is slightly
higher than the growth rate of South Africa as a whole (1.56%). Compared to Frances Baard's
average annual growth rate (1.83%), the growth rate in Sol Plaatje's population at 2.19% was slightly
higher than that of the district municipality.
Table 4: Population projections - Sol Plaatje, Frances Baard, Northern Cape and National
Total, 2015-2020 [Numbers percentage]
Sol Plaatje
Frances Baard
Northern Cape
National Total
Sol Plaatje as % of district
municipality
Sol Plaatje as % of
province
Sol Plaatje as % of national
2016 265,000 400,000 1,210,000 55,700,000 66.3% 21.9% 0.48%
2017 271,000 407,000 1,230,000 56,500,000 66.5% 21.9% 0.48%
2018 276,000 414,000 1,250,000 57,400,000 66.6% 22.0% 0.48%
2019 281,000 421,000 1,270,000 58,100,000 66.6% 22.1% 0.48%
2020 285,000 428,000 1,290,000 58,900,000 66.7% 22.2% 0.48%
Average Annual growth
2015-2020 1.85% 1.70% 1.46% 1.42%
Source: IHS Global Insight Explorer Version 1029
The population projection of Sol Plaatje Local Municipality shows an estimated average annual
growth rate of 1.9% between 2015 and 2020. The average annual growth rate in the population over
the projection period for Frances Baard District Municipality, Northern Cape Province and South
Africa is 1.7%, 1.5% and 1.4% respectively and is lower than that the average annual growth in Sol
Plaatje Local Municipality.

15 | P a g e
Chart 2: Population structure 2015 vs 2020
The population pyramid reflects a projected change in the structure of the population from 2015
and 2020. The differences can be explained as follows:
In 2015, there is a significantly larger share of young working age people between 20 and 34 (27.4%),
compared to what is estimated in 2020 (25.4%). This age category of young working age population
will decrease over time.
The fertility rate in 2020 is estimated to be slightly higher compared to that experienced in 2015.
The share of children between the ages of 0 to 14 years is projected to be slightly smaller (27.4%) in
2020 when compared to 2015 (27.6%).
In 2015, the female population for the 20 to 34 years age group amounts to 14.3% of the total female
population while the male population group for the same age amounts to 13.2% of the total male
population. In 2020, the male working age population at 12.1% does not exceed that of the female
population working age population at 13.3%, although both are at a lower level compared to 2015.
2.1.2 Labour Market and Educational Statistics
Of the population over 20 years, 30% have matric and higher education, while 10% indicate no
schooling. The remaining 60% have some primary schooling and some secondary schooling. This will
pose a serious problem for the future economic trajectory as skills will have to be built to suit the
economic path and in the short-term skills will have to be brought in from skilled areas.

16 | P a g e
Chart 3: Labour Market and Education Statistics 2011 compared to 2001
Source Stats SA & Quantec
Chart 4: Highest level of Education 15+ (2005 vs. 2015)

17 | P a g e
Within Sol Plaatje Local Municipality, the number of people without any schooling decreased from
2005 to 2015 with an average annual rate of -3.43%, while the number of people within the 'matric
only' category, increased from 32,100 to 49,200. The number of people with 'matric and a
certificate/diploma' increased with an average annual rate of 3.65%, with the number of people
with a 'matric and a Bachelor's' degree increasing with an average annual rate of 7.82%. Overall
improvement in the level of education is visible with an increase in the number of people with
'matric' or higher education.
Chart 5: Involvement in the economy
Chart 6: EAP as a percentage of total population
In 2005, 39.7% of the total population in Sol Plaatje Local Municipality were classified as economically
active which decreased to 39.6% in 2015. Compared to the other regions in Frances Baard District
Municipality, Sol Plaatje local municipality had the highest EAP as a percentage of the total
population within its own region relative to the other regions.

18 | P a g e
On the other hand, Magareng local municipality had the lowest EAP with 28.0% people classified as
economically active population in 2015.
Chart 7: Unemployment Rates
Of the economically active people in the municipality, 31.9% are unemployed (narrow definition of
unemployment). 41.7% of the economically active youth (15 – 34 years) in the area are
unemployed. This figure is compelling enough to direct a special focus on youth employment.
Chart 8: Labour force and Unemployment Rates
In 2015 the labour force participation rate for Sol Plaatje was at 60.0% which is very similar when
compared to the 59.2% in 2005. The unemployment rate is an efficient indicator that measures the
success rate of the labour force relative to employment. In 2005, the unemployment rate for Sol
Plaatje was 36.6% and decreased overtime to 36.0% in 2015.

19 | P a g e
The gap between the labour force participation rate and the unemployment rate decreased which
indicates a negative outlook for the employment within Sol Plaatje Local Municipality.
2.1.3 Household Statistics
Chart 9 shows a comparison between the number and types of dwellings in Sol Plaatje and
surrounding municipal areas, from 2001 to 2016.
During the 2011 Census 10378 households lived in informal settlements. This number increased to 9829
by end of 2016, according to the Community Survey performed by STATS SA. Refer to chart 9 below
for further detail.
Chart 9: Types of dwellings
Chart 10: Households by type of toilet

20 | P a g e
Sol Plaatje Local Municipality had a total number of 58 900 flush toilets (91.89% of total households),
144 Ventilation Improved Pit (VIP) (0.22% of total households) and 751 (1.17%) of total household’s p it
toilets.
Chart 11: Sanitation backlog
When looking at the sanitation backlog (number of households without hygienic toilets) over time, it
can be seen that in 2005 the number of Households without any hygienic toilets in Sol Plaatje Local
Municipality was 5 130, this decreased annually at a rate of -0.15% to 5 050 in 2015.
Chart 12: Households by level of access to water

21 | P a g e
Sol Plaatje Local Municipality had a total number of 39 400 (or 61.44%) households with piped water
inside the dwelling, a total of 15 400 (24.05%) households had piped water inside the yard and a
total number of 874 (1.36%) households had no formal piped water.
When looking at the water backlog (number of households below RDP-level) over time, it can be
seen that in 2005 the number of households below the RDP-level were 924 within Sol Plaatje Local
Municipality, this increased annually at 6.50% per annum to 1 730 in 2015.
The total number of households within Sol Plaatje Local Municipality increased at an average annual
rate of 1.67% from 2005 to 2015, which is lower than the annual increase of 1.86% in the number of
households in South Africa.
Chart 13: Water Backlog
0
1
0000
Wa…
#…Sou
Chart 14: Households by electricity usage

22 | P a g e
0%
100%
0
Ho…
Sou
Households are distributed into 3 electricity usage categories: Households using electricity for
cooking, Households using electricity for heating, households using electricity for lighting. Household
using solar power are included as part of households with an electrical connection.
This time series categorises households in a region according to their access to electricity (electrical
connection). Sol Plaatje Local Municipality had a total number of 1 920 (3.00%) households with
electricity for lighting only, a total of 55 200 (86.11%) households had electricity for lighting and other
purposes and a total number of 6 980 (10.89%) households did not use electricity.
Chart 15: Electricity Connections

23 | P a g e
The region within Frances Baard with the highest number of households with electricity for lighting
and other purposes is Sol Plaatje local municipality with 55 200 or a share of 66.36% of the households
with electricity for lighting and other purposes within Frances Baard District Municipality.
Chart 16: Households by access to refuse removal
The region with the lowest number of households with electricity for lighting and other purposes is
Magareng local municipality with a total of 5 100 or a share of 6.13% of the total households with
electricity for lighting and other purposes within Frances Baard District Municipality. When looking at
the number of households with no electrical connection over time, it can be seen that in 2005 the
households without an electrical connection in Sol Plaatje Local Municipality was 7 440, this
decreased annually at -0.64% per annum to 6 980 in 2015.
A distinction is made between formal and informal refuse removal. When refuse is removed by the
local authorities, it is referred to as formal refuse removal. Informal refuse removal is where either the
household or the community disposes of the waste, or where there is no refuse removal at all. A
further breakdown is used in terms of the frequency by which the refuge is taken away, thus leading
to the following categories:
Removed weekly by authority
Removed less often than weekly by authority
Removed by community members
Personal removal / (own dump)
No refuse removal
Sol Plaatje Local Municipality had a total number of 54 800 (85.53%) households which had their
refuse removed weekly by the authority, a total of 714 (1.11%) households had their refuse removed
less often than weekly by the authority and a total number of 5 690 (8.88%) households which had to
remove their refuse personally (own dump). The region within Frances Baard with the highest number
of households where the refuse is removed weekly by the authority is Sol Plaatje local municipality
with 54 800 or a share of 71.19% of the households where the refuse is removed weekly by the
authority within Frances Baard. The region with the lowest number of households where the refuse is
removed weekly by the authority is Magareng local municipality with a total of 4 330 or a share of
5.63% of the total households where the refuse is removed weekly by the authority within the district
municipality.
24 | P a g e
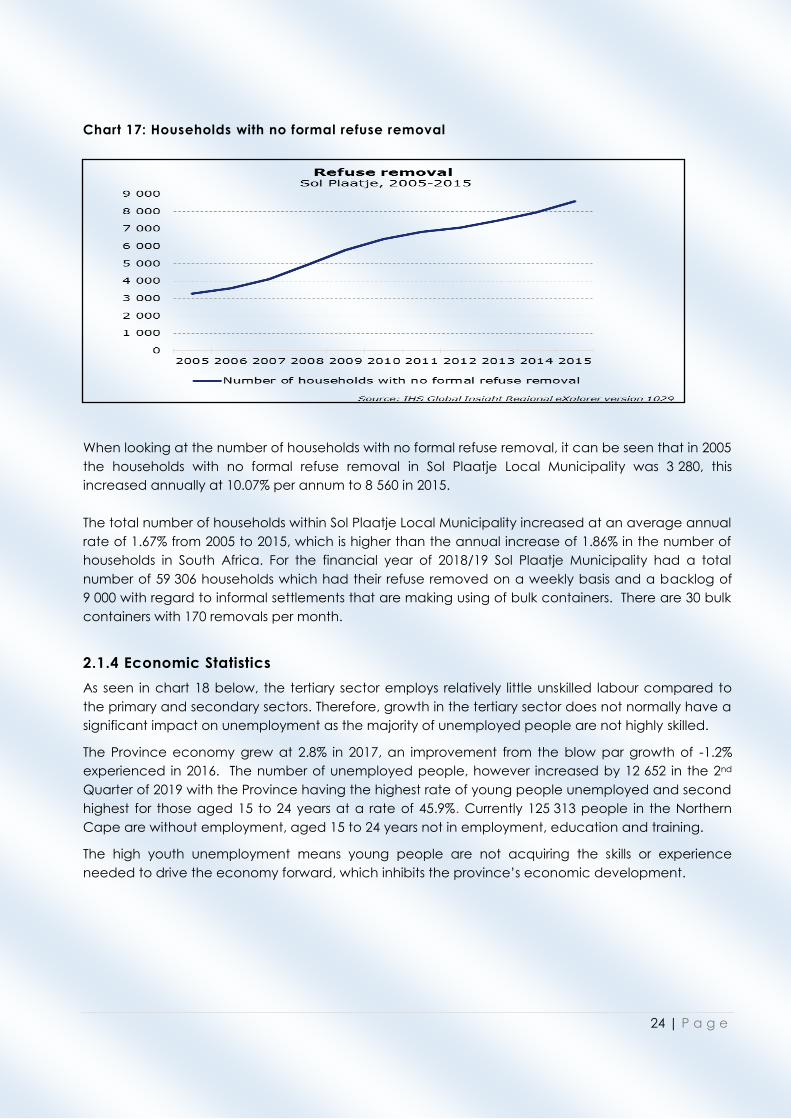
Chart 17: Households with no formal refuse removal
When looking at the number of households with no formal refuse removal, it can be seen that in 2005
the households with no formal refuse removal in Sol Plaatje Local Municipality was 3 280, this
increased annually at 10.07% per annum to 8 560 in 2015.
The total number of households within Sol Plaatje Local Municipality increased at an average annual
rate of 1.67% from 2005 to 2015, which is higher than the annual increase of 1.86% in the number of
households in South Africa. For the financial year of 2018/19 Sol Plaatje Municipality had a total
number of 59 306 households which had their refuse removed on a weekly basis and a backlog of
9 000 with regard to informal settlements that are making using of bulk containers. There are 30 bulk
containers with 170 removals per month.
2.1.4 Economic Statistics
As seen in chart 18 below, the tertiary sector employs relatively little unskilled labour compared to
the primary and secondary sectors. Therefore, growth in the tertiary sector does not normally have a
significant impact on unemployment as the majority of unemployed people are not highly skilled.
The Province economy grew at 2.8% in 2017, an improvement from the blow par growth of -1.2%
experienced in 2016. The number of unemployed people, however increased by 12 652 in the 2nd
Quarter of 2019 with the Province having the highest rate of young people unemployed and second
highest for those aged 15 to 24 years at a rate of 45.9%. Currently 125 313 people in the Northern
Cape are without employment, aged 15 to 24 years not in employment, education and training.
The high youth unemployment means young people are not acquiring the skills or experience
needed to drive the economy forward, which inhibits the province’s economic development.

25 | P a g e
Chart 18: GVA – Broad sector composition, 2015
000
Gr…
Sou
Chart 19: Gross Domestic Product (GDP) Forecast, 2005 - 2015

26 | P a g e
From the above chart it can be seen that when compared to the national economy of South Africa,
Sol Plaatje Local municipality has a comparative advantage on community services and almost the
same advantage on the transport industry. A slight advantage is also noted on financial services.
However, when it comes to specifically manufacturing, Sol Plaatje has a significant comparative
disadvantage relative to the country as a whole. In terms of trade the quotient of Sol Plaatje is
relatively similar to that of South Africa. Generally speaking, Sol Plaatje has a very narrow economy.
2.1.5 South African Perspective
During the State of the Nation Address by President Cyryl Ramaphosa on 13 February 2020, some key
announcements were made. 1
To fight youth unemployment a new six-pronged plan was introduced that will target skill building,
expansion of the Youth Employment Service and re-allocation of 1% of the national budget to a
youth employment initiative. South Africa’s youth faces one of the highest unemployment rates in
the world, with almost 6 out of every 10 South African between the ages of 15 and 24 without jobs.
After the success of the high-profile investment conferences held in 2018 and 2019 in a bid to attract
R1.2 trillion in new investment over five years, a third conference will be held in November to review
the implementation of the previous commitments and to generate new investment into SA’s
economy. A total of R664 billion in investment commitments had been raised during the first two
years of the investment drive.
The Infrastructure Fund Implementation Team has finalised the list of shovel-ready projects and has
begun work to expand private investment into public infrastructure sections with revenue streams.
These include areas like student accommodation, social housing, independent water production,
rail freight branch lines, embedded electricity generation, municipal bulk infrastructure and
broadband roll-out.
The social housing program to build rental housing for low-income families is at implementation
stage, which could leverage as much as R9 billion of private investment in the construction of 37 000
rental apartments.
A Tourism Equity Fund is going to be launched by Government to stimulate transformation in tourism.
The low levels of growth mean that South Africa are not generating enough revenue to meet our
expenses. Our debt is heading towards unsustainable levels, and spending is misdirected towards
consumption and debt servicing rather than infrastructure and productive activity. The Minister of
Finance would thus outline a serious of measures to reduce spending and improve its composition.2
Gross domestic product shrank an annualised 1.4% in the last quarter of 2019, compared with a
revised 0.8% decline in the three months through September. The economy contracted 0.5% from a
1 Web SA Government 2 Fin 24

27 | P a g e
year earlier, the first time in almost four years that GDP has shrunk from the same period a year
earlier. 3
The contraction means Africa’s most-industrialised economy has had two recessions since President
Cyril Ramaphosa came to power at the start of 2018. For the full year, economic growth was 0.2%,
the lowest since the global financial crisis, and half of what the Reserve Bank estimated in January,
when it cut its key interest rate.
Chart 20: Economic Growth in 4th Quarter 2019 (SA Statistics)
Seven of the ten industries contracted in the fourth quarter. Finance, mining and personal services
managed to keep their heads above water, but this was not enough to prevent the economy from
sliding into its third recession since 1994 as shown below.
Chart 21: Industry growth in 4 th Quarter 2019(SA Statistics)
3 SA Statistics

28 | P a g e
Chart 22: SA’s Consumer Price Inflation , January 2020 (SA Statistics)

29 | P a g e
South Africa’s annual inflation rate nudged up to 4,6% in February from January’s 4,5%, inching past
the 4,5% midpoint of the South African Reserve Bank’s monetary policy target range. The last time
the inflation rate was above the midpoint was in November 2018 when the rate was 5,2% as shown
above.
The youth aged 15–24 years are the most vulnerable in the South African labour market as the
unemployment rate among this age group was 55,2% in the 1st quarter of 2019. Among graduates in
this age group, the unemployment rate was 31,0% during this period compared to 19,5% in the
4th quarter of 2018 – an increase of 11,4 percentage points quarter-on-quarter.
However, the graduate unemployment rate is still lower than the rate among those with other
educational levels, as shown in the chart below, meaning that education is still the key to these
young people’s prospects improving in the South African labour market.
Chart 23: SA’s Youth Unemployment Rate, Quarter 4:2018 to Q1: 2019(SA Statistics)
The continued lack of growth will weigh on the government’s revenue collection and efforts to tame
debt and narrow the budget deficit. It will also make it even more difficult to lower an
unemployment rate that’s close to 30% and seen as one of the biggest obstacles to reducing
poverty in one of the world’s most unequal nations
SA is facing a heightened risk of a sovereign credit rating downgrade to junk by Moody's Investors
Service, which changed its outlook from stable to negative late in 2019. Moody's is the sole major
rating agency to not already have down-graded SA's sovereign debt to sub-investment grade,

30 | P a g e
For the first time over a century, the world is facing a medical emergency far graver than what
human race have experienced before. The World Health Organisation has declared the coronavirus
outbreak as a global pandemic. It is for this reason that
SA’s President, Cyril Ramaphosa, declared a national
disaster on 15 March 2020 with the outbreak of the
Corona-virus and announced government measures to
assist in containing the spread and supporting
businesses with the pandemic. Never before in the
history of our democracy has the country been
confronted with such a severe situation.
The pandemic will have will have an impact on health
and wellbeing of people on the day-to-day life of
society and a significant and potentially lasting impact
on the economy.
There was already a dramatic decline in economic activity in SA’s major trading partners, i.e a
sudden drop in international tourism and severe instability across all global markets. The anticipated
effects of the decline in exports and tourist arrivals will be exacerbated by both an increase in
infections and the measures required to take to contain the spread of the disease.
A potentially severe impact on production, the viability of businesses, job retention and job creation.
The Cabinet is therefore in the process of finalising a comprehensive package of interventions to
mitigate the expected impact of COVID-19 on the economy especially on production, viability of
businesses, job retention and job creation.

31 | P a g e
Impact
It is the first time in a decade that the Reserve Bank cut the interest rate by a full percentage point in
one meeting as shown above.
The inflation rose above the 4.5% midpoint of the central bank’s target range for the first time in 15
months in February, but it’s expected to moderate over the coming months on the back of a sharp
decline in oil prices. The cut in interest rates won’t derail the efforts to anchor price growth at the
midpoint according to the Monetary Policy Committee, who has also revised its inflation forecast for
the year to 3.8% from 4.7%
The central bank’s quarterly projection model indicated three repo rate cuts of 25 basis points each
in the second and fourth quarter of 2020, as well as in the third quarter of 2021.

32 | P a g e
2.2 CONTEXTUALISING THE ISSUES RELATING TO DEMOGRAPHIC AND SOCIO-
ECONOMIC INFORMATION
The issues identified above need to be considered when reviewing the IDP and preparing the
budget for the 2020/21 MTREF. The Province economy grew at 2.8% in 2017, an improvement from
the blow par growth of -1.2% experienced in 2016. The number of unemployed people, however
increased by 12 652 in the 2nd Quarter of 2019 with the Province having the highest rate of young
people unemployed and second highest for those aged 15 to 24 years at a rate of 45.9%.SPLM’s
population growth is 2, 95% (between 2011 and 2016). A large proportion of this growth is in the lower
income and indigent component of the population The unemployment rate is 31,9% (youth
unemployment 41,7%). Only 10% of SPLM’s population has a higher education than matric. More
than half (55%) of SPLM’s population also has an income of R3, 000 or less per month. All this indicate
that economic growth and job creation must (in line with the NDP) be a high priority in SPLM as well.
Realizing economic growth in its area and creating sustainable jobs is, however, a huge challenge
for SPLM as it is in itself not a “big” role-player in this process.
This challenge becomes even greater considering the fact that the primary and secondary sectors is
the actual job creating sectors within the economy - especially in an area, such as SPLM, where the
skills levels are low (refer to level of education above). Unfortunately the primary sectors form a very
small portion of the SPLM’s economy – only 12%. The tertiary sector on the other hand forms 69% of
the local economy and these are also the sectors where SPLM has a comparative.
The state of the economy (in SA at present) should also be considered. The economy grew by 2% in
the 3rd quarter of 2017 (refer above). That being said, the many challenges facing Sol Plaatje
Municipality and the country as a whole, need to be analyzed and understood, in order to create
workable mitigation strategies and action plans.

33 | P a g e
Chart 24: The “Poverty-Gap”
The poverty gap is used as an indicator to measure the depth of poverty. The gap measures the
average distance of the population from the poverty line and is expressed as a percentage of the
upper bound poverty line, as defined by StatsSA. The Poverty Gap deals with a major shortcoming of
the poverty rate, which does not give any indication of the depth, of poverty. The upper poverty line
is defined by StatsSA as the level of consumption at which individuals are able to purchase both
sufficient food and non-food items without sacrificing one for the other.
It is estimated that the poverty gap rate in Sol Plaatje Local Municipality amounted to 27.6% in 2015 -
the rate needed to bring all poor households up to the poverty line and out of poverty.
In 2015, the poverty gap rate was 27.6% and in 2005 the poverty gap rate was 30.6%,it can be seen
that the poverty gap rate decreased from 2005 to 2015, which means that there were improvements
in terms of the depth of the poverty within Sol Plaatje Local Municipality.
In order to deal with this gap a two-pronged approach is necessary, namely:
1. A job creation strategy for the indigent population in order for them to also contribute
towards the creation and maintenance of the urban services and facilities, and
2. Create an enabling environment for private sector investment in order for this segment of
the population to grow which will contribute towards sustainable economic growth.

34 | P a g e
It is of utmost importance to address the above issues as it also negatively influences the financial
sustainability of the municipality who is tasked to ensure a livable City by providing and maintaining
the necessary municipal services and facilities. This is illustrated by the figure below.
Figure 1: Municipal Financial Sustainability
Issues to be addressed to ensure the financial sustainability of the SPLM include, but are not
restricted to:
o Economic growth and job creation
o Affordable Municipal Rates
o Increase revenue collection
o Reduce billing lag after development has been completed.
o Differentiated service levels according to affordability
o Core vs Non-core functions – concentrate on core functions (B2B)
o Optimum cost-efficient service delivery
o Reliable and increased infrastructure capacity for growth and development, especially
related to connector and reticulation networks – specifically Electricity
o Reduce “Red Tape” for investors who wishes to invest in development in Kimberley

35 | P a g e
CHAPTER 3: SITUATIONAL ANALYSIS
3.1 STATUS QUO PER KEY PERFORMANCE AREA
3.1.1 STRATEGIC ECONOMIC DEVELOPMENT AND PLANNING
3.1.1.1 Local Economic Development
Status Quo
The history of LED in South Africa can be divided into six phases, as described in Table 5.
Table 5: South Africa and LED history
PRE-1994
(apartheid era)
■The approach was government-planned industrial decentralisation and LED
initiatives, as part of the social engineering and economic boosterism of the
apartheid state (Rogerson, 1997; Nel & John, 2006).
■ From the 1980s, programmes were introduced to attract industries, promote
place marketing, and develop infrastructure, tourism and land. However, by
the early 1990s, many of the decentralised, planned places (e.g.
Botshabelo, Mdantsane) were failing, with plants closing and jobs being lost
(Marais et al., 2016c; SACN, 2016).
1994–2002
■ The new Constitution (1996) came into force and included the principle of
developmental local government, reinforcing the importance of economic
planning at the local level. ■ Two opposing approaches to LED developed: a city-based (or pro-market)
approach and a community-based approach (Nel, 1997). As donors started
channelling their funding through government, the community-based
approach lost momentum (Nel, 2005). Community groups argued in favour
of pro-poor approach to LED (Khanyaacidd, 2006).
■ Government introduced the LED Fund (1998) that was aimed at projects
with a pro-poor, poverty-relief focus. Projects had limited success because
they were poorly planned and designed, seldom considered the value
chains, were mostly implemented by the public sector and often did not
include appropriate technical support (Marais & Botes, 2007).
■ Some of the large cities implemented inner-city renewal programmes and
large tourism investments, such as waterfront developments and
convention centres, which were in many cases driven by public-private
partnerships (Nel & Rogerson, 2007)
2003–2011
■Having discontinued the LED Fund (2002), government developed a new LED
policy for South Africa, the National LED Framework 2006–2011 (DPLG, 2006),
which was: ■ A five-year strategic framework aimed at supporting the development of
sustainable local economies through integrated government action.
■ A guide to LED that proposed a strategic implementation approach that
government and communities could use to improve LED, and suggested
actions for implementing LED Key Performance Indicators.

36 | P a g e
POST 2011
■A review of the 2006–2011 LED Framework took into consideration the state of
the economy and of local government, the existing national economic
frameworks and national contemporary LED issues, and identified LED
challenges and opportunities.
■ Challenges included: the lack of a shared conceptual understanding of LED,
poor intergovernmental relations on LED, sectoral plans not integrated as
part of LED planning and implementation, limited funding and financing for
municipal-led LED programmes, the lack of a differential approach to LED
implementation, and skills deficit and general human resources issues.
2016
■Cabinet adopted South Africa’s national urban policy, the IUDF, which
promotes a differentiated approach to cities and towns.
■The IUDF recognises the specific problems associated with intermediate cities
in South Africa, including dependence on a single economic sector, poor
urban management, inadequate maintenance of municipal infrastructure,
and weak relations between the municipality and external role-players.
■ The IUDF specifically calls for a national LED strategy and for economic
development to be central to the municipal agenda.
2018
■The Ministry of Cooperative Governance and Traditional Affairs (COGTA)
published a draft National Framework for Local Economic Development:
Creating Innovation driven Local Economies 2018–2028 (COGTA, 2018)
that takes forward the policy proclamations.
■ Its aim is to “provide strategic guidance to LED agents and actors and their
activities in order to achieve innovative, competitive, sustainable, inclusive
local economies that maximise local opportunities, address local needs,
and contribute to national and provincial development objectives”.
Understanding of the LED within Sol Plaatje Municipality
The main goal of Local Economic Development is improving the economic well-being of a
community through efforts that entail job creation, job retention, tax base enhancements and
quality of life. As there is no single definition for economic development, there is no single strategy,
policy, or program for achieving successful economic development. Communities differ in their
geographic and political strengths and weaknesses. Each community, therefore, will have a unique
set of challenges for economic development.
Within municipalities, there still confusion about the LED department’s role, and LED is not considered
a high priority. As a result, projects identified in terms of SDBIP are not aligned with New Agenda LED
2017 in terms National LED Framework and are rarely updated in the IDP. These projects tend to be
disconnected from reality, lack strong economic rationale or make simplistic assumptions about the
economic value chains, and assume that funding will come from other spheres of government. The
private sector is also not aligned with the municipality, and economic analysis and intelligence are
lacking.
The Integrated Urban Development Framework (DCOG, 2016) and research by the South African
Cities Network (SACN) and the South African Local Government Association (SALGA) recognise that
the economic development function at local level needs to be re-imagined.
This study recommends that the LED function be re-imagined, based on four principles and six
strategic issues.

37 | P a g e
Four institutional principles for LED
1. A functional economic development directorate can exist on a small budget.
2. A functional economic development directorate needs to be involved in both pro-growth
and pro-poor projects.
3. LED needs to occupy centre stage within a municipality and economic thinking must be
integrated into the other functions performed by a municipality.
4. A functional economic development directorate should furnish the rest of the municipality
with robust economic intelligence.
Six strategic issues in reimagining LED
1. Local governments should mainstream economic considerations into their sectoral
departments and also into the accompanying strategies of those departments.
2. Local governments need to use municipal levers, such as land-use planning, to support their
economies.
3. Municipalities should do more to build economic intelligence, with the assistance of other
spheres of government.
4. Local governments should strengthen economic strategies that are appropriate for their
specific economic context and based on solid economic intelligence.
5. Local governments should develop economic partnerships, as municipalities need to
facilitate, not drive, economic development.
6. Local governments should create appropriate institutional arrangements that support
economic development.
The LED challenges of Sol Plaatje Municipality as an intermediate city
The slower economic growth is due to various realities facing intermediate city, including SPM
reliance on a single sector (especially mining). This makes SPM vulnerable to changes in mining and
international markets, and to decisions and policies made at national level; for example, the
imposition or relaxation of import tariffs. Compounding this reality is the disappointing state of
economic planning at local government level, or local economic development (LED).
The draft National Framework for Local Economic Development
The draft Framework contains a vision for LED: “Innovative, competitive, sustainable, inclusive local
economies that maximise local opportunities, address local needs, and contribute to national
development objectives”, including the following strategic objectives:
To launch a radical fight against poverty, inequality and unemployment, and enhance the
quality of life for all through developing innovative and inclusive and competitive local
economies.
To support the potential of local economies to grow and develop the national economy.
To raise greater awareness of the significance of regions, metropolitan municipalities and
localities as focal points for generating national prosperity.
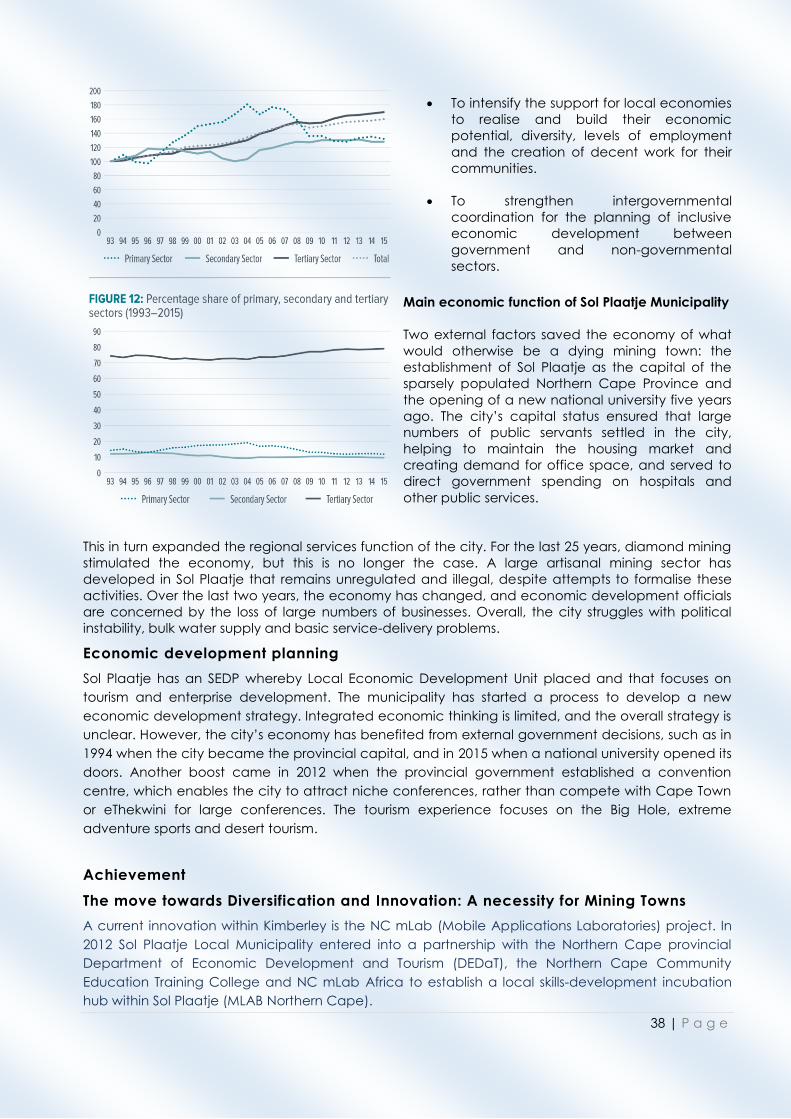
38 | P a g e
To intensify the support for local economies
to realise and build their economic
potential, diversity, levels of employment
and the creation of decent work for their
communities.
To strengthen intergovernmental
coordination for the planning of inclusive
economic development between
government and non-governmental
sectors.
Main economic function of Sol Plaatje Municipality
Two external factors saved the economy of what
would otherwise be a dying mining town: the
establishment of Sol Plaatje as the capital of the
sparsely populated Northern Cape Province and
the opening of a new national university five years
ago. The city’s capital status ensured that large
numbers of public servants settled in the city,
helping to maintain the housing market and
creating demand for office space, and served to
direct government spending on hospitals and
other public services.
This in turn expanded the regional services function of the city. For the last 25 years, diamond mining
stimulated the economy, but this is no longer the case. A large artisanal mining sector has
developed in Sol Plaatje that remains unregulated and illegal, despite attempts to formalise these
activities. Over the last two years, the economy has changed, and economic development officials
are concerned by the loss of large numbers of businesses. Overall, the city struggles with political
instability, bulk water supply and basic service-delivery problems.
Economic development planning
Sol Plaatje has an SEDP whereby Local Economic Development Unit placed and that focuses on
tourism and enterprise development. The municipality has started a process to develop a new
economic development strategy. Integrated economic thinking is limited, and the overall strategy is
unclear. However, the city’s economy has benefited from external government decisions, such as in
1994 when the city became the provincial capital, and in 2015 when a national university opened its
doors. Another boost came in 2012 when the provincial government established a convention
centre, which enables the city to attract niche conferences, rather than compete with Cape Town
or eThekwini for large conferences. The tourism experience focuses on the Big Hole, extreme
adventure sports and desert tourism.
Achievement
The move towards Diversification and Innovation: A necessity for Mining Towns
A current innovation within Kimberley is the NC mLab (Mobile Applications Laboratories) project. In
2012 Sol Plaatje Local Municipality entered into a partnership with the Northern Cape provincial
Department of Economic Development and Tourism (DEDaT), the Northern Cape Community
Education Training College and NC mLab Africa to establish a local skills-development incubation
hub within Sol Plaatje (MLAB Northern Cape).

39 | P a g e
The provincial government’s Northern Cape Information Society Strategy (NCISS) noted as early as
2005 that: “a paradigm shift will be required to transition our resource rich industrial and agricultural
economy to a knowledge-based information economy” (NCISS, 2005). Establishing an NC mLab
within the province is an example of a progressive means towards the desired goal of diversifying the
local economy. Northern Cape mLab is a Non-Profit Organisation which exists in order to provide
skills, training and an incubation platform for the youth in the province, particularly in the areas of
entrepreneurship, SMME development ICT and mobile applications.
Through the MLAB skills and innovation cycle, the organisation provides opportunities to scholars,
budding entrepreneurs and upcoming innovators to gain new and highly sort after skills including:
Coding skills
Exposure and opportunities to participate in ICT industry innovation and research
Business start-up an SMME skills
Mobile application development skills
Currently the NC mLab is located in the Galeshewe SMME Village in Kimberly. Over twenty (20)
youths comprising of small business owners, mobile app developers and “mentees” are currently
part of the NC mLab establishment and are receiving training and skill up-scaling through one
means or the other. NC mLab hopes to see an increase in the volume of youths and entrepreneurs
that have been mentored by the business incubation programme run by the organisation.
In addition to the above, it is worth noting that Sol Plaatje University offers a specialised
undergraduate degree in Data Science and is currently the only university in Africa that provides this
course offering. It is clear that the municipality is charting its way towards innovation, new
technologies and a knowledge-based economy, and this is commendable. It is hoped that many
mining towns within the country may adopt means of economic diversification, best suited for them,
and take the necessary steps towards innovation-driven local economic development. This forms an
essential part of economic sustainability for mining towns’ through-out the country.
Projects for 2020/21
NC mLab at Galeshewe SMMeVillage
The Department of Science and Technology and Department of Economic Development and
Tourism allocated an amount of R11.8 m over a period of 2018/19 to 2020/21 for the NC mLab
project as mentioned above with the SMME’s in the Galeshewe township being the beneficiaries for
this grant. This is an on-going project and in its 2nd year of implementation.
Review of the LED Strategy
The Review of the LED Strategy is funded by the Old Mutual Group in the amount of R1 m for the
period 2020. The review must be done by the Centre for Local Economic Development from the
University of Johannesburg (CENLED) being a condition of the grant. Beneficiaries are the entire
community of Sol Plaatje which is extended to the entire region of the Frances Baard District
Municipality.
Enhancing Sol Plaatje Local Municipality’s economic governance & infrastructure
for Business expansion Attraction & Retention (BEAR)
The third grant known as the General Budget Support National Treasury and European Union in the
amount of R45 m is for the period 2020/21 to 2022/23.
40 | P a g e
The purpose of this grant is to enhance the institution’s economic governance and infrastructure for
Business Expansion Attraction and Retention (BEAR) with SPLM ‘s community being the beneficiaries
which will be done through the Medium Term Revenue Expenditure Framework of SPLM.
Northern Cape Innovation Forum
A grant of R1 m was allocated for the Establishment of the Northern Cape Innovative Forum to
enhance the implementation of science, technology and innovation through LED’s strategic
planning. This will be an on-going project of which Sol Plaatje University will be the champion of the
project with the beneficiaries being the entire community of SPLM as well as the entire Northern
Cape.
Partnership with Genk Municipality in Netherlands
The LED Unit is currently in engagement with Genk City in Limburg Province of Belgium to finalize a
concept proposal to be able to qualify for the European Union Partnerships for Sustainable cities
2020 : Smart Cities’ Grant of approximately R50 m for 2020. This grant must be used for smart data
management in SPLM as driving force for city policy on waste, gender and local entrepreneurship is
Beneficiaries will be the entire community and SPM’s organisation. The condition of the grant is that
SPLM must have an European Partner to qualify before submitting an application.
Integrated Township Economic Development Programme
The department is currently developing an integrated township economic development
programme, which intends to develop township economies, and to target investments such as
factories, workshops, technical hubs and locally-owned retail operations in our townships, large or
small.
The driving force behind job creation must be the realization that interventions at local level do not
need to be only small-scale, but that high value economic activity in townships must also be
encouraged.
The approach to focus on townships is informed by the reality that South African townships are
characterised by the highest levels of unemployment, poverty and inequality. Therefore, township
economies have been identified as a critical vehicle to drive the South African economy to upward
trajectory.
The initiative will be implemented in the following five townships: Mankweng, (Polokwane
Municipality, Limpopo); Imbali, (Msunduzi Municipality, Kwa-Zulu Natal); Ezibeleni,(Enoch Mgijima
Municipality, Eastern Cape); Tlhabane, (Rustenburg, North West) and Galeshewe, (Sol Plaatje
Municipality in Northern Cape).
Mayibuye Uprising Monument-Kimberley – Frances Baard District
The defiance campaign inculcated the idea of the spirit of sacrifice of personal interest for the
public good. Out of the campaign came a disciplined volunteer corps of men and women who
gave freely of their time and energy without any remuneration in order to build the African National
Congress and Alliance.
The Defiance Campaign put an end to deputations pleading with the government to grant rights
which it had deliberately, as a matter of calculated policy, taken away from the oppressed and
exploited majority.

41 | P a g e
The key objectives that the project hopes to achieve include:
Preserving the heritage of the Northern Cape liberation struggle
Unlocking the potential of these areas as tourist destinations
Provide social investment to the communities in Galeshewe (Kimberley)
As an effort to preserve our heritage DSAC, together with Sol Plaatje Municipality has collaborated
on the current monument since the monument. Since 2002 as part of DSAC’s Flagship Programme of
Hounoring Heroes and Heroines who selflessly contributed to the liberation struggle of our country,
Mayibuye Commemoration is held annually on 8th November.
At the moment, the Mayibuye Monument Precinct needs to be upgraded, thus there is a need for
renovation or restoration of Robert Sobukwe Office; upgrading of the monument; upgrading of
tombstones of the victims at the West End Cemetery, the construction of an onsite security room and
upgrading the current ablution facilities. The project will be linked with the intended Nelson Mandela
precinct where the intension is to construct a new Museum which will depict the history of
Galeshewe Township.
Further development of the current monument is expected to redress the imbalances of the past by
changing the heritage landscape of the province.
As the custodian of heritage in the Northern Cape Province, DSAC will be the champion of the
project. With regard to the financial management, DSAC has competent financial management
team lead by the Chief Financial Officer who will unsure that Public Finance Management Act of
1999 (PFMA) prescripts and regulations; and also make sure that all Supply Chain Management
(SCM) processes are adhered to.
Mayibuye Uprising Memorial Precinct is owned and managed by the Sol Plaatje Municipality. Since
the site falls within the Sol Plaatje Municipality Tourism Route, they will lead the Management Team.
The team will be constituted by officials from DSAC, Frances Baard District Municipality, Sol Plaatje
Municipality, McGregor Museum, Northern Cape Department of Tourism, PHRA, Historical Society of
the Northern Cape, Galeshewe Memorial Project and other role players who will come on board
for the sustainability of the site.
Due to the limited budget, it has been difficult for the DSAC and the Sol Plaatje Municipalities to
upgrade the precinct. The project will afford the opportunity to the DSAC to upgrade the site and
the graves of the victims as they are at appalling state.
Conclude with the cost of the proposed project as well as the development that was done on the site
in the past
The costs of the work done - Estimated R3 000 000 on Sobukwe office for R150 000
The cost for the project is estimated at R55 000 000
NB DSAC has transferred R10 000 000 in 2016/17 to Sol Plaatje Municipality as the contribution
towards the Mandela Precinct.
Enterprise and Supplier Development through procurement opportunities
In line with Northern Cape Procurement Localisation Strategy Sol Plaatje Municipality through its LED
Unit has drafted agreement with local SMMEs forums and associations whereby 30% of SPM’s
procurement opportunities will be set aside as a pre-qualification criteria to benefit only members of
the SMMEs forums and associations. The inception of the programme is the 01st July 2020 as new
financial year.

42 | P a g e
Enterprise Development (ED) is the process of developing small or medium companies or businesses
through the provision of finance and support, assisting in their business development and
sustainability.
The initiative will be collaboration efforts with the following stakeholders:
Small Enterprise Development Agency
Small Enterprise Financial Agency
National Youth Development Agency
National Empowerment Fund
Frances Baard District Municipality
Department of Economic Development and Tourism
For suppliers, localisation helps to: improve overall technical know-how due to increased interaction
with international specs; innovate; and have a direct positive impact on the economy as parties
involved are able to maximize spare capacity and keep busy.
For international brands, localisation helps in: exercising a direct control on the supply chain locally
instead of depending on global vendors, reducing the overall cost & risks as companies do not need
to store or import large quantities, and in customizing and modifying designs based on regional
needs as well as on geographical, cultural and working condition differences.
Enterprise Infrastructure is the basic services that represent a foundational tool for the enterprise
programme of a nation, region or city. Infrastructure can include physical structures, systems,
institutions, services and facilities. The following are common types of enterprise infrastructure;
Transportation
- Services such as roads, bridges, cycle highways, rail, airport and ports,
Energy
- Production and delivery of energy including electric grids. Most nations are moving towards
sustainable energy sources such as solar panels and wind.
Water
- Water infrastructure that provides a supply a supply of clean water and management of
water resources.
Safety
- Institutions and systems that allows a region to endure stresses such as a natural disaster. For
example, earthquake detection systems, tsunami shelters and resilient sources of local
food.
Financial
- Financial markets and services that support basic enterprise processes such as raising capital,
investing, storing wealth, payments and managing risk.
Public space
- Public spaces that attracts enterprise activities such as tourists and companies to the
province.
Technology
- Basic technology services such as networks.
Environment
- Systems that improve environmental conditions such as rain gardens and green.
Multi-Skills Acquisition and Job Employment Project

43 | P a g e
Mineworkers Development Agency (MDA) and Sol Plaatje Municipality partnered to establish a
Multi- Skills Acquisition and Job Employment project.
The overall project objective is to “implement a skills acquisition and entrepreneurial support project
for 384 young men and women over the next three years in Sol Plaatje Municipality, geared at
reducing youth unemployment within Frances Baard District Municipality”.
The specific objectives are:
a) To set up an Operational Training and Entrepreneurial Unit at one of the Township of Sol
Plaatje Municipality in Kimberley city, complete with office equipment and project personnel
by May 2021
b) To recruit 384 young men and women form within Frances Baard District Municipality to be
trained and mentored while facilitating their employability into the Labour force
c) To contract accredited partners to conduct training and provide mentoring and technical
assistance to youth in Autobody Repair Entrepreneurship, Artisan Skills Training for
Employability, Solar Geyser Skills Acquisition and Youth Agricultural Cooperatives
d) To provide post-project follow-up initiatives to learners/ potential entrepreneurs for support
and quality assurance, and
The project will have a life cycle of three years starting from May 2021 to May 2024 and the project
area covers the entire Sol Plaatje Local Municipality, in France Baard District Municipality, in Northern
Cape Province.
The target beneficiaries are young men and women aged between 18 and 35 years initially working
with 384 recruits in the four identified enterprise development projects. The Autobody and the
Artisans Skills Training for Employability will target both skilled and unskilled learners, while the Solar
Geyser Skills Acquisition and the Youth Agricultural Cooperatives will recruit mostly young women
who have dropped out of school before their Matric level. Preference will be given to young women
selected from all the four nodal areas of Frances Baard District Municipality (Sol Plaatje Municipality,
Phokwane Municipality, Magareng Municipality and Dikgatlong Municipality).
3.1.1.2 Urban Planning
The Urban Planning Division is a strategic Division within the Municipality mandated to focus on the
containment of an orderly built environment and proper land use management for various land uses
i.e. industrial, institutional, residential and various businesses. For the financial year 2020/2021 the
Urban Planning Division will be having various initiatives and below is a summary of the proposed
initiatives:
Status Quo
IUDF- The Sol Plaatje Municipality is the only municipality in the Northern Cape selected as a pilot
project for the National programme facilitated and implemented by National Department of
COGTA (Cooperative Governance and Traditional Affairs) and which also is a requirement in terms
of the Spatial Planning and Land Use Management Act, 2013 (SPLUMA) Integrated Urban
Development Framework funded by COGTA National in order to achieve spatial transformation. The
municipality have developed a capital expenditure framework which will assist the municipality in
allocating funds to previously disadvantaged areas and below is a detailed definition of CEF.

44 | P a g e
“A Capital Expenditure Framework is a comprehensive, high-level, long-term spatial-infrastructure
plan which is underpinned by a 10-year financial plan”. The capital expenditure framework
estimates the level of affordable capital investment by the municipality over the long term.
Affordable capital investment is determined by comparing an estimate of capital investment needs
to an estimate of available capital finance sources. The affordable capital investment should be
disaggregated by sector, by target user (poor households, non-poor households and non-residential
users); by investment driver (informal settlement upgrading, other new infrastructure and renewal)
and in space.” In the financial year 2020/2021 the municipality will Review the Capital Expenditure.
ICLEI – EU –The Urban Planning Division have made submission to ICLEI's global Transformative Action
Program (TAP) 2019 for program to determine the extent of flood-line and flood prone areas in
preparation of climate change and creating resilient city. The municipality will equally have further
engagements in 2020/2021 for the progress of submission and due way forward.
The Draft SDF was approved by council on the 26 February 2020 and it will be out for public
participation in due course. This will enable the city to outline its growth strategy spatially and also
encourage the investment in the City. The reviewed SDF will be able to guide the orderly and
desirable spatial development inter alia developing development strategies. Thus creating
integrated, sustainable and habitable city as well as rural areas.
Project for the feasibility studies for Ritchie (Draft EIA and Ge-Technical Report, Phase 1) and Fluffy
Park (Layout Plan and Draft SG Diagramme) for financial year 2019/20.
In terms of NUSP (National Upgrading of Informal Settlement) program the municipality had 31
Informal Settlements from 2014 to date. In order to reduce informal settlements, the Sol Plaatje Local
Municipality formalised a total of twenty (20) informal settlement from 2014 till 2020. However, the
challenge remains the illegal land invasions which have known sprawled to private properties i.e.
Lions Club next to St Boniface in Kimberley.
Challenges
Moreover, relocation within a close proximity of invaded spaces remains a challenge and the
municipality will engage with Provincial COGHSTA in order to assist with the acquisition of land in
various areas within the vicinity of Sol Plaatje Local Municipality. The Urban Planning Division of Sol
Plaatje Local Municipality will have engagements in the year 2020/2021 in order for the municipality
to be assisted with acquisition of land.
In light of the above the Urban Planning unit will continuously ensure that there is enabling
environment in order to improve the investment in the City of Kimberley and Sol Plaatje Local
Municipality in its entirety.
Planning 2020/21
The provision of erven for middle and low cost remains a challenge and as such the municipality is
participating in the PHDA’s (Priority Housing Development Areas) program facilitated by National
COGTA.

45 | P a g e
Figure 2: Priority Housing Development Areas
In the financial year 2020/2021 the municipality will start with planning and implementation of PHDA
2 (Carters Glen).
The planning and surveying of 1200 erven in Ritchie erf 454 (Layout Plan and Draft SG diagramme)
Lastly in the financial year 2020/2021 the municipality will review the Land Use Management Scheme
2008 in order to comply with Section 27 (1) of the Spatial Planning and Land Use Management Act
16 of 2013.
3.1.2 BASIC AND SUSTAINABLE SERVICE DELIVERY AND INFRASTRUCTURE
DEVELOPMENT
Two Directorates fall under this Key Performance Area, namely Infrastructure and Community and
Social Development Services which will be separately reviewed, hereunder.
INFRASTRUCTURE SERVICES
3.1.2.1 ROADS AND STORM WATER
Status Quo
Currently there is no policy that prescribes the basic level of service for access roads in residential
areas. The municipality, can only make reference to the Municipal Infrastructure Framework, which
recommends an all-weather access road at a distance of not more than 500m. Considering this, the
municipality does not have backlogs. However, the municipality has embarked on a programme to
improve gravel roads to paved roads in the previously disadvantaged areas.
General condition of roads and streets in Sol Plaatje Municipality can be classified as fair to poor. This
is due to lack of investment in upgrading and routine maintenance challenges, which nee

46 | P a g e
During the mid-year adjustment the IUDG funding for the upgrading of gravel roads to paved roads
was increased from R13.4 m to R18.4 m. The kilometres paved for gravel roads for FY 2019/20 have
thus increased from 4.5 km to 6.7 km to be done in Wards 6, 7, 9, 10, 12, 15 and 17. This project will be
completed by year end.
The NDPG funding for Phase 2A for the upgrading of storm water channels in Galeshewe, has been
increased during the mid-year for FY 2019/20 from R40 m to R78.2. The target set for the completion
of the construction projects for Phase 2 by year end is 60%.
Frances Baard District Municipality (FBDM) provided additional funding in the amount of R3 million for
the repairs of potholes in the Kimberley, various areas within Sol Plaatje Local Municipality.
Challenges
The scaling down of projects has impacted on the roads department and no funds were allocated.
The capital budget decreased by 20.3% in in 2019/20 financial year when compared to the 2019/20
adjustment budget.
Mitigations/Strategies
To respond to the Roads and storm water challenges, the municipality has put in place long term
strategic projects to rationalize planning and coordination of activities.
This will assist having a more focused and aligned long-term spatial development objectives. These
plans vigorously address the challenges and constraints that stand in a way of making our vision a
reality. The six main plans are discussed below.
Integrated Transport Plan: This is a document that will guide the management, maintenance,
rehabilitation and the improvement of the municipality’s road network. This plan is meant to inform
all roads infrastructure planning and its interaction with any future municipal developmental project.
This will be an evolving palling tool that can be updated when changes occur to the development
plans.
The transport sector in Kimberley is confronted with intensified demand for people and goods,
especially in the already-congested CBD. Galeshewe is, however no exception as continuing
economic growth accelerate the demand for transportation, and rising income generate a desire
for greater mobility. The Integrated Transport Plan will reflect an acute awareness, safeguard against
adverse social and environmental impacts of transport and highlight issues of how transportation
can stimulate economic growth.
Storm Water Master Plan: This is a plan that will consolidate all information on municipal formal and
informal storm water infrastructure, inform all storm water infrastructure upgrades, frequency of
maintenance and the protection of the infrastructure. It will also most importantly deal with elements
of possible water capture and reuse, flood lines, analysis of catchment areas, and integration with
road infrastructure.
Rehabilitation and Upgrading of Storm Water Infrastructure: Emanating from the Storm Water Master
Plan, the municipality would be in a position to know what it current and future needs are so it can
appropriately plan and coordinate maintenance, rehabilitation and upgrading programs.
The municipality is already undertaking planning and implementation of storm water upgrading in
Galeshewe as almost half the storm water runoff is collected from the Southern suburbs through pipe

47 | P a g e
culverts and lined open channels, and get disposed at the attenuation pond in Thlageng. This pond
falls under the most critical storm water sub-system within the Kimberley area since it conveys
approximately 50% of the storm runoff.
Resealing of roads: Sol Plaatje Municipality finds itself as one of the main corridors between the North
and South of the country, as well as a central hub for mining and transportation of commodities. As
a result, this has had a negative impact on the road infrastructure as our roads have to carry heavy
traffic volumes and excessive loads that they were not initially intended for, resulting in advanced
deterioration. Most residential and atrial roads urgently need resurfacing as they are very old and
show signs of brattling and cracking, later resulting into potholes. The municipality therefore
acknowledges the unhealthy state of tarred roads and intends rolling out a resealing programme to
prevent the roads from further deterioration and not lead to a state of disrepair. This project can
only be implemented as and when funding has been secured.
Upgrading of roads: A number of streets in newly established townships as well as previously
underdeveloped areas are either gravel roads or earth roads. Although acceptable, this is a low
level of service and sustainability is a challenge. The municipality has therefore put as one of its
priorities the upgrading of township roads to a paved surface in order to increase the level of service
and accessibility in those areas.
Re-Alignment of N12: The effect of the closure of Bultfontein has a severe impact on the
Municipality’s budget and its ability to provide improved road infrastructure to its residents and the
through traffic through Kimberley. This diversion is placing severe strain on the alternative routes as
these routes were not designed for the number and for the loading of traffic that it must now carry.
In addition to the structural strain, traffic congestion caused by the N12 traffic through the centre
business area of Kimberley as a result of the closer of Bultfontein has already increased to a point
where additional capacity is required to alleviate the problem. Due to all these, and in order to
alleviate delays through the city, a bypass is seen as the most suitable solution.
The plans discussed above will assist the municipality in transforming its service delivery by
undertaking a more aligned and focused planning approach, which derives from reliable
information and is in line with spatial developmental objectives of the municipality.
Planning 2020/21
2.5 km of Gravel roads in Galeshewe will be upgraded to a paved surface.
Completion of the construction work for Phase 2 for the upgrading of the storm water infrastructure
in Galeshewe.
3.1.2.2 WATER AND SANITATION
Status Quo
Sol Plaatje Municipality consists of two main towns, Kimberley and Ritchie, with varying levels of
infrastructure quality and standards. Kimberley is an old city that was designed as a mining town
which grew with time. The infrastructure is very old, retrofitted with time and buried under other
structures with no accurate "as built" information. While Ritchie is a small predominantly farming
town, with very limited water infrastructure.

48 | P a g e
The municipality has invested, and still investing in improvement of the infrastructure to realize its
goals. The minimum requirements in terms of the provision of basic water and sanitation services
delivery are met, but challenges still exist in the informal settlements due to uncontrollable sprawling
of informal dwellings.
The following projects were planned for the financial year 2019/20:-
Appointment of a contractor for the construction of the Carters Glen new sewer pump station and
the reconstruction of aged sink toilets in Kagisho, Kutlwanong and Phomolong had to be re-
advertised due to non-responsiveness of bids according to Supply Chain Management Policies and
National Treasury Regulations.
Complete the bulk water infrastructure for the Lerato Park Development
Complete 50% work for the bulk sewer infrastructure for Lerato Park Development
Replacement of 2500 water meters
Complete the repair/refurbishment of the Homevale/Seleke outfall sewer line to Homevale WWTW
During mid-year the Department of Water and Sanitation allocated R9 m under the WSIG grant for
emergency repairs at the Homevale Wastewater Treatment Plan.
In June the municipality received communication from Department of Co-operative Governance
and National Treasury and granted approval to reprioritze the IUDG (Integrated Urban Development
Grant) allocation and redirect R12.3 million for Covid-19 projects. The two projects from which funds
were adjusted downwards are:
Homevale Fire Statiion an amount of R10 m (Original Budget – R14 420 582 m)
Lerato Park Bulk Sewer an amount of R2.3 m Original Budget – R19 540 514 m)
A second adjustment budget and Adjusted SDBIP for FY 2019/20 will be tabled to Council on 30 June
2020. The adjustment for the new projects is set out below:-
Project Name and Description Final
Adjustment
Elevate water tanks, Elevate water tanks, Construction of 4 elevated water
tanks with a combined capacity of 720 kl for critical areas. R8 000 000
Provision of sanitation facilities in informal areas. Rental of portable chemical
toilets for a period of 3 months in and around informal areas. R700 000
Emergency repairs of Camelia sewer pump station. Repair, replace and
commission of broken and damaged infrastructure components in Camelia
Street sewer pump station.
R1 600 000
Emergency electricity equipment. Supply and delivery of 3 mobile
generators with varying capacities (37, 50 and 120 kVA) complete with 4 x
lighting towers and auxiliary equipment.
R2 000 000
Total R12 300 000
Challenges

49 | P a g e
Funding remains one of the main challenges to timeously address challenges of maintenance,
refurbishment, upgrading and development of new infrastructure at the same rate as demand and
growth
Planning 2020/21
Complete the reconstruction of 320 aged sink toilets in Kagisho, Kutlwanong and Phomolong
funding by WSIG.
Complete 70% of the construction work at the new sewer outfall mains for Carters Glen sewer pump
station.
Complete the bulk sewer infrastructure for the Lerato Park development.
Replacement of 1500 water meters
Complete the installation of electrical and mechanical components in Lerato Park Sewer Pump
stations in Eagle Street and Lerato Park.
Complete the construction work at the Homevale Fire Station.
The excessive water losses reported over the past number of years necessitated the development of
a practical action plan that identifies projects which would directly address these losses. The
proposed plan is depicted in the table below:
Table 6: Water losses – Action plan
Water Losses – Action Plan
Efficiencies at the purification plant (Riverton)
Catchment of purified water disposed during the back wash process
Upgrade of existing dam in Riverton that can be used to catch the water, ensuring that the already purchased and purified water is not flushed back into the river
Capital Budget or Maintenance as the asset exists already
It is estimated that 6% of water losses are as a result of this process
Unmetered consumers (farmers along the 900 and 630 lines from Riverton
It is believed that there are farmers connected directly on the distribution line from Riverton that have no meters installed, and accordingly not being billed for the water.
Water Services Engineering must confirm the existence of such customers and ensure that these customers have a meter installed and are read and billed monthly
Part of day to day operations.
Depending on the number of customers found, it is estimated that this may be about 3% of the water losses reported. It will also improve on the monthly billing and receivables per month.
Major leaks identified in the distribution network.
There are apparent major leaks that need urgent attention of the Engineers. Some had been attended to.
Pipe replacement projects have also be conceptualised in the current IDP Cycle.
Pipe replacement project as part of maintenance must be developed and funded within the available budget allocated.
Normal maintenance work or use of contractors to complete complex fixes required.
A capital project was planned in phases from 2018/19 MTREF
Leaks and pipe bursts may be contributing about 5% to losses reported
Installation of bulk meters to all informal and formalised areas where household billing is not yet taking place
The municipality provides free basic water to formalised and illegal/unplanned settlements.
However, water provided is not metered to determine amounts consumed for billing of FBW purposes. This unmetered
Installation of meters in all areas that receive FBW immediately
Part of day to day operations of technicians and plumbers.
It is estimated that 1,584 cubic litres of water is distributed as FBW thus contributing about 3-5% to the water losses

50 | P a g e
water is reported as part of losses.
Covered meters Inability of meter readers to read meters due to them being covered
Clearing of meters for reading purposes
Duties of Meter Readers and Meter Inspectors
Finance to provide a list of covered meters
Leaking meters and internal services
Many customers report leaking meters and leakages within the yard causing disputed bills
Establish a system to manage reported leaks and replacement of such meters
This work can be outsources to ensure quick turnaround times to complete the list available
There is a budget for water meter replacement
Replacement of water meters with SMART meters at all Council Properties
No proper management of meters installed at all council occupied properties and the reading rate of such is very poor.
Procure and install SMART water meters for all council occupied properties for accurate measurement of consumption.
Capital Project funded as water meter replacement
Identify municipal properties, analyse functionality of these meters, or immediate replacement of meters.
Reading of meters Access to water meters is a challenge. Customers with more than 6 months interim water readings as a result of access issues have their meters moved to the pavement
This job be co-sourced with the local plumbing company to assist with relocation of meters as well as installation of meters where we have straight connections.
Contracted services – mater replacement project
Interim readings impact the accuracy of estimating water losses as a result of journal corrections monthly
Review of meter reading routes and use of advance technology for reading purposes
The municipality ran a pilot to test meter reading using electronic devises. The project was successful and new device requires to be purchased. However, this project must be enhanced to include an integrate-able meter reading system and reading devices for water and electricity
Procurement has been completed. Tender processes must now be followed in this regard. Consider Section 32 if possible.
This has been budgeted for as part of meter replacement, however, upon award, the system installation, staff training, testing and implementation will be moved with budget for correct classification. Annual license fees shall be budgeted for under ICT.
A 100% reading rate is sought after for good performance by Meter reading Section
3.1.2.3 ELECTRICITY
Sol Plaatje Municipality is licensed to purchase electricity from Eskom and distribute to residents via
the 66kV, 11kV and low voltage electrical network.
Sol Plaatje has two bulk 66kV electricity supply points from Eskom namely, Herlear and HA Morris
Substations which supply the Kimberley area and Riverton Substation. Although demarcated within
the Sol Plaatje municipal area, Eskom is licensed to distribute electricity in Ritchie.
Status Quo
Projects planned for the financial year 2019/20 is set out below:-
Complete the replacement of the 66 KV oil circuit breakers a the Herlear Substation with SF6.
Appointment of an Electrical Engineer Consultant for the Lerato Park link services network
strengthening bulk project.
Complete the electrification of 200 households on project areas to be determined as per revised
project schedule program.
Replace at least 1550 prepaid electricity meters.
Challenges

51 | P a g e
Electrification remains a challenge due to continuous growth of informal settlements on vacant land.
Electrical infrastructure and electrification of houses cannot be installed in informal settlements prior
to township establishment.
Other major challenges regarding electricity are vandalism and copper theft that lead to
equipment damage, electrical supply interruptions and possible fatalities to municipal employees or
members of the public.
Planning 2020/21
The following projects are planned for financial year 2020/21:-
Complete the procurement phase only for the replacement of the 11kV circuit breakers at Herlear
Substation.
Complete 50% of the bulk electrification work for Lerato Park.
Complete the electrification of 675 households.
Replace at least 1550 prepaid electricity meters.
Refer to the Figure below for the 66 kV network layout.
Figure 3: Kimberley 66 Kv Network

52 | P a g e
Mitigation Strategies
An action plan has also been compiled to curb the high electricity losses:
Table 7: Electricity losses – Action plan
ELECTRICITY LOSSES - PROJECTS
Faulty meters replacement
There are still faulty electricity meters that need to be replaced.
There is lack of supervision in as far as replacement of faulty meters is concerned – this may contribute to the electricity losses suffered by the municipality.
There is a detailed report on faulty meters. All meters must be replaced by 30 June 2019.
Appointment of contractor may be necessary to complete the project on time.
Replacement of all credit meters for residential customers.
The municipality has progressively replaced residential customer meters and there is less than 5 000 customers still on credit meters.
For revenue protection purposes, these customers must have their meters replaced as part of the meter replacement project
A report of residential customers with credit meters be obtained, customers on arrears for more than 90 days must have their meters replaced as a priority
Appointment of contractor may be necessary to complete the project on time.
Install of SMART electricity meters for large customers and ensure automated reading take place for accurate and efficient billing.
Project has been conceptualised. Out of 400 customers, over 250 customers have been installed with SMART meters.
Implement project to completion.
Accurate reading and reduction of customer queries that delays payment of accounts.
Billing and Electricity to meet and prepare a status quo report in this regard. CFO and ED I and S to guide immediately after the report is received.
3.1.2.4 FLEET
Inadequate and unreliable fleet has always been one of the hinderers of effective service delivery.
The municipality has over the years relied on the external hiring of fleet and machinery, but have
recently taken a decision to revitalize own fleet by replacing old, unreliable and redundant fleet.
The challenge however remains that funds allocated for the Vehicle Fleet Replacement Plan are
inadequate to satisfy the urgency and frequency that this fleet is required, hence the needs to align
to the budget thereof to the annual Fleet Replacement Plan/Needs Analysis, taking into
consideration financial constraints that may exist.
An amount of R6m was made available for the 19/20 financial year but during mid-year the amount
was adjusted downwards to R5.4m due to financial constraints. A projected budget of R2, R5 and
R10 m per year was made available for the following three financial years.
3.1.2.5 HOUSING
Status Quo
It should be emphasised that the provision of housing is not the responsibility of the Local
Municipality, but rather the Department of Cooperative Governance and Human Settlements
(COGSTHA). The municipality had in the past acted as an implementing agent for the department,
through appointing and monitoring of construction contractors. The function was, however taken
back by the department in its entirety. The municipality is responsible for the identification, planning
and surveying of land suitable for human settlement.

53 | P a g e
That being said, housing remains a major challenge in Sol Plaatje municipality, with backlogs as per
the housing applications currently at approximately 12 000 applications. This is evident by the
number of illegal and informal settlements that have mushroomed over the past decade, sitting
currently at 21 informal settlements. Nine of the 21 informal settlements have however been formally
registered and declared as townships, although infrastructure provision remains a challenge.
The municipality has a mandate to ensure provision of all basic housing to deserving communities as
set out in the table below.
Table 8: Estimated Housing Backlog
The estimated number of families living in informal settlements is 12374, and this is something that
through joint efforts between COGHSTA and SPLM is being resolved.
It is important that a progressive working agreement between the municipality and COGSTHA is
maintained in order to deal with this issue in an effective manner.
The municipality is transferring title deeds to lawful owners, especially the pre- 1994 stock. This in in
line with the budget speech from the National Minister of Human Settlement. The Minister
emphasized how without the rightful owners, government is unable to revitalise old townships, which
are in most cases in a state of decay. The municipality is looking at collaborating with department of
Land Reform and the office of the Land Commission to create a dedicated unit to deal with fast
tracking the issuing of these Title Deeds.
In addition to this, the department has also expressed its intention to donate the Community Rental
Units (CRU’s) in Lerato Park to the municipality. The municipality plans to outsource the management
of these units – including the maintenance thereof.
Achievements
In an effort to deal with overcrowding and density challenges in informal settlements, the
municipality also undertook a project to identify new pockets of land suitable for low cost housing,
survey sites and relocate families.

54 | P a g e
Challenges
The illegal invasion of municipal land and sporadic mushrooming of illegal settlements remains the
biggest challenge facing the Housing Division. The safeguarding of municipal land has always been
a challenge, and eviction of illegal occupants is even a much more difficult challenge to overcome
due to non-cooperation from SAPS and insufficient security personnel from the municipality to
enforce evictions. This also negatively impacts on municipal efforts to eradicate the Housing backlog
as in some instances the invasion of land impedes proper coordination to providing services.
Land invasion also interferes with the Housing Needs Register as in most instances people who have
illegally occupied land end up being permanent residents to the land they have occupied, thus
interfering with the Planning and Development of the Implementation protocols of Human
Settlements Development.
All the above are exacerbated by the shortage of suitable located land for BNG and the Gap
Market potential beneficiaries, which are the two brackets most in need.
Maintenance of municipal rental stock is also a big challenge in the municipality as the municipal
flats have drastically deteriorated over the years and are becoming more and more costly to
maintain, of the revenue collected at the stock is far less then maintenance cost incurred. This needs
to be investigated to look at possibilities of putting these flats/stock in being managed by a Social
Housing Institute or a management company who can do that effectively on behalf of the
Municipality.
The issuing of title deeds remains a challenge as the rightful owners have either left town, or do not
attend organised meetings to have their details verified and to collect their title deeds. Difficulties in
regards to transfers of deceased estate also adds to this predicament.
Mitigation Strategies
In order to address one of the biggest challenges that affect Housing in Sol Plaatje Municipality, the
Housing Division will improve its interactions with town planning to ensure alignment in planning and
exploring for land availability suitable for human settlement.
Subsequently this, the current waiting list would be converted to a National Housing Register and
appropriately prioritized in order to consolidate and streamline the Housing Delivery value chain.
The Municipality has gone a long way in upgrading its bulk infrastructure to enable growth. It now
has to prioritise the reticulation of services to business and households. In this process it is important to
take cognisance of the spatial development taking place – both in terms of commercial
development and residential development to ensure that the reticulation of services is aligned to
the ‘space-economic’ development of the City.
The table below details the funded infrastructure projects that the municipality has included in its
capital budget for 2020/21.

55 | P a g e
Table 9: Capital Infrastructure projects
Project Description
Current
Year
2019/20 2020/21 Medium Term Revenue &
Expenditure Framework
Ward
Funding
Source Full Year
Forecast Location Budget
Year
2020/21
Budget
Year +1
2021/22
Budget
Year +2
2022/23
R’000 R’000 R’000 R’000
Replacement of 1550 prepaid
meters 3 000 3 000 3 000 3 000 All CRR
Complete the procurement phase
for the 11 KV circuit breakers at
Herlear Substation 500 3 000 All
CRR
Replacement of 1500 water meters 3 400 3 000 3 000 3 000 All CRR Reconstruction of 320 aged sink
toilets in Kagisho, Kutlwanong and
Phomolong
8 500 CRR
Fleet Replacement 5 400 2 000 5 000 10 000 All CRR
Computer equipment replacement 2 500 2 000 2 000 3 000 CRR Furniture and equipment
replacement 1 700 2 000 2 000 3 000 CRR
Township establishment 1 000 2 000 CRR European Union - Business
Expansion, Attraction and Retention
(BEAR)
14 400 18 850 11 750 All EU
Complete 50% of the Lerato Park
bulk electrification project 14 945 6 008 30 INEP
Electrification of 675 households 9 553 12 150 23 000 21 000 To be
determined INEP Complete the procurement phase
for the 11 KV circuit breakers at
Herlear Substation 1 500 21
INEP Complete 100% upgrade of 2km
water reticulation pipe length within
Sol Plaatje areas
5 000 12 000 11 500 To be
determined IUDG Complete 100% upgrade of 1.8 km
sewer reticulation pipe length within
Sol Plaatje areas
5 000 12 000 11 500 IUDG
Complete the construction for the
bulk sewer infrastructure for the
Lerato Park Development (R2.3m
redirected Covid 19) and the
electrical and mechanical
components at the pump station in
Eagle Street and in Lerato Park.
17 240 26 455 30
IUDG Lerato Park construction bulk water
mains 642 IUDG
To upgrade 2.5 km of Galeshewe
access roads to a paved surface 18 436 8 000 11 639 15 689
To be
determined IUDG
Resealing of various roads 5 000 12 000 12 000 All IUDG Planning and Survey of 1200 erven
in Ritchie, erf 454 1 500 2 000 2 000 IUDG

56 | P a g e
Project Description
Current
Year
2019/20 2020/21 Medium Term Revenue &
Expenditure Framework
Ward
Funding
Source Full Year
Forecast Location Budget
Year
2020/21
Budget
Year +1
2021/22
Budget
Year +2
2022/23
R’000 R’000 R’000 R’000
Complete the construction work for
the Homevale Fire station ((R10m
redirected Covid 19)
4 421 3 IUDG
High-mast lighting 4 000 4 000 Various
wards IUDG
Redirected IUDG funds for Covid 19 Construction of 4 elevated water
tanks with a combined capacity of
720 kl for critical areas.
8 000 Various
wards IUDG Provision of chemical toilets in
informal areas 700
Various
wards IUDG Emergency repairs of Camelia
sewer pump stations. 1 600 2 IUDG
Emergency electricity equipment. 2 000 Various
wards IUDG Complete the construction work of
Priority 2, Ph 2A for the upgrading of
storm water infrastructure in
Galeshewe
78 299 20 000 30 000 30 071 All
NDPG Complete 70% of of the
construction work at the new sewer
outfall mains for Carters Glen new
sewer pump station
5 300 20 000 11 250 13 750 24
WSIG Reconstruction of 320 aged sink
toilets in Kagisho, Kutlwanong and
Phomolong
5 943 3 750 12 198 15, 17 WSIG
Repair 50% of faulty electrical and
mechanical equipment emergency
repairs at Homevale WWTW 9 000 3
WSIG
Servicing of erven 2 000 Various
wards FBDM
Total 189 636 154 456 155 489 169 458
As can be seen from the table above, the following flag ship projects currently receive priority at the
municipality:
The biggest project on the capital program is for the Development in Lerato Park in the amount of
R26 455 m to complete the bulk sewer infrastructure and the installation of the electrical and
mechanical components at the pump station in Eagle Street/Lerato Park. This project is funded
through the IUDG Grant. R6 m was also allocated through INEP to complete 50% of the construction
work for the bulk electrification.
The second biggest project is the Galeshewe Storm Water Upgrade which is implemented under the
Urban Renewal Program (URP) as part of the Public Network Transport (PNT) mainly in Galeshewe
and other areas in the city. The total allocation from the Neighborhood Development Partnership
Grant (NDPG) from National Treasury is R20 m for 2020/21 and R60 m over the MTREF.

57 | P a g e
This project will replace most of the existing storm water drainage pipes and install box and pipes
culverts where heavy floods are experienced in the greater Galeshewe and will significantly reduce
the huge storm water problems experienced in both primary and secondary networks as well as
reducing floods in private and business properties. This will create great water harvesting
opportunities for municipality amidst national current water crisis.
The project is implemented for the total upliftment of the area as well as to facilitate improved
drainage to a significant part of the city.
An allocation through Water Services Infrastructure Grant (WSIG) in the amount of R20 m for 2020/21
and over the MTREF R25 m is the construction of new sewer outfall mains for Carters Glen new sewer
pump station.
An amount of R14 4 m was received for Business Expansion, Attraction and Retention (BEAR) and
R45 m over the MTREF funded by the European Union.
As a result of the housing development in the city, new areas are mushrooming and provision for the
electrification of houses need to be made. An amount of R12 150 m has been earmarked for the
electrification of 675 households funded by Integrated National Electrification Program (INEP).
Planned capital funding sources for the next three financial years are shown in the table below:
Table 10: Capital funding sources over the MTREF
The municipality has 33 wards. Ward priorities are received from the ward councilors in each ward.
From these priorities it is evident that the main causes of concern are service delivery related. The
condition of the roads and poor water and sanitation infrastructure is prevalent. Accordingly, these
areas are also where the largest portion of the budget were allocated, Refer to Annexure 3 – Multi-
year capital plan for a comprehensive list of funded and unfunded projects. ANNEXURE 3
Table 11: Ward Priorities
The list of ward priorities received, is attached as Annexure 4. ANNEXURE 4
FUNDING 2020/21 2021/22 2022/23
IUDG 50 955 000 53 639 000 56 689 000
INEP 19 658 000 23 000 000 21 000 000
NDPG 20 000 000 30 000 000 30 071 000
WSIG 25 943 000 15 000 000 25 948 000
EUROPEAN UNION 14 400 000 18 850 000 11 750 000
CRR 23 500 000 15 000 000 24 000 000
TOTAL R154 456 000 R155 489 000 R169 458 000

58 | P a g e
COMMUNITY AND SOCIAL DEVELOPMENT SERVICES
Parks and Recreation
Status Quo
The municipality has 12 community halls with two of them being in Ritchie (Motswedimosa and
Rietvale). The Greenpoint community hall is being used as a drop-off centre as part of the
community-based projects.
The halls are used by the community to generate revenue on a weekly basis for meetings, training
session, weddings, funerals and for commercial purposes. The community is charged accordingly as
per the intended use in line with the approved tariff.
Three (3) of the halls, namely the RC Elliot, Recreation and Motswedimosa halls were badly
damaged during the municipal protests that took place in 2018 and 2019, and it has been a
challenge to recover funds from the Municipal Insurance. The section has been relying only on eight
(8) community halls to service the entire community within the Sol Plaatje jurisdiction.
Challenges
Due to the municipality’s low cash flow, vacant positions could not be filled which led to inadequate
manpower in terms of safeguarding of the facilities and general maintenance of the buildings.
A major setback was the decision by Finance Department to combine the vote number for the
Caravan Park and all 12 community halls. This has negatively affected the running and
maintenance of these facilities seeing that the budget allocation was insufficient. This forces the
section to mainly rely on the Municipal Maintenance Section for the maintenance of the Caravan
Park and all community halls, and the Maintenance Section is overloaded with work and
subsequently fail to respond speedily to the section’s needs.
Mitigation Strategies
Immense pressure was put on the Asset Management Office to follow up with the insurance to claim
funds and a positive feedback was received in January 2020. The Recreation Hall will be addressed
first by the Maintenance section as it was not badly damaged as compared to damages that
resulted at the RC Elliot Hall.
Permission was granted by the Municipal Manager in 2019 to temporarily appoint 6 General Workers
and a Senior Booking Clerk. Funds saved from not filing vacant positions were used to finance the
salaries of these contract workers. Appointment of a Handyman which is included on the new
organogram that was approved by Council in June 2016, will assist in having an employee within the
Halls section who will be responsible for the basic maintenance of the halls.
Planning 2020/21
The following rehabilitation work will be done at the halls:-
Upgrading of halls Painting of the walls Removal of old ceiling boards Replacement and painting of ceiling Repairing of leaking roofs

59 | P a g e
Tiling floors Removal of worn-out window and door frames Replacement of new window and door frames
Ablution facilities Installation of hand sanitizer dispenser Installation of hand towel dispenser Installation of new toilet systems Repair and replacement of male urinary systems Repair outside toilet blocks (Bantu Hall)
Furniture and equipment Tables Chairs Kitchen Appliances Polish buffer machines Industrial Vacuum Cleaners Solar system to save electricity usage
Air conditioning Industrial air conditioner Fan (to save electricity)
Security system Installation of Alarm Systems Installation of Surveillance Cameras Burglar proofing of windows and doors Appointment of Security Services Upgrading of fence using Clearvu Invisible fence
Rehabilitation Cost-estimation R5 000 000,00
Libraries
Status Quo
The Kimberley Library and Research Services consist of two parts namely:
A. The Public Library Section and
B. The Africana Research Library
PUBLIC LIBRARIES
The Public Libraries consist of two service points namely Central Services and Northern Services.
Central Services Northern Services
Beaconsfield Library Galeshewe Library
Greenpoint Library Judy Scott Library
Hadison Park Library Sonny Leon Library
Kimberley Public
Library
Ubuntu Library

60 | P a g e
Central Services also service the following Old Age Homes: Acacia, Belgrave Lodge,Ons Huis,Sally
Aucamp Home for Physically Disabled Adults and Stillerweë.
The following services are rendered by the libraries:
Circulation of books, internet usage , research, photocopying, laminating of documents, monthly
outreach programs, monthly displays to conduct awareness, old age home visits, reading clubs,
marketing and advocacy.
Staff received several in-house training sessions.
Africana Library
Visitors from South Africa and abroad, visited and were taken on guided tours through the library.
Heritage Program for Students of Sol Plaatje University .
Ghost tour in collaboration with Steve Lunderstedt in October 2019 attended by 70 people
Several documentaries for television was shoot at the library
Kalf Annual General Meeting was held on 13 November 2019 with guest speaker Jaco Powell who
gave an talk on game farms, 25 people attended.
Trust meetings are held on a quarterly basis.
Daily research are done for people received via e-mail or telephone. Researchers worldwide visited
the library to do own research.
Conservation and preservation of books, documents, etc.
Indexing and Digitization of municipal files, maps, photographs, news papers are done on a daily
basis.
Challenges
No internet connections due to Department of Arts and Culture’s changeover to a new service
provider.
Maintenance of libraries
Security at Judy Scott Library huge risk
Staff vacancies
Budget constraints – Grant funding were decreased
Planning 2020/21
Public Internet Access Facilities
Security upgrade at Judy Scott Library if DSAC Grant Funding is sufficient
Alternative storage facilities to assist with the increasing collection of the Africana Research Library

61 | P a g e
TRAFFIC SERVICES
Status Quo
The municipality is responsible for ensuring a safe road environment by providing efficient and
effective law enforcement resulting in the reduction in the loss of life as well as the number of
persons injured on our roads, free flow of traffic, and creating public awareness with emphasis to
educate all road users to arrive alive.
Challenges
Shortage of staff due to vacancies hamper service delivery. The absence of road signs and marking
is a main contributory factor for accidents and fatalities on the roads.
General assistants – Only 1 cleaner to service 4 floors.
Light Duty Policy to be drawn up as positions are vacant due to personnel on light duty. Traffic
wardens act in permanent positions to do the cleaning and road marking and signs after hours and
on weekends to improve service delivery. No corrective measures can be taken against personnel
on light duty as a traffic officer needs to have the necessary qualification specified by legislation.
SOCIAL DEVELOPMENT
Status Quo
The institution must become a meaningful and effective partner in a sustainable TB and STI/HIV/Aids
prevention and treatment program. The normal activities is the Counselling and testing, awareness
and promotion, condom distribution, support and poverty alleviation.
Achievements
UNAIDS has developed a new strategy to combat HIV/Aids which is known as 90-90-90 strategy. This
strategy is labelled as an “ambitious” treatment target because its ultimate goal is to work towards
eliminating HIV/Aids by 2030. SPLM has been nominated to lead the Northern Cape Province in this
initiative and the former mayor, KD Molusi signed the declaration in March 2016 as a commitment to
implement this strategy in partnership with relevant stakeholders in their City.
Challenges
Re-launch of Local Aids Council still outstanding – not operational.
Resistance to HIV counselling and testing
Inadequate transport for Peer Educators to visit sections outside Kimberley (Ritchie, Riverton &
Rekaofella)
Stigma and discrimination
Uniform for new Peer Educators and warm jackets for early sessions during winter
Partnership with Municipalities from other provinces to learn and expand the program
More condom dispensers to be purchased so that all municipal service points have one
Banners, Tents and Chairs – external campaigns
Inadequate budget
The 90-90-90 campaign is not on track as representatives of the Premier’s Office are struggling to
meet with Executive Mayor to be briefed on his role in the campaign

62 | P a g e
Corrective Measures
Re-emphasize importance of functional Local Aids Council
Highlight benefits of testing to employees as an encouragement to go for testing
Continue with arrangements with Security and Traffic Services to assist, when possible
Stigma and discrimination can be eliminated through more education to dispel the myths
Motivation needs to be approved by Executive Director or CFO for municipal warm jackets
Request SALGA for assistance
Condom dispensers to be purchased in minimal quantities during each financial year
Banner, tents and chairs to be procured pending on the availability of funds
Budget to be increased to ensure the continuation of programs as planned
Attempts by Premier’s Office to meet with Executive Mayor must continue
Costing estimates : R525 000
3.1.3 MUNICIPAL FINANCIAL VIABILITY AND MANAGEMENT
Status Quo – Budget and Expenditure
Sound financial management deals with the management of financial resources in a manner that
supports service delivery, good governance and institutional transformation, whilst at the same time
ensuring compliance with the local government legislative framework and its supporting regulations
and circulars.
When planning the road ahead for the municipality, it is imperative to analyse and understand the
financial situation, trends and forecasts. This will aid in ensuring that the planning objectives are
realistic and takes into consideration the funds available. Part of this KPA is also to identify new and
innovative strategies to generate revenue as well as optimizing the effectiveness of the current
revenue related plans and strategies.
Table 12: State of the Budget – 2020/21 Tariff increases
SUMMARY SERVICES AVERAGE
SEWER AND SANITATION 5.50%
CLEANSING / REFUSE COLLECTION 6.22%
ELECTRICTIY 5.50%
WATER 5.50%
RATES 5.50%
5.80%
The figures below depict the trend in terms of tariff increases over the past years, both on an
average basis, and for the rates service specifically.
Chart 25: Average tariff increases

63 | P a g e
Chart 26: Rates tariff increases

64 | P a g e
The main cost drivers for the municipality are shown in the table below:
Table 13: Main cost drivers
It is clear from the information above that the largest part of operating expenditure relates to
employee costs and bulk purchases of water and electricity. These costs are very difficult to reduce
or contain and therefore it leaves very little room for leverage within the operating expenditure
budget.
Revenue
The process of review for the current General Valuation Roll (GVR) has was concluded by the 1st
January 2019 and was submitted to the Accounting officer before 31st January 2019, and has since
been published for objection processes in February 2019.
The new General Valuation Roll will see the increase of valuation for 31 July 2019, R35 496 318 070
with 54,718 properties, to 28 February 2020, to R35 503 108 070.00 with 55,031 properties.
The current valuation roll is completed and the Valuation Appeal Board has been constituted for the
hearing of appeals against certain entries to the Sol Plaatje Municipality General Valuation Roll 2019.
The Appeal Board will sit on the 6th and 7th of April 2020.
Below is a summary of the status of the General valuation roll:
Total number of registered properties as at February 2020: 55 031
The G.V. 2019 and lodging of objections against the Municipal Valuer, was concluded.
The Valuation Appeal Board was established and will sit on the 6th and 7th of April 2020.
Expenditure as a % of Total Expenditure 2020/21
% of Total
Expenditure
Employee related costs 814 281 382 37%
Debt impairment 249 000 000 11%
Bulk purchases 672 500 000 31%
Other materials 165 426 444 8%

65 | P a g e
Chart 27: Current value of G.V. Roll – R35 503 108 070.00
Chart 28: Growth in Number of Properties
Achievements
The municipality was a pilot site for the implementation of the municipal Standard Chart of Accounts
(mSCOA) since 2015. Version 6.3 of mSCOA was implemented in July 2019 and version 6.4 will be
implemented from 1 July 2020. All submissions of supporting documents and data was done as per
the regulation.

66 | P a g e
The municipality has managed to produce an adjusted budget for the FY 2019/20 that was assessed
by the National Treasury to be credible and funded.
For the 2018/19 financial year Sol Plaatje municipality received a financially qualified audit report
and a disclaimer for reporting on predetermined objectives.
Bi-weekly meetings are held with regard to the progress made on the Audit Action Plan for 2019/20.
Progress made on the audit action plan as well as on the status of the cash flow are reported
regularly to the relevant Portfolio Committees and to Council. Councilors are receiving e-mails with
regard to progress made with the Audit Action Plan with the plan attached for ease of reference.
The newly appointed acting CFO and Acting MM have put various cost containment measures in
place which includes the stopping of the procurement of beverages, refreshments, bottled water
and furniture. Clamping down on deviations and also centralizing the sourcing of quotations to
Supply Chain Unit.
Improved debt collection practices
The municipality embarked on an improved method to implement the credit control policy to own
personnel, councilors, all categories of customers including Organs of State. Our three year debt
collection strategy which included the use of specialist debt collection service provider; New
Integrated Credit Solutions (“NICS”) to collect arear debt older than 90 days for residential and
businesses category came to an end 31th October 2019. The municipality is currently implementing
recommendations from this contract’s close off report including recommendation to write off of
about R249,6 Million of irrecoverable debt relating doubtful recoverable indigent household debt,
deceased and dormant untraceable debt. The municipality also encouraged more debtors to enter
into formal payment arrangements and offered relief to customers by introducing arrear debt
settlements specials including black Fridays and December specials.
Challenges
There are many factors that impact on this KPA, both directly and indirectly. These factors can be
broadly divided into internal and external factors.
Internal factors that affect the financial sustainability of the municipality negatively include:
- Non-compliance with policies, hence incorrect practices followed and payment
arrangement to collect outstanding debt.
- Restrictive policy to enrol indigents to the register and strict audit reviews on indigent
approval criteria and verifications.
- Public perception that SPLM does not offer fair value for the cost of tariffs and taxes
- Rental charges are not market related
- Penalties do not deter transgression
- Incentives offered are not sufficient to attract the required investment.
- Project planning and project management need to be improved. Poor spending on grant
funded projects may lead to a reduction in grant funding for future years. The trend of
underspending, specifically during the first 6 months of the financial year, should be curbed.
Furthermore, additional or unplanned spending towards the end of a particular project
causes unnecessary budgetary constraints.

67 | P a g e
External factors that play a role are described below:
- The biggest challenge this KPA faces remain the growth in debtors. This is largely attributable
to the economic climate, the high unemployment rate and the consequential mushrooming
of informal settlements. People are finding it increasingly difficult to settle their municipal bills.
- Consumer attitude towards regular settlement of monthly current accounts and honouring
arrangement payments agreements is very concerning because only an average of R88,3
Million is collected from average monthly services billing of R130 million.
- Political and policy uncertainties which results more and more public protests to erupt.
- The rising costs of distribution and supply of electricity impacts negatively on the electricity
tariffs. Increases applied for, are not always approved by NERSA, placing even more strain on
the already overstretched budget.
- Another obstacle to financial sustainability is the unfunded mandates carried by the
municipality, e.g. health services, library services and resorts. These services cost the
municipality a significant amount of money, without any external funding being received.
Mitigation Strategies
In an effort to address the factors mentioned above, a shared understanding and appreciation of
the importance of Revenue, Expenditure and Budget Management needs to be created. The
community does not have an unlimited supply of money and they deserve to be given the best
service possible at the most cost effective prices. Revenue collection as an administrative function
belongs to Finance. Revenue management and collection as a principle and lifeline of the
community by way of provision of services is every person’s reasonability. Two-way communication
between the Municipality and its community is imperative and so is a need for reciprocal
participation. The municipality should strive to create pride in the city through education and
campaigns. Children should know that it is their city.
Estimated readings for water and electricity should be kept to a minimum. This will promote
accuracy of billing. 100 Percent billing coverage is the aim. Stringent measures should be
implemented when payments are not received and no arrangements were made. These measures
should be consistently applied throughout the financial year.
Various avenues of obtaining readings should be possible. This includes automated readings, own
readings, and prepayment metering. Turnaround times towards resolving reported billing queries,
reported faulty meters and leakages should be attended to at shorter intervals. Access to account
information can be made easier, with online account information (static and interactive).
Contents of existing policies and by-laws should be reviewed to determine the relevance and
applicability thereof. Interpretation of provisions in policies and by-laws should also be reviewed and
clarity provided where required. In doing so, existing sources of revenue will be optimized (including
advertising and rental income).
In terms of tariff determination, the following key principles should continue to be applied:
Transparency
Efficiency
Uniformity
Parity

68 | P a g e
The following important considerations must be made in addition to the policy criteria and guidelines
when considering tariffs and charges:
• What do we want the city to look like in 100 years?
• What do we want the city to be best known for: Towards a leading and modern City?
• What are the most pressing and immediate needs for the community?
Development of cycles of aggressive competitiveness, business and other sector maintenance,
community relief, growth and development is key. The municipality should improve fluidity to
maximize opportunity.
New sources of revenue that may be explored:
Small Scale Embedded Electricity Generators (SSEG’s). This involves the municipality
buying excess energy from these electricity generators at a price lower than the ESKOM
tariff.
Independent Power Producers (IPP’s): Similar to the above scenario, but on a larger
scale. This may be more cumbersome as the IPP’S are more closely regulated.
Land Development/Sales Partnerships should be encouraged
Advertising income optimized
Landfill Site – the upgrade of the landfill site will enable the municipality to develop
charges for dumping of certain material.
Purified Effluent can be sold to mining companies.
Environmental and developmental Incentives and Partnerships
ICT UNIT
Status Quo
ICT has made strides in enforcing the ICT strategy vision to connect, collaborate, and integrate not
only for employee related services, but also for Council and the community.
This strategic vision is directly aligned to the IDP vision for Leading to a modern city. To achieve this
vision, ICT had prioritised 3 key critical projects. The information security project to strengthen the
current ICT physical infrastructure and provide for a secure platform to transact electronically in all
spheres of user bases. This project also spans into necessary responses to the AG findings for
automation that will allow better and effective controls in our environment.
Supplementary to the information security project is the Biometric access project, which is not only a
basic core component of security but spans into the human resources extensively thus allowing for
improved controls around employee related matters.
Disaster management is the third project identified to provide an automated response to disaster
management and to a certain extent business continuity, but also to provide an automated solution
for the municipality as the disaster management co-ordinators of the province.
IT is ready to roll out the town planning application management system, and building plan
application management system.

69 | P a g e
There is also a property management and land management system ready for implementation for
the 2019/2020 year in preparation for a fully integrated AFLA portal. All of which will be accessible by
the public on the GIS portal which is now available online on the municipality website to the
community.
Challenges
The main challenge experienced through the year is the financial constraint more so on the resource
limitations. Over the past 3 years ICT has suffered loss of employees through a retirement and
resignations. As a result delivery on day-to-day responsibility and project implementation has
become difficult to run concurrently. The ICT structure is now under revision to ensure that at
minimum ICT is able to support the basic service delivery requirements.
Planning 2020/21
The planning in preparation focuses on the 2nd phase of the information security project as well as
disaster management. Automation of revenue based processes and well as community focused
initiatives will be the key priority to promote and realise the ICT strategy vision to connect,
collaborate, and integrate with the community, employees and council.
A project for the updating of oblique aerial photography for geographical information system is
planned for the 2020/21 FY should funding of approximately R900 000 be secured by Frances Baard
District Municipality. This project will generate revenue not just for the Rates Section but the value
that GIS with updated pictometry brings to valuations, town planning, building control and
infrastructure will be immeasurable.
This tool is also used as proof during the objection and tribunal processes of valuations as the public
is very cautious to allow a municipal worker inside their property. The Building Control Session will be
able to identify illegal additions without building plans.
The last aerial photography was done in 2016 and funding for this project is crucial as the city is
developing at a fast pace.
3.1.4 MUNICIPAL INSTITUTIONAL DEVELOPMENT AND TRANSFORMATION
Status Quo
Institutional development and transformation focuses on the provision of strategic managerial
leadership of the integrated business, transformation, development strategies and plans for the
organisation.it provides the framework within which the municipality must function, the collaborative
development thereof, inclusive corporate strategies.

70 | P a g e
Objectives under this key performance area must ensure effective and appropriate use of
organisational intelligence and information for strategic purposes for operational, planning purposes
and enable reporting and compliance with the local government legislative framework.
It is also focusing on strategies aimed at building capacity for excellent performance and service
delivery through developing and implementing sound recruitment policies and effective
performance management framework. It aims at fostering synergies between various departments
by developing workflows, clear job descriptions and organisational structure aimed at mobilising
human capital that will match the organisational mission and vision and improve existing capital.
The Mission and Values that will guide the municipality over the five year term, as captured in the
IDP:
Togetherness: there is no separation between Sol Plaatje municipality and community, we are
intertwined.
Certainty: There is a clear plan of reaching out to every community in Sol Plaatje municipal area.
Availability: The services are available at different levels, everywhere.
Responsiveness: We will be innovative and embrace technology as means of communication
Appreciative: We are best placed in Sol Plaatje, and we choose to be here.
Relentlessness: We work, we serve, and we do our best.
Legacy: We create heritage through legacy.
Ethical work: We will work in an ethical manner to be efficient, effective and ensure value for money.
Respect: We are family.
These values provide the backdrop for the approach to Human Resource’s contribution to the
achievement of municipal strategic objectives in the medium to long term. The Human Resource
function of the Municipality must therefore be capable to perform its strategic human resource
function and not only personnel management. As of February 2020, Sol Plaatje had a total of 2223
employees including:
1356 permanent employees
424 contract employees
48 interns
65 councillors
330 ward committee members
The approved organisational structure of the municipality provides for 2701 posts (excluding ward
committee members and ad hoc contract workers. The rest of the vacant positions are not
budgeted for. SPLM currently employs 0.7% of SPLM population, and could potentially employ 1% of
the population in future.
A Human Resource Strategy is developed and skills development plan is available. The Succession
Management plan is addressed by the Human Resource Strategy.
The Performance Management System is institutionalized from the level of Executive Directors to
General Workers. Some of the Executive Directors have not yet cascaded to lower levels, however
additional training has been provided and is on-going. The Reward & Recognition Policy is
completed and approved by Council.

71 | P a g e
Achievements
The nature of this KPA is largely driven by strategy, policy and legislation. It includes indicators such
the submission of the IDP and SDBIP documents, conducting of bi-annual performance assessments,
and compliance with equity employment targets within the legislated timeframes. Performance
assessments for the Municipal Manager and Managers reporting directly to the Municipal Manager
were done.
The Annual Performance Assessment for FY 2018/19 was done on 22 October 2019 and the Mid-Year
Performance Assessment is scheduled for 6 April 2020. Due to Covid 19 Lock down it has been
postponed to August 2020 when both the Mid-year and Annual Performance Assessment will be
done.
An Overtime policy has been developed and was tabled to the relevant Council Sub-Committee
where it was noted. The Policy is scheduled to be tabled to Council for approval.
An item for the establishment of a Disciplinary Board was submitted to the Portfolio Committee for
Corporate Services and Human Resources for noting. It will be submitted to the next Council
meeting for noting.
A Consequence Management Policy – has been developed and was tabled to the relevant Council
Sub-Committee where it was noted. The Policy is scheduled to be tabled to Council for approval.
The municipality is implementing consequence management as provided for in the Collective
Agreement on disciplinary action. Cases of misconduct are processed as advised/requested by
various departments.
A process is underway to review allowances to determine whether it is still applicable and relevant
Council endeavors to work towards a Paperless Committee Service. All councillors were issued with
the required tools of trade and the number of hard copies have been reduced substantially.
Challenges
The unresolved Section 106 report and the MM and CFO who are still on special leave has
contributed to the current financial situation and the low morale of employees in the institution. An
Acting MM, T Mabija and CFO, Z Cader have been appointed in October 2019 for a three month
period which was extended to April 2020 and again until end May. The Acting CFO’s contract was
extended for another three month period until end August 2020 and a new Acting Municipal
Manager, Mr B Dhluwayo (ED : Infrastructure Services) was appointed rom 1 June to end August 2020
to take leadership in order for the institution to go forward. The new Acting Municipal M
Critical vacancies were advertised for the IDP Manager, Revenue, Expenditure and Supply Chain
Manager and City Engineer: Roads and Storm water but held in abeyance until the financial
situation has improved. Personnel are appointed to act in these positions on a rotating basis.
Outstanding appeals must be finalized and implemented.

72 | P a g e
Mitigation Strategies
The approved organogram should be analyzed and reviewed to ensure that it is as efficient and
service delivery orientated as possible. Research should be conducted with regards to
organizational restructuring in order to achieve mentioned objectives e.g. where certain
departments are overstaffed, these employees should be re-trained/re-skilled to fill critical vacancies
in other departments where possible.
Open discussions in this regard must be held with the Labour Forums. Centralizing the training budget
to the Human Resources department will also assist in fast tracking skills development and training of
staff.
Another critical HR deliverable is a culture change program to reinvigorate the organization,
establish a new code of conduct at all levels and positively enhance the profile of the municipality.
Planning 2020/21
It is also important to enhance the project management skills and processes in the administration to
ensure the delivery of capital projects on time, within budget and according to set qualities.
In this process the Project Management Unit should play a central role. It is the intention of the
municipality to focus on the capacitation of managers and leaders in project management and
leadership skills in the 2020/2021 Workplace Skills Plan.
In order to achieve the strategic objectives, set out for this KPA, it is imperative to look at the
information technology support systems and functionalities required for this department to function
optimally. Currently a number of tasks are still performed manually (paper-based). Modernization in
these areas should be prioritized.
Introduction and preparation of employees to go online leave application which continues and the
biometric system, initial date was 1 March 2020. Currently the implementation has been delayed
due to the Covid-19 for protective measures.
3.1.5 GOOD GOVERNANCE AND PUBLIC PARTICIPATION
Status Quo
Accountability is a fundamental requirement of good governance, Municipalities have an
obligation to report, explain and be answerable for the consequences of decisions it has made on
behalf of the community it represents.
Good governance is also transparent, as it must enable people to follow and understand the
decision making process, the information utilised to arrive at the decision, the advice received and
consideration of the legal framework. Good governance is also responsive, and this is in line with the
motto of the municipality of “We Serve”. According to the Back to Basics Programme good
governance is at the heart of the effective functioning of municipalities.

73 | P a g e
SPLM must therefore ensure that good governance is prioritised. This lies within the responsibility
sphere of the political component of the Municipality, which will be constantly monitored and
evaluated on its ability to carry out the following basics:
The holding of Council meetings as legislated.
The functionality of oversight structures, S79 committees, audit committees and District IGR
Forums.
The existence and efficiency of anti-corruption measures.
The extent to which there is compliance with legislation and the enforcement of by-laws.
The rate of service delivery protests and approaches to address them.
Public participation is another essential component of good governance namely, putting people
first. Measures need to be taken to ensure that the Municipality engages with communities.
The Municipality must develop affordable and efficient communication systems to communicate
regularly with communities and disseminate urgent information. The basic measures to be monitored
include:
Achievements
In terms of achievement within this KPA, the following should be mentioned:
- The required number of ward committees have been established and are functional.
- Effective public participation programs are conducted by Council.
- Functioning of council and committees is optimal.
- General compliance on decision making processes and technical compliance matters is
high in all sectors such as SCM, Financial Management, HRM, Town Planning, contracts
management, safety procedures, conditional grants etc
- Reporting requirements strictly adhered to.
- The Budget, IDP, SDBIP, and financial statements are prepared and tabled timeously without
exception.
Challenges
According to literature on identification of the developmental state, there are few challenges that
every society, especially the developing economies, are faced with in accomplishment of good
governance: they are weak institutions, lack of participation and democratization, lack of social etc.
In the developing countries, institutions concerning fined property rights, formal contacts and
guarantees and enforcement rules are weak— either too weak or too predatory in their demands.
This being so, to achieve good governance becomes difficult. Attributes of goods and services have
to be clearly measured for proper exchange to take place and property rights enforced. All these
activities have costs, which can be reduced only when these institutions are effective.
In fact, good governance is significantly related to issues of participation and democratization. For
the people dependent on local resources, democracy means participation in managing them.
But in the face of the emergence of worldwide markets, the efficacy of local community tends to be
destroyed and they seem to be powerless in facing new challenges. These local communities need
to be strengthened to at least manage local resources and local affairs.

74 | P a g e
Other than weak institutions and absence of participation and democratization, lack of social
capital poses a major challenge to approaching good governance. Social capital is viewed as
emerging from the collection of norms, belief, attitudes and practices that govern relationship
between individuals and groups in a society.
It is the social capital that fosters trust in societies, and the societies that are marked by trust are
industrialized and economically developed. The performance in the KPA is largely dependent on all
other areas and departments in the municipality, as it is a collective effort to achieve fair and
transparent processes and decision-making. Specifically, the KPA “municipal institutional
development and transformation” directly impact on the area of good governance and therefore
the challenges mentioned there may be replicated in the KPA of Good Governance.
Mitigation Strategies
SPLM needs to operationalize the above Strategic Development Agenda. This is achieved by
prioritizing the IDP Objectives and the activities to achieve them as outlined above and to ensure
that the resource allocation of the Municipality over the remaining period of this IDP cycle addresses
these priorities. It is also important that it must be possible to monitor and measure whether this is in
fact happening. This will only be possible if realistic Key Performance Indicators and Targets are
developed for each IDP Objective. The operational resources are contained in the Operational
Budget of the 2020/21 MTREF. Some of the line items in the Operational Budget need to address the
IDP priorities indicated above – especially in light of the B2B program as not all priorities relate to the
capital program.
Projects and activities must now be identified to address the key focus areas discussed above and
must be resourced with the available financial resources from own confirmed funding and gazetted
funding from National and Provincial Government. This process is diagrammatically indicated below:
Figure 4: IDP/Budget/SDBIP Process
REVIEWED IDP FOCUS AREAS 2020/21 MTREF
BUDGET Capital and Operational
What activities and projects can be done with available resources to achieve Prioritised Focus Areas?
1. ID Activities and
Projects
2. Allocate funding
3. Link to IDP Objectives
4. Develop KPI’s
5. Set 5-year targets
6. Annual Target – 2020/21

75 | P a g e
3.1.5.1 GOVERNANCE FRAMEWORK
The Sol Plaatje Municipality is an organ of state within the local sphere of government exercising
legislative and executive authority within its area of jurisdiction as specified by the Local
Government: Municipal Demarcation Act 117 of 1998. It consists of the political segment, an
administrative component and the community. Sol Plaatje Municipality is a category C Municipality.
It has an Executive Mayoral System combined with a ward participatory system. After local
government elections in 2016, a 66 member council was elected. There are 33 ward councilors and
33 proportional representatives nominated to council from the list of respective parties.
Figure 5: Governance Structure
Roles and responsibilities of political structures
The roles and responsibilities of the political structures and political office bearers are stipulated in
section 53 of the Municipal Systems Act. The roles of the Council,
Executive Mayoral Committee and the Executive Mayor are summarised in the table below:
Table 14: Roles and responsibilities of political structures

76 | P a g e
Council Executive Mayor Mayoral Committee
Governs by making and administrating laws, raising taxes and taking decisions that affect people’s rights. Is a tax authority that may raise property taxes and service levies
Is the executive and political leader of the Municipality and is in this capacity supported by the mayoral committee. Is the social and ceremonial head of the Municipality Must identify the needs of the Municipality and must evaluate progress against key performance indicators.
Its members are appointed by the Executive Mayor from the ranks of councillors, with the exception of the Deputy Executive Mayor who is elected by the council and is an ex officio member of the mayoral committee.
Is the primary decision maker and takes all the decisions of the Municipality except those that are delegated to political structures, political office bearers. Individual councillors or officials; can delegate responsibilities and duties for the purposes of fast and effective decision making. Must strive towards the constitutional objects of local government. Must consult the community with respect to local government matters. Is the only decision maker on non-delegated matters such as the approval of the IDP and budget.
Is the defender of the public’s right to be heard Has many responsibilities with respect to the annual budget, the budget process, budget control and various other financial matters. Performs the duties and exercises the responsibilities delegated to her by the council.
Its functional responsibility is linked to that of the Executive Mayor to the extent that she must operate together with the members of the mayoral committee. Its primary task is to assist the Executive Mayor in the execution of her powers – it is in fact an extension of the office of Executive Mayor. The committee has no powers on its own, decision making remains that of the Executive Mayor.
The political structure and composition is based on the Executive Mayoral Committee (MayCo)
system. The Mayoral Committee reports to the Municipal Council whose duties are defined so as to
ensure proper decision making and appropriate allocation of funds. The Council must adhere to the
Protocol of Corporate Governance in the Public Sector (1997) and a host of relevant legislation.
The MAYCO is appointed by the Executive Mayor. It exercises powers, functions and duties
designated to it by the Executive Mayor and Council. These powers, functions and duties are
performed and exercised by the Executive Mayor, Ald SP Mabilo together with the members of the
MAYCO as follows.
Executive Management Structure
The Municipal Manager as head of the administration is responsible and accountable for tasks and
functions as provided for in Section 55 of the Systems Act, other functions/tasks as provided for in
legislation, as well as functions delegated by the Executive Mayor and Council. He is responsible for
the implementation of the IDP under the direction and guidance of the Municipal Council.

77 | P a g e
The Municipal Manager is supported by executive managers appointed in terms of Section 57 of the
MSA. The Development Priorities of the municipality as contained in the IDP cannot be achieved
without people (human resources) and therefore the effective management of human resources
makes a vital contribution to achieving these goals. The Sol Plaatje Municipality, through its salary
budget, human resource management policies, practices, systems, etc. recognizes that its
employees are central in realizing the vision and mission of the organization. There is, therefore, close
alignment between the way in which the administration is structured and resourced through its
operational and salaries budget, the IDP objectives and the performance targets of the
municipality.
Figure 6: Executive Management Structure
As such, there has to be a focus on building strong municipal administrative systems and processes.
This includes ensuring that administrative positions are filled with competent and committed people
whose performance is closely monitored. Targeted and measurable training and capacity building
will be provided for councillors and municipal officials so that they are able to deal with the
challenges of local governance as well as ensuring that scarce skills are addressed through bursary
and training programs. The basic requirements to be monitored include:
Ensuring that the top six posts (Municipal Manager, Finance, Infrastructure and Services,
Corporate Services, Community and Social Development Services and Strategy, Economic
Development and Planning) are filled by competent and qualified people.
That the municipal organograms are realistic, underpinned by a service delivery model and
affordable.
That there are implementable human resources development and management programs.
There are sustained platforms to engage organised labour to minimise disputes and
disruptions.
Importance of establishing resilient systems such as billing.

78 | P a g e
The Municipality is attending to most of the above issues – albeit in an ad-hoc manner. These
activities and actions should be done in a more integrated manner. It is therefore important that
these issues should be incorporated in the IDP Objectives. SPLM is reporting on the B2B program via
provincial COGHSTA and therefore these issues should also form part of the SDBIP’s KPI’s and targets
– this will result in attending to these issues continuously and in a more integrated manner – rather
than only attending to these issues on a quarterly basis when reports are due.
3.1.5.2 LOCAL GOVERNMENT MANAGEMENT IMPROVEMENT MODEL
Linked to the above is the Local Government Management Improvement Model. The LGMIM
assesses compliance and quality of management practices of municipalities. It serves two important
purposes, namely, learning or improvement, and accountability. It also provides a holistic or
integrated picture of the state of management practices within municipalities. Municipalities can
then be benchmarked against each other and best practices can be exchanged in order to
enhance local government in general.
The LGMIM does not include an assessment of actual deliverables against planned deliverables and
it does not assess the performance of individual officials. It is therefore not a performance
management system but measures the Municipality’s compliance and management practices
within the following key performance areas:
o Integrated Planning and Implementation
o Service delivery
o Human Resource Management
o Financial Management
o Community Engagement
o Governance
The LGMIM also does not duplicate existing legal, regulatory and prescribed best practices. It draws
these together into a single coherent framework. The due date for the 2018/19 LGMIM Assessment
was December 2019 with a review period in January 2020. The late submission of documentation for
uploading on the system by some directorates has resulted that the assessment was only partly
completed by the IDP Unit.
3.1.5.3 FRANCES BAARD DISTRICT DEVELOPMENT MODEL
The Ministry of COGTA has developed a District Development Model that seeks to bring about a
coherent system in order to achieve integrated service delivery and development in 44 districts and
8 metropolitan municipalities.
The status quo analysis or profile will:
Inform the development of a spatially integrated single government plan;
Guides and direct all strategic investment spending and project delivery across government;
and
Form the basis of accountability.

79 | P a g e
The Premier of the Northern Cape engaged with FBDM and SPLM with regard to the establishment of
the district model and FBDM submitted a draft Profile in February 2020, the district municipal
verification process has commenced and submission to Premier was scheduled for April 2020. The
Presidential Launch was planned for May 2020.

80 | P a g e
CHAPTER 4: INTEGRATION OF THE IDP
4.1 LINKAGE OF THE IDP TO OTHER STRATEGIC DOCUMENTS
It should be emphasized that the IDP was not developed in isolation. National plans, goals and
frameworks were considered as follows:
4.1.1 Sustainable Development Goals (SDGs)
These goals are aimed at ending poverty, fighting inequality and injustice, and tackling climate
change by 2030. Goal eleven of the seventeen SDG’s is: “Making cities and human settlements
inclusive, safe, resilient and sustainable” which is a specific focus area for SPM during this IDP cycle.
4.1.2 African Union Agenda 2063
This agenda recognises that: “Cities and other settlements are hubs of cultural and econom ic
activities, with modernized infrastructure, and people have access to affordable and decent
housing including housing finance together with all the basic necessities of life such as, water,
sanitation, energy, public transport and ICT.” One of Agenda 2063’s key objectives is to: “Provide
opportunities for all Africans to have decent and affordable housing in clean, secure and well
planned environments.”
4.1.3 National Development Plan (NDP)
The NDP challenges all, “to rethink the urban to face the future challenges” and to “grapple with this
task and deal intelligently with social exclusion, environmental threats, economic inefficiencies,
logistical bottlenecks, urban insecurity, decaying infrastructure and the impacts of new
technologies.” The National Development Plan envisages a future in which, “we have created a
home where everybody feels free yet bounded to others; where everyone embraces their full
potential. We are proud to be a community that cares.” It also envisages a future in which, “Our
homes, neighbourhoods, villages, towns and cities are safe and filled with laughter.” Our future is
clearly an urban future, an urban future inextricably linked to our rural future.
The NDP recognises that, “while the fundamental reshaping of the colonial and apartheid
geography may take decades, by 2030 South Africa should observe meaningful and measurable
progress in reviving rural areas and in creating more functionally integrated, balanced and vibrant
urban settlements.” However, for this to happen, the NDP says the country must do three things:
1. Clarify and relentlessly pursue a national vision for spatial development;
2. Sharpen the instruments for achieving this vision;
3. Build the required capabilities in the state and among citizens.
In the spirit of the National Planning Commission’s “National Development Plan - Vision 2030”,
stronger social partnerships between government, organised labour, organised business and the
community constituency are needed to address investment, employment and poverty challenges
our country faces.
Government has therefore developed a range of intervention approaches to support and guide
action on growth and development. The two most important of these documents, at present, in
relation to local government are:
National Development Plan is about both growth and redistribution and there are many aspects to
this transformation challenge:

81 | P a g e
How we utilise land and our mineral resources,
How we organise transport, energy and communication networks,
How we manage cities and local government,
How we improve education and health services,
How we reform our social security and welfare services,
How we broaden ownership and enterprise development, and
How we engage with Africa and the rest of the world.
Figure 7: The National Development Plan – Vision 2030
Although municipalities can also contribute to most of the above themes it is in the areas of
managing cities and local government where it plays its specific role in contributing towards the
NDP.
However, the National Development Plan (NDP) – Vision 2030 has been given greater emphasis as
the point of departure for all spheres of Government in terms of planning and budgeting for next 20
to 30 years. The Plan includes integrated strategies for accelerating growth, eliminating poverty and
reducing inequality. The NDP further emphasises lowering the cost of living for households and
reducing the cost of doing business, especially for small and emerging enterprises.
In light of the above and for SPLM to contribute towards the vision of the NDP it needs to, as a
priority, embark on a process to develop a Growth and Development Strategy with a long term (30
year) planning horizon.
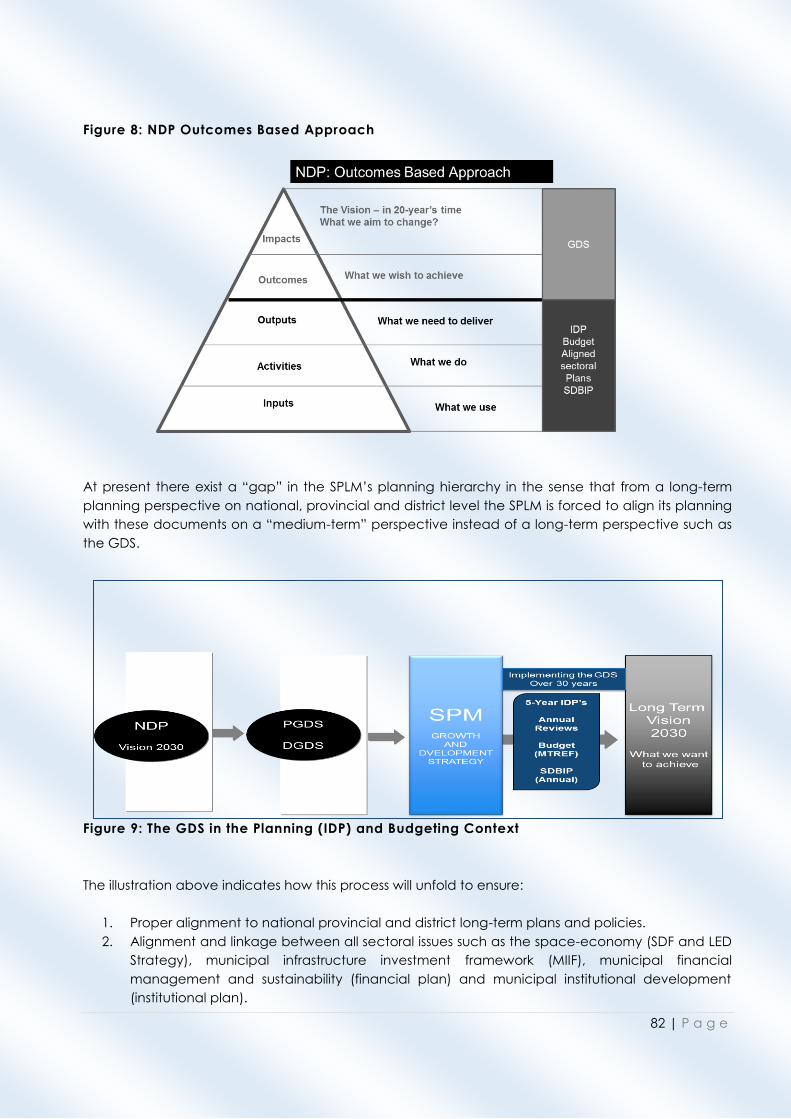
82 | P a g e
Figure 8: NDP Outcomes Based Approach
At present there exist a “gap” in the SPLM’s planning hierarchy in the sense that from a long-term
planning perspective on national, provincial and district level the SPLM is forced to align its planning
with these documents on a “medium-term” perspective instead of a long-term perspective such as
the GDS.
Figure 9: The GDS in the Planning (IDP) and Budgeting Context
The illustration above indicates how this process will unfold to ensure:
1. Proper alignment to national provincial and district long-term plans and policies.
2. Alignment and linkage between all sectoral issues such as the space-economy (SDF and LED
Strategy), municipal infrastructure investment framework (MIIF), municipal financial
management and sustainability (financial plan) and municipal institutional development
(institutional plan).

83 | P a g e
3. Transformation of the current development policy framework into one that is integrated,
coherent, strategic and user friendly.
4. In-depth collaboration and consultation with all relevant stakeholders to ensure a common
vision and understanding of the future growth and development path of SPLM.
5. An implementation framework with key projects and activities linked to programs and
projects and main activities – with funding alternatives - that will be integrated with the
municipal 5-year IDP and Budget cycles.
4.1.4 Back to Basics programme
The National Development Plan makes it clear that meeting the development and transformation
agenda requires functional municipalities and a capable machinery at a local level that can create
safe and healthy and economically sustainable areas where citizens and people can work, live and
socialize.
The goal of the B2B Programme is to improve the functioning of municipalities to better serve
communities by getting the basics right.
Municipalities must therefore:
Develop fundable consolidated infrastructure plans.
Ensure infrastructure maintenance and repairs to reduce losses with respect to
Water and sanitation.
Human Settlements.
Electricity.
Waste Management.
Roads.
Public Transportation.
Ensure the provision of Free Basic Services and the maintenance of Indigent register.
4.1.5 Integrated Urban Development Framework
This framework, adopted by Cabinet in April 2016, marks a New Deal for South African cities and
towns, by steering urban growth towards a sustainable growth model of compact, connected and
coordinated cities and towns. Its overall outcome is spatial transformation. The IUDF builds on the
National Development Perspective conception of spatial transformation and advocates that the
elements of urban structure, namely land, jobs, housing and transport should be used to promote
urban restructuring. SPLM is a pilot for this framework, and as such, the strategic objectives are
directly aligned to the principles set out in the IUDF.
The IUDF is guided by the four principles set out in the NDP: spatial justice, spatial sustainability, spatial
quality, spatial efficiency, and spatial resilience. To achieve this transformative vision, the IUDF
introduces four overall strategic goals:
• Spatial integration: To forge new spatial forms in settlement, transport, social and economic
areas.
• Inclusion and access: To ensure people have access to social and economic services,
opportunities and choices.
• Inclusive Growth: To harness urban dynamism for inclusive, sustainable economic growth
and development.

84 | P a g e
• Governance: To enhance the capacity of the state and its citizens to work together to
achieve spatial and social integration.
The end goal is to strengthen rural-urban linkages, promote urban resilience, create safe urban
spaces and ensure that the needs of the most vulnerable groups are addressed.
To accelerate progress in respect of the spatial transformation of cities more urgently and assertively,
and to address the stubborn persistence of spatial patterns enforced in the apartheid years, a key
instrument is pursuing coherent and integrated planning supported by strategic investments in
infrastructure.
Development for the province is set out in the Northern Cape Provincial Growth Development
Strategy (2004-2014), which sets the tone for development planning and outlines the strategic
planning direction in the Province. The main objectives set by the NCPGDS for development
planning in the Province are:
1. Promoting the growth, diversification and transformation of the provincial economy;
2. Poverty reduction through social development;
3. Developing requisite levels of human and social capital;
4. Improving the efficiency and effectiveness of governance and other development
institutions;
5. Enhancing infrastructure for economic growth and social development.
The Province is in the process of developing a Provincial Growth and Development Plan which
responds to the NDP and will have the following broad objectives:
Providing overarching goals for what they want to achieve by 2030.
Building consensus on the key obstacles to the province achieving these goals and what
needs to be done to overcome those obstacles.
Providing a shared long-term strategic framework within which more detailed planning can
take place in order to advance the long-term goals set out in the Northern Cape Growth &
Development Plan – Vision 2030 and
Creating a basis for making choices about how best to use limited resources.
4.1.6 Provincial and District Strategies
Development for the province is set out in the Northern Cape Provincial Growth Development
Strategy (2004-2014), which sets the tone for development planning and outlines the strategic
planning direction in the Province. The main objectives set by the NCPGDS for development
planning in the Province are:
1. Promoting the growth, diversification and transformation of the provincial economy;
2. Poverty reduction through social development;
3. Developing requisite levels of human and social capital;
4. Improving the efficiency and effectiveness of governance and other development
institutions;
5. Enhancing infrastructure for economic growth and social development.

85 | P a g e
CHAPTER 5: SECTORAL PLANS
5.1 EXISTING SECTORAL PLANS AND THE RELEVANCE THEREOF
It is also important to ensure the sectoral alignment as mentioned above. Sector Plans plays an
important role in management, planning and decision-making.
Table 15: Existing Sectoral Plans
Sector Plan Contribution to IDP Objectives Status
Spatial Development
Framework (SDF) and
aligned Land Use
Management System
(LUMS)
The SDF sets out the objectives for the
desired spatial form of the municipal area.
It also contains strategies relating to the
desired pattern of land use. It also
addresses spatial reconstruction and
provides strategic guidance for the
location and nature of future development
in the Municipality. It contains a strategic
assessment of the environmental impact of
the SDF and identifies programs and
projects for the development of land within
the municipality. The SDF also sets
guidelines for a land use management
system.
While the SDF deals with spatial policy issues
the Land Use Management Scheme 2008
(LUMS) gives effect to these policies and
can be seen as the implementation tool of
the SDF. The LUMS consist of a set of Zoning
Plans which indicate the specific use
allowed on the land parcel. The LUMS will
be reviewed after completion of the
reviewed SDF.
The Draft SDF 2018-2022 was approved
by council on the 26 February 2020 and
it will be out for public participation in
due course. This will enable the city to
outline its growth strategy spatially and
also encourage the investment in the
City.The reviewed SDF will be able to
guide the orderly and desirable spatial
development inter alia developing
development strategies.
Thus creating integrated, sustainable
and habitable city as well as rural
areas.
Lastly in the financial year 2020/2021
the municipality will review the Land
Use Management Scheme 2008 in
order to comply with Section 27 (1) of
the Spatial Planning and Land Use
Management Act 16 of 2013
LED Strategy
The LED Strategy was prepared to
investigate the options and opportunities
available to broaden the local economic
base of Sol Plaatje in order to address the
creation of employment opportunities and
the resultant positive spin-off effects
throughout the local economy. Poverty
and lack of economic development are
two indicators of the sub-optimal
functioning and operation of a
development system, creating a poverty
trap with a range of developmental and
social problems.
The creation of an economic base through
the LED Strategy is deemed critical, since
the local economy of Sol Plaatje is largely
dependent on a select few sectors such as
community services, mining and retail for
the generation of production and
employment opportunities. The local
economy is very vulnerable with respect to
Old Mutual Group has collaborated
with SPM by funding the review of the
LED Strategy to value of R1 million. The
Centre for Local Economic
Development at University of
Johannesburg is the appointed service
provider reviewing the LED Strategy.
The inception meeting took place in
February 2020. The focus group
meetings will be on the 18th, 19th and
20th March 2020 first focus group with
SPM officials and Councilors including
business communities other institutions
such as IDC, NEF, NYDA, SEDA.
The review It promotes LED Strategy as
a territorial-led approach to
development; as an inclusive and
innovative process; and as an outcome
that results in stronger local economies.
Therefore, is designed to entrench LED
as primarily a territorial response to local

86 | P a g e
Sector Plan Contribution to IDP Objectives Status
any shock (contraction or change) within
these sectors, which could have a
devastating effect on local communities in
terms of job losses. This phenomenon is
already evident within the Mining Sector as
many mineworkers in the study area and
the Province as a whole, have over the last
few years, experienced retrenchments and
job losses.
It should be noted that strategy formulation
is regarded as a process and this process
can be applied to initiate economic
development and inform the establishment
of economic development partnerships
between the local municipality, the
community as well as the private sector.
The strategy should not be regarded as an
end in itself, but rather as a dynamic and
pro-active tool to be used by the
municipality to promote regeneration and
economic development.
challenges of Frances Baard region. It
emphasises the importance of unique
characteristics of localities; an
innovative approach to development;
a Local Government-led process, multi-
stakeholder driven process, and an
outcome based on progressive
partnerships.
Thus, Frances Baard District Municipality,
Phokwane, Magareng and Dikgatlong
are part of the review and on the 19th
and 20th March the focus meetings is
with these municipalities.
Integrated Transport
Plan (ITP)
Roads and Storm Water section provides an
effective, competitive and responsive
infrastructure by ensuring continuous
maintenance, refurbishment, upgrade and
replacement of existing roads and storm
water infrastructure assets in order to sustain
service delivery and infrastructure
development in the municipality.
By ensuring effective roads and Storm
Water systems, this section contributes
towards facilitating economic growth and
social development, improving traffic flow
and traffic safety by alleviating traffic
congestion. For this, Integrated Transport
Plan becomes crucial, as a strategic sector
plan.
The sector still does not have Master
Plans. However, Master Plans shall be
developed in the 2020/2021 financial
year, to inform ITP and provide inputs
into IDP review or new IDP process.
Water Services
Development Plan
(WSDP)
The Water Services Act, 1997 (Act 108 of
1997) requires municipalities which have
been authorized to render the water
services provision function (Water Services
Authorities) to:
1. Draft a Water Services Development
Plan as part of their IDP process
2. Elicit comments on draft WSDP
3. Consider and report consideration of
comments
4. Finalize and adopt the WSDP
5. Supply copies to DWS, CoGTA &
neigbouring WSA’s
6. Incorporate the WSDP into the IDP
7. Report on the implementation of the
WSDP every year
SPLM has completed the process to
prepare a WSDP in accordance with
the new Guideline framework of DWA.
DWA is also in the process to review IDP
assessment framework in consultation
with CoGTA to align with WSDP Guide
Framework. The outstanding process is
the approval by the Council
Storm water Master
Plan
SPLM does not have a Storm water
Master Plan in place.

87 | P a g e
Sector Plan Contribution to IDP Objectives Status
Disaster Management
Plan (DMP)
The Disaster Management Act (No 57 of
2002) emphasis four main objectives, to be
executed by all municipalities, namely;
o The compilation of a Disaster
Management Framework (DMF).
o The execution of comprehensive disaster
hazard, vulnerability and risk assessment.
o The compilation of disaster
management plans.
o Establishment of a Disaster Management
Centre.
These four objectives aim to help formulate
and implement appropriate disaster risk
reduction strategies
The Disaster Management Plan guides all
role players on how to proactively manage
disasters, respond to disasters and recover
from disasters.
The Disaster Management Plan was
adopted by Council in August 2008.
This Plan was updated already in June
2018.
The plan and executive summary were
submitted to the Safety and Security
Committee on several occasions and
due to no quorums, it was escalated to
the next level. It was later decided to
present it to the EMT who supported it
and there after it was submitted to the
Mayoral Committee with Ald Matika as
the then Chairperson where it was
noted. Unfortunately, it was during the
time with quite a lot of division between
ANC Councillors and meetings were
postponed indefinitely. The then
Municipal Manager made a proposal
that the documents be placed on the
Intranet for inputs by the general
public.
We are already working on the new
plan. This plan will be discussed with the
ED of Community Services and the
Acting MM to determine the way
forward.
Water and Sanitaton
Master Plan
The Water Services Act, 1997 (Act 108 of
1997), prescribes the legislative duty of
municipalities as water-service authorities to
provide water supply and sanitation
according to national standards and
norms. It also regulates water boards as
important water service providers and gives
the executive authority and responsibility to
the Minister of Water and Sanitation to
support and strengthen the capacity of
municipalities to manage their own affairs,
exercise their powers and perform their
functions.
In order to meet this requirement, the
municipality must develop and update
plans that seek to support this requirement.
The water and sanitation master plan is
completed and used by the user sub-
directorate. The process of getting it
approved by the Council is currently
underway.
Electricity Master Plan
The master plan details the needs versus
the current situation. The master plan is
aligned to the IDP where all sector plans
were considered. This for both medium-
term and long-term. This master plan
outlines the impact on
consumers/communities and industry, and
includes an implementation plan which will
be dependant on funding sources.
The Electricity Master Plan was
completed.
Integrated Waste
Management Plan The overall aim of the IWMP is to set out the
direction required for the effective
An Integrated Waste Management
Plan has been adopted by Council in

88 | P a g e
Sector Plan Contribution to IDP Objectives Status
(IWMP) management of waste within SPLM that will
result in activities that will not only align
those activities with the legislative
compliance required but will have a
positive effect on the health and wellbeing
of communities and the environment.
The IWMP addresses the following focus
areas:
o Review the current routes of collection
and implement a cost effective and
sustainable system of collection in all
areas within SPLM.
o Ensuring a positive impact on the health
of communities.
o Limiting the impact on the environment.
o Compliance with relevant legislation.
o Encouraging community participation
through mobilization, education and
awareness programmes.
o Proper management of the refuse
disposal site so as to ensure legislative
compliance and limited impact on the
health of communities and the
environment.
o Proper and effective monitoring and
control of all processes.
o Facilitation of effective waste
minimization projects through recycling,
avoidance, reduction and proper
disposal with the focus on
entrepreneurship development.
o Implementation of resources required
and the effective management thereof.
o Prevention of air, water and soil
pollution.
o Effective law enforcement.
o Eradicate illegal dumping and littering
on municipal, public and private
property.
October 2011 and program/projects
emanating from this plan have been
included in the 5-year Action Plan of
this IDP. Kwezi V3 Consultants was
appointed to review the Plan, which
was finalized in 2018 and only council
approval is still outstanding. Upon
approval the plan will be submitted to
the MEC.
Integrated
Environmental
Management Plan
(IEMP)
The IEMP presents an IDP sector plan, which
strives to achieve the following:
o To ensure that municipal development
strategies and projects take cognisance
of:
Existing environmental problems and
threats; and
Environmental assets;
o To ensure that the Chapter 1 principles
of the National Environmental
The Environmental Status Quo
document (IEMP Volume 1), has been
completed in Jan 2012 and takes stock
of the environmental profile of SPLM in
terms of the current state of the
Municipality’s environmental features
and their associated issues.
Volume 2 of the IEMP provides the
strategic framework and interventions
for addressing prioritised environmental
issues and harnessing the potential of
natural assets. Volume 2 has been

89 | P a g e
Sector Plan Contribution to IDP Objectives Status
Management
Act (Act No. 107 of 1998) are applied
when:
Strategies are designed; and
Projects planned;
To ensure a healthy environment by
ensuring that:
Urgent environmental issues are
addressed; and
Envisaged projects have no
negative impacts on the natural
environment.
completed in Mar 2012.
The municipality does not have an
Environmental Unit at present.
Municipal
Infrastructure
Investment Framework
(MIIF) and Capital
Expenditure
Framework (CEF)
The Municipal Infrastructure Investment
Framework should address the following
critical issues:
o Bulk Infrastructure requirements
(electricity, water, sanitation, waste
disposal and transport network)
o Infrastructure network (reticulation)
requirements (electricity, water,
sanitation, roads, waste management –
telecom and IT)
o Replace and refurbish existing and
ageing Infrastructure (electricity, water,
sanitation, solid waste disposal and the
transport network. Upgrade and extent
the existing IT and telecom infrastructure
network
o Provide sufficiently for infrastructure
operations and maintenance
requirements (electricity, water,
sanitation, solid waste disposal, roads,
storm water and the IT and telecom
networks)
Central government have proposed a
new capital funding model, with the
intention of consolidating all its funding
streams. This is effected through the
Capital Expenditure Framework (CEF).
Although the intention of CEF is not to
replace MIIF, but has similar features.
Municipality has approved CEF, which
will dovetail with MIIF when it is
developed and completed.
Due to the seriousness of the bulk
infrastructure backlogs the Municipality
continues to implement
recommendations of the feasibility
study that quantified the actual
infrastructure backlog and came up
with a funding model. The feasibility
study focused on critical infrastructure
delivery such as water, sanitation and
electricity capacity.
The already developed master plans
for water, sanitation and electricity shall
provide crucial stepping stones towards
the MIIF
Institutional Plan
The SPLM’s Institutional Plan will address:
o A revised HR Policies and Procedures
Handbook were prepared.
o An assessment of changes required to
Macro and Micro Organisational
Structure was completed and
proposals on the “to be”
Organisational Structure were drafted
o A draft Human Resource Strategy
Report was prepared.
Linked to the above process an assessment
was also done on the strengths and
weaknesses of the current Sol Plaatje
Municipal Political Governance Model and
it was revised in line with relevant
legislation.
As part of its Turnaround Strategy and
OPCAR the Sol Plaatje Municipality has
identified Institutional Building as a key
focus area in line with the National
Local Government Turnaround Strategy
and Outcomes Based. An institutional
overview indicated the critical
interventions that were required in this
area and has been included in a draft
plan which is in its approval phase.
Although a single Institutional Plan is not
in place – the institutional plan is
effectively contained in the HR policies,
the reviewed Organisational Structure
as well as the HR Plan.

90 | P a g e
Sector Plan Contribution to IDP Objectives Status
Financial Plan
The Financial Plan should define sound
financial management and expenditure
control as well as means of increasing
revenues and external funding for the
Municipality to achieve its development
priorities and objectives. It will further
address:
Revenue raising strategies
o Asset management strategies
o Financial management strategies
o Capital financing strategies
o Strategies that will enhance cost-
effectiveness
o Operational financing strategies
The Long Term Financial Plan was for
the period 2017/18 to 2026/27 and was
finalized in December 2018. All
strategies for financial plan are
available.
SPM has developed a Capital
Expenditure Framework (CEF) which will
assist the municipality in allocating
funds to previously disadvantaged
areas. The CEF is a comprehensive,
high level, long-term spatial
infrastructure plan which is underpinned
by a 10 year financial plan.
Integrated Human
Settlement Plan
The aim of the IHSP is to identify the
location and nature of specific housing
projects in the greater SPLM area, the
combined effect of which is to meet the
net housing need in the area, insofar as
possible within the strategic framework of
the SPLM IDP, taking into account the
realities of development on the ground.
The IHSP should be read with the IDP which
remains the principal strategic planning
instrument which guides and informs all
planning and development and all
decisions with regard to planning,
management and development in the
municipality.
An IHSP has been adopted by Council
in October 2011 and is due for review.
The National Upgrading of Informal-
Settlements program assist the
categorization and the implementation
of the upgrading plans viz Relocation,
In Situ or Infill upgrading plans. We
identified 31 Informal-settlements of 20
are fully upgraded for residential
purposes 11 are outstanding due to
funding to complete the others with
additional 6 recently areas invaded.
The IHSP is part of the efforts to deal
with the Human-settlements Backlog in
terms of the different housing programs,
viz Social Housing, BNG, CRU’s and
FLISP. {Gap Market}
Ward Based Plans
Practical implementation plans should be
prepared for each ward to include the following
– in order to create sustainable livelihoods:
o One needs to develop a “pro-forma” for
these plans – they need to address the
same things, follow the same process and
look the same.
o The plan needs to provide some
community perspective/back ground, a
statement of needs and then a plan.
o The plan needs to address 1-year, 3-year
and 5-year needs.
o All service and functional areas need to be
addressed.
o A useful planning and monitoring tool to
use is a matrix. The matrix effectively links
plan, budget, responsibility and
performance in one document/page.
o The plan should also be illustrative.
A draft ward based planning model is
in plan. The practical implementation
of this model is still a challenge due to
various factors – the most important
being that the issue of outdated sector
plans in all infrastructure areas should
be addressed before effective ward
based planning can be done. Ward
priorities are however sources from the
various ward councilors and these
priorities are listed earlier in this
document

91 | P a g e
5.2 THE LOGIC OF SECTOR PLANS
Through the development of a Growth and Development Strategy SPLM will also be in a position to
transform the current policy framework (including the sector plans) into one that is integrated,
coherent, strategic and user-friendly. A strategic user friendly document can be produced through
the GDS process that integrates and references all municipal plans, strategies and programmes
related to the SPLM’s long term integrated space-economic vision and goals. This will result in the
“logic of sector plans”. This is illustrated in the diagram below – which follows a logic sequence.
Figure 10: Logic of Sectoral Plans
From the illustration above SPLM should:
In the first instance look at how it can, on a local level, contribute towards the
national development outcomes in creating integrated cities that include social
cohesion.
Secondly, how it can ensure an enabling environment for local economic
development, and
Thirdly, how it can contribute towards environmental sustainability.
The three above mentioned national strategic objectives (which also aligns to the principles of
sustainable development) can be achieved by utilising the “logic of sector plans”, in the absence
of a Growth and Development Strategy, as illustrated above:

92 | P a g e
Step 1: The Spatial Vision
Everything happens in a space. The above objectives therefore need to be spatially organised.
Section 26(e) of the Local Government: Municipal Systems Act, No. 32 of 2000 (the “MSA”) requires
all municipalities to compile Spatial Development Frameworks (the “SDF”) as a core component of
Integrated Development Plans (the “IDP”). It is therefore important that the SPLM has a Spatial
Development Framework in place that will ensure an integrated and optimal spatial development of
the City and its surrounding areas. SDF will give effect to National, Provincial and Municipal Planning
and Alignment of the strategic frameworks of other spheres as well as sector plans i.e. Housing Sector
Plan.
The NDP, for instance, stresses the importance of a strong and efficient spatial planning system, well
integrated across the spheres of government. In this endeavour it promotes the following actions:
Reforms to the current planning system for improved co-ordination (SPLUMA is one
example).
Develop a strategy for densification of cities and resource allocation to promote
better located housing and settlements.
Substantial investment to ensure safe, reliable and affordable public transport.
Introduce spatial development framework and norms, including improving the
balance between location of jobs and people.
Conduct a comprehensive review of the grant and subsidy regime for housing with a
view to ensure diversity in product and finance options that would allow for more
household choice and greater spatial mix and flexibility. This should include a
focused strategy on the housing gap market, involving banks, subsidies and employer
housing schemes.
National spatial restricting fund, integrating currently defused funding.
Establish a national observatory for spatial data and analysis.
Provide incentives for citizen activity for local planning and development of spatial
compacts.
Introduce mechanisms that would make land markets work more effectively for the
poor and support rural and urban livelihoods.
Step 2: Social, Economic and Environmental Vision
This step elaborates on the detail within the Spatial Vision namely to articulate the social -, economic
-, and environmental vision through the following strategic plans, namely:
An Integrated Human Settlement Plan
A Local Economic Development Plan
An Environmental Management Plan
These plans need to articulate in detail how SPLM will transform its human settlements as envisaged
by both the NDP and B2B in order for it to be socially and economically integrated and
environmentally sustainable within the Spatial Vision.
These plans are especially important as it is the strategic priorities that should inform the
Municipalities actions and allocation of resources. The B2B especially emphasises the output and
impact of these plans.

93 | P a g e
Step 3: Input Sector Plans
This step refers to the input that is necessary to realise the strategic plans mentioned in Step 2. It is the
actual action plans that deal with the infrastructure and services such as:
Integrated Waste Management Plan
Integrated Transport Plan
Integrated Energy Plan
Integrated Water Services Development Plan
The important aspect of these plans are that they should include specific projects with time frames
and budgets (including funding sources).
Step 4: Strategy Support Plans
The strategy support plans is complementary to the input plans and deal specifically with disaster
management and a Municipal Infrastructure Investment Framework (MIIF).
Step 5: Financial Strategy/Plan and Institutional Plan
The last step in the sequence of the “logical sector plans” is the resources needed to implement
these plans. At this stage the Municipality is aware of what it needs to implement to achieve its goals
and objectives and therefore need to allocate the necessary resources, which will include:
The Financial Strategy/Plan
The Institutional Plan (Human Resources)
By following the above process SPLM will ensure that it structurally addresses all the issues related to
what is envisaged in the NDP and B2B.
As part of the implementation framework of the GDS SPLM also needs to explore new funding
alternatives apart from the traditional sources of funding, as illustrated below in order to achieve its
development goals.
Figure 11: Alternative Funding Methodologies

94 | P a g e
Sound financial management is integral to the success of local government.
Performance against the following basic indicators will be constantly assessed:
o The audit opinions for the last three to five years.
o Whether the budgets are realistic and based on cash available.
o The percentage revenue collected.
o The extent to which debt is serviced.
o The efficiency and functionality of supply chain management.

95 | P a g e
CHAPTER 6: MONITORING OF THE IDP AND BUDGET
The IDP’s Multi-year Municipal Performance Plan will inform the 2020/21 SDBIP which aligns with both
the Capital and Operational Budget. KPI’s and targets cannot be set if resources are not available.
Resources refer to both institutional capacity as well as financial capacity.
The Capital Budget is attached in the schedules while the Operational Budget is contained in the
Budget Statement. The Capital Budget is included in the IDP as it speaks directly to LED, Infrastructure
Development and Service Delivery outputs while the Operational Budget mainly addresses the
activities which produces the outputs.
SPLM’s SDBIP for 2020/21 will be completed after the public consultation process as priorities may be
adjusted due to this process. The SDBIP will submitted to the Executive Mayor by Mid-May for
approval and submission to Council at the same time as the submission of the IDP and Budget for
adoption.
The SDBIP gives effect to the implementation of the IDP and Budget of the Municipality. The IDP
Objectives, Key Performance Indicators and Targets aligned to the Budget within each Key
Performance Area in the Multi-Year Municipal Performance Plan will then inform the SDBIP for the
2020/21 financial year and breaks it up into quarterly targets.
The “top layer” SDBIP is used as a framework for the Organizational Performance Management
System. The implementation of the IDP and Budget is monitored, evaluated, reported and measured
through the integrated Performance Management System (PMS) to ensure that the resources
available to the Municipality are directed at the delivery of prioritized projects, programs and
operations that meet the agreed IDP Objectives. Monitoring, evaluating, measuring and reporting
performance will also assist the Municipality:
To make immediate and appropriate changes in the prioritized delivery process and
to adjust resources accordingly;
Identify and overcome major or systemic blockages in the delivery process and
Guide future planning on development objectives and resource use.
The PMS process from planning through in-year monitoring and reporting up to the Annual Report is
structured as per the figure below:

96 | P a g e
Figure 12: IDP/Budget/PMS Linkage

ANNEXURE 1 – HIGH LEVEL PROCESS PLAN
IDP AND BUDGET TIME-SCHEDULE FOR PREPARING THE IDP REVIEW 2019/20 AND
BUDGET FOR 2020/21 MTREF
NO ACTIVITY DESCRIPTION ORGANISATIONAL RESPONSIBILITY
OUTPUT
LEGISLATIVE REQUIREMENT
AND INFORMATION
TIME FRAME
JULY 2019
1 Briefing sessions with EMT to initiate the Annual Report and Annual Audit processes
MM/CFO Process Plan to complete the Annual Report and Annual Audit (Audit File process)
Internal process Done
2
Consideration of the IDP and Budget Process Plan 2020/21 MTREF
MM/CFO/EMT Process Plan for the 2019/20 IDP Review and Budget for 2020/21 MTREF
MSA 32 of 2000 & MFMA No. 56 of 2003
30 July 2019
3 Conclude MM and s57 Managers Performance Agreements and Plans
MM/Mayco/Corporate Services ED
Signed Performance Agreements and Plans for MM and s 57 Managers
MSA and Reg 805 31 July 2019
4
Submit 4th Quarter to: 1. EMT 2. NT/PT 3. EM/IDP Budget Com 4. Submission of Section
52 (d) Report to Council
All 4th Quarter Report 2018/19
MFMA S52(d) 31 July 2019
AUGUST 2019
5
Tabling of the approved (by the Budget Steering Committee) IDP and Budget Process Plan
IDP, Budget and PM Committee (Sec 80 Committee)
Recommend the approval of the IDP and Budget Process Plan to Council
Terms of Reference of the Committee (Oversight Committee on IDP, Budget and Performance Management and Reporting)
1 August
6 Approval of the IDP and Budget Process Plan
Executive Mayor Executive Mayor endorses the IDP and Budget Process Plan for 2020/21 MTREF
MSA 32 of 2000 & MFMA No. 56 of 2003
7 August 2019
7
Publish MM and 57 Managers Performance Agreements and Plans on Web and submit to CoGHSTA, NT and PT
Corporate Services
Published and submitted performance agreements and plans
MSA and Reg 805 7 August 2019
8 Constituting the IDP/Budget Steering Committee
MM/CFO Legally constituted IDP/Budget Steering Committee
MFMA s53(1) 30 August 2019
9
Submit Annual Report including Annual Financial Statements and Annual Performance Report to the Audit Committee
MM/CFO
Submission of annual financial statements as per section 126(1) of the MFMA. Draft Annual Performance Report 2018/19 as per section 46 of the MSA.
MFMA Circular 63, Sep 12
31 Aug 2019
10 Approval of the IDP and Budget Process Plan
Executive Mayor Council approves the IDP and Budget Process Plan 2020/21 MTREF
MSA 32 of 2000 & MFMA No. 56 of 2003
31 Aug 2019
11
Submission of the Financial Statements, Annual Report and Annual Performance Report to the AGSA
MM/CFO Submission of signed AFS, Draft Annual Report and Final Annual Performance Report to AGSA
31 Aug 2019

2 | P a g e
IDP AND BUDGET TIME-SCHEDULE FOR PREPARING THE IDP REVIEW 2019/20 AND
BUDGET FOR 2020/21 MTREF
NO ACTIVITY DESCRIPTION ORGANISATIONAL RESPONSIBILITY
OUTPUT
LEGISLATIVE REQUIREMENT
AND INFORMATION
TIME FRAME
12
Advertisement of time-schedule on website, local newspapers and notice boards
IDP/BTO
Notification to public on how and when the IDP and Budget preparation process 2020/21 will happen
MSA and MFMA 31 Aug 2019
SEPTEMBER 2019
13 Issue of Budget guidelines (operational budget)
CFO
Issue Circular on operational budget guidelines:
- Confirm approved organogram
- Vacant and funded positions
- Maintenance Plans - Review of Long Term
Borrowing Contracts and commitments of the next MTREF
- Demand for services analysis
- Review of Electricity Tariff Structure
Budget Policy 20 Sept 2019
14
Commencement of IDP analysis of institutional, services and infrastructure provision, backlogs and priorities.
IDP/BTO
Assessment Report: An assessment of existing Priority Issues, present Gaps in the IDP as well as issues identified in various government policy documents, engagements with political structures, provincial CoGHSTA, NT and other stakeholders. Unaudited Annual Report 2018/19 as submitted to Auditor-General to be used as input into the IDP strategic phase process and community verification & input by MPAC on reported performance.
MSA Circular 63, Sep 2012 MSA Ch5 s 26 and IDP Guidelines
20 Sept 2019
15 Finalise Assessment Report IDP/BTO
Discuss and agree on Assessment Report to inform planning and budget for the 2020/21 MTREF 1. EMT / Manco
MFMA/Budget Regulations and Internal process
20 Sep 2019 27 Sep 2019
16 Councillor Briefing IDP Review Process
MM/Executive Mayor
Review terms of reference of IDP Rep Forum Understanding the development agenda of the municipality Presentation of the status quo report 2019-2020 Performance Analysis and future projections
MSA and MFMA 27 Sept 2019

3 | P a g e
IDP AND BUDGET TIME-SCHEDULE FOR PREPARING THE IDP REVIEW 2019/20 AND
BUDGET FOR 2020/21 MTREF
NO ACTIVITY DESCRIPTION ORGANISATIONAL RESPONSIBILITY
OUTPUT
LEGISLATIVE REQUIREMENT
AND INFORMATION
TIME FRAME
OCTOBER 2019
17
Finalise Annual Report
EMT
The Annual Report submitted complies with the requirements of Section 121(3) (a-k). Information on pre-determined objectives to be included Note: that it is unaudited and will not include any of the Auditor-General’s reports as the auditing thereof will still be in progress
MSA Circular 63, Sep 2012
18 Oct 2019
18
Municipality submits Annual Report including final annual financial statements and annual performance report to Auditor-General for auditing councils’
CFO/IDP 31 Oct 2019
19
Liaise with National and Provincial Sector Departments re alignment of Strategic Priorities and Budgets
IDP Task Teams
Liaise with sector departments to ensure that SPM priorities form part of their strategic plans and budgets
MSA Oct 2019 – Dec 2019
20
Prepare and submit 1st Quarter SDBIP Report to EMT, IA, PAC, Executive Mayor (Mayco) and Council
IDP/BTO 1st Quarter Report 2019/20 submitted
MFMA and MFMA Cir 15
18 Oct 2019 (EMT) 1. 22 Oct 2019
(IA&PAC) 2. 25 Oct 2019
(EM) 3. 6 Nov 2019
(SCM)
21
1st Strategic Planning sessions with: 1. EMT, Manco
Extended IDP/Budget/PMS Committee Informal Council meeting
EMT/Manco/IDP Com/Council
Finalising Key Priority Issues related to Assessment Report. Review Strategic Objectives for service delivery and development including backlogs aligned to district, provincial and national strategic plans and policies. Review financial and non-financial performance, analyse gaps between planned and actual performance. Determine financial position and assess financial/human resource capacity against possible future strategies.
Internal Process
1. 22 Oct 2019
2. 23 Oct 2019
NOVEMBER 2019
2. Extended IDP/Budget/PMS Committee
06 Nov 2019

4 | P a g e
IDP AND BUDGET TIME-SCHEDULE FOR PREPARING THE IDP REVIEW 2019/20 AND
BUDGET FOR 2020/21 MTREF
NO ACTIVITY DESCRIPTION ORGANISATIONAL RESPONSIBILITY
OUTPUT
LEGISLATIVE REQUIREMENT
AND INFORMATION
TIME FRAME
Informal Council meeting
22 Detail Budget discussions/motivation with individual Directorates
EMT/Manco
In line with the IDP Key priority issues Directorates need to motivate their different Budgets for the 2020/21 MTREF Draft Budget completed
Internal process
Week of 04, 11 and 18 Nov 2019 (CFO and BTO done; Operational, Revenue and partly Capital)
23
Auditor-General audits the unaudited Annual Report and submit an audit report to the accounting officer for the municipality.
EMT/BTO /Directorates
Draft AR 2018/19 and Management Report Final AR and Management Report
MFMA
15 Nov 2019 29 Nov 2019
24
Annual Report and oversight report process for adoption to be used as input into public participating meetings for the IDP review process.
AC/MPAC/Council MFMA Section 127, 128, 129 and 159
Nov 2019 to Jan 2020
JANUARY 2020
25
Mayor tables audited Annual Report and financial statements to Council Audited Annual Report is made public, e.g. posted on municipality’s website.
EM Web Master
Section 129, 150 and 151. Tabling the audited Annual Report within 5 or 6 months after the end of the financial year. Section 75 for publication on website.
22 Jan 2020
26
Finalise Mid-year Budget and Performance Assessment Report 2019/20 and submit to: 1. EMT 2. BSC 3. Mayor 4. NT and PT 5. Council
IDP/BTO Mid-year Report with recommendations informing Adj Budget/SDBIP Targets
MFMA s72
29 Jan 2020
1. 16 Jan 2020 2. 23 Jan 2020 3. 23 Jan 2020 4. 29 Jan 2020 5. 29 Jan 2020
FEBRUARY 2020
27 MPAC finalises assessment on Annual Report.
MPAC
This must be concluded within 7 days of receipt of AGs report. Council is expected to conclude on this matter before going on recess in December.
MSA Circular 63, Sep 2012
Feb to Mar 2020 (Oversight)

5 | P a g e
IDP AND BUDGET TIME-SCHEDULE FOR PREPARING THE IDP REVIEW 2019/20 AND
BUDGET FOR 2020/21 MTREF
NO ACTIVITY DESCRIPTION ORGANISATIONAL RESPONSIBILITY
OUTPUT
LEGISLATIVE REQUIREMENT
AND INFORMATION
TIME FRAME
28
Planning sessions with: 1. Extended
IDP/Budget/PMS Committee
2. Informal Council meeting
Mayco Councillors EMT Manco
Present first draft IDP 2020/21priorities linked to Budget allocations
Internal process
1. 03 Feb 2020 2. 05 Feb 2020
29 NT Mid-term visit EMT
Sec 71 and 72 Reports Qtr 2 Performance Report 2019/20 Audited AFS 2018/19 Audit Report MFMA Sec 32 Report Risk Management Issues
NT Prescribed
Between 11-15 Feb 2020
30
Adjustment Budget 1. EMT 2. BSC 3. Council
MM/CFO Tabling of Adjustment Budget 2019/20 MTREF
MFMA Sec 28 1. 17 Feb 2020 2. 24 Feb 2020 3. 26 Feb 2020
31
Conduct 2018/2019 annual performance assessments for MM and Managers reporting directly to MM as well as lower level managers up to job level 6
EM/MM/IDP/Human Resources
Performance Assessment Reports for MM, senior and other managers
MSA and Regulations
Feb 2020
32 Note National/Provincial Government Budget for incorporation
IDP/BTO
Ensure what is contained in National and provincial Budgets for incorporation in local budget
MFMA 25 Feb – 18 Mar 2020
33
Draft reviewed 5-year Capital Project Schedule aligned with IDP Strategic Objectives and KPA’s for prioritisation purposes – including Ward allocations submitted to EMT
IDP/Budget Office
Draft 5-year Capital Programme 2020/21 aligned to IDP Key Priority Issues including Ward priorities Internal Process
Jan 14 – 11 Mar 2020
34 Draft Operating Budget submitted to EMT
Directorates/BTO/ IDP
Draft 3-year Operational Budget aligned to IDP Key Priority Issues
Internal Process 04 Mar 2020
MARCH 2020
35
Conduct Mid-year 2019/20 performance assessments for MM and Managers reporting directly to MM as well as lower level managers up to job level 6
EM/MM/IDP/Human Resources
Performance Assessment Reports for MM, senior and other managers
MSA and Reg 805 Mar 2020
34
1. Council adopts Oversight report.
2. Oversight report is made public.
3. Oversight report is submitted to Legislators, Treasuries and
Council CFO
The entire process, including oversight reporting and submission to provincial legislators is completed in December and not in March the following year.
MSA Circular 63, Sep 2012
25 Mar 2020 (SCM)

6 | P a g e
IDP AND BUDGET TIME-SCHEDULE FOR PREPARING THE IDP REVIEW 2019/20 AND
BUDGET FOR 2020/21 MTREF
NO ACTIVITY DESCRIPTION ORGANISATIONAL RESPONSIBILITY
OUTPUT
LEGISLATIVE REQUIREMENT
AND INFORMATION
TIME FRAME
CoGHSTA
35
Present and discuss draft IDP and Budget with: 1. Mayco/relevant
committees 2. BSC 3. Informal Council
Meeting 4. Special Council
Meeting
EMT/Mayco/Budget Steering Committee
Present, discuss and receive input from the different structures
Internal process
1. 10 – 14 Mar
2020 2. MAYCO 18
Mar 2020 3. Informal
Council 24 Mar 2020
4. SCM 25 Mar 2020
36 Table draft IDP and Budget 2020/21 to Council for public consultation
IDP/BTO/Council Council to approve IDP and Budget for public consultation purposes
MSA and MFMA 31 Mar 2020 (Tabling)
37
Make public the draft IDP and Budget and submit (including draft SDBIP) to NT, PT and NC CoGHSTA
IDP/BTO/Council
IDP and Budget made public and submitted to relevant stakeholders for consultation purposes
MFMA 31 Mar 2020
APRIL 2020
38
Conduct public hearings on draft IDP, Budget and Top Layer SDBIP with constituted public participation structures
IDP/BTO/Speaker’s Office/Service Providers
Consult and receive input from community and stakeholder groupings with regard to draft IDP/Budget and SDBIP (Top Layer)
MSA and MFMA April 2020 (Public Participation)
39 Confirm National and Provincial DoRA allocations and adjust draft budget
BTO Ensure that DoRA allocations are included in the Budget MFMA/DoRA April 2020
40 Submit 3rd Quarter SDBIP 2019/20 Performance Report to Mayco/Council
IDP/BTO/Mayco/ Council
3rd Quarter report submitted April 2020
41
Conclude public hearings and adjust IDP, Budget and SDBIP taking cognisance of input received
IDP/BTO
Include input received from public consultation in IDP/Budget/SDBIP 2020/21
MSA and MFMA April 2020
42 Discuss adjusted IDP, Budget and SDBIP with Mayco
IDP/BTO
Inform Mayco of input received from public consultation in IDP/Budget/SDBIP
Internal process 28 April 2020
43 National Treasury Benchmarking Exercise
EMT/NT
NT’s analysis of SPLM’s IDP and Budget 2020/21 benchmarked against 21 secondary cities to improve IDP and Budget processes and products
MFMA April 2020
MAY 2020
44 Finalise IDP/Budget and SDBIP documentation for final submission to Council
EMT Finalise IDP, Budget and SDBIP 2020/21 documentation for final submission to Council
MSA and MFMA 06 May 2020
45 Present final IDP and Budget to BSC, Mayco and Council
EM/MM/CFO
Present final IDP/Budget/SDBIP 2020/21 to Mayco and informal Council before submission to Council for adoption
Internal process
BSC 13 May 2020 MAYCO 19 May 2020 Informal Council Meeting 26 May 2020

7 | P a g e
IDP AND BUDGET TIME-SCHEDULE FOR PREPARING THE IDP REVIEW 2019/20 AND
BUDGET FOR 2020/21 MTREF
NO ACTIVITY DESCRIPTION ORGANISATIONAL RESPONSIBILITY
OUTPUT
LEGISLATIVE REQUIREMENT
AND INFORMATION
TIME FRAME
SCM 27 May 2020
46
Council adopt IDP, Budget and “Top Layer” SDBIP by resolution, setting taxes and tariffs, approving changes to the IDP and budget related policies, approve measurable performance objectives for revenue by source and expenditure by vote before the start of the financial year
EM/MM/CFO Council adopted IDP/Budget and SDBIP 2020/21
MFMA 24 May 2020
JUNE 2020
47
Notification of approved 2019/20 IDP review and Budget 2020/21 MTREF to public
BTO/IDP Notify public of adopted budget MFMA June 2020
48
Submit final 2020/21 SDBIP to Executive Mayor for approval, submit to Council for Notification and Make public
IDP Executive Mayor approved SDBIP and published SDBIP
MFMA 16 June 2020
49
Final Preparations for the implementation of mSCOA Version 6.4 (locked NT version)
BTO mSCOA compliance mSCOA Regulations
26 June 2020

8 | P a g e
ANNEXURE 2 – PUBLIC PARTICIPATION PROGRAM
SOL PLAATJE MUNICIPALITY
“Don’t ask what the City can do for me?
Rather ask, “what can I do for my City?”
“Let’s work together to make
Sol Plaatje Municipality Great Again”
In accordance with the Municipal Systems Act (Chapter 5) and Municipal Finance Management Act (Chapter 4), notice is hereby given that the Draft Integrated Development Plan (IDP) and Budget for 2020/ 21 for the Sol Plaatje Municipality. In light of the stipulation on the prohibition of public gatherings and assemblies, regulated under level 5-3, the municipality has embarked on alternative methods of engaging the public and its stakeholders on the 2020/2021 budget and IDP cycle. The Sol Plaatje Municipal Council will be engaging the community and the stakeholder groupings via radio panel interviews and virtual meetings. Below is the time schedule for these engagements as well as the public participation. Copies of these documents will be available at all municipal libraries as well as the Council Civic Centre (Information Counter and Budget Office) for public inspection. The information will also be published on the Municipality’s website – www.solplaatje.org.za

9 | P a g e
Public Participation Program Stakeholder Engagements
Date Forum / Ward Venue Time Municipal Representative
30.06.2020
Organized Business (NOCCI),
Kimberley Local Developers
(KLD), Sol Plaatje Community
Forum (SPCF), NGO, SCHOOLS,
Institutions of Higher Learning,
PBO, Churches
Radio Revival FM
09H00
FINANCE:
Mr. KENNETH SAMOLAPO.
On special request: The Executive Mayor;
The CFO; MM
Convener: Ms T Riet
General Public Participation
04.06.2020
All 33 Wards within the Sol
Plaatje Municipal Jurisdiction
Radio Revival FM
09H00
FINANCE:
Mr. KENNETH SAMOLAPO.
Mr. JJ Wagner
On special request: The Executive Mayor;
The CFO; MM
Convener: Ms T Riet
09.06.2020
All 33 Wards within the Sol
Plaatje Municipal Jurisdiction
Radio Revival FM
09H00
FINANCE:
Mr. KENNETH SAMOLAPO.
INFRASTRUCTURE:
Ms GAIL JELE,
Mr. NDUDUZO ZWANE
Mr. ZUGHDI ADIKARY
On special request: The Executive Mayor;
The CFO; MM
Convener: Ms T Riet
11.06.2020
All 33 Wards within the Sol
Plaatje Municipal Jurisdiction
Radio Revival FM
09H00
FINANCE:
Mr. KENNETH SAMOLAPO.
INFRASTRUCTURE:
Ms GAIL JELE,
Mr. NDUDUZO ZWANE
Mr. ZUGHDI ADIKARY
On special request: The Executive Mayor;
The CFO; MM
Convener: Ms T Riet
18.06.2020
All 33 Wards within the Sol
Plaatje Municipal Jurisdiction
Radio Revival FM
09H00
FINANCE:
Mr. KENNETH SAMOLAPO.
INFRASTRUCTURE: Ms GAIL JELE, Mr. NDUDUZO ZWANE Mr. ZUGHDI ADIKARY On special request: The Executive Mayor;
The CFO; MM
Convener: Ms T Riet

10 | P a g e
Stakeholder Engagements
Date Forum / Ward Venue Time Municipal Representative
23.06.2020
All 33 Wards within the Sol
Plaatje Municipal Jurisdiction
Radio Revival FM
09H00
FINANCE:
Mr. KENNETH SAMOLAPO.
COMMUNITY SERVICES: Ms T Marupong, Mr. M Mazzoncini Mr. D Letebejane On special request: The Executive Mayor; The CFO; MM Convener: Ms T Riet
25.06.2020
All 33 Wards within the Sol
Plaatje Municipal Jurisdiction
Radio Revival FM
09H00
FINANCE: Mr. KENNETH SAMOLAPO. SEDP: Mr N Modiba On special request: The Executive Mayor; The CFO; MM Convener: Ms T Riet
Interested parties, local community and all stakeholders are invited to submit representations, comments and inputs regarding the Draft Budget 2020/21.

11 | P a g e

12 | P a g e

ANNEXURE 3 MULTI YEAR CAPITAL PLAN
PROJECT DESCRIPTION ESTIMATED TOTAL
COST
RESPON
SIBLE
2017/18 2018/19 2019/20 2020/21 2021/22 2022/23 Beyond 5 Years
Funded and
included in
capital budget
WATER AND SANITATION PROJECTS
LINKING SERVICES - BULK WATER LERATO PARK 20 783 414.00 SPLM MIG 8 402 274 8 796 308 a
CRR 3 584 832 a
LINKING SERVICES - BULK SANITATION LERATO PARK 16 839 176.00 SPLM MIG 6 558 321 7 370 383 a
CRR 2 910 472 a
GOGGA PUMP SEWER OUTFALL MAIN 28 500 000.00 SPLM WSIG CRR 28 500 000 a
RITCHIE BULK WATER (ABSTRACTION AND DISTRIBUTION) 30 551 000.00 SPLM RBIG/MIG 20 000 000 10 551 000 a
RIVERTON PUMP STATION BUILDING 31 657 205.00 SPLM CRR 31 657 205 a
RIVERTON HIGH LIFT PUMPS (MECHANICAL AND ELECTRICAL
WORKS) 6 096 300.00 SPLM CRR 6 096 300 a
CARTERS RIDGE SEWER PUMP STATION 3 000 000.00 SPLM WSIG 3 000 000 a
CARTERS RIDGE SEWER PUMP STATION 32 000 000.00 SPLM 10 000 000.00 15 000 000 7 000 000 NOT FUNDED
RECONSTRUCTION OF OLD SINK TOILETS IN KHUTLANONG 14 000 000.00 SPLM WSIG 14 000 000 a
REFURBISHMENT OF SEWER PUMPS VARIOUS WARDS 12 000 000.00 SPLM MIG 5 000 000.00 7 000 000 a
REFURBISHMENT OF SEWER PUMPS VARIOUS WARDS 2 400 000.00 SPLM CRR 1 000 000.00 1 400 000 a
PIPE REPLACEMENT (water mains) 20 000 000.00 SPLM MIG 5 000 000 5 000 000 10 000 000 a
PIPE REPLACEMENT (water mains) 3 000 000.00 CRR 1 000 000 2 000 000 a
PIPE REPLACEMENT (water mains) UNFUNDED PORTION 317 000 000.00 SPLM MIG CRR 30 000 000 30 000 000 30 000 000 50 000 000 200 000 000 NOT FUNDED
PIPE REPLACEMENT (sewer mains) 310 000 000.00 SPLM MIG CRR 25 000 000 25 000 000 25 000 000 25 000 000 210 000 000 NOT FUNDED
RIVERTON SUMP RESERVOIR 30 000 000.00 SPLM RBIG/MIG 10 000 000 10 000 000 10 000 000 NOT FUNDED
BULK WATER RISING MAIN 100 000 000.00 SPLM RBIG/MIG 30 000 000 30 000 000 30 000 000 10 000 000 NOT FUNDED
REPLACEMENT OF WEST END/TAMBO SQUARE SEWER OUTFALL
MAIN 13 000 000.00 SPLM RBIG/MIG 2 000 000 5 000 000 6 000 000 NOT FUNDED
UPGRADING OF SEWER PUMP STATIONS IN AND AROUND
GALESHEWE 50 000 000.00 SPLM MIG 10 000 000 20 000 000 10 000 000 10 000 000 NOT FUNDED
UPGRADE RIVERTON WATER TREATMENT PLANT 200 000 000.00 SPLM RBIG 20 000 000 30 000 000 30 000 000 50 000 000 70 000 000 NOT FUNDED
REVENUE AND BILLING ( WATER METERS) 14 000 000.00 SPLM CRR 2 000 000 3 000 000 3 000 000.00 3 000 000 3 000 000 a
WATER ZONE METERING 8 500 000.00 CRR 8 500 000 a
REPLACEMENT OF PIPES AT NEWTON RESERVOIR 11 200 000.00 SPLM CRR 11 200 000 a
NEWTON RESERVOIR EXTENDED PHASE 32 000 000.00 SPLM RBIG 10 000 000 10 000 000 12 000 000 NOT FUNDED
BEACONSFIELD WWTW 50 000 000.00 SPLM RBIG/MIG 20 000 000 12 000 000 12 000 000 6 000 000 NOT FUNDED
REFURBISHMENT OF ROODEPAN TOWER 20 000 000.00 SPLM CRR 10 000 000 6 000 000 4 000 000 NOT FUNDED
FUNDING SOURCE

2 | P a g e
PROJECT DESCRIPTION ESTIMATED TOTAL
COST
RESPON
SIBLE 2017/18 2018/19 2019/20 2020/21 2021/22 2022/23 Beyond 5 Years
Funded and
included in
capital budget
ELECTRICITY RELATED PROJECTS
CARTERS GLEN SUBSTATION/GALESHEWE BULK ELECTRICITY 12 336 500.00 DOE INEP 7 000 000 5 336 500 a
UPGRADE OF HADISON PARK SUBSTATION 35 000 000.00 DOE/SPLMINEP CRR 20 000 000 15 000 000 NOT FUNDED
UPGRADE OF GALESHEWE SUBSTATION WITH 2x 30 MVA
TRANSFORMERS 35 000 000.00 SPLM INEP 20 000 000 15 000 000 NOT FUNDED
UPGRADE OF SOUTH RIDGE SUBSTATION WITH 1X 30 MVA AND
EXTENSION OF 11KV SWITCHROOM 25 000 000.00 SPLM INEP CRR 10 000 000 15 000 000 NOT FUNDED
REDESIGN OF LOOPING NETWORK IN GALESHEWE 10 000 000.00 SPLM INEP 3 000 000 3 000 000 4 000 000 NOT FUNDED
RESTRUCTURE LANDBOU AVENUE 11KV OVERHEAD LINE 13 000 000.00 SPLM INEP 5 000 000 5 000 000 3 000 000 NOT FUNDED
UPGRADE OF SUPPLY IN CARTERS, LONG ,MEMORIAL, DU
TOITSPAN, MCDOUGAL 25 000 000.00 SPLM INEP CRR 10 000 000 8 000 000 7 000 000 NOT FUNDED
REPLACE 66KV OIL CIRCUIT BREAKERS WITH SF6 AT HERLEAR 13 000 000.00 SPLM INEP CRR 3 000 000 10 000 000 a
REPLACE 11KV CIRCUIT BREAKERS AT HERLEAR 9 000 000.00 SPLM INEP CRR 7 000 000 2 000 000 a
REPLACE TWO 11 KV RINGS FROM
HERLEAR/CASSANDRA/ERNSTVILLE 32 000 000.00 SPLM INEP CRR 16 000 000 16 000 000 NOT FUNDED
INSTALLATION OF LIGHTING AND SURGE ARRESTER EQUIPMENT
AT OVERHEAD LINES 3 500 000.00 SPLM INEP CRR 3 500 000 NOT FUNDED
UPGRADE OF 11KV SUBSTATIONS, MEDIUM AND LOW VOLTAGE
CABLES 28 000 000.00 SPLM INEP CRR 3 000 000 4 000 000 7 000 000 7 000 000 7 000 000 NOT FUNDED
UPGRADE OF MINIATURE SUBSTATIONS AND POLE
TRANSFORMERS, KIOSKS AND LOW VOLTAGE CABLES 30 000 000.00 SPLM INEP CRR 6 000 000 6 000 000 6 000 000 6 000 000 6 000 000 NOT FUNDED
UPGRADE RIVERTON SUBSTATION WITH 2x10 MVA
TRANSFORMERS 8 000 000.00 INEP CRR 4 000 000 4 000 000 a
LED/HIGH MAST LIGHTING 4 000 000.00 SPLM MIG 2 000 000 2 000 000 a
LED/HIGH MAST LIGHTING 560 000.00 CRR 280 000 280 000 a
LED/HIGH MAST LIGHTING (UNFUNDED PORTION) 8 000 000.00 MIG CRR 5 000 000 3 000 000
ELECTRIFICATION OF SG APPROVED ERVEN 123 794 000.00 DoE/ESKOMINEP 24 660 500 19 200 000 16 000 000 20 000 000 a
Electrification of Snake Park 949 20 000 000.00 14 709 500 a
Electrification of Platfontein 300 4 650 000.00 4 650 000 a
Electrification of Soul City 1 200 000.00
Electrification of Romorwa 106 2 000 000.00 1 643 000 a
Electrification of Mathibe “Fluffy Park” 49 1 000 000.00 759 500 a
Electrification of Witdam 2 500 000.00
Electrification of Santa Centre 139 2 500 000.00 2 154 500 a
Electrification of Golf Course 20 000 000.00
Electrification of Kutlwanong 48 744 000.00 744 000 a
FUTURE HOUSING PROJECTS
Riverton (formalise stands) 3 200 000.00
Begonia 2 000 000.00
France Farm 49 000 000.00
Ritchie Erf 2 & 12 15 000 000.00
ELECTRIFICATION OF IVORY PARK (1175) 97 343 000.00 DoE INEP 19 000 000 a
ELECTRICITY METER REPLACEMENT 14 000 000.00 CRR 2 000 000 3 000 000 3 000 000 3 000 000 3 000 000 a
UPGRADE POWER MONITORING EQUIPMENT AT STATIONS 1 000 000.00 CRR 1 000 000 NOT FUNDED
EEDSM STREETLIGHTING AND OWN BUILDINGS 17 000 000.00 EEDMS 7 000 000 5 000 000 5 000 000 a
FUNDING SOURCE

3 | P a g e
PROJECT DESCRIPTION ESTIMATED TOTAL
COST
RESPON
SIBLE 2017/18 2018/19 2019/20 2020/21 2021/22 2022/23 Beyond 5 Years
Funded and
included in
capital budget
ELECTRICITY RELATED PROJECTS
ELECTRIFICATION OF IVORY PARK (1175) 97 343 000.00 DoE INEP 19 000 000 a
ELECTRICITY METER REPLACEMENT 14 000 000.00 CRR 2 000 000 3 000 000 3 000 000 3 000 000 3 000 000 a
UPGRADE POWER MONITORING EQUIPMENT AT STATIONS 1 000 000.00 CRR 1 000 000 NOT FUNDED
EEDSM STREETLIGHTING AND OWN BUILDINGS 17 000 000.00 EEDMS 7 000 000 5 000 000 5 000 000 a
ROADS AND STORMWATER PROJECTS
ROADS RESEALING 38 706 600.00 SPLM MIG 10 748 507 11 203 418.00 16 754 675.00 a
ROADS RESEALING 12 000 000.00 SPLM CRR 8 000 000.00 4 000 000.00 a
ROADS RESEALING (UNFUNDED PORTION) 160 000 000.00 20 000 000 10 000 000.00 10 000 000.00 10 000 000.00 30 000 000 80 000 000 NOT FUNDED
PAVING OF ROADS 20 101 724.00 MIG 14 868 488 5 233 236.00 a
PAVING OF ROADS 2 667 000.00 SPLM CRR 2 667 472 2 950 713 4 000 000.00 a
GRAVEL ROADS 30 000 000.00 SPLM ES/CRR 6 000 000 6 000 000 6 000 000 6 000 000 6 000 000 NOT FUNDED
N12 BYPASS 200 000 000.00 DoT ITNG 4 000 000 15 000 000 100 000 000 50 000 000 31 000 000 NOT FUNDED
SANRAL INTERSECTIONS UPGRADE 80 000 000.00 DoT ITNG 8 000 000 72 000 000 NOT FUNDED
UPGRADING OF STORM WATER CHANNELS GALESHEWE 409 379 000.00 SPLM NDPG 97 537 000 151 699 000 154 447 000.00 5 696 000.00 a
ROADS AND STORMWATER UPGRADES VARIOUS WARDS 16 000 000.00 MIG 6 000 000.00 10 000 000.00 a
ROADS AND STORMWATER UPGRADES VARIOUS WARDS 2 840 000.00 CRR 840 000.00 2 000 000.00 a
THLAGENG RETENTION DAM 20 000 000.00 SPLM NDPG 20 000 000 a
ROODEPAN ACCESS ROADS 4 378 284.00 SPLM MIG 4 378 284 a
GALESHEWE ACCESS ROADS 7 005 542.00 SPLM MIG 7 005 542 a
FUNDING SOURCE

4 | P a g e
PROJECT DESCRIPTION ESTIMATED TOTAL
COST
RESPON
SIBLE 2017/18 2018/19 2019/20 2020/21 2021/22 2022/23 Beyond 5 Years
Funded and
included in
capital budget
ECONOMIC DEVELOPMENT, COMMUNITY SERVICES AND
OTHER PROJECTS
PLANNING AND SURVEYING OF ERVEN 13 000 000.00 SPLM CRR 2 000 000 5 000 000 3 000 000.00 3 000 000 a
ROODEPAN SWIMMING POOL 3 500 000.00 DSAC DSAC CRR 3 500 000 NOT FUNDED
UPGRADE OF FLORIANVILLE SWIMMING POOL 5 183 506.00 DSAC DSAC 5 183 506 a
UPGRADE OF VARIOUS FACILITIES AT DE BEERS STADIUM 2 742 416.00 DSAC DSAC 2 742 416 a
UPGRADE OF GALESHEWE SPORT STADIUM 1 336 986.00 DSAC MIG 1 336 986 10 952 704 2 206 483 a
UPGRADE OF GALESHEWE SPORT STADIUM CRR 1 800 000 300 000
CRAVEN STREET STALLS 1 000 000.00 SPLM CRR - 1 000 000 NOT FUNDED
INFORMAL TRADERS MARKET 1 000 000.00 ECONOMIC AFFAIRS CRR 1 000 000 NOT FUNDED
HOMEVALE FIRE STATION 11 526 729.00 SPLM MIG CRR 6 762 002 4 764 727 a
RC ELLIOT PRECINCT - NMMM 800 000 000.00 DSAC DSAC 200 000 000 200 000 000 200 000 000 200 000 000 NOT FUNDED
MANDELA MEMORIAL STATUE 8 153 649.00 SPLM DSAC 8 153 649 a
REFURBISHMENT OF OTHER MONUMENTS - SPLM CRR - NOT FUNDED
TOMMY MOREBUDI PHASE 2 2 500 000.00 SPLM GURP 2 500 000 NOT FUNDED
GREEN POINT SQUARE 5 000 000.00 SPLM GURP 5 000 000 NOT FUNDED
GREEN POINT INFORMAL TRADING ZONE 3 000 000.00 ECONOMIC AFFAIRSECON CRR 3 000 000 NOT FUNDED
FRESH PRODUCE MARKET 200 000.00 SPLM NDPG 200 000 NOT FUNDED
GOVERNMENT/MARKET SQUARE DEVELOPMENT 8 000 000.00 SPLM NDPG 1 000 000 7 000 000 NOT FUNDED
TAXI LAY BY'S GALESHEWE - SPLM NDPG - NOT FUNDED
REFURBISH LANDFILL SITE SPLM CRR 2 617 371 a
UPGRADE OF RESORTS 2 500 000.00 SPLM CRR 500 000 2 000 000 NOT FUNDED
UPGRADE OF COMMUNITY HALLS 5 200 000.00 SPLM MIG 2 000 000 2 000 000 1 200 000 a
UPGRADE OF COMMUNITY HALLS CRR 280 000 280 000 a
FUNDING SOURCE

5 | P a g e
PROJECT DESCRIPTION ESTIMATED TOTAL
COST
RESPON
SIBLE 2017/18 2018/19 2019/20 2020/21 2021/22 2022/23 Beyond 5 Years
Funded and
included in
capital budget
RITCHIE MULTI SPORT PARK (NMMM) 15 000 000.00 SPLM DSAC 15 000 000 NOT FUNDED
RENEWABLE ENERGY INCUBATOR 2 500 000.00 SPLM CRR 250 000 250 000 1 000 000 1 000 000 NOT FUNDED
NEW COURT BUILDING 25 000 000.00 DoCJ DoCJ 25 000 000 NOT FUNDED
DSAC NEW LIBRARY 25 000 000.00 DSAC DSAC 25 000 000 NOT FUNDED
PLATFONTEIN MULTI SPORT - NMMM 15 000 000.00 SPLM DSAC 15 000 000 NOT FUNDED
PLATFONTEIN COMMUNITY HALL - NMMM 8 000 000.00 SPLM NDPG 8 000 000 NOT FUNDED
PLATFONTEIN MiFARM 2 500 000.00 PRIVATE PRIVATE 2 500 000 NOT FUNDED
ECD CENTRE LERATOPARK 3 000 000.00 DSD DSD 3 000 000 NOT FUNDED
UPGRADE OF LANGLEY AND RIVERTON RESORTS 2 500 000.00 SPLM CRR 2 500 000 NOT FUNDED
LIFTS BUILDING 2 000 000.00 SPLM CRR 2 000 000 a
SECURITY 15 000 000.00 SPLM CRR 4 000 000 5 000 000 3 000 000 3 000 000 NOT FUNDED
RENTAL STOCK UPGRADE 8 000 000.00 SPLM CRR 3 000 000 5 000 000 NOT FUNDED
FIRE ENGINES 4 500 000.00 SPLM CRR 2 500 000 2 000 000 NOT FUNDED
UPGRADE OF EXISTING TEST CENTRE 750 000.00 CRR 750 000 a
SMOKE DETECTION BUILDINGS 1 000 000.00 SPLM CRR 1 000 000 NOT FUNDED
FLEET REPLACEMENT/REFUSE COMPACTORS 22 000 000.00 CRR 6 000 000 4 000 000 4 000 000 4 000 000 4 000 000 a
FLEET REPLACEMENT (UNFUNDED PORTION) 59 000 000.00 10 000 000 10 000 000 12 000 000 12 000 000 15 000 000 NOT FUNDED
COMPUTER EQUIPMENT 42 592 608.00 CRR 4 592 608 4 000 000 5 000 000 27 000 000 2 000 000 4 000 000 4 000 000 a
SOFTWARE ACQUISTIONS 2 300 000.00 CRR 2 300 000 4 000 000 6 000 000 a
FURNITURE AND OFFICE EQUIPMENT 16 000 000.00 CRR 3 000 000 3 000 000 3 000 000 3 000 000 4 000 000 4 000 000 6 000 000 a
4 193 418 639.00 536 190 936 805 851 930 898 736 358 726 417 158 311 200 000
FUNDING SOURCE

Ward Clr Roads and Storm water Housing Community Services Parks Electricity Water & Sanitation Urban Planning
1Petunia
FrancisPaving of untarred roads in Old Roodepan Upgrade municipal flats Community hall Upgrade Sida Park
Electrification of Begonia
and provision of High mast
lights
Upgrade Camelia and Eagle street
pump station including rising main
and outfall
2 L MohamedPaving of Weaver, Finch, Seeduif, Papegaai, Dikkop, Nightingale, Hoopoe,
Parakiet and Pluto Streets
Extension of current clinic or building of another clinic
as 4 wards visits clinic on daily basis
Upgrading of multi-purpose hall
Upgrading of park with swings,
planting of trees) in Albatross Str
currently being used as a
dumping site
High mast light at Mahala
Park
Replacement of water meters.
Replacement of sewer mains.
Communal water and sanitation
services level 1. Installation of water
and sanitation services for 55 sites.
Replacement of sewer main in
Spreeu and Seeduif Street
Maintenance of Sewerage system in
Eagle Str (RDP houses) Rectify Homevale Ext houses and
Homevalley houses
Provision for disable houses
Provision for houses in Homevalley
shacks
Upgrade of parks and build
public swimming pool
Replacement of water meters.
Replacement of sewer mains.
Communal water and sanitation
services level 1. Installation of water
and sanitation services for 55 sites.
Survey of 350 sites for informal housing
Build a paypoint and one stop centre,
Buildt houses in all open spaces, build
youth centre, build houses in open spaces
Recreational park next to
Roodepan roads and
Homevalley ext.
Rezoning and subdivision empty erven
Upgrade soccer field
Homevalley, 11th Str, 18th Str,
Sandshark Str playgrounds,
Baracuda in open space
Fully surveyed serviced erven for
development and serving for housing formal
and high income group due to influx of
industrial workers for next year onwards thus
boosting the municipality's revenueBuild park in Homevale and
HomevalleyPut up hockey fields Volley Ball
pitch erect, Gym Park
Uplifting of paving in Chris Hani Park (last street facing Waterloo Str Sickbay at old age home in Seochoareng Str Upgrade of Gogga outfall sewer main
Paving of roads in Peme, Botsang and Boikanyo Str and all streets in Santa Zone 2
and Otto Str
Upgrading of s/w drainage system between Peme and Botsang Str
Community Hall open space in Botsang StrCommunal services for water and
sanitation
Rehabilitation of retention dam between Peme and Botsang Str.Household water and sanitation
connections for informal areas
Provision of basic water services in
Fluffy Park
Upgrading of toilets in Thusano Unit
Ramora & Blikkies dorp sloot, gully to be closed and s/w pipes to be installedAudit to be conducted to establish
damage done to slab housesThemba Sloot, gully to be closed and s/w pipes to be installed Infll & Old cracked Vergenoeg houses
Upgrade s/w next to Solly;s store, Maphutha Str opposite Deke Str, Boitsanape,
Motlhaba and Masakhane Clinic
6116, 6118, 6107, 6112 Maphuta Str,
6002 Seleki Str, 6566, 6573, 6913 Deke
Str, 7031, 7032 Mathibe Str, 7033, 7056,
7057 Stamper Str Roads to be paved: Tshwene, Mathibe, Kgarebe, mmutla, Tlou Singel, Tshwene,
Goitseone, Selebogo, Pulane, Moeti, Themba 1 & 2 Mokake, Cwaedi, Mcheta,
Basadi, Ngobeni, Msekang, Matsebe, Tshipo, Maiteko, Legaga, Mmoledi, Str no
name next to Solly's Store, Tlhabanelo, Kgalalelo, Tsholofelo, Mochudi & Lekuku,
Tau StreetsSpeed bumps in Thutlo, Stamper, Deke, Goitsemang, Seleki and Moheta Str
No toilets at Riemvasmaak
Provision of communal water and
sanitation services in Riemvasmaak.
Upgrade of Gogga outfall sewer main.
7 houses in Solly Legodi that still
needs to be build still uses bucket
system
Sewer manholes to be lifted in Solly
Legodi and Ubuntu/Danston
Pedestrian walkway from Schmidtsdrift Rd to Freedom Rd
Cleaning of s/w canal in Silson, Armstrong and Freedom Rd
Resurfacing of Limpopo and Swanson Rd and patching of potholes
Paving of Thesele, Thomas Morebudi, Peacock, Gans, Morubisi, Gaka, Kalkoen,
Eshley Mothelesi and Nxumalo Extension, John Daka, Donkerhoek and 7de Laan
3 CB Lewis
Resurface all tar roads in ward 3.
Paving in Homevale ext., Porpoise, Pilchard, Sardine, Barracuda, Salmon,
Anchovy, Sole Close, Bass Close, Hake Close, Gold Fish Close, Mackeral,
Haddock, Whiting, Garrick Bream Str in Homelite, Marthennay
Paving of Bream, Cyntrex Proman, Pilchard, Porpoise, Sardine, Barracuda,
Anchovy, Salmon, Bream Drive, Whiting, Haddock and Mackeral Str in Homelite
Upgrade gravel roads in Homevale shacks
Upgrade all storm water drains. Clean all canals in Ward
Pave all the gravel roads in Homevale Extension (20, 21, 22, 24)
Build in door sport facility, multi-purpose recreation ahll,
recycle projects in wards, regular removal of dumps,
rubble, etc pavements, open areas, parks, build
playground and stadium, build car wash
Provision of high mast lights
Electrification of Homevalley
shacks, high mass, Sardine
2nd Street. Homevalley
shacks, between
Homevalley and Roodepan
Road, 21st Street
Replace all faulty
transformers
Upgrade house lights and
street lights in Homevalley
and Homelite
4 TH MpanzaProvision of housing in Ramorwa and
Witdam2 Parks Mphela and Tholo Str Electrification of Ramorwa
Provision of basic water and
sanitation services
5 M MohapiPaving of street in Vaalbos 1, Mathibe Old Vergenoeg, Mathibe extension
(Madalane shacks) Baba Gopane, MadibaProvision of housing in Fluffy Park Electrification of Fluffy Park
7 JG Diphahe
Paving of entire Ubuntu, Malebe, Gaborone, Melesi, Kgopisho, Mojanaga, Maputle,
Amakhuzane Streets and April Str connecting to Ramatshela Str. Upgrade minor
roads connecting April to Ramatshela. Upgrade minor streets connecting
Kesiamang to Moraladi. Paving of Solly Legodi. Construct Vehicular bridge
connecting Solly Legodi & Dunston (Over the lined canal)
Solly Legodi cracked houses, disaster
houses throughout ward. Solly Legodi 1
house without electricity since the day it
was built
Provision of housing in Riemvasmaak
Five April Park (Bambanani Park)
no caretaker, park in bad state
Provision of electricity in
Riemvasmaak
High Mast Lights
New Area Riemvasmaak still informal
settlement no development only taps
6 D T SetlholoNeed for a community hall for public gatherings site
next to boikhutsong community creche
Recreational facility in Mathibe
Str, Thutlo Str park to be
upgraded
High Mast light Seleki Str in
front of Tikke Bar at Erf
4004 to eliminate high crime
Sewerage overflowing in Maphuta Str
constantly giving problems
Cleaning of Ramatshela Cemetery
Provision of more bulk refuse bins and no dumping
signs
8Charles
Ngoma
Provision of housing in Madiba Park and
Donkerhoek Ext
Maintenance of poorly constructed RDP
houses with dangerous building problems
in Donkerhoek
Upgrade of parks in Armstron Rd
and Donkerhoek Gurp Park
Provision of electricity and
High Mast Lights
Replace all water pipes in ward.
ANNEXURE 4 WARD PRIORITIES

Ward Clr Roads and Storm water Housing Community Services Parks Electricity Water & Sanitation Urban Planning
9 DM SwaziPaving of roads, Boitumelo, Mosamo, Chou, Solani, Mokonyama, Hlongwane,
Lilian Mantsane, Jenkis Mothibedi, Maokeng StrProvision of FLISP housing in Retswelele
Fencing and greening (grass) for
parks, Real Madrid soccer
ground
Provision of electricity in
Retswelele
Provision of water services in
Retswelele
Paving/Upgrading of roads Dinokwane, Moagi & Molema Str (Unit 3) Obakeng,
Moretele, Phetolo, Tladi Str, Sekate, Tlhapi, and Botlhale Str (Unit 1)
Solar Geysers to be
installed
Erection of speed bumps : Phajane, Modise, Ditake, Nkgare, Street no name
between Phajane shops, Tetlanyou Secondary school, Mongale, Moagi, Letlhaku,
Molema Unit 3, Gwele, Fish Crescent, Siwisa, Simino, Madibane, Leqwabe and
Sontlaba Str Unit 2, Obakeng Str Unit 1
Installation of high mast light
at area of Dingaan Str and
Pick 'n Pay Centre,
substation between Siwisa
and Dingaan Str to be
closed by council
Potholes to be fixed : Unit 2 consist of Sontlaba up until Fish Cres, and Unit 3
consist of Phajane up until Modise and Ditake Str
Provision of electricity to
shack currently at
Tshwaragano shacksAgisang (Katima Molelo) residents
extension of 2 rooms and asbestosJob for youth Cleaning of parks
15862 Elizaqbeth Manko Str, roof leagae
and door broken, 15905 Mojakwe Str,
door between kitchen and sitting room is
loose, Roof leakage problem; 15860
Elizabeth Manko Str, toilet leakage, and
roof leakage; 15837 Elizabeth Manko Str,
roof, geyser and door needs
replacements
Playground at Stranger Nkosi open space Upgrading of Agisanang Park
Geysers are cracking roofs and all RDP
houses must be renovatedCleaning of graveyard
Removal of asbestos
Greater Vergenoeg houses are crackedCleaning of all sections in ward 11
Arena Residents want houses to be
renovated, new toilets.
House next to park at hostel to be cleaned as it is used
for smoking drugs.Residents that were removed from Num 2
and relocated to the hostels due to s/w
problems are requesting houses
Youth in ward 11 need employment/jobs to be taught
business skills, learnerships and interships
Refurbishment of hostels into CRU's
Unit 1 - Paving of roads (Mashilo, Magonare, vicinity at Peme Office and car wash),
Witdam streets
Unit 1 - Magonare big tree church side open area for
small park for relaxation and gathering purposesUnit 2 Paving Tyala Drive & Jabula RDP houses, road signs, chromodeck signs
(speeds bumps, reflectors paint each street 3 ) Khotso Str, Naledi Str, Chevron
Rod sign between Khotso and Naledi, Tyala Drive, Redirile School speed bump
and Bongani Str 4 way James Mandeu Dula Str to Jabula Street = C (Chromodeck
Road sign; Jabula Str to Tyala-Phutane Str
Unit 2 - Building of libraryNext to African Church in
Kwnobanthu
Unit 3 - Tyala- Kekane Str sameUnit 4 & 5 Cutting of trees which causes a lot of rapes
and robbery at Phillip Mphiwa down Phakedi Str
Ufnit 4 - Hulana str all internal streets Phakedi Str
Develop food garden for the (jojo) community and
create jobs at open space next to Salvation Creche at
Nkoane StrUnit 5 - Hulana Str internal streets to Montshiwa Rd, Street name signs for all units
in Chromodech Road
Unit 4 & 5 S/w slope at Phakedi, Phillip Mphiwa to be cleaned up and restructured
with tunnels for flow and safety of families
Paving of ext 6, Sesing 2, Maji, Methodist Str (next to St James Church), Methodis
Str (in White City next to Methodist Church), Ncakani laan, Masiza, Maleka, Zone
2, China Square, Sesedi Str, Santa Santa, Seochoareng Str (behind Cashbuild),
Potholes Zone 2
Upgrade storm water canal at Greater No 2, Zone 2, Chris Hani Park, Palweni,
Malunga, Modiakgotla, Sol Plaatje
Social centre park needs to be
cleaned and revamped
Zone 2, electricity boxes
needs to be transferred from
shacks into the houses
Provision of basic services to Santa
Centre & Zone 2 shacks
Speed bumps in Riet Str, Phakedi Str Galeshewe Stadium needs to be
paved in the front entrance Street lights in Long Str
Infrastructure Mahala Park, Santa Santa Electricity Santa Centre
(Agisanang) Paving in Molemo, Letsatsi T-junction, Bhekuzulu T-junction next to
post office and Thokoza Str.
(Vergenoeg) paving at T-junction Magoda and Mondile. Provision of side
pavement at T-junction Hagos & Mashakane Str
(Arena) Paving of Elizabeth Manko and France Lebona Str.
Paving of all streets in the hostels
10 JT Gomba Provision of housingUpgrade of Tommy Morebudi
Sports facility
Provision of basic services in
Tshwaragano shacks, pipe
replacement programme Nobengula
13 MK Molatudi Santa Centre and Zone 2
11 IM Mojakwe
Provision of high mast light
at hall next to Mondile
creche
Residents are unhappy with
new installation of electricity
want the old electricity box
15895 Mojakwe Str, meter box
leakage
Replacement of water pipes in
Agisanang
(Arena) Removal of zinc tolets.
Agisanang open space behind bar/Post Office
next to Molemo Str for houses to be built. Use
of Open space next to Agisanang creche for
building of creche.
(Vergenoeg) Open space between Stranger
and Mondile Str needed for building of
community hall and library
Open space in middle of hostels, needed for
building of RDP houses.
12LL
Mocwagole
Unit 4 - Dilapidated house in Phllip
Mphiwa next to Faima Church should be
renovated for Ward 12 consultation house
causes rapes and robberies
Unit 4 & 5 Upgrading of park in
Phillip Mpiwa down to Phakedi
Str
Maintenance needed at all
units

Ward Clr Roads and Storm water Housing Community Services Parks Electricity Water & Sanitation Urban Planning
14 H Pieterse
Squarehill Park (Aster, Malfa, Carnation, Marigold, Cosmos and Verbena Str -
maintenance)
Florianville (Beechwood and Acacia Rd deteriorated due to overgrown water channel,
resurfacing of Maple, Deodar, Cedar, Beech, Ash, Almond, Bloubos and Ganna Rd)
Mint Village / Moghul Park (Potholes - Peach, Plum, Pear, Mango, Grape, Mandarin Str)
Colville ( Potholes - Omega and Margaret Rd)
Homestead (Lynch, Harmse, Dawson, Varrie and Rabia Str - resurfacing)
Northview (Edith, Riverton, Sussex, Neethling, Homestead, Association and Natasha Str -
resurfacing)
Access/ connecting roads Church Rd pavement to small for wheelchairs, road breaking
up, Community Rd kerbing to be installed and regular cleaning of s/w canals,
Karee/Cypress Rd - road breaking up and kerbing to be installed, Recreation Road from 4
way stop past Florianville and Square Hill Park to main road Barkly Rd to be resurfaced.
Trees on pavement at William Pescod High school must be trimmed.
Community Rd kerbing is breaking up to be replaced and cleaning of s/w drains.
Karee/Cypress Rd Road is breaking up due to rainfalls. Homes are 1 m from edge of road,
kerbing to be installed.
Recreation Rd From 4 way stop where Church Rd ends past Florianville and Squarehill
Park main road Barkly Rd needs resurfacing. Road from Almond Rd to Pine Rd needs
resurfacing and kerbing. Speed bumkps (half-shaped roundels) to be placed near c/o NG
Church to avoid speeding.
All roads that have speed bumkps must be replaced with half-shaped roundels as existing
speed bumps contributes to deterioration of roads as water stands in front and behind
speed bumps.
Stormwater
Florianville, Colville, Ashburnham, Utility and Squarehill Park are surrounded by s/w
channels which are poorly maintained. All earth/sand channels to be replaced with concrete
lined channels, would save costs in the long term.
Cleaning of suburbs:
Squarehilll Park (pavement around Lords Park in Aster Rd, around
church c/o Marigold and Dahlia Ave, Behind Petunia Rd from
Recreation between Apostolic & Baptist churches, Area Opposite
Kemo Motel up to 4 way crossing in Church Rd, Area at Civic Centre,
Judy Scott Library, Clinic & SPM Utility Payment office, pavement of
Davidson Str)
Florianville (Area opposite Baptist, Methodist Church up to 4 way
stop at Karee Road, Area opposite Dr Wolfsons Creche in Recreation
Rd up to Cypress Rd behind Endeavor Primary school, area between
Baptist Church c/o Recreation Rd & Apostolic Church c/o Petunia Str,
behind Squarehill Park, water furrow sloot in Recreation Rd in front of
Hostel, behind Beefwood running through to Mimosa Rd, area next to
St Barnabas Church in Community Rd)
Ashburnham (area between Resthaven Old Age Home and Moghul
Park, side of Bradley Str thorn tree and shrubs, Ripon Str overgrown,
trees in Church Rd side of Helen Bishop Home & William Pescod High
School to be trimmed)
Utility (Donald Str at cul-de-sac with Loop Str, pavements overgrown,
Pavement of Loop Str opposite homes overgrown)
Moghul Park (Rutherford Str next to train line overgrown, area at
Lime Street, Mandarin Str up to power station, cul-de-sac of Fig Str
near bridge)
Mint Village (Next to Old Transvaal Rd Primary School in Pear Rd,
Open veld behind houses of Peach Rd)
Colville (No open veld exsit as it is occupied by housing)
Cyril Crescent (Park in Carl Str & Cyril Crescent and area bordering
Progress Primary School)
Formal settlement - area has to subjected to a
general engineering survey for an IDP faculty.
Land had been pegged and allocated to
shack residents with erven numbers for
approval of MPAC committees.
Ward
14
Northview (Area from Varrie Rd into Natasha Str by
Old Cader Brickworks up to Lutheran Church in
Natasha Str, open veld allocated informally as a park
regular brush cutting, Baptist Church leading to the
sewage treatment facility, opposite side of Rhona Close
up to 50 m from corner of last house, open area
between Constance Rd and Barkly Rd on either side of
Edith Road, pavements of Dpt of Education opposite
Northview in Constance Rd and Barkly Rd)
New Homestead opposite Shoprite/Santa Centre
(Open veld 30 m from boundary of College Road
embarked from St Pauls Rd opposite Dept of Education
to 50m from last house in road. Area between New
Homestead and AR Abass Stadium next to Santa
Centre rubbish are dumped by informal settlements.
Island between Hugo & Orange Str overgrown.
Gemdene (Buffer area Ruby St & Barkly Rd regular
maintenance overgrown.
15 M Keetile
Roads & S/w drainage for Phutanang & Phomolong, (Frank Chikane, M Goniwe,
Winnie Jansen, Johannes Lekotla, Mocumi Maropong, Gwagwa
Sidewalks and bicycle lanes in John Daka
Phomolong FLISP and low cost Phomolong electrification Provision of reticulation
16 BJ Stout Paving of Gugulethu, Nelson Moitsi, Mthengi, Paving of streets in TswelelangSnakepark & Promise Land. Provision of
housing in Tswelelang
New Homestead (opposite Shoprite/Santa Centre
(Open veld about 30 m from boundary of College Rd,
from St Pauls Rd opposite Education Dpt up to 50 m
from last house, area between New Homestead and
AR Abass Stadium where inf settlement opposite the
road next to Santa Centre, Island between Hugh &
Orange Str overgrown)
Complete Snake Park
electrification
Provision of basic services Snake
Park & Promise land

Ward Clr Roads and Storm water Housing Community Services Parks Electricity Water & Sanitation Urban Planning
Unit 1 Club 2000 (Road in Peace/Khutsonong to be fixed, potholes to be patched,
no s/w intakes in Tidimalo, Kakaretso, Khutsanong)Unit 1, Club 2000 (cracked houses, roofs) Gemdene (Buffer Area Ruby Str & Barkly Rd)
Unit 1 Club 2000 ( Trees to be
cutted in Peace Str and cleaning
of ground)
Unit 1 - Club 2000
Refurbishment of all high
mast lights
Unit 2 (Zink toilets Convention, Julia,
Chabagae, Patric Mothelesi, Molete,
Motlhanke, Matshidiso, Vanani, Mac
Sebao Str)Unit 2 Paving of Nche, Julia, Chabagae, Gala Motheo, Gloria Mathebula, Tebogo
Masen, Rebecca Motlhwaeng, Bunny Mamba, Captain Matsi, Molete, Motlhanke,
Convention, Vancini, Mac Seao, Patric Mothelesi, Peace, Thutsanong. Paving of
Lathi Mabilo, Albert Luthuli, Manne Dipico, Edward Moeng, King Senare, Forest
View, Trisano.
Extension of Morris Lenyibi Main road too small for 2 cars, Patches to be repaired,
no intakes)
Unit 2 (cracked houses and leaking roofs
to be repaired)
Unit 2 (Close ground facility to be fixed has been
vandalised, community hall, cleaning of veld)
Unit 2 (Park to be upgraded,
security 24 hours, trees to be
cutted in Kulia, Chabagae,
Convention Str)
(3 street lights in every str,
Khutsanang,
Kakaretso/Tidimalo/Peace
when high mast is off street
lights must serve as back
up)
Unit 1, 2, 3 (Zink toilets to be built
with bricks, Khutsanong, Tidimalo,
Kakaretso, Peace, Convention, Julia,
Chabagae, Patric Mothelesi, Molete,
Motlhanke, Matshidiso, Vanani, Mac
Sebao, Nobengula Rd)
S/w drain in Patric Mothelesi to be cleaned and closed, no s/w intakes in Molete,
Matshidiso, Convention, Vanani, Mac Sebao, Patric Mothelesi, Motlhanke,
Nobengula Main road to assist retention dam).
Bridge to be built over s/w canal
Unit 3 (cracked and leaking roofs to be
repaired)
Kaghiso (School, library, clinic near ground in John
Mampe, Kagiso, Tlhageng)
Kaghiso (Park and fencing to be
upgraded, rubbish drums in Gala
Mottheo, Tlhageng Unit, as well
as at park)
Unit 2 - (3 Str lights in every
streets, Molete, Motlhanke,
Matshidiso, Patric Mothelesi,
Convention, Vanani, Mac
Sebao)
Unit 3 (King Senare, Phidisanang,
Tirisano, Gabriel, Baremedi, Forest
View,
Extension of Morris Lenyibi Main road too small for 2 cars, Patches to be repaired,
no intakes)
Kagiso (36 cracked houses built by Mulan
Construction to be rectified, other cracked
houses and leaking roofs to be repaired)
Ipeleng (Netball, basket ball fields to be provided)
John Mampe II (John Daka 2 and
Kagiso Parks and fencing to be
upgraded)
Unit 2 ( High mast light in
Moleteand at close ground
to be fixed)
Kagiso (Zink toilets to be built with
bricks Gala Moetheo, Morris Lenyibi,
Rebecca Motlhwaeng, Bunny Mamba,
Captain Matsie, George Molaolwa,
Gloria Mathebula, Tebogo Maseng)
John Mampe II (Patching of Albert Lethuli , short street in John Mampe II, Kagiso,
Phakamile Mabija, Manne Dipico , Lathi Mabilo to be paved, no s/w intakes in John
Daka 2)
Provision of housing in King SengariIpeleng ( rubbish drum at Ipeleng
Park and park and fencing to be
upgraded)
Unit 3 (3 street lights
Gabriel, Tirisano, Edward
Moeng, King Senare,
Tshidisanang)
Pipe replacement on sewer mains
with an option of upgrading top
structures. Point repairs on sewer
mains in Kagiso, basic services for
King Sengari.
Ipeleng (No s/w intakes Chris Marais, Masisi, Man Zana, potholes to be patched)
Kaghiso ( 3 street lights as
back up in Rebecca
Motllhwaeng, Gloria
Mathebula, bunny Mamba,
Morris Lenyibi, Gala
Motheo, Captain Matsie,
Tebogo Maseng,)John Mampe II (3 street
lights in John Daka, Mampe,
Manne Dipico, Albert
Lethuli, Phakamile Mabija
for back up)Ipeleng ( High mast light at
Ipeleng Park)
S/w system in whole ward (foculs also in Nxumalo as system is in back of yards)
Renovation of Heritage Houses (mud
houses)
Mlimba Str shacks + 7.
Development of small village - LED (Mayibuye Precinct -
Robert Sobukwe office)
More speed bumps to be erected
Block brick houses in Greater No 2 and
some houses in Nxumalo cracking
because of poor workmanship
Unemployment and lack of skills program for young
people
Paving of streets Malat Str, Nxumalo cul-de-sac Registration of Greater No 2 for the title
deedsLack of library in this cluster ward
Infill houses
19 IA Lekoma
Klaas Moncho and Moroka Str to be paved. Paving of Sello Phiri, Snyman
Rankane Str, Peter Thabile, Thabo Moyo. Resurfacing/paving of outstanding
portion of Mampunye Str
Upgrading Kammerkies (72 houses)
asbestos roofs incl leaking roofs, fixing of
falling mud houses, cracked/sub-standard
houses SAKA
Revamp of old age home Upgrading of parks Toilets Lathi Mabilo Park (SAKA)
20 C Pearce
All main roads to be resurfaced and rehabilitated. Upgrade all main earth s/w
cables
All roads in CBD to be maintained
Resealing of roads in West End, Kimberley North and Utility
Partching of roads in other units in Ward 20.
Visible street names
S/w drains in West End, Utility and CBD, especially at Big Hole
Replace broken windows at 3 flats in New
Park (Tiffany, Holland and Newton
Courts). Maintenance as required at flats
Regular removal of dumped rubble in public spaces
CBD, thorough cleaning in West End, Utility and New
Park
Making our CBD safe and installing working CCTV
cameras
Soccer field and parks in West
End
Lighting in CBD and
suburbs
Sewer diversion at flats, replacing
pipes for water mains. Repairing
sanitation probles at Tiffany, Holland
and Newton Courts.
Major sanitation problem at Tower
Villas - Albertynshof
21W van
Rooyen
Rehabilitation and resealing of Hull Str.
Upgrade s/w management system in Hull Str and Diamantveld Primary School.
Automize and upgrade s/w management at subways
Upgrading of Flamingo Court Pipe replacement for water mains
Paving of roads, Woodburn, Idutywa, Soga, Lemonwood, Ironwood, Denomthuli,
Liphuku, Mokoalane, Thomspon, Magugu, Bonbani, Mohosh, Sneezewood and
Witpad Streets
Upgrading of sports ground
Extension of s/w canal in GreenpointDevelopment of parks in
SouthridgeMaintenance of roads in Southridge and cleaning of s/w drains (Landbou Rd,
Britten Close, Smart and Beddome Str - serious need)
17 I Petoro
18 R van Wyk
Service and upgrade of
electricty transformers
Mlimba Str Shacks
Provision of services Mlimba Str
shacksOver population double packing of families
Land for new cemetery22 N Maditse Provision of housing in Greenpoint Elektra Park - no service deliveryGreenpoint, investigation
into lighting levels
Provision of basic services in
Greenpoint, Point repairs on sewer
reticulation

Ward Clr Roads and Storm water Housing Community Services Parks Electricity Water & Sanitation Urban Planning
Elektra Park (Paving of streets)
23 J Vorster
Taxi parking bays, move taxi's to industrial area
Linking of s/w pipes
Visible street names
24Sharon
Steyn
All main roads to be resurfaced and rehabilitated. Upgrade all main earth s/w
cables
All roads in CBD to be maintained
Resealing of roads in Carters Glen, Rhodesdene, Lindene and Hadison Park
Partching of roads in other units in Ward 24
Visible street names
S/w drains in the whole Ward 24 especially in Selous Ave as well as the others in
the Ward
Street lights in Ward 24 to
be replaced
Upgrading of sewerage pump station -
New Hillcrest and Carters Glen
Replace missing Sewerage drain
covers
Provision of bulk refuse bins at municipal flats
Replace main water line in Dalham
Rd, Broadway from Carrington Rd up
to Old Cape Town Rd
Bulk refuse bins at Diamond Park
Replace waterline in Central Rd from
Carrington Rd up to Old Free State
Rd at Phoenix Hotel
Construction of V-drains: Shuping, Mokotoi, Moremi, Ratanang, Zepe Str Rietvale informal settlement
Paving : Motsweding, Moremi, Shuping, Zepe, Kgabang, Morometssi, Kutlwano,
Goolam Akharwaray, Ratanang, Matlhaku Zone, Pakes Dikgetsi Str
Rebuilding of Old Phelindaba houses in 3
phases
S/w Management for Ritchie, R Repairing rooftops of Ikageng houses
Paving sidewalk from Ritchie to Modderriver
Paving of Fraser Moleketi and other bus & taxi routes, Seeduif, John Humphres,
Van Riebeeck and Venus Str.
Speed bumps for Opperman, Van Riebeeck, Stokroos, Pelikaan Str.
Underground s/w drains to river
Upgrade of s/w in St Luke Rd and s/w sloot c/o Pine and Farm Roads
Resurfacing of St Luke, Epsolom and St James Str. Paving of Beta, Gamma,
Cecelia, Agatha roads. Repair potholes and cleaning of s/w inlets 10 streets
(Maple to Soutbos Str)Paving for pedestrians in Main Rd, St Pauls, Recreation, Pine, Farm and
Community Rd
Removal of mining dumps in Colville/Floors area to make way for development of
houses
29 B Springbok Paving and resurfacing of streetsTransfer of houses from municipality to
owners. Provision of houses in Ivory ParkElectrification of Ivory Park
Provision of basic water services.
Upgrading of sewer system in
Riverton
Lerato Park shacks (sequence and services)
Community Hall, Clinic
Jacksonville ( Indigents, clinic)
31 John KemeUpgrading of s/w drain system in Soul City. Resurfacing of roads.
Paving of street (One street in Soul City, Ngwenyama, Ixcelishe)
Provision of FLISP housing in Nobengula
Str.
Provision of housing in Kutlwanong
Electrification of Kutlwanong
Upgrading of sewer pump station.
Provision of basic water services.
Upgrading of toilet top structure.
Paving of Kgatlane, Legodi and George Joseph Str
Paving of Chris Hani 2 Streets
Street names
Upgrade of bulk water infrastructure,
replacement and upgrade of water
pipes incl installation of bulk meters,
provision of basic water services
informal areas
Electrification of informal
settlements
Pipe replacement programme (sewer)
with an option of upgrading top
structures. Investigate alternate
waterborne sewer system for
Platfontein
26 BJ
Makhamba
Revamp community hall, pave and lights outside, 100
chairs, 8 tables. Stone guard doors and replace old
door
Stadium and swimming pool
Electrification of informal
settlements
27
Land for new cemetery
25 O FourieUpgrading of flats, Krisant, Hercules,
Jonker, and Eureka Courts
Highmast ligths Diamond
Park
22 N Maditse Provision of housing in Greenpoint Elektra Park - no service deliveryGreenpoint, investigation
into lighting levels
Provision of basic services in
Greenpoint, Point repairs on sewer
reticulation
Surveying 220 informal structures, 750 erven
including complimenting facilities such as
business, creche, government office, etc
28 H Japhta Community Road Settlement Building of community hall (500 people)Electrification of Colville and
bulk upgrade
Provision of basic services in
Community Rd
Completion of main s/w pipeline.
Rehabilitation of Lerato Park main road. Paving of streets in Jacksonville with s/w
system.
Lerato ParkPark in Lerato Park and
Jacksonville
Electrification of
Jacksonville
N Hammer
Riemvasmaak
Moving of app 30 in Suiderkruis &
Kleindam Str (fountain flooding), Houses
to be developed for Rietvale, Houses for
app 1000 houses.
Cleaning of illegal dumping sites. Purchase of refuse
removal truck, Upgrading and maintenance of
community hall (Paving and parking area)
Soccer and netball pitch develop,
3 Parks for Rietvale, Swimming
Pool
Upgrade of bulk water infrastructure,
replacement and upgrade of water
pipes incl installation of bulk meters,
provision of basic water services in
Riemvasmaak
33 K M Sebego
Upgrade of pump stations. Bulk
linking services. Upgrading of sewer
outfall main
32 F BandaPaving o Frank Chikane and Gerald Sekoto, Zef Motopheng, Ellen Khuzwayo Str.
Upgrading and management of s/w discharge pointProvision of housing at Frans Farm Electrification of Platfontein
30 GP Kock