Final Geotechnical Report Multi-Level Building at 250 ...
54
Final Geotechnical Report Multi-Level Building at 250 Parkdale Avenue Ottawa, ON Prepared for: Richcraft Group of Companies 2280 St. Laurent Blvd, Ottawa, ON K1G 4K1 Prepared by: Stantec Consulting Ltd. 2781 Lancaster Rd., Suite 200 Ottawa, ON K1B 1A7 Project No. 122410780 May 2012
Transcript of Final Geotechnical Report Multi-Level Building at 250 ...
Final Geotechnical Report Multi-Level Building at 250 Parkdale Avenue Ottawa, ON
Prepared for: Richcraft Group of Companies 2280 St. Laurent Blvd, Ottawa, ON K1G 4K1
Prepared by: Stantec Consulting Ltd. 2781 Lancaster Rd., Suite 200 Ottawa, ON K1B 1A7
Project No. 122410780
May 2012

FINAL GEOTECHNICAL REPORT
i
Table of Contents
1.0 INTRODUCTION ................................................................................................................ 1
2.0 SITE DESCRIPTION AND BACKGROUND ....................................................................... 1
3.0 SCOPE OF WORK ............................................................................................................. 1
4.0 METHOD OF INVESTIGATION .......................................................................................... 2 4.1 GEOTECHNICAL FIELD INVESTIGATION......................................................................... 2
5.0 RESULTS OF INVESTIGATION ......................................................................................... 3 5.1 SUBSURFACE INFORMATION .......................................................................................... 3
5.1.1 Surficial Materials ................................................................................................. 3 5.1.2 Bedrock ................................................................................................................ 3
5.2 GROUNDWATER ............................................................................................................... 4
6.0 DISCUSSION AND RECOMMENDATIONS ....................................................................... 5 6.1 SITE GRADING AND PREPARATION ................................................................................ 5
6.1.1 Building Footprint ................................................................................................. 5 6.1.2 Paved Areas ......................................................................................................... 5
6.2 FOUNDATIONS .................................................................................................................. 6 6.3 SEISMIC SITE CLASSIFICATION ...................................................................................... 6 6.4 GROUNDWATER CONTROL ............................................................................................. 7 6.5 PIPE BEDDING AND BACKFILL ........................................................................................ 7 6.6 TEMPORARY EXCAVATIONS AND BACKFILLING ........................................................... 8
6.6.1 Excavations in Soil ............................................................................................... 8 6.6.2 Excavations in Bedrock ........................................................................................ 8 6.6.3 Groundwater ........................................................................................................ 8 6.6.4 Earth Pressures on Shoring Systems ................................................................... 8 6.6.5 Rock Anchors ....................................................................................................... 9 6.6.6 Foundation Backfill ............................................................................................... 9
6.7 CEMENT TYPE AND CORROSION POTENTIAL ..............................................................10 6.8 PAVEMENT STRUCTURE RECOMMENDATIONS ...........................................................10 6.9 VIBRATIONS MONITORING AND PRE-CONSTRUCTION SURVEYS .............................11 6.10 CLOSURE .........................................................................................................................12 List of Tables Table 5.1: Unconfined Compressive Strength of Rock Cores .................................................... 4 Table 6.1: Geotechnical Bearing Resistance for Foundations on Bedrock ................................ 6 Table 6.2: Shear Wave Velocity Information of Selected Boreholes .......................................... 7 Table 6.3: Lateral Earth Pressure Parameters .......................................................................... 9 Table 6.4: Unfactored Friction Coefficients ................................................................................ 9 Table 6.5: pH, Sulphate, Chloride and Resistivity Analysis Results ..........................................10 Table 6.6: Recommended Pavement Design ...........................................................................10

FINAL GEOTECHNICAL REPORT May 2012
ii
APPENDICES APPENDIX A Statement of General Conditions APPENDIX B Key Plan Borehole Location Plan VS30 Measurement Location Plan Fault Location Plan APPENDIX C Symbols and Terms Used on Borehole Records Borehole Records Field Core Logs Bedrock Core Photos APPENDIX D Laboratory Test Results APPENDIX E Rock Anchor: Resistance to Rock Mass Failure

FINAL GEOTECHNICAL REPORT May 2012
1
1.0 Introduction
This report presents the results of the Geotechnical Investigation and recommendations carried out for the proposed 28-storey building near the corner of Parkdale Ave. & Scott St., Ottawa, ON. This building will include five below grade parking levels.
The work was carried out in general accordance with our Proposal Number 1224-B11221, dated December 5, 2011.
This report has been prepared specifically and solely for the project described herein. It presents the factual results of the investigation and provides geotechnical recommendations for the design and construction of the proposed building.
2.0 Site Description and Background
It is understood that the proposed 28-storey building is to be located at the southwest corner of Parkdale Avenue and Scott Street. The building is approximately 85 m high and has five underground parking levels. The finish floor elevation of the ground floor has been assumed to be near elevation 62.70 m. The finish floor elevation of the first parking level has been assumed to be near elevation 59.70 m and the finish floor elevation of the fifth parking level is estimated to be 47.7 m. The site area is approximately 1,157 m2 and the total gross building floor area (above grade) is approximately 16,357 m2.
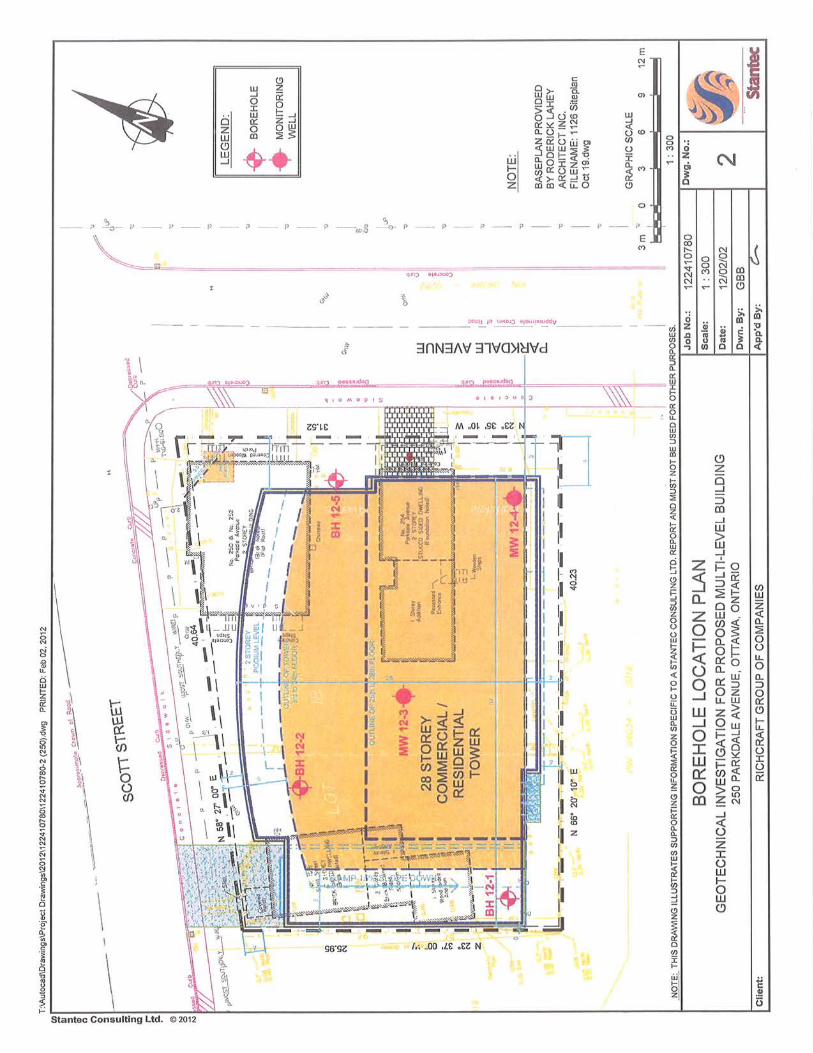
The location of the proposed building is shown on Drawing No. 1 in Appendix B.
Surficial soil maps indicate the soil conditions in the area consist of fill/glacial till over shallow bedrock within 3 m of ground surface.
3.0 Scope of Work
The scope of work for this investigation included the following:
• Advance five boreholes. Two boreholes were cored to the depths of approximately 16.5 m and 19.7 m below the ground surface. Three boreholes were terminated on shallow bedrock confirmed by auger refusal.
• Install two monitoring wells to measure groundwater levels. • Survey the ground surface elevations at the borehole locations with reference to a geodetic
benchmark. • Complete a geotechnical laboratory testing program to characterize the soil and rock.

FINAL GEOTECHNICAL REPORT May 2012
2
• Prepare a Geotechnical Report outlining the field observations, laboratory results and providing geotechnical recommendations for design and construction of the proposed building including:
• Bearing capacity of rock for shallow foundations; • Lateral earth pressures for shoring systems; • Seismic site classification in accordance with 2006 Ontario Building Code; • Design recommendations for rock anchors extending to bedrock; • Groundwater levels and construction dewatering requirements.
4.0 Method of Investigation
4.1 GEOTECHNICAL FIELD INVESTIGATION
Prior to carrying out the investigation, Stantec Consulting Limited (SCL) personnel marked out the proposed borehole locations at the site. As a component of our standard procedures and due diligence, Stantec arranged to have the borehole locations cleared of both private and public underground utilities.
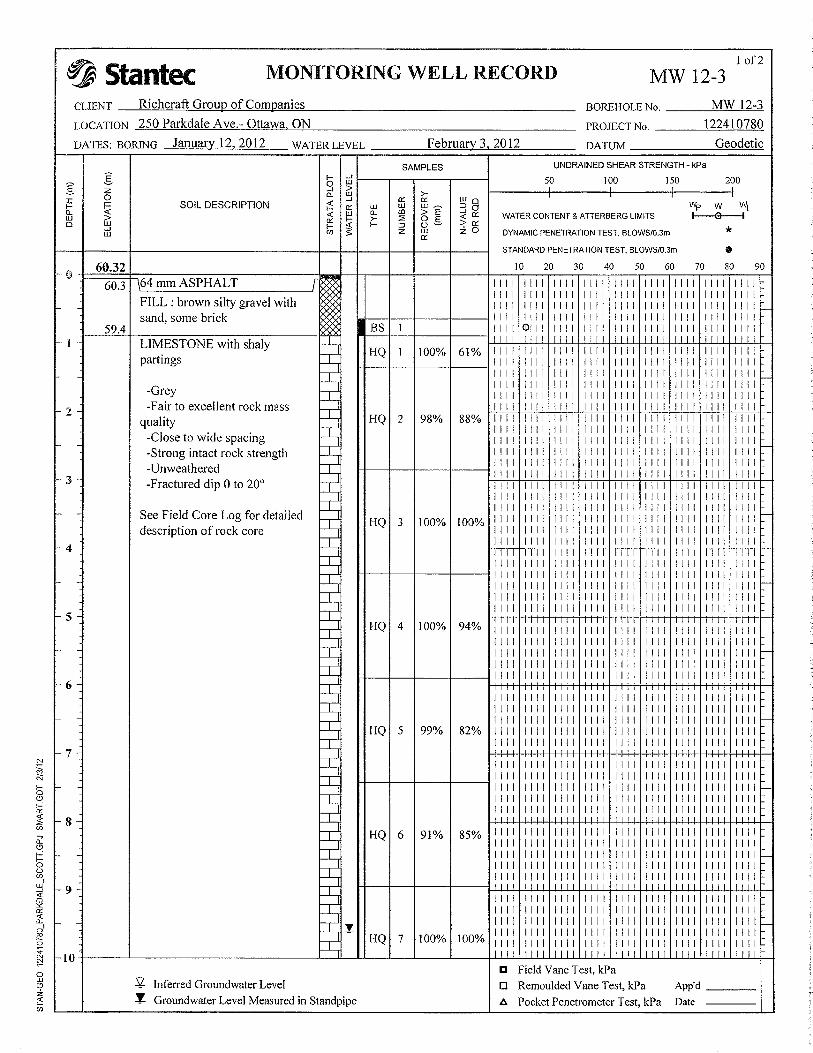
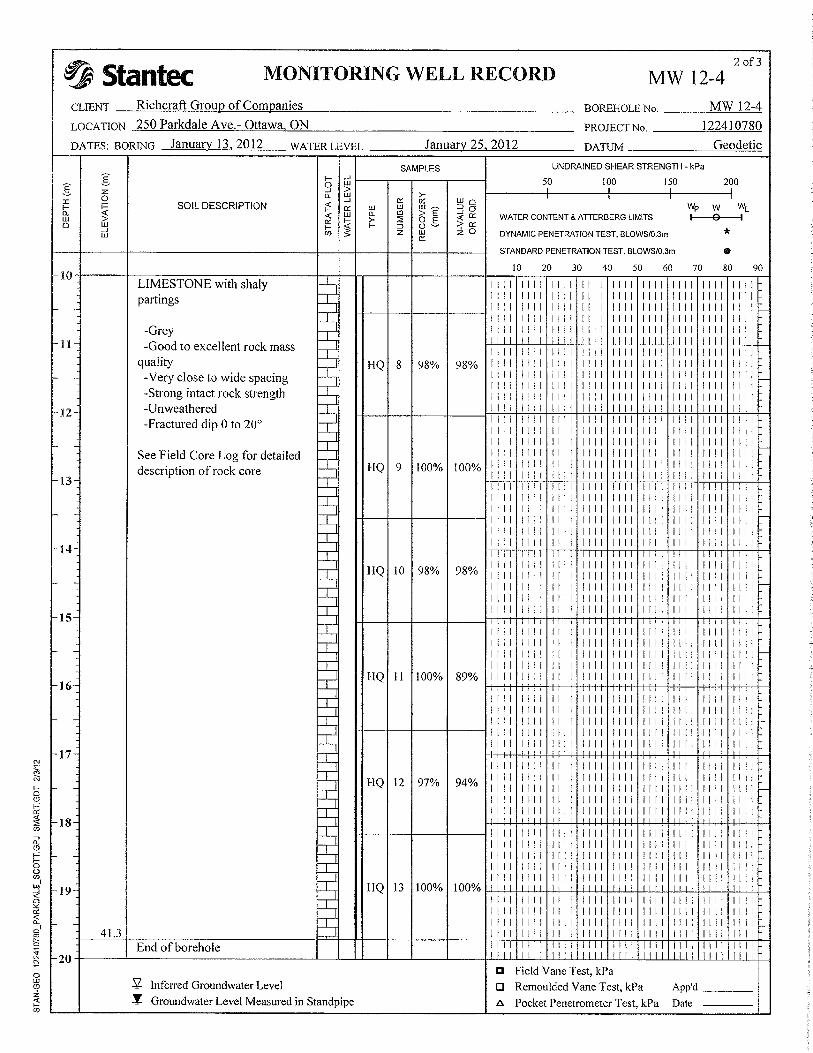
The field drilling program was carried out on January, 12 and 13, 2012. The five boreholes were advanced, at the locations shown on Drawing No. 2 in Appendix B, with a truck mounted CME 55 auger drill rig. The subsurface stratigraphy encountered in each borehole was recorded in the field by SCL personnel while performing Standard Penetration Tests (SPT). Split spoon samples were collected for surficial fill materials. Bedrock was cored with HQ size coring equipment in boreholes MW 12-3 and MW 12-4 to the depths of 16.5 m and 19.7 m below the ground surface respectively.
Following the investigation, all boreholes were backfilled with augered material. 50 mm diameter monitoring wells were installed in two holes, MW12-3 and MW12-4. Monitoring well MW12-3 was installed to 16.5 m below ground surface and MW 12-4 was installed to 19.7 m below ground surface.
Samples were returned to the laboratory and subjected to detailed visual examination and additional classification by a geotechnical engineer. Selected samples were tested for moisture content, particle size analysis, and intact rock core strength. Groundwater samples collected from the monitoring wells were submitted to Paracel Laboratories to measure pH, resistivity, chlorides, and sulphate content. Results of this testing are shown in Appendix D and on the Borehole and Test Pit Record in Appendix C.
Samples will be stored for a period of one (1) month after issuance of this report unless we are otherwise directed by the client.
Borehole locations were surveyed in the field by Stantec personnel using a Trimble Geo XH GPS. Geodetic ground surface elevations were obtained for all the boreholes and are accurate to 0.1 m.

FINAL GEOTECHNICAL REPORT May 2012
3
The ground surface elevations at the borehole locations are shown on the Borehole Records included in Appendix C.
5.0 Results of Investigation
5.1 SUBSURFACE INFORMATION
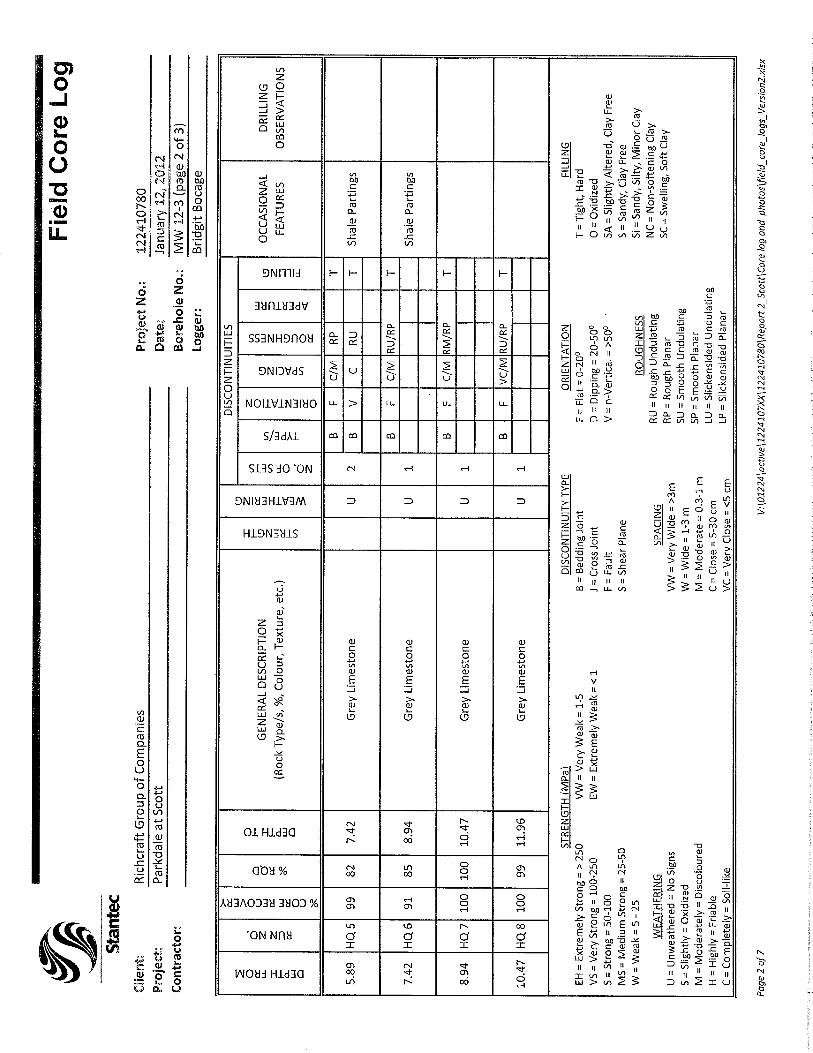
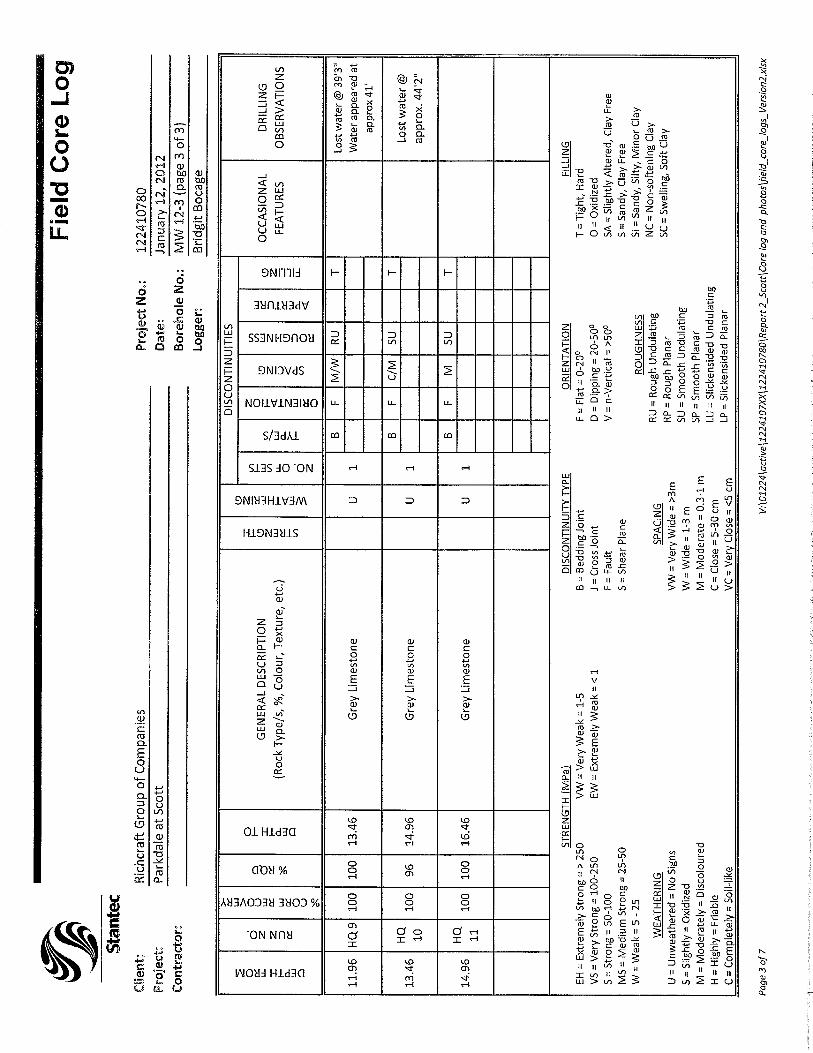
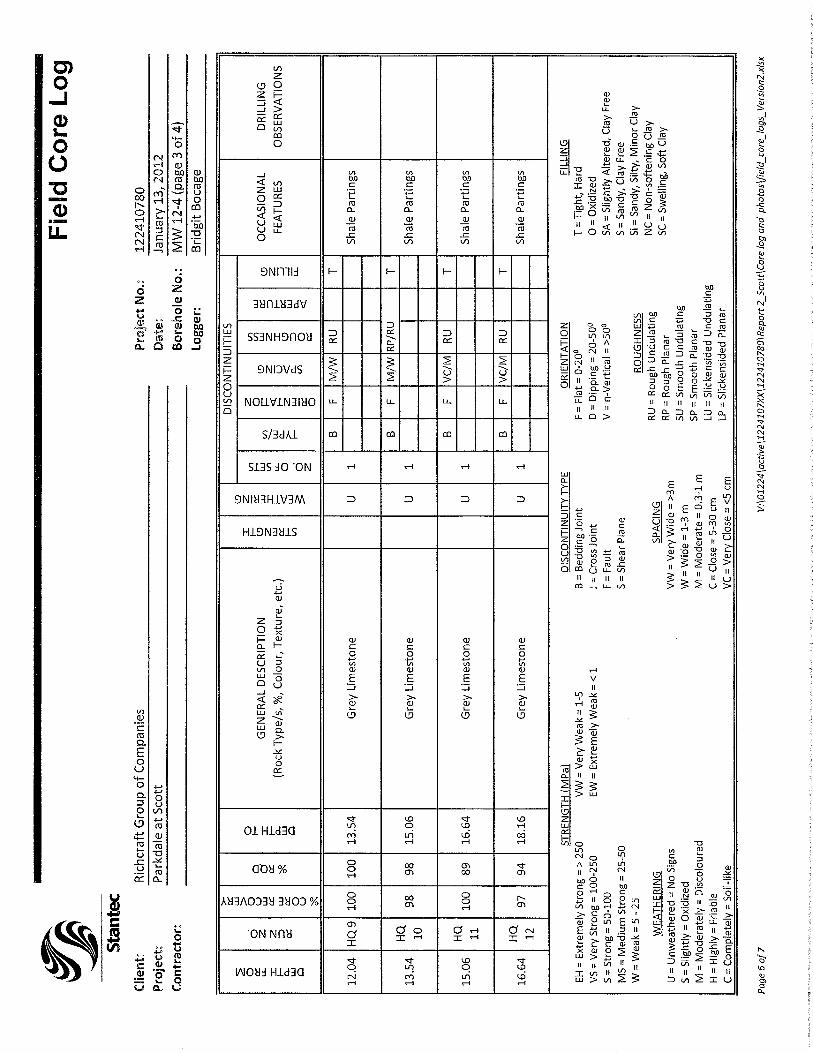
The subsurface conditions observed in the boreholes are presented in detail on the Borehole Records, Field Core Logs, and Bedrock Core Photos in Appendix C. An explanation of the symbols and terms used to describe the Borehole and Test Pit Records is also provided in Appendix C. In general, the observed stratigraphy consisted of fill material underlain by shallow bedrock.
A general overview of the soil, rock and groundwater conditions encountered in the boreholes is provided below.
5.1.1 Surficial Materials
Asphalt was encountered at the surface of all the boreholes. The asphalt varied from 25 mm to 76 mm in thickness.
Fill materials were observed in all the boreholes and varied from 0.4 m to 1.5 m in thickness. This material generally consisted of silty sand with gravel with some bricks and rock fragments. The moisture content of this material ranged from 10% to 12%. Gradation tests performed on this material show 13% to 46% gravel, 37% to 54% sand, and 15% to 32% fines (silt and clay). This material can be classified as a silty sand with gravel (SM) and silty gravel with sand (GM), according to the Unified Soil Classification System (USCS).
5.1.2 Bedrock
Limestone with shaly partings bedrock was encountered in all the boreholes. The depth to top of bedrock ranged from 0.4 m to 1.5 m below ground surface. The limestone had very close to wide joint spacing which had generally flat orientation. The rock was unweathered with shale partings.
Generally bedrock quality was good to excellent however the top portion of borehole MW 12-3 (down to 1.3 m depth) was observed to be fair quality. The Rock Quality Designation (RQD) varied from 61% to 100%. The unconfined compressive strength of the rock, which is summarized in Table 5.1, ranged from 77 MPa to 173 MPa. Rock Core logs and photos of the rock core are shown in Appendix C.

FINAL GEOTECHNICAL REPORT May 2012
4
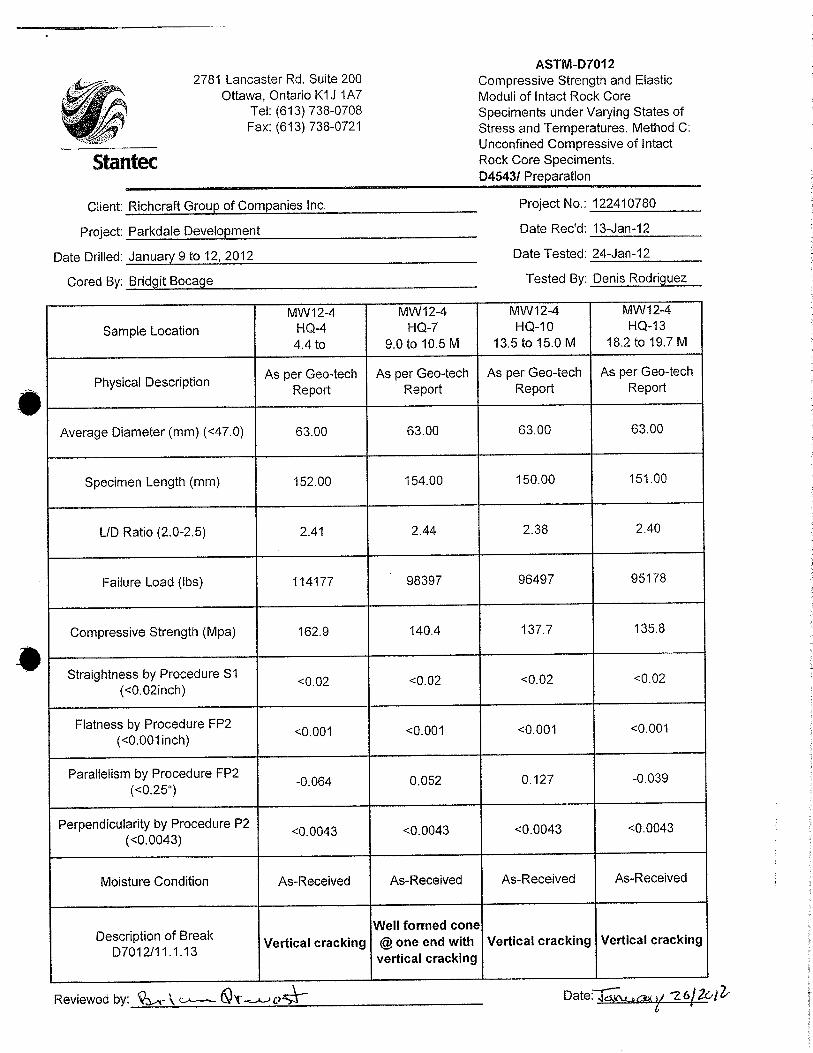
Table 5.1: Unconfined Compressive Strength of Rock Cores Borehole Depth (m) Unconfined Compressive Strength (MPa)
MW 12-3
5.2 172.8 9.7 183.9 12.8 132.3 15.8 77.2
MW 12-4
5.2 162.9 9.8 140.4 14.3 137.7 19.0 135.8
5.2 GROUNDWATER
Groundwater was measured by means of monitoring wells installed in boreholes MW 12-3 and MW 12-4. Groundwater was measured on January 25 and February 3, 2012. At monitoring wells MW 12-3 and MW 12-4, the groundwater level was measured at 9.60 m and 7.76 m below ground surface.
Fluctuation in the groundwater level due to seasonal variations or in response to a particular precipitation event should be anticipated.

FINAL GEOTECHNICAL REPORT May 2012
5
6.0 Discussion and Recommendations
The following geotechnical issues should be considered during design activities:
• Conventional spread footings founded on bedrock are appropriate for the design of the multi-storey building at this site.
• Groundwater was encountered at depths within the proposed depth of construction. It is anticipated that surface water run-off and groundwater can be controlled with sump and pump methods during construction.
• The bedrock on this site consists of limestone, with a measured unconfined compressive strength ranging between 77 MPa to 173 MPa which suggest strong to very strong rock.
• The Soluble sulphate concentrations show that a low degree of sulphate attack is expected for concrete in contact with soil and groundwater. Type GU Portland Cement should therefore be suitable for use in concrete at this site.
• The recommended Site Classification for Seismic Site Response for the site is Site Class A in accordance with 2006 Ontario Building Code.
6.1 SITE GRADING AND PREPARATION
6.1.1 Building Footprint
Footings should be founded on sound bedrock. Exposed bedrock surfaces should be free of loose bedrock, soil, water, bedrock irregularities, bedrock pinnacles and sloping surfaces. Hand cleaning and pressure washing of the bearing areas to remove any loose materials will be required to achieve the recommended bearing pressure.
Temporary frost protection should be provided for all footings if construction is carried out under winter conditions.
Prepared subgrade surfaces should be inspected by experienced geotechnical personnel prior to placement of either Structural Fill or concrete.
Structural Fill should conform to the requirements of OPSS Granular A. Structural Fill placed beneath building should contain no recycled materials such as concrete or asphalt. It should be compacted in lifts no thicker than 300 mm to at least 100% Standard Proctor Maximum Dry Density (SPMDD). This material should be tested and approved by a Geotechnical Engineer prior to delivery to the site.
Earth removals should be inspected by a geotechnical engineer to ensure that all unsuitable materials are removed prior to placement of fill or concrete. Inspection and testing services will be critical to ensure that all fill and concrete used is suitable and is placed competently.
6.1.2 Paved Areas
All vegetation, topsoil, existing asphalt and other deleterious material should be removed from beneath pavement areas. The subgrade should be proof rolled in the presence of geotechnical
FINAL GEOTECHNICAL REPORT May 2012
6
personnel. All soft areas revealed during proof rolling or subgrade inspections should be excavated to a maximum depth of 500 mm and replaced with compacted OPSS Granular B Type II.
6.2 FOUNDATIONS
The foundations for the proposed building may be supported on spread footings provided that the foundation preparation work described in Section 6.1 above is carried out. Spread footings should be placed on clean undisturbed sound bedrock.
Table 6.1 provides Geotechnical Bearing Resistances for shallow foundations on bedrock.
Table 6.1: Geotechnical Bearing Resistance for Foundations on Bedrock Foundation Type Footing Width (m) Geotechnical Resistance, ULS, (kPa)
Strip Footing 1.0 to 3.0 4500 Square Footing 1.0 to 3.0 5500
The factored geotechnical bearing resistance at ultimate limit states (ULS) incorporates a resistance factor of 0.5. The settlement of foundations founded on bedrock is expected to be negligible and therefore, the geotechnical reaction at Serviceability Limit States (SLS) is not provided for footings on bedrock.
The design frost depth is 1.8 m. All exterior spread footings and footings for unheated structures should be protected from frost action by a minimum soil cover of 1.8 m or equivalent insulation. Perimeter footings should be protected by a minimum soil cover of 1.5 m or equivalent insulation. Perimeter footings and interior footings within 1.5 m of perimeter walls of heated structures should be protected by a minimum soil cover of 1.5 m or equivalent insulation. Where proposed footings have insufficient soil cover for frost protection, the use of insulation will be required.
The base of all footing excavations should be inspected by a geotechnical engineer prior to placing concrete to confirm the design pressures and to ensure that there is no disturbance of the founding soils.
Where construction is undertaken during winter conditions, all footing subgrades should be protected from freezing. Foundation walls and columns should be protected against heave due to soil adfreeze.
6.3 SEISMIC SITE CLASSIFICATION
Existing VS30 measurements around the study site were reviewed to determine the site class according to the 2006 Ontario Building Code. The measurements were obtained from the geological Survey of Canada Surficial Boreholes for the National Capital Area. The data is accessible through the Carleton University website called the Interactive Surface Geography Map for the City of Ottawa. The selected boreholes are illustrated in Drawing No. 3 in Appendix B and the corresponding shear wave velocity information is shown in Table 6.2. This Table provides the average shear wave velocity in top 30 m for the studied sites (Vs30).
FINAL GEOTECHNICAL REPORT May 2012
7
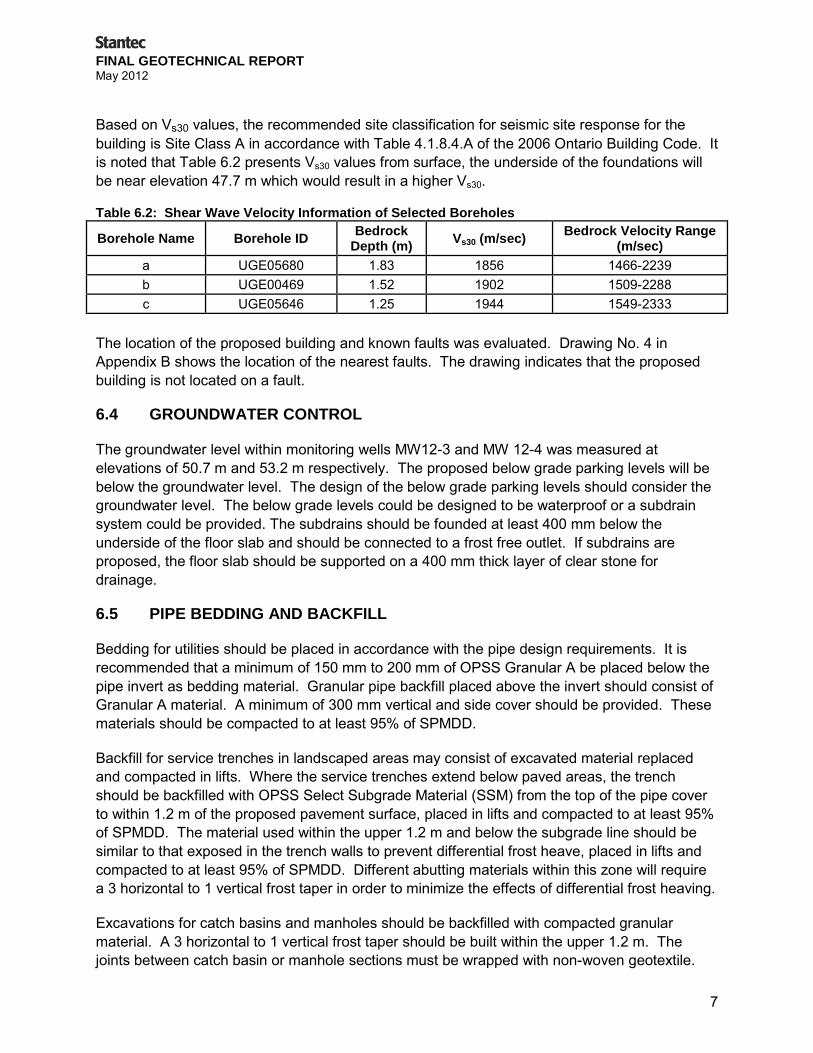
Based on Vs30 values, the recommended site classification for seismic site response for the building is Site Class A in accordance with Table 4.1.8.4.A of the 2006 Ontario Building Code. It is noted that Table 6.2 presents Vs30 values from surface, the underside of the foundations will be near elevation 47.7 m which would result in a higher Vs30.
Table 6.2: Shear Wave Velocity Information of Selected Boreholes
Borehole Name Borehole ID Bedrock Depth (m) Vs30 (m/sec) Bedrock Velocity Range
(m/sec) a UGE05680 1.83 1856 1466-2239 b UGE00469 1.52 1902 1509-2288 c UGE05646 1.25 1944 1549-2333
The location of the proposed building and known faults was evaluated. Drawing No. 4 in Appendix B shows the location of the nearest faults. The drawing indicates that the proposed building is not located on a fault.
6.4 GROUNDWATER CONTROL
The groundwater level within monitoring wells MW12-3 and MW 12-4 was measured at elevations of 50.7 m and 53.2 m respectively. The proposed below grade parking levels will be below the groundwater level. The design of the below grade parking levels should consider the groundwater level. The below grade levels could be designed to be waterproof or a subdrain system could be provided. The subdrains should be founded at least 400 mm below the underside of the floor slab and should be connected to a frost free outlet. If subdrains are proposed, the floor slab should be supported on a 400 mm thick layer of clear stone for drainage.
6.5 PIPE BEDDING AND BACKFILL
Bedding for utilities should be placed in accordance with the pipe design requirements. It is recommended that a minimum of 150 mm to 200 mm of OPSS Granular A be placed below the pipe invert as bedding material. Granular pipe backfill placed above the invert should consist of Granular A material. A minimum of 300 mm vertical and side cover should be provided. These materials should be compacted to at least 95% of SPMDD.
Backfill for service trenches in landscaped areas may consist of excavated material replaced and compacted in lifts. Where the service trenches extend below paved areas, the trench should be backfilled with OPSS Select Subgrade Material (SSM) from the top of the pipe cover to within 1.2 m of the proposed pavement surface, placed in lifts and compacted to at least 95% of SPMDD. The material used within the upper 1.2 m and below the subgrade line should be similar to that exposed in the trench walls to prevent differential frost heave, placed in lifts and compacted to at least 95% of SPMDD. Different abutting materials within this zone will require a 3 horizontal to 1 vertical frost taper in order to minimize the effects of differential frost heaving.
Excavations for catch basins and manholes should be backfilled with compacted granular material. A 3 horizontal to 1 vertical frost taper should be built within the upper 1.2 m. The joints between catch basin or manhole sections must be wrapped with non-woven geotextile.
FINAL GEOTECHNICAL REPORT May 2012
8
It should be noted that reuse of the site generated material will be highly dependent on the material’s moisture content at time of placement.
Backfill should be compacted in lifts not exceeding 300 mm.
6.6 TEMPORARY EXCAVATIONS AND BACKFILLING
6.6.1 Excavations in Soil
The shallow silty sand fill (maximum encountered thickness of 1.3 m) present at the site is considered a Type 3 soil in accordance with the Occupational Health and Safety Act (OHSA) and Regulations for Construction Projects. Temporary excavations in the overburden may be supported or should be sloped at 1 horizontal to 1 vertical from the base of the excavation and as per the requirements of OHSA. Alternatively, sheet piling or other support methods will be required. Excavations should be inspected regularly for signs of instability and flattened as required. The excavation support system should be designed to resist loads from traffic and foundations from adjacent structures.
6.6.2 Excavations in Bedrock
Drilling and blasting and hoe ramming techniques will be required to excavate bedrock. Temporary excavation in bedrock may be carried out at near vertical slopes, provided the trench sides are cleared of loose rock prior to workers entering the trench. If the bedrock is overly fractured such that the loose rock cannot be entirely removed, a temporary rock catchment system such as a wire mesh system should be used. The catchment system should be designed to contain and/or prevent loose rock particles from falling on workers within the excavation.
Bedrock excavation sidewalls adjacent to existing building foundations should be supported to ensure the stability of the existing buildings.
6.6.3 Groundwater
Groundwater was encountered during this geotechnical investigation within the depths of the anticipated excavations.
Though soils and bedrock permeability measurements were not included as part of this investigation, it is expected that dewatering of the excavations will be possible using conventional sump and pump techniques. It should be noted that groundwater elevations fluctuate seasonally. Dewatering of the excavation is not anticipated to cause settlement of soils due to groundwater lowering in the vicinity of the site.
6.6.4 Earth Pressures on Shoring Systems
Earth pressures will need to be considered in the design of shoring systems for temporary excavations during construction. Table 6.3 gives the coefficients of lateral earth pressure for shoring systems. These values are based on the assumption that a horizontal back slope will be utilized behind the shoring system.
FINAL GEOTECHNICAL REPORT May 2012
9
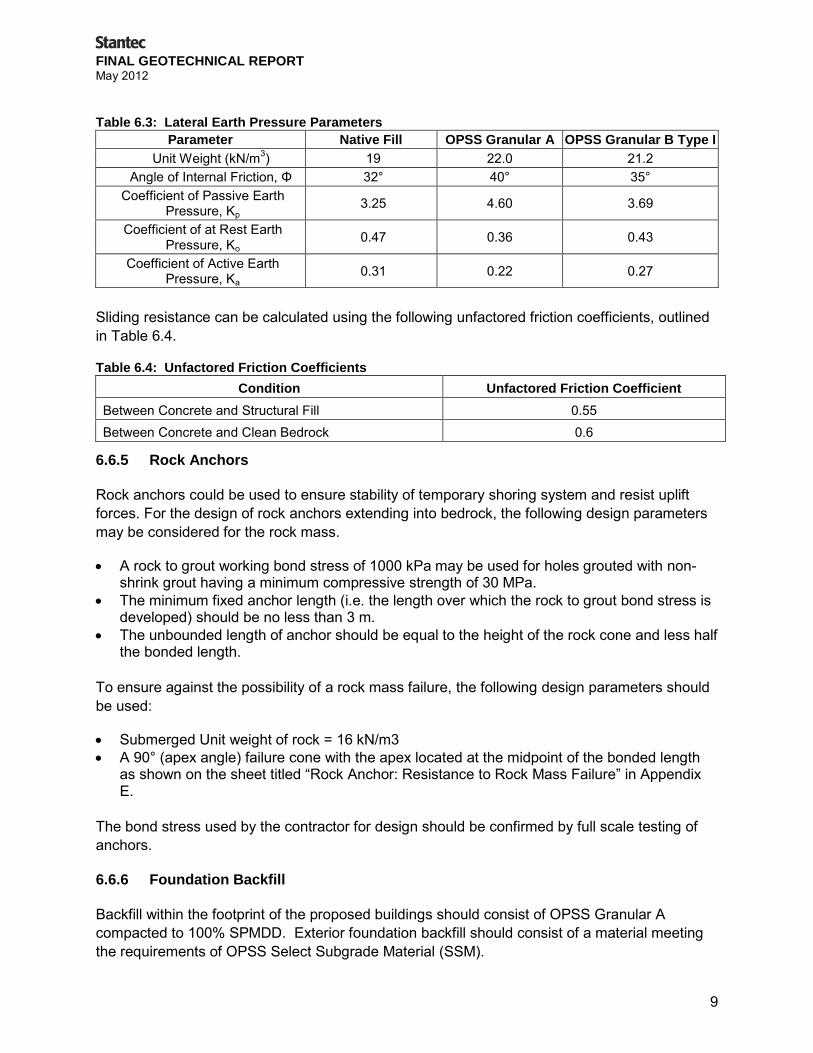
Table 6.3: Lateral Earth Pressure Parameters Parameter Native Fill OPSS Granular A OPSS Granular B Type I
Unit Weight (kN/m3) 19 22.0 21.2 Angle of Internal Friction, Φ 32° 40° 35°
Coefficient of Passive Earth Pressure, Kp
3.25 4.60 3.69
Coefficient of at Rest Earth Pressure, Ko
0.47 0.36 0.43
Coefficient of Active Earth Pressure, Ka
0.31 0.22 0.27
Sliding resistance can be calculated using the following unfactored friction coefficients, outlined in Table 6.4.
Table 6.4: Unfactored Friction Coefficients Condition Unfactored Friction Coefficient
Between Concrete and Structural Fill 0.55 Between Concrete and Clean Bedrock 0.6
6.6.5 Rock Anchors
Rock anchors could be used to ensure stability of temporary shoring system and resist uplift forces. For the design of rock anchors extending into bedrock, the following design parameters may be considered for the rock mass.
• A rock to grout working bond stress of 1000 kPa may be used for holes grouted with non-shrink grout having a minimum compressive strength of 30 MPa.
• The minimum fixed anchor length (i.e. the length over which the rock to grout bond stress is developed) should be no less than 3 m.
• The unbounded length of anchor should be equal to the height of the rock cone and less half the bonded length.
To ensure against the possibility of a rock mass failure, the following design parameters should be used:
• Submerged Unit weight of rock = 16 kN/m3 • A 90° (apex angle) failure cone with the apex located at the midpoint of the bonded length
as shown on the sheet titled “Rock Anchor: Resistance to Rock Mass Failure” in Appendix E.
The bond stress used by the contractor for design should be confirmed by full scale testing of anchors.
6.6.6 Foundation Backfill
Backfill within the footprint of the proposed buildings should consist of OPSS Granular A compacted to 100% SPMDD. Exterior foundation backfill should consist of a material meeting the requirements of OPSS Select Subgrade Material (SSM).

FINAL GEOTECHNICAL REPORT May 2012
10
Exterior foundation backfill shall be placed in lifts no thicker than 300 mm and compacted using suitable compaction equipment to at least 95% of SPMDD. Care should be taken immediately adjacent to the foundation walls to avoid over-compaction of the soil which could result in damage to the walls.
6.7 CEMENT TYPE AND CORROSION POTENTIAL
One representative groundwater sample was submitted to Paracel Laboratories Ltd. in Ottawa, Ontario, for pH, chloride, sulphate and resistivity testing. The test results are summarized in Table 6.5.
Table 6.5: pH, Sulphate, Chloride and Resistivity Analysis Results Borehole No. pH Sulphate (µg/g) Resistivity (0.01 ohm.m) Chloride (µg/g)
MW12-4 6.9 179 1.83 1950 One concentration of soluble sulphate provides an indication of the degree of sulphate attack that is expected for concrete in contact with soil and groundwater at the site. The soluble sulphate is 179 µg/g. Soluble sulphate concentrations less than 1000 µg/g generally indicate that a low degree of sulphate attack is expected for concrete in contact with soil and groundwater. Type GU Portland Cement should therefore be suitable for use in concrete at this site.
The pH, resistivity and chloride concentration provide an indication of the degree of corrosiveness of the sub-surface environment. The soil pH was 6.9 which is within what is considered the normal range for soil pH of 5.5 to 9.0. The pH levels of the tested soil do not indicate a highly corrosive environment. The test results provided in the Table 6.5 can be used to aid in the selection of coatings and corrosion protection systems for buried steel objects.
6.8 PAVEMENT STRUCTURE RECOMMENDATIONS
It has been assumed that the parking areas will be used mostly by passenger vehicles and the access roads will be used by delivery trucks and fire vehicles.
The subgrade in paved areas should be prepared as described in Section 6.1 above. The following minimum pavement structures are recommended:
Table 6.6: Recommended Pavement Design
Material Heavy Duty Parking Access Roads
Standard Duty Parking Area
SP 12.5 Asphaltic Concrete 40 mm 50 mm SP 19 Asphaltic Concrete 50 mm - Granular Base Course, OPSS Granular A 150 mm 150 mm
Granular Subbase Course, OPSS Granular B Type II 400 mm 300 mm
FINAL GEOTECHNICAL REPORT May 2012
11
It is estimated that the service life prior to major rehabilitation for the above pavement structures is 20 years provided they are properly maintained. The pavement surface and the underlying subgrade should be graded to direct runoff water towards suitable drainage.
All granular materials should be tested and approved by a geotechnical engineer prior to delivery to the site. Both base and subbase materials should be compacted to at least 100% SPMDD. Asphalt should be compacted to at least 97% Marshal bulk density.
It is recommended that the lateral extent of the subbase and base layers not be terminated in a vertical fashion immediately behind the curb line. A taper with a grade of 5 horizontal to 1 vertical is recommended in the subgrade line to minimize differential frost heave problems under sidewalks.
6.9 VIBRATIONS MONITORING AND PRE-CONSTRUCTION SURVEYS
The required construction activities for the proposed building will generate some vibrations that will be perceptible to nearby residents. The vibrations are expected to be greatest during bedrock excavation by blasting/mechanical methods. It is recommended that pre-construction surveys of all structures be carried out in accordance with OPSS 120 “General Specifications for the Use of Explosives”.
It is recommended that construction vibrations generally be limited to a maximum peak particle velocity as outlined in OPSS 120. Should there be structures in the area sensitive to vibrations, more stringent specifications should be developed by a vibration specialist. For instance, the particle velocity should be limited to 10 mm/sec if there is a historic building in the area. Vibration monitoring should be carried out prior to and throughout the construction period.
No blasting should be carried out within a distance of 200 m from any water storage reservoir, pumping station, water works transformer station or water storage tank without prior approval by the owner of the facility.


FINAL GEOTECHNICAL REPORT May 2012
APPENDIX A Statement of General Conditions
STATEMENT OF GENERAL CONDITIONS USE OF THIS REPORT: This report has been prepared for the sole benefit of the Client or its agent and may not be used by any third party without the express written consent of Stantec Consulting Ltd. and the Client. Any use which a third party makes of this report is the responsibility of such third party. BASIS OF THE REPORT: The information, opinions, and/or recommendations made in this report are in accordance with Stantec Consulting Ltd.’s present understanding of the site specific project as described by the Client. The applicability of these is restricted to the site conditions encountered at the time of the investigation or study. If the proposed site specific project differs or is modified from what is described in this report or if the site conditions are altered, this report is no longer valid unless Stantec Consulting Ltd. is requested by the Client to review and revise the report to reflect the differing or modified project specifics and/or the altered site conditions. STANDARD OF CARE: Preparation of this report, and all associated work, was carried out in accordance with the normally accepted standard of care in the state or province of execution for the specific professional service provided to the Client. No other warranty is made. INTERPRETATION OF SITE CONDITIONS: Soil, rock, or other material descriptions, and statements regarding their condition, made in this report are based on site conditions encountered by Stantec Consulting Ltd. at the time of the work and at the specific testing and/or sampling locations. Classifications and statements of condition have been made in accordance with normally accepted practices which are judgmental in nature; no specific description should be considered exact, but rather reflective of the anticipated material behavior. Extrapolation of in situ conditions can only be made to some limited extent beyond the sampling or test points. The extent depends on variability of the soil, rock and groundwater conditions as influenced by geological processes, construction activity, and site use. VARYING OR UNEXPECTED CONDITIONS: Should any site or subsurface conditions be encountered that are different from those described in this report or encountered at the test locations, Stantec Consulting Ltd. must be notified immediately to assess if the varying or unexpected conditions are substantial and if reassessments of the report conclusions or recommendations are required. Stantec Consulting Ltd. will not be responsible to any party for damages incurred as a result of failing to notify Stantec Consulting Ltd. that differing site or sub-surface conditions are present upon becoming aware of such conditions. PLANNING, DESIGN, OR CONSTRUCTION: Development or design plans and specifications should be reviewed by Stantec Consulting Ltd., sufficiently ahead of initiating the next project stage (property acquisition, tender, construction, etc), to confirm that this report completely addresses the elaborated project specifics and that the contents of this report have been properly interpreted. Specialty quality assurance services (field observations and testing) during construction are a necessary part of the evaluation of sub-subsurface conditions and site preparation works. Site work relating to the recommendations included in this report should only be carried out in the presence of a qualified geotechnical engineer; Stantec Consulting Ltd. cannot be responsible for site work carried out without being present.

FINAL GEOTECHNICAL REPORT May 2012
APPENDIX B Key Plan
Borehole Location Plan
VS30 Measurement Location Plan
Fault Location Plan


FINAL GEOTECHNICAL REPORT May 2012
APPENDIX C Symbols and Terms Used on Borehole Records
Borehole Records
Field Core Logs
Bedrock Core Photos

SYMBOLS AND TERMS USED ON BOREHOLE AND TEST PIT RECORDS – MARCH 2009 Page 1 of 3
SYMBOLS AND TERMS USED ON BOREHOLE AND TEST PIT RECORDS SOIL DESCRIPTION Terminology describing common soil genesis:
Topsoil - mixture of soil and humus capable of supporting vegetative growth
Peat - mixture of visible and invisible fragments of decayed organic matter
Till - unstratified glacial deposit which may range from clay to boulders
Fill - material below the surface identified as placed by humans (excluding buried services) Terminology describing soil structure:
Desiccated - having visible signs of weathering by oxidization of clay minerals, shrinkage cracks, etc. Fissured - having cracks, and hence a blocky structure Varved - composed of regular alternating layers of silt and clay
Stratified - composed of alternating successions of different soil types, e.g. silt and sand Layer - > 75 mm in thickness Seam - 2 mm to 75 mm in thickness
Parting - < 2 mm in thickness Terminology describing soil types: The classification of soil types are made on the basis of grain size and plasticity in accordance with the Unified Soil Classification System (USCS) (ASTM D 2487 or D 2488). The classification excludes particles larger than 76 mm (3 inches). The USCS provides a group symbol (e.g. SM) and group name (e.g. silty sand) for identification. Terminology describing cobbles, boulders, and non-matrix materials (organic matter or debris): Terminology describing materials outside the USCS, (e.g. particles larger than 76 mm, visible organic matter, construction debris) is based upon the proportion of these materials present:
Trace, or occasional Less than 10% Some 10-20%
Frequent > 20% Terminology describing compactness of cohesionless soils: The standard terminology to describe cohesionless soils includes compactness (formerly "relative density"), as determined by the Standard Penetration Test N-Value (also known as N-Index). A relationship between compactness condition and N-Value is shown in the following table.
Compactness Condition SPT N-Value
Very Loose <4 Loose 4-10
Compact 10-30 Dense 30-50
Very Dense >50 Terminology describing consistency of cohesive soils: The standard terminology to describe cohesive soils includes the consistency, which is based on undrained shear strength as measured by in situ vane tests, penetrometer tests, or unconfined compression tests.
Consistency Undrained Shear Strength
kips/sq.ft. kPa
Very Soft <0.25 <12.5 Soft 0.25 - 0.5 12.5 - 25 Firm 0.5 - 1.0 25 - 50 Stiff 1.0 - 2.0 50 – 100
Very Stiff 2.0 - 4.0 100 - 200 Hard >4.0 >200

SYMBOLS AND TERMS USED ON BOREHOLE AND TEST PIT RECORDS – MARCH 2009 Page 2 of 3
ROCK DESCRIPTION Terminology describing rock quality:
RQD Rock Mass Quality
0-25 Very Poor 25-50 Poor 50-75 Fair 75-90 Good
90-100 Excellent Rock quality classification is based on a modified core recovery percentage (RQD) in which all pieces of sound core over 100 mm long are counted as recovery. The smaller pieces are considered to be due to close shearing, jointing, faulting, or weathering in the rock mass and are not counted. RQD was originally intended to be done on NW core; however, it can be used on different core sizes if the bulk of the fractures caused by drilling stresses are easily distinguishable from in situ fractures. The terminology describing rock mass quality based on RQD is subjective and is underlain by the presumption that sound strong rock is of higher engineering value than fractured weak rock. Terminology describing rock mass:
Spacing (mm) Joint Classification Bedding, Laminations, Bands
> 6000 Extremely Wide - 2000-6000 Very Wide Very Thick 600-2000 Wide Thick 200-600 Moderate Medium 60-200 Close Thin 20-60 Very Close Very Thin <20 Extremely Close Laminated <6 - Thinly Laminated
Terminology describing rock strength:
Strength Classification Unconfined Compressive Strength (MPa)
Extremely Weak < 1 Very Weak 1 – 5
Weak 5 – 25 Medium Strong 25 – 50
Strong 50 – 100 Very Strong 100 – 250
Extremely Strong > 250 Terminology describing rock weathering:
Term Description
Fresh No visible signs of rock weathering. Slight discolouration along major discontinuities
Slightly Weathered Discolouration indicates weathering of rock on discontinuity surfaces. All the rock material may be discoloured.
Moderately Weathered Less than half the rock is decomposed and/or disintegrated into soil. Highly Weathered More than half the rock is decomposed and/or disintegrated into soil.
Completely Weathered All the rock material is decomposed and/or disintegrated into soil. The original mass structure is still largely intact.

SYMBOLS AND TERMS USED ON BOREHOLE AND TEST PIT RECORDS – MARCH 2009 Page 3 of 3
STRATA PLOT
Strata plots symbolize the soil or bedrock description. They are combinations of the following basic symbols. The dimensions within the strata symbols are not indicative of the particle size, layer thickness, etc.
Boulders Cobbles Gravel
Sand Silt Clay Organics Asphalt Concrete Fill Igneous Bedrock
Meta-morphic Bedrock
Sedi-mentary Bedrock
SAMPLE TYPE
SS Split spoon sample (obtained by performing the Standard Penetration Test)
ST Shelby tube or thin wall tube
DP Direct-Push sample (small diameter tube sampler hydraulically advanced)
PS Piston sample BS Bulk sample WS Wash sample
HQ, NQ, BQ, etc. Rock core samples obtained with the use of standard size diamond coring bits.
RECOVERY For soil samples, the recovery is recorded as the length of the soil sample recovered. For rock core, recovery is defined as the total cumulative length of all core recovered in the core barrel divided by the length drilled and is recorded as a percentage on a per run basis. N-VALUE Numbers in this column are the field results of the Standard Penetration Test: the number of blows of a 140 pound (64 kg) hammer falling 30 inches (760 mm), required to drive a 2 inch (50.8 mm) O.D. split spoon sampler one foot (305 mm) into the soil. For split spoon samples where insufficient penetration was achieved and N-values cannot be presented, the number of blows are reported over sampler penetration in millimetres (e.g. 50/75). Some design methods make use of N value corrected for various factors such as overburden pressure, energy ratio, borehole diameter, etc. No corrections have been applied to the N-values presented on the log. DYNAMIC CONE PENETRATION TEST (DCPT) Dynamic cone penetration tests are performed using a standard 60 degree apex cone connected to A size drill rods with the same standard fall height and weight as the Standard Penetration Test. The DCPT value is the number of blows of the hammer required to drive the cone one foot (305 mm) into the soil. The DCPT is used as a probe to assess soil variability. OTHER TESTS
S Sieve analysis H Hydrometer analysis k Laboratory permeability γ Unit weight
Gs Specific gravity of soil particles CD Consolidated drained triaxial
CU Consolidated undrained triaxial with pore pressure measurements
UU Unconsolidated undrained triaxial DS Direct Shear C Consolidation Qu Unconfined compression
Ip Point Load Index (Ip on Borehole Record equals Ip(50) in which the index is corrected to a reference diameter of 50 mm)
WATER LEVEL MEASUREMENT
measured in standpipe, piezometer, or well
inferred
Single packer permeability test; test interval from depth shown to bottom of borehole
Double packer permeability test; test interval as indicated
Falling head permeability test using casing
Falling head permeability test using well point or piezometer


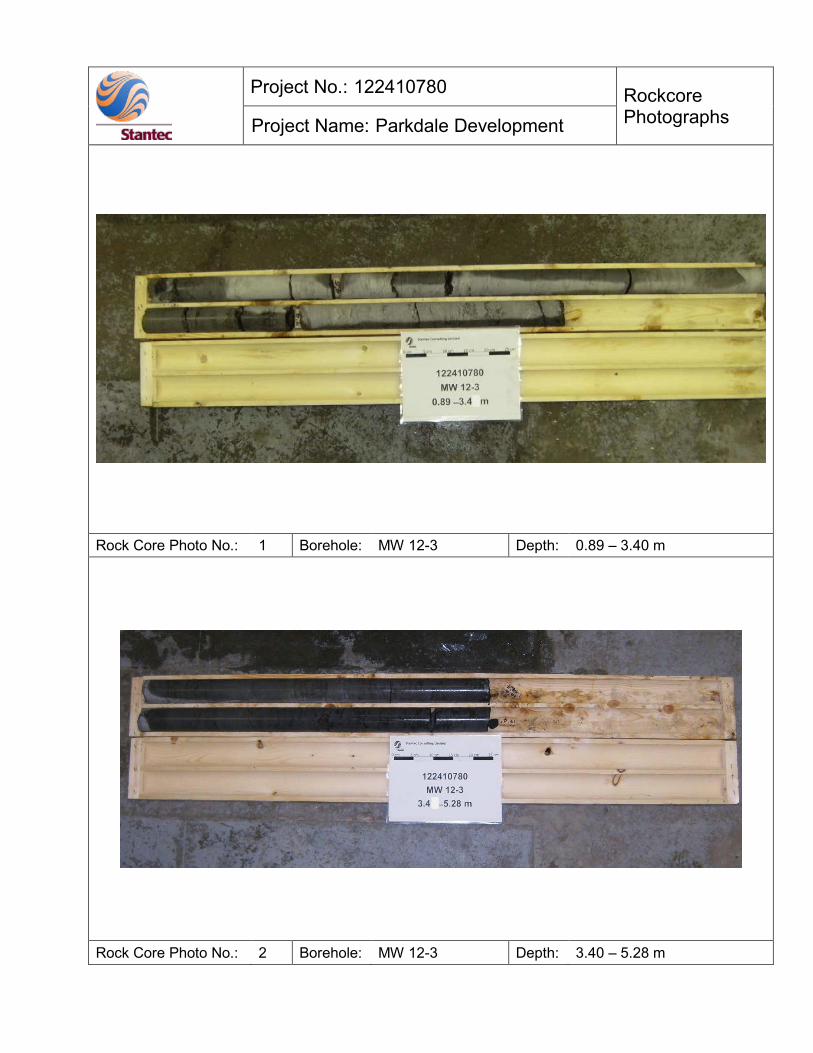
Project No.: 122410780 Rockcore Photographs Project Name: Parkdale Development
Rock Core Photo No.: 1 Borehole: MW 12-3 Depth: 0.89 – 3.40 m
Rock Core Photo No.: 2 Borehole: MW 12-3 Depth: 3.40 – 5.28 m

Project No.: 122410780 Rockcore Photographs Project Name: Parkdale Development
Rock Core Photo No.: 3 Borehole: MW 12-3 Depth: 5.28 – 7.42 m
Rock Core Photo No.: 4 Borehole: MW 12-3 Depth: 7.42 – 10.17 m

Project No.: 122410780 Rockcore Photographs Project Name: Parkdale Development
Rock Core Photo No.: 5 Borehole: MW 12-3 Depth: 10.17 – 13.08 m
Rock Core Photo No.: 6 Borehole: MW 12-3 Depth: 13.08 – 15.44 m

Project No.: 122410780 Rockcore Photographs Project Name: Parkdale Development
Rock Core Photo No.: 7 Borehole: MW 12-3 Depth: 15.44 – 16.46 m
Rock Core Photo No.: 8 Borehole: MW 12-4 Depth: 0.41 – 2.92 m
Project No.: 122410780 Rockcore Photographs Project Name: Parkdale Development
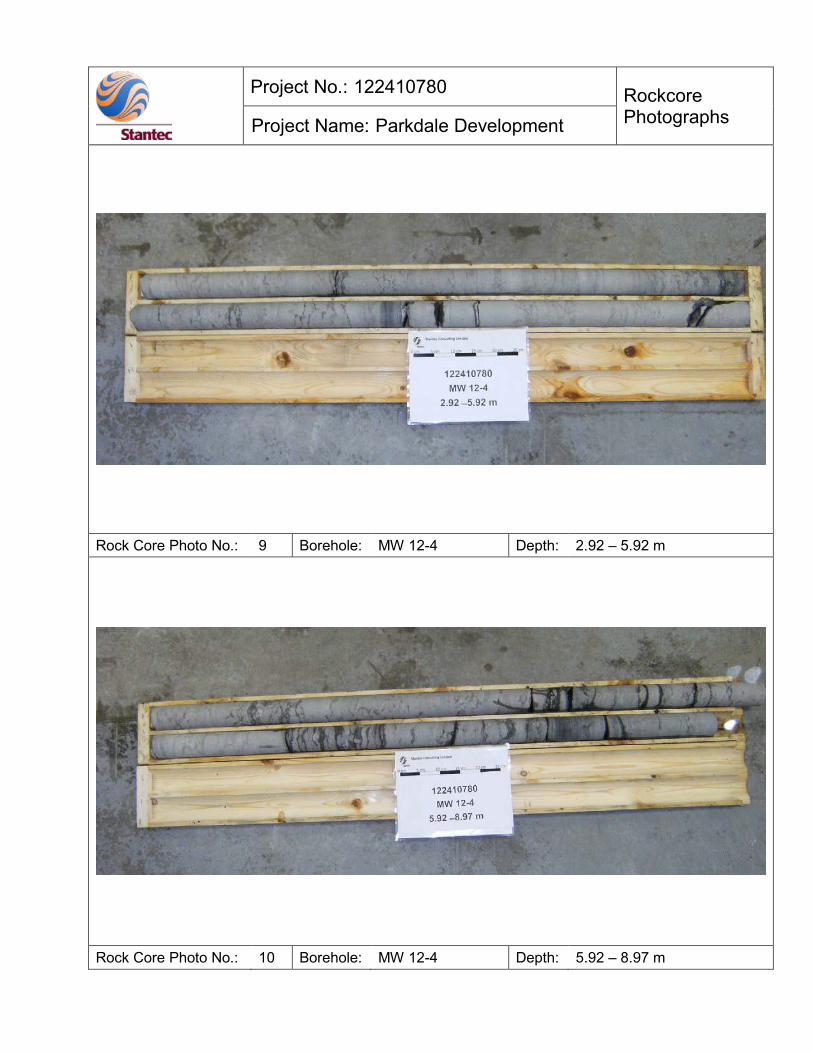
Rock Core Photo No.: 9 Borehole: MW 12-4 Depth: 2.92 – 5.92 m
Rock Core Photo No.: 10 Borehole: MW 12-4 Depth: 5.92 – 8.97 m
Project No.: 122410780 Rockcore Photographs Project Name: Parkdale Development
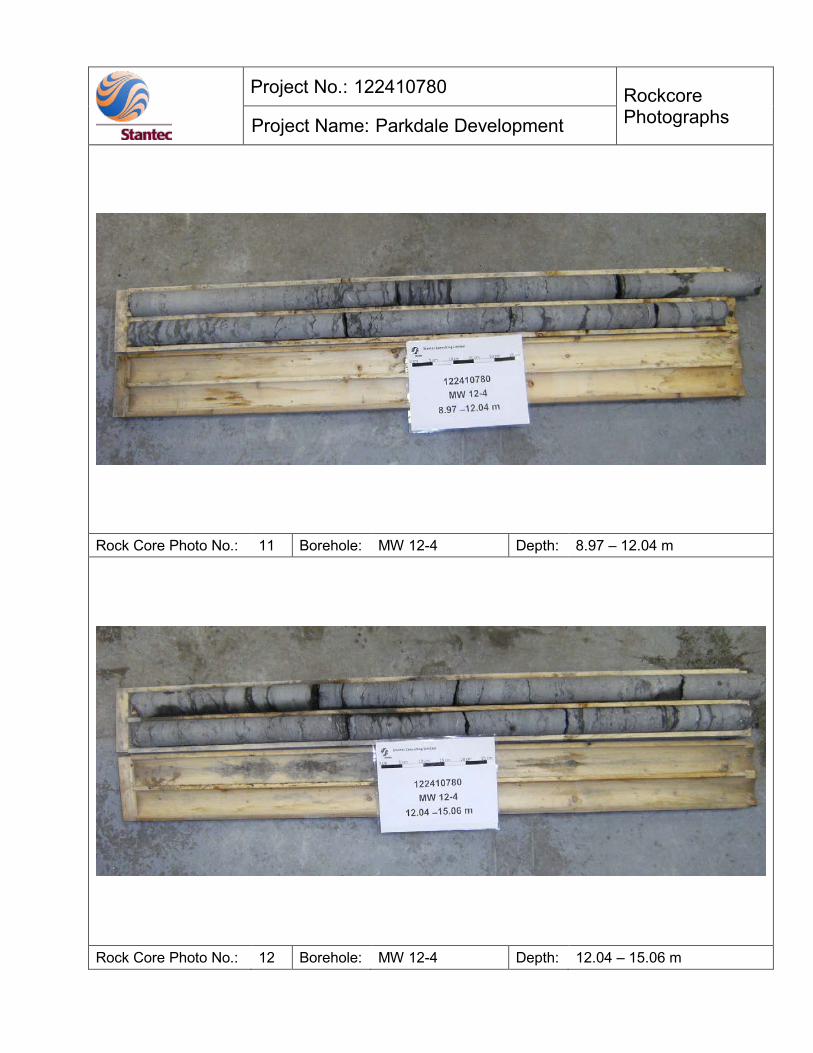
Rock Core Photo No.: 11 Borehole: MW 12-4 Depth: 8.97 – 12.04 m
Rock Core Photo No.: 12 Borehole: MW 12-4 Depth: 12.04 – 15.06 m
Project No.: 122410780 Rockcore Photographs Project Name: Parkdale Development
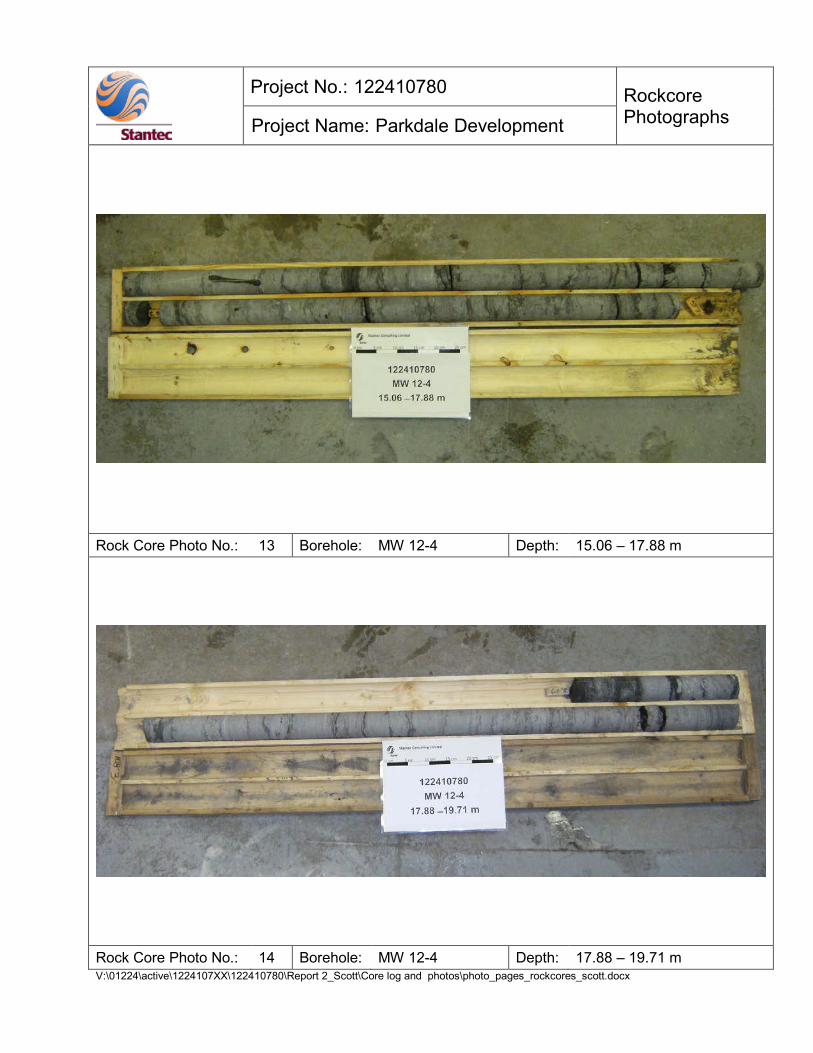
Rock Core Photo No.: 13 Borehole: MW 12-4 Depth: 15.06 – 17.88 m
Rock Core Photo No.: 14 Borehole: MW 12-4 Depth: 17.88 – 19.71 m V:\01224\active\1224107XX\122410780\Report 2_Scott\Core log and photos\photo_pages_rockcores_scott.docx

FINAL GEOTECHNICAL REPORT May 2012
APPENDIX D Laboratory Test Results
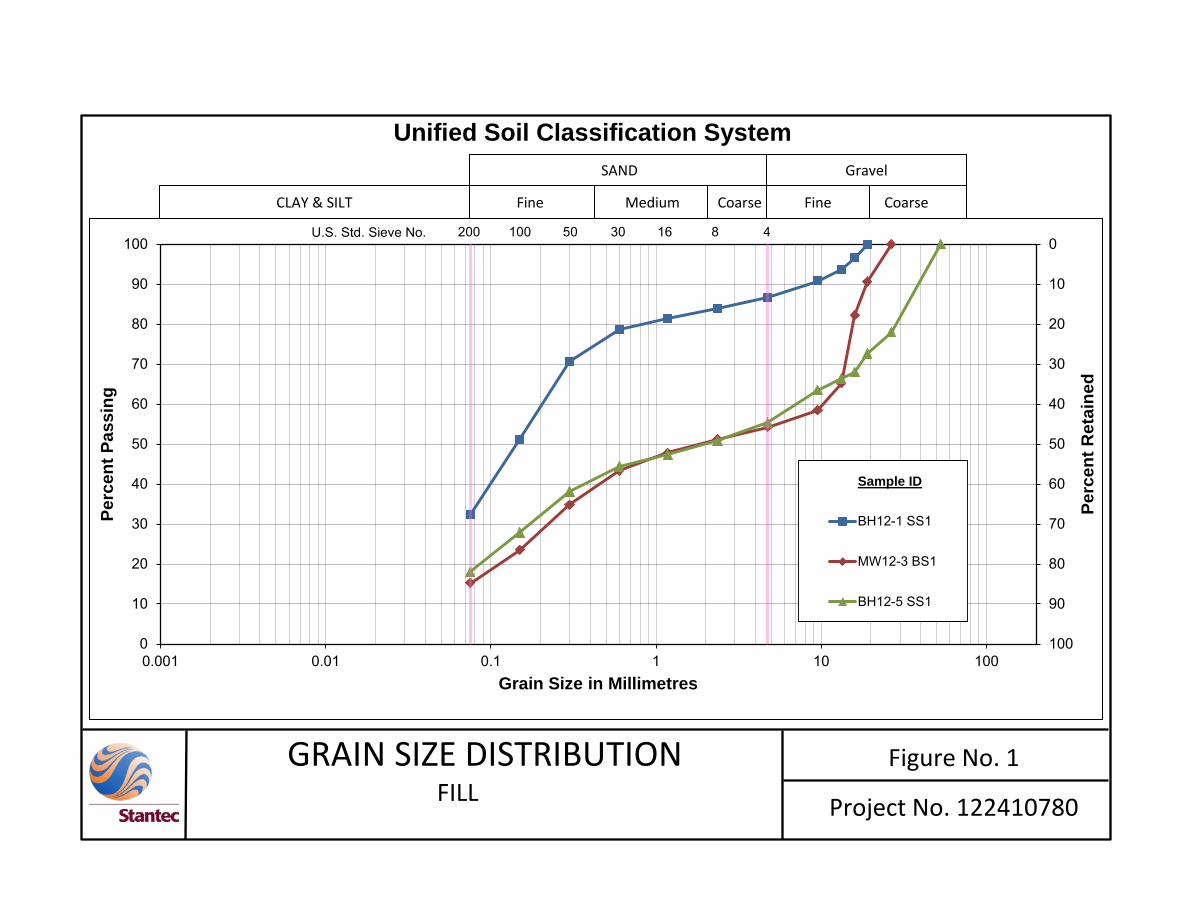
Unified Soil Classification System
Figure No. 1
Project No. 122410780
0
10
20
30
40
50
60
70
80
90
1000
10
20
30
40
50
60
70
80
90
100
0.001 0.01 0.1 1 10 100
Perc
ent R
etai
ned
Perc
ent P
assi
ng
Grain Size in Millimetres
Sample ID
BH12-1 SS1
MW12-3 BS1
BH12-5 SS1
Fine Medium Coarse Coarse
SAND Gravel
CLAY & SILT Fine
GRAIN SIZE DISTRIBUTION
FILL
8 16 30 50 100 200 U.S. Std. Sieve No. 4


FINAL GEOTECHNICAL REPORT May 2012
APPENDIX E Rock Anchor: Resistance to Rock Mass Failure