FINAL eMTB study report 03April2016 -...
28
A Comparison of Environmental Impacts from Mountain Bicycles, Class 1 Electric Mountain Bicycles, and Motorcycles: Soil Displacement and Erosion on BikeOptimized Trails in a Western Oregon Forest PREPARED FOR: Bicycle Product Suppliers Association PREPARED BY: The International Mountain Bicycling Association Trail Solutions Program PO Box 20280 Boulder, CO 80308 SOLUTIONS TRAIL
Transcript of FINAL eMTB study report 03April2016 -...
A Comparison of Environmental Impacts from Mountain Bicycles, Class 1 Electric Mountain
Bicycles, and Motorcycles: Soil Displacement and Erosion on Bike-‐Optimized
Trails in a Western Oregon Forest
PREPARED FOR: Bicycle Product Suppliers Association PREPARED BY: The International Mountain Bicycling Association
Trail Solutions Program PO Box 20280 Boulder, CO 80308
SOLUTIONSTRAIL

2
Table of Contents Abstract ................................................................................................................................................... 3 Introduction ........................................................................................................................................... 5
What is an eMTB? .......................................................................................................................................... 5 What's Needed ................................................................................................................................................ 6 Where to Start ................................................................................................................................................. 6 IMBA’s Role in Studying eMTBs .............................................................................................................. 7 Study Goals ...................................................................................................................................................... 7 Study Hypotheses ......................................................................................................................................... 7
Study Area .............................................................................................................................................. 9 Test Trail .......................................................................................................................................................... 10
Study Methods ................................................................................................................................... 12 Site Preparation ............................................................................................................................................ 12 Controlled Variables ................................................................................................................................... 12 Cross-Sectional Area “CSA” Measurements ................................................................................... 13 Condition Class Assessment (“CCA”) ................................................................................................ 14 Data Analysis ................................................................................................................................................ 15
Study Results ..................................................................................................................................... 16 Change in Tread Surface .......................................................................................................................... 16 Class 1 eMTBs vs. Traditional Mountain Bicycles ......................................................................... 18 ANOVA & Tukey HSD Test ....................................................................................................................... 19 Condition Class Assessment ................................................................................................................. 20
Discussion .......................................................................................................................................... 21 Study Limitations ......................................................................................................................................... 21 Access Implications for Land Managers ........................................................................................... 21
Conclusion .......................................................................................................................................... 23 Appendix A: Throttle Test ............................................................................................................. 24
Throttle Observations: Mini Test .......................................................... Error! Bookmark not defined. Appendix B: Literature Review ................................................................................................... 25 Literature Cited .................................................................................................................................. 27

3
Abstract In the fall of 2015, under contract with the Bicycle Product Suppliers Association (BPSA), with counsel from a field of recreation management experts, and through a review of existing studies of erosional impacts from trail users, the International Mountain Bicycling Association (IMBA) conducted a scientifically controlled field study designed to measure relative levels of soil displacement and erosion resulting from traditional mountain bicycles, electric mountain bicycles (eMTBs), and traditional off-road motorcycles (i.e. dirt bikes). The observations were compiled in controlled environmental conditions, with each type of bike making multiple passes on separated sections of the same trail within a single test site. IMBA developed these hypotheses for this small initial study:
• Soil displacement and erosion caused by mountain biking will be consistent with existing studies showing relatively low impact as with other types of non-motorized travel on this type trail (a bike-optimized trail also considered a sustainable trail) and this set of local conditions.
• Soil displacement and erosion from Class 1 eMTBs will likely fall somewhere between those caused by mountain bikes and motorcycles. It is expected that they will much more closely resemble those of mountain bikes.
• It is expected that Class 1 eMTBs may lead to greater soil displacement under certain conditions, such as through turns, including bermed turns; on ascents and descents; and where there are abrupt changes in trail conditions.
Results from the field experiment show that, under this set of conditions, soil displacement and tread disturbance from Class 1 eMTBs1 and traditional mountain bikes were not significantly different, and both were much less than those associated with a gasoline-powered motorcycle. Understanding the potential resource impacts of trail-based recreation is a necessary and important first step for formulating management strategies. This is especially important for new types of recreational pursuits, such as the fast emerging power-assisted vehicles like eMTBs. Additional research is needed to further assess the range of environmental and social impacts for successful eMTB use on public lands. Mountain bicycling is a solely muscle-powered activity, and is thus regulated as a non-motorized use, along with hiking, trail running, and horseback riding. eMTBs are not entirely muscle-powered. IMBA recognizes that eMTBs, particularly Class 1 eMTBs, are substantially different from other motorized uses, and may warrant a separate category and new management strategies. IMBA does not have an advocacy interest in this Class 1 eMTB study, but is leading this study 1 A “Class 1 electric bicycle,” or “low-speed pedal-assisted electric bicycle,” is a bicycle equipped with a motor that provides assistance only when the rider is pedaling, and that ceases to provide assistance when the bicycle reaches the speed of 20 miles per hour.

4
as a respected partner of land management agencies; to further knowledge about recreational trails; and to inform future discussions with members, chapters, land mangers, the bike industry, and other user groups.

5
Introduction The emergence of electric bicycles, commonly known as e-bikes, is a rapidly growing component of the bicycle market in the US (MacArthur and Kobel, 2014). As a transportation option, they represent an opportunity to reduce vehicle use and emissions, as well as the physical barriers to cycling. For use on trails, they present similar opportunities to reduce barriers to cycling but, as a new use, present new challenges for trail management. While already popular in Europe, the use of eMTBs is on the rise in North America, and their increased presence is sparking controversy within the trail user community. Electric mountain bikes are generally defined as motorized vehicles for the purposes of trail use on federal lands, with states and municipalities expected to make their own decisions. All trail users affect the trail surface and surrounding environment, especially when trails are poorly constructed. Those impacts range from vegetation loss to soil erosion, and related water quality problems. However, there is no evidence that traditional mountain bicycling causes greater environmental impact than other recreational trail uses. In fact, current research suggests that mountain bicycling impacts are similar to hiking, and less damaging than equestrian and motorized users. There have been no studies of the environmental impacts of eMTBs specifically, but there exist numerous studies on the impacts of both mountain bicycles and off-road motorcycles, which provide a basis for developing research protocols. One could speculate that the impacts of eMTBs on trails would fall somewhere between the two modes, but this is a rather wide span, particularly regarding soil displacement under certain trail conditions, e.g., turn exits, steep grades, and/or non-cohesive soils. The lack of existing data may contribute to poor trail management decisions that may either unnecessarily ban eMTBs from trails or allow them where their impacts will be disproportionate to their use. An understanding of how eMTBs affect the environment and trail management is needed so that land managers and the communities that support them can make informed access decisions. The purpose of this study was not to decide whether eMTBs should be regulated as bicycles or motorcycles, or whether they are appropriate for shared-use on non-motorized trails. These decisions are for land managers to make in consultation with their recreation community. This report provides an understanding of some of physical impacts to trails associated with this use, and how these might differ from those associated with traditional mountain bicycles. What is an eMTB? A Class 1 eMTB is an e-bike that can be pedaled under human power alone as well as pedaled with the assistance of a battery-powered electric motor. eMTBs are capable of and primarily designed for off-road use, with wider, lugged tires, a sturdier frame, and front or dual suspension

6
systems. State traffic codes and regulations apply to transportation routes (e.g. streets and bike paths) only and have no bearing on recreational routes (e.g. singletrack trails), so it is up to land management agencies at each level of government to define their own rules and regulations regarding eMTB use. The current definition of eMTBs defines them as motorized vehicles for the purposes of recreational trail use on federal lands, with states and municipalities looking to federal agencies for guidance. However, states and municipalities generally have greater flexibility in defining trail access than federal agencies. What's Needed An understanding of how eMTBs affect the environment and trail management is needed so that land managers and the communities that support them can make informed decisions about trail design, construction, and management. In order to achieve a better understanding of the impacts of eMTBs on the trail landscape, several factors need to be studied:
• Test Riding: Comparison of eMTBs alongside mountain bicycles and motorcycles helps understand how eMTBs perform and are used on trails, what the experience is, and how that might affect other trail users.
• Test Trails: It is likely that impacts to trails are somewhere between mountain bikes and motorcycles, but this is unknown. Test trails are needed to understand and measure the effects on trails directly and to the surrounding environment. Future efforts should focus on developing and testing eMTB-specific trails.
• Special considerations for trail design, construction, and maintenance o Grade, turns, jumps, and trail direction are some of the trail design and
management characteristics that could be affected. o Weight: eMTBs are considerably heavier than mountain bicycles but as
technologies improve, weight may become less and less of a factor and may ultimately be indistinguishable from regular mountain bicycles.
o Ascending trails: eMTBs make ascending even very steep and technical trails easier. Power and ability to keep weight over rear wheel can help to maintain traction.
• How the trail experience is similar to and differs from mountain bicycling Empirical study is the best way to understand the impacts and make reasonable assertions regarding environmental and social effects. Where to Start There are a host of potential environmental impacts to the landscape from any trail user, from soil erosion to the spread of invasive species and wildlife impacts. For this initial study, it was important to select a project suitable for the scope and that would provide meaningful initial data

7
for future studies. Soil displacement and erosion were selected as the best choice for this first small-scale study. “Soil erosion is the single most important, managerially significant trail degradation indicator.” (Jewell & Hammitt, 2000)
IMBA’s Role in Studying eMTBs IMBA has an interest in continuing to deliver best practices in trail construction and management. IMBA does not directly gain from this study. A cursory look at IMBA’s eMTB user survey, along with the comments on blog posts and magazine articles, suggests that IMBA risk the ire of a share of its members in engaging in this study. While eMTBs are motorized, they most closely resemble traditional mountain bicycles and have the potential to impact mountain bicyclists more than other users. As such, IMBA has an obligation to provide information to land managers, its members, and trail communities in managing and creating experiences appropriate for this evolving use. As the leader in trail design, construction, and management, IMBA possesses the requisite set of skills to provide technical assistance to study the effects of eMTBs on trails. Likewise, IMBA’s role in providing user management resources to land managers makes it imperative that IMBA take a leadership role in identifying conflicts and opportunities presented by the advent and evolution of eMTBs. Study Goals The goals of the study are to:
• Further IMBA’s overall knowledge base regarding trail design, trail construction, and environmental impacts related to mountain biking and other trail uses.
• Provide an objective analysis of the physical impacts of Class 1 eMTBs relative to traditional mountain bikes and traditional dirt bikes by measuring soil displacement after hundreds of passes on a controlled course.
• Gather information regarding possible social impacts associated with Class 1 eMTBs. • Provide land managers with data and analysis to assist them in making informed
decisions regarding appropriate access. • Create a baseline of data about the impacts of Class 1 eMTBs, which will inform what
types of additional studies are warranted. Study Hypotheses
• Soil displacement and erosion caused by mountain biking will be consistent with existing studies showing relatively low impact as with other types of non-motorized travel on this

8
type of trail (a bike-optimized trail is also considered a sustainable trail) and this set of local conditions.
• Soil displacement and erosion from Class 1 eMTBs will likely fall somewhere between those caused by mountain bikes and motorcycles. It is expected that they will much more closely resemble those of mountain bikes.
• It is expected that Class 1 eMTBs may lead to greater soil displacement under certain conditions, such as through turns, including bermed turns; on ascents and descents; and where there are abrupt changes in trail conditions.

9
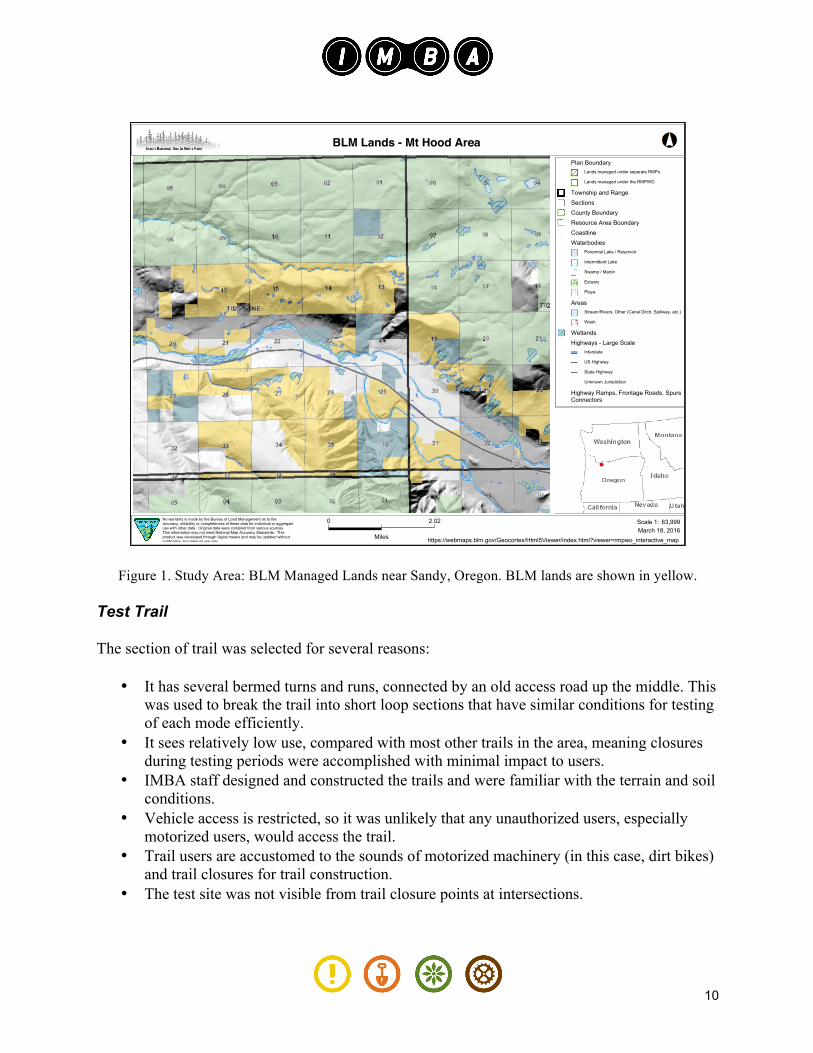
Study Area The study took place on existing trails on Bureau of Land Management (BLM) lands in Northwest Oregon. The BLM and IMBA have a regional assistance agreement to cooperate in trail related planning, design, and research. The test trail sections were on low-use bike-optimized trails, designed and constructed using IMBA best management practices, with short sections of former extraction roads used to create short loops for each mode. Topography of the test site is generally north-facing aspect with moderate slopes ranging from 20-50%, at elevations ranging from 2,100-2,300 feet (640-700 m). Average rainfall is 80 inches per year (203 cm), with a temperate climate characterized by wet winter and spring, and dry summer months. Soils in the area are well draining, comprised of volcanic Zygore gravelly loams, with parent material of volcanic ash over colluvium derived from basalt and andesite. (NRCS, 2016.) Prior to testing, soils were consistently very dry across the test site, the area having experienced lower than average spring precipitation. The vegetation is typical of Western Cascade foothills, dominated by a Douglas fir-Western hemlock forest community, with Western red cedar, red alder, and big leaf maple also common. Understory is comprised primarily of Oregon grape (Mahonia sp), salal (Gaultheria shallon), and sword fern (Polystichum minutum); with grasses and blackberry (Rubus discolor and R. ursinus) dominating along open roadbeds.
10
Figure 1. Study Area: BLM Managed Lands near Sandy, Oregon. BLM lands are shown in yellow.
Test Trail The section of trail was selected for several reasons:
• It has several bermed turns and runs, connected by an old access road up the middle. This was used to break the trail into short loop sections that have similar conditions for testing of each mode efficiently.
• It sees relatively low use, compared with most other trails in the area, meaning closures during testing periods were accomplished with minimal impact to users.
• IMBA staff designed and constructed the trails and were familiar with the terrain and soil conditions.
• Vehicle access is restricted, so it was unlikely that any unauthorized users, especially motorized users, would access the trail.
• Trail users are accustomed to the sounds of motorized machinery (in this case, dirt bikes) and trail closures for trail construction.
• The test site was not visible from trail closure points at intersections.
No warranty is made by the Bureau of Land Management as to the accuracy, reliability or completeness of these data for individual or aggregate use with other data. Original data were compiled from various sources. This information may not meet National Map Accuracy Standards. This product was developed through digital means and may be updated without notification. For internal use only.
Scale 1:March 18, 2016
https://webmaps.blm.gov/Geocortex/Html5Viewer/index.html?viewer=rmpwo_interactive_map
63,999
Miles
0 2.02
BLM Lands - Mt Hood AreaPlan Boundary
Lands managed under separate RMPs
Lands managed under the RMPWO
Township and RangeSectionsCounty BoundaryResource Area BoundaryCoastlineWaterbodies
Perennial Lake / Reservoir
Intermittent Lake
Swamp / Marsh
Estuary
Playa
AreasStream/Rivers, Other (Canal Ditch, Spillway, etc.)
Wash
WetlandsHighways - Large Scale
Interstate
US Highway
State Highway
Unknown Jurisdiction
Highway Ramps, Frontage Roads, Spurs, Connectors
Land OwnershipBureau of Land Management
U.S. Forest Service
National Park Service
U.S. Fish and Wildlife Service
Bureau of Indian Affairs
Other Federal
State
Local Government
Private/Unknown

11
The trail was closed during preparation and testing. Trail construction warning and temporary closure signs were placed at access points to this trail section and at key decision points within the trail system in order to restrict use outside of test laps. Given the potential for controversy regarding eMTBs among the mountain bicycling community, care was taken in not disclosing the location of the test site prior to and during field testing to avoid tampering with the test site.

12
Study Methods Site Preparation
• Test trails were along the same section of trail, with no intersections. • Test loops ranged from 1900 to 3100 feet (~600 to 950 m) in length, comprised of a
contour singletrack descending section, with rollers, dips, and a bermed turn. Singletrack trail sections were connected into loops using an old roadbed. Each roadbed climb had two at-grade steep turns (20-25% grade) and a straight run at 12-15% grade.
• Ten permanent sample sites were set up on each loop to observe and record cross-sectional areas (CSA). Seven sample sites were established on each singletrack section, with three sample sites on each roadbed section.
• Sample sites were paired to match trail conditions for each loop (e.g. each had sample sites at comparable locations on bermed turns, road bed climbs, trail grade, tread texture, etc.). Sample sites were selected to capture a range of trail conditions.
o Two plastic survey stakes (16” x 2”) were placed at each sample location, perpendicular to the trail tread, 51.2 inches (130 cm) apart (the span of the CSA measurement tool), as measured from the center of the stake head. Stakes were placed into the ground so that the head was flush with the surface. Efforts were made to keep stake heads as close to level as possible, in some cases meaning that part of the head of the stake was countersunk.
o Each stake was identified with the sample site number and a letter indicating whether it was on the uphill (“A”) or downhill (“B”) side of the tread. For roadbed locations, or where uphill and downhill was not obvious, the left side marker (as one faced the trail in the direction of travel for the test) was labeled as “uphill” (“A”).
o In order to ensure that the sampling location could be relocated in the event of tampering or other damage to the placement of the markers, survey marker locations were measured from reference tree markers (round pre-numbered aluminum tags, affixed to trees using aluminum nails). The distance (to 0.1 cm) and bearing to two tree markers was recorded for each survey marker location.
Controlled Variables To the extent feasible given the study scope, effort was made to control for environmental, equipment, and rider variables. Environmental variables controlled across sample sites include:
• Soil type • Soil moisture • Vegetation type and canopy cover • Level of use • Tread texture and surface stability

13
• Trail feature (e.g. roller, dip, insloped turn) • Trail grade
Equipment and rider variables controlled:
• Wheel size (for MTB and Class 1 eMTB) • Tire make and model (for MTB and Class 1 eMTB) • Tire pressure (for MTB and Class 1 eMTB) • Rider skill and weight
Cross-Sectional Area “CSA” Measurements
• A CSA tool was created to allow for consistent, replicable measurements at each sample station (Figure 2). The CSA tool was placed at a fixed height on the uphill side, at 30 cm above the survey marker surface. The downhill side was adjusted in height until level along the horizontal.
• Three levels were monitored (1 horizontal axis and 2 vertical axes) throughout the sampling to maintain consistent measurements. Measurements were replicable to +/-1 mm at each interval.
Figure 2: Layout of trail transect and formula for calculating CSA. (From: (Cole, 1983)
• CSA was measured at each sampling station. Vertical measurements were captured using the CSA tool at 10 cm intervals across the trail tread, up to 120 cm from the uphill side fixed marker.
• Measurements were taken at 0 (prior to test), 50, 100, 200, and 500 laps for Class 1 eMTB and mountain bike modes. Motorcycle mode was measured at 0, 50, 100, and 200 laps.
• Motorcycle laps were discontinued after 200 laps due to concerns regarding tread damage.

14
• All test riders were advanced to expert riders and were asked to ride as they normally would.
• CSA measurements and photos were taken at 0, 50, 100, 200, and 500 laps. • Soil moisture was captured at each sample location twice daily during testing (in the
morning and afternoon) using a HydroSense soil moisture meter (volumetric water content measured at 6-12 cm depth).
• Additional observations captured include disturbance area and condition class along the entire tread (not just at sample sites).
Figure 3. CSA measurements along the test trail loops at permanent sampling stations.
Condition Class Assessment (“CCA”) A CCA was used to assess the overall impact of experimental treatments along the full length of each trail segment (not exclusively at sampling sites). CCAs are commonly used in trail assessments to provide rapid, qualitative evaluations of site conditions. Classes were modified to reflect the range of disturbance conditions at this test site. (Jewell & Hammitt, 2000; J. L. Marion & Leung, 2001)
Condition'Class'Assessment
DescriptionDepth,(loose,soil),,cm
Trench,depth,,cm
CC1 no,to,minimal,disturbance,,not,visibly,different,from,start,condition <0.5 <0.5
CC2minor,disturbance,,less,than,half,tread,width,,noticable,soil/litter,movement 0.5C2 <0.5
CC3moderate,disturbance,,greater,than,half,of,tread,width,,noticable,soil,movement,,loose,soil,evident 2.0C4.0 0.5C2.0
CC4high,disturbance,,loose,soil,common,throughout,tread,,accumulation,evident,,some,trenching/breaking,tread,evident 4.0C6.0 2.0C4.0
CC5 severe,disturbance,,trenching,and,piling,of,soil >6cm >4.0

15
Data Analysis
• Data preparation: Any soil movement or change in the tread surface is important to capture, not just soil loss. Loose soil is often pushed to the side such that no change in total CSA would be measured, but this loose soil is available for erosion. Total change in soil surface is used, whether an increase or decrease was recorded (absolute value of change from 0-lap measurement).
• For group pairs, t-tests (two-sample and Welch) were used to compare sample means. Analysis of Variance (ANOVA) was used to compare sample groups, with a Tukey Honest Significant Difference test (Tukey HSD) as a post-hoc test to determine significance for group pairs.
• Data were transformed as needed to meet test assumptions. • Data analysis was conducted using R (The R Foundation, version 2.15.1).

16
Study Results This small study represents a very limited set of site and user conditions, the results of which may or may not be replicated in other locations and test conditions. No broad conclusions should be made from the observations presented. Change in Tread Surface One way to visualize soil movement (displacement and/or erosion) is to show a profile of trail sample sites. In order to compare paired sites (sample sites with similar trail conditions: slope, grade, texture, and feature), only the change in tread surface is shown and absolute values are used so that both soil increases and decreases can be illustrated, as any soil movement was important to capture. This allows for side-by-side comparison of sample sites by trail condition. A few selected sample sites are shown below (Figures 4-6).
Figure 4. Trail profiles at 0 and 500 laps (200 laps for motorcycle). These show change in tread surface from the 0 lap measurement. For the motorcycle, you can see both trenching and piling of soil material as soil is displaced side-to-side and pushed downslope. These are from comparable sample sites on the roadbed.
The sample site illustrated in Figure 4 is for a short steep climb on a roadbed. Under these site conditions, the mountain bicycle and Class 1 eMTB show similar soil movement (low), while the the motorcycle showed much greater soil displacement and erosion (large dip). The motorcycle engages a throttle for propulsion that moves the wheels even in the event of a loss of traction. This can lead to considerable soil movement, as is seen in Figure 4.
!16$
!14$
!12$
!10$
!8$
!6$
!4$
!2$
0$
2$
4$
V0$ V1$ V2$ V3$ V4$ V5$ V6$ V7$ V8$ V9$ V10$ V11$
Chan
ge'in'tread'surface,'cm'
Tread'cross'sec4on,'ver4cal'measurements'at'10'cm'intervals'
Roadbed'climb'
0$laps$
Mountain$Bike$
eMTB$
Motorcycle*$

17
Figure 5. Trail profiles at 0 and 500 laps (0 and 200 for motorcycle). These show change in tread surface from the 0 lap measurement. Measurements taken at 10 cm intervals across each sample site, perpendicular to the trail. Greater soil displacement is seen for the Class 1 eMTB than for the mountain bicycle (some tread holes were observed forming), but much less than for the motorcycle. These are from comparable sample locations at the upper leg of a bermed turn.
The sample site illustrated in Figure 5 is at a berm entrance, in the descending direction. Under these site conditions, the mountain bicycle showed the least amount of soil movement and the Class 1 eMTB showed slightly greater soil movement (both at 500 laps). However, both modes represent relatively little soil movement compared to the motorcycle (at 200 laps). As in Figure 4, there is a large dip in the tread, showing soil loss at the tread center from the motorcycle. All modes are likely braking while approaching a turn, though the inslope of the berm allows users to carry more speed than in other kinds of turns (e.g. switchbacks). In this situation, the combination of approaching speed and the mass of the vehicle could be affecting the soil movement differently: The Class 1 eMTB could allow users to approach the turn more quickly leading to greater soil movement upon braking and/or simply the weight difference (approximately 8 kg/20 lbs) could be sufficient to produce this result. Similarly, but on a much greater scale, the motorcycle can both approach the turn more quickly and has a much greater mass than either the Class 1 eMTB or the mountain bike (motorcycle weight plus protective equipment is roughly 250 lbs; engine output ranges approximately 100-200 times that of the potential output for this 350W Class 1 eMTB motor).
!5#
!4#
!3#
!2#
!1#
0#
1#
2#
V0# V1# V2# V3# V4# V5# V6# V7# V8# V9# V10# V11#Ch
ange'in'tread'surface,'cm'
Tread'cross'sec4on,'ver4cal'measurements'at'10'cm'intervals'
Berm'entrance'
0#Laps#Mountain#Bike#eMTB#Motorcycle*#

18
Figure 6. Sample site: Exit from bermed turn, descending direction
The sample site illustrated in Figure 6 is for an exit from a bermed turn, in the descending direction. Under these site conditions, all modes show little soil movement. A typical wheeled user under these trail conditions would be simply rolling through the site, using little to no braking and no pedaling or throttle engagement. With a durable tread, as was the case for this study, no soil movement was measurable under these user conditions (simply rolling along the tread). Class 1 eMTBs vs. Traditional Mountain Bicycles Because the motorcycle was only tested to 200 laps, a direct comparison could not be made with the Class 1 eMTBs and mountain bicycles at 500 laps. However, this data point still provides valuable information for the study. While the average change in tread surface across all 10 sample sites was greater for Class 1 eMTBs than for mountain bicycles, there was considerable site to site variability, especially for mountain bicycle sites, as shown by the error bars in Figure 7. When comparing Class 1 eMTBs to mountain bicycles, a simple t-test could be used for analysis (Table 1).
Table 1. Comparison of average change in tread surface for Class 1 eMTBs and mountain bicycles at 200 and 500 laps using Two Sample t-test. There was no significant difference between the modes (α=0.05) at either 200 or 500 laps.
pair laps t p(valueeMTB(MTB 200 0.3638 0.7202eMTB(MTB 500 (1.1122 0.2807
!5#
!4#
!3#
!2#
!1#
0#
1#
2#
V0# V1# V2# V3# V4# V5# V6# V7# V8# V9# V10# V11#
Chan
ge'in'tread'surface,'cm'
Tread'cross'sec4on,'ver4cal'measurements'at'10cm'intervals'
Berm'exit'
0#Laps#
Mountain#Bike#
eMTB#
Motorcycle*#

19
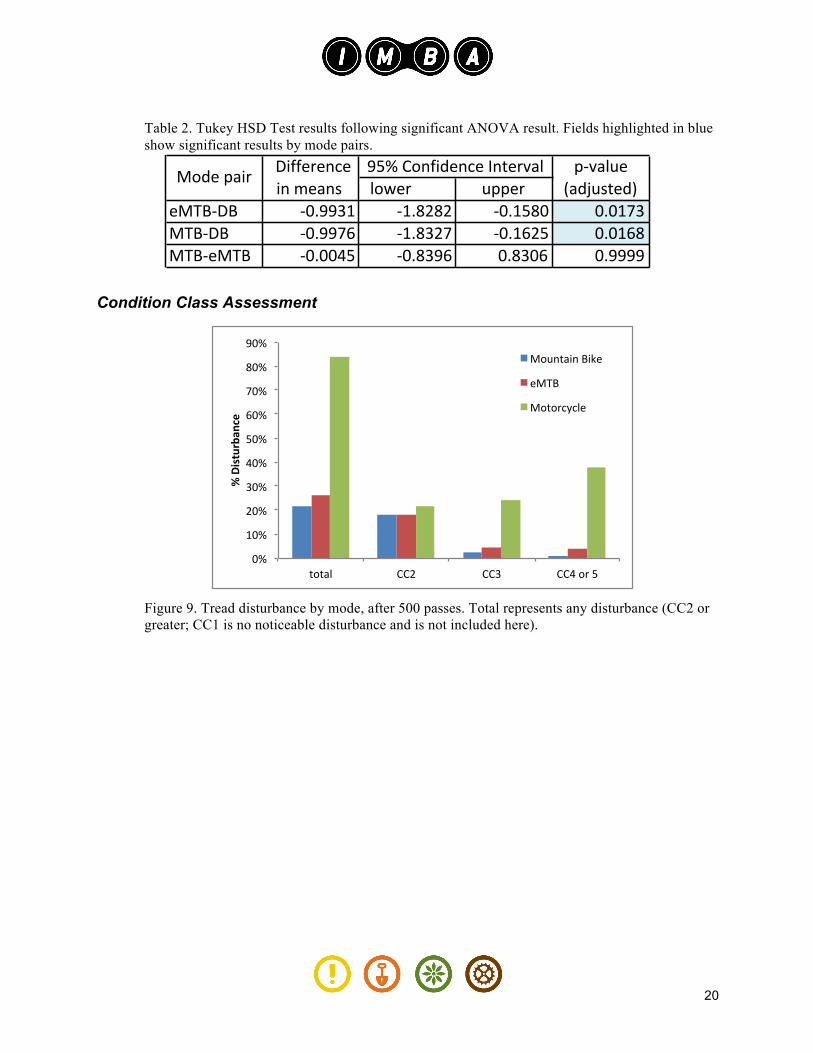
In considering average change in tread surface by mode after 200 laps, a difference between motorcycle impacts and those associated with Class 1 eMTBs and mountain bicycles is readily apparent (Figure 8). However, there is high variability among the motorcycle group of sample sites (note the span of error bars for “DB200”), as some sites experienced large amounts of soil displacement and rutting, while others showed little to no soil movement. ANOVA and Tukey HSD Test An analysis of variance (ANOVA) was conducted to determine if there was a significant difference between groups where more than two groups are compared, in this case: Change in tread surface for motorcycle, Class 1 eMTB, and mountain bicycle after 200 laps. Data were log transformed in order to meet test assumptions. The ANOVA showed that there was a significant difference between groups (F=5.822, p-value=0.0079), but this test cannot show which groups were different. The Tukey HSD Test is a post-hoc test, used following the ANOVA to identify which groups had significant differences. This test revealed that there was a significant difference between change in tread surface from motorcycles (DB) and that of both Class 1 eMTBs and traditional mountain bicycles (MTB) (p=0.0173 and p=0.0169, respectively; see Table 2). There was no significant difference between Class 1 eMTBs and mountain bicycles (p=0.9999).
0"
50"
100"
150"
200"
250"
300"
350"
MTB$200$ eMTB$200$ DB$200$
Change$in$tread$surface$area$a6er$200$laps$by$each$mode$(cm2)$
Figure 8. Average change in tread surface (absolute value) per sample site transect (cm2) after 200 laps. Error bars represent 95% confidence intervals.
20
Table 2. Tukey HSD Test results following significant ANOVA result. Fields highlighted in blue show significant results by mode pairs.
Condition Class Assessment
Figure 9. Tread disturbance by mode, after 500 passes. Total represents any disturbance (CC2 or greater; CC1 is no noticeable disturbance and is not included here).
0%#
10%#
20%#
30%#
40%#
50%#
60%#
70%#
80%#
90%#
total# CC2# CC3# CC4#or#5#
%"Disturban
ce"
Mountain#Bike#
eMTB#
Motorcycle#
lower&&&&&&&& uppereMTB,DB& ,0.9931 ,1.8282 ,0.1580 0.0173MTB,DB&&& ,0.9976 ,1.8327 ,0.1625 0.0168MTB,eMTB& ,0.0045 ,0.8396 0.8306 0.9999
&&Difference&in&means&&&&
p,value&(adjusted)
Mode&pair 95%&Confidence&Interval
21
Discussion All trail users affect the trail surface and surrounding environment, especially when trails are poorly constructed. Those impacts range from vegetation loss to soil erosion, water-quality degradation, and disruption of wildlife. However, there is no evidence that mountain bicycling causes greater environmental impact than other recreational trail uses. In fact current research suggests that mountain bicycling impacts are similar to hiking, and less damaging than equestrian and motorized users. An emerging body of research suggests that when it comes to impacts to soils, water quality, and vegetation, the primary issue is not the type of user, but the way the trail is designed and constructed.
IMBA conducted a small trail impact study that measured soil displacement and erosion from traditional mountain bicycles, Class 1 eMTBs, and motorcycles under the same environmental conditions on separated sections of the same trail, within a single test site. Analysis of data from this small-scale field experiment showed support for the hypotheses. Some differences between the impacts of Class 1 eMTBs and mountain bicycles were observed, particularly at turns and grade changes. However, the soil displacement measured in this study was not significantly different (statistically) from that associated with mountain bicycles, and was much less than that associated with motorcycle use. Electric-powered mountain bikes (eMTBs) are a new category of recreational use on public lands, a hybrid of muscle and electric power that falls between traditional motorized and non-motorized uses. Defining eMTBs as new category of recreation access will minimize impacts on access for mountain bikes and protect against an increase of motorized use on non-motorized trails. Study Limitations This was a small study, under a limited set of environmental and trail conditions, and user behavior. This study does not, and should not be interpreted to represent consensus on the environmental impacts of Class 1 eMTB. However, it is a first step in better understanding the physical impacts to tread surfaces from their use, and how these impacts may be similar to or different from other two-wheeled uses. Environmental impacts are only part of understanding how a new use, like eMTBs, on public lands may affect the environment, user management, and experiences for other trail users. Social and regulatory factors may be of greater importance in determining appropriate use and should also be studied. Access Implications for Land Managers IMBA strongly recommends that trail management decisions for any recreational user have a foundation in science. The impact of mountain bicycling on trails and the environment has been a leading management concern since the activity’s inception. Mountain bicyclists know acutely the experience of arbitrary decision-making based upon anecdotal observations of user behaviors

22
and environmental impacts. As a new use, eMTBs will likely face similar scrutiny. Perception of impacts – both social and environmental – is an issue that Class 1 eMTBs face, in part because there are relatively few eMTBs currently on trails. Trail users and land managers have limited opportunity to observe and interact with this new use and may assume the worst in terms of impacts. Land managers should not just weigh environmental impacts, but should honestly address the social factors that also contribute to access decisions. While the environmental impacts of a particular trail use are an important consideration in management, social and regulatory factors also play a critical role. For good or bad, access is not based upon a hierarchy of environmental impacts. Equestrian use has much greater environmental impacts than mountain bicycling, but it is managed quite differently for social, historical, and regulatory reasons. It is important to keep this in mind when evaluating this new use.

23
Conclusion This study found that the impacts from Class 1 eMTBs and traditional mountain bicycles were not significantly different, while motorcycles led to much greater soil displacement and erosion. Observations suggest that Class 1 eMTBs may lead to more displacement under certain trail conditions. More research is needed before conclusions can be drawn regarding the environmental impacts of Class 1 eMTBs as compared with traditional mountain bicycles. Understanding the potential resource impacts of Class 1 eMTBs is a necessary and important first step for formulating management strategies. Additional research is needed to further assess the range of environmental and social impacts for successful Class 1 eMTB use on public lands. IMBA’s initial study suggests that, with conscientious management and attention to trail design, Class 1 eMTBs may have the potential to offer a beneficial use of public lands with acceptable impacts.

24
Appendix A: Throttle Observations: Mini Test This was a very limited test to begin to understand the differences between pedal-assist and throttle eMTBs.
• Modes: MTB, pedal-assist eMTB, throttle-assist eMTB • Pedal/throttle assist eMTBs at highest power setting • Steep uphill: 40-45% grade over 4.5 m • All modes start from full stop 4 m before grade change • 50 laps each
MTB vs. Pedal-Assist: Greater area of disturbance, but less depth. Throttle: Much greater area of disturbance, equal depth to Pedal-Assist.
• Most impact at crest of climb
0"
2000"
4000"
6000"
8000"
10000"
12000"
MTB" Pedal0Assist" Thro8le"
Soil%disturba
nce,%cm3%
Total%disturbance%by%mode%
25
Appendix B: Literature Review A literature review was conducted in developing the methods for this study. While no studies have looked at the effects of eMTBs explicitly, there have been numerous studies of mountain bicycles and motorcycles, presumably encompassing the range of potential environmental impacts associated with eMTBs. Other studies characterizing soil displacement and erosion in general, regardless of use, also informed the study design.
• Wilson & Seney, 1994 – Erosion from experimentally applied mountain bicycling and motorcycles (also horses and hikers) on trails in Montana. Used existing trails, varying slopes, in wet conditions and dry. Applied rainfall to assess wet conditions and immediately following user passes to assess erosion. (Wilson & Seney, 1994)
• Thurston & Reader, 2001 – Impacts of experimentally applied mountain bicycling on vegetation and soils in a deciduous forest (also hikers). Not on existing trails, but on designated tracks on varying slopes, applied varying user passes (25 to 1000), then measured vegetation and soil compaction. Assessed recovery after 1 year. (Thurston & Reader, 2001)
• White et al, used point measurement of max incision and width in their observational study. ‘Cessford (1995a) discussed ecological impacts and presented several astute observations, though the majority of his conclusions were derived from other forms of recreation, such as hiking and off-road motorcycling. His most notable inference was that mountain bikes will generate the most torque during uphill travel, but considerably less pressure on the trail in comparison to other users when moving downhill, although degradation is possible “in extremely wet conditions, on uncompacted surfaces, or due to poor braking practices”’ (Gordon R. Cessford, 1995; White, Waskey, Brodehl, & Foti, 2006)
• Existing mountain bicycle studies show greatest erosion at turns and on steep downhills. (Goeft and Alder, 2001; White, 2006). For motorcycles, turns are also an area of higher erosion, as are uphills. Check other citations for additional information. (Goeft & Alder, 2001; White et al., 2006)
• All uses have greatest potential to cause damage to soils and vegetation in wet conditions. (B. J. Marion & Wimpey, 2007)
• Olive & Marion (2009) – Variable CSA approach. Observational study, but methods useful. (Olive & Marion, 2009)
• Wallin and Hardin 1996 – trail erosion using rainfall simulator. Insufficient resources for this study, but worth exploring for a future study to test under varying soil moisture conditions. (Wallin & Harden, 1996)
• SA MTB study (Clement, 2010) – used CSA method to monitor and assess mountain bicycling trails in South Australia for Mountain Bike Australia. These trails were building using BMPs for mountain bicycling trails. CSA for 20 randomly placed points along each of two trails (under different soil and rainfall conditions). (Clement, 2010)

26
• USFS comparison of trail erosion evaluation methods ranked CC Assessments highest overall when combining training required, efficiency, accuracy, precision, and management utility. (Jewell & Hammitt, 2000)
• 2nd and 3rd ranked methods: census of erosional events and CSA (tied with Max Incision Post-construction). – CSA probably best for experiment versus an observational study. CSA –highest precision and accuracy, but low efficiency.
• Cross-Sectional Area Method: “Soil erosion is the single most important, managerially significant trail degradation indicator. The cross-sectional method is probably the most frequently used, replicable method for monitoring purposefully located trail segments. This method may also be applied to systematically sampled locations for monitoring entire trail systems. The erosion or deposition of soil can be measured with very high precision and accuracy with this method. …. it involves a number of assumptions, including ability to relocate the fix points precisely, reference line elevated above surrounding vegetation, the line is kept taut, a level is used for the vertical measurements, the taut line is repositioned the same height above the fixed points, vertical measurements are taken at the same interval, and the vertical measurements are taken starting from the same side. For these reasons, training is the single most important factor in the proper application of this method. Adequate training is costly and thus a major limiting factor for managers.” (Jewell & Hammitt, 2000)

27
Literature Cited Clement, S. (2010). Monitoring and Assessing the Long- term Environmental and Use Impacts
on Selected Mountain Bike Trails in South Australia. Adelaide, South Australia. Cole, D. N. (1983). Assessing and Monitoring Backcountry Trail Conditions (No. INT-303).
Ogden, UT. Goeft, U., & Alder, J. (2001). Sustainable Mountain Biking: A Case Study from the Southwest
of Western Australia. Journal of Sustainable Tourism, 9(3), 193–211. doi:10.1080/09669580108667398
Gordon R. Cessford. (1995). Off-Road Impacts of Mountain Bikes: A Review and Discussion.
Department of Conservation. Wellington, New Zealand. Retrieved from http://www.mountainbike.co.nz/politics/doc/impacts/index.htm
Jewell, M. C., & Hammitt, W. E. (2000). Assessing Soil Erosion on Trails : A Comparison of
Techniques (No. RMRS-P-15-Vol-5). Marion, B. J., & Wimpey, J. (2007). Environmental Impacts of Mountain Biking�: Science
Review and Best Practices. Managing. Marion, J. L., & Leung, Y. (2001). Trail Resource Impacts and An Examination of Alternative
Assessment Techniques. Journal of Park and Recreation Administration, 19(3), 17–37. Olive, N. D., & Marion, J. L. (2009). The influence of use-related, environmental, and
managerial factors on soil loss from recreational trails. Journal of Environmental Management, 90(3), 1483–1493. doi:http://dx.doi.org/10.1016/j.jenvman.2008.10.004
Thurston, E., & Reader, R. J. (2001). Impacts of Experimentally Applied Mountain Biking and
Hiking on Vegetation and Soil of a Deciduous Forest. Environmental Management, 27(3), 397–409. doi:10.1007/s002670010157
Wallin, T. R., & Harden, C. P. (1996). Estimating Trail-Related Soil Erosion in the Humid
Tropics: Jatun Sacha, Ecuador, and La Selva, Costa Rica. Ambio, 25(8), 517–522. Retrieved from http://www.jstor.org/stable/4314532
White, D. D., Waskey, M. T., Brodehl, G. P., & Foti, P. E. (2006). A Comparative Study of
Impacts to Mountain Bike Trails in Five Common Ecological Regions of the Southwestern U . S . Journal of Park and Recreation Administration, 24(2), 21–42.
Wilson, J. P., & Seney, J. P. (1994). EROSIONAL IMPACT OF HIKERS, HORSES,
MOTORCYCLES, AND OFF-ROAD BICYCLES ON MOUNTAIN TRAILS IN MONTANA. Mountain Research and Development, 14(1), 77–88.

28