Cancer Stem Cells Michael Rosemann, Helmholtz-Zentrum Muenchen, Radiation Biology [email protected].

Final Draft of the original manuscript: Ceyhan, U.; Horstmann, M.; Dogan, B.: High Temperature Cross-Weld Characterisation of Steel Weldments by Microtensile Testing In: Materials at High Temperatures (2006) Science Reviews 2006 Vol. 23(3-4): 233-243 DOI: -

1
High Temperature Cross-Weld Characterisation of Steel Weldments by Microtensile Testing
U. Ceyhan, M. Horstmann and B. Dogan
GKSS Research Centre, Institute for Materials Research, Materials Mechanics
Max-Planck Str.1, D-21502 Geesthacht, Germany
Abstract
Study of local material properties and damage mechanisms are undertaken in order to characterise weldments that show significant variation of properties across weldments. One of the methods to characterise the local variation of properties is microtensile (MT) testing of specimens machined out of specific narrow zones of weldments. The literature data, though limited, on microtensile specimen testing are reported on the low temperature behaviour. On the other hand, systematic study of cross-weld local material properties at high service temperatures have not been reported yet. In present study, MT tests are conducted across similar welds of P22 and P91 steels at 550 °C and 600 °C, respectively. In order to study deformation mechanisms and the role of surface condition on properties, specimens with different surface conditions (i.e. machined, polished and electropolished surfaces) are tested. Two different loading rates of 0.2 mm/min and 0.5 mm/min are used to study the effect of loading rate on deformation and mechanical properties. Variations of material properties yield strength (Rp0.2) and ultimate tensile strength (Rm), for the weldments are presented as a function of surface conditions of specimens and loading speeds. Higher loading rates yield higher values of Rp0.2 and Rm and specimens with machined and polished surfaces show consistent and higher values of Rp0.2 and Rm compared to specimens with electropolished surface finish. Deformation behaviour is studied on the side surfaces of tested microtensile specimens using an SEM. Deformation is correlated to microstructural constituent that observed on specimen side surfaces. The metallographic information is used to interpret the variation of mechanical properties determined in tension at high temperatures. The MT data are compared with standard tensile data obtained on specimens with simulated microstructures. The prospects of using MT tests for characterising the material at high temperatures and feasibility of use of data for assessment of components under service loading conditions are reported.
Keywords: Microtensile testing, high temperature deformation, high temperature steels, SEM, microstructure
1. INTRODUCTION
Local material behaviour of weldment zones at high temperature (HT) has not been systematically studied. Due to the variation of material properties of functionally graded structure of weldments local material behaviour plays an important role in determining the component behaviour. High temperature, particularly creep failure in uniaxial cross-weld tests involves complex interactions between zones reported recently on CrMoV, P22 and P91 steel welds [1, 2]. Many of the observed weld uniaxial test failures are, however, highly artificial. The P22 weld / P22 Heat Affected Zone (HAZ) conjoint failure mechanism by ductile strain interaction and necking is clearly a peculiarity of the plain bar specimen geometry. Thus, it is important to develop a testing methodology to characterise local properties of a welded component. Microtensile (MT) testing, although not standardised yet, may be used successfully. The published data are still limited to low temperatures [3, 4]. The MT testing

2
involves conducting tests across weldment by using little amount of material so that it is also useful for in-service material characterisation that may possibly be compared with other test methods such as small punch testing. [5]. Systematic study of service temperature deformation and fracture behaviour of constituent zones of weldments using microtensile tests has not been reported yet. The fact that most of the power plant assessments require material data of weldment at service temperatures, the deformation and fracture behaviour of current industrial structures containing P22 and P91 steels welds is utmost importance.
In the present study, microtensile specimens machined from similar welds of P22 and P91 steels ground and polished giving different surface conditions are tested at 550 oC and 600 oC, respectively. Mechanical data obtained on MT specimens are compared with standard tensile (ST) specimens carried out using weld (WM) and base material (BM) as well as material with simulated HAZ. Deformation and fracture behaviour are studied on sectioned side surfaces of tested specimens using an SEM. Mechanical data are correlated with microstructural constituents in specific zones of weldments.
2. MATERIALS
Two materials, (P22 and P91 steels), are used in MT testing program. The ASTM A335 Grade P22 (2.25Cr1Mo) is the most commonly used low alloy ferritic steel for application in high temperature tubing and pipework in power generation and petro-chemical plants. The ASTM P91 (Mod 9Cr1Mo) steel is newly developed high strength, high ductility steel with martensitic structure for possible applications in pressure parts in conventional and nuclear power plant and petrochemical reactor vessels and pipework [6]. Chemical compositions of base metal (BM) and weld metal (WM) are shown in Table 1. Materials data including yield strength Rp0.2, ultimate tensile strength Rm, modulus of elasticity E, Ramberg-Osgood constants, D1 and m of BM, WM and simulated heat affected zone (SIM.HAZ) determined by standard tensile tests are presented in Table 2.
Table 1. Chemical compositions of P22 and P91 materials
Test specimens were machined out of welded pipes which were produced by circumferential butt-welding using shielded metal arc-welding (SMAW) process. MT specimens were extracted in sequence along pipe length, with loading axis in radial direction from the welded pipes. The pipe segments were of 216 mm outer diameter and 50 mm thickness for P22, and 295 mm outer diameter and 55 mm wall thickness for P91.
Table 2. Materials data determined by standard tensile (ST) tests [6]

3
3. EXPERIMENTAL METHOD
Microtensile specimens of P22 and P91 similar welds with microstructural constituents sampling weldment zones of BM, HAZ and WM were machined out of the butt-welded pipe segments by EDM technique, as shown in Fig.2. The microtensile specimens were of 2 mm width and 9mm gage length (Fig.1). Thickness of microtensile specimens were recorded, varying between 0.5 and 0.65 mm, before testing. MT specimens are tested in three different surface conditions, a) as EDM machined (with thickness of 0.5 mm), b) polished down to 1µm diamond paste and c) electropolished where specimen was ground and polished down to 0.6 mm.
Figure 1. Microtensile specimen
Figure 2. Extraction of MT specimens from vicinity of weldment of a pipe
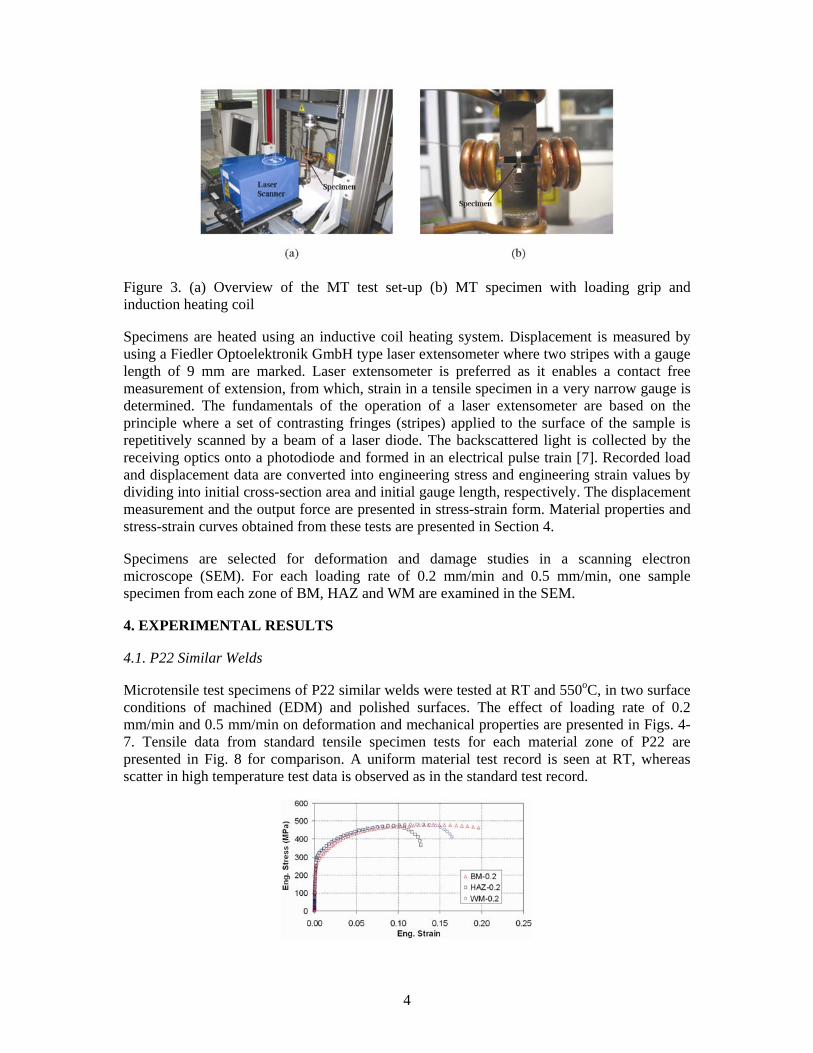
Tensile tests were conducted by using Zwick Roell Z005 type electromechanical testing machine with load cell (±2.5 kN) at room temperature and high temperatures of 550 °C and 600 °C (Fig. 3). Specimens are tested at two different loading rates of 0.2 mm/min and 0.5 mm/min, in order to study the effect of loading rate on tensile properties of Rp0.2 and Rm.
4
Figure 3. (a) Overview of the MT test set-up (b) MT specimen with loading grip and induction heating coil
Specimens are heated using an inductive coil heating system. Displacement is measured by using a Fiedler Optoelektronik GmbH type laser extensometer where two stripes with a gauge length of 9 mm are marked. Laser extensometer is preferred as it enables a contact free measurement of extension, from which, strain in a tensile specimen in a very narrow gauge is determined. The fundamentals of the operation of a laser extensometer are based on the principle where a set of contrasting fringes (stripes) applied to the surface of the sample is repetitively scanned by a beam of a laser diode. The backscattered light is collected by the receiving optics onto a photodiode and formed in an electrical pulse train [7]. Recorded load and displacement data are converted into engineering stress and engineering strain values by dividing into initial cross-section area and initial gauge length, respectively. The displacement measurement and the output force are presented in stress-strain form. Material properties and stress-strain curves obtained from these tests are presented in Section 4.
Specimens are selected for deformation and damage studies in a scanning electron microscope (SEM). For each loading rate of 0.2 mm/min and 0.5 mm/min, one sample specimen from each zone of BM, HAZ and WM are examined in the SEM.
4. EXPERIMENTAL RESULTS
4.1. P22 Similar Welds
Microtensile test specimens of P22 similar welds were tested at RT and 550oC, in two surface conditions of machined (EDM) and polished surfaces. The effect of loading rate of 0.2 mm/min and 0.5 mm/min on deformation and mechanical properties are presented in Figs. 4-7. Tensile data from standard tensile specimen tests for each material zone of P22 are presented in Fig. 8 for comparison. A uniform material test record is seen at RT, whereas scatter in high temperature test data is observed as in the standard test record.

5
Figure 4. Stress vs. strain curves of P22 BM, WM and HAZ specimens with machined surface (EDM) at RT
Figure 5. Stress vs. strain curves of P22 BM and WM specimens with machined (EDM) surface at 550 °C
Figure 6. Stress vs. strain curves of P22 BM, WM and HAZ specimens with polished surface at RT
Figure 7. Stress vs. strain curves of P22 BM, WM and HAZ specimens with polished surface at 550 °C
Figure 8. Stress vs. strain curves of P22 BM, WM and HAZ standard tensile (ST) specimens at 550 C°

6
Yield strength, Rp0.2, and ultimate tensile strength, Rm, determined across the P22 weldment at varying temperature and loading rate are determined on specimens with as machined EDM and polished surfaces given in Tables 3 and 4, respectively. The tensile strength values decrease substantially with temperature for both surface conditions. However, while the yield strain value, εp0.2 is not affected by temperature, tensile strain, εm, at ultimate tensile strength, Rm, decreases at an order up to 20.This is a typical thin specimen behaviour related to inhomogeneous deformation of thin plates.
More representative material properties data similar to those obtained on ST specimens are determined on specimens with polished surface conditions. However, tensile strain values, εm, at ultimate tensile strength, Rm, decreases with increasing loading rate, except that the value remains almost the same for the HAZ zone. Furthermore, the strain εp0.2 at yield strength, Rp0.2, is unaffected by the loading rate.
Although the sequence of strength of different weldment zones ( BM, WM and HAZ) coincides with the ST test results, materials strength values from MT tests with polished surface are lower than the properties obtained on ST tests. Therefore, in order to determine materials properties in MT tests, correction factors are needed. These are determined experimentally for P22 BM and P22 WM in this study as ≈2.9 and ≈2.5 for loading rates 0.2 mm/min and 0.5 mm/min, respectively. A correction factor of ≈3.4 is suggested for P22 HAZ for both loading rates.
Table 3. MT data of Rp0.2 and Rm values across the similar weld of P22 specimens with machined surface (EDM) tested at loading rates 0.2 mm/min and 0.5 mm/min at RT and 550 °C.
Table 4. MT data of Rp0.2 and Rm values across the similar weld of P22 specimens with polished surface tested at loading rates 0.2 mm/min and 0.5 mm/min at RT and 550 °C.

7
4.2. P91 Similar Welds
Microtensile test specimens machined out of P91 similar welds are tested at RT and 6000C. Specimens’ surface finish were varied, namely as machined (EDM), polished and electropolished conditions and tested at loading rates of 0.2 mm/min and 0.5 mm/min. The results are presented in Figs. 9-14. Tensile data from standard tensile specimen tests for each material zone of P91 including simulated HAZ are presented in Fig.15 Similar to P22, the RT data show some variation with surface finish as observed in the data from weldment zone sequences, WM with highest strength. Similar variation is observed in HT data. However, the high loading rate data are clearly higher than that of the low loading rate data.
Figure 9. Stress vs. strain curves of P91 BM, HAZ and WM specimens with machined (EDM) surface at RT
Figure 10. Stress vs. strain curves of P91 BM, WM and HAZ specimens with machined (EDM) surface at 600 °C

8
Figure 11. Stress vs. strain curves of P91 BM, WM and HAZ specimens with polished surface at RT
Figure 12. Stress vs. strain curves of P91 BM, WM and HAZ specimens with polished surface at 600 °C
Figure 13. Stress vs. strain curves of P91 BM, WM and HAZ specimens with electropolished surface at RT
Figure 14. Stress vs. strain curves of P91 BM, WM and HAZ specimens with electropolished surface at 600 °C

9
Figure 15. Stress vs. strain curves of P91BM, WM and HAZ standard tensile (ST) specimens at 600 o
The tensile properties across the P91 weldment zones at test temperatures and loading rates are presented for as machined (EDM), polished, and electropolished surfaces in Tables 5, 6 and 7, respectively. A large discrepancy in tensile property data is seen in the tables. Increase in tensile strength and decrease in tensile strain are observed with increasing loading rate conforming the standard behaviour with work hardening. However, effect of specimen surface condition varies in different weldment zones.
The specimens with polished surface conditions, which produced data similar to the ST specimens showed loading rate dependence of tensile strains εp0.2 and εm. The strains decrease with increasing loading rate, except in the WM zone. Substantial decrease of tensile strain values εm is seen with increasing temperature. The yield strain, εp0.2, is unaffected in all weldment zones. As in P22 steel, correction factors are needed for MT data to be considered as material property data. These are determined as 3.5 for the loading rate of 0.2 mm/min and 2.7 for the loading rate of 0.5 mm/min.
Table 5. MT data of Rp0.2 and Rm values across the similar weld of P91 specimens with machined (EDM) surface tested at loading rates 0.2 mm/min and 0.5 mm/min at RT and 600 °C.
Table 6. MT data of Rp0.2 and Rm values across the similar weld of P91 specimens with polished surface tested at loading rates 0.2 mm/min and 0.5 mm/min at RT and 600 °C.

10
Table 7. MT data of Rp0.2 and Rm values across the similar weld of P91 specimens with electropolished surface tested at loading rates 0.2 mm/min and 0.5 mm/min at RT and 600 °C.
5. METALLOGRAPHY
Side surfaces of selected specimens are examined by using Scanning Electron Microscope (SEM) for deformation and crack initiation sites. Specimens extracted from different weldment zones (BM, HAZ and WM), which were tested at different loading rates, are studied in order to correlate damage with microstructural constituents. For each specimen, damage is observed in different areas of the specimen, i.e. necking area which undergoes the most severe damage in a specimen, head of the specimen which was not damaged during testing and a region between head of the specimen and the necking area in which an intermediate level of damage are observed.
5.1. P22 Similar Welds
The comparison of results obtained from P22 similar weld MT specimens machined from the same weldment zones and tested at different loading rates, showed that tests at lower loading rate yield lower Rp0.2 and Rm than those tested at higher loading rate as confirmed by metallographic observations. It is seen that recovery occurred at specimens tested with lower loading rate. Grain size varied between 3-10 µm. For any zone of weldment, elongation of grains along the main loading axis is also obvious for specimens tested at low loading rate when compared with specimens tested at high loading rate (Figs. 16 & 17).

11
Figure 16. SEM picture from necking area of P22 BM tested at 0.2 mm/min in the (εfinal=14%)
Figure 17. SEM picture from necking area of P22 BM tested at 0.5 mm/min with pore formation along axis of 43.5° with horizontal plane (εfinal=8%)
This behaviour is attributed to the longer time at low rates deformation softening mechanisms of recovery. Figures 17 (BM, 0.5 mm/min) and. 18 (WM, 0.2 mm/min), show the pore formation along shear deformation plane (Fig. 19) aligned at 43.5° for the BM specimen and 49.5° for the WM specimen to the main loading plane.
Figure 18. SEM picture from necking area of P22 WM tested at 0.2 mm/min with pore formation along axes of 49.5° with horizontal plane (εfinal=8%)

12
Figure 19. SEM picture from necking area of P22 WM tested at 0.2 mm/min with deformation band and grain refinement (εfinal=8%)
On the side surface of fractured WM specimen tested with 0.5 mm/min loading rate, grain boundary damaging and microcracking are observed near to the fracture surface as seen in Figures 20 and 21. There is not much deformed grain alignment in deformation band at high loading rate compared with the specimen tested with 0.2 mm/min loading rate as seen in Figure 19.
Figure 20. SEM fractured end picture of P22 WM tested at 0.5 mm/min (εfinal=15%)
Figure 21. SEM picture of P22 WM tested at 0.5 mm/min, g.b. failure by pore formation and cracking (εfinal=15%)
5.2. P91 Similar Welds

13
Optical micrographs show the microstructures of BM and WM in the deformed section of the specimens tested at 2 mm/min and 5 mm/min loading rates in Figures 22 and 23, respectively. Martensitic-transformed bainitic microstructure with prior austenite grain boundaries is delineated.
Figure 22. OM picture of P91 BM tested at 0.2 mm/min (εfinal=28%)
Figure 23. OM picture of P91 WM tested at 0.5 mm/min (εfinal=17%)
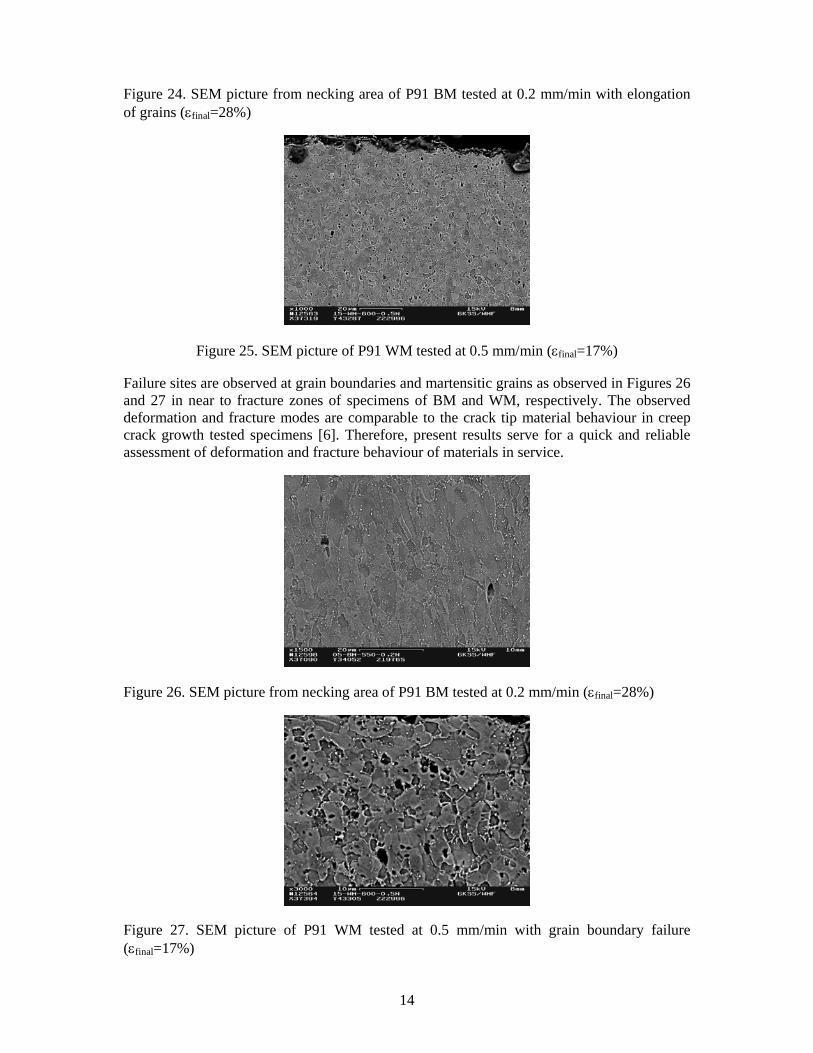
Higher magnification SEM micrographs in Figures 24 and 25 depict the deformation in BM and WM zones. The fracture site deformation zone extends into material of about 50 µm where pore formation and growth are observed, as seen in Fig. 24. Rather uniform damage is seen in WM located at grain boundaries (Fig. 25).
14
Figure 24. SEM picture from necking area of P91 BM tested at 0.2 mm/min with elongation of grains (εfinal=28%)
Figure 25. SEM picture of P91 WM tested at 0.5 mm/min (εfinal=17%)
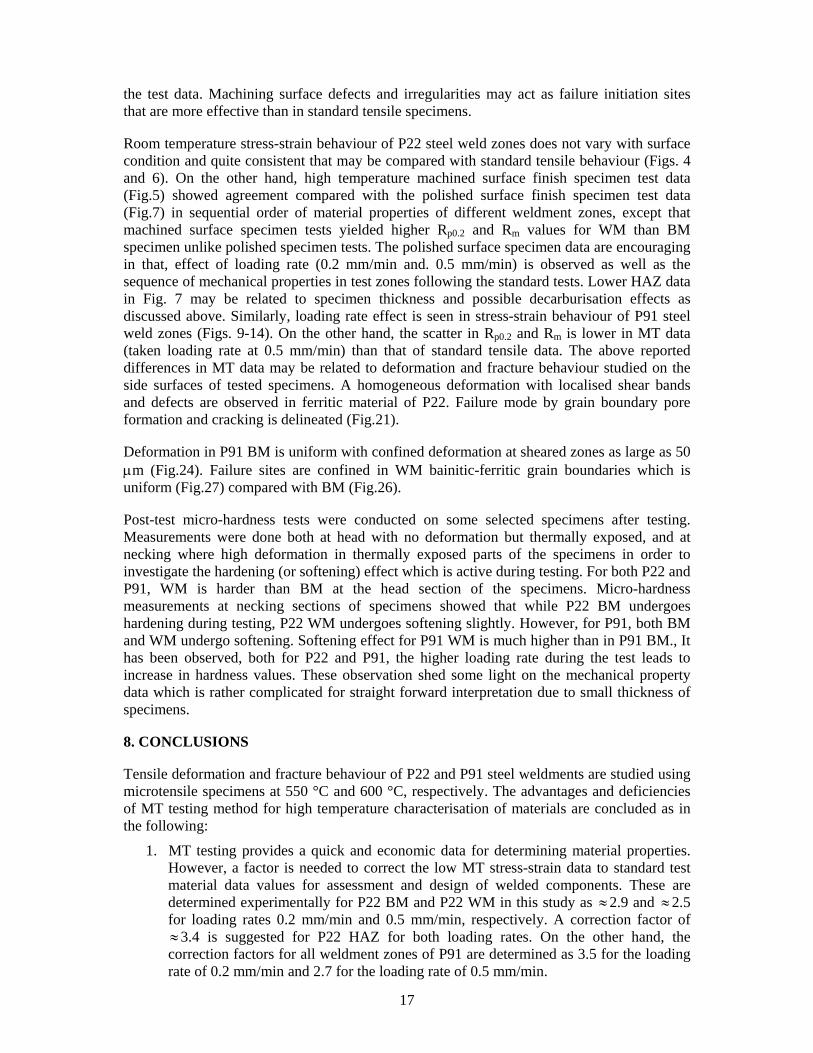
Failure sites are observed at grain boundaries and martensitic grains as observed in Figures 26 and 27 in near to fracture zones of specimens of BM and WM, respectively. The observed deformation and fracture modes are comparable to the crack tip material behaviour in creep crack growth tested specimens [6]. Therefore, present results serve for a quick and reliable assessment of deformation and fracture behaviour of materials in service.
Figure 26. SEM picture from necking area of P91 BM tested at 0.2 mm/min (εfinal=28%)
Figure 27. SEM picture of P91 WM tested at 0.5 mm/min with grain boundary failure (εfinal=17%)

15
6. POST-TEST MICRO-HARDNESS TESTING
Micro-hardness tests were conducted on selected MT specimens after tensile testing. Micro-hardness measurement locations were the necking part which was highly deformed and thermally exposed and head part which were non-deformed but thermally exposed, for each weldment zone and each loading rate. Table 8 and 9 show the values of Vickers [HV 0.1] micro-hardness numbers at head and necking parts of P22 and P91, respectively. Figures 28 and 29 illustrate the change of micro-hardness numbers from head to necking part for P22 and P91, respectively. Note the difference in hardness values in two materials. Strain hardening in BM of P22 and softening in P91 are seen.
Table 8. Micro-hardness values [HV 0.1] of P22 BM and WM at head (undamaged) and necking (damaged) parts
Table 9. Micro-hardness values [HV 0.1] of P91 BM and WM at head (undamaged) and necking (damaged) parts
158.3164.1
152.9152.2
176.5
149.2
160.7159.9
100
120
140
160
180
200
220
240
260
Head Necking
Position on specimen
Har
dn
ess
[HV
0.1
]
P22 BM, 0.2 mm/minP22 BM, 0.5 mm/minP22 WM, 0.2 mm/minP22 WM, 0.5 mm/min
Figure 28. Change of micro-hardness values from head to necking part of specimen of P22 BM and WM at different loading rates

16
227.7
185.3190.4
181.3
192.5184.3
218.4
179.3
100
120
140
160
180
200
220
240
260
Head Necking
Position on specimen
Har
dn
ess
[HV
0.1
]
P91 BM, 0.2 mm/minP91 BM, 0.5 mm/minP91 WM, 0.2 mm/minP91 WM, 0.5 mm/min
Figure 29. Change of micro-hardness values from head to necking part of specimen of P91 BM and WM at different loading rates
7. DISCUSSION
Functionally graded microstructures of weldments have different mechanical and creep properties which in turn directly influence the stress redistribution and damage accumulation within weldment zones. Time dependent high temperature deformation in uniaxial cross-weld tests involves complex interactions between zones. Adjacent strong material can constrain deformation and retard failure in a weak zone that is thinner compared to the specimen diameter. It is also important that thin low alloy steel zones may be weakened by decarburisation, but the composite test specimen is also strengthened by adjacent high alloy zones. The net result, therefore, requires careful analysis. These considerations direct attention to test methods that facilitate local material property and behaviour determination in constitutive zones of weldments. MT testing provides the needed tool as it also facilitates sampling specimens in very narrow zones of weldments. This is of particular interest for characterizing the weldments of components produced by advanced joining techniques, such as electron beam, laser and hybrid welding.
The present results highlight the advantages of MT testing and characterisation as well as deficiency of the method that needs further study and development. MT specimens of P22 and P91 materials, particularly with polished surface produced similar strength and deformation properties where stress and strain are considerably lower than those of standard tensile tests. However, the obtained data follows a similar sequence of properties for the tested weldment zones. Therefore, correction factors for P22 and P91 are suggested to be introduced to overcome such deficit in MT test data. This, however, requires more data for a reliable correlation. Finite element analysis would also assist to increase the reliability of the correction factors. For ST tests, the values of Rp0.2 and Rm for P91 are much higher than P22. However, for MT tests, the values of Rp0.2 and Rm are very close for both materials. More data are also needed for clarification of this discrepancy between MT and ST results.
The reported deformation behaviour is useful to get a speedy data and information for service performance assessment of components. Deformation, pore formation and fracture sites are correlated with microstructure of the weldment zone. However, thinner specimens may suffer a backdraw of microstructural inhomogenity of test material where the test cross-section only contains a few grains. Therefore, the specimen surface finish is an important factor affecting
17
the test data. Machining surface defects and irregularities may act as failure initiation sites that are more effective than in standard tensile specimens.
Room temperature stress-strain behaviour of P22 steel weld zones does not vary with surface condition and quite consistent that may be compared with standard tensile behaviour (Figs. 4 and 6). On the other hand, high temperature machined surface finish specimen test data (Fig.5) showed agreement compared with the polished surface finish specimen test data (Fig.7) in sequential order of material properties of different weldment zones, except that machined surface specimen tests yielded higher Rp0.2 and Rm values for WM than BM specimen unlike polished specimen tests. The polished surface specimen data are encouraging in that, effect of loading rate (0.2 mm/min and. 0.5 mm/min) is observed as well as the sequence of mechanical properties in test zones following the standard tests. Lower HAZ data in Fig. 7 may be related to specimen thickness and possible decarburisation effects as discussed above. Similarly, loading rate effect is seen in stress-strain behaviour of P91 steel weld zones (Figs. 9-14). On the other hand, the scatter in Rp0.2 and Rm is lower in MT data (taken loading rate at 0.5 mm/min) than that of standard tensile data. The above reported differences in MT data may be related to deformation and fracture behaviour studied on the side surfaces of tested specimens. A homogeneous deformation with localised shear bands and defects are observed in ferritic material of P22. Failure mode by grain boundary pore formation and cracking is delineated (Fig.21).
Deformation in P91 BM is uniform with confined deformation at sheared zones as large as 50 µm (Fig.24). Failure sites are confined in WM bainitic-ferritic grain boundaries which is uniform (Fig.27) compared with BM (Fig.26).
Post-test micro-hardness tests were conducted on some selected specimens after testing. Measurements were done both at head with no deformation but thermally exposed, and at necking where high deformation in thermally exposed parts of the specimens in order to investigate the hardening (or softening) effect which is active during testing. For both P22 and P91, WM is harder than BM at the head section of the specimens. Micro-hardness measurements at necking sections of specimens showed that while P22 BM undergoes hardening during testing, P22 WM undergoes softening slightly. However, for P91, both BM and WM undergo softening. Softening effect for P91 WM is much higher than in P91 BM., It has been observed, both for P22 and P91, the higher loading rate during the test leads to increase in hardness values. These observation shed some light on the mechanical property data which is rather complicated for straight forward interpretation due to small thickness of specimens.
8. CONCLUSIONS
Tensile deformation and fracture behaviour of P22 and P91 steel weldments are studied using microtensile specimens at 550 °C and 600 °C, respectively. The advantages and deficiencies of MT testing method for high temperature characterisation of materials are concluded as in the following:
1. MT testing provides a quick and economic data for determining material properties. However, a factor is needed to correct the low MT stress-strain data to standard test material data values for assessment and design of welded components. These are determined experimentally for P22 BM and P22 WM in this study as ≈2.9 and ≈2.5 for loading rates 0.2 mm/min and 0.5 mm/min, respectively. A correction factor of ≈3.4 is suggested for P22 HAZ for both loading rates. On the other hand, the correction factors for all weldment zones of P91 are determined as 3.5 for the loading rate of 0.2 mm/min and 2.7 for the loading rate of 0.5 mm/min.

18
2. The effect of loading rate on mechanical properties and deformation behaviour is demonstrated. Higher loading rates of 0.5 mm/min may be taken for comparison with standard tests.
3. Lower loading rate tests lead to microstructural softening by recovery, hence lower strength data were determined by materials. However, the effect varies from material to material.
4. Thin specimens suffer from microstructural inhomogenities such as grain boundaries, only a few grains exist on the loading plane.
5. Deformation and fracture initiation sites are correlated with microstructural constituents, facilitating study of material behaviour of components in service.
6. Except for P22 BM, all materials undergo softening effect during testing. Higher loading rates lead to material hardening.
ACKNOWLEDGEMENTS
Thanks are due to H. Tek for technical support in testing, P.Fischer and G. Wiese for support in metallography work and A. C. Cruz of ISQ-PT and A. Chowdhury of ERA-UK for providing the test material.

19
REFERENCES
Allen, D.J. Creep Performance of Dissimilar P91 to Low Alloy Steel Weldments Proc. 6th Int. Conf. PARSONS 2003, Eds. A. Strang et.al., IOM-UK, 281-294 (2003).
Dogan, B. High temperature design approaches for welds Proc. 2nd Int. Conf. Integrity of High Temperature Welds, Ed. T.H. Hyde, IOM-UK, 461-471 (2003).
Sekhar, N.C. and Reed R.C. Effects of post-weld heat treatment on power beam welds in Waspaloy and Udimet 720Li Proc. 6th ASM International-International Trends in Welding Research Conf., Pine Mountain GA, 773-777 (2002).
Cam, G., Erim, S., Yeni C. and Kocak, M. Determination of mechanical and fracture properties of laser beam welded steel joints Welding Journal 78(6), 193-201 (1999).
Lucon, E., Bicego, V., D'Angelo, D. and Fossati, C. Evaluating a service-exposed component's mechanical properties by means of subsized and miniature specimens, Small Specimen Test Techniques Applied to Nuclear Reactor Vessel Thermal Annealing and Plant Life Extension ASTM STP 1204, 311-323 (1993).
Dogan, B. and Petrovski, B., Creep crack growth of high temperature weldments Int. J. Pressure Vessels and Piping 78(11-12), 795-805 (2001).
Dogan, B. and Horstmann, M., Laser scanner displacement measurement at high temperatures Int. J. Pressure Vessels and Piping, 80(7-8), 427-434 (2003).

20
FIGURES
Figure 1. Microtensile specimen
Figure 2. Extraction of MT specimens from vicinity of weldment of a pipe
Figure 3. (a) Overview of the MT test set-up (b) MT specimen with loading grip and induction heating coil
Figure 4. Stress vs. strain curves of P22 BM, WM and HAZ specimens with machined surface (EDM) at RT
Figure 5. Stress vs. strain curves of P22 BM and WM specimens with machined (EDM) surface at 550 °C
Figure 6. Stress vs. strain curves of P22 BM, WM and HAZ specimens with polished surface at RT
Figure 7. Stress vs. strain curves of P22 BM, WM and HAZ specimens with polished surface at 550 °C
Figure 8. Stress vs. strain curves of P22 BM, WM and HAZ standard tensile (ST) specimens at 550 C°
Figure 9. Stress vs. strain curves of P91 BM, HAZ and WM specimens with machined (EDM) surface at RT
Figure 10. Stress vs. strain curves of P91 BM, WM and HAZ specimens with machined (EDM) surface at 600 °C
Figure 11. Stress vs. strain curves of P91 BM, WM and HAZ specimens with polished surface at RT
Figure 12. Stress vs. strain curves of P91 BM, WM and HAZ specimens with polished surface at 600 °C
Figure 13. Stress vs. strain curves of P91 BM, WM and HAZ specimens with electropolished surface at RT
Figure 14. Stress vs. strain curves of P91 BM, WM and HAZ specimens with electropolished surface at 600 °C
Figure 15. Stress vs. strain curves of P91BM, WM and HAZ standard tensile (ST) specimens at 600 o
Figure 16. SEM picture from necking area of P22 BM tested at 0.2 mm/min in the (εfinal=14%)
Figure 17. SEM picture from necking area of P22 BM tested at 0.5 mm/min with pore formation along axis of 43.5° with horizontal plane (εfinal=8%)
Figure 18. SEM picture from necking area of P22 WM tested at 0.2 mm/min with pore formation along axes of 49.5° with horizontal plane (εfinal=8%)

21
Figure 19. SEM picture from necking area of P22 WM tested at 0.2 mm/min with deformation band and grain refinement (εfinal=8%)
Figure 20. SEM fractured end picture of P22 WM tested at 0.5 mm/min (εfinal=15%)
Figure 21. SEM picture of P22 WM tested at 0.5 mm/min, g.b. failure by pore formation and cracking (εfinal=15%)
Figure 22. OM picture of P91 BM tested at 0.2 mm/min (εfinal=28%)
Figure 23. OM picture of P91 WM tested at 0.5 mm/min (εfinal=17%)
Figure 24. SEM picture from necking area of P91 BM tested at 0.2 mm/min with elongation of grains (εfinal=28%)
Figure 25. SEM picture of P91 WM tested at 0.5 mm/min (εfinal=17%)
Figure 26. SEM picture from necking area of P91 BM tested at 0.2 mm/min (εfinal=28%)
Figure 27. SEM picture of P91 WM tested at 0.5 mm/min with grain boundary failure (εfinal=17%)
Figure 28. Change of micro-hardness values from head to necking part of specimen of P22 BM and WM at different loading rates
Figure 29. Change of micro-hardness values from head to necking part of specimen of P91 BM and WM at different loading rates