Final Design Report for Human Powered Vehicle Drivetrain ...
130
Final Design Report for Human Powered Vehicle Drivetrain Project Sponsored by The Cal Poly Human Powered Vehicle Club in conjunction with George Leone May 31, 2019 Team members: Derek Fromm: [email protected] Luke Opitz: [email protected] Michael Juri: [email protected] Olivier Côté: [email protected]
Transcript of Final Design Report for Human Powered Vehicle Drivetrain ...

Final Design Report for Human Powered Vehicle Drivetrain Project
Sponsored by The Cal Poly Human Powered Vehicle Club in conjunction with George Leone
May 31, 2019
Team members: Derek Fromm: [email protected]
Luke Opitz: [email protected] Michael Juri: [email protected] Olivier Côté: [email protected]

i
Statement of Disclaimer
Since this project is a result of a class assignment, it has been graded and accepted as fulfillment
of the course requirements. Acceptance does not imply technical accuracy or reliability. Any use of
information in this report is done at the risk of the user. These risks may include catastrophic failure
of the device or infringement of patent or copyright laws. California Polytechnic State University at
San Luis Obispo and its staff cannot be held liable for any use or misuse of the project.
ii
Abstract
The Cal Poly Human Powered Vehicle Club is building a bike to surpass 61.3 mph in 2019.
The club and their mentor, George Leone, have proposed a senior project to design, build, and test
the drivetrain for this year’s human powered vehicle. Research into human powered vehicles and their
drivetrains has shown that the power that a rider can output and the efficiency at which the rider can
pedal depend extensively on the design of the drivetrain. Despite the existence of standard bicycle
drivetrain designs, the senior project team has found that the best design to meet the club’s
requirements is a completely custom drivetrain based on the rider’s dimensions and preferences. The
team defined a list of technical specifications that they used to validate the completed final prototype.
The final confirmation prototype functioned as intended and all the specifications were met with the
exception of total cost. Details of the team’s design, manufacturing, and testing processes are outlined
in this document.
iii
Table of Contents
1. Introduction ............................................................................................................................................... 1
2. Background Research ................................................................................................................................ 1
2.1. Product Research .............................................................................................................................. 1
2.1.1. French Team .............................................................................................................................. 1
2.1.2. Italian Team ............................................................................................................................... 2
2.1.3. Dutch Team ............................................................................................................................... 2
2.1.4. Canadian Team .......................................................................................................................... 3
2.1.5. Hans Van Vugt .......................................................................................................................... 3
2.2. Customer/Needs Research .............................................................................................................. 4
2.3. Technical Research............................................................................................................................ 5
2.3.1. Rider Power ............................................................................................................................... 5
2.3.2. Rider Pedaling Efficiency......................................................................................................... 5
2.3.3. Pedals, Cranks, and the Chainring .......................................................................................... 6
2.3.4. Shifting........................................................................................................................................ 7
2.4. Relevant Patent Research ................................................................................................................. 8
3. Objectives ................................................................................................................................................. 10
3.1. Problem Statement .......................................................................................................................... 10
3.2. Project Boundary Diagram ............................................................................................................ 10
3.3. QFD House of Quality .................................................................................................................. 11
3.3.1. Discussion of Specifications .................................................................................................. 12
4. Concept Design ....................................................................................................................................... 13
4.1. Ideation ............................................................................................................................................. 13
4.2. Functional Comparison .................................................................................................................. 13
4.3. Concept Analysis ............................................................................................................................. 14
4.3.1. Rear Wheel Drive, 2 Stage, Split-Offset .............................................................................. 14
4.3.2. Front Wheel Drive, 2 Stage, Split-Offset ............................................................................ 14
4.3.3. Front Wheel Drive, 2-Stage, Right-Offset .......................................................................... 15
4.3.4. Front-Wheel Drive, 2-Stage, Left-Offset ............................................................................ 16
4.3.5. Front Wheel Drive, 2-Stage, No Offset .............................................................................. 16
4.4. Concept Selection ............................................................................................................................ 17
4.4.1. Decision Matrix ....................................................................................................................... 17
4.4.2. Concept Prototype .................................................................................................................. 17
4.4.3. Design Considerations ........................................................................................................... 18
4.4.4. Preliminary Analysis Gear Selection .................................................................................... 19
iv
4.4.5. Concept Design Description ................................................................................................. 20
4.5. Discussion of the current risks, challenges, and unknowns ...................................................... 21
5. Final Design.............................................................................................................................................. 23
5.1. Design Description ......................................................................................................................... 23
5.1.1. Front System ............................................................................................................................ 24
5.1.2. Mid-drive system ..................................................................................................................... 25
5.1.3. Hub Subsystem ....................................................................................................................... 27
5.1.4. Shifting Subsystem .................................................................................................................. 29
5.2. System Function .............................................................................................................................. 29
5.3. Detailed Analysis ............................................................................................................................. 30
5.3.1. Gear Reduction Analysis ........................................................................................................ 30
5.3.2. Chain Load Analysis ............................................................................................................... 30
5.3.3. Structural Analysis .................................................................................................................. 31
5.3.4. Torque Steer Analysis ............................................................................................................. 32
5.3.5. Chain Path Analysis ................................................................................................................ 33
5.4. Safety, Maintenance, and Repair ................................................................................................... 35
5.5. Cost Analysis .................................................................................................................................... 35
6. Manufacturing .......................................................................................................................................... 36
6.1. Procurement ..................................................................................................................................... 36
6.2. Component Manufacturing ........................................................................................................... 36
6.2.1. Mid-Drive Mounts .................................................................................................................. 36
6.2.2. Mid-Drive Gear Adapter ....................................................................................................... 38
6.2.3. Chain Tensioner Mount ......................................................................................................... 38
6.2.4. Mid Drive Hub ........................................................................................................................ 39
6.3. Outsourced components ................................................................................................................ 40
6.4. Assembly........................................................................................................................................... 40
6.5. Manufacturing Challenges .............................................................................................................. 42
6.6. Recommendations ........................................................................................................................... 42
7. Design Verification .................................................................................................................................. 43
7.1. Freedom of Motion ........................................................................................................................ 44
7.2. Frontal Area ..................................................................................................................................... 44
7.3. Q-Factor ........................................................................................................................................... 45
7.4. Clearance with Fairing/Frame....................................................................................................... 45
7.5. Chain Installation Time .................................................................................................................. 45
7.6. Component Load Test ................................................................................................................... 46
7.7. Number of Tools Required ........................................................................................................... 47
v
7.8. Chain Angle/Offset ........................................................................................................................ 47
7.9. Cost to Build .................................................................................................................................... 47
8. Project Management ............................................................................................................................... 49
8.1. Overall Design ................................................................................................................................. 49
8.2. Manufacturing .................................................................................................................................. 49
8.3. Testing............................................................................................................................................... 49
8.4. Project Timeline .............................................................................................................................. 50
8.5. Discussion of Process ..................................................................................................................... 50
9. Conclusions and Recommendations ..................................................................................................... 51
Works Cited ...................................................................................................................................................... 52
List of Tables ...................................................................................................................................................... v
List of Figures ................................................................................................................................................... vii
Appendix A – Preliminary Data Collection/Test Results ........................................................................... 1
Appendix B – QFD House of Quality ........................................................................................................... 3
Appendix C – Design Verification Plan ......................................................................................................... 4
Appendix D – Pugh Matrices .......................................................................................................................... 5
Appendix E – Weighted Decision Matrix ...................................................................................................... 6
Appendix F – Bicycle Gear Standard Dimensions ....................................................................................... 7
Appendix G – Gear Ratio MatLab Calculations ........................................................................................... 8
Appendix H – Gear Ratio Excel Calculations ............................................................................................. 10
Appendix I – Top View Layout Models ....................................................................................................... 12
Appendix J – Design Hazard Checklist ........................................................................................................ 14
Appendix K – Bill of Materials ...................................................................................................................... 16
Appendix L – Drawing Package .................................................................................................................... 18
Appendix M – Chain load Analysis Hand Calculations, Code, and Results ........................................... 32
Appendix N – Mid-Drive Hub Load Analysis ............................................................................................ 37
Appendix O – Torque Steering Analysis ...................................................................................................... 38
Appendix P – Chain Path Analysis Results .................................................................................................. 39
Appendix Q – Risk Assessment .................................................................................................................... 40
Appendix R – Failure Mode and Effects Analysis ...................................................................................... 42
Appendix S – Project Budget ......................................................................................................................... 48
Appendix T – Operator’s Manual ................................................................................................................. 50
Appendix U – Test Procedures ..................................................................................................................... 61
Appendix V – Gantt Chart ............................................................................................................................. 65
vi
List of Tables
1. Comparison of Power Output for Varying Levels of Rider Fitness 2. List and Description of Relevant Patents 3. Drivetrain Engineering Specifications 4. Summary Cost Break Down (US dollars) 5. Specification Validation Methods 6. Specification Results
vii
List of Figures
1. IUT Annecy’s mid-drive, with a SRAM 12-speed cassette 2. First-stage reduction of TU Delft’s drivetrain with electronically shifted cassette 3. University of Toronto’s mid-drive with a 4-Gear cassette 4. Comparison of non-circular (left) and circular (right) chainrings 5. Boundary diagram for the HPV drivetrain 6. Rear-wheel drive with multiple chain guides (idlers) and two reductions 7. Front-wheel drive with two reductions on either side of the bike centerline 8. Front-wheel drive with two reductions on the right side of the bike centerline 9. Front-wheel drive with two reductions on the left side of the bike centerline 10. Front-wheel drive with two reductions aligned with the bike centerline 11. Right-offset concept prototype 12. Right-offset isometric model 13. Split-offset isometric model 14. Final drivetrain assembly 15. Front system assembly 16. Mid-drive system assembly 17. Mid-drive system exploded assembly 18. Modified Phil-wood mid-drive hub and adapter 19. Modified 11 speed cassette with 8 gears ranging from 12-28 teeth 20. Mid-drive mounts 21. Hub subsystem 22. Custom fabricated chain tensioner 23. Shifting subsystem 24. Stress distribution on right mid-drive mount 25. Stress levels on mid-drive adapter 26. Torque steer due to off-axis chain path in second reduction 27. Chain path between cassette and chainring 28. Second-stage chain clearance with fork 29. Waterjet outer profile and hole locations on mid-drive mounting plates and mid-drive adapter 30. First fitting test of right mounting plate on frame 31. Chain tensioner bushing 32. Chain tensioner adapter 33. Mid-drive hub and gear adapter 34. Drivetrain assembly integration 35. Mid-drive assembly 36. Chain tensioner assembly drawing 37. Left-hand threaded freewheel 38. Test fitting of rider 39. Chain installation time test 40. Load testing setup (left) and test in progress (right)

1
1. Introduction
The Cal Poly Human Powered Vehicle Club and their advisor, George Leone, reached out to the senior project team because they need an efficient and reliable drivetrain for their vehicle. The club’s goal is to design, build, test, and ride a custom recumbent bike to attempt to break the U.S. collegiate unassisted human powered land speed record of 61.3 mph. The drivetrain team consists of four mechanical engineering seniors at California Polytechnic State University in San Luis Obispo. Derek Fromm is the analysis lead for the project. Luke Opitz is the design lead. Michael Juri is the project manager and sponsor contact. Olivier Côté is the manufacturing lead.
Due to the difficulty of this challenge, it is pertinent that the bike utilizes the rider’s maximum performance and power output. To accomplish this, the drivetrain must be designed for the rider’s preferred cadence (or pedal rate), pedal stroke diameter, and leg extension. The team is responsible for designing, building, and testing a drivetrain that meets the requirements of both the club and the rider. The following document outlines the research, objectives, design, manufacturing, and testing for this drivetrain, as well as a detailed design verification section and an analysis of the overall project timeline.
2. Background Research
During the Summer of 2018, two of the team’s members, Derek and Michael, conducted field research of current human powered vehicles at the IHPVA competition in Battle Mountain, NV. In late September, the entire team met with the Cal Poly Human Powered Vehicle Club to better understand the scope of the project. Soon after, the team visited the club’s mentor, George Leone, to gain more technical insight into how to design a human powered vehicle. The team also researched technical papers to gain a better understanding of human performance and pedaling efficiency. Finally, the team researched relevant patents to gain insight into existing solutions. This research is outlined in the sections below.
2.1. Product Research
The four most prominent teams that Michael and Derek observed at the IHPVA World Speed Challenge were the French, Italian, Dutch, and Canadian teams. In addition, they observed an individual builder, Hans van Vugt, who constructed his own high-performance bike. Due to the niche nature of this competition, there are no competing products on the market. The only competition for this project is the other teams competing at the IHPVA competition.
2.1.1. French Team
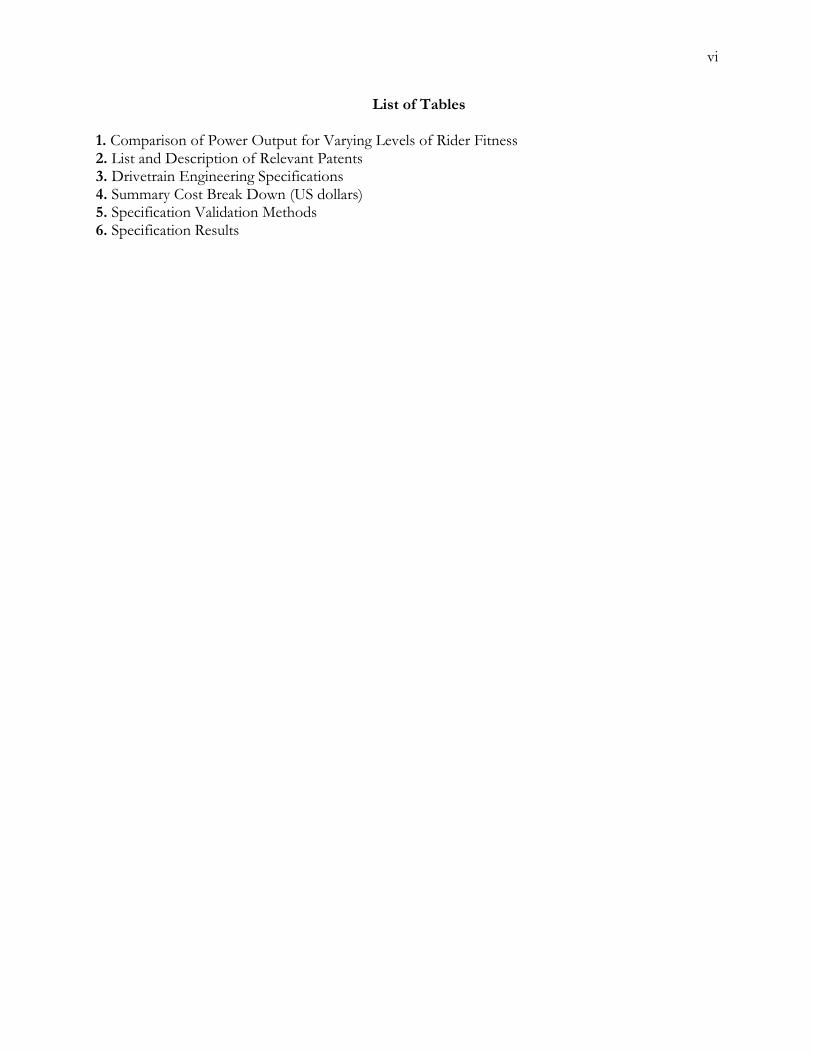
IUT Annecy (French University Institutes of Technology) designed a front-wheel drive, two-stage reduction drivetrain. The first chain reduction spanned a 33-tooth chainring to a SRAM 12-speed NX cassette, which ranges from 11 teeth to 50 teeth (SRAM is a bicycle component manufacturer and the NX cassette is an off-the-shelf product). Figure 1 shows the relative size of this cassette. In this design, a SRAM GX derailleur was modified by removing the chain tensioner. To fit a lower profile while still being able to shift the chain on the cassette, IUT designed a custom chain tensioner. The chain reduction was centered in the frame, allowing for wider components without interfering with the rider’s leg movements. The cassette was fixed to a second, 119-tooth gear which made up part of the second reduction. A chain with a smaller pitch was used on this reduction. The
2
chain spanned the 119-tooth gear to a 26-tooth gear attached to the front wheel hub. A smaller chain tensioner was used to account for the chain slack when the wheel was turned from side to side. Since the 26-tooth gear had such a small radius, a chain with a larger pitch would bind on this gear, warranting the smaller pitch chain. The entire drivetrain was mounted to a carbon frame.
Figure 1. IUT Annecy’s mid-drive, with a SRAM 12-speed cassette
2.1.2. Italian Team
The Italian Polycumbent team used a two-stage gear reduction, similar to the French team, with a chain spanning a chainring to a mid-drive cassette. The mid-drive was located almost directly above the hub of the front wheel so that the second-reduction chain would travel straight down to the hub gear on the wheel. This first reduction was located on the right side of the frame, while the second reduction was located on the left side.
The unique feature of this drivetrain was the shifting mechanism. The Polycumbent team patented an electronic shifting mechanism which would shift the entire cassette horizontally beneath the chain, instead of shifting the chain across the cassette gears with a derailleur. This kept the chain perfectly straight when shifted to each of the 6 gears, increasing chain efficiency.
2.1.3. Dutch Team
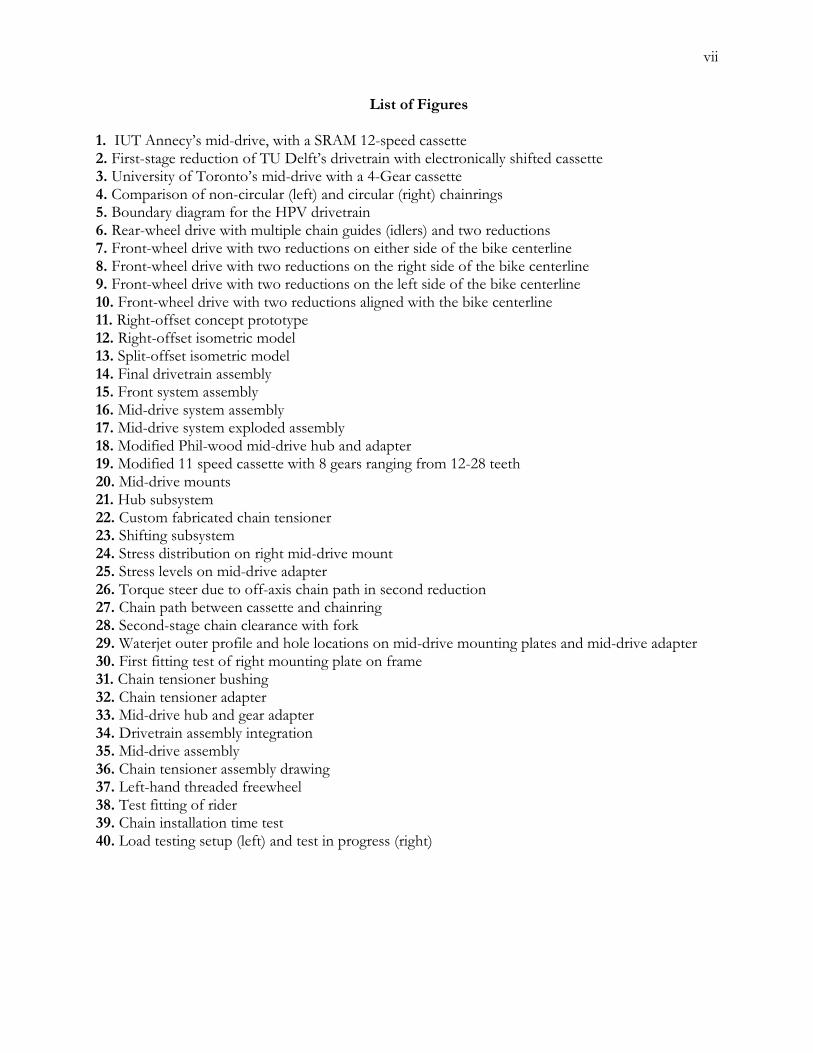
The Dutch team’s drivetrain was almost identical to the Italian team with a two-stage reduction, shifting cassette, single chainring, right-side first reduction, and left-side second reduction (shown in Figure 2). However, unlike the Italian team, TU Delft’s (Dutch University of Technology) cassette had only 4 gears, which allowed for a slightly lower-profile design.
3
Figure 2. First-stage reduction of TU Delft’s drivetrain with electronically shifted cassette
2.1.4. Canadian Team
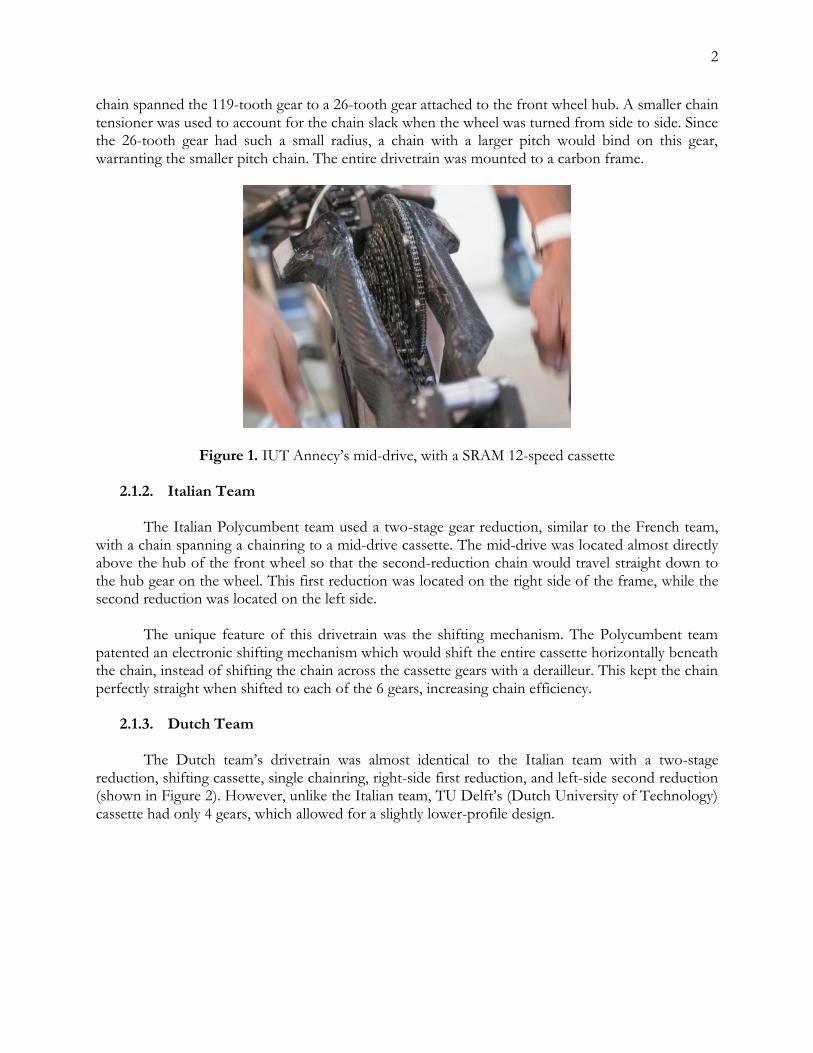
The University of Toronto had a similar design to Delft’s drivetrain, though with a standard derailleur instead of a shifting cassette. The team’s chief engineer stated that he, “could get away with 3 gears on the cassette”; however, due to the large size of his smallest drive ratio, it was difficult for him to start pedaling. The small cassette is shown in Figure 3.
Figure 3. University of Toronto’s mid-drive with a 4-Gear cassette
2.1.5. Hans Van Vugt
Hans Van Vugt is an independent builder who has been competing at the IHPVA world speed challenge for many years. His high-performance bike used rear-wheel drive at this year’s competition.
4
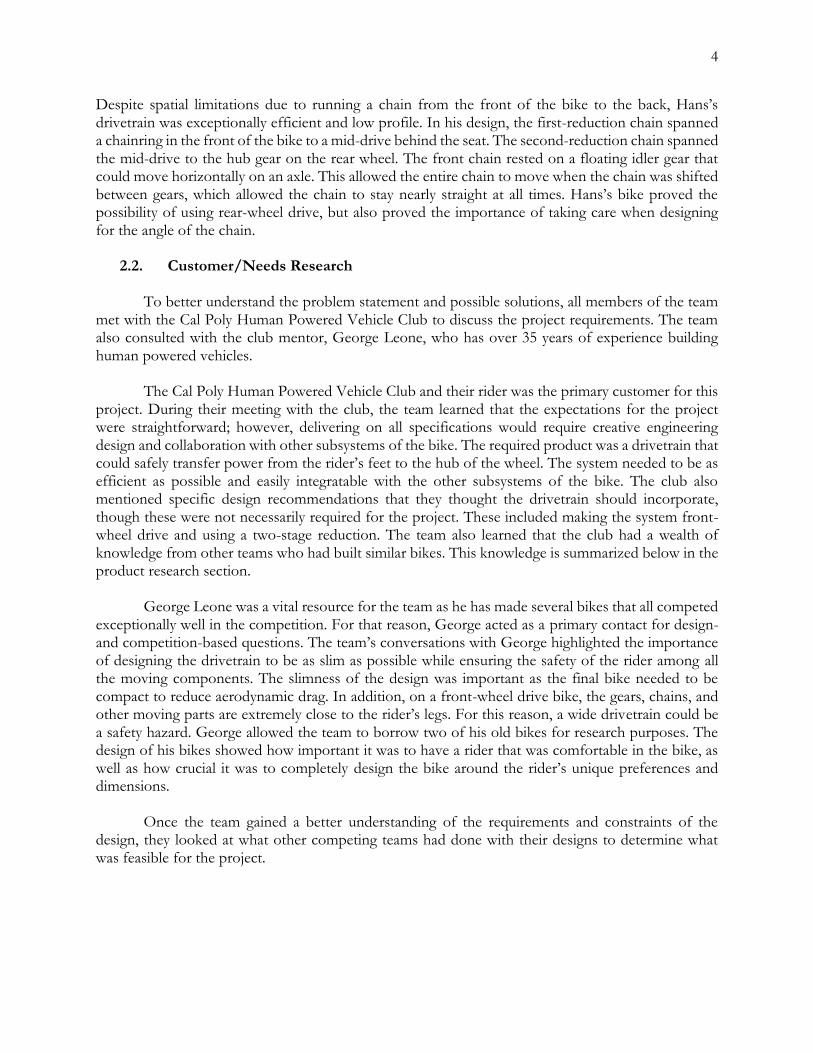
Despite spatial limitations due to running a chain from the front of the bike to the back, Hans’s drivetrain was exceptionally efficient and low profile. In his design, the first-reduction chain spanned a chainring in the front of the bike to a mid-drive behind the seat. The second-reduction chain spanned the mid-drive to the hub gear on the rear wheel. The front chain rested on a floating idler gear that could move horizontally on an axle. This allowed the entire chain to move when the chain was shifted between gears, which allowed the chain to stay nearly straight at all times. Hans’s bike proved the possibility of using rear-wheel drive, but also proved the importance of taking care when designing for the angle of the chain.
2.2. Customer/Needs Research
To better understand the problem statement and possible solutions, all members of the team met with the Cal Poly Human Powered Vehicle Club to discuss the project requirements. The team also consulted with the club mentor, George Leone, who has over 35 years of experience building human powered vehicles.
The Cal Poly Human Powered Vehicle Club and their rider was the primary customer for this project. During their meeting with the club, the team learned that the expectations for the project were straightforward; however, delivering on all specifications would require creative engineering design and collaboration with other subsystems of the bike. The required product was a drivetrain that could safely transfer power from the rider’s feet to the hub of the wheel. The system needed to be as efficient as possible and easily integratable with the other subsystems of the bike. The club also mentioned specific design recommendations that they thought the drivetrain should incorporate, though these were not necessarily required for the project. These included making the system front-wheel drive and using a two-stage reduction. The team also learned that the club had a wealth of knowledge from other teams who had built similar bikes. This knowledge is summarized below in the product research section.
George Leone was a vital resource for the team as he has made several bikes that all competed exceptionally well in the competition. For that reason, George acted as a primary contact for design- and competition-based questions. The team’s conversations with George highlighted the importance of designing the drivetrain to be as slim as possible while ensuring the safety of the rider among all the moving components. The slimness of the design was important as the final bike needed to be compact to reduce aerodynamic drag. In addition, on a front-wheel drive bike, the gears, chains, and other moving parts are extremely close to the rider’s legs. For this reason, a wide drivetrain could be a safety hazard. George allowed the team to borrow two of his old bikes for research purposes. The design of his bikes showed how important it was to have a rider that was comfortable in the bike, as well as how crucial it was to completely design the bike around the rider’s unique preferences and dimensions.
Once the team gained a better understanding of the requirements and constraints of the design, they looked at what other competing teams had done with their designs to determine what was feasible for the project.
5
2.3. Technical Research
Bike speed is affected by many factors: the rider’s performance, the smoothness of shifting, and the types of components that are used. Especially important are the types of cranks and pedals that are chosen, and the shape of the chainring. The team’s research in these areas is broken into sections below.
2.3.1. Rider Power
The core part of a human powered vehicle is the human, whose power drives the bike forward. Humans are imperfect engines and the delivery of power from the rider to the drivetrain is not a perfectly efficient process. The power that the rider can generate will depend on their fitness and the time interval of effort. A rider will not be able to sustain the same power output for five minutes that they could for fifteen seconds. A good cyclist can output 900 watts on average for 10 seconds. Over a minute-long interval, a good cyclist can likely only output approximately 600 watts on average [1]. The club’s rider will need to build up speed for five miles before he reaches the speed trap (where his speed will be recorded). He will need to conserve as much energy as possible during the build-up, so that he can produce the power required to reach the expected top speed by the speed trap.
Another major consideration with respect to human power is that no two riders are the same. Different cyclists will have different levels of endurance and maximum power output. Data collected by Training Peaks shows how widely the power-to-weight-ratios range within the cycling world. A small set of the data is shown in Table 1.
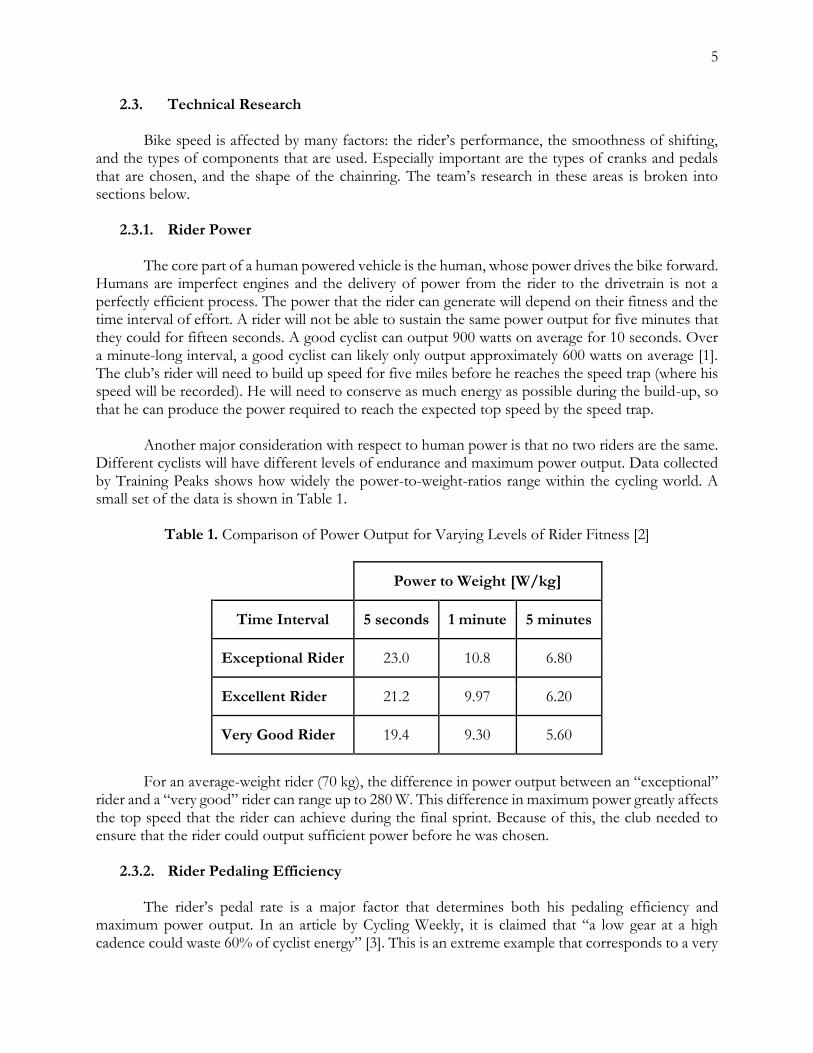
Table 1. Comparison of Power Output for Varying Levels of Rider Fitness [2]
Power to Weight [W/kg]
Time Interval 5 seconds 1 minute 5 minutes
Exceptional Rider 23.0 10.8 6.80
Excellent Rider 21.2 9.97 6.20
Very Good Rider 19.4 9.30 5.60
For an average-weight rider (70 kg), the difference in power output between an “exceptional” rider and a “very good” rider can range up to 280 W. This difference in maximum power greatly affects the top speed that the rider can achieve during the final sprint. Because of this, the club needed to ensure that the rider could output sufficient power before he was chosen.
2.3.2. Rider Pedaling Efficiency
The rider’s pedal rate is a major factor that determines both his pedaling efficiency and maximum power output. In an article by Cycling Weekly, it is claimed that “a low gear at a high cadence could waste 60% of cyclist energy” [3]. This is an extreme example that corresponds to a very
6
low power, 50W, at a very high pedal rate, 110 rpm. Nevertheless, it highlights a crucial design consideration: the gears must be designed to allow the rider to pedal at an efficient rate for the duration of the race. Designing with this criterion in mind allowed us to reduce the amount of pedaling energy wasted, which will directly impact the bike’s top speed at the competition.
Choosing a pedal rate is a complicated process, as there is no consensus on whether a fast or slow pedal rate is more efficient. Typical pedal rates range from 60 to 100 rpm for most cyclists. Studies have shown that, in general, a lower cadence results in more muscle fatigue, whereas a higher cadence results in a higher heart rate. In a study done at Cal Poly, senior Katy McGarry found that the most “economical” pedal rate depended on the rider’s power output. She conducted tests on multiple college cyclists and found that while 80 rpm was optimal for a 300W output, 60 rpm was optimal for a 150W output. She tested more pedal rates and found a trend that lower cadences were more efficient for lower power outputs and higher cadences were more efficient for higher power outputs [4].
Despite having data on optimal cadences, riders have “preferred cadences” which they will choose over the most efficient pedal cadence. This preferred cadence usually falls above the optimal cadence, resulting in a higher heart rate, but reduced power per stroke. McGarry also writes that oxygen consumption is highest at a rider’s preferred pedal rate. Another Cal Poly senior project report, written by Kathleen Kelley, states that riders are most efficient at approximately 91 rpm [5]. However, this test produced a significant amount of variance in the data, so this value may not be accurate.
Despite the research that has been done on pedal rate and efficiency, each cyclist must be analyzed on an ad hoc basis. In a discussion with Cal Poly Kinesiology Professor, Robert Clark, the team learned that the best way to design for an efficient pedal stroke is to perform power and heart rate tests on the rider [6]. The team conducted a series of power tests on potential riders as a baseline (Appendix A). Cadence preference, leg length, and muscle type vary between riders, so their efficient pedal rate can vary significantly. Therefore, the team determined that researched values for pedal rate would only be used as a baseline for design. Final gear ratios were based solely on data collected on the rider.
2.3.3. Pedals, Cranks, and the Chainring
The rider’s first contact with the drivetrain is with the cranks and chainring. While the rest of the drivetrain was designed for mechanical efficiency and shifting, the cranks and chainring were designed for optimal rider power and pedaling efficiency.
Attempts have been made to improve the typical bike crank involving geometry changes that optimize length during the rider’s stroke. In an experiment by Paola Zamparo, a new prototype crank resulted in a bike velocity increase of 1 km per hour [7]. While this is a marginal increase, it was enough to elicit consideration when incorporating cranks into the drivetrain design. Despite the potential benefit of this design, the complexity of this prototype crank was contrary to the club’s goal of a simple design. Therefore, this custom crank was not used in the design of the drivetrain.
In a study titled, “Human Power Transfer to Modern Vehicles,” the authors claim that optimal crank length is a function of a rider’s leg length [8]. In discussions with cyclists on the Cal Poly cycling team, the team found that this statement was true. Riders have preferred crank lengths ranging from 165 to 175 mm. Taller riders prefer longer cranks, and shorter riders prefer shorter cranks. This presented an interesting challenge in the design, as the rider needed long crank arms to supply torque
7
to power the vehicle, but wider crank arms would cause inefficiencies and be awkward for the rider. This information resulted in a consensus that standard cranks were the best option.
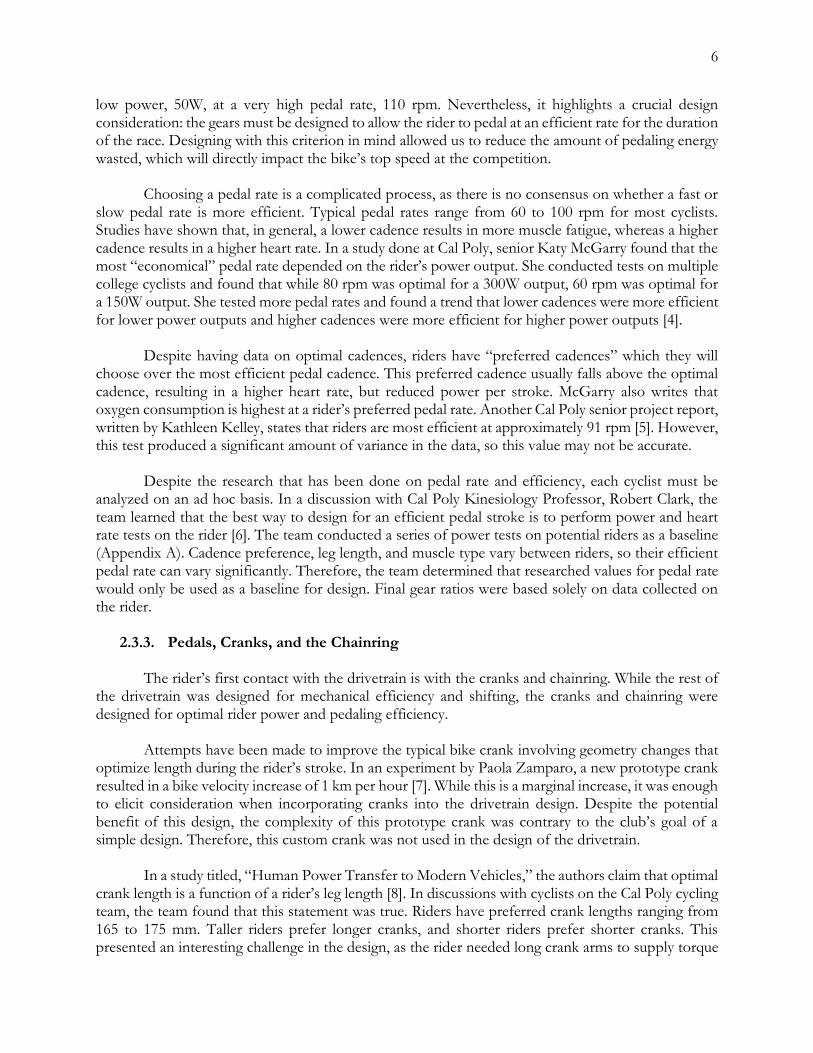
The next component of the drivetrain is the chainring, which delivers power from the cranks to the first chain in the system. There are two styles of chainrings that exist today, both with benefits that were worth researching. As seen in Figure 4, there are circular chainrings (CC’s), and non-circular chainrings (NCC’s). Non-circular chainrings, such as the Osymetric chainring, are designed to maximize torque during the most powerful part of the pedal stroke and minimize resistance during the weakest part.
Figure 4. Comparison of non-circular (left) and circular (right) chainrings
An early study in 1992 showed that changes in chainring shape did not improve pedaling efficiency [9]. However, a recent study by Dr. Robert Clark at Cal Poly showed that there are efficiency and power benefits from the non-circular chainring. After discussing with multiple cyclists, the team found that a significant issue with the non-circular chainring is that most cyclists are not used to it. Transitioning to a new type of chainring can be difficult for riders to adapt to, which can reduce the amount of power they can output. In a study done on hand cyclists, Sebastian Zeller found that the difference in energy expenditure, gross efficiency, and net efficiency between NCC’s and CC’s was insignificant [10]. This is slightly irrelevant in that hand cycling is biomechanically dissimilar from regular pedaling. A third study found that NCC’s were beneficial during the “dead center of the stroke” and not beneficial during the “downstroke” [11]. To maintain the simplicity of the design and comfort of the rider, the team decided that circular chainrings would be the best option.
2.3.4. Shifting
Another important component of the drivetrain is the shifting mechanism, or derailleur. The derailleur shifts the chain between the gears of the cassette to change the gear ratio for the rider, making it easier or harder to pedal relative to the revolutions of the driving wheel.
There are two main types of shifting mechanisms: mechanical and electronic. Mechanical shifters use cables to actuate the motion of shifting the system and the chain across the cassette. The limits of motion for a mechanical shifter are set by limit screws, which are adjustable for optimal performance. Electronic shifters use a motor to shift the chain and are powered by a battery. They must be charged to work and are typically more expensive than mechanical shifters. However,

8
electronic shifters are often more reliable than mechanical shifters. With electronic shifting, the chain will always move precisely and will never mis-shift. It can shift when riding up hills, even with high pressure on the pedals. Electronic shifting is also an excellent solution for riders who have weak hands or other limitations that make shifting gears difficult, as shifting consists of pressing a button rather than pulling a lever.
As an alternative to derailleurs, internal hubs have shifting mechanisms inside the hub of the rear wheel and can work with a chain or a belt drive (belt drives are stronger, quieter and cleaner than a chain, with less maintenance. However, they are more difficult and sometimes even impossible to install on custom bikes, and thus are the inferior option for the team’s purposes). Because all moving parts are completely protected from water, dirt, and grime, internal gear hubs are lower maintenance than conventional cassettes, but they are limited in how many gears they can provide.
There are also different kinds of shifters for different types of bikes. Road bikes have shifters integrated into the brake levers of the bike. They are easy to reach and in the rider’s field of vision, so they do not have to take their eyes off the road to shift. Older and lower-budget road bikes have shifters mounted on either side of the stem, on the downtube, or in the bar ends. Mountain bike shifters are either thumb shifters or grip shifters. Thumb shifters have two levers for each hand—one lever moves the chain up through the gears and one moves the chain down. On one hand, the top lever makes the gears harder, and on the opposite hand the top shifter makes the gears easier. Grip shifters let you switch gears by twisting the indexed grip of your bike forward or backward. Like with thumb shifters, twisting one way moves the chain up through the gears and twisting the opposite way moves the chain down [12].
2.4. Relevant Patent Research
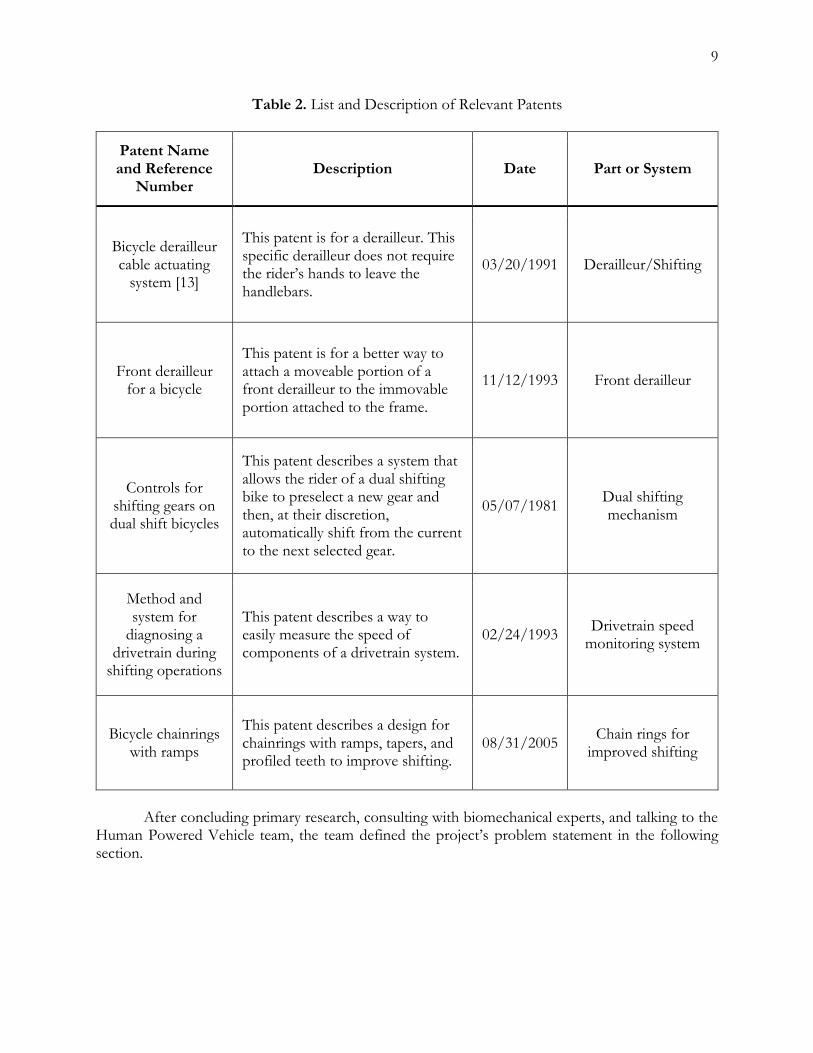
The final important piece of research to consider was relevant patent research. This ensured that the team would avoid patent infringement, while also providing them with information on existing products. As there are no existing custom drivetrain patents, the patent research in this section consists of research on components. Table 2 summarizes the relevant patents that the team has investigated.
9
Table 2. List and Description of Relevant Patents
Patent Name and Reference
Number Description Date Part or System
Bicycle derailleur cable actuating
system [13]
This patent is for a derailleur. This specific derailleur does not require the rider’s hands to leave the handlebars.
03/20/1991 Derailleur/Shifting
Front derailleur for a bicycle
This patent is for a better way to attach a moveable portion of a front derailleur to the immovable portion attached to the frame.
11/12/1993 Front derailleur
Controls for shifting gears on dual shift bicycles
This patent describes a system that allows the rider of a dual shifting bike to preselect a new gear and then, at their discretion, automatically shift from the current to the next selected gear.
05/07/1981 Dual shifting mechanism
Method and system for
diagnosing a drivetrain during
shifting operations
This patent describes a way to easily measure the speed of components of a drivetrain system.
02/24/1993 Drivetrain speed
monitoring system
Bicycle chainrings with ramps
This patent describes a design for chainrings with ramps, tapers, and profiled teeth to improve shifting.
08/31/2005 Chain rings for
improved shifting
After concluding primary research, consulting with biomechanical experts, and talking to the Human Powered Vehicle team, the team defined the project’s problem statement in the following section.
10
3. Objectives
This section defines the scope and objectives of this project. It includes a concise statement of the problem and the goal of the project, a diagram that shows the physical scope of the drivetrain system, and a discussion of the Quality Function Deployment (QFD) process.
3.1. Problem Statement
The HPV club needed an efficient and reliable way for their rider to deliver power to the drive wheel of the 2019 human powered vehicle. The rider needed to be able to pedal the bike at a speed of 61.3 mph and the club needed to be able to adjust and maintain the mechanical components required for this power transmission. The design needed to be as mechanically and spatially efficient as possible to allow the rider to pedal powerfully with no interference from the drive system.
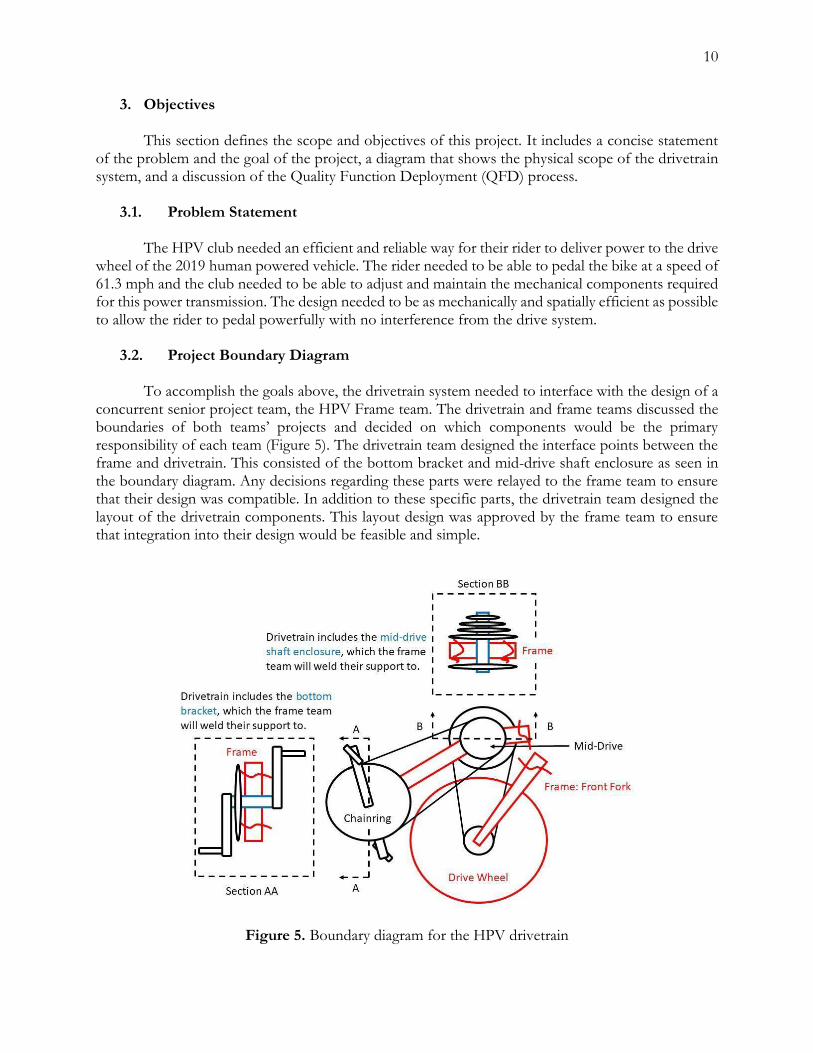
3.2. Project Boundary Diagram
To accomplish the goals above, the drivetrain system needed to interface with the design of a concurrent senior project team, the HPV Frame team. The drivetrain and frame teams discussed the boundaries of both teams’ projects and decided on which components would be the primary responsibility of each team (Figure 5). The drivetrain team designed the interface points between the frame and drivetrain. This consisted of the bottom bracket and mid-drive shaft enclosure as seen in the boundary diagram. Any decisions regarding these parts were relayed to the frame team to ensure that their design was compatible. In addition to these specific parts, the drivetrain team designed the layout of the drivetrain components. This layout design was approved by the frame team to ensure that integration into their design would be feasible and simple.
Figure 5. Boundary diagram for the HPV drivetrain
11
3.3. QFD House of Quality
To determine the engineering specifications for this project, the team completed a House of Quality (Appendix B). The team defined their “customers” to be the club’s build team and rider. After listing customer needs and rating their importance, the team found that the highest priority needs to satisfy were safety, mechanical efficiency, ergometry (rider power), and reliability of the drivetrain. Analyzing these specifications for competitors’ bikes showed that many of them had high ratings in efficiency and ergometry, but lower ratings in maintainability and cost. Maintainability was an important goal for the club as it would allow them to minimize repair time at the competition, maximizing the total time to compete and gain experience. Due to the importance of this design concern, the team kept maintainability at the forefront of their design. Finally, after weighing the selected specifications against the club’s requirements, the team found that the most important tests for the drivetrain to pass were the freedom of motion test, proof of power test, and chain line assessment. These tests and assessments needed to be planned and completed rigorously to ensure the feasibility and safety of the system.
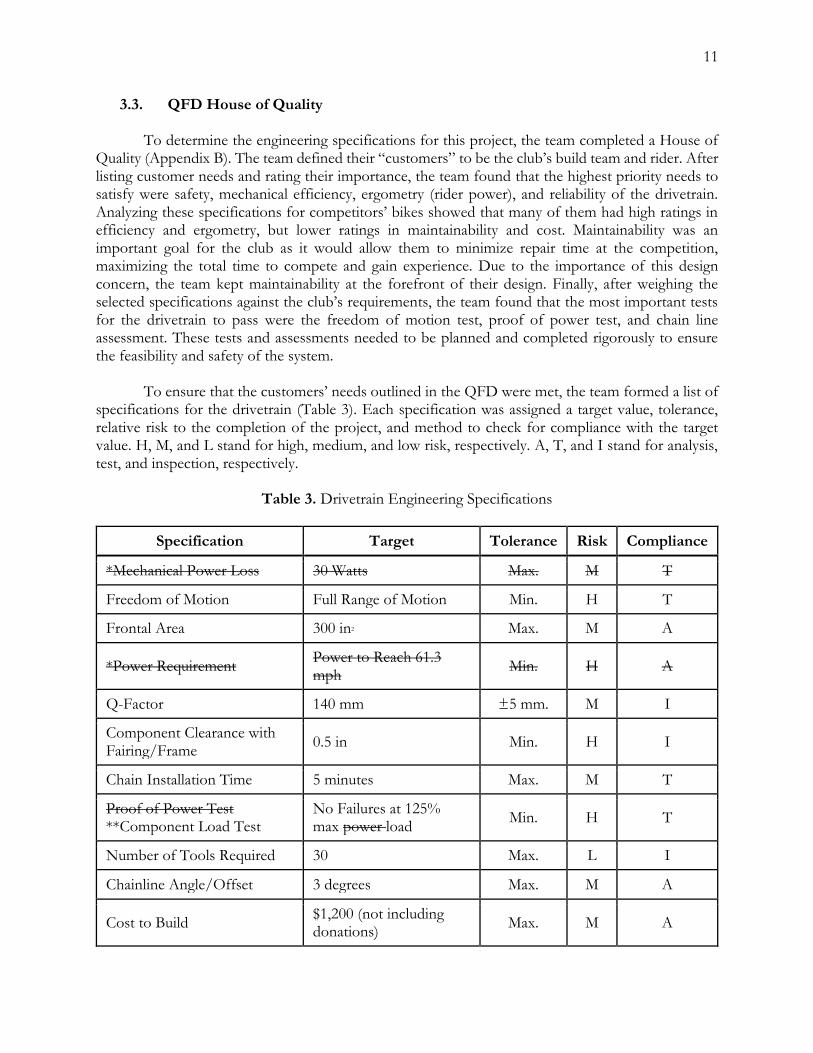
To ensure that the customers’ needs outlined in the QFD were met, the team formed a list of specifications for the drivetrain (Table 3). Each specification was assigned a target value, tolerance, relative risk to the completion of the project, and method to check for compliance with the target value. H, M, and L stand for high, medium, and low risk, respectively. A, T, and I stand for analysis, test, and inspection, respectively.
Table 3. Drivetrain Engineering Specifications
Specification Target Tolerance Risk Compliance
*Mechanical Power Loss 30 Watts Max. M T
Freedom of Motion Full Range of Motion Min. H T
Frontal Area 300 in2 Max. M A
*Power Requirement Power to Reach 61.3 mph
Min. H A
Q-Factor 140 mm ±5 mm. M I
Component Clearance with Fairing/Frame
0.5 in Min. H I
Chain Installation Time 5 minutes Max. M T
Proof of Power Test **Component Load Test
No Failures at 125% max power load
Min. H T
Number of Tools Required 30 Max. L I
Chainline Angle/Offset 3 degrees Max. M A
Cost to Build $1,200 (not including donations)
Max. M A
12
* All strikethrough specifications were retroactively eliminated due to the team’s inability to acquire the equipment necessary to validate the specification. In addition, the team and club decided that the importance of these specifications was negligible enough to omit them.
** The Proof of Power Test was retroactively changed to the Component Load Test. This change was due to the team’s inability to acquire the necessary equipment required to perform the test. However, the specification was still deemed important, so the test was simply altered to be feasible for the team to complete.
As seen in the table, three of the specifications were high-risk. These included: freedom of motion, component clearance, and component load test. The component load test was a high-risk specification as any component failure could jeopardize the safety of the rider. The other two high-risk specifications were classified accordingly due to the potential for total system failure if these specifications were not met.
The table also shows that, in addition to the three specifications that needed to be tested, three specifications needed to be validated via analysis, and three more simply by inspection. A complete discussion of each specification and its accompanying analysis, test, or inspection can be found below and in Appendix C.
3.3.1. Discussion of Specifications
1. Freedom of Motion: The rider must have full range of motion. His ability to pedal with no interference from other parts of the bike (against his feet/legs/knees/etc.) is critical for his power output.
2. Frontal Area: The frontal area of the entire drivetrain system must be limited to less than 300 square inches to allow for maximum aerodynamic efficiency of the bike.
3. Q-Factor: The Q-factor, or the distance from the outside of one crank arm to another, must be within 5 millimeters of 140 millimeters, which is the standard Q-factor of a road bike and the preferred Q-factor of the rider.
4. Component Clearance with Fairing/Frame: The drivetrain system must have at least 0.5 inches of clearance between all components and both the frame and fairing.
5. Chain Installation Time: The installation of the chain must take no longer than five minutes. This is a metric that ensures that the system is easily accessible and maintainable.
6. Component Load Test: This test ensures that no component will fail under a load that is 1.25 times the maximum load that each component will experience when under the rider’s power.
7. Number of Tools Required: The number of tools required to assemble and maintain the system must remain under 30 tools. This is a metric that ensures the simplicity of the design in terms of assembly and maintenance.
8. Chainline Angle/Offset: The angle of the chain while under load must be less than 3 degrees to maximize efficiency and minimize losses due to chain rubbing.
9. Cost to Build: The total cost of the system should remain below $1,200.
13
4. Concept Design
With background research completed and the project objectives and specifications defined, the team set out to choose a design direction. The following section outlines the concept ideation, functional comparison, and concept analysis that led to the initial five concept designs. This section also explains why the team decided to move forward with the two concept designs that they deemed the best. After further research, the team chose the best conceptual design and moved forward with final design. The final design was redesigned slightly multiple times. The reasoning for these redesigns as well as the details of the design changes are described in the Final Design chapter.
4.1. Ideation
Initial drivetrain ideas were generated as the team researched current drivetrain systems used in similar bikes. In addition, the team participated in creative brainstorming sessions to generate and expand on more ideas. The team eventually decided to design a drivetrain with a chain/sprocket power transfer system. Every bicycle drivetrain on the market today, with very few exceptions, uses sprockets, chains, and derailleurs to transfer power. These bikes have reasonable gear reductions and reliable shifting. There is also a wide range of reliable off-the-shelf components (chainrings, cassettes, bottom brackets, derailleurs, etc.) that could be used in a chain/sprocket drivetrain. Compared to the complexity of a driveshaft system or belt drive with an internal hub, the chain/sprocket system was simple and would satisfy the team’s design requirements of a low-profile drivetrain. After finalizing this decision, the team moved on from the ideation process to design a chain/sprocket drive system.
4.2. Functional Comparison
There are three significant design choices that define the design of a custom drivetrain: the choice of front- or rear-wheel drive, the number of gear reductions, and the overall layout of the components. The team evaluated every option to ensure that they made the best decisions for each of the three design choices. These evaluations are summarized below.
Nearly all standard bikes on the market, including recumbents, use rear-wheel drive. Consequently, bicycle components have been designed for rear-wheel drive systems for decades. However, bikes at the IHPVA competition almost exclusively utilize front-wheel drive. To determine the best option, the team utilized a Pugh matrix to compare these two designs (Appendix D, Table D1). This comparison showed that both designs were feasible. This led the team to continue to consider rear-wheel drive as a viable option, despite an initial predisposition towards a front-wheel drive system.
At the IHPVA competition, the rider must slowly increase the speed of the bike over five miles before they enter the speed trap. As the bike increases speed, the gear reduction between the rider’s input and the rotation of the drive wheel must steadily increase to keep the rider at his most efficient cadence for the entire distance. At 65 mph, the drive ratio required to keep the rider pedaling at 90 rpm is about 10. This is more than twice that of a regular road bike drive ratio. The options to create this reduction are to use a very large chainring and large number of gears in a single reduction or use a second/third reduction to scale a regularly sized first reduction. After evaluating a Pugh matrix, the team determined that the 2-stage reduction was the best option (Appendix D, Table D2).
14
The greatest amount of variation in drivetrain design between bikes at the competition was the layout of the drivetrain. The design of the layout affects the design of the frame and the proximity of drivetrain components to the wheel and the rider’s legs. The team evaluated each layout in a Pugh matrix to determine the best option (Appendix D, Table D3). Each layout is defined relative to the centerline of the bike (i.e. centered, on the left side, on the right side, or split on either side). The comparison of these layouts resulted in differences in the overall profile of the system and the custom components required; however, none of the layouts seemed to be inherently superior to the others.
4.3. Concept Analysis
After combining the best options from each of the three design considerations, the team generated five concept designs with the most desirable combinations. The concept designs are discussed and analyzed below.
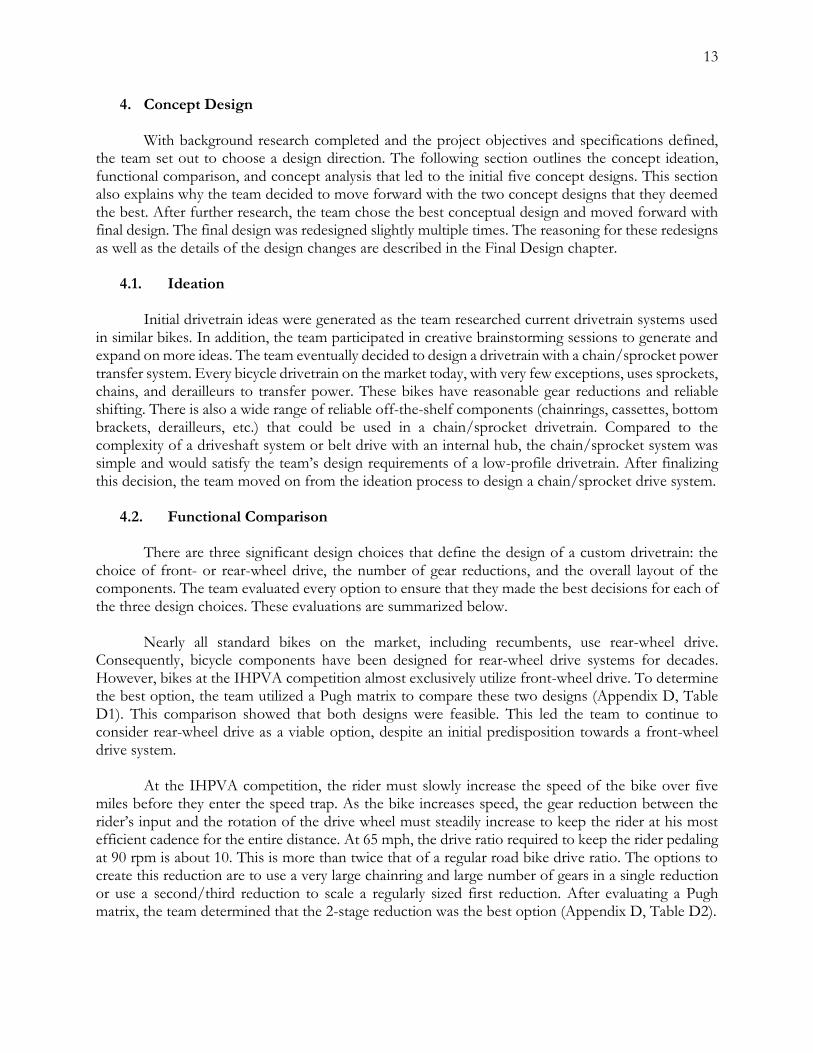
4.3.1. Rear Wheel Drive, 2 Stage, Split-Offset
Rear-wheel drive, despite its larger size, is a more standard drive system than front-wheel. Most off-the-shelf recumbents use rear-wheel drive, with an entirely right-side drive. In order to achieve the large gear reduction necessary, a second reduction, offset to the left, would be necessary. Figure 6 shows the large size and extra components necessary to use rear-wheel drive.
Figure 6. Rear-wheel drive with multiple chain guides (idlers) and two reductions
4.3.2. Front Wheel Drive, 2 Stage, Split-Offset
Most teams at the IHPVA competition used a 2-stage reduction, front-wheel drivetrain, with an initial reduction offset to the right, and a second reduction offset to the left (Figure 7). This is a low-profile design which allows for ample space for the drivetrain components. It requires more custom parts, such as a left-hand drive hub for the wheel.
15
Figure 7. Front-wheel drive with two reductions on either side of the bike centerline
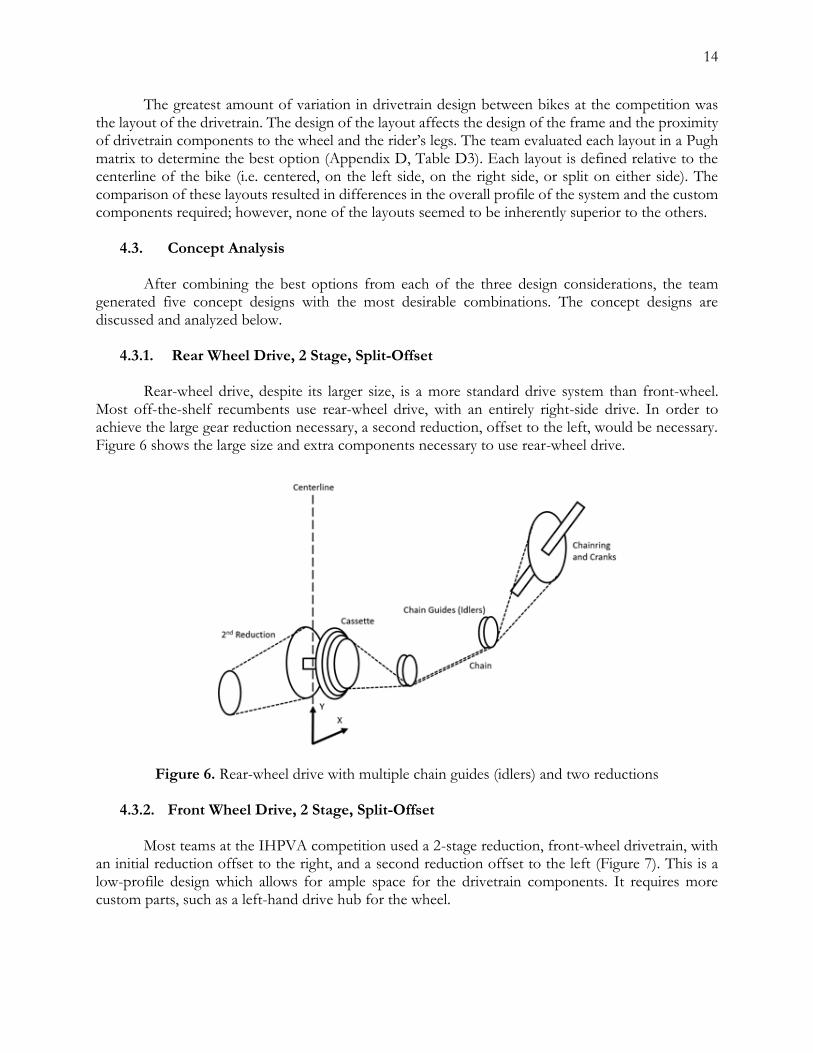
4.3.3. Front Wheel Drive, 2-Stage, Right-Offset
An entirely right-side drivetrain (Figure 8) is not a common design; however, it allows for the possibility of using a standard hub on the drive wheel. The cassette for the first reduction and the large gear for the second reduction could both sit on a standard driver body. Off-the-shelf drivetrains use a right-hand drive hub on the drive wheel, which would be a less expensive component compared to a custom left-hand drive hub. This system sits further to the right than the split-offset design, which could cause interference with the rider’s legs; however, the system would be simpler than the other four concept designs.
Figure 8. Front-wheel drive with two reductions on the right side of the bike centerline
16
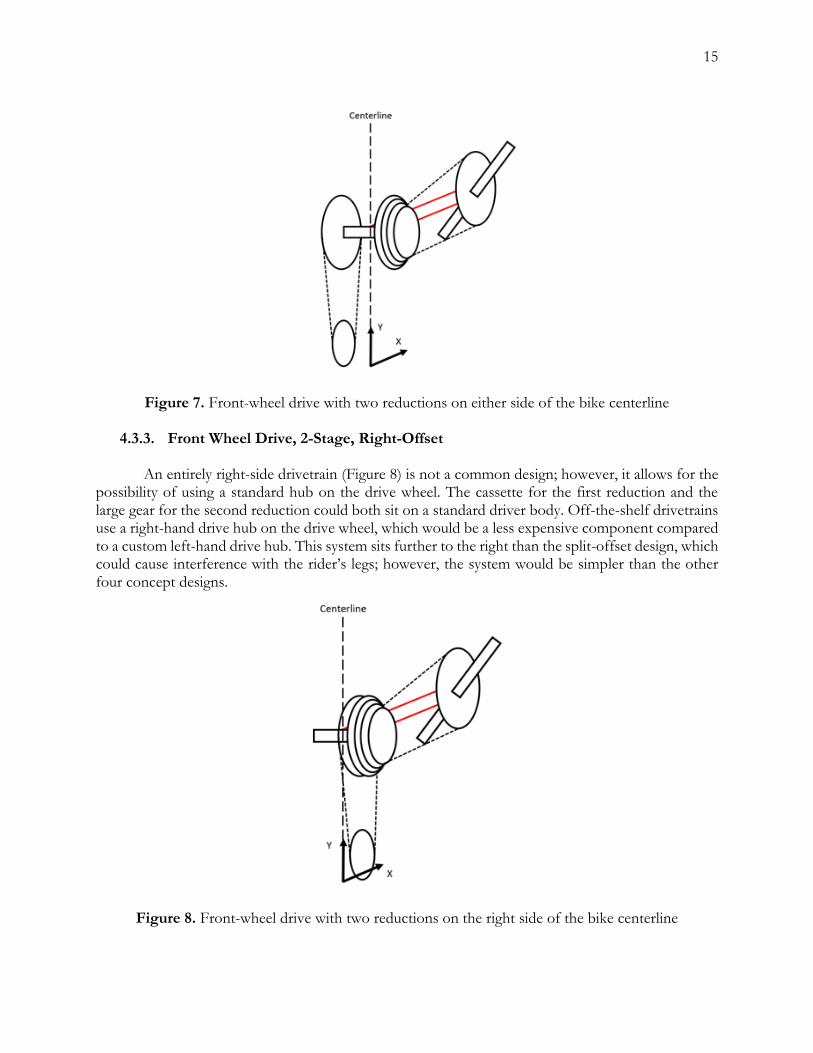
4.3.4. Front-Wheel Drive, 2-Stage, Left-Offset
The left-offset design has a similar overall shape/profile to the right-offset design; however, it presents the possibility of having a straighter chain path when the chain is shifted into the highest gear (Figure 9).
Figure 9. Front-wheel drive with two reductions on the left side of the bike centerline
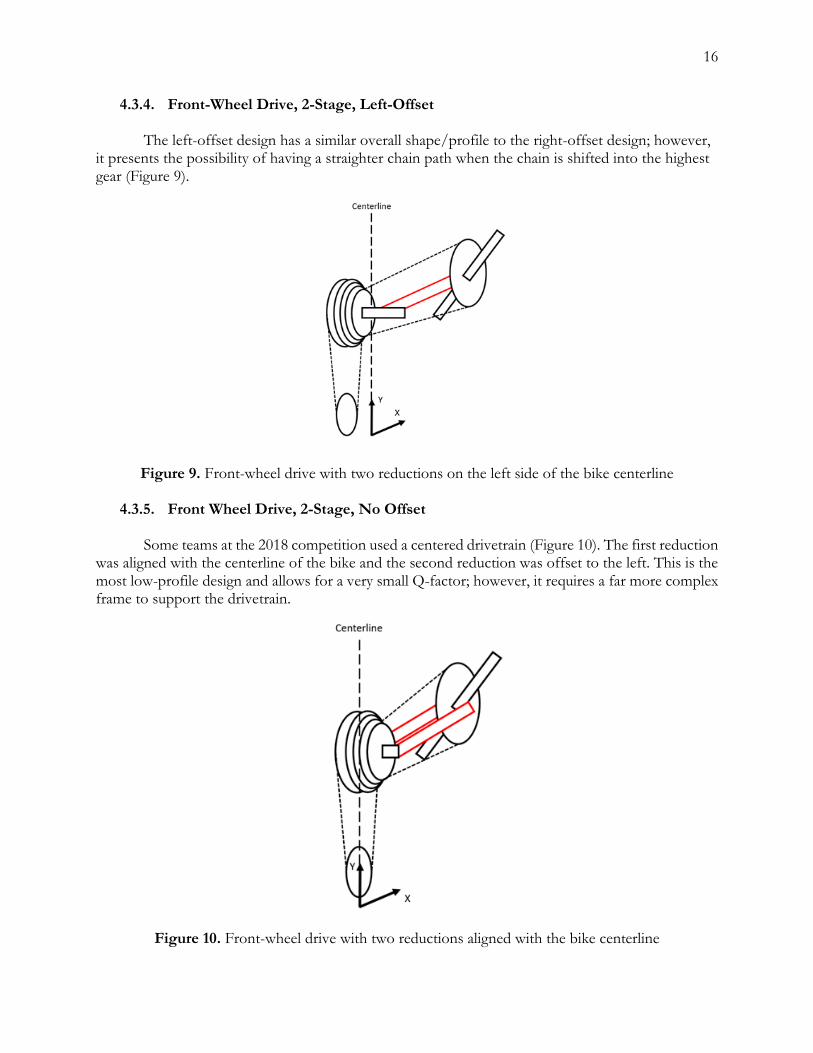
4.3.5. Front Wheel Drive, 2-Stage, No Offset
Some teams at the 2018 competition used a centered drivetrain (Figure 10). The first reduction was aligned with the centerline of the bike and the second reduction was offset to the left. This is the most low-profile design and allows for a very small Q-factor; however, it requires a far more complex frame to support the drivetrain.
Figure 10. Front-wheel drive with two reductions aligned with the bike centerline

17
After generating these five concept designs, the team proceeded to analyze each and choose the best option.
4.4. Concept Selection
With five possible designs, detailed analysis on each required a substantial amount of work that was deemed infeasible given the tight timeline of the project. This section explains how the team used a decision matrix and a concept prototype to narrow down the number of potential designs to the best two, rather than analyzing all five. This section also details the various considerations that the team accounted for which led to the final concept design.
4.4.1. Decision Matrix
The five concept designs were compared using a weighted decision matrix (Appendix E, Table E1). The goal for the decision matrix was to compare each concept using the technical specifications developed from the QFD House of Quality, such as mechanical efficiency, and ergometry. The weighting of each criterion was based on the original QFD weights. These were modified after further research and discussion with the club. The weight of the safety criteria was reduced slightly because the drivetrain does not pose a serious safety threat or act as a risk mitigation device. The maintenance access criteria weight was increased because the most common bike failure at the competition is chain derailment. If this occurs at the start of a race, it is possible to start another attempt if the chain is fixed quickly, which makes ease of maintenance a more important consideration.
The resulting decision matrix shows that the front-wheel drive concepts are more desirable than rear-wheel drive by a significant margin. Between the front-wheel drive concepts, the split-offset and right-offset layouts were the most desirable options, with the same score. With this result, the team effectively narrowed the concept designs down to two options. The team decided to move forward with both the right- and split-offset concept designs until further testing or analysis showed the superiority of one design over the other.
4.4.2. Concept Prototype
One of the team’s major concerns as they moved forward with the right-offset concept design was that it could potentially create spatial issues with the rider or frame. To gain a better understanding of the size and layout of the right-offset layout design, the team made a full-scale concept prototype of the components and built a frame to hold them in the desired locations. Doing so allowed the team to inspect the layout and determine whether the components and chain would function spatially around the rider’s legs without interference. After building and analyzing this concept prototype, the team determined that the right-offset design could be feasible. A picture of the concept prototype can be seen in Figure 11 below.
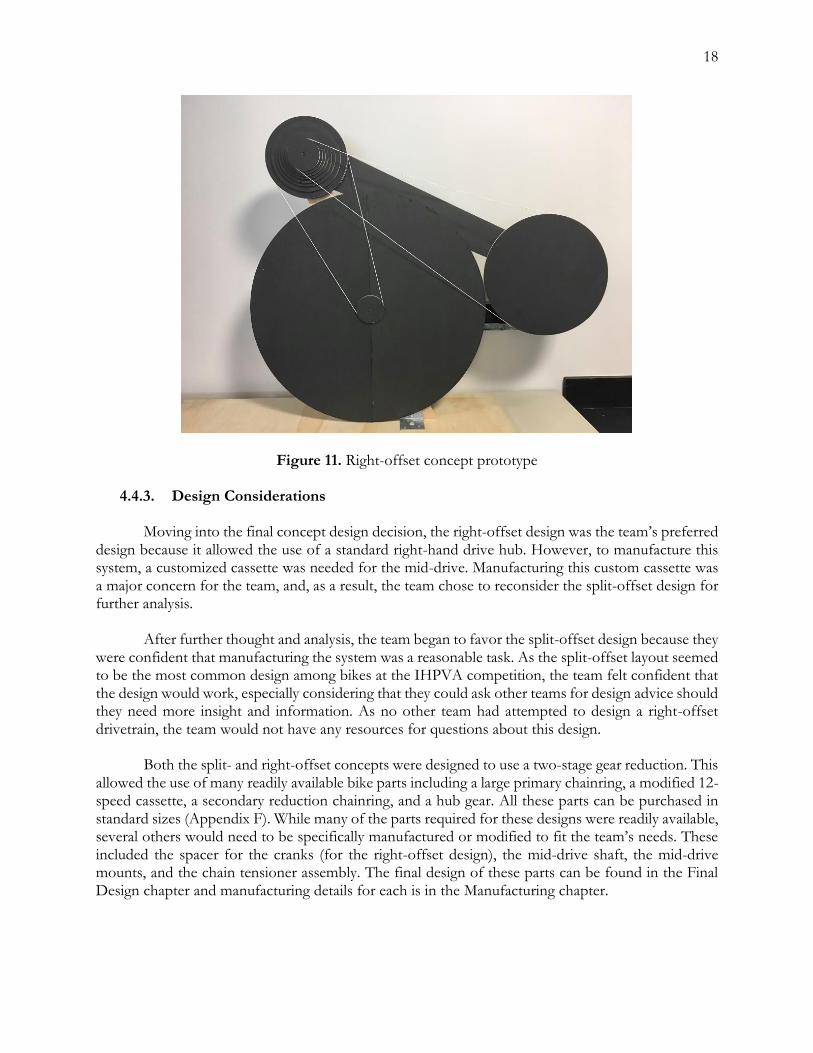
18
Figure 11. Right-offset concept prototype
4.4.3. Design Considerations
Moving into the final concept design decision, the right-offset design was the team’s preferred design because it allowed the use of a standard right-hand drive hub. However, to manufacture this system, a customized cassette was needed for the mid-drive. Manufacturing this custom cassette was a major concern for the team, and, as a result, the team chose to reconsider the split-offset design for further analysis.
After further thought and analysis, the team began to favor the split-offset design because they were confident that manufacturing the system was a reasonable task. As the split-offset layout seemed to be the most common design among bikes at the IHPVA competition, the team felt confident that the design would work, especially considering that they could ask other teams for design advice should they need more insight and information. As no other team had attempted to design a right-offset drivetrain, the team would not have any resources for questions about this design.
Both the split- and right-offset concepts were designed to use a two-stage gear reduction. This allowed the use of many readily available bike parts including a large primary chainring, a modified 12-speed cassette, a secondary reduction chainring, and a hub gear. All these parts can be purchased in standard sizes (Appendix F). While many of the parts required for these designs were readily available, several others would need to be specifically manufactured or modified to fit the team’s needs. These included the spacer for the cranks (for the right-offset design), the mid-drive shaft, the mid-drive mounts, and the chain tensioner assembly. The final design of these parts can be found in the Final Design chapter and manufacturing details for each is in the Manufacturing chapter.
19
4.4.4. Preliminary Analysis Gear Selection
To achieve a top speed of 65 miles per hour, the bike needed a final gear ratio of approximately 10. For the rider to stay upright while beginning to pedal the bike, the starting gear ratio needed to be as small as possible. This necessity of a large range of gear ratios required the team to perform gear reduction calculations to determine possible designs for cassette/chainring pairs. As all gears needed to fit onto both the split- and right-offset designs, each layout design had its own corresponding gear design.
Gear Ratio Design:
To begin the gear ratio analysis, the team needed a general idea of the rider’s preferred cadence. From the initial rider testing data, the team found that the rider preferred a range of cadences between 90 and 110 rpm. As this data was taken using an upright bicycle, the team decided to adjust the data to simulate riding in a recumbent position. As cadences are generally lower on recumbent bikes, the team used an adjusted range of 80 to 100 rpm and chose 90 rpm as the target cadence.
Using this target cadence, the team determined the required gear ratios needed to achieve the necessary top speed. To perform this calculation quickly and allow for iterations with different speeds or cadences, the team constructed a MatLab file that would accept the desired speed and cadence and output the necessary gear ratio. This MatLab script and an example output can be found in Appendix F. From this, the team confirmed that a final drive ratio of 10:1 would be necessary to achieve a top speed of 65 mph with a cadence of 90 rpm.
Once the team determined the top-speed gear ratio, they needed attempt to design the lowest
starting gear ratio possible. The main difficulty that impeded the design of a low starting ratio was total the number of gears that would be required. Designing for a larger number of gears would increase the angle of the chain, which would subsequently increase the risk of chain derailment. Using fewer gears with large differences in diameter would require the rider to pedal through very large changes in gear ratios when shifting. Ideally, the rider would be able to keep a comfortable cadence while shifting and having large changes in gear ratios would make it very difficult for the rider to transition between gears. With this in mind, the team attempted to minimize the starting gear ratio while maximizing the number of gears that would fit on the drivetrain without causing a steep chain angle.
The next step was to begin searching for the components required to create the two-stage gear reduction. The team researched commonly available sizes for each component that could be used in the drivetrain. With this information, they began to iterate through different combinations of chainring sizes and cassettes. Eventually, iteration proved that a relatively large starting gear ratio would be required to achieve the desired top speed. The team finally generated two different gear ratio designs. The first design utilized most of the smaller gears on the cassette, allowing the use of a larger hub gear on the wheel, while the second used a smaller hub gear in order to use the bigger cassette gears.
Gear Design 1:
The first-reduction design consisted of an 80-tooth chainring connected to a modified 12-speed cassette. The cassette would be modified to use all the gears except for the smallest 11-tooth gear, so that it ranged from 13-50 teeth. This cassette would be mounted on the same mid-drive shaft
20
as the driving gear for the second reduction, which would have 50 teeth. Finally, this second-stage reduction would be connected to the hub gear which would have 26-teeth. The gear ratios for Design 1 can be seen in Table H1 in Appendix H.
Gear Design 2:
The second-reduction design consisted of an 80 tooth chainring connected to a modified 12-speed cassette with only the 8 largest gears in use. Like Design 1, the cassette would be mounted on the same shaft as a 50-tooth driving gear that drives the wheel with an 18-tooth hub gear. The ratios for Design 2 can be found in Table H2 in Appendix H. As this design used three fewer gears than Design 1, it was a more favorable design to be used with the right-offset design due to the extra room for the second stage driving gear.
After choosing gear designs, the team decided to move forward with the right-offset design with gear Design 2 and keep the split-offset design with gear Design 1 as a back-up.
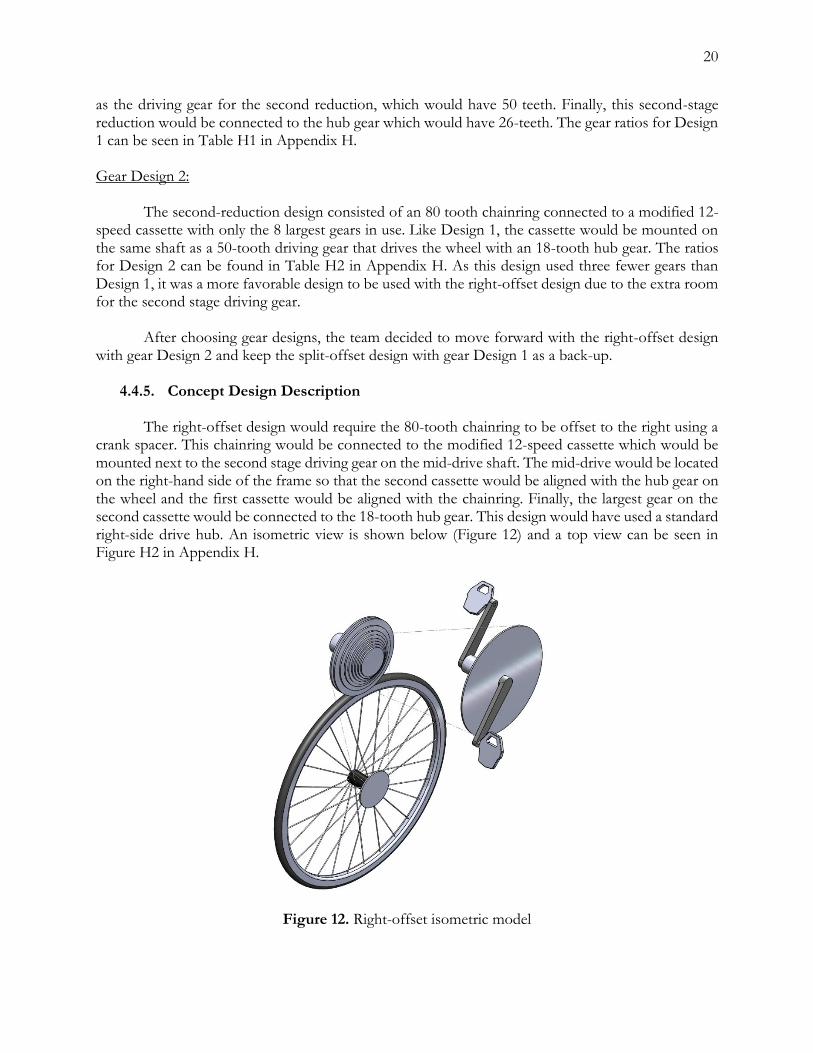
4.4.5. Concept Design Description
The right-offset design would require the 80-tooth chainring to be offset to the right using a crank spacer. This chainring would be connected to the modified 12-speed cassette which would be mounted next to the second stage driving gear on the mid-drive shaft. The mid-drive would be located on the right-hand side of the frame so that the second cassette would be aligned with the hub gear on the wheel and the first cassette would be aligned with the chainring. Finally, the largest gear on the second cassette would be connected to the 18-tooth hub gear. This design would have used a standard right-side drive hub. An isometric view is shown below (Figure 12) and a top view can be seen in Figure H2 in Appendix H.
Figure 12. Right-offset isometric model

21
The split-offset design required the 80-tooth chainring to be mounted slightly to the right of the centerline of the bike. The chainring would be connected to the modified 12-speed cassette which would be mounted next to the 50-tooth second stage driving gear. This gear would be offset slightly to the left of the centerline of the bike and would be connected to a 26-tooth left-side hub gear on the wheel. This design required a custom left-side drive hub. An isometric is shown below (Figure 13) and a top view can be seen in Figure I1 in Appendix I.
Figure 13. Split-offset isometric model
After discussing these two designs with several professional mechanical engineers, the team
decided to choose the split-offset layout for their final design. This decision was made at the
recommendation of all the engineers that the team consulted. The primary concern with the right-
offset design was that the resulting loads on the mid-drive mounting would be far too large and
unbalanced for a reliable and structural system.
4.5. Discussion of the current risks, challenges, and unknowns
Throughout the design process, the team identified risks and hazards, as seen in the hazards checklist in Appendix J, that needed to be considered as they moved forward with their design. Both right- and split-offset designs used rotating sprockets near the front tire of the bike as well as the rider’s legs. This posed a potential hazard for the rider as he could be harmed by direct leg contact with the rotating gears. In addition, catastrophic failure of the tire due to excessive rubbing on the rotating gears could easily cause him to lose control of the bike, resulting in a crash. To mitigate the risk of the sprockets contacting the wheel, the club would limit the steering to ensure that the tire cannot rotate far enough to contact the gears. The rider is kept safe from the spinning wheel and gears by guards that the club will install on the system as well as personal protective equipment.
22
Another potential hazard is caused by the high chain forces generated while the rider is pedaling. These forces introduce the risk of chain failure. In order to decrease the likelihood of this failure, the team used high-end bike chains that have been tested by professional companies to withstand loads that are greater than they expect to encounter. In addition, proper maintenance and inspection before use will minimize the risk of chain failure due to high chain loads during bike testing or competition.
To minimize the risk of rider injury as a result of exertion in an awkward position, the team designed the drivetrain to fit the rider’s body measurements and ergonomic preferences.
After talking to George Leone, the team realized that the drivetrain would be very loud during use when enclosed inside the fairing of the final bike. To prevent potentially damage to the rider’s hearing, the team attempted to optimize the angle of the chain on the gears. This would lower the friction in the chain links and reduce noise during use. In addition, the team determined that the amount of time the rider would be exposed to this noise would be short enough that there would be no significant risk of hearing loss.
The main design challenge was to fit the drivetrain into as small of a space as possible, without interfering with the frame or the rider’s range of motion. Once the team selected a design, they needed to ensure that there was no interference with the rider or the other subsystems of the vehicle. To do this, the team took physical measurements of the rider to confirm their CAD model and discussed the spatial specifications with the club and the frame team.
23
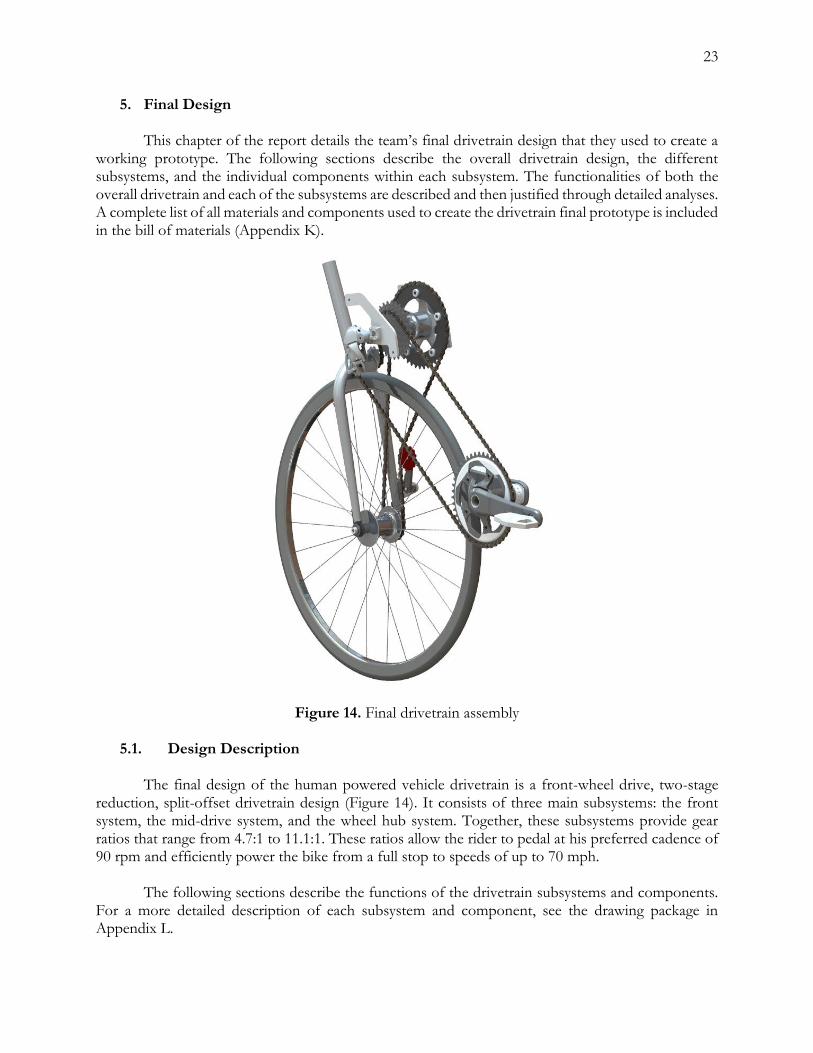
5. Final Design This chapter of the report details the team’s final drivetrain design that they used to create a working prototype. The following sections describe the overall drivetrain design, the different subsystems, and the individual components within each subsystem. The functionalities of both the overall drivetrain and each of the subsystems are described and then justified through detailed analyses. A complete list of all materials and components used to create the drivetrain final prototype is included in the bill of materials (Appendix K).
Figure 14. Final drivetrain assembly
5.1. Design Description The final design of the human powered vehicle drivetrain is a front-wheel drive, two-stage reduction, split-offset drivetrain design (Figure 14). It consists of three main subsystems: the front system, the mid-drive system, and the wheel hub system. Together, these subsystems provide gear ratios that range from 4.7:1 to 11.1:1. These ratios allow the rider to pedal at his preferred cadence of 90 rpm and efficiently power the bike from a full stop to speeds of up to 70 mph.
The following sections describe the functions of the drivetrain subsystems and components. For a more detailed description of each subsystem and component, see the drawing package in Appendix L.

24
5.1.1. Front System
The front system consists of the pedals, cranks, chainring, bottom bracket, and bottom bracket shell (Figure 15). To ensure that power is transferred efficiently from the rider’s shoes to the cranks, SPD-SL clipless pedals are used instead of common platform pedals. These allow the rider to snap his shoe cleats into the pedals, ensuring a stiff shoe-to-pedal connection. Using these pedals will ensure that no power is lost due to shoe movement relative to the pedal.
Figure 15. Front system assembly
The front system uses a SRAM Force 1 carbon crankset with crank arm lengths of 170mm. This length is slightly shorter than the rider’s usual length of 175mm; however, recumbent bikes generally have shorter cranks to accommodate the rider’s stretched-out position. The carbon cranks are stiffer and lighter than aluminum cranks, which decreases the weight of the subsystem while maintaining crank stiffness when under load.
The bottom bracket shell has standard road bike dimensions (1.500 in OD, 68.5 mm width, BSA thread). It is made of 4130 chromoly steel, which allows for easy welding to the frame. The bottom bracket shell is paired with a SRAM GXP bottom bracket, which allows the crankshaft to rotate relative to the shell.
The final front system component is the 54 tooth chainring, which drives the first-stage gear reduction.

25
5.1.2. Mid-drive system The mid-drive subsystem is responsible for the large gear reduction that allows the rider to pedal the bike at high speeds (Figure 16 and 17).
Figure 16. Mid-drive system assembly
Figure 17. Mid-drive system exploded assembly The core of this system is a Phil Wood 148mm rear hub. The cassette used for the first reduction sits on the rider’s right side of the hub, and the driving gear for the second reduction sits on the left side. The hub is made of 6061-T6 aluminum for minimum weight and high stiffness.
The cassette mounts to a standard splined Shimano driver body, so no modifications were necessary on the right side of the hub. The driver gear for the second reduction required an adapter (Figure 18) to be mounted to a six-bolt pattern on the left side of the hub. To align this mid-drive gear with the hub gear on the wheel, spacers were placed between the mid-drive adapter and the mid-drive gear.

26
Figure 18. Modified Phil Wood mid-drive hub and adapter
The mid-drive gear adapter is machined from 6061-T6 aluminum. It is designed to convert the 6-bolt pattern’s 40mm bolt circle diameter (BCD) to any standard 130 BCD, 5 bolt chainring.
Figure 19. Modified 11 speed cassette with 8 gears ranging from 12-28 teeth The drivetrain required a slightly customized cassette on the first reduction (Figure 19). To allow the rider to start from a full stop and pedal efficiently at 65+ mph, a cassette gear range of 12-28 teeth is used. Eight gears on the cassette achieve this range; however, they were taken from an 11-speed cassette. To accommodate the extra space on the end of the cassette, custom spacers were used to locate the cassette on the driver body so that it sits in the desired location relative to the chainring (see Figure 27 and detailed discussion in section 5.3.5).
27
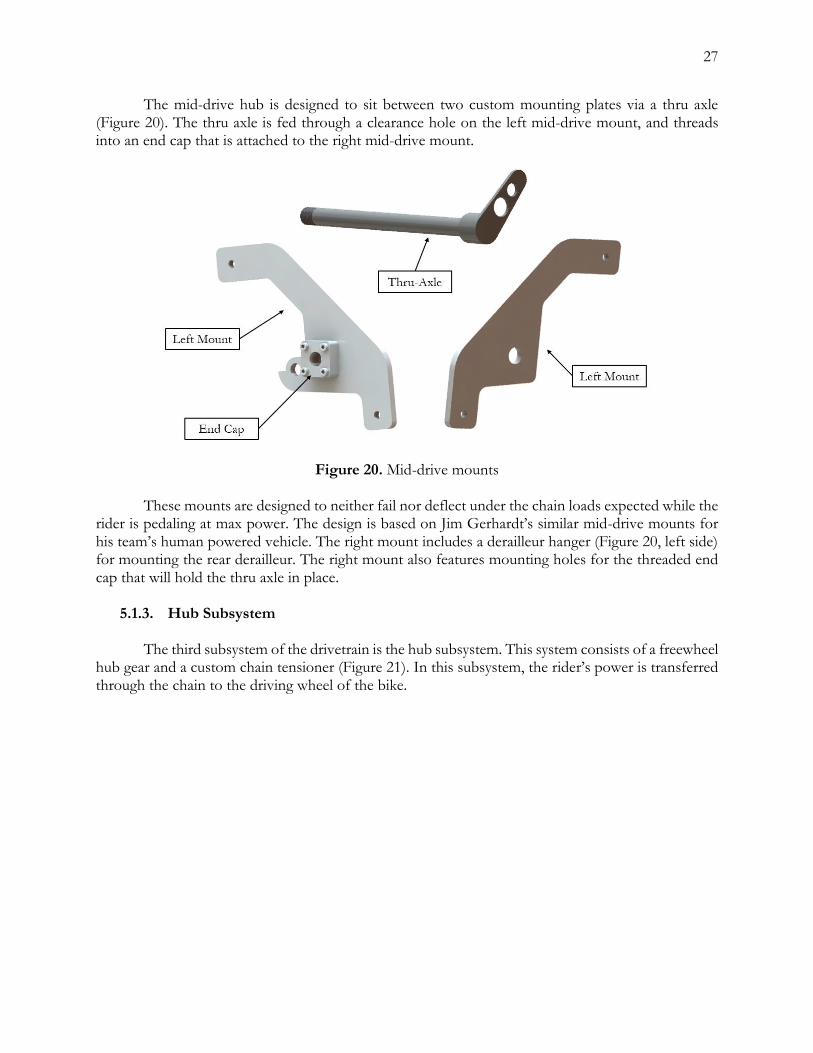
The mid-drive hub is designed to sit between two custom mounting plates via a thru axle (Figure 20). The thru axle is fed through a clearance hole on the left mid-drive mount, and threads into an end cap that is attached to the right mid-drive mount.
Figure 20. Mid-drive mounts
These mounts are designed to neither fail nor deflect under the chain loads expected while the rider is pedaling at max power. The design is based on Jim Gerhardt’s similar mid-drive mounts for his team’s human powered vehicle. The right mount includes a derailleur hanger (Figure 20, left side) for mounting the rear derailleur. The right mount also features mounting holes for the threaded end cap that will hold the thru axle in place.
5.1.3. Hub Subsystem The third subsystem of the drivetrain is the hub subsystem. This system consists of a freewheel hub gear and a custom chain tensioner (Figure 21). In this subsystem, the rider’s power is transferred through the chain to the driving wheel of the bike.

28
Figure 21. Hub subsystem
The second gear reduction required a left-hand 17-tooth gear on the wheel hub. Standard bikes use a right-hand freewheel, which allows the wheel to rotate freely in the clockwise direction. However, the two-stage reduction drivetrain design required that the wheel be driven on its left side. Therefore, a custom freewheel was used to allow the wheel to spin freely in the counterclockwise direction.
Standard bike drivetrains often drive a rear wheel which is only free to spin on one axis. As this drivetrain design drives the bike’s front wheel, the wheel rotates about the steering axis, which causes the chain path to warp whenever the wheel is turned from side to side. This requires the use of a custom chain tensioner in order to guide and tension the chain, allowing it to extend and contract during turning. This custom tensioner is shown in Figure 22.
Figure 22. Custom chain tensioner
29
The tensioner consists of a main body, which spaces the tensioner off the bike’s fork blade,
and a swing arm, which is pulled towards the main body via a spring (tensioning the chain). The chain travels around an idler gear, mounted to the end of the swing arm.
During freedom of motion testing, the team realized that the chain tensioner interfered with the rider’s leg. To correct for this, the tensioner’s mounting bosses were moved from the left side of the fork to the front and a simple adapter plate was retroactively added. This gave the rider full clearance with the tensioner. This component is discussed in more detail in the manufacturing section and a detailed part drawing can be seen in Appendix L.
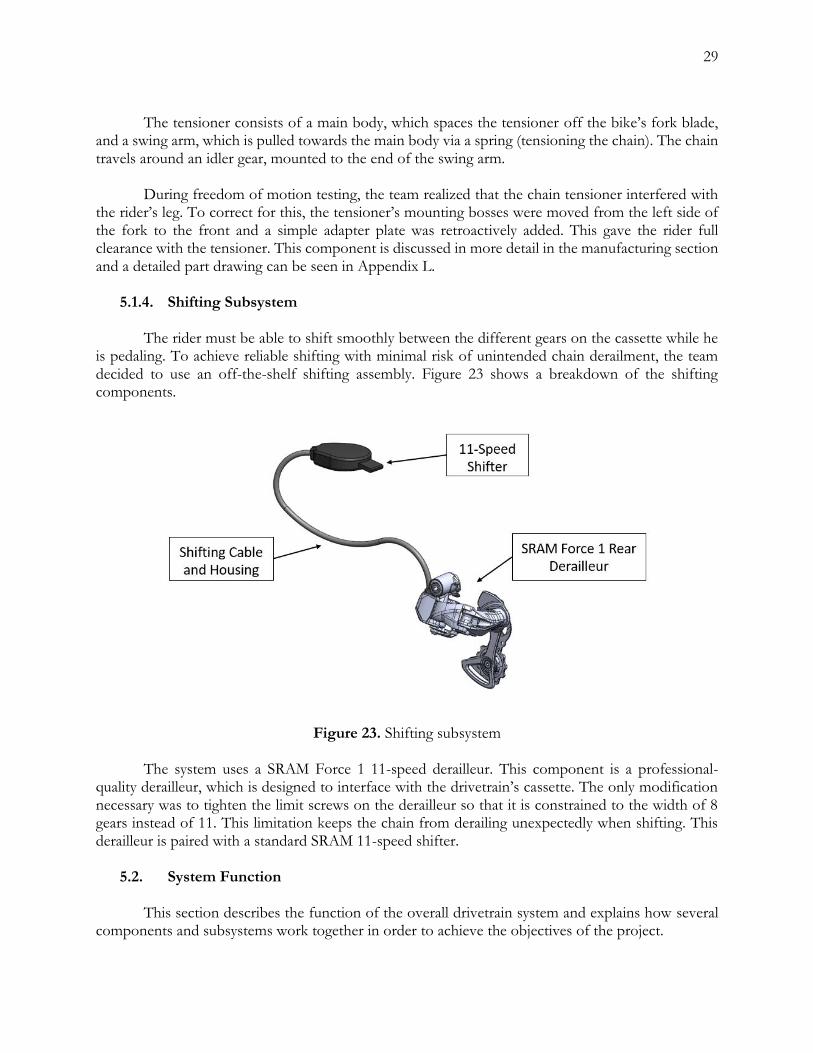
5.1.4. Shifting Subsystem The rider must be able to shift smoothly between the different gears on the cassette while he is pedaling. To achieve reliable shifting with minimal risk of unintended chain derailment, the team decided to use an off-the-shelf shifting assembly. Figure 23 shows a breakdown of the shifting components.
Figure 23. Shifting subsystem The system uses a SRAM Force 1 11-speed derailleur. This component is a professional- quality derailleur, which is designed to interface with the drivetrain’s cassette. The only modification necessary was to tighten the limit screws on the derailleur so that it is constrained to the width of 8 gears instead of 11. This limitation keeps the chain from derailing unexpectedly when shifting. This derailleur is paired with a standard SRAM 11-speed shifter.
5.2. System Function
This section describes the function of the overall drivetrain system and explains how several components and subsystems work together in order to achieve the objectives of the project.
30
In addition to delivering power from the rider’s feet to the drive wheel, the main functionality of the drivetrain is to create a drive ratio which allows for efficient pedaling at speeds ranging from 0 to 65 mph. The original drivetrain design used large gears to achieve this ratio; however, due to spatial concerns with the rider and the front fork, the team was forced to downsize the cassette gears and chainring, as well as choose a different derailleur.
The first stage of the drivetrain’s two-stage reduction uses a gear layout that is nearly identical to that of a standard road bike. A 54-tooth chainring transfers power from the cranks to a chain, which drives the cassette on the mid-drive hub.
The second-stage reduction is used to scale the first reduction’s drive ratio by a factor of 2.5. The cassette, coupled with the second reduction, results in a drive ratio range of 4.7 to 11.1. With practice, the rider would be able to start the bike at a 4.7 drive ratio, and then achieve speeds of approximately 70 mph with a comfortable pedaling cadence of 90 rpm, using the 11.1 drive ratio.
5.3. Detailed Analysis The performance of the drivetrain is critical to the success of the bike at competition. To confirm that the design would be comfortable, reliable, and efficient, analyses were conducted in five areas. The team verified the cassette range and gear sizing through gear reduction analysis. Load analysis was conducted on the chain, mounts, adapters, and cranks to confirm the structural integrity of each. Analysis was also done to determine the magnitude of torque steer generated by the drivetrain. Finally, chain paths were analyzed to optimize the location of the mid-drive.
5.3.1. Gear Reduction Analysis To ensure that the decrease in gear size did not affect the overall performance of the drivetrain, analysis was done to calculate the total gear reduction ratios with the changes from the preliminary design. These calculations are summarized in Table H3 of Appendix H. These calculations use the rider’s preferred cadence along with the desired top speed of the bike to iteratively determine the gear ratios in both reductions. To calculate gear ratios at each stage, the number of teeth on the driving gear is divided by the number of teeth on the driven gear. This method of finding gear ratios is commonly done in industry. See Appendix G for details on this calculation.
The calculations showed that the new gearing had only a 7% difference in overall drive ratios from the preliminary design. The team felt confident that the new gearing would still allow the rider to achieve speeds of 65+ mph.
5.3.2. Chain Load Analysis To guarantee that no components would yield or significantly deflect while under load, the team calculated maximum expected stress and strain values for each part. This was accomplished by calculating the force transferred through the chain at worst-case scenario pedal loads. This load was approximated by treating the rider’s max experimental pedal force as a high impulse impact (Appendix A). This simulates the rider pushing as hard as he can immediately upon starting. The hand calculations and MATLAB code used for this analysis as well as the table of results can be found in Appendix M.

31
To calculate the resulting forces on each component, the team started with a static load analysis on each of the major subsystems. Free body diagrams of the front, mid-drive, and hub subsystems can be found in Figures M1-3 in Appendix M. Starting at the front subsystem and applying the maximum pedal force, the team found resulting the chain load and the force on the bottom bracket. Loads on the mid-drive hub and mounts were found by applying the first chain load to the hub. Assuming efficient power transfer through the mid-drive, chain load in the second chain was calculated, along with the reaction force on the freewheel. As the load path through the second chain is not in line with the steering axis on the front wheel, a resulting moment acts on the wheel. This moment is commonly called torque steer and is addressed in Section 5.3.4 below. The force and moment values found from this analysis were used to perform structural analysis on the custom components on the drivetrain. This analysis is described in the next section.
5.3.3. Structural Analysis To verify the integrity of all custom drivetrain components, the team performed structural analysis on the two components which experience the greatest loads: the right mid-drive mount and the mid-adapter. Despite basing mount design on Jim Gerhart’s design, the team found it necessary to verify that the highly customized shape could withstand the expected chain loads with negligible deflection. The load distribution was calculated using 3D statics (Appendix N), and the largest load was found to be on the right mount. Finite Element Analysis on the right mount showed a maximum deflection of 0.04mm and a minimum safety factor of 5.2. Figure 24 shows the deflection results.
Figure 24. Deflection distribution on right mid-drive mount

32
Despite the team’s lack of experience with Finite Element Analysis (FEA), the estimated stress/strain results exceeded the team’s requirements by such a large margin that the mount design was accepted as structural.
The mid-drive adapter experiences high torque during pedaling, and, given its small width, the
team decided that structural analysis was necessary. Results of FEA using maximum expected loads showed an acceptable minimum safety factor of just over 3 (Figure 25).
Figure 25. Stress distribution on mid-drive adapter
5.3.4. Torque Steer Analysis On the second-stage gear reduction, power is transferred from the mid-drive gear to the front wheel hub. The force, transferred through chain, pulls the wheel hub in a direction that is not parallel to the steering axis of the wheel. The result is a moment that tends to turn the wheel clockwise when the rider applies power. Most bikes at the IHPVA competition have managed to mitigate this issue by aligning their chain path with the steering axis; however, due to spatial restrictions caused by the reverse offset fork, designing a parallel chain path for the drivetrain was impossible (Figure 26).
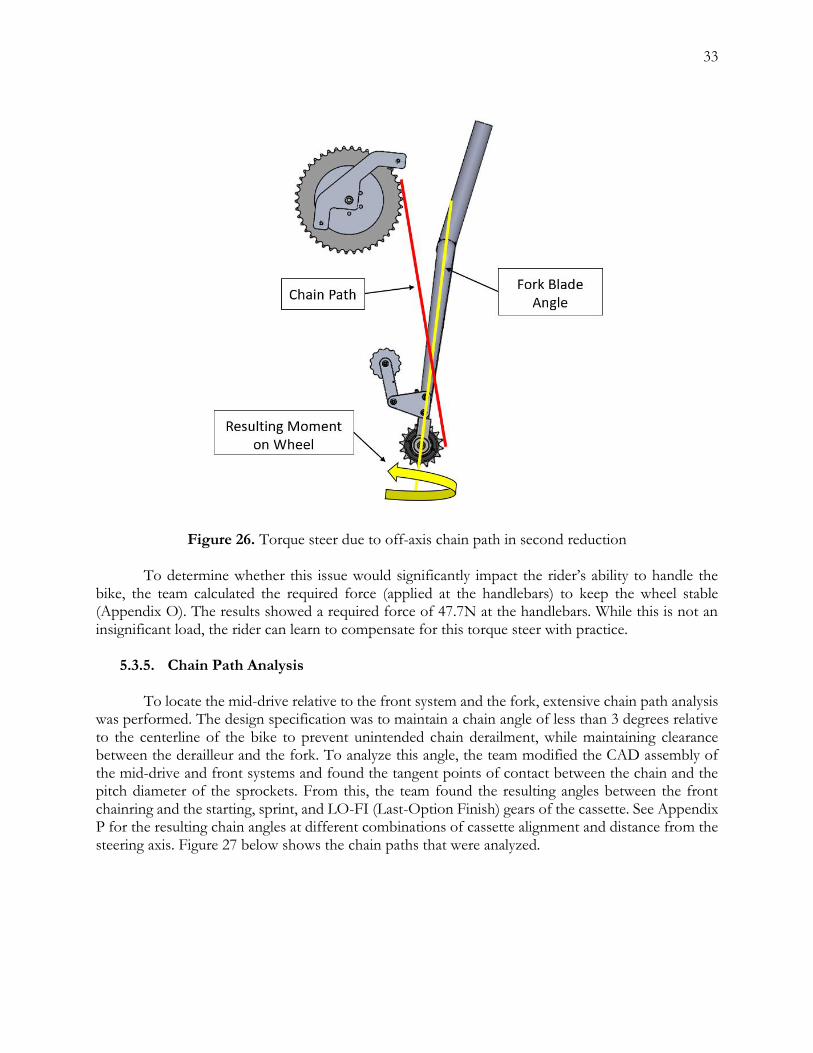
33
Figure 26. Torque steer due to off-axis chain path in second reduction To determine whether this issue would significantly impact the rider’s ability to handle the bike, the team calculated the required force (applied at the handlebars) to keep the wheel stable (Appendix O). The results showed a required force of 47.7N at the handlebars. While this is not an insignificant load, the rider can learn to compensate for this torque steer with practice.
5.3.5. Chain Path Analysis To locate the mid-drive relative to the front system and the fork, extensive chain path analysis was performed. The design specification was to maintain a chain angle of less than 3 degrees relative to the centerline of the bike to prevent unintended chain derailment, while maintaining clearance between the derailleur and the fork. To analyze this angle, the team modified the CAD assembly of the mid-drive and front systems and found the tangent points of contact between the chain and the pitch diameter of the sprockets. From this, the team found the resulting angles between the front chainring and the starting, sprint, and LO-FI (Last-Option Finish) gears of the cassette. See Appendix P for the resulting chain angles at different combinations of cassette alignment and distance from the steering axis. Figure 27 below shows the chain paths that were analyzed.
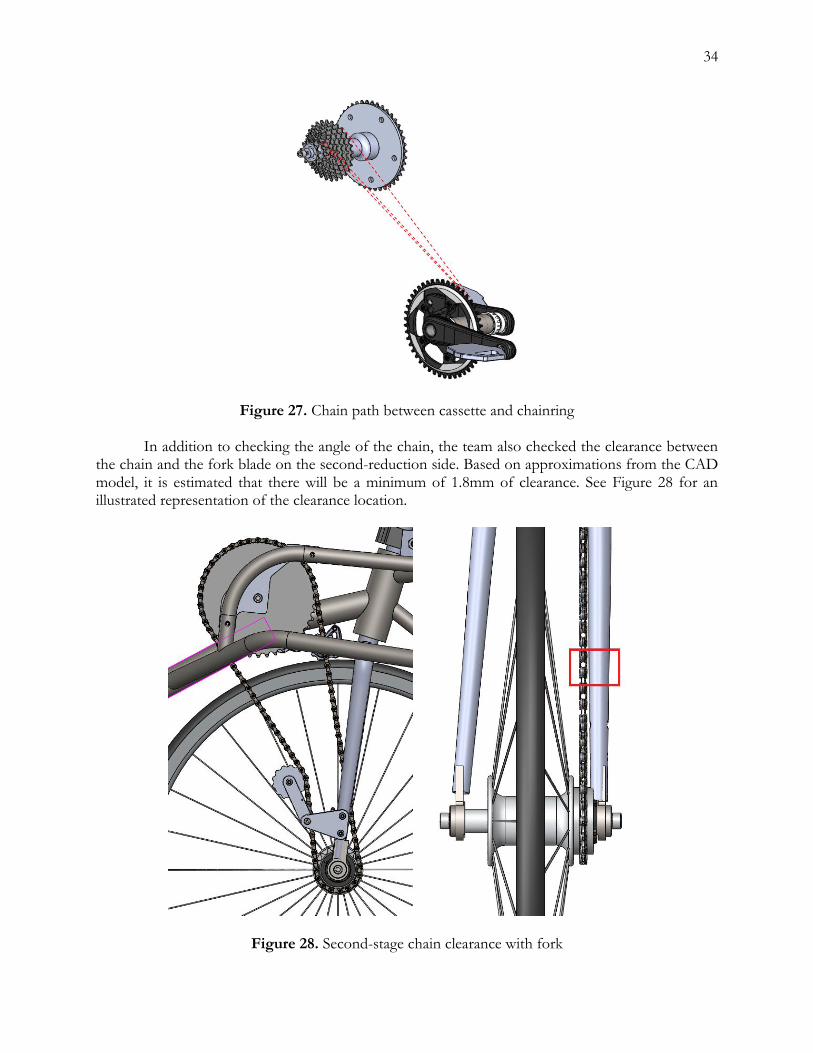
34
Figure 27. Chain path between cassette and chainring In addition to checking the angle of the chain, the team also checked the clearance between the chain and the fork blade on the second-reduction side. Based on approximations from the CAD model, it is estimated that there will be a minimum of 1.8mm of clearance. See Figure 28 for an illustrated representation of the clearance location.
Figure 28. Second-stage chain clearance with fork
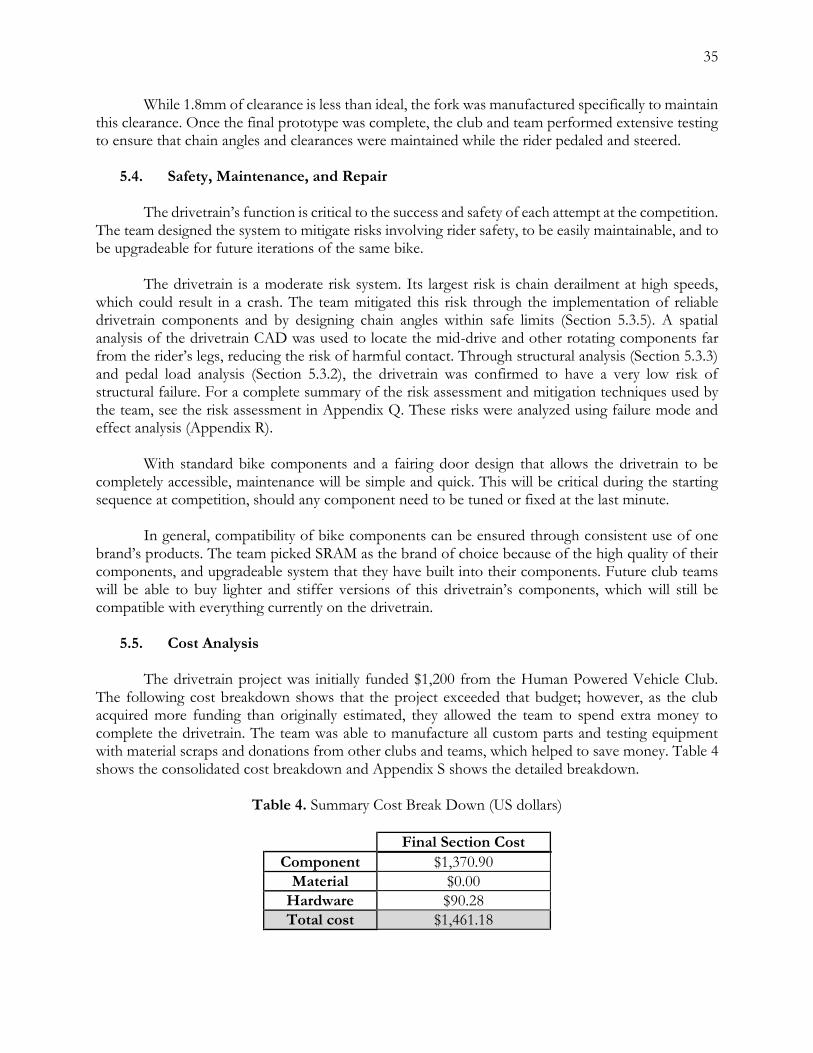
35
While 1.8mm of clearance is less than ideal, the fork was manufactured specifically to maintain this clearance. Once the final prototype was complete, the club and team performed extensive testing to ensure that chain angles and clearances were maintained while the rider pedaled and steered.
5.4. Safety, Maintenance, and Repair
The drivetrain’s function is critical to the success and safety of each attempt at the competition. The team designed the system to mitigate risks involving rider safety, to be easily maintainable, and to be upgradeable for future iterations of the same bike.
The drivetrain is a moderate risk system. Its largest risk is chain derailment at high speeds, which could result in a crash. The team mitigated this risk through the implementation of reliable drivetrain components and by designing chain angles within safe limits (Section 5.3.5). A spatial analysis of the drivetrain CAD was used to locate the mid-drive and other rotating components far from the rider’s legs, reducing the risk of harmful contact. Through structural analysis (Section 5.3.3) and pedal load analysis (Section 5.3.2), the drivetrain was confirmed to have a very low risk of structural failure. For a complete summary of the risk assessment and mitigation techniques used by the team, see the risk assessment in Appendix Q. These risks were analyzed using failure mode and effect analysis (Appendix R).
With standard bike components and a fairing door design that allows the drivetrain to be completely accessible, maintenance will be simple and quick. This will be critical during the starting sequence at competition, should any component need to be tuned or fixed at the last minute.
In general, compatibility of bike components can be ensured through consistent use of one brand’s products. The team picked SRAM as the brand of choice because of the high quality of their components, and upgradeable system that they have built into their components. Future club teams will be able to buy lighter and stiffer versions of this drivetrain’s components, which will still be compatible with everything currently on the drivetrain.
5.5. Cost Analysis The drivetrain project was initially funded $1,200 from the Human Powered Vehicle Club. The following cost breakdown shows that the project exceeded that budget; however, as the club acquired more funding than originally estimated, they allowed the team to spend extra money to complete the drivetrain. The team was able to manufacture all custom parts and testing equipment with material scraps and donations from other clubs and teams, which helped to save money. Table 4 shows the consolidated cost breakdown and Appendix S shows the detailed breakdown.
Table 4. Summary Cost Break Down (US dollars)
Final Section Cost
Component $1,370.90
Material $0.00
Hardware $90.28
Total cost $1,461.18
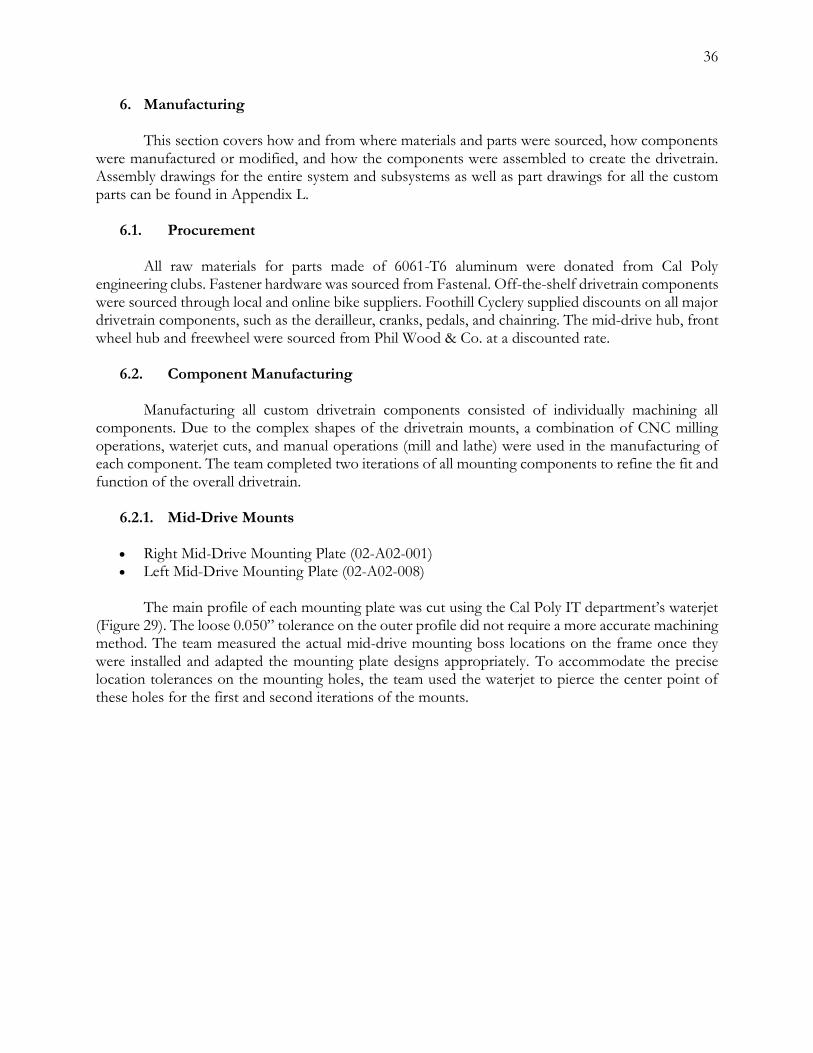
36
6. Manufacturing This section covers how and from where materials and parts were sourced, how components were manufactured or modified, and how the components were assembled to create the drivetrain. Assembly drawings for the entire system and subsystems as well as part drawings for all the custom parts can be found in Appendix L.
6.1. Procurement
All raw materials for parts made of 6061-T6 aluminum were donated from Cal Poly engineering clubs. Fastener hardware was sourced from Fastenal. Off-the-shelf drivetrain components were sourced through local and online bike suppliers. Foothill Cyclery supplied discounts on all major drivetrain components, such as the derailleur, cranks, pedals, and chainring. The mid-drive hub, front wheel hub and freewheel were sourced from Phil Wood & Co. at a discounted rate.
6.2. Component Manufacturing Manufacturing all custom drivetrain components consisted of individually machining all components. Due to the complex shapes of the drivetrain mounts, a combination of CNC milling operations, waterjet cuts, and manual operations (mill and lathe) were used in the manufacturing of each component. The team completed two iterations of all mounting components to refine the fit and function of the overall drivetrain.
6.2.1. Mid-Drive Mounts
Right Mid-Drive Mounting Plate (02-A02-001) Left Mid-Drive Mounting Plate (02-A02-008)
The main profile of each mounting plate was cut using the Cal Poly IT department’s waterjet (Figure 29). The loose 0.050” tolerance on the outer profile did not require a more accurate machining method. The team measured the actual mid-drive mounting boss locations on the frame once they were installed and adapted the mounting plate designs appropriately. To accommodate the precise location tolerances on the mounting holes, the team used the waterjet to pierce the center point of these holes for the first and second iterations of the mounts.
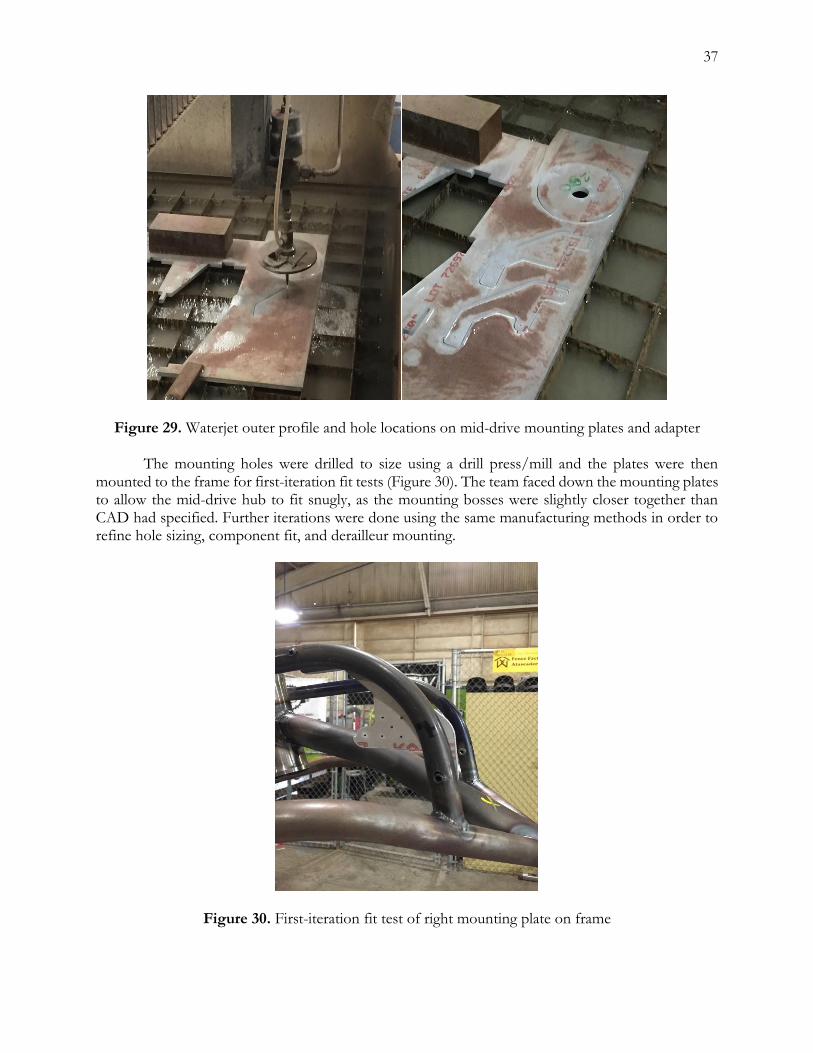
37
Figure 29. Waterjet outer profile and hole locations on mid-drive mounting plates and adapter The mounting holes were drilled to size using a drill press/mill and the plates were then mounted to the frame for first-iteration fit tests (Figure 30). The team faced down the mounting plates to allow the mid-drive hub to fit snugly, as the mounting bosses were slightly closer together than CAD had specified. Further iterations were done using the same manufacturing methods in order to refine hole sizing, component fit, and derailleur mounting.
Figure 30. First-iteration fit test of right mounting plate on frame
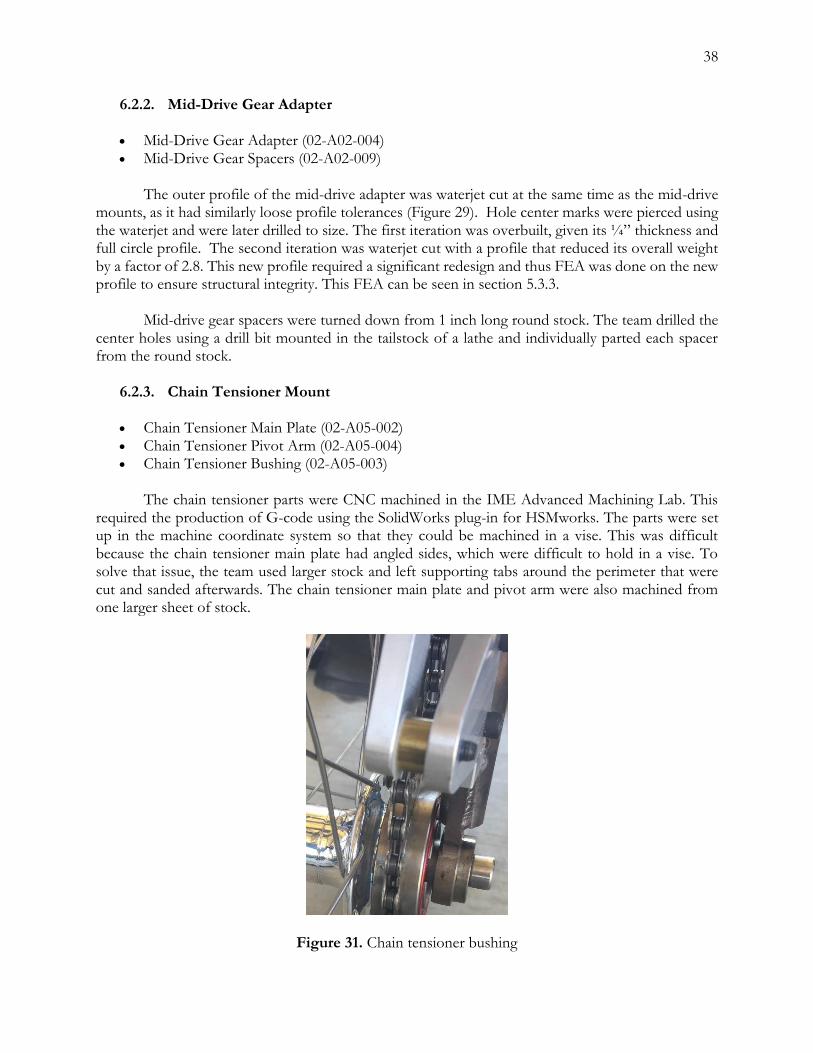
38
6.2.2. Mid-Drive Gear Adapter
Mid-Drive Gear Adapter (02-A02-004) Mid-Drive Gear Spacers (02-A02-009)
The outer profile of the mid-drive adapter was waterjet cut at the same time as the mid-drive mounts, as it had similarly loose profile tolerances (Figure 29). Hole center marks were pierced using the waterjet and were later drilled to size. The first iteration was overbuilt, given its ¼” thickness and full circle profile. The second iteration was waterjet cut with a profile that reduced its overall weight by a factor of 2.8. This new profile required a significant redesign and thus FEA was done on the new profile to ensure structural integrity. This FEA can be seen in section 5.3.3.
Mid-drive gear spacers were turned down from 1 inch long round stock. The team drilled the center holes using a drill bit mounted in the tailstock of a lathe and individually parted each spacer from the round stock.
6.2.3. Chain Tensioner Mount
Chain Tensioner Main Plate (02-A05-002) Chain Tensioner Pivot Arm (02-A05-004) Chain Tensioner Bushing (02-A05-003)
The chain tensioner parts were CNC machined in the IME Advanced Machining Lab. This required the production of G-code using the SolidWorks plug-in for HSMworks. The parts were set up in the machine coordinate system so that they could be machined in a vise. This was difficult because the chain tensioner main plate had angled sides, which were difficult to hold in a vise. To solve that issue, the team used larger stock and left supporting tabs around the perimeter that were cut and sanded afterwards. The chain tensioner main plate and pivot arm were also machined from one larger sheet of stock.
Figure 31. Chain tensioner bushing
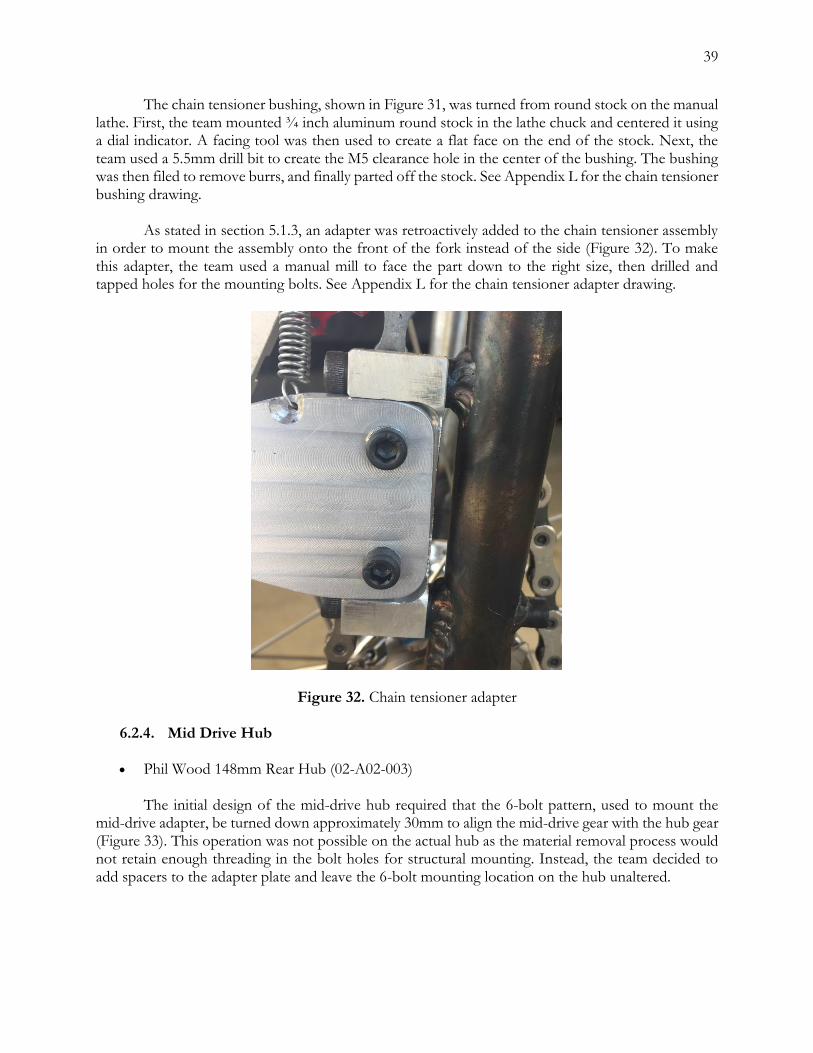
39
The chain tensioner bushing, shown in Figure 31, was turned from round stock on the manual lathe. First, the team mounted ¾ inch aluminum round stock in the lathe chuck and centered it using a dial indicator. A facing tool was then used to create a flat face on the end of the stock. Next, the team used a 5.5mm drill bit to create the M5 clearance hole in the center of the bushing. The bushing was then filed to remove burrs, and finally parted off the stock. See Appendix L for the chain tensioner bushing drawing.
As stated in section 5.1.3, an adapter was retroactively added to the chain tensioner assembly in order to mount the assembly onto the front of the fork instead of the side (Figure 32). To make this adapter, the team used a manual mill to face the part down to the right size, then drilled and tapped holes for the mounting bolts. See Appendix L for the chain tensioner adapter drawing.
Figure 32. Chain tensioner adapter
6.2.4. Mid Drive Hub
Phil Wood 148mm Rear Hub (02-A02-003) The initial design of the mid-drive hub required that the 6-bolt pattern, used to mount the mid-drive adapter, be turned down approximately 30mm to align the mid-drive gear with the hub gear (Figure 33). This operation was not possible on the actual hub as the material removal process would not retain enough threading in the bolt holes for structural mounting. Instead, the team decided to add spacers to the adapter plate and leave the 6-bolt mounting location on the hub unaltered.
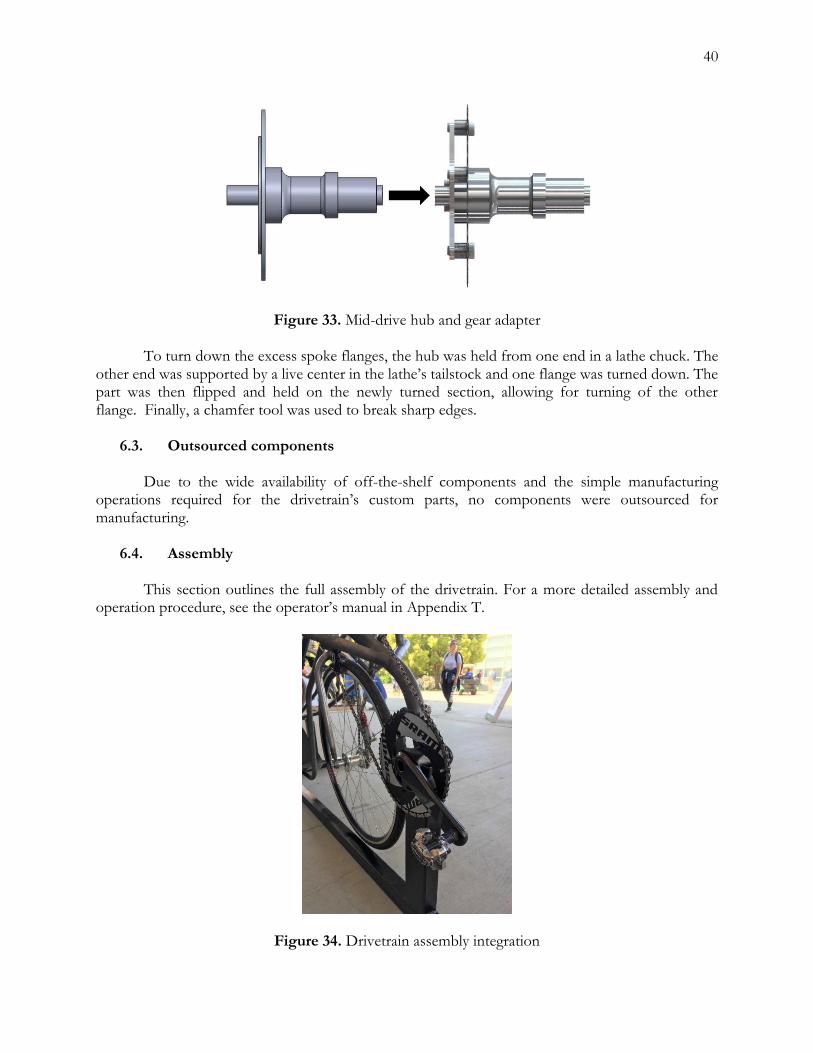
40
Figure 33. Mid-drive hub and gear adapter To turn down the excess spoke flanges, the hub was held from one end in a lathe chuck. The other end was supported by a live center in the lathe’s tailstock and one flange was turned down. The part was then flipped and held on the newly turned section, allowing for turning of the other flange. Finally, a chamfer tool was used to break sharp edges.
6.3. Outsourced components
Due to the wide availability of off-the-shelf components and the simple manufacturing operations required for the drivetrain’s custom parts, no components were outsourced for manufacturing.
6.4. Assembly This section outlines the full assembly of the drivetrain. For a more detailed assembly and operation procedure, see the operator’s manual in Appendix T.
Figure 34. Drivetrain assembly integration

41
Starting with the front system (Figure 34), the bottom bracket is threaded into the bottom bracket shell and the crankset is inserted and tightened into the bottom bracket. Next, the chainring is installed onto the cranks with chainring bolts. Finally, the pedals are installed on the cranks.
Figure 35. Mid-drive assembly Once the front system assembly is complete, the mid-drive is assembled (Figure 35). First, the cassette with spacers is installed onto the splined driver body of the hub. Then the mid-drive adapter and mid-drive gear are installed onto the adapter. Once these components are assembled, the assembly is mounted to the mid-drive mounting plates using the thru axle and the bolt-on threaded end cap. The rear derailleur is then installed onto the right mid-drive mount. Finally, this entire assembly is bolted to the frame using M5 x 0.8 mounting bolts.
Figure 36. Chain tensioner assembly
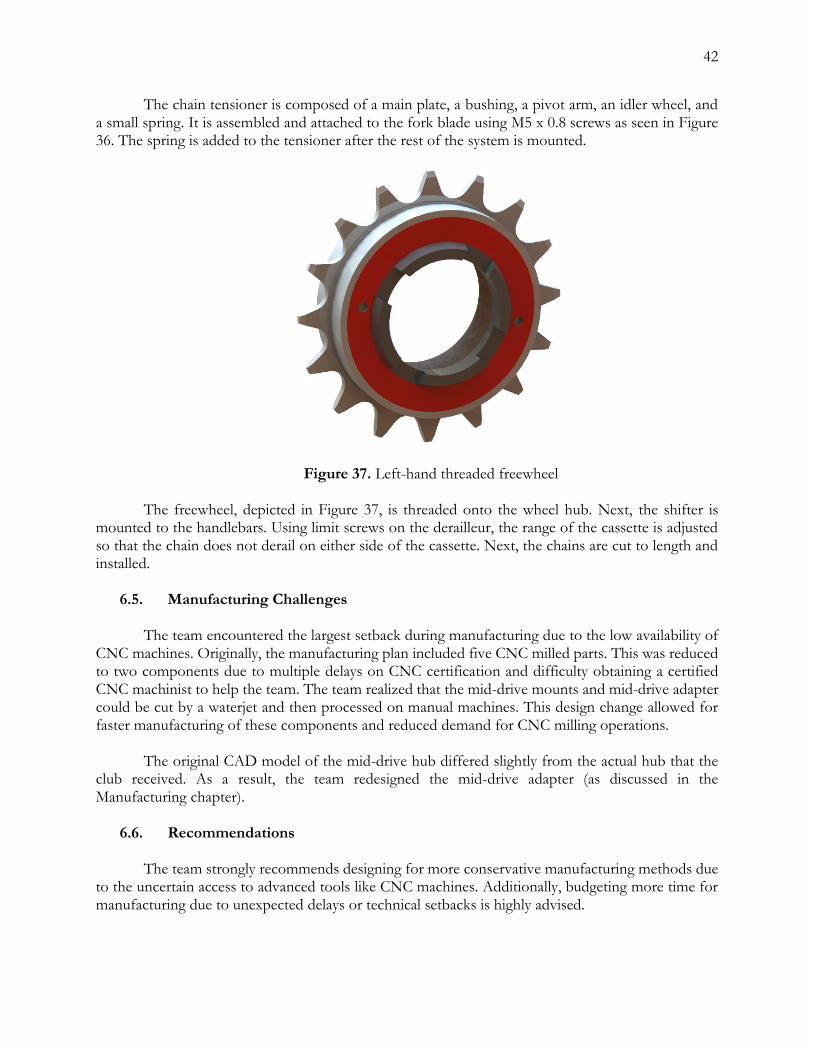
42
The chain tensioner is composed of a main plate, a bushing, a pivot arm, an idler wheel, and a small spring. It is assembled and attached to the fork blade using M5 x 0.8 screws as seen in Figure 36. The spring is added to the tensioner after the rest of the system is mounted.
Figure 37. Left-hand threaded freewheel
The freewheel, depicted in Figure 37, is threaded onto the wheel hub. Next, the shifter is mounted to the handlebars. Using limit screws on the derailleur, the range of the cassette is adjusted so that the chain does not derail on either side of the cassette. Next, the chains are cut to length and installed.
6.5. Manufacturing Challenges The team encountered the largest setback during manufacturing due to the low availability of CNC machines. Originally, the manufacturing plan included five CNC milled parts. This was reduced to two components due to multiple delays on CNC certification and difficulty obtaining a certified CNC machinist to help the team. The team realized that the mid-drive mounts and mid-drive adapter could be cut by a waterjet and then processed on manual machines. This design change allowed for faster manufacturing of these components and reduced demand for CNC milling operations.
The original CAD model of the mid-drive hub differed slightly from the actual hub that the club received. As a result, the team redesigned the mid-drive adapter (as discussed in the Manufacturing chapter).
6.6. Recommendations
The team strongly recommends designing for more conservative manufacturing methods due to the uncertain access to advanced tools like CNC machines. Additionally, budgeting more time for manufacturing due to unexpected delays or technical setbacks is highly advised.

43
7. Design Verification
This section contains an explanation of the methods used to evaluate the specifications of the final prototype as well as the results of the corresponding analyses, inspections, and tests. Table 5 below summarizes how each specification was validated.
Table 5. Specification Validation Methods
Number Specification Method of Validation
1 Freedom of Motion Test: See detailed Test 1 procedure in Appendix U below.
2 Frontal Area Analysis: Frontal area was analyzed in CAD to validate that it met our specification.
3 Q-Factor Inspection: Q-Factor was physically measured on the conformation prototype to validate that it met the specification.
4 Component Clearance with Fairing/Frame
Inspection: Once the conformation prototype, the frame, and the fairing were finished, the system was run through a few cycles to confirm that none of the components interfered with the frame or fairing.
5 Chain Installation Time
Test: See detailed Test 2 procedure in Appendix U below.
6 Component Load Test
Test: See detailed Test 3 procedure in Appendix U below.
7 Number of Tools Required
Inspection: Once the confirmation prototype was finished, all the tools needed for assembly and maintenance of the prototype were gathered and counted to confirm that it met the specification.
8 Chain Angle/Offset Analysis: Chain Angle/Offset was analyzed in CAD to validate that it met the specification.
9 Cost to Build
Analysis: The total cost of each part and component used to build, test, and assemble the conformation prototype was recorded and totaled to confirm that it met the specification.
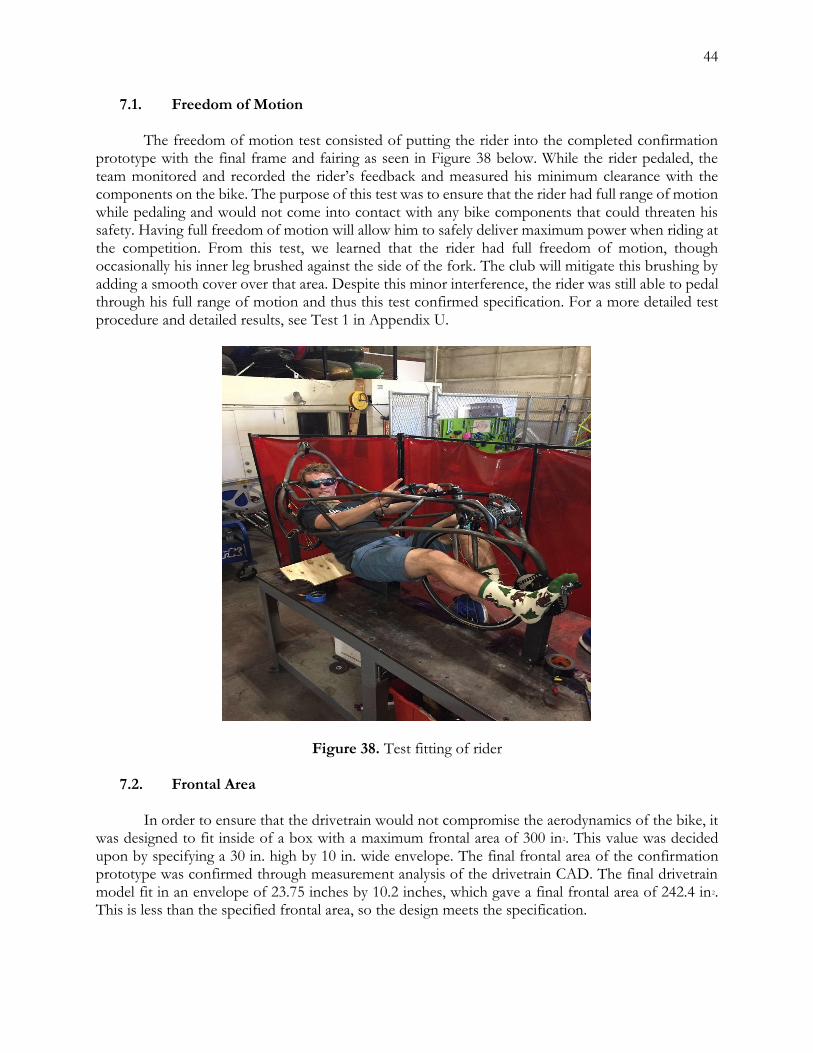
44
7.1. Freedom of Motion
The freedom of motion test consisted of putting the rider into the completed confirmation prototype with the final frame and fairing as seen in Figure 38 below. While the rider pedaled, the team monitored and recorded the rider’s feedback and measured his minimum clearance with the components on the bike. The purpose of this test was to ensure that the rider had full range of motion while pedaling and would not come into contact with any bike components that could threaten his safety. Having full freedom of motion will allow him to safely deliver maximum power when riding at the competition. From this test, we learned that the rider had full freedom of motion, though occasionally his inner leg brushed against the side of the fork. The club will mitigate this brushing by adding a smooth cover over that area. Despite this minor interference, the rider was still able to pedal through his full range of motion and thus this test confirmed specification. For a more detailed test procedure and detailed results, see Test 1 in Appendix U.
Figure 38. Test fitting of rider
7.2. Frontal Area
In order to ensure that the drivetrain would not compromise the aerodynamics of the bike, it was designed to fit inside of a box with a maximum frontal area of 300 in2. This value was decided upon by specifying a 30 in. high by 10 in. wide envelope. The final frontal area of the confirmation prototype was confirmed through measurement analysis of the drivetrain CAD. The final drivetrain model fit in an envelope of 23.75 inches by 10.2 inches, which gave a final frontal area of 242.4 in2. This is less than the specified frontal area, so the design meets the specification.

45
7.3. Q-Factor To ensure that the rider is as comfortable as possible when pedaling and thus able to deliver his full power, the team decided upon a Q-factor specification of 140 ± 5 mm, which is the road bicycling standard and the preferred Q-factor for the rider. This specification was validated through inspection of the confirmation prototype. The actual Q-factor was measured to be 145 mm, so the specification was met.
7.4. Clearance with Fairing/Frame
The team inspected the drivetrain while it was mounted on the completed frame with the fairing in place. The goal of this inspection was to ensure that the drivetrain had at least 0.5 in of clearance with the other systems at all times. After completing the inspection, it was found that the drivetrain had over 0.5 in of clearance with the fairing at all times. The only case of possible contact was between the derailleur and fork when shifted into the lowest gear. The clearance between the fork and the derailleur was between 0.25 and 0.5 in. This was deemed acceptable because the steering limitation will keep the clearance equal to or greater than 0.5 in, which satisfies the specification.
7.5. Chain Installation Time
The chain installation test was designed to ensure that the drivetrain is easily accessible for maintenance, which is important for last minute adjustments while at competition. This specification required the frame and drivetrain to be completely assembled. A member of the team was timed as he removed the old chain and installed the new chain (Figure 39).
Figure 39. Chain installation time test
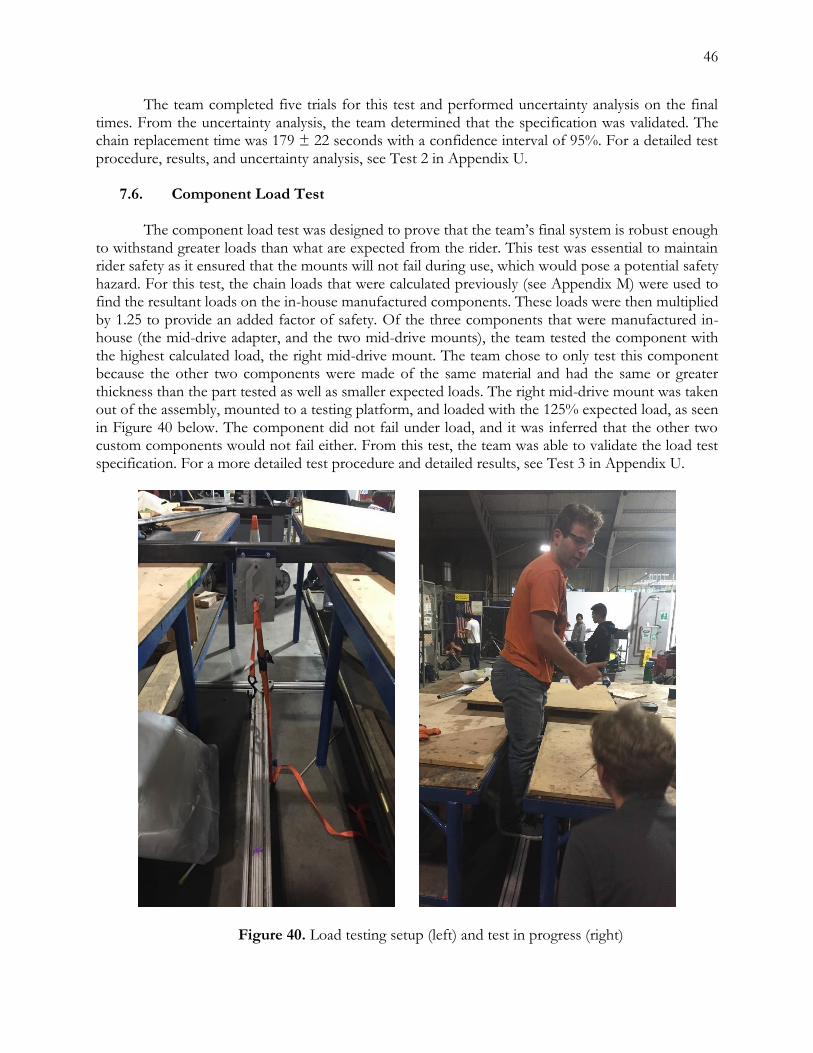
46
The team completed five trials for this test and performed uncertainty analysis on the final times. From the uncertainty analysis, the team determined that the specification was validated. The chain replacement time was 179 ± 22 seconds with a confidence interval of 95%. For a detailed test procedure, results, and uncertainty analysis, see Test 2 in Appendix U.
7.6. Component Load Test
The component load test was designed to prove that the team’s final system is robust enough to withstand greater loads than what are expected from the rider. This test was essential to maintain rider safety as it ensured that the mounts will not fail during use, which would pose a potential safety hazard. For this test, the chain loads that were calculated previously (see Appendix M) were used to find the resultant loads on the in-house manufactured components. These loads were then multiplied by 1.25 to provide an added factor of safety. Of the three components that were manufactured in-house (the mid-drive adapter, and the two mid-drive mounts), the team tested the component with the highest calculated load, the right mid-drive mount. The team chose to only test this component because the other two components were made of the same material and had the same or greater thickness than the part tested as well as smaller expected loads. The right mid-drive mount was taken out of the assembly, mounted to a testing platform, and loaded with the 125% expected load, as seen in Figure 40 below. The component did not fail under load, and it was inferred that the other two custom components would not fail either. From this test, the team was able to validate the load test specification. For a more detailed test procedure and detailed results, see Test 3 in Appendix U.
Figure 40. Load testing setup (left) and test in progress (right)
47
7.7. Number of Tools Required
The purpose of this specification is to ensure that the drivetrain is easily assembled and maintainable. An easily maintainable drivetrain may allow for more record attempts at competition by decreasing the chances of long repair times. This specification is also an easily measurable benchmark for teams in the future to compare designs to. This specification was validated by a simple inspection of all the tools used to assemble the entire drivetrain system. The drivetrain system required a total of 10 tools to assemble, which is significantly less than the 30 tools specified.
7.8. Chain Angle/Offset
Chain angle is a measure of how straight the chain is relative to the gear it is resting on. Large chain angles can drastically decrease drivetrain efficiency and lead to unexpected derailment during use, which can pose a safety hazard for the rider. The design goal was to have a chain angle of 3 degrees or less. To validate this specification, an analysis was done using the finalized CAD model and the measure tool to calculate a worst-case angle. From this analysis the team found our worst chain angle to be 2.9 degrees. This is just smaller than the design value, so the drivetrain successfully met the specification.
7.9. Cost to Build
The cost to build was an important specification for the project, both because the project is funded directly by the HPV club and also because the club wanted to provide future teams with a benchmark cost for fundraising. Using data from previous years, the club estimated that the drivetrain system would cost $1,200, not including the value of donated components. After fundraising and reaching out to sponsors for donations, the final cost of the drivetrain was $1,461.18. This is slightly more than the club’s budget, so the drivetrain failed to meet this specification. However, after fundraising this year, the club decided that $1,200 was an underestimate and provided the team with an additional $300 to successfully complete the project.
A more detailed breakdown of this chapter, the Design Verification Plan (DVP), can be found in Appendix C. This spreadsheet contains information on each specification and corresponding test. This information includes the acceptance criteria, the team member responsible, the build stage required, and the planned start date of each test. See Table 6 below for the consolidated specifications and results.
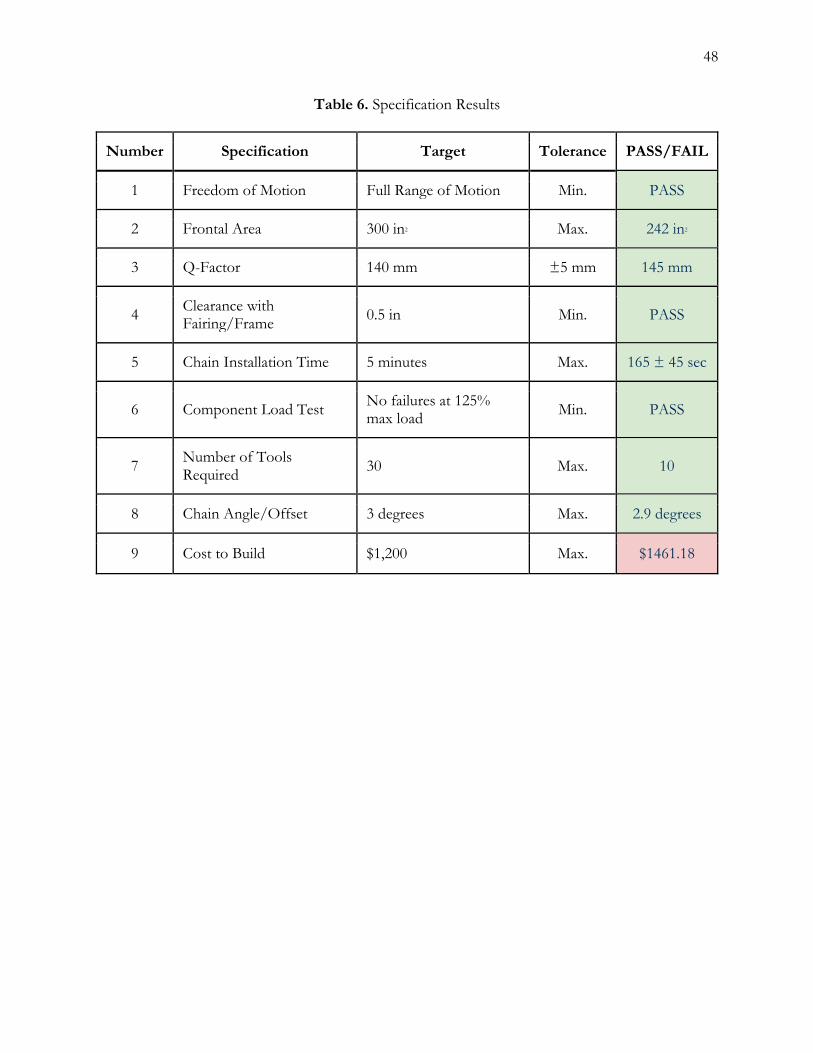
48
Table 6. Specification Results
Number Specification Target Tolerance PASS/FAIL
1 Freedom of Motion Full Range of Motion Min. PASS
2 Frontal Area 300 in2 Max. 242 in2
3 Q-Factor 140 mm ±5 mm 145 mm
4 Clearance with Fairing/Frame
0.5 in Min. PASS
5 Chain Installation Time 5 minutes Max. 165 ± 45 sec
6 Component Load Test No failures at 125% max load
Min. PASS
7 Number of Tools Required
30 Max. 10
8 Chain Angle/Offset 3 degrees Max. 2.9 degrees
9 Cost to Build $1,200 Max. $1461.18
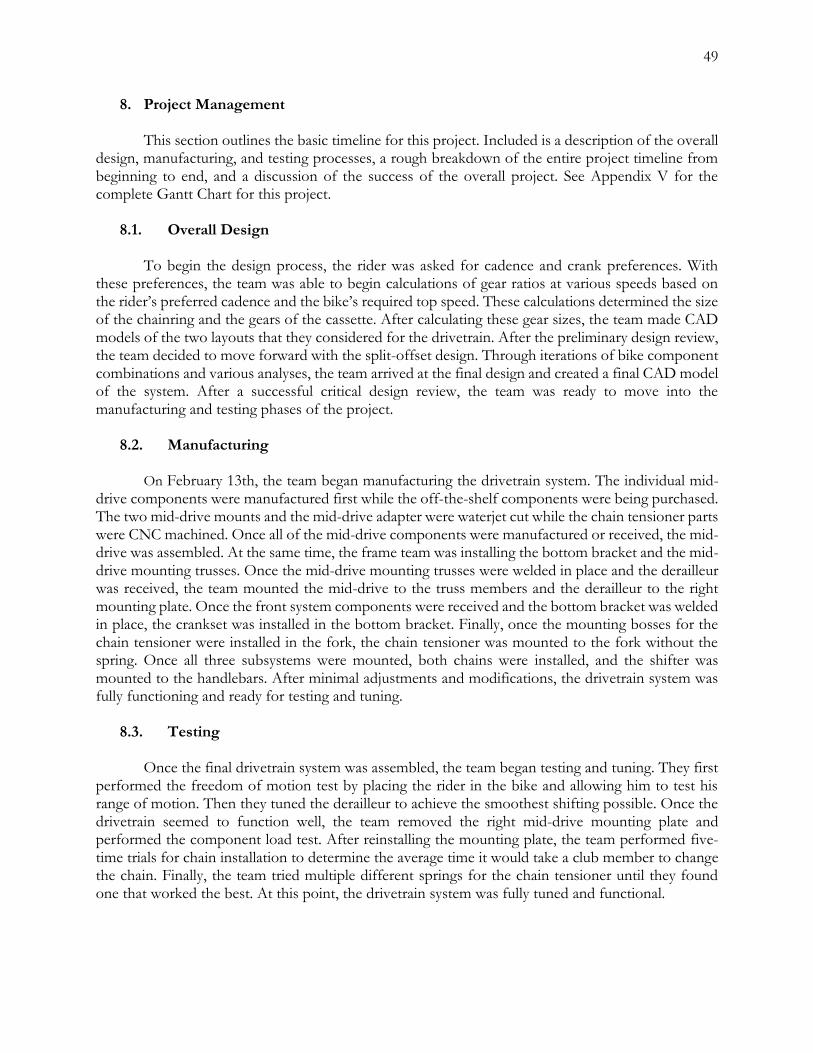
49
8. Project Management
This section outlines the basic timeline for this project. Included is a description of the overall design, manufacturing, and testing processes, a rough breakdown of the entire project timeline from beginning to end, and a discussion of the success of the overall project. See Appendix V for the complete Gantt Chart for this project.
8.1. Overall Design
To begin the design process, the rider was asked for cadence and crank preferences. With these preferences, the team was able to begin calculations of gear ratios at various speeds based on the rider’s preferred cadence and the bike’s required top speed. These calculations determined the size of the chainring and the gears of the cassette. After calculating these gear sizes, the team made CAD models of the two layouts that they considered for the drivetrain. After the preliminary design review, the team decided to move forward with the split-offset design. Through iterations of bike component combinations and various analyses, the team arrived at the final design and created a final CAD model of the system. After a successful critical design review, the team was ready to move into the manufacturing and testing phases of the project.
8.2. Manufacturing
On February 13th, the team began manufacturing the drivetrain system. The individual mid-drive components were manufactured first while the off-the-shelf components were being purchased. The two mid-drive mounts and the mid-drive adapter were waterjet cut while the chain tensioner parts were CNC machined. Once all of the mid-drive components were manufactured or received, the mid-drive was assembled. At the same time, the frame team was installing the bottom bracket and the mid-drive mounting trusses. Once the mid-drive mounting trusses were welded in place and the derailleur was received, the team mounted the mid-drive to the truss members and the derailleur to the right mounting plate. Once the front system components were received and the bottom bracket was welded in place, the crankset was installed in the bottom bracket. Finally, once the mounting bosses for the chain tensioner were installed in the fork, the chain tensioner was mounted to the fork without the spring. Once all three subsystems were mounted, both chains were installed, and the shifter was mounted to the handlebars. After minimal adjustments and modifications, the drivetrain system was fully functioning and ready for testing and tuning.
8.3. Testing
Once the final drivetrain system was assembled, the team began testing and tuning. They first performed the freedom of motion test by placing the rider in the bike and allowing him to test his range of motion. Then they tuned the derailleur to achieve the smoothest shifting possible. Once the drivetrain seemed to function well, the team removed the right mid-drive mounting plate and performed the component load test. After reinstalling the mounting plate, the team performed five-time trials for chain installation to determine the average time it would take a club member to change the chain. Finally, the team tried multiple different springs for the chain tensioner until they found one that worked the best. At this point, the drivetrain system was fully tuned and functional.

50
8.4. Project Timeline
1) Background Research a. Research on all components, including patents and other competitors
2) Preliminary Decisions a. Decide Wheel-size (650c x 23 decided) b. Decide Front- or Rear-wheel drive
3) Preliminary Design (PDR) a. Determine all ratios/components that will make up the system b. Determine general layout and locations of components
4) Detailed Design (IDR) - Due by Week 10 of Fall Quarter a. Failure/Risk analysis b. Stress analysis on components and frame c. Efficiency analysis d. Complete SolidWorks model
5) Detailed Design (CDR) - Due by Week 1 of Winter Quarter a. Determine and design all interface points with frame and other subsystems b. All calculations and analysis complete, confirmed, and refined c. Final SolidWorks model with other subsystems
6) Manufacture Jigs - Due by Week 7 of Winter Quarter a. All jigs necessary for construction and testing
7) Manufacture System - Due by Week 3 of Spring Quarter a. Incorporate all components and necessary mounting points to build entire system
8) Component Testing - Due by Week 7 of Spring Quarter a. Functionality testing and tuning on all components as part of the completely
assembled system 9) System Testing - Due by Week 8 of Spring Quarter
a. Full system testing for efficiency and issues 10) Assembly and Integration - Due by Week 8 of Spring Quarter
a. Complete assembly and integration with the rest of the bike
8.5. Discussion of Process
Overall, the drivetrain project was a success. Both the timeline that the team followed, and the scope of the project were manageable in the allotted three quarters. The periodic design reviews were essential milestones for the design process and the safety checks and manufacturing reviews were useful benchmarks throughout the design and manufacturing processes. In general, the project progressed smoothly with few notable setbacks. For a future design project, it will be important to allot considerably more time for manufacturing and testing. In addition, it will be wise to account for extra time when receiving purchased or outsourced manufactured components. One of the challenges of managing the project was determining the necessary timeline and order of tasks that needed to be completed. Using a Gantt Chart was useful to visualize interdependencies between tasks; however, in the future, more thought should be put into the order of necessary tasks to finish the project successfully.
51
9. Conclusions and Recommendations
Over the course of the 2018-2019 school year, the HPV drivetrain team designed, built, and tested a functioning drivetrain for the 2019 Human Powered Vehicle. The drivetrain was designed around the chosen rider’s optimal cadence and ergonomics, which in turn would allow him to produce his peak power. A list of required prototype specifications was created and multiple tests, such as the component load test, were used to verify that the team’s final prototype met those specifications. Though the team spent more money than what was allocated in the required specifications, the club sponsor approved an increase in budget to cover the additional cost. The final prototype was proven functional but will be tuned to higher performance during the 2019 summer by the Human Powered Vehicle Team.
The manufacture and testing of any future HPV drivetrain should be improved from this year’s project. The manufacturing methods should remain simple, with minimal dependency on CNC methods. This will minimize delays due to lack of machine access and improve the overall efficiency of the manufacturing phase of the project. In the future, more time should be allocated for testing and test planning, and future teams should take extra care to set feasible testing goals. This year’s use of iterative manufacturing to refine the fit and function of the drivetrain within the overall bike assembly was an effective approach. Future teams should continue to allocate time towards making multiple iterations of the drivetrain, due to the variability in other subsystems which interact with the drivetrain. The current design could be improved for higher chain efficiency and implementation of lighter and more efficient (more expensive) components.
Moving forward with this final prototype, the Human Powered Vehicle Club should continue to adjust and tune the drivetrain system as they begin to perform full bike testing with the rider. Regular maintenance will be required during use to ensure that the chains and components remain in good condition. Beyond typical use of the system, the club should consider investing in measurement devices to determine the power output and cadence of the rider’s pedal stroke, as well as the bike’s speed, and drivetrain’s efficiency. It would be very useful to provide the rider with power, cadence, and speed data during a race so that he can determine the best way to pace himself and conserve energy. Drivetrain efficiency would also be exceedingly useful to know in order to adjust the drivetrain and optimize the efficiency through fine tuning.
Overall, this project was a success that met all of the club’s required specifications. All members of the team gained a significant amount of useful knowledge and experience working on a long-term engineering project as a member of a team. The HPV drivetrain team hopes that the Human Powered Vehicle Club will succeed in their attempt to break the US collegiate land speed record.
52
Works Cited
1. “Cycling Analytics.” Power Curve of David Johnstone - Cycling Analytics, 2018, www.cyclinganalytics.com/user/1000000/power-curve.
2. De Vroet, Matthew. “Just How Good Are Male Pro Road Cyclists?” CyclingTips, 9 Mar. 2018, cyclingtips.com/2017/06/just-how-good-are-male-pro-road-cyclists/.
3. Glaskin, Max. “Ideal Cycling Cadence: Why Amateurs Shouldn't Try to Pedal like Chris Froome.” Cycling Weekly, Cycling Weekly, 26 Apr. 2018, www.cyclingweekly.com/fitness/why-amateurs-shouldnt-try-to-pedal-like-chris-froome- 191779.
4. McGarry, Katy. Efficiency of Varying Pedal Cadences at a Set Power Output. 1996, Efficiency of Varying Pedal Cadences at a Set Power Output.
5. Kelley, Kathleen. Effects of Varying Pedal Cadence on Bicycling Efficiency. 1991, Effects of Varying Pedal Cadence on Bicycling Efficiency.
6. Clark, Robert. “Ergometry of Human Powered Vehicles.” 2018.
7. Zamparo, Paola. “Mechanical Efficiency of Cycling with a New Developed Pedal-Crank.” Journal of Biomechanics., vol. 35, no. 10, 2002, pp. 1387–1398.
8. Abbott, A. V., and D. G. Wilson. "Human power transfer to modern vehicles." Human Powered Vehicles. Human Kinetics, Champaign, IL (1995): 29-45.
9. Hull, M. L., et al. "Physiological response to cycling with both circular and noncircular chainrings." Medicine and science in sports and exercise 24.10 (1992): 1114-1122.
10. Zeller, Sebastian, et al. "Influence of noncircular chainring on male physiological parameters in hand cycling." Journal of Rehabilitation Research & Development 52.2 (2015).
11. Horvais, Nicolas, Pierre Samozino, and Frederique Hintzy. "The Effect of a Non-Circular Chainring on Cycling Performance." The Engineering of Sport 6. Springer, New York, NY, 2006. 85-90.
12. REI Co-op Expert Advice. “Bike Gears and Shifting Basics.” REI. October 10, 2018.
13. Patterson, S. H., SRAM LLC., 03/30/1993 Patent number (n.d.). US5197927A - Bicycle derailleur cable actuating system. Retrieved from https://patents.google.com/patent/US5197927A/en?q=derailleur&oq=derailleur
14. Kojima, S., Nishimoto, N., Shimano Inc., 04/15/1997, Patent number (n.d.). US5620384A-Front derailleur for a bicycle. Retrieved from https://patents.google.com/patent/US5620384A/en?q=derailleur&oq=derailleur
15. Darby, Jack B., 11/01/1983, Patent number (n.d.). US4412828A- Control means for shifting gears on dual shift bicycles, Retrieved from
53
https://patents.google.com/patent/US4412828A/en?q=gear&q=shifting&q=bike&oq=g ear+shifting+bike
16. Birchenough, C.W., Dietz, H.P., Holloway, D.S., Rytter, N.J., Scholl, R.D., Tweed, L.W., Caterpillar Inc., 01/14/1997, Patent number (n.d.). US5594643A- Method and system for diagnosing a drivetrain during shifting operations, retrieved from https://patents.google.com/patent/US5594643A/en?q=drivetrain&q=shifting&oq=drive train+shifting
17. Wickliffe, C. A., Goates, E., Wick Werks LLC, 01/10/2012, Patent number (n.d.). US8092329B2, Bicycle chain rings with ramps, Retrieved from https://patents.google.com/patent/US8092329B2/en?q=bike&q=chain&q=ring&oq=bik e+chain+ring
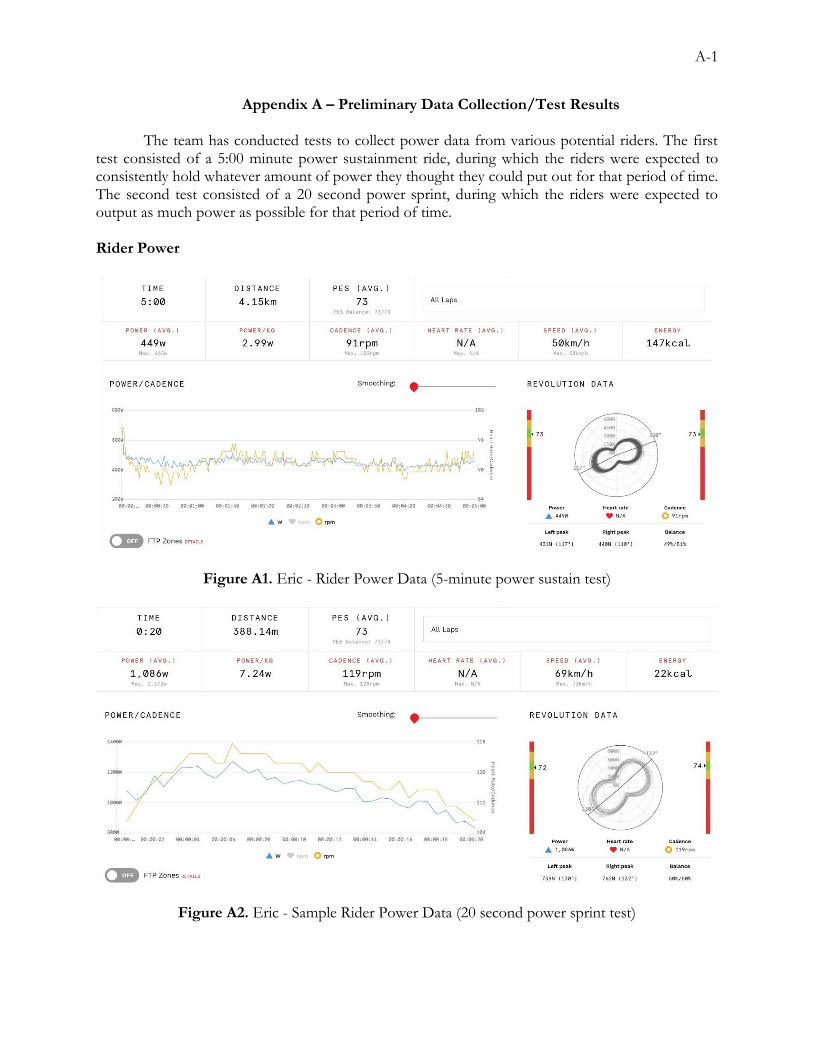
A-1
Appendix A – Preliminary Data Collection/Test Results
The team has conducted tests to collect power data from various potential riders. The first test consisted of a 5:00 minute power sustainment ride, during which the riders were expected to consistently hold whatever amount of power they thought they could put out for that period of time. The second test consisted of a 20 second power sprint, during which the riders were expected to output as much power as possible for that period of time.
Rider Power
Figure A1. Eric - Rider Power Data (5-minute power sustain test)
Figure A2. Eric - Sample Rider Power Data (20 second power sprint test)
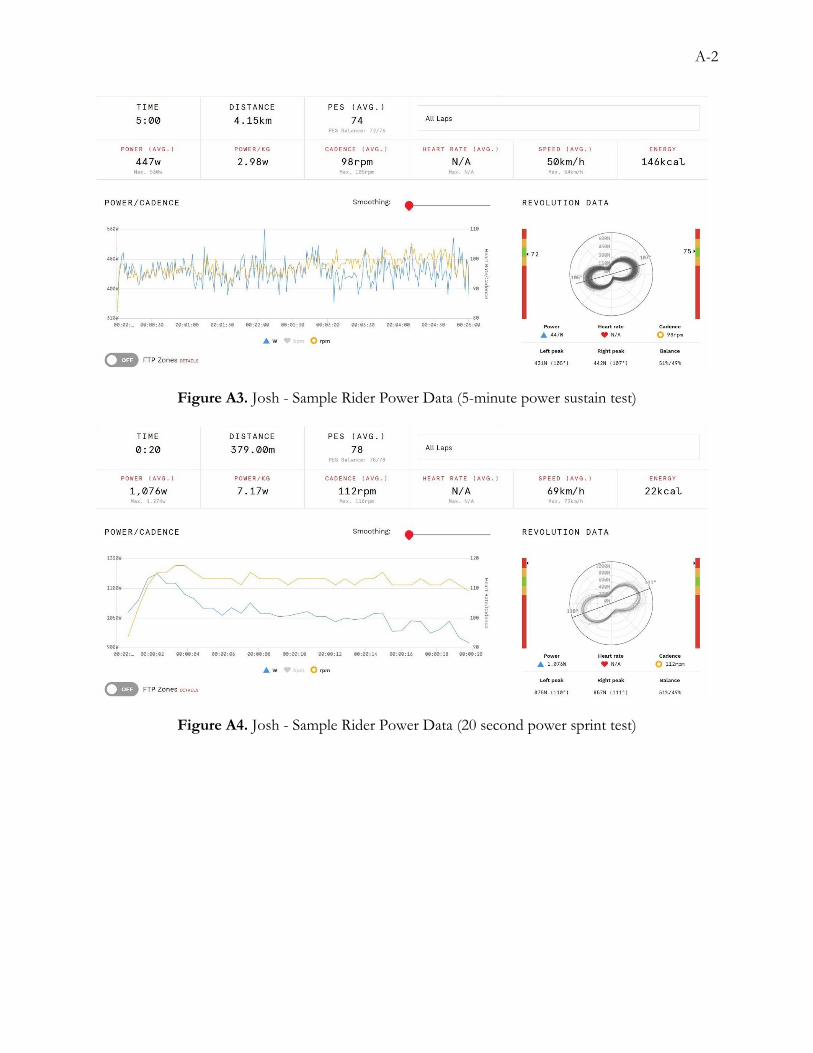
A-2
Figure A3. Josh - Sample Rider Power Data (5-minute power sustain test)
Figure A4. Josh - Sample Rider Power Data (20 second power sprint test)

A-3
Appendix B – QFD House of Quality
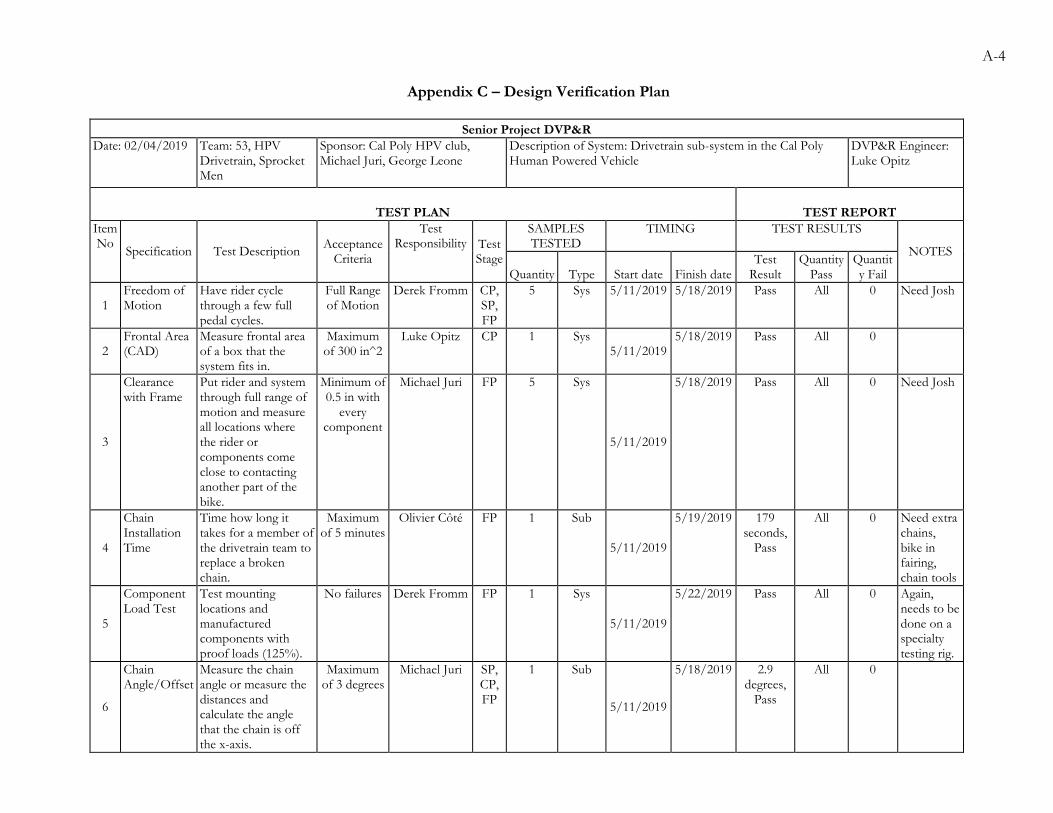
A-4
Appendix C – Design Verification Plan
Senior Project DVP&R
Date: 02/04/2019 Team: 53, HPV Drivetrain, Sprocket Men
Sponsor: Cal Poly HPV club, Michael Juri, George Leone
Description of System: Drivetrain sub-system in the Cal Poly Human Powered Vehicle
DVP&R Engineer: Luke Opitz
TEST PLAN TEST REPORT
Item No
Specification Test Description Acceptance
Criteria
Test Responsibility Test
Stage
SAMPLES TESTED
TIMING TEST RESULTS
NOTES
Quantity Type Start date Finish date Test
Result Quantity
Pass Quantity Fail
1 Freedom of Motion
Have rider cycle through a few full pedal cycles.
Full Range of Motion
Derek Fromm CP, SP, FP
5 Sys 5/11/2019 5/18/2019 Pass All 0 Need Josh
2 Frontal Area (CAD)
Measure frontal area of a box that the system fits in.
Maximum of 300 in^2
Luke Opitz CP 1 Sys 5/11/2019
5/18/2019 Pass All 0
3
Clearance with Frame
Put rider and system through full range of motion and measure all locations where the rider or components come close to contacting another part of the bike.
Minimum of 0.5 in with
every component
Michael Juri FP 5 Sys
5/11/2019
5/18/2019 Pass All 0 Need Josh
4
Chain Installation Time
Time how long it takes for a member of the drivetrain team to replace a broken chain.
Maximum of 5 minutes
Olivier Côté FP 1 Sub
5/11/2019
5/19/2019 179 seconds,
Pass
All 0 Need extra chains, bike in fairing, chain tools
5
Component Load Test
Test mounting locations and manufactured components with proof loads (125%).
No failures Derek Fromm FP 1 Sys
5/11/2019
5/22/2019 Pass All 0 Again, needs to be done on a specialty testing rig.
6
Chain Angle/Offset
Measure the chain angle or measure the distances and calculate the angle that the chain is off the x-axis.
Maximum of 3 degrees
Michael Juri SP, CP, FP
1 Sub
5/11/2019
5/18/2019 2.9 degrees,
Pass
All 0
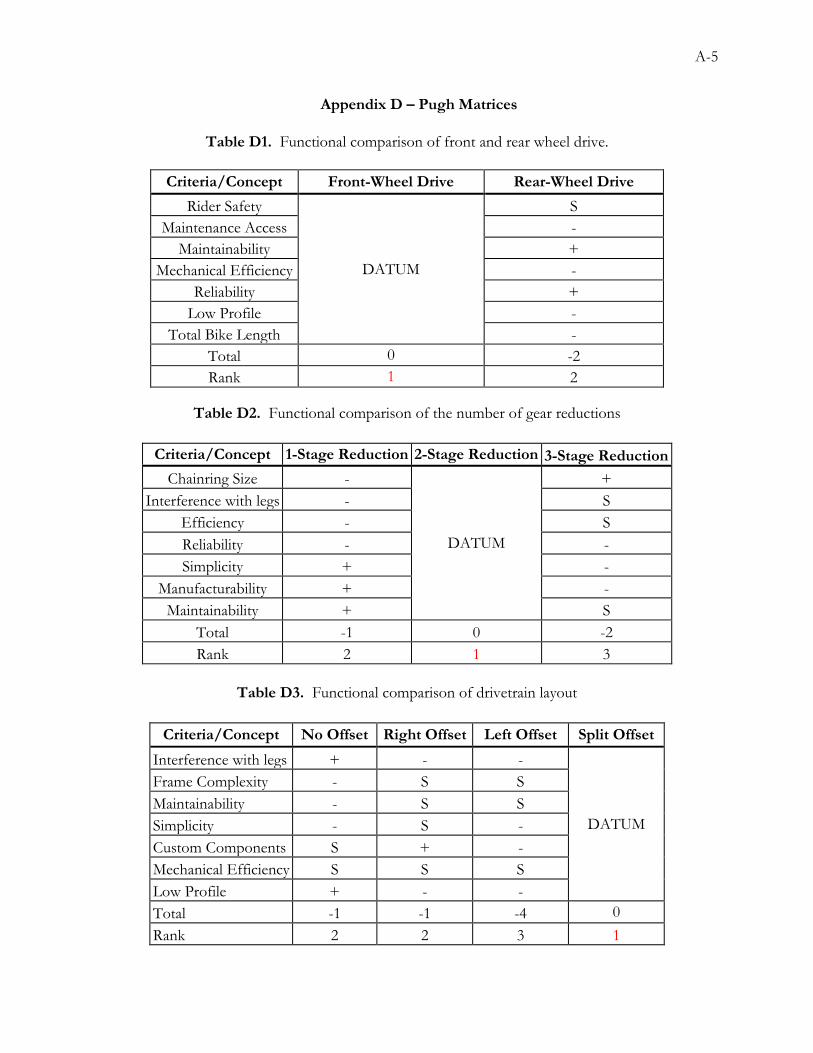
A-5
Appendix D – Pugh Matrices
Table D1. Functional comparison of front and rear wheel drive.
Table D2. Functional comparison of the number of gear reductions
Criteria/Concept 1-Stage Reduction 2-Stage Reduction 3-Stage Reduction
Chainring Size -
DATUM
+
Interference with legs - S
Efficiency - S
Reliability - -
Simplicity + -
Manufacturability + -
Maintainability + S
Total -1 0 -2
Rank 2 1 3
Table D3. Functional comparison of drivetrain layout
Criteria/Concept No Offset Right Offset Left Offset Split Offset
Interference with legs + - -
DATUM
Frame Complexity - S S
Maintainability - S S
Simplicity - S -
Custom Components S + -
Mechanical Efficiency S S S
Low Profile + - -
Total -1 -1 -4 0
Rank 2 2 3 1
Criteria/Concept Front-Wheel Drive Rear-Wheel Drive
Rider Safety
DATUM
S
Maintenance Access -
Maintainability +
Mechanical Efficiency -
Reliability +
Low Profile -
Total Bike Length -
Total 0 -2
Rank 1 2
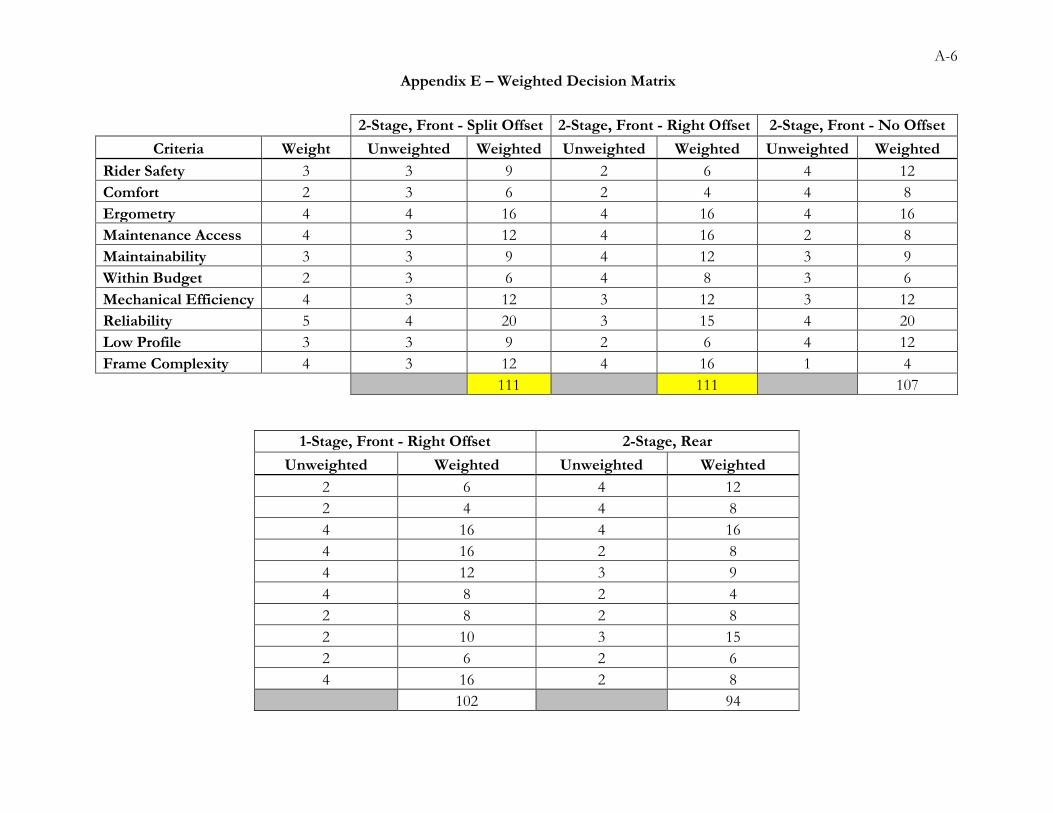
A-6
2-Stage, Front - Split Offset 2-Stage, Front - Right Offset 2-Stage, Front - No Offset
Criteria Weight Unweighted Weighted Unweighted Weighted Unweighted Weighted
Rider Safety 3 3 9 2 6 4 12
Comfort 2 3 6 2 4 4 8
Ergometry 4 4 16 4 16 4 16
Maintenance Access 4 3 12 4 16 2 8
Maintainability 3 3 9 4 12 3 9
Within Budget 2 3 6 4 8 3 6
Mechanical Efficiency 4 3 12 3 12 3 12
Reliability 5 4 20 3 15 4 20
Low Profile 3 3 9 2 6 4 12
Frame Complexity 4 3 12 4 16 1 4
111 111 107
1-Stage, Front - Right Offset 2-Stage, Rear
Unweighted Weighted Unweighted Weighted
2 6 4 12
2 4 4 8
4 16 4 16
4 16 2 8
4 12 3 9
4 8 2 4
2 8 2 8
2 10 3 15
2 6 2 6
4 16 2 8
102 94
Appendix E – Weighted Decision Matrix

A-7
Appendix F – Bicycle Gear Standard Dimensions
Cog Teeth Radius [in]
11 0.887
13 1.044
15 1.202
17 1.36
18 1.441
19 1.518
22 1.756
25 1.994
26 2.076
28 2.232
32 2.55
36 2.868
42 3.345
50 3.981
80 6.363
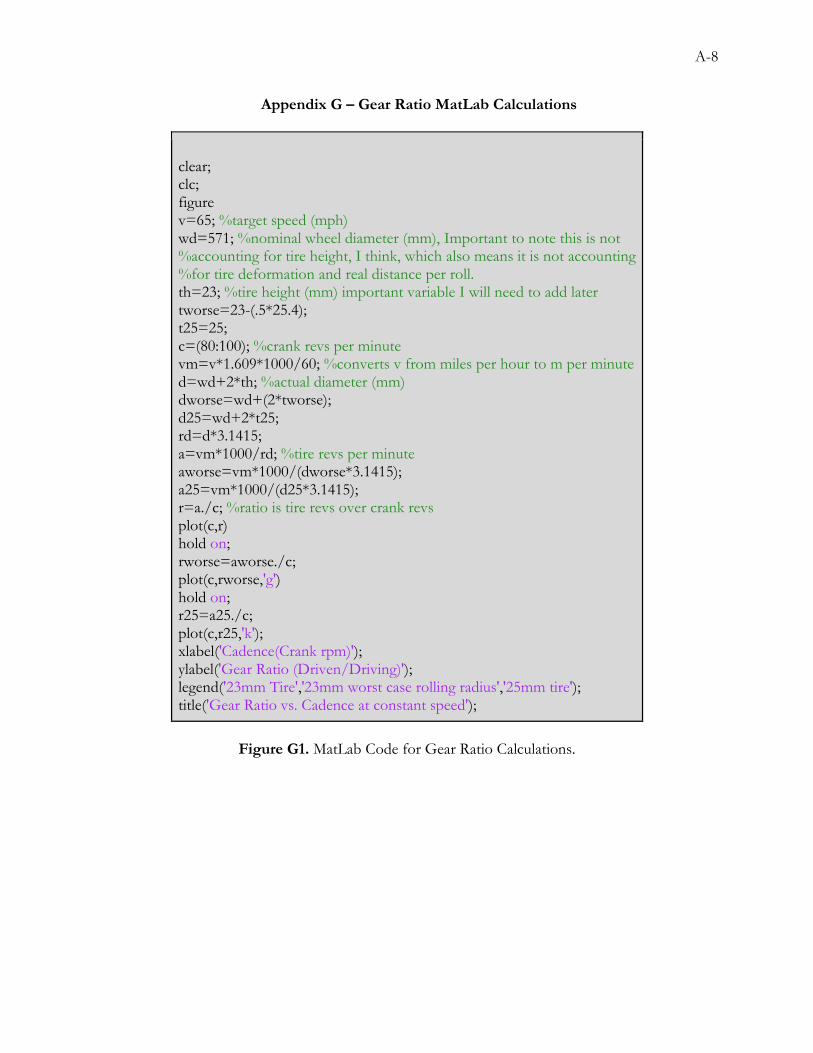
A-8
Appendix G – Gear Ratio MatLab Calculations
clear; clc; figure v=65; %target speed (mph) wd=571; %nominal wheel diameter (mm), Important to note this is not %accounting for tire height, I think, which also means it is not accounting %for tire deformation and real distance per roll. th=23; %tire height (mm) important variable I will need to add later tworse=23-(.5*25.4); t25=25; c=(80:100); %crank revs per minute vm=v*1.609*1000/60; %converts v from miles per hour to m per minute d=wd+2*th; %actual diameter (mm) dworse=wd+(2*tworse); d25=wd+2*t25; rd=d*3.1415; a=vm*1000/rd; %tire revs per minute aworse=vm*1000/(dworse*3.1415); a25=vm*1000/(d25*3.1415); r=a./c; %ratio is tire revs over crank revs plot(c,r) hold on; rworse=aworse./c; plot(c,rworse,'g') hold on; r25=a25./c; plot(c,r25,'k'); xlabel('Cadence(Crank rpm)'); ylabel('Gear Ratio (Driven/Driving)'); legend('23mm Tire','23mm worst case rolling radius','25mm tire'); title('Gear Ratio vs. Cadence at constant speed');
Figure G1. MatLab Code for Gear Ratio Calculations.

A-9
Figure G2. Comparison of Possible Wheel Sizes and Their Effect on Cadence

A-10
Appendix H – Gear Ratio Excel Calculations
Table H1. Gear Ratio Calculations for Design 1
Chainring [T]
Cassette Gear [T]
Function Mid Drive Gear [T]
Hub Gear [T]
Final Drive Ratio
Gear Jump
Ratio Jump
80
50 Starting
50 26
3.08 8 0.59
42 gaining speed
3.66 6 0.61
36 intermediate 4.27 4 0.53
32 intermediate 4.81 4 0.69
28 intermediate 5.49 3 0.66
25 intermediate 6.15 3 0.84
22 intermediate 6.99 3 1.1
19 intermediate 8.1 2 0.95
17 intermediate 9.05 2 1.21
15 Sprint 10.26 2 1.58
13 LO-FI Gear 11.83 2 2.15
11 Not used 13.99
Table H2. Gear Ratio Calculations for Design 2
Chainring [T]
Cassette Gear [T]
Function Mid Drive Gear [T]
Hub Gear [T]
Final Drive Ratio
Gear Jump
Ratio Jump
80
50 Starting
50 18
4.44 8 0.85
42 gaining speed
5.29 6 0.88
36 intermediate 6.17 4 0.77
32 intermediate 6.94 4 0.99
28 intermediate 7.94 3 0.95
25 intermediate 8.89 3 1.21
22 Sprint 10.1 3 1.59
19 LO-FI Gear 11.7 2 1.38
Not used 13.07 2 1.74
Not used 14.81 2 2.28
Not used 17.09 2 3.11
Not used 20.2
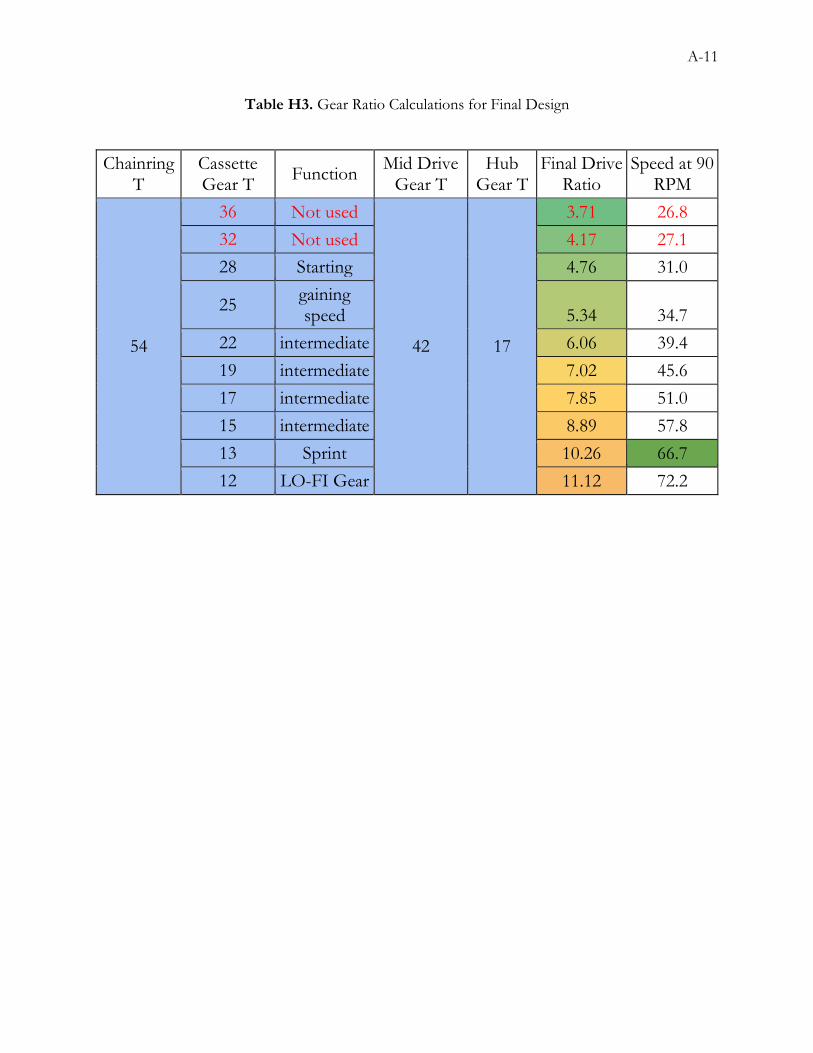
A-11
Table H3. Gear Ratio Calculations for Final Design
Chainring T
Cassette Gear T
Function Mid Drive
Gear T
Hub Gear T
Final Drive Ratio
Speed at 90 RPM
54
36 Not used
42 17
3.71 26.8
32 Not used 4.17 27.1
28 Starting 4.76 31.0
25 gaining speed 5.34 34.7
22 intermediate 6.06 39.4
19 intermediate 7.02 45.6
17 intermediate 7.85 51.0
15 intermediate 8.89 57.8
13 Sprint 10.26 66.7
12 LO-FI Gear 11.12 72.2
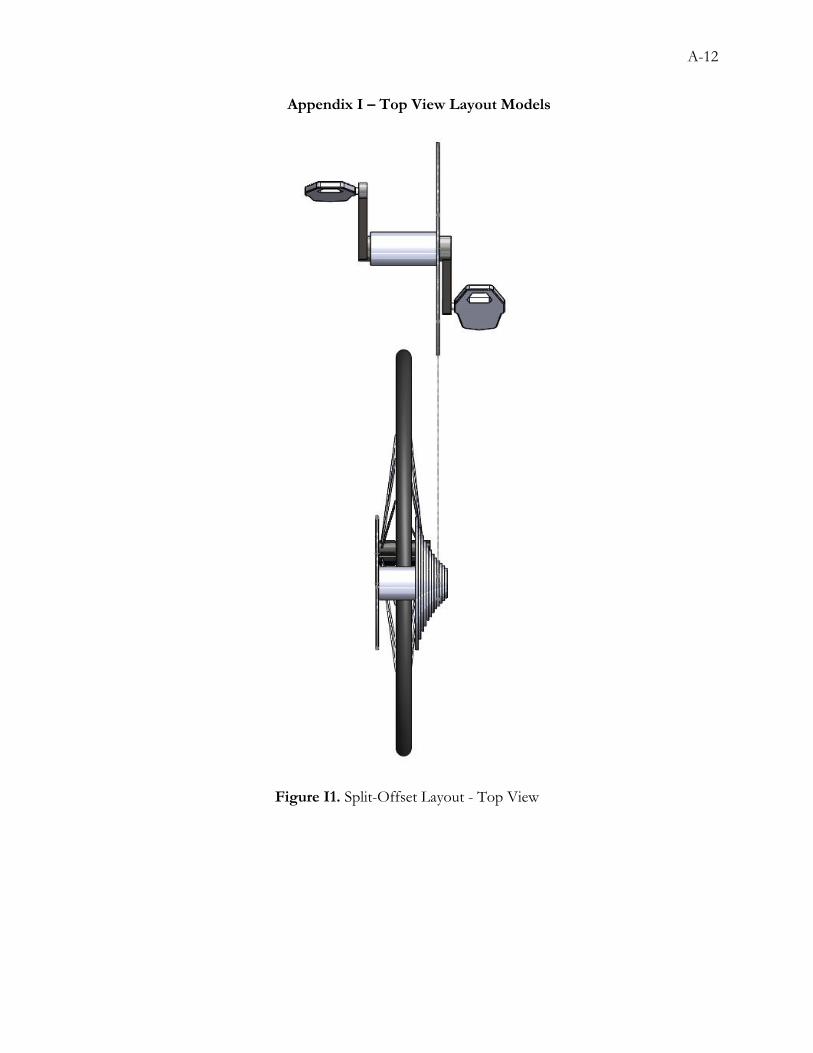
A-12
Appendix I – Top View Layout Models
Figure I1. Split-Offset Layout - Top View
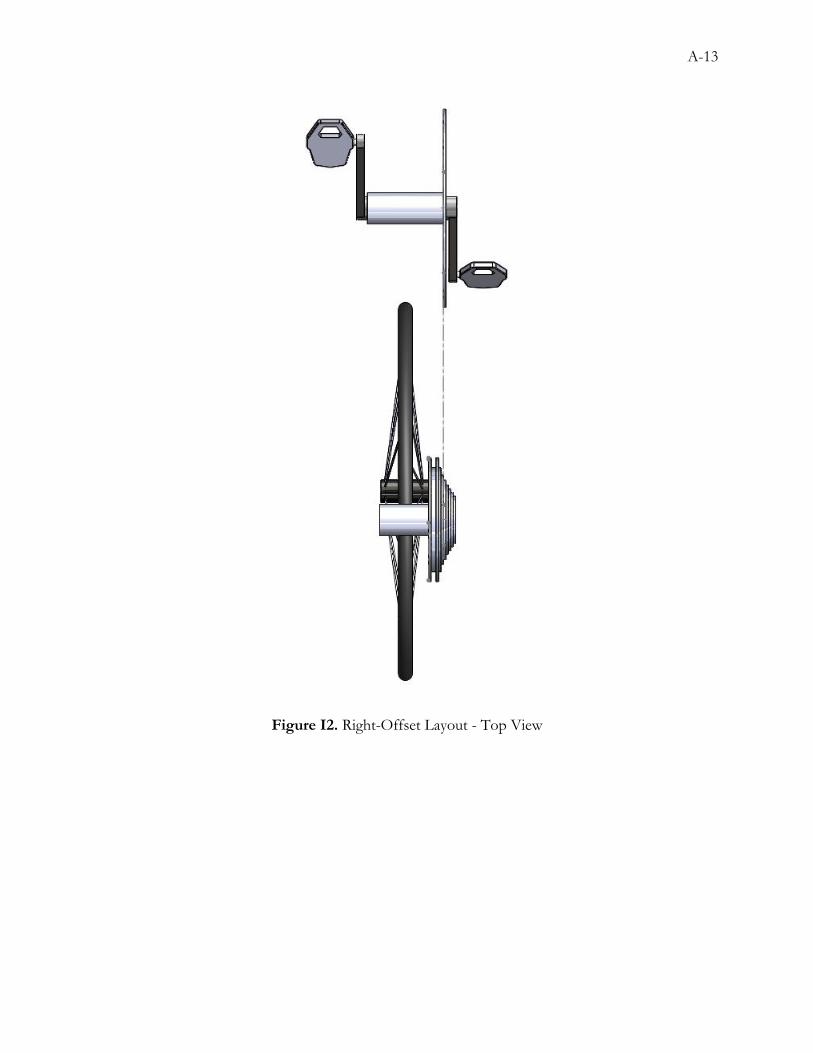
A-13
Figure I2. Right-Offset Layout - Top View
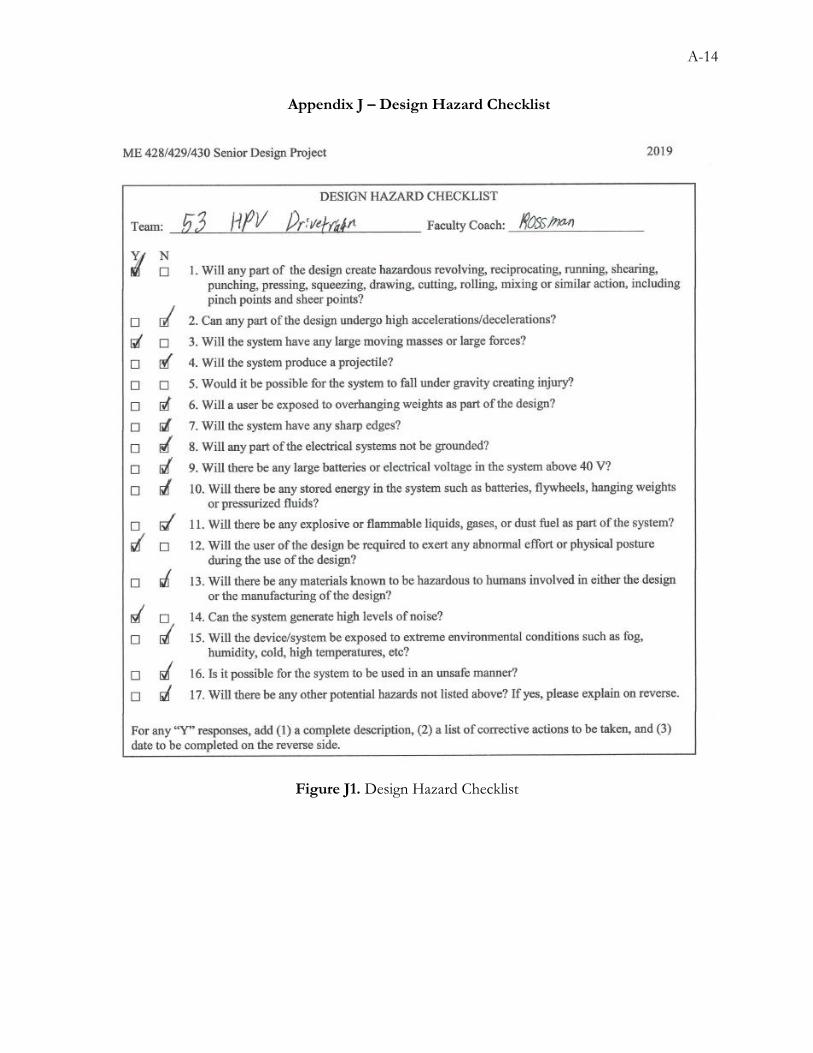
A-14
Appendix J – Design Hazard Checklist
Figure J1. Design Hazard Checklist

A-15
Table J1. Planned Corrective Action
Description of Hazard
Planned Corrective Action Planned
Date Actual Date
Rotating sprockets near the riders’ legs
and near tire.
Spatial testing to verify catastrophic tire contact is not possible, protective equipment on the rider, and possibly guards in areas of likely
contact.
15-Jan 18-May
Chain forces due to rider pedaling will be
large but within capabilities of chain
strength.
Use high end chains with highest manufacturing specifications to minimize risk of chain failure.
15-Jan 25-May
The rider will be exerting themselves in a recumbent position
during the entire operation of the
vehicle.
We will optimize the ergometry of the bike drivetrain to minimize discomfort and
maximize rider capabilities in the recumbent position.
15-Jan 11-May
The main source of noise will be the
drivetrain and the airflow over the
fairing.
We will focus on drivetrain efficiency in the most used gears to minimize power losses due
to friction and consequently sound. 15-Jan 25-May
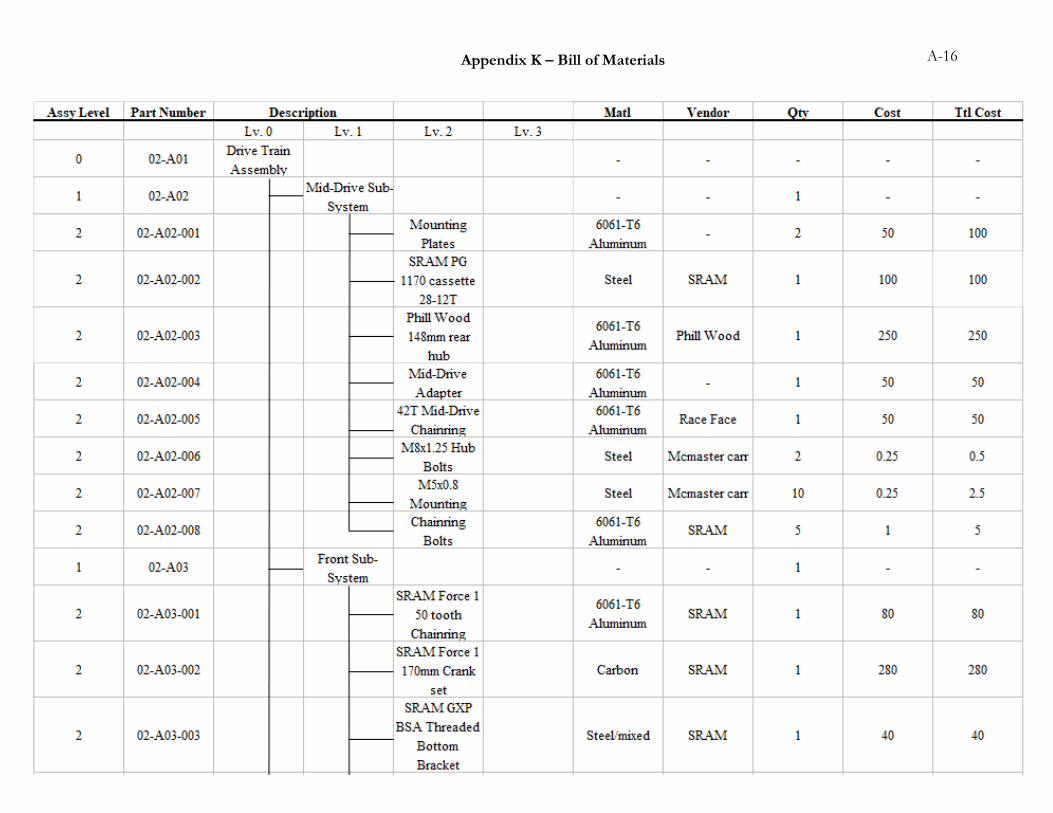
A-16
Appendix K – Bill of Materials
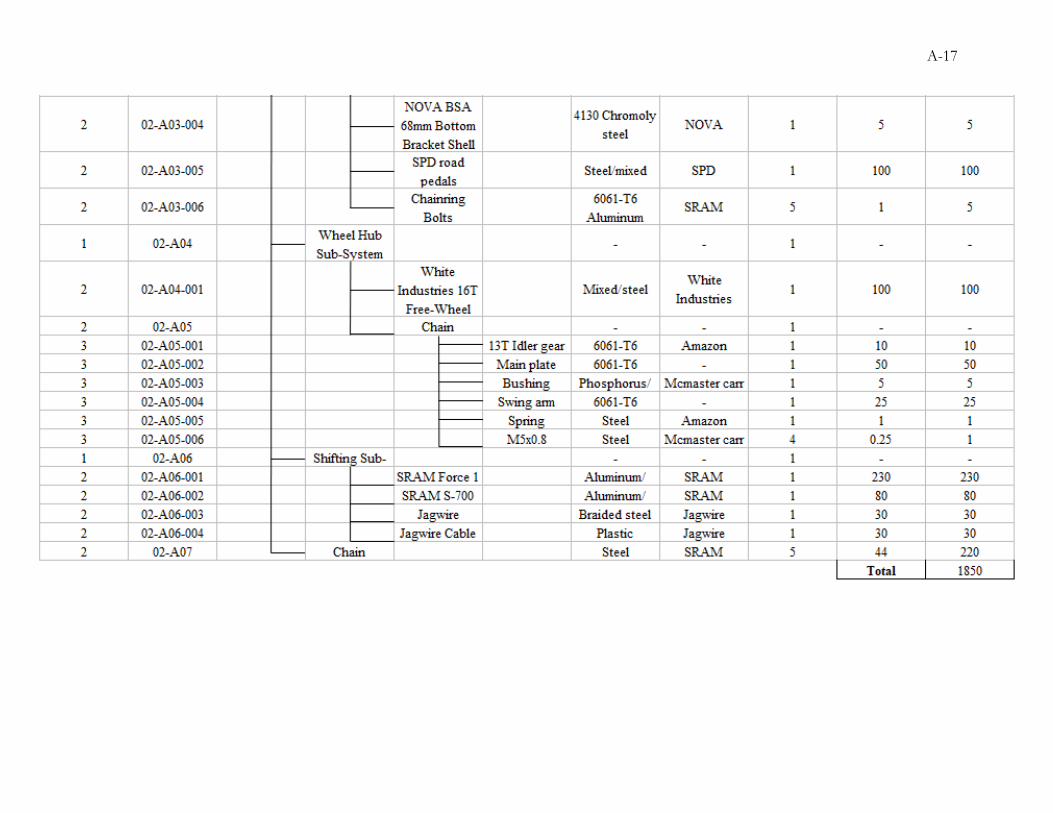
A-17
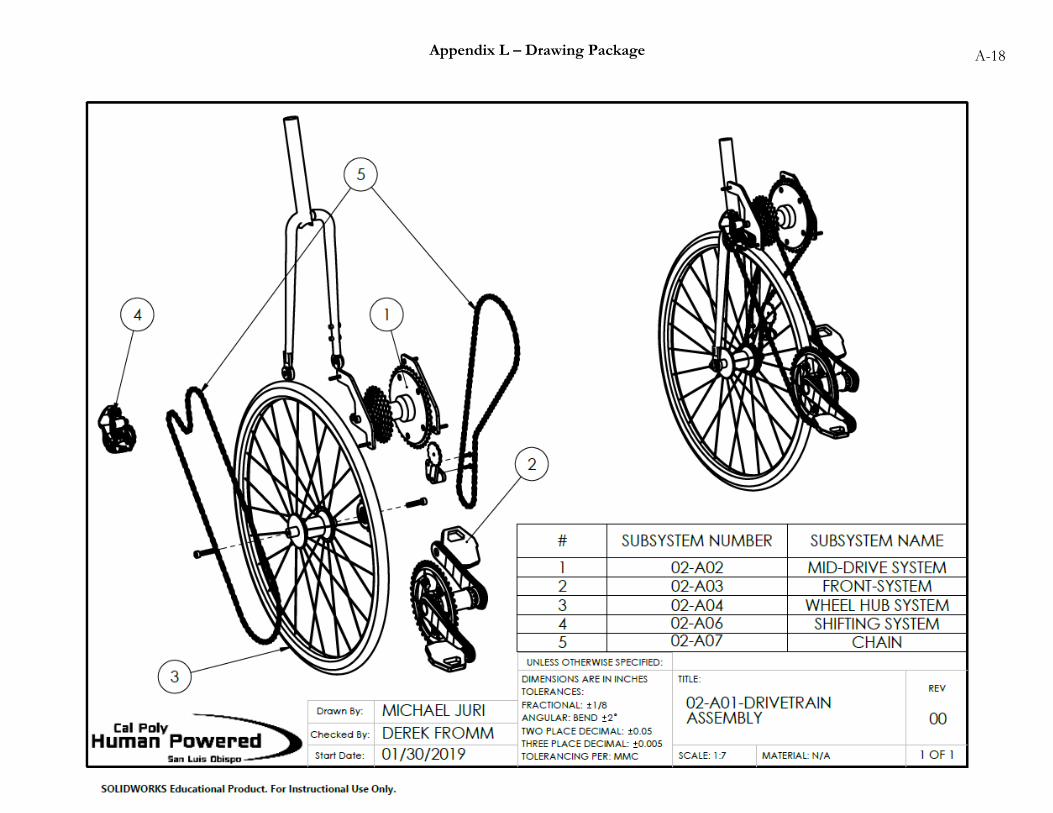
A-18
Appendix L – Drawing Package
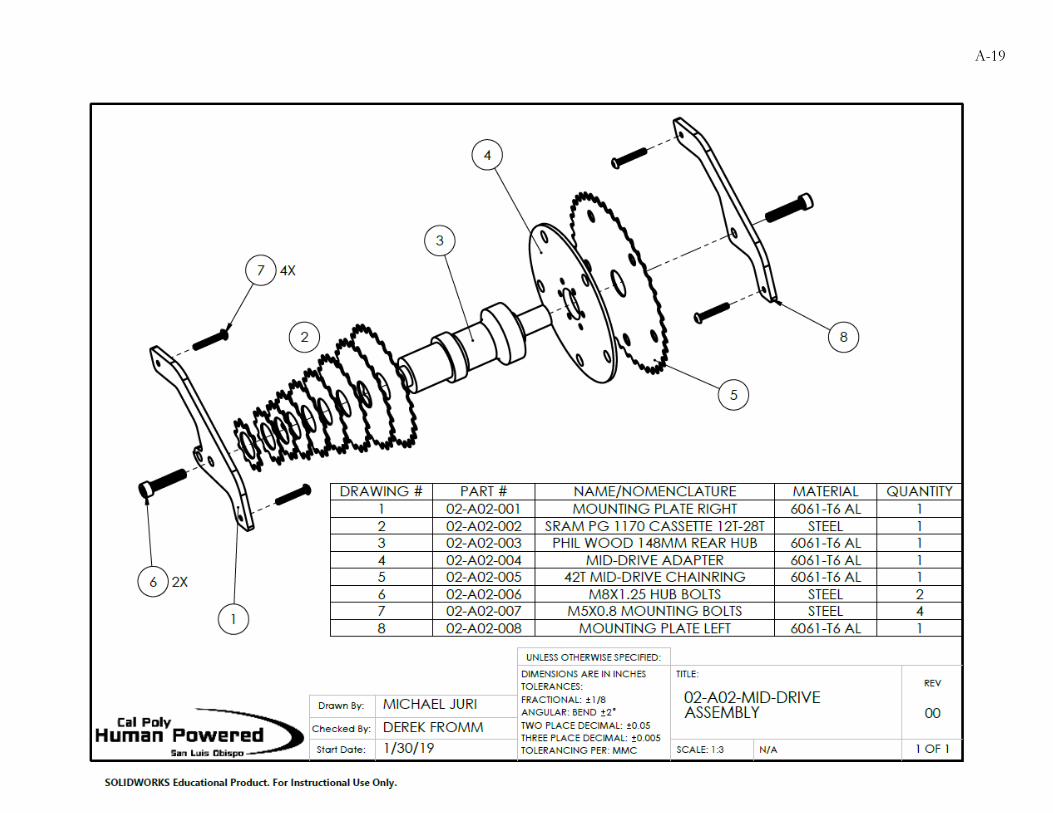
A-19

A-20
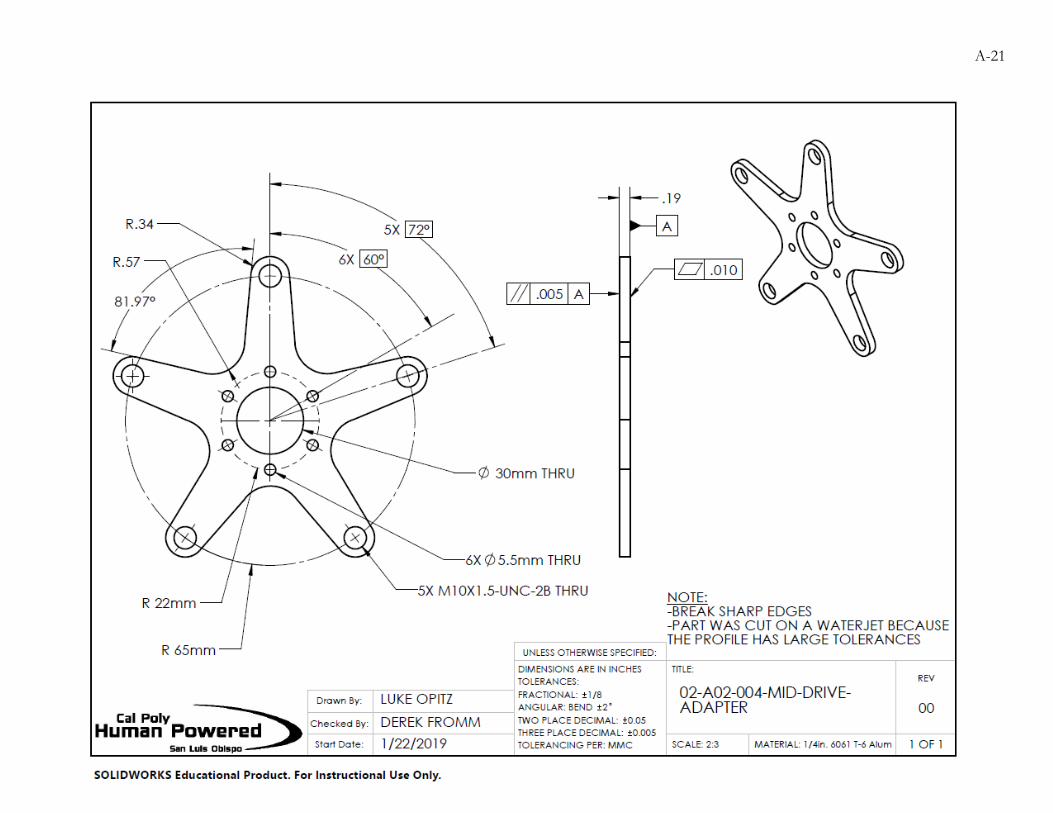
A-21
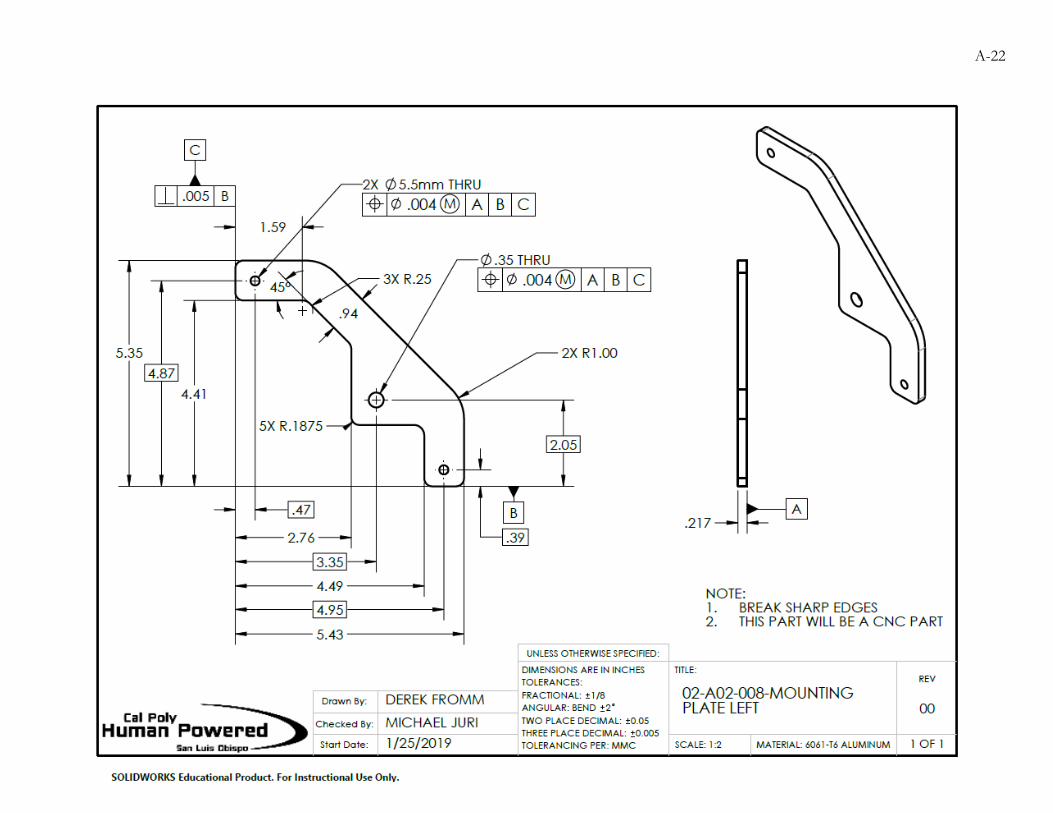
A-22
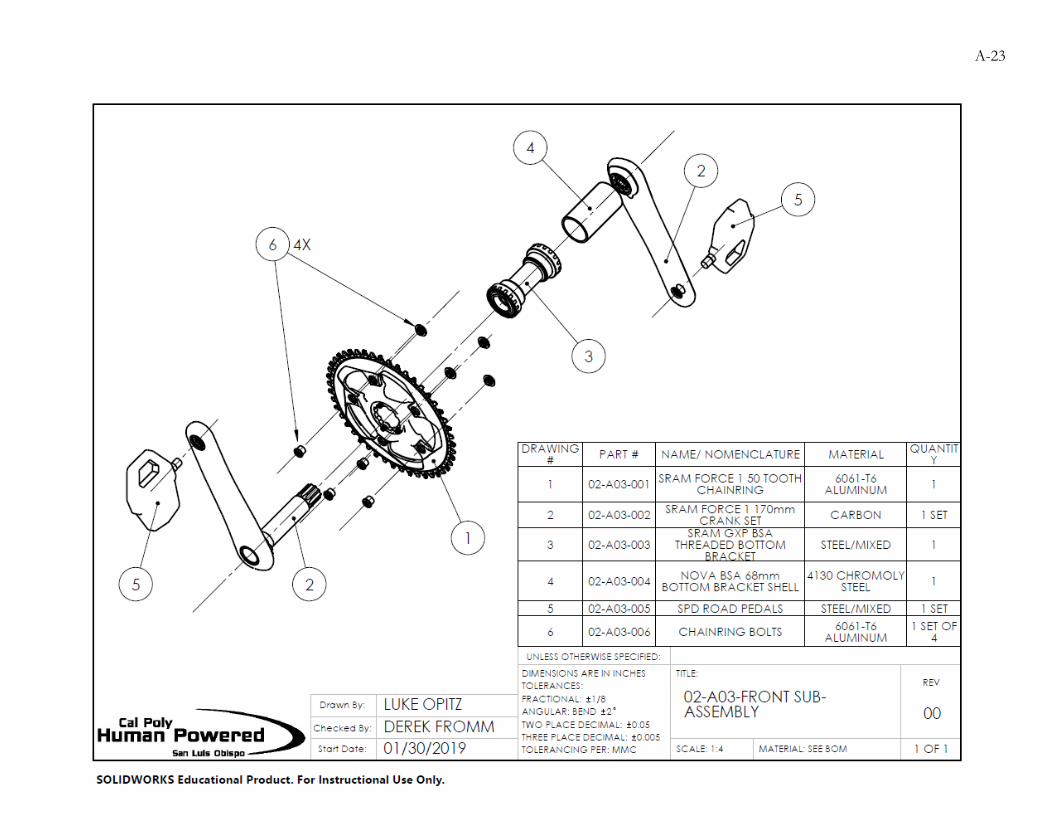
A-23
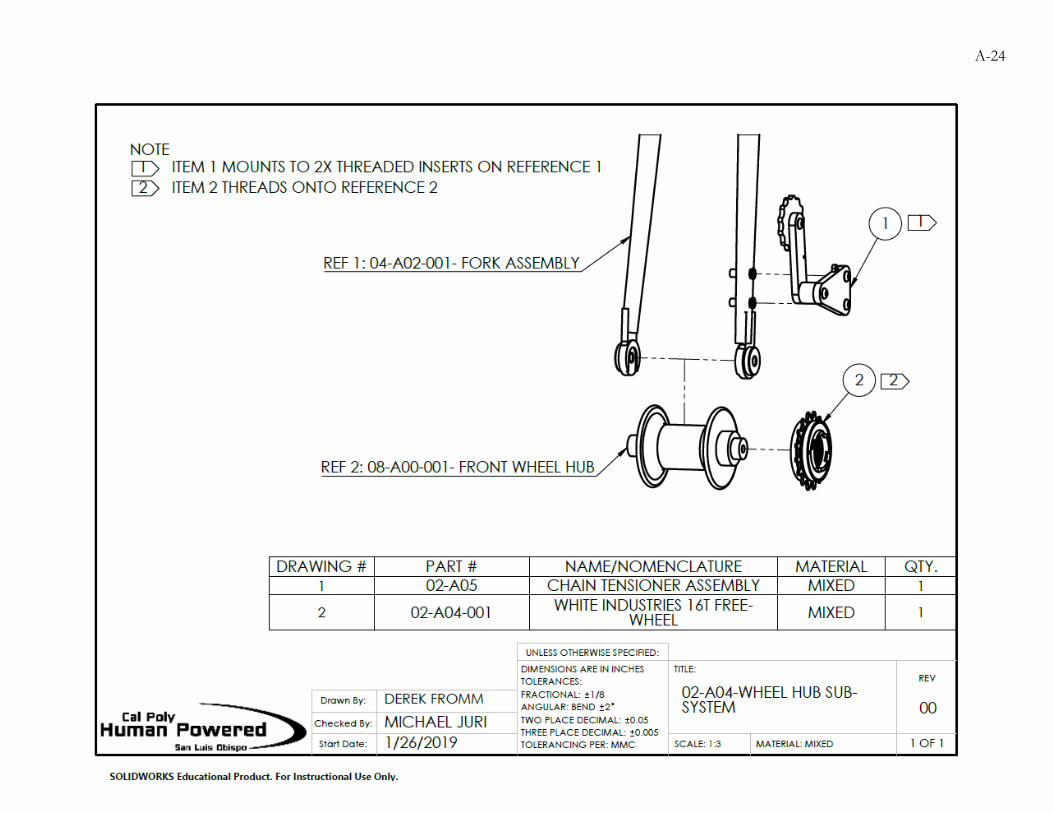
A-24

A-25

A-26
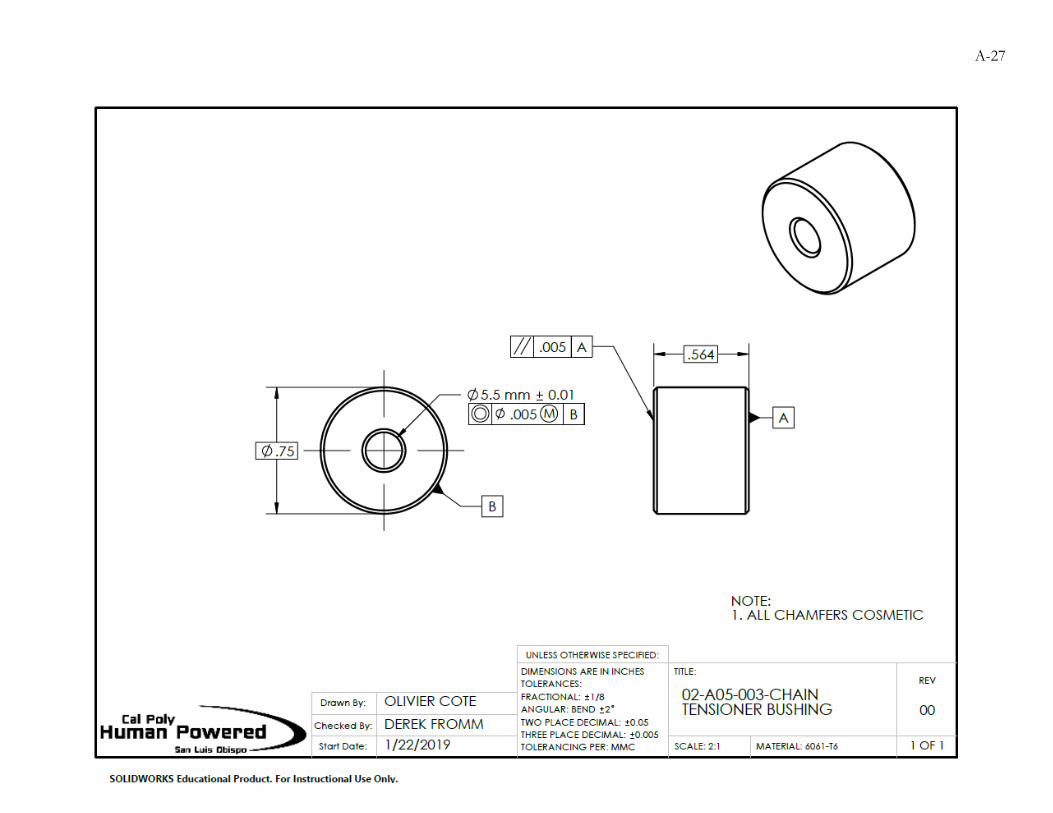
A-27
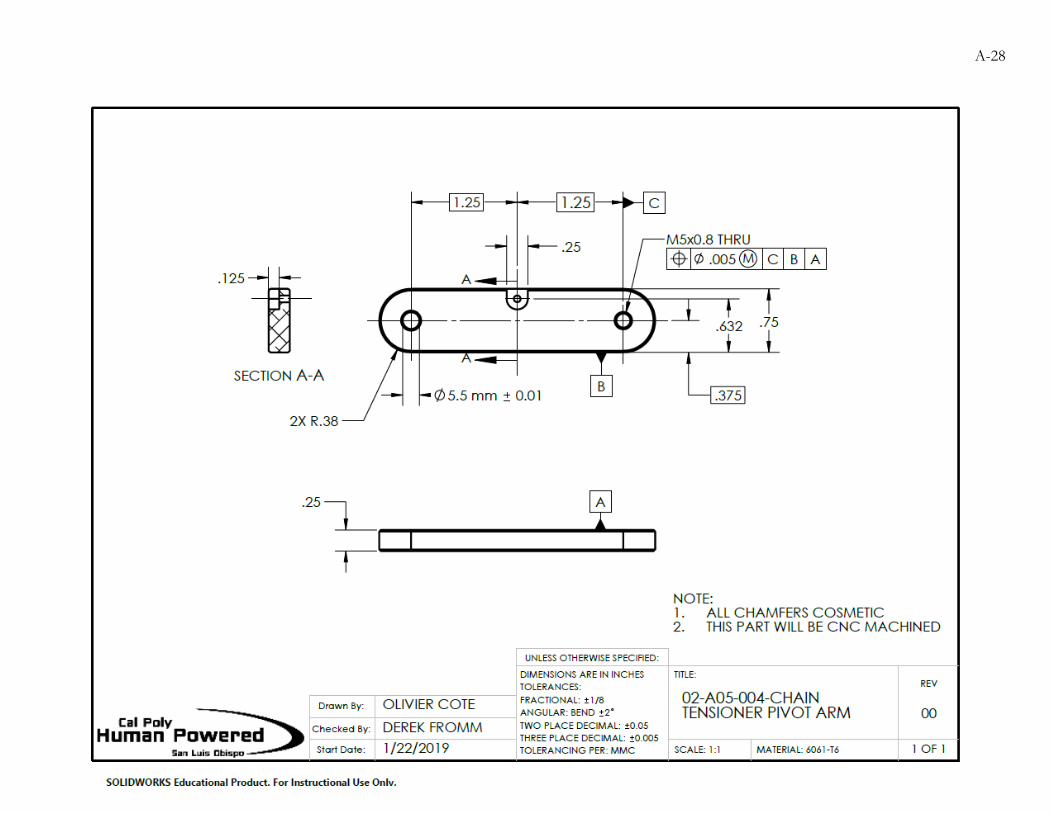
A-28

A-29
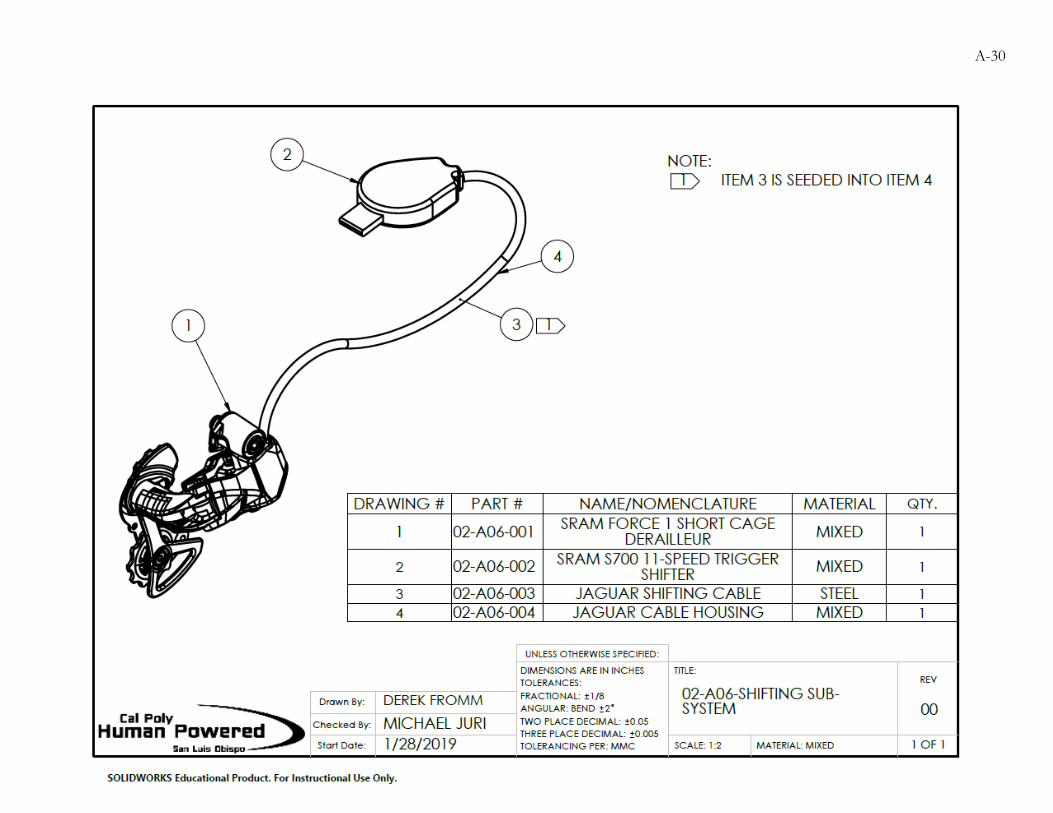
A-30
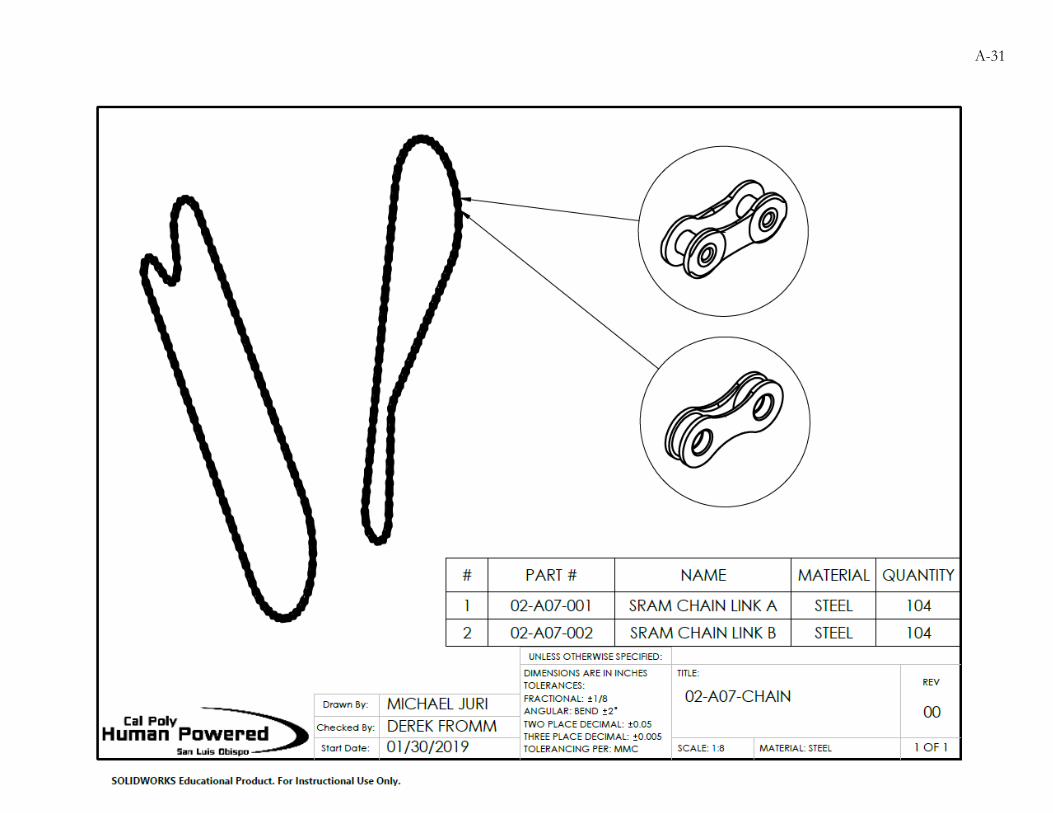
A-31
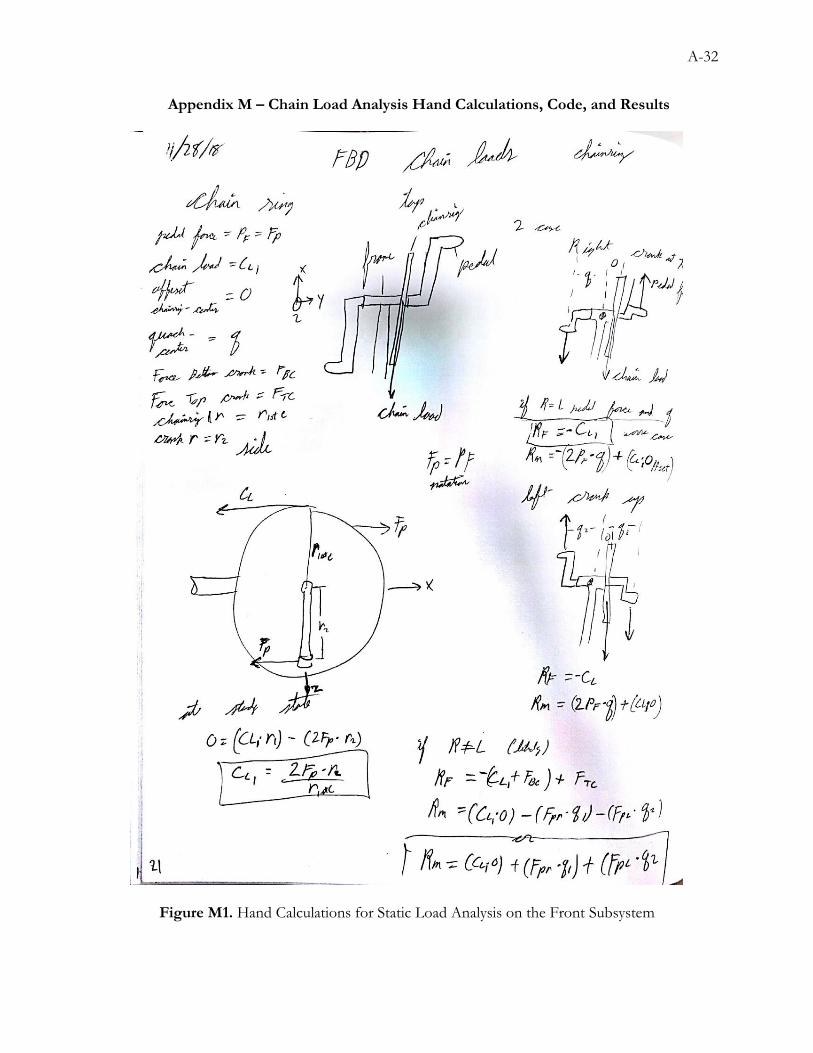
A-32
Appendix M – Chain Load Analysis Hand Calculations, Code, and Results
Figure M1. Hand Calculations for Static Load Analysis on the Front Subsystem

A-33
Figure M2. Hand Calculations for Static Load Analysis on the Mid-drive Subsystem
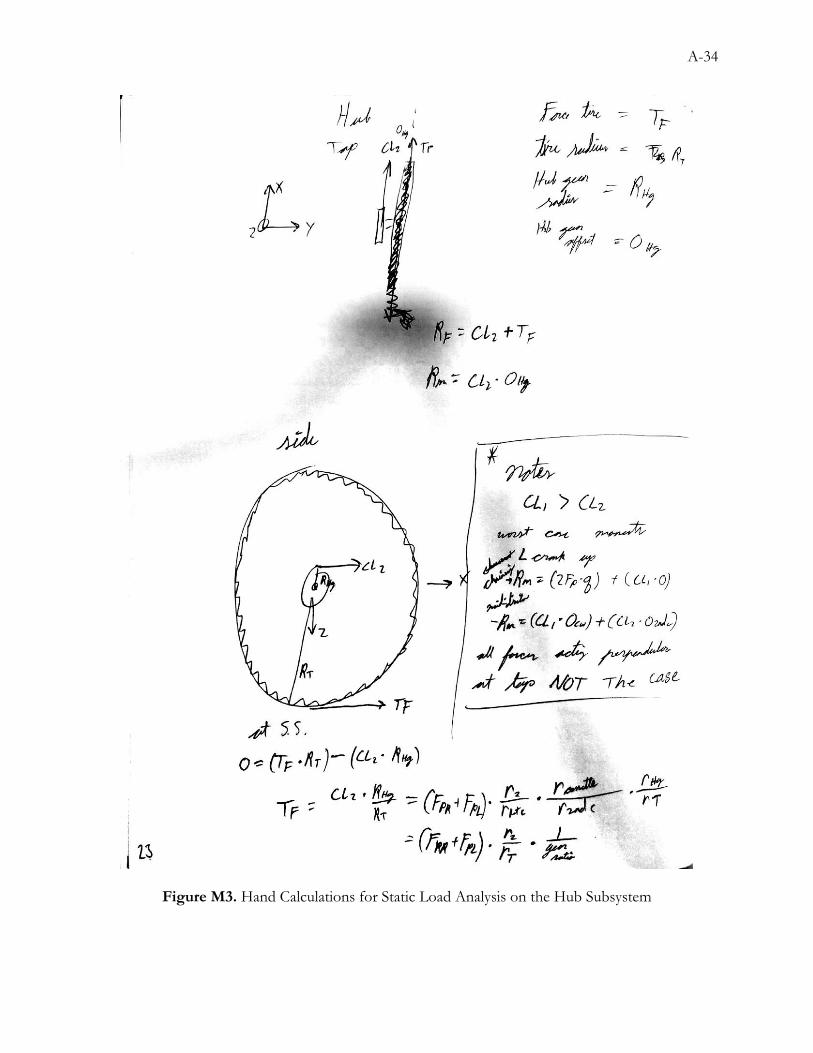
A-34
Figure M3. Hand Calculations for Static Load Analysis on the Hub Subsystem
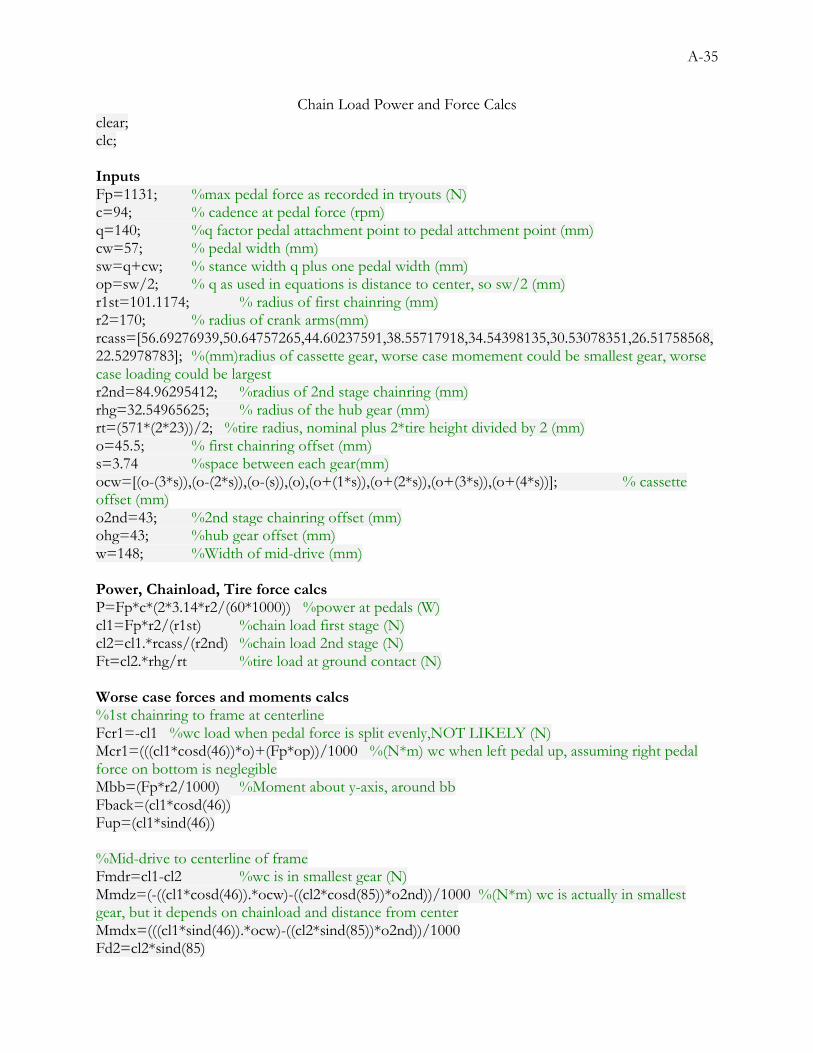
A-35
Chain Load Power and Force Calcs clear; clc; Inputs Fp=1131; %max pedal force as recorded in tryouts (N) c=94; % cadence at pedal force (rpm) q=140; %q factor pedal attachment point to pedal attchment point (mm) cw=57; % pedal width (mm) sw=q+cw; % stance width q plus one pedal width (mm) op=sw/2; % q as used in equations is distance to center, so sw/2 (mm) r1st=101.1174; % radius of first chainring (mm) r2=170; % radius of crank arms(mm) rcass=[56.69276939,50.64757265,44.60237591,38.55717918,34.54398135,30.53078351,26.51758568,22.52978783]; %(mm)radius of cassette gear, worse case momement could be smallest gear, worse case loading could be largest r2nd=84.96295412; %radius of 2nd stage chainring (mm) rhg=32.54965625; % radius of the hub gear (mm) rt=(571*(2*23))/2; %tire radius, nominal plus 2*tire height divided by 2 (mm) o=45.5; % first chainring offset (mm) s=3.74 %space between each gear(mm) ocw=[(o-(3*s)),(o-(2*s)),(o-(s)),(o),(o+(1*s)),(o+(2*s)),(o+(3*s)),(o+(4*s))]; % cassette offset (mm) o2nd=43; %2nd stage chainring offset (mm) ohg=43; %hub gear offset (mm) w=148; %Width of mid-drive (mm) Power, Chainload, Tire force calcs P=Fp*c*(2*3.14*r2/(60*1000)) %power at pedals (W) cl1=Fp*r2/(r1st) %chain load first stage (N) cl2=cl1.*rcass/(r2nd) %chain load 2nd stage (N) Ft=cl2.*rhg/rt %tire load at ground contact (N) Worse case forces and moments calcs %1st chainring to frame at centerline Fcr1=-cl1 %wc load when pedal force is split evenly,NOT LIKELY (N) Mcr1=(((cl1*cosd(46))*o)+(Fp*op))/1000 %(N*m) wc when left pedal up, assuming right pedal force on bottom is neglegible Mbb=(Fp*r2/1000) %Moment about y-axis, around bb Fback=(cl1*cosd(46)) Fup=(cl1*sind(46))
%Mid-drive to centerline of frame Fmdr=cl1-cl2 %wc is in smallest gear (N) Mmdz=(-((cl1*cosd(46)).*ocw)-((cl2*cosd(85))*o2nd))/1000 %(N*m) wc is actually in smallest gear, but it depends on chainload and distance from center Mmdx=(((cl1*sind(46)).*ocw)-((cl2*sind(85))*o2nd))/1000 Fd2=cl2*sind(85)

A-36
Fb2=cl2*cosd(85) Fxr=((-Fb2*((w/2)-o2nd))+(Fback.*((w/2)+ocw)))./w Fzr=((Fd2*((w/2)-o2nd))+(Fup.*((w/2)+ocw)))./w Fxl=((Fb2*((w/2)+o2nd))-(Fback.*((w/2)-ocw)))./w Fzl=((Fd2*((w/2)+o2nd))-(Fup.*((w/2)-ocw)))./w
%Hub to fork Fh=cl2+Ft %wc note pulling forward on gear, NOT ACCURATE, worse case (N) Mh=cl2*ohg/1000 %TORQUE STEER, note worse case due to assuming perpendicular (N*m)
Figure M4. Matlab Code for Solving the Equations Derived in Figure M1-3.
Table M5. Results for Chain Loads, Resulting Forces, and Moments
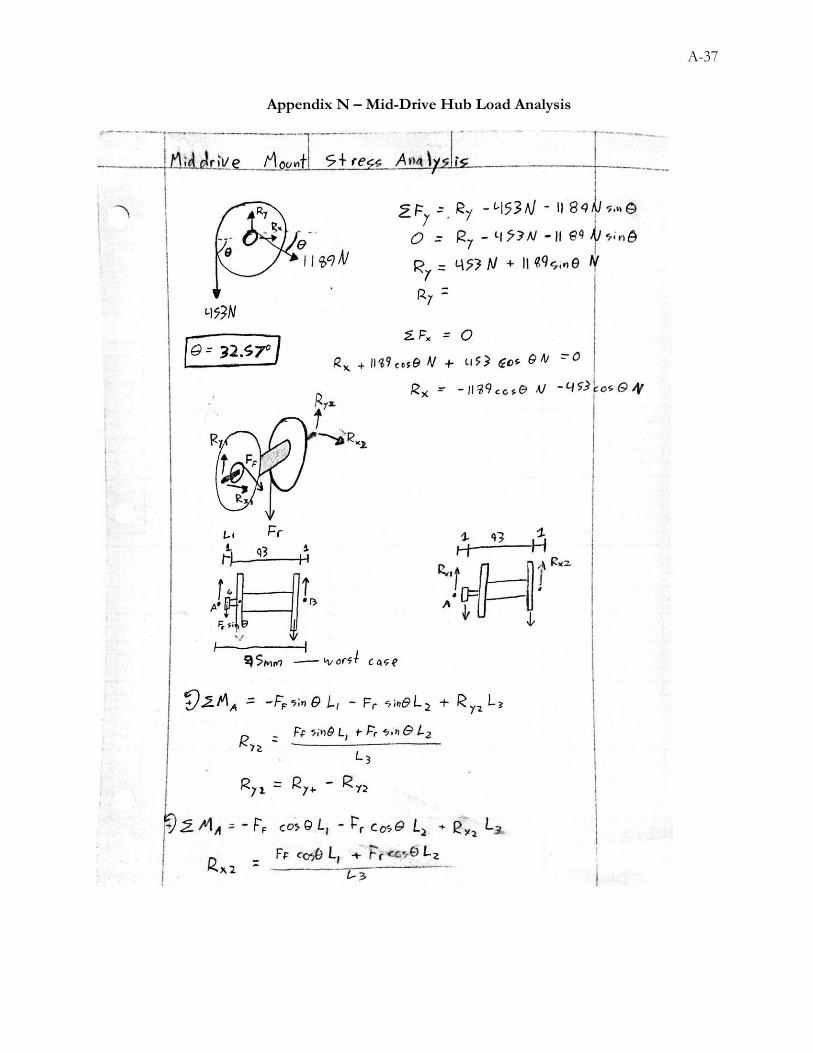
A-37
Appendix N – Mid-Drive Hub Load Analysis

A-38
Appendix O – Torque Steering Analysis
Table O1- Torque Steer Analysis Setup and Results
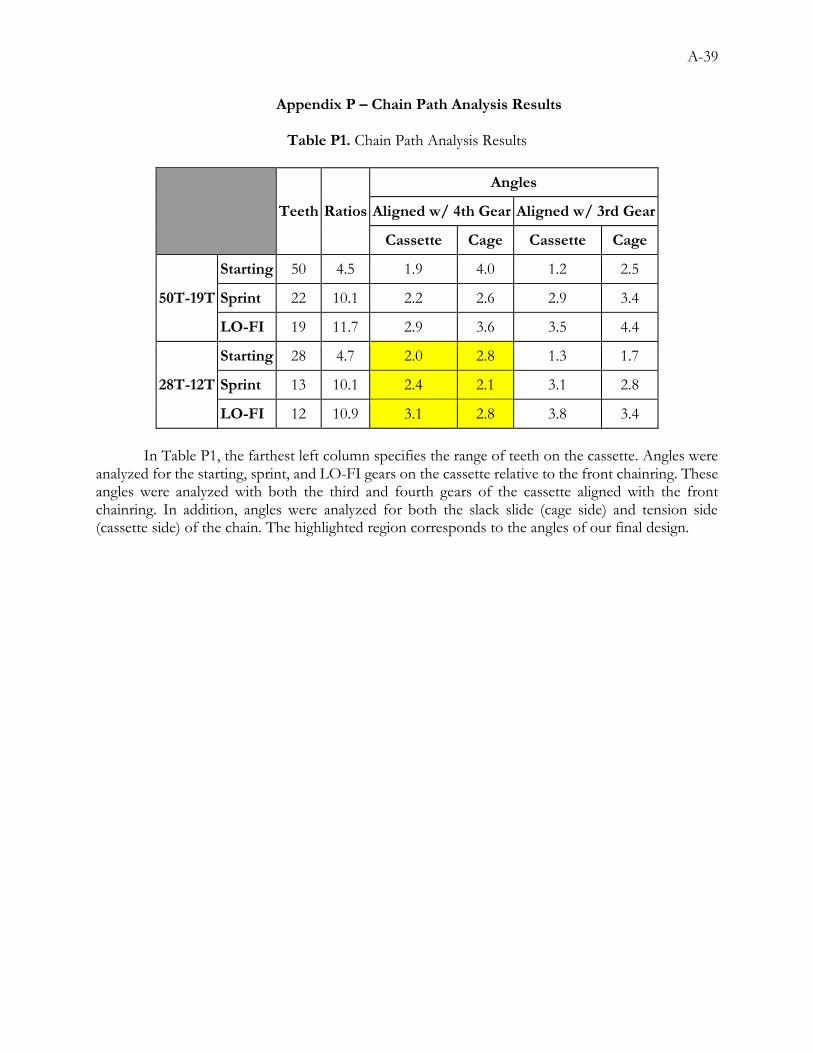
A-39
Appendix P – Chain Path Analysis Results
Table P1. Chain Path Analysis Results
Teeth Ratios
Angles
Aligned w/ 4th Gear Aligned w/ 3rd Gear
Cassette Cage Cassette Cage
50T-19T
Starting 50 4.5 1.9 4.0 1.2 2.5
Sprint 22 10.1 2.2 2.6 2.9 3.4
LO-FI 19 11.7 2.9 3.6 3.5 4.4
28T-12T
Starting 28 4.7 2.0 2.8 1.3 1.7
Sprint 13 10.1 2.4 2.1 3.1 2.8
LO-FI 12 10.9 3.1 2.8 3.8 3.4
In Table P1, the farthest left column specifies the range of teeth on the cassette. Angles were analyzed for the starting, sprint, and LO-FI gears on the cassette relative to the front chainring. These angles were analyzed with both the third and fourth gears of the cassette aligned with the front chainring. In addition, angles were analyzed for both the slack slide (cage side) and tension side (cassette side) of the chain. The highlighted region corresponds to the angles of our final design.

A-40
Appendix Q – Risk Assessment
Figure Q1. System hazards before mitigation.
Figure Q2. System hazards after mitigation
A-41
Failure Modes Analyzed
Component Failure - Moderate Risk ➝ Minor Risk
o ☑ Designed out Designed and chose components based off FEA analysis and manufacturer
ratings (Team, completed) Test equipment in a safe environment (Olivier)
Rider Leg Impacts Components - Minor Risk ➝ Negligible Risk
o ☑ Designed out Placed gears far away from rider legs, validated with CAD and spatial checks
with rider in a non-moving environment (Team, completed) Re-designed gears in order to create space (Team, completed)
o Added protection Add guards to potentially dangerous components (Derek, June)
Wheel cover Second Chain Reduction
Pinch Points - Minor Risk ➝ Negligible Risk
o Added protection Constructed of smooth guards (fiberglass) around sharp/pinch points
(Derek) Mid-Drive assembly Derailleur
☑ Smoothed edges of custom parts (Olivier) PPE for high risk areas on rider legs (Luke)
Chain Derailment - Serious Risk ➝ Moderate Risk
o ☑ Designed out Analyzed and designed chainline to decrease the chance of derailment
(Michael)
o ☑ Added protection Used narrow-wide chainrings
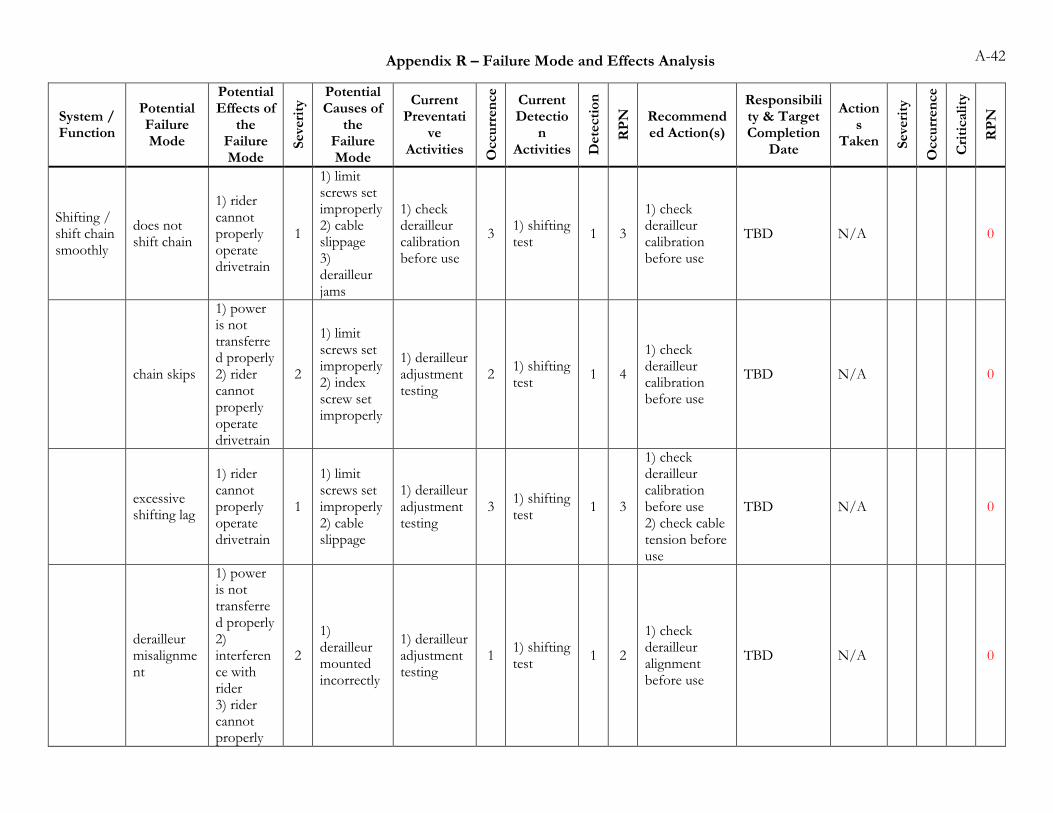
A-42
System / Function
Potential Failure Mode
Potential Effects of
the Failure Mode
Seve
rity
Potential Causes of
the Failure Mode
Current Preventati
ve Activities
Occu
rren
ce
Current Detectio
n Activities D
ete
cti
on
RP
N
Recommended Action(s)
Responsibility & Target Completion
Date
Actions
Taken Seve
rity
Occu
rren
ce
Cri
ticali
ty
RP
N
Shifting / shift chain smoothly
does not shift chain
1) rider cannot properly operate drivetrain
1
1) limit screws set improperly 2) cable slippage 3) derailleur jams
1) check derailleur calibration before use
3 1) shifting test
1 3
1) check derailleur calibration before use
TBD N/A 0
chain skips
1) power is not transferred properly 2) rider cannot properly operate drivetrain
2
1) limit screws set improperly 2) index screw set improperly
1) derailleur adjustment testing
2 1) shifting test
1 4
1) check derailleur calibration before use
TBD N/A 0
excessive shifting lag
1) rider cannot properly operate drivetrain
1
1) limit screws set improperly 2) cable slippage
1) derailleur adjustment testing
3 1) shifting test
1 3
1) check derailleur calibration before use 2) check cable tension before use
TBD N/A 0
derailleur misalignment
1) power is not transferred properly 2) interference with rider 3) rider cannot properly
2
1) derailleur mounted incorrectly
1) derailleur adjustment testing
1 1) shifting test
1 2
1) check derailleur alignment before use
TBD N/A 0
Appendix R – Failure Mode and Effects Analysis
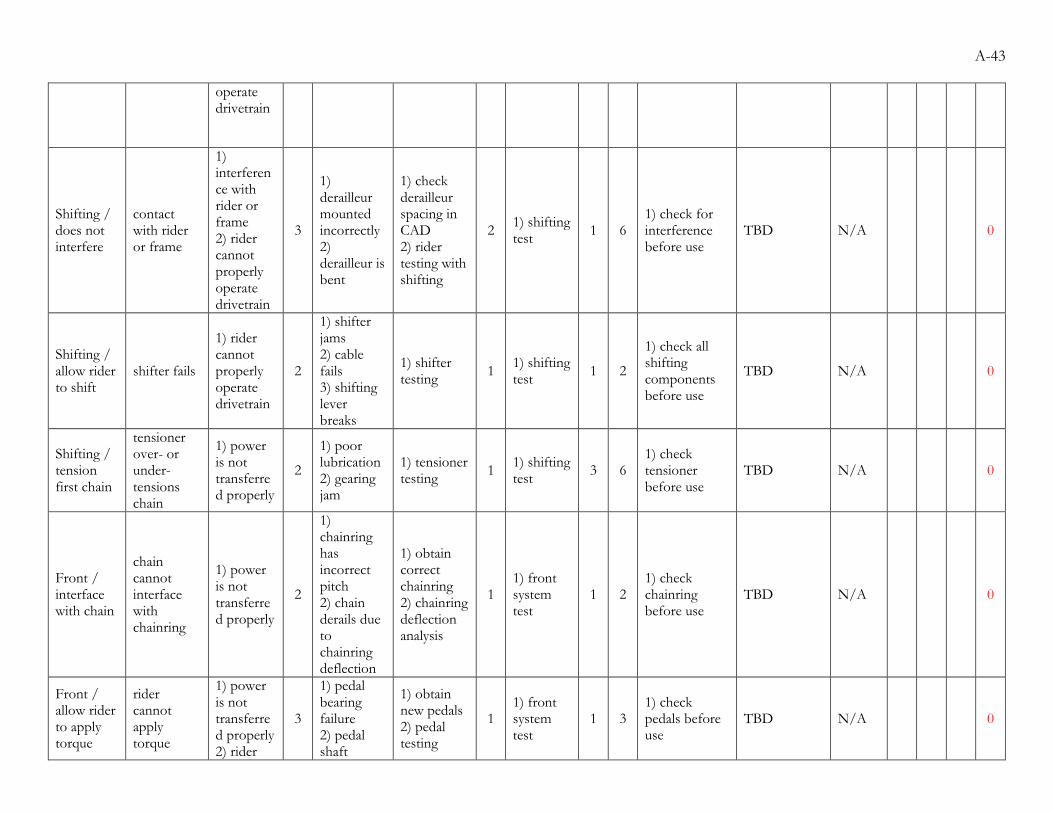
A-43
operate drivetrain
Shifting / does not interfere
contact with rider or frame
1) interference with rider or frame 2) rider cannot properly operate drivetrain
3
1) derailleur mounted incorrectly 2) derailleur is bent
1) check derailleur spacing in CAD 2) rider testing with shifting
2 1) shifting test
1 6 1) check for interference before use
TBD N/A 0
Shifting / allow rider to shift
shifter fails
1) rider cannot properly operate drivetrain
2
1) shifter jams 2) cable fails 3) shifting lever breaks
1) shifter testing
1 1) shifting test
1 2
1) check all shifting components before use
TBD N/A 0
Shifting / tension first chain
tensioner over- or under-tensions chain
1) power is not transferred properly
2
1) poor lubrication 2) gearing jam
1) tensioner testing
1 1) shifting test
3 6 1) check tensioner before use
TBD N/A 0
Front / interface with chain
chain cannot interface with chainring
1) power is not transferred properly
2
1) chainring has incorrect pitch 2) chain derails due to chainring deflection
1) obtain correct chainring 2) chainring deflection analysis
1 1) front system test
1 2 1) check chainring before use
TBD N/A 0
Front / allow rider to apply torque
rider cannot apply torque
1) power is not transferred properly 2) rider
3
1) pedal bearing failure 2) pedal shaft
1) obtain new pedals 2) pedal testing
1 1) front system test
1 3 1) check pedals before use
TBD N/A 0
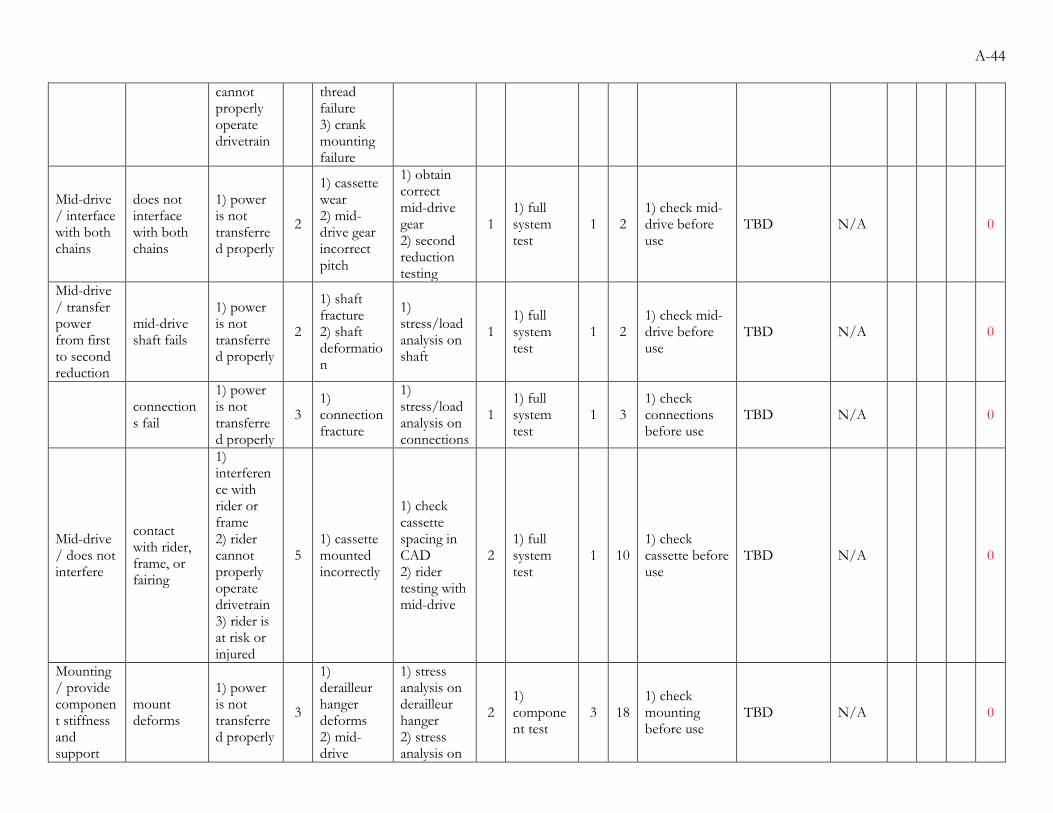
A-44
cannot properly operate drivetrain
thread failure 3) crank mounting failure
Mid-drive / interface with both chains
does not interface with both chains
1) power is not transferred properly
2
1) cassette wear 2) mid-drive gear incorrect pitch
1) obtain correct mid-drive gear 2) second reduction testing
1 1) full system test
1 2 1) check mid-drive before use
TBD N/A 0
Mid-drive / transfer power from first to second reduction
mid-drive shaft fails
1) power is not transferred properly
2
1) shaft fracture 2) shaft deformation
1) stress/load analysis on shaft
1 1) full system test
1 2 1) check mid-drive before use
TBD N/A 0
connections fail
1) power is not transferred properly
3 1) connection fracture
1) stress/load analysis on connections
1 1) full system test
1 3 1) check connections before use
TBD N/A 0
Mid-drive / does not interfere
contact with rider, frame, or fairing
1) interference with rider or frame 2) rider cannot properly operate drivetrain 3) rider is at risk or injured
5 1) cassette mounted incorrectly
1) check cassette spacing in CAD 2) rider testing with mid-drive
2 1) full system test
1 10 1) check cassette before use
TBD N/A 0
Mounting / provide component stiffness and support
mount deforms
1) power is not transferred properly
3
1) derailleur hanger deforms 2) mid-drive
1) stress analysis on derailleur hanger 2) stress analysis on
2 1) component test
3 18 1) check mounting before use
TBD N/A 0
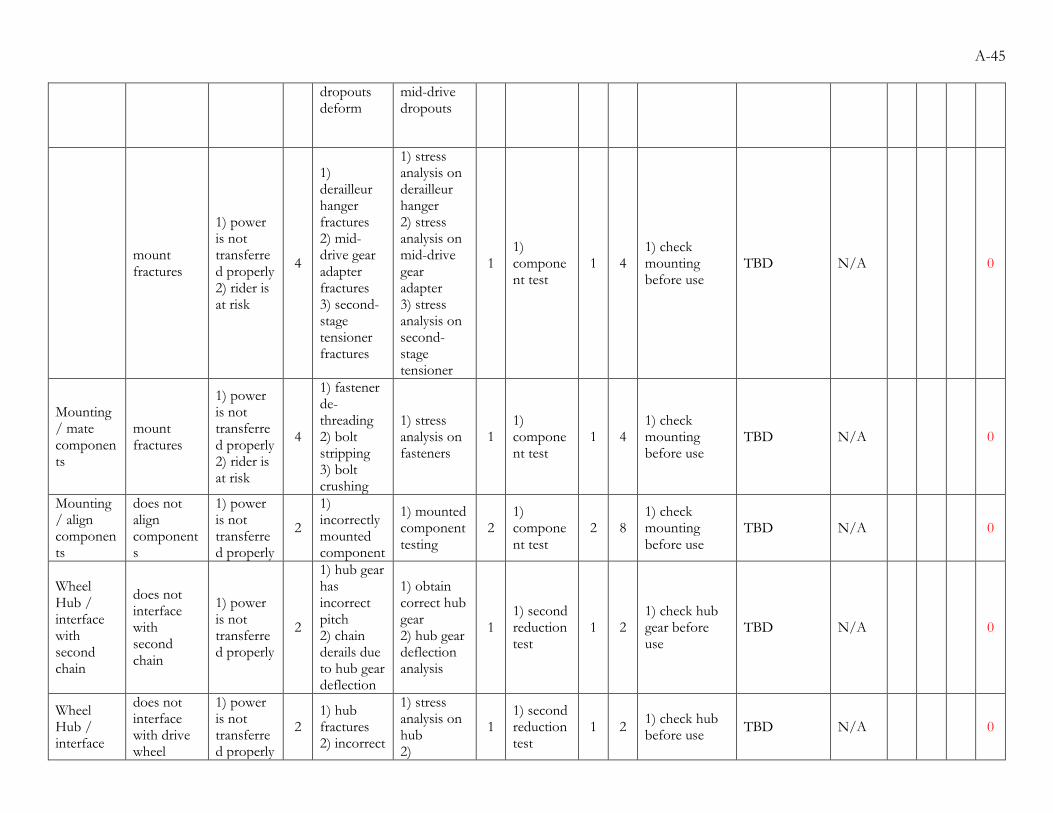
A-45
dropouts deform
mid-drive dropouts
mount fractures
1) power is not transferred properly 2) rider is at risk
4
1) derailleur hanger fractures 2) mid-drive gear adapter fractures 3) second-stage tensioner fractures
1) stress analysis on derailleur hanger 2) stress analysis on mid-drive gear adapter 3) stress analysis on second-stage tensioner
1 1) component test
1 4 1) check mounting before use
TBD N/A 0
Mounting / mate components
mount fractures
1) power is not transferred properly 2) rider is at risk
4
1) fastener de-threading 2) bolt stripping 3) bolt crushing
1) stress analysis on fasteners
1 1) component test
1 4 1) check mounting before use
TBD N/A 0
Mounting / align components
does not align components
1) power is not transferred properly
2
1) incorrectly mounted component
1) mounted component testing
2 1) component test
2 8 1) check mounting before use
TBD N/A 0
Wheel Hub / interface with second chain
does not interface with second chain
1) power is not transferred properly
2
1) hub gear has incorrect pitch 2) chain derails due to hub gear deflection
1) obtain correct hub gear 2) hub gear deflection analysis
1 1) second reduction test
1 2 1) check hub gear before use
TBD N/A 0
Wheel Hub / interface
does not interface with drive wheel
1) power is not transferred properly
2 1) hub fractures 2) incorrect
1) stress analysis on hub 2)
1 1) second reduction test
1 2 1) check hub before use
TBD N/A 0
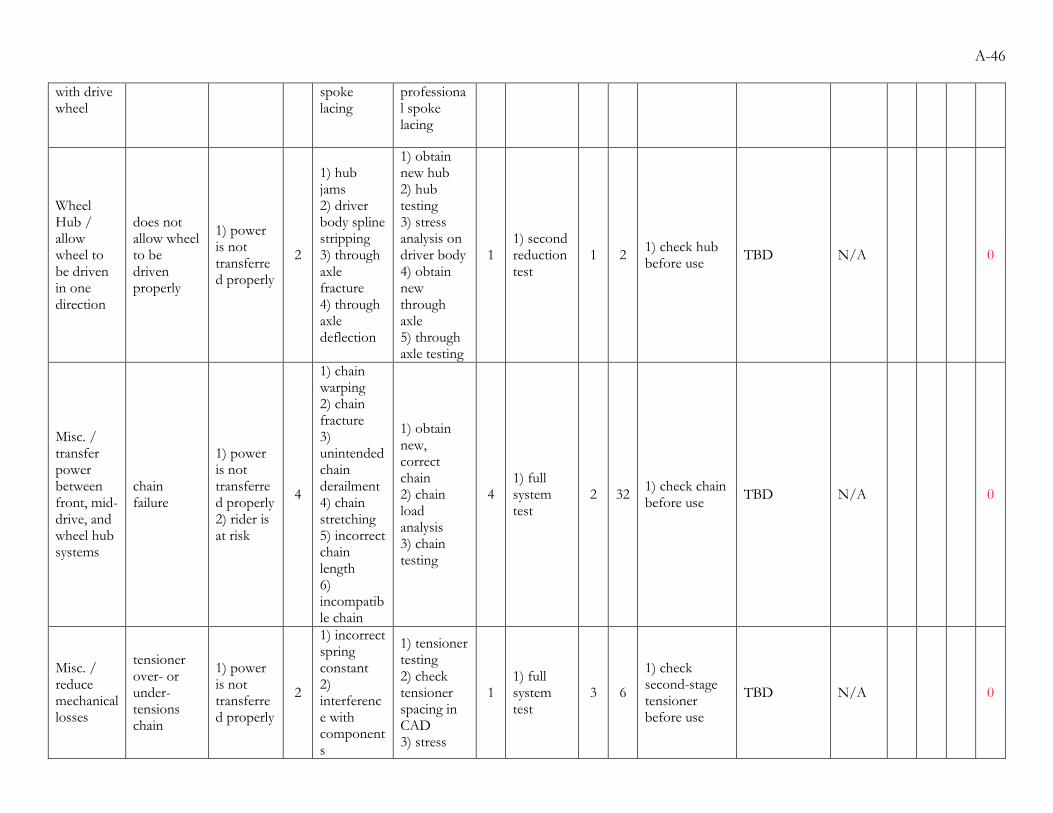
A-46
with drive wheel
spoke lacing
professional spoke lacing
Wheel Hub / allow wheel to be driven in one direction
does not allow wheel to be driven properly
1) power is not transferred properly
2
1) hub jams 2) driver body spline stripping 3) through axle fracture 4) through axle deflection
1) obtain new hub 2) hub testing 3) stress analysis on driver body 4) obtain new through axle 5) through axle testing
1 1) second reduction test
1 2 1) check hub before use
TBD N/A 0
Misc. / transfer power between front, mid-drive, and wheel hub systems
chain failure
1) power is not transferred properly 2) rider is at risk
4
1) chain warping 2) chain fracture 3) unintended chain derailment 4) chain stretching 5) incorrect chain length 6) incompatible chain
1) obtain new, correct chain 2) chain load analysis 3) chain testing
4 1) full system test
2 32 1) check chain before use
TBD N/A 0
Misc. / reduce mechanical losses
tensioner over- or under-tensions chain
1) power is not transferred properly
2
1) incorrect spring constant 2) interference with components
1) tensioner testing 2) check tensioner spacing in CAD 3) stress
1 1) full system test
3 6
1) check second-stage tensioner before use
TBD N/A 0
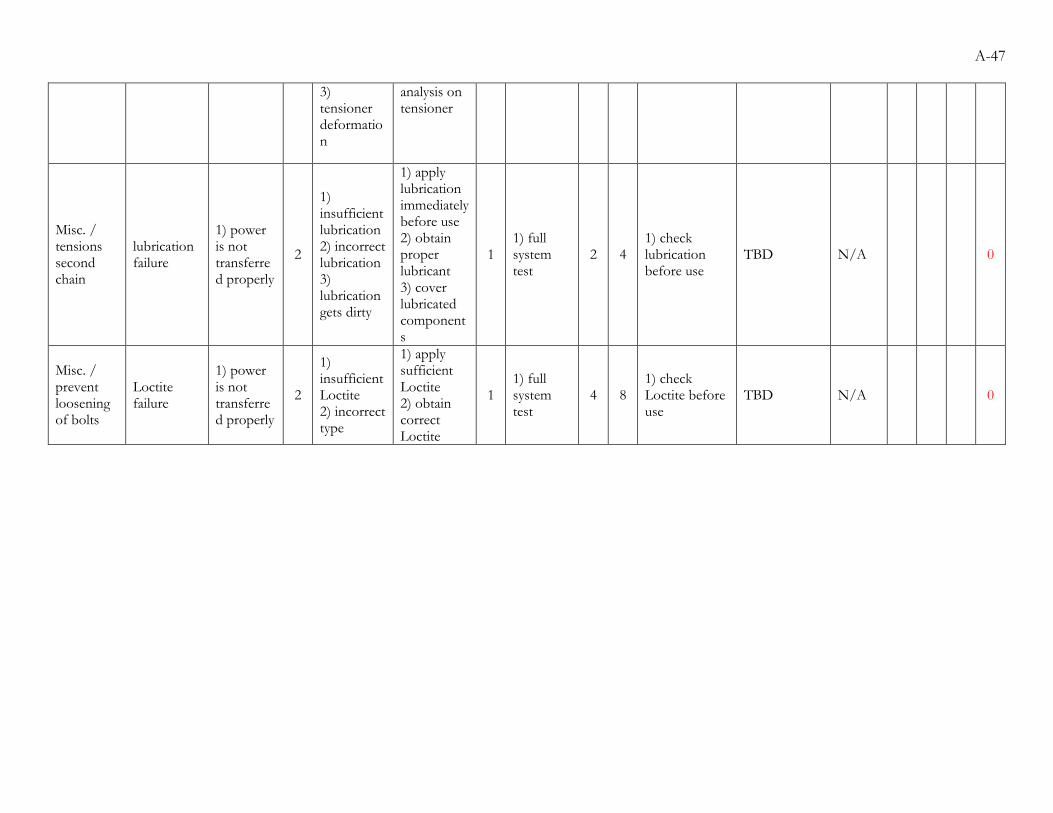
A-47
3) tensioner deformation
analysis on tensioner
Misc. / tensions second chain
lubrication failure
1) power is not transferred properly
2
1) insufficient lubrication 2) incorrect lubrication 3) lubrication gets dirty
1) apply lubrication immediately before use 2) obtain proper lubricant 3) cover lubricated components
1 1) full system test
2 4 1) check lubrication before use
TBD N/A 0
Misc. / prevent loosening of bolts
Loctite failure
1) power is not transferred properly
2
1) insufficient Loctite 2) incorrect type
1) apply sufficient Loctite 2) obtain correct Loctite
1 1) full system test
4 8 1) check Loctite before use
TBD N/A 0
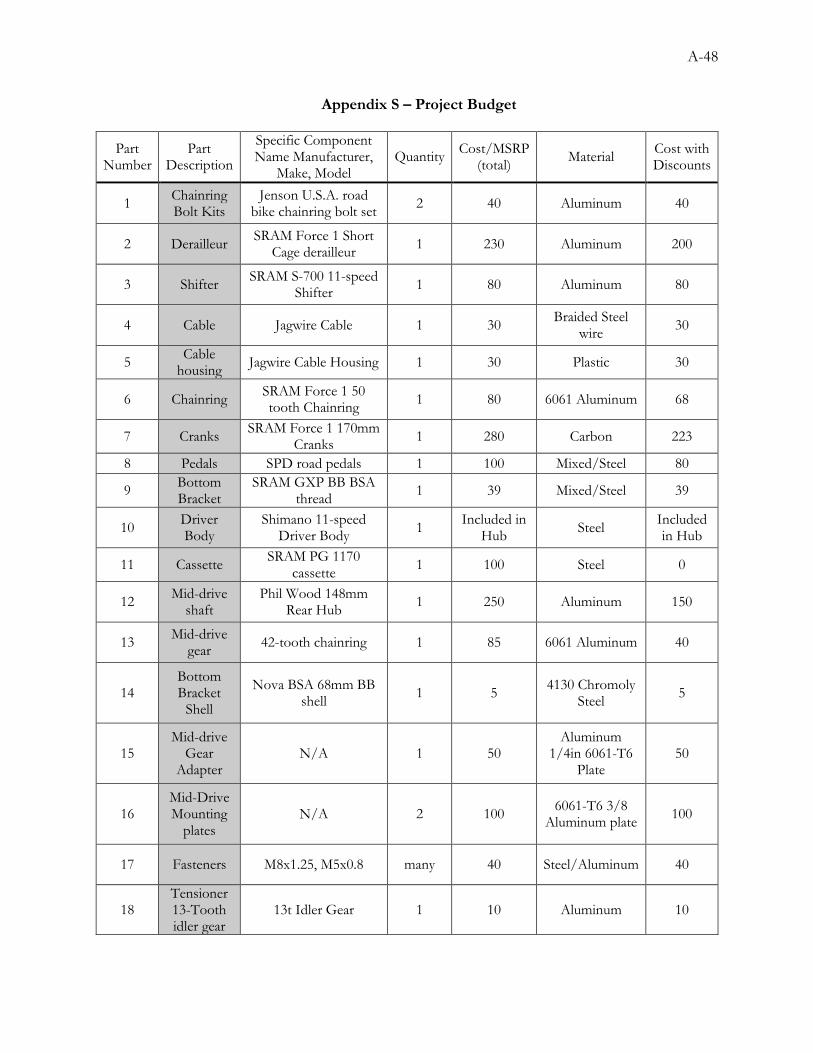
A-48
Appendix S – Project Budget
Part Number
Part Description
Specific Component Name Manufacturer,
Make, Model Quantity
Cost/MSRP (total)
Material Cost with Discounts
1 Chainring Bolt Kits
Jenson U.S.A. road bike chainring bolt set
2 40 Aluminum 40
2 Derailleur SRAM Force 1 Short
Cage derailleur 1 230 Aluminum 200
3 Shifter SRAM S-700 11-speed
Shifter 1 80 Aluminum 80
4 Cable Jagwire Cable 1 30 Braided Steel
wire 30
5 Cable
housing Jagwire Cable Housing 1 30 Plastic 30
6 Chainring SRAM Force 1 50 tooth Chainring
1 80 6061 Aluminum 68
7 Cranks SRAM Force 1 170mm
Cranks 1 280 Carbon 223
8 Pedals SPD road pedals 1 100 Mixed/Steel 80
9 Bottom Bracket
SRAM GXP BB BSA thread
1 39 Mixed/Steel 39
10 Driver Body
Shimano 11-speed Driver Body
1 Included in
Hub Steel
Included in Hub
11 Cassette SRAM PG 1170
cassette 1 100 Steel 0
12 Mid-drive
shaft Phil Wood 148mm
Rear Hub 1 250 Aluminum 150
13 Mid-drive
gear 42-tooth chainring 1 85 6061 Aluminum 40
14 Bottom Bracket
Shell
Nova BSA 68mm BB shell
1 5 4130 Chromoly
Steel 5
15 Mid-drive
Gear Adapter
N/A 1 50 Aluminum
1/4in 6061-T6 Plate
50
16 Mid-Drive Mounting
plates N/A 2 100
6061-T6 3/8 Aluminum plate
100
17 Fasteners M8x1.25, M5x0.8 many 40 Steel/Aluminum 40
18 Tensioner 13-Tooth idler gear
13t Idler Gear 1 10 Aluminum 10
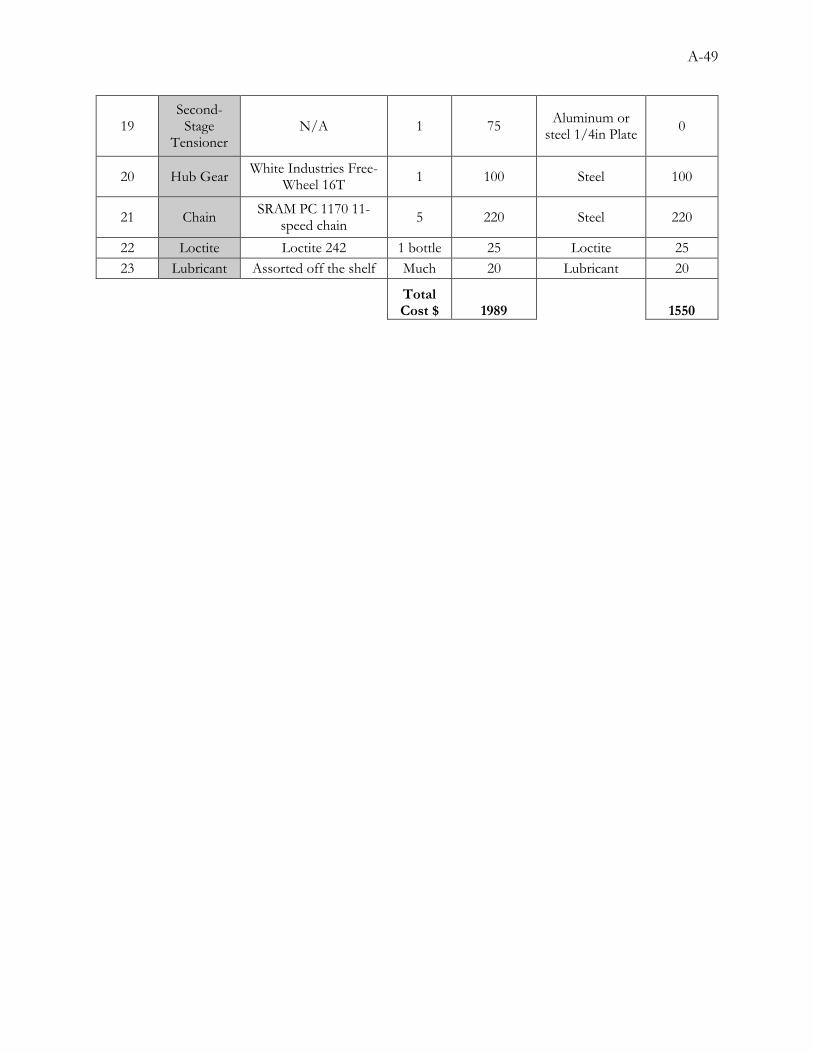
A-49
19 Second-
Stage Tensioner
N/A 1 75 Aluminum or
steel 1/4in Plate 0
20 Hub Gear White Industries Free-
Wheel 16T 1 100 Steel 100
21 Chain SRAM PC 1170 11-
speed chain 5 220 Steel 220
22 Loctite Loctite 242 1 bottle 25 Loctite 25
23 Lubricant Assorted off the shelf Much 20 Lubricant 20
Total Cost $ 1989 1550
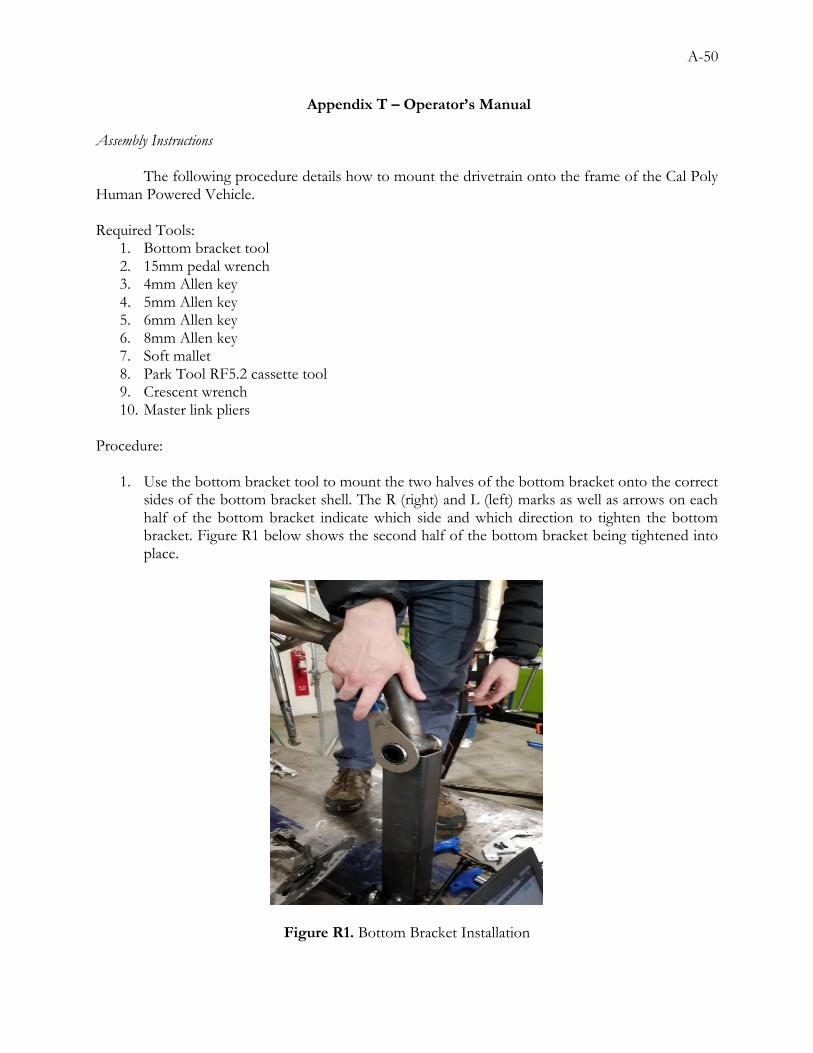
A-50
Appendix T – Operator’s Manual Assembly Instructions The following procedure details how to mount the drivetrain onto the frame of the Cal Poly Human Powered Vehicle. Required Tools:
1. Bottom bracket tool 2. 15mm pedal wrench 3. 4mm Allen key 4. 5mm Allen key 5. 6mm Allen key 6. 8mm Allen key 7. Soft mallet 8. Park Tool RF5.2 cassette tool 9. Crescent wrench 10. Master link pliers
Procedure:
1. Use the bottom bracket tool to mount the two halves of the bottom bracket onto the correct sides of the bottom bracket shell. The R (right) and L (left) marks as well as arrows on each half of the bottom bracket indicate which side and which direction to tighten the bottom bracket. Figure R1 below shows the second half of the bottom bracket being tightened into place.
Figure R1. Bottom Bracket Installation
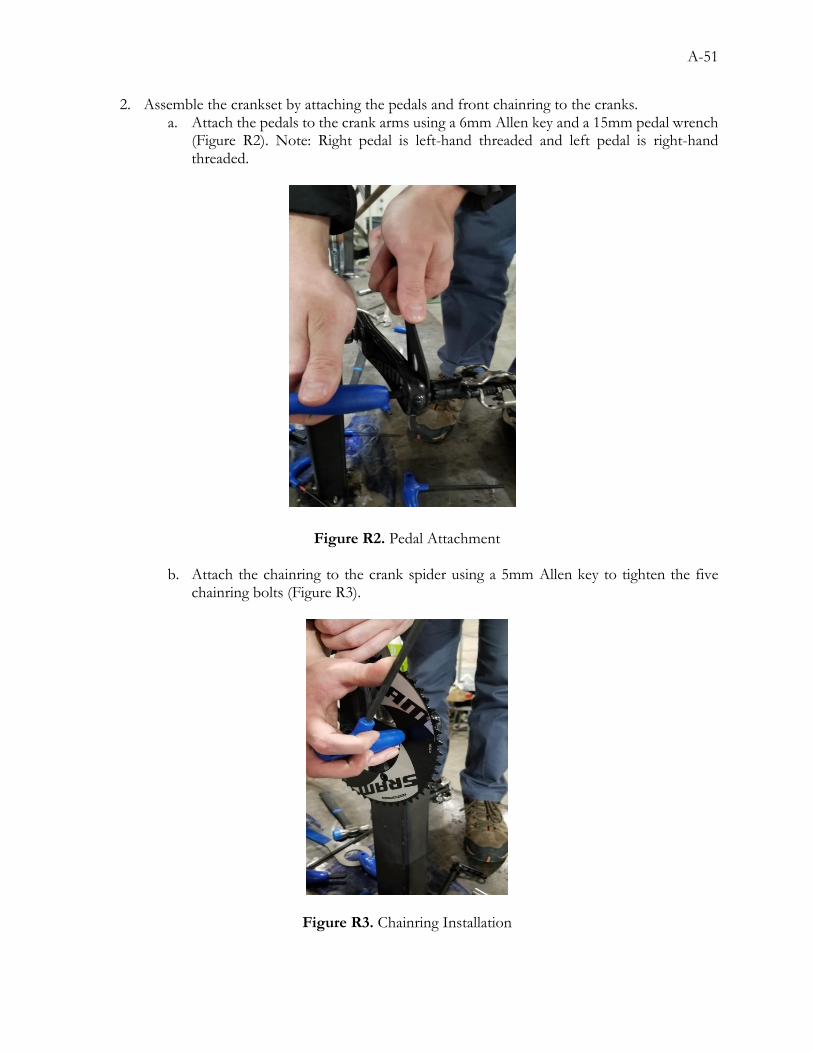
A-51
2. Assemble the crankset by attaching the pedals and front chainring to the cranks. a. Attach the pedals to the crank arms using a 6mm Allen key and a 15mm pedal wrench
(Figure R2). Note: Right pedal is left-hand threaded and left pedal is right-hand threaded.
Figure R2. Pedal Attachment
b. Attach the chainring to the crank spider using a 5mm Allen key to tighten the five chainring bolts (Figure R3).
Figure R3. Chainring Installation

A-52
3. Slide crankset shaft through bottom bracket and fasten left crank arm using an 8mm Allen key (Figure R4). Note: Tighten to torque settings specified on left crank arm.
Figure R4. Crankset Assembly Mounting
4. Attach right and left mid-drive mounts to the frame using a 4mm Allen key to tighten the M5x0.8 mounting bolts into the mid-drive bosses on the frame (Figure R5).
Figure R5. Mid-drive Mount Installation
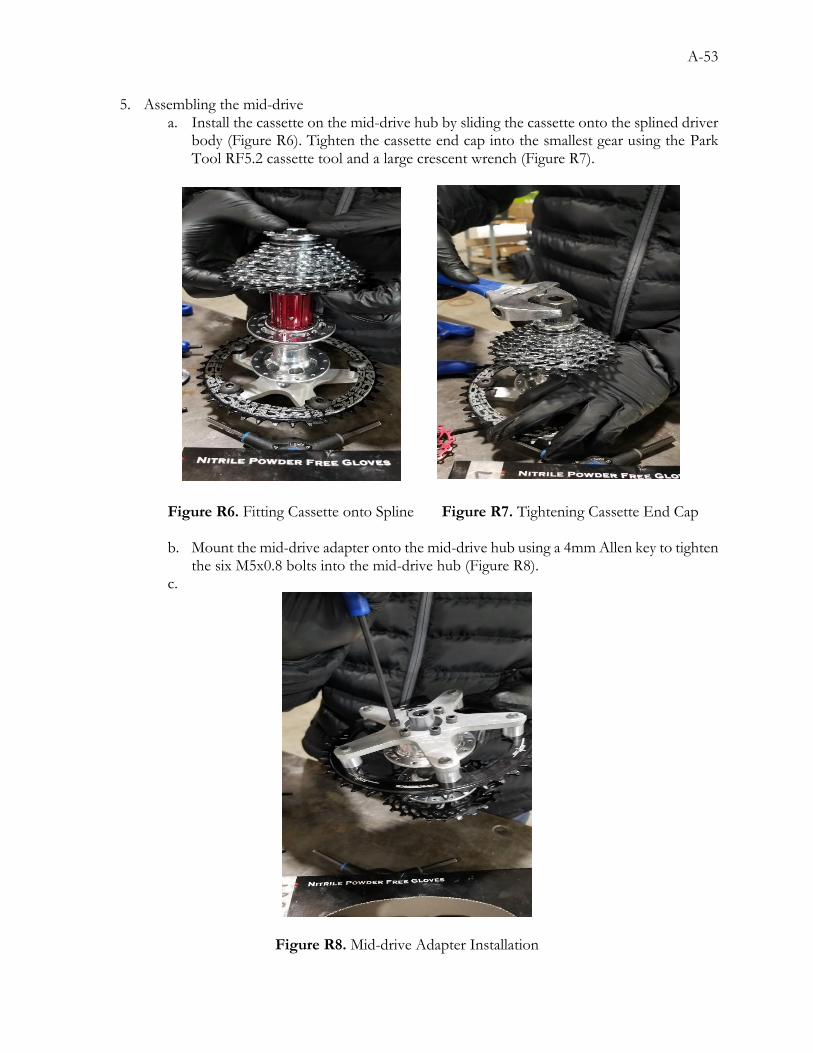
A-53
5. Assembling the mid-drive a. Install the cassette on the mid-drive hub by sliding the cassette onto the splined driver
body (Figure R6). Tighten the cassette end cap into the smallest gear using the Park Tool RF5.2 cassette tool and a large crescent wrench (Figure R7).
Figure R6. Fitting Cassette onto Spline Figure R7. Tightening Cassette End Cap
b. Mount the mid-drive adapter onto the mid-drive hub using a 4mm Allen key to tighten the six M5x0.8 bolts into the mid-drive hub (Figure R8).
c.
Figure R8. Mid-drive Adapter Installation
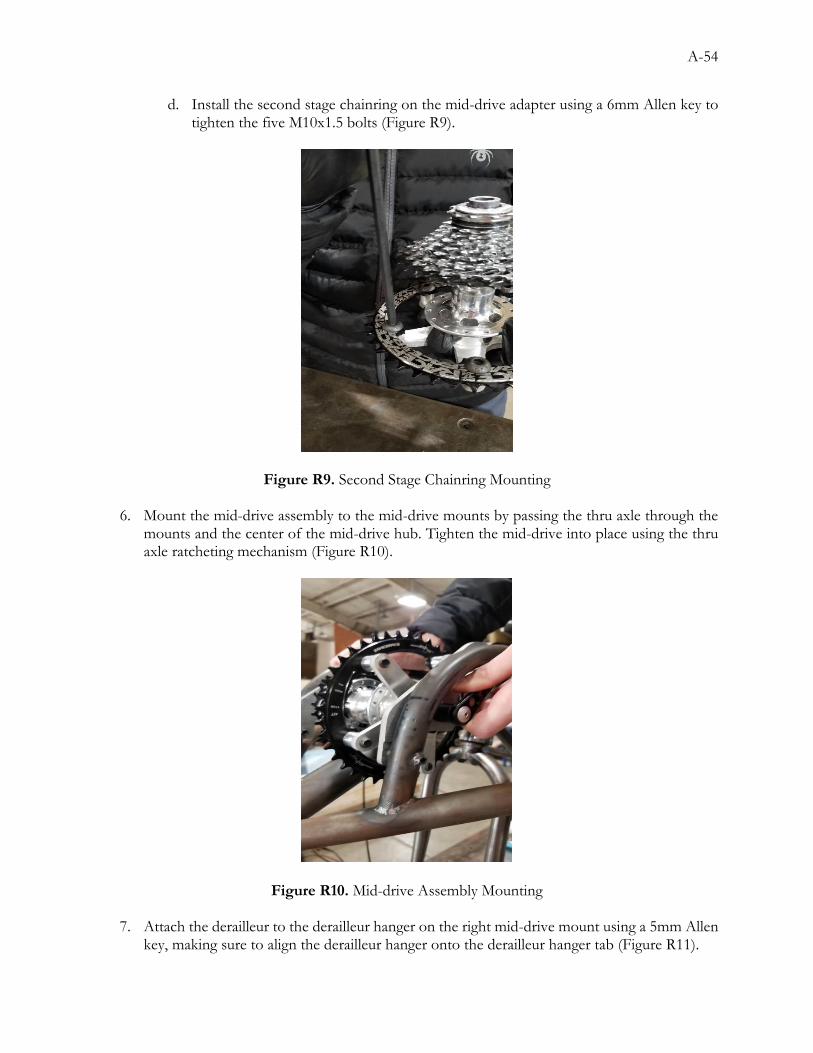
A-54
d. Install the second stage chainring on the mid-drive adapter using a 6mm Allen key to tighten the five M10x1.5 bolts (Figure R9).
Figure R9. Second Stage Chainring Mounting
6. Mount the mid-drive assembly to the mid-drive mounts by passing the thru axle through the mounts and the center of the mid-drive hub. Tighten the mid-drive into place using the thru axle ratcheting mechanism (Figure R10).
Figure R10. Mid-drive Assembly Mounting
7. Attach the derailleur to the derailleur hanger on the right mid-drive mount using a 5mm Allen key, making sure to align the derailleur hanger onto the derailleur hanger tab (Figure R11).
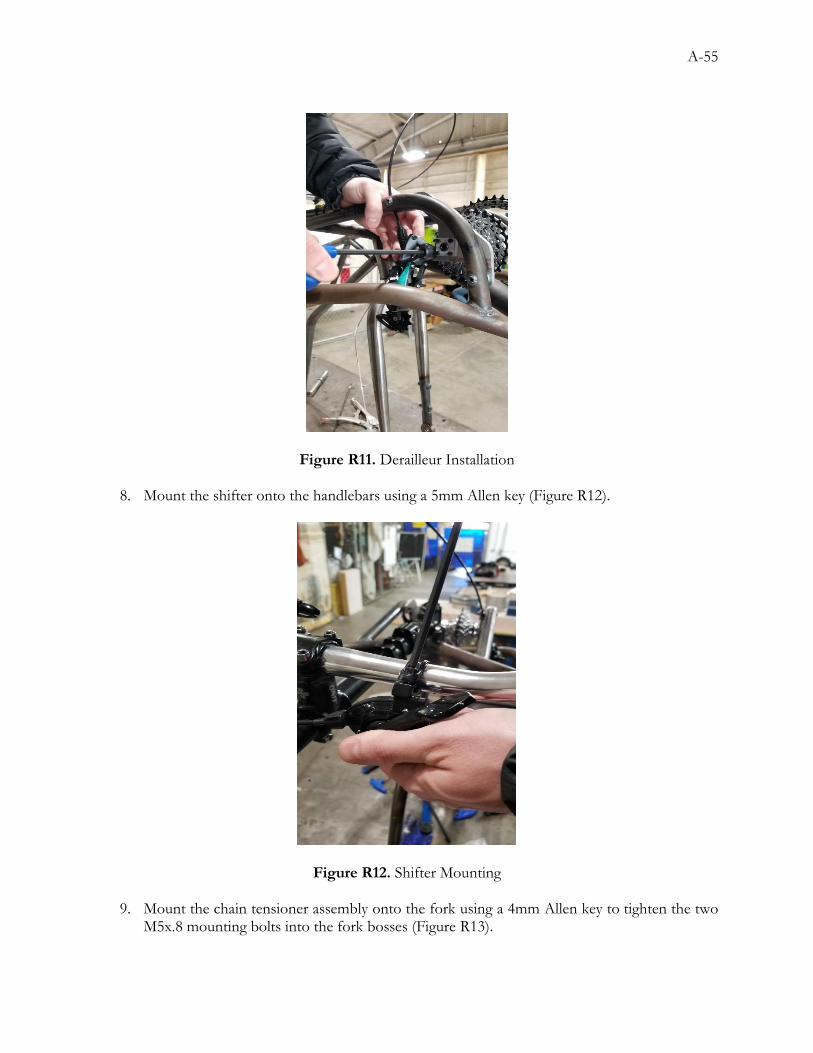
A-55
Figure R11. Derailleur Installation
8. Mount the shifter onto the handlebars using a 5mm Allen key (Figure R12).
Figure R12. Shifter Mounting
9. Mount the chain tensioner assembly onto the fork using a 4mm Allen key to tighten the two M5x.8 mounting bolts into the fork bosses (Figure R13).
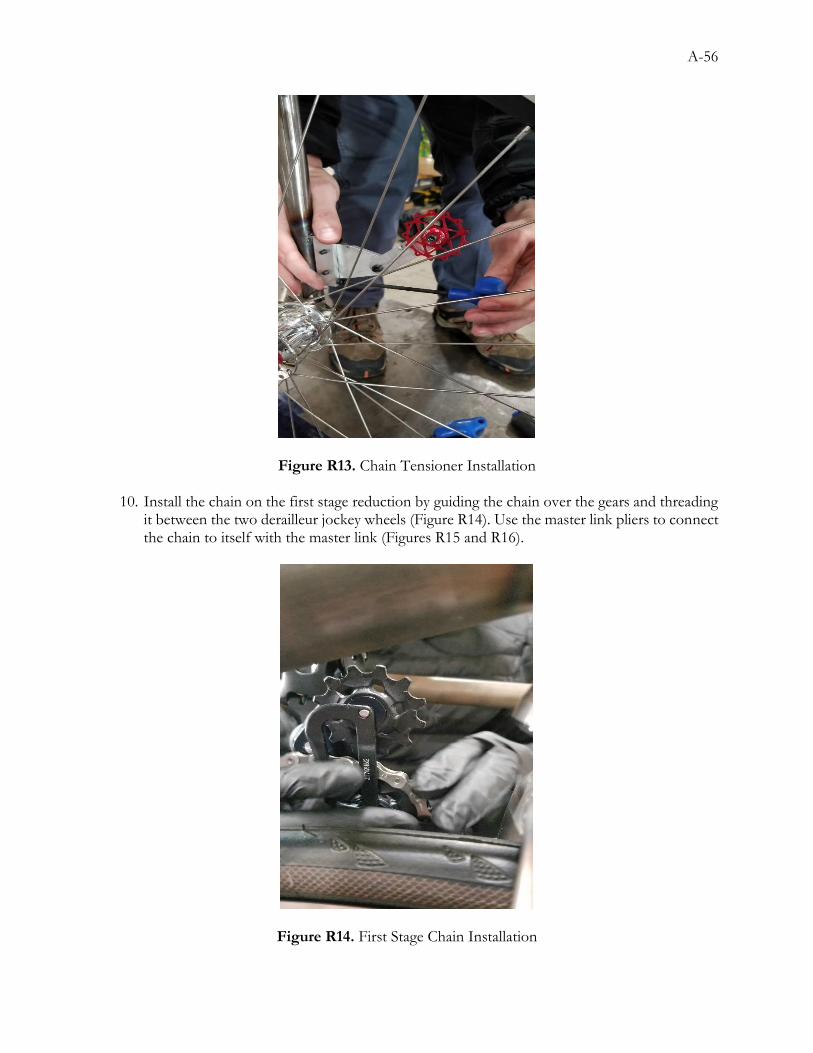
A-56
Figure R13. Chain Tensioner Installation
10. Install the chain on the first stage reduction by guiding the chain over the gears and threading it between the two derailleur jockey wheels (Figure R14). Use the master link pliers to connect the chain to itself with the master link (Figures R15 and R16).
Figure R14. First Stage Chain Installation

A-57
Figure R15. Master Link Halves
Figure R16. MasterLink Connection
11. Install the chain on the second stage reduction by guiding the chain over the gears and by leading it around the inside of the chain tensioner (Figure R17). Use the master link pliers to connect the chain to itself with the master link (Figures R15 and R16).
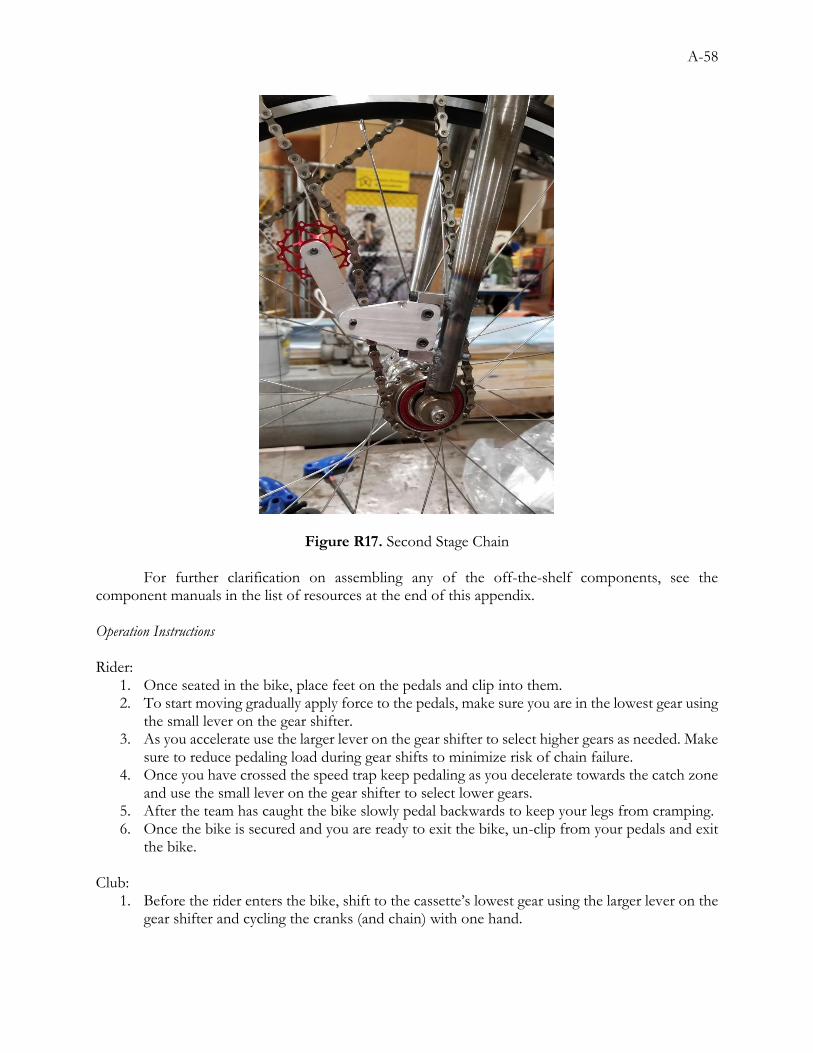
A-58
Figure R17. Second Stage Chain
For further clarification on assembling any of the off-the-shelf components, see the component manuals in the list of resources at the end of this appendix. Operation Instructions Rider:
1. Once seated in the bike, place feet on the pedals and clip into them. 2. To start moving gradually apply force to the pedals, make sure you are in the lowest gear using
the small lever on the gear shifter. 3. As you accelerate use the larger lever on the gear shifter to select higher gears as needed. Make
sure to reduce pedaling load during gear shifts to minimize risk of chain failure. 4. Once you have crossed the speed trap keep pedaling as you decelerate towards the catch zone
and use the small lever on the gear shifter to select lower gears. 5. After the team has caught the bike slowly pedal backwards to keep your legs from cramping. 6. Once the bike is secured and you are ready to exit the bike, un-clip from your pedals and exit
the bike. Club:
1. Before the rider enters the bike, shift to the cassette’s lowest gear using the larger lever on the gear shifter and cycling the cranks (and chain) with one hand.
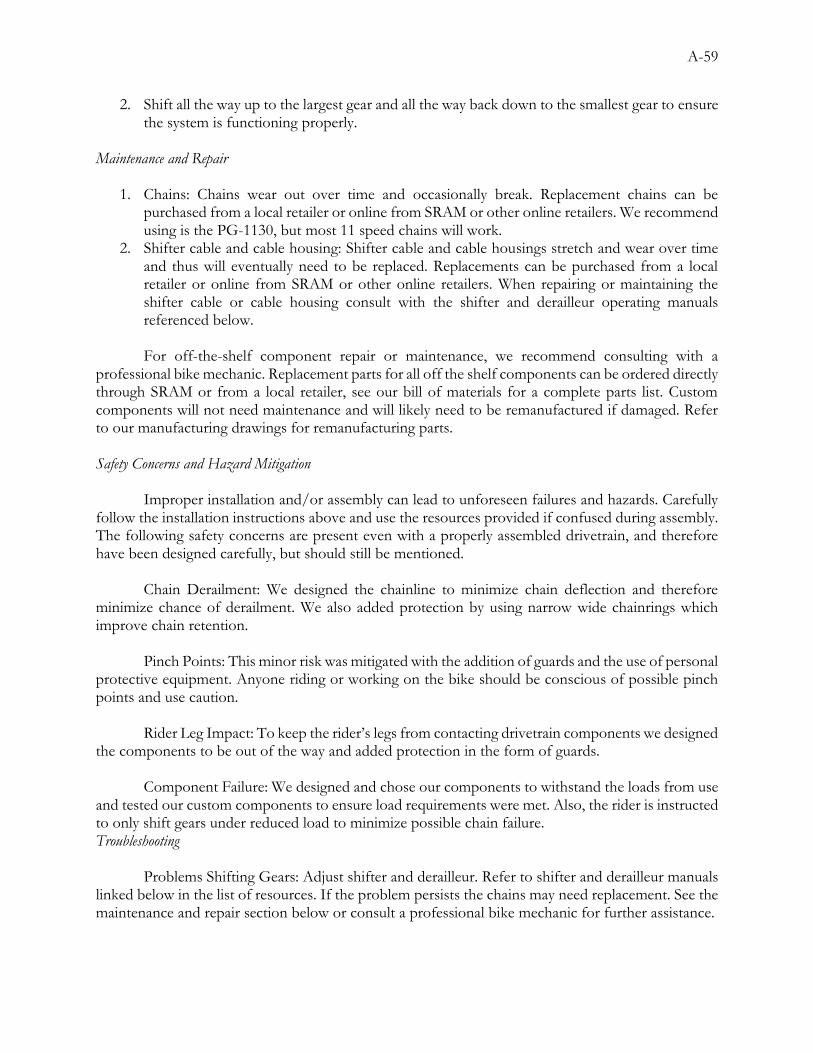
A-59
2. Shift all the way up to the largest gear and all the way back down to the smallest gear to ensure the system is functioning properly.
Maintenance and Repair
1. Chains: Chains wear out over time and occasionally break. Replacement chains can be purchased from a local retailer or online from SRAM or other online retailers. We recommend using is the PG-1130, but most 11 speed chains will work.
2. Shifter cable and cable housing: Shifter cable and cable housings stretch and wear over time and thus will eventually need to be replaced. Replacements can be purchased from a local retailer or online from SRAM or other online retailers. When repairing or maintaining the shifter cable or cable housing consult with the shifter and derailleur operating manuals referenced below.
For off-the-shelf component repair or maintenance, we recommend consulting with a
professional bike mechanic. Replacement parts for all off the shelf components can be ordered directly through SRAM or from a local retailer, see our bill of materials for a complete parts list. Custom components will not need maintenance and will likely need to be remanufactured if damaged. Refer to our manufacturing drawings for remanufacturing parts. Safety Concerns and Hazard Mitigation
Improper installation and/or assembly can lead to unforeseen failures and hazards. Carefully follow the installation instructions above and use the resources provided if confused during assembly. The following safety concerns are present even with a properly assembled drivetrain, and therefore have been designed carefully, but should still be mentioned.
Chain Derailment: We designed the chainline to minimize chain deflection and therefore minimize chance of derailment. We also added protection by using narrow wide chainrings which improve chain retention.
Pinch Points: This minor risk was mitigated with the addition of guards and the use of personal protective equipment. Anyone riding or working on the bike should be conscious of possible pinch points and use caution.
Rider Leg Impact: To keep the rider’s legs from contacting drivetrain components we designed the components to be out of the way and added protection in the form of guards.
Component Failure: We designed and chose our components to withstand the loads from use and tested our custom components to ensure load requirements were met. Also, the rider is instructed to only shift gears under reduced load to minimize possible chain failure. Troubleshooting
Problems Shifting Gears: Adjust shifter and derailleur. Refer to shifter and derailleur manuals linked below in the list of resources. If the problem persists the chains may need replacement. See the maintenance and repair section below or consult a professional bike mechanic for further assistance.
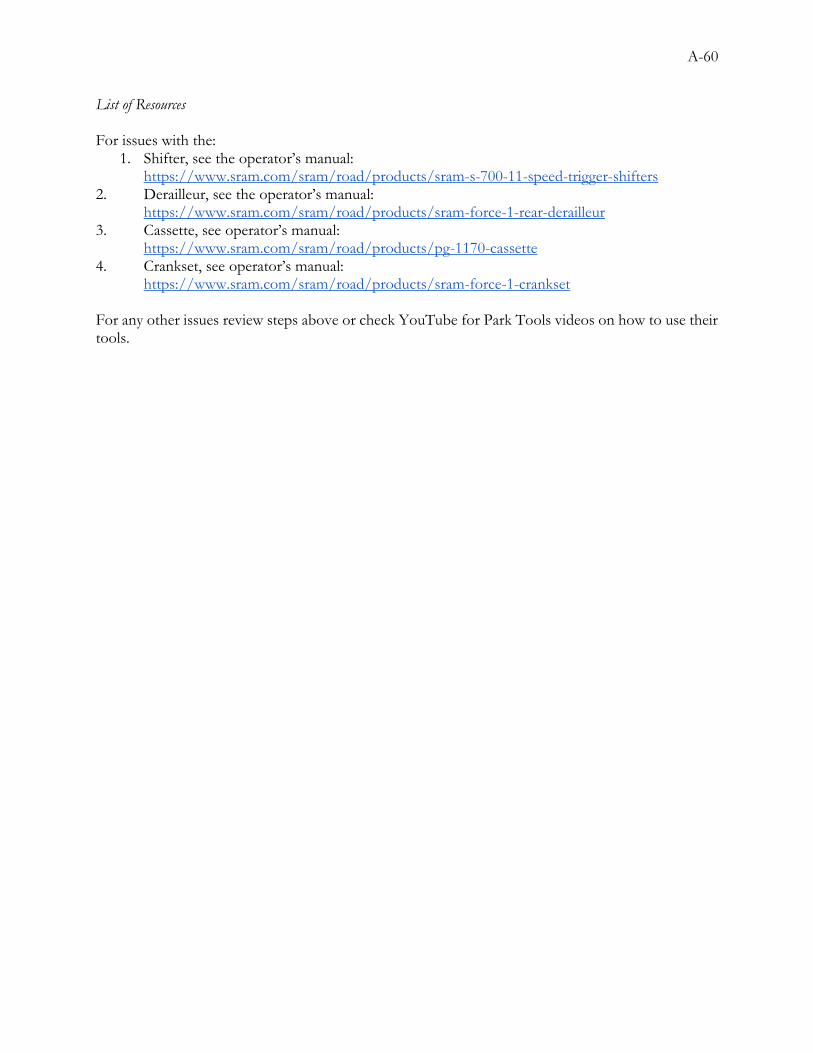
A-60
List of Resources For issues with the:
1. Shifter, see the operator’s manual: https://www.sram.com/sram/road/products/sram-s-700-11-speed-trigger-shifters
2. Derailleur, see the operator’s manual: https://www.sram.com/sram/road/products/sram-force-1-rear-derailleur
3. Cassette, see operator’s manual: https://www.sram.com/sram/road/products/pg-1170-cassette
4. Crankset, see operator’s manual: https://www.sram.com/sram/road/products/sram-force-1-crankset
For any other issues review steps above or check YouTube for Park Tools videos on how to use their tools.
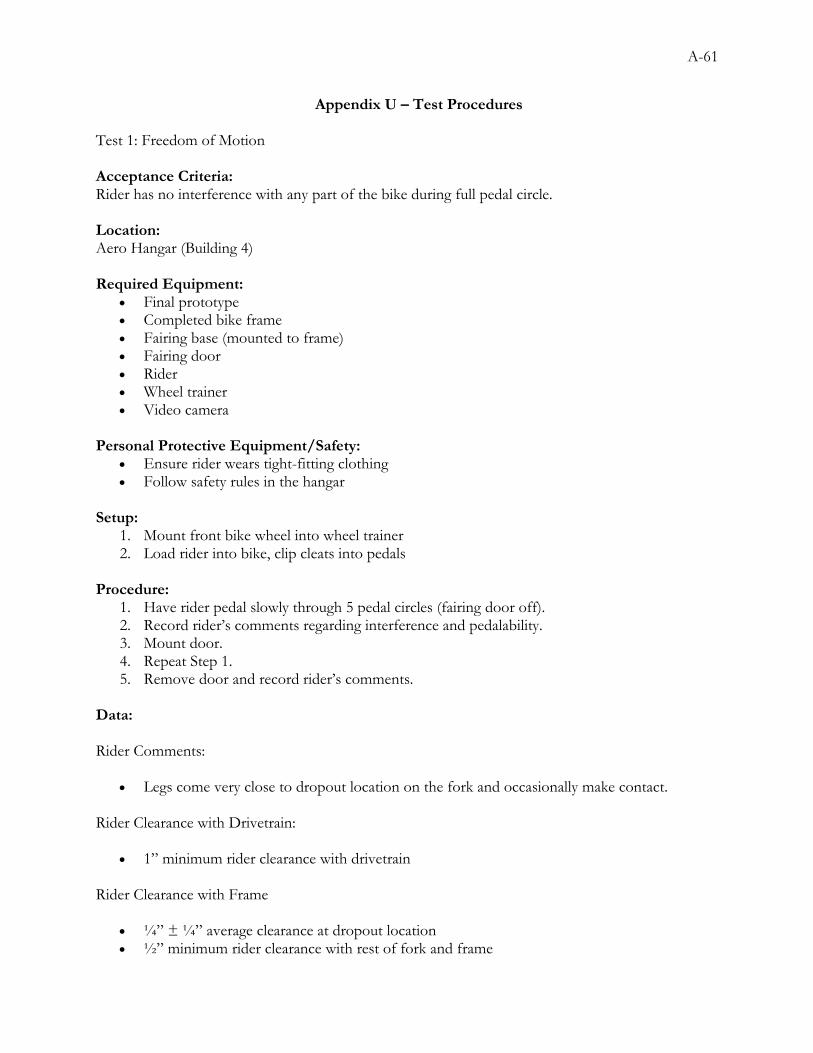
A-61
Appendix U – Test Procedures Test 1: Freedom of Motion Acceptance Criteria: Rider has no interference with any part of the bike during full pedal circle. Location: Aero Hangar (Building 4) Required Equipment:
Final prototype Completed bike frame Fairing base (mounted to frame) Fairing door Rider Wheel trainer Video camera
Personal Protective Equipment/Safety:
Ensure rider wears tight-fitting clothing Follow safety rules in the hangar
Setup:
1. Mount front bike wheel into wheel trainer 2. Load rider into bike, clip cleats into pedals
Procedure:
1. Have rider pedal slowly through 5 pedal circles (fairing door off). 2. Record rider’s comments regarding interference and pedalability. 3. Mount door. 4. Repeat Step 1. 5. Remove door and record rider’s comments.
Data: Rider Comments:
Legs come very close to dropout location on the fork and occasionally make contact. Rider Clearance with Drivetrain:
1” minimum rider clearance with drivetrain Rider Clearance with Frame
¼” ± ¼” average clearance at dropout location ½” minimum rider clearance with rest of fork and frame

A-62
Test 2: Chain Installation Time Acceptance Criteria: It must take less than 5 minutes to install a new chain. Location: Aero Hangar (Building 4) Required Equipment:
Final Prototype Finished bike Chain Chain tool Chain pliers Stopwatch
Personal Protective Equipment/Safety:
Adhere to safety rules in the hangar Setup:
1. Remove the door from the bike to allow access to the drivetrain. 2. Acquire tools. 3. Remove chain from packaging.
Procedure:
1. Start stopwatch. 2. Place chain on mid-drive to wheel hub. 3. Cut chain to length using the chain tool. 4. Install the chain on the mid-drive to wheel hub. 5. Place the chain on the chainring to the cassette and derailleur. 6. Cut chain to length using the chain tool. 7. Install the chain on the chainring to the cassette. 8. Spin cranks to seat chain in proper gear and make sure the chain is properly installed. 9. Stop the stopwatch and record time. 10. Repeat steps 1-9 for 5 trials, then calculate and record confidence interval. 11. Remove and properly store chain.
Data: Stopwatch/Reaction Time Uncertainty: 2 seconds Trial 1: 3:05 min Trial 2: 2:57 min Trial 3: 3:54 min Trial 4: 2:26 min Trial 5: 2:32 min Uncertainty and Confidence Interval: 179 ± 22 seconds or 2.98 ± 0.37 minutes at 95% confidence
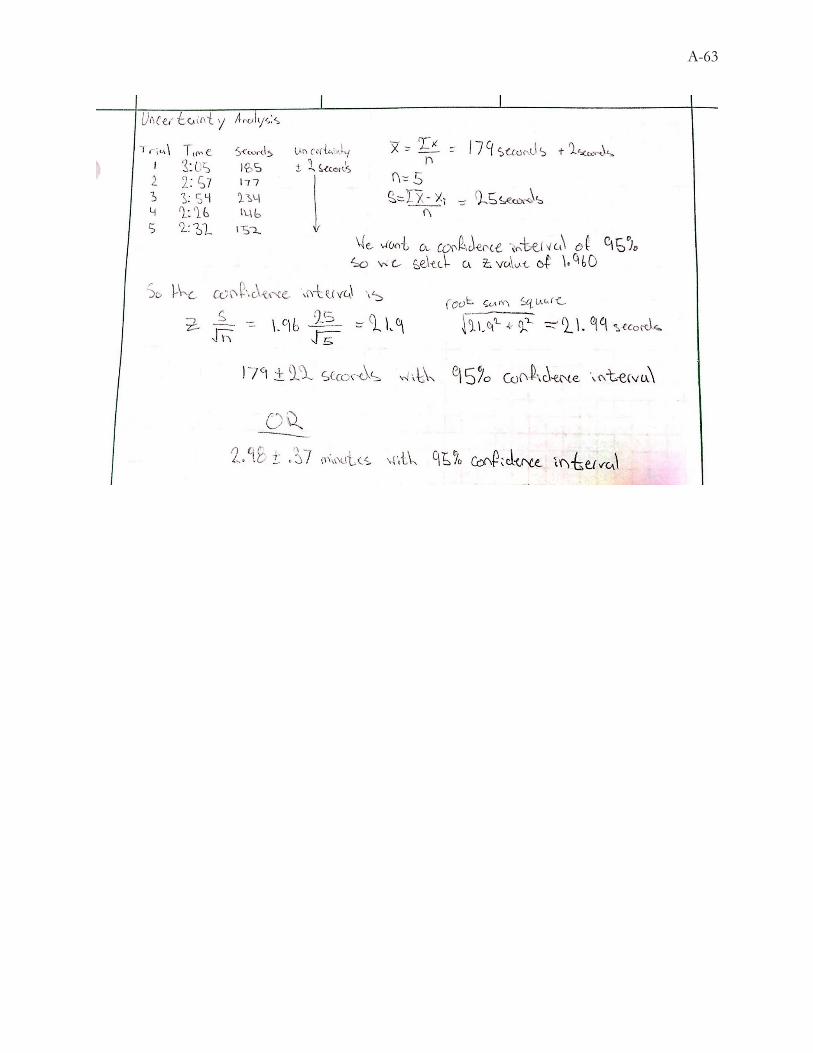
A-63
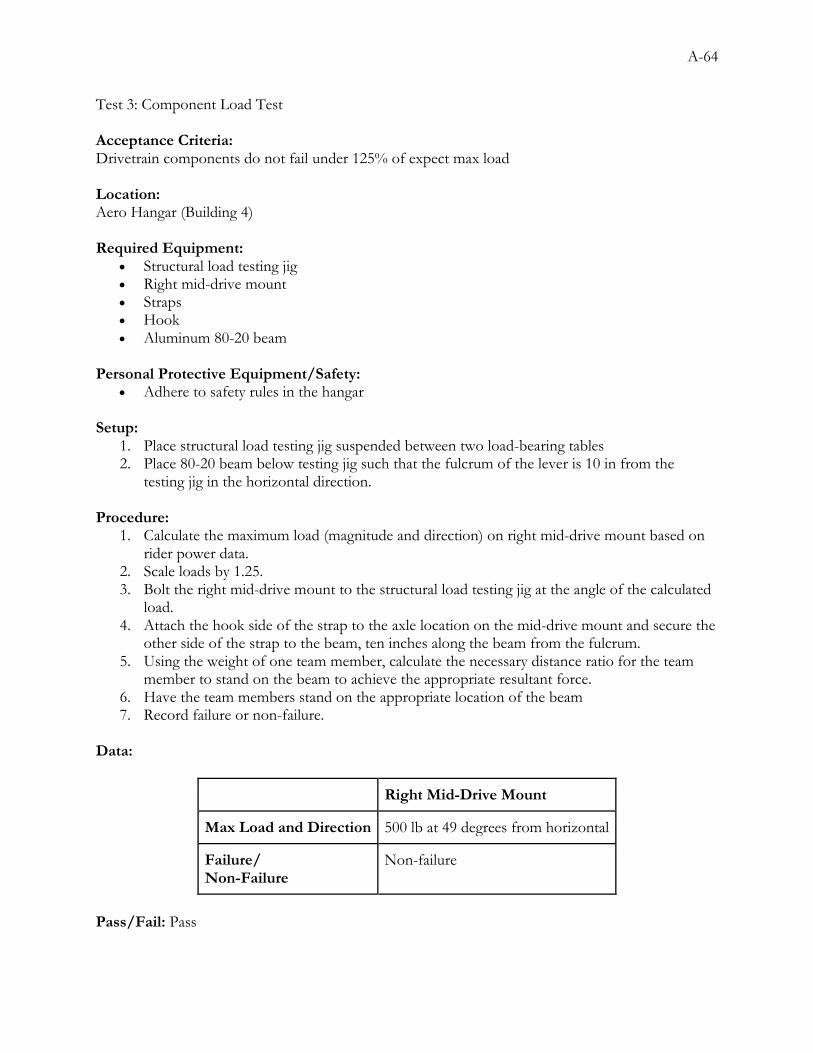
A-64
Test 3: Component Load Test Acceptance Criteria: Drivetrain components do not fail under 125% of expect max load Location: Aero Hangar (Building 4) Required Equipment:
Structural load testing jig Right mid-drive mount Straps Hook Aluminum 80-20 beam
Personal Protective Equipment/Safety:
Adhere to safety rules in the hangar Setup:
1. Place structural load testing jig suspended between two load-bearing tables 2. Place 80-20 beam below testing jig such that the fulcrum of the lever is 10 in from the
testing jig in the horizontal direction. Procedure:
1. Calculate the maximum load (magnitude and direction) on right mid-drive mount based on rider power data.
2. Scale loads by 1.25. 3. Bolt the right mid-drive mount to the structural load testing jig at the angle of the calculated
load. 4. Attach the hook side of the strap to the axle location on the mid-drive mount and secure the
other side of the strap to the beam, ten inches along the beam from the fulcrum. 5. Using the weight of one team member, calculate the necessary distance ratio for the team
member to stand on the beam to achieve the appropriate resultant force. 6. Have the team members stand on the appropriate location of the beam 7. Record failure or non-failure.
Data:
Right Mid-Drive Mount
Max Load and Direction 500 lb at 49 degrees from horizontal
Failure/ Non-Failure
Non-failure
Pass/Fail: Pass
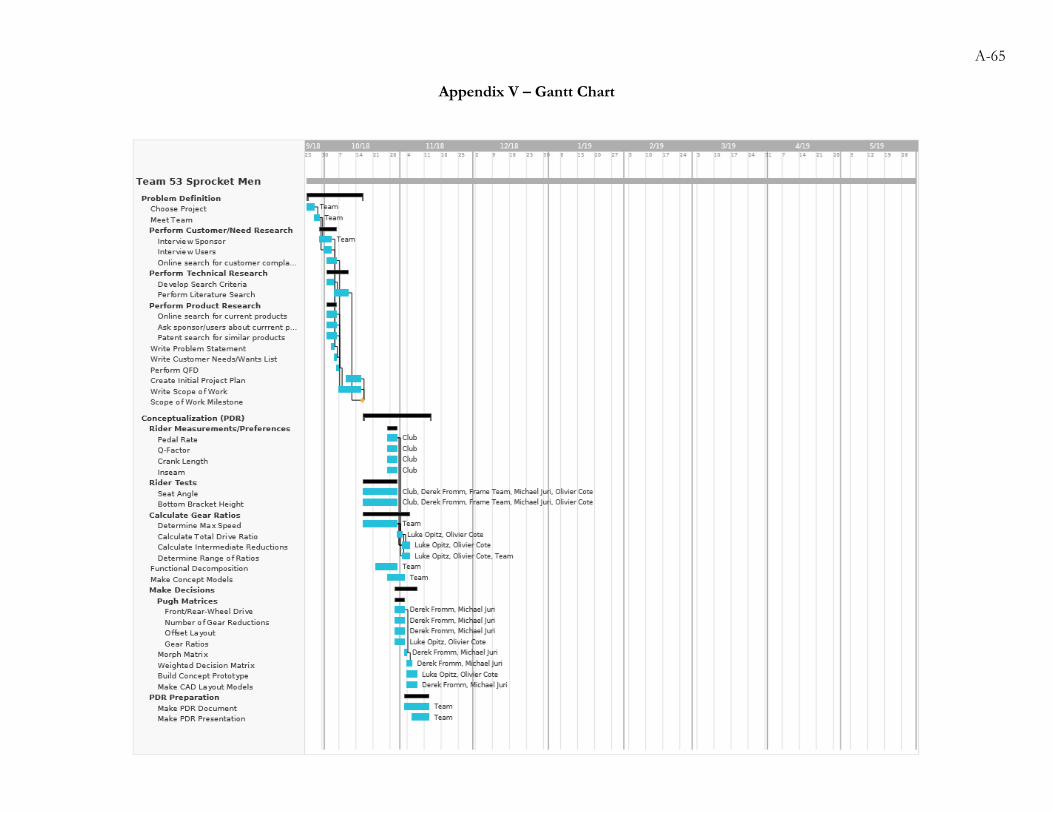
A-65
Appendix V – Gantt Chart
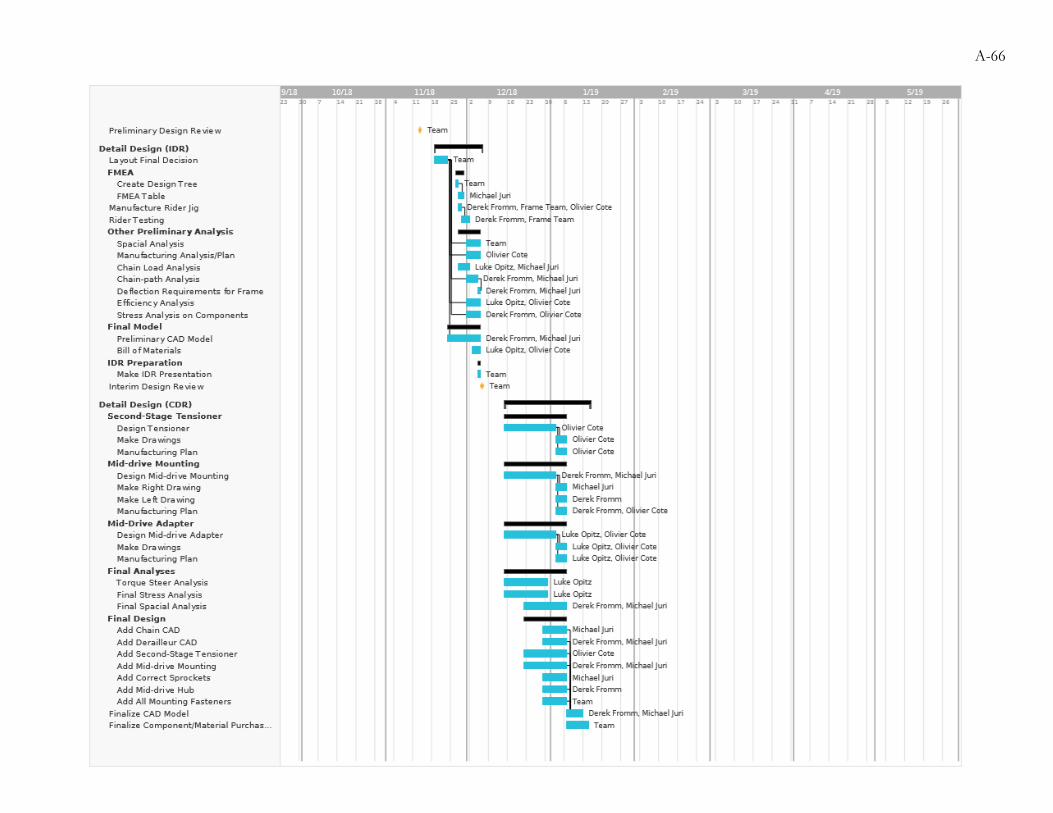
A-66

A-67
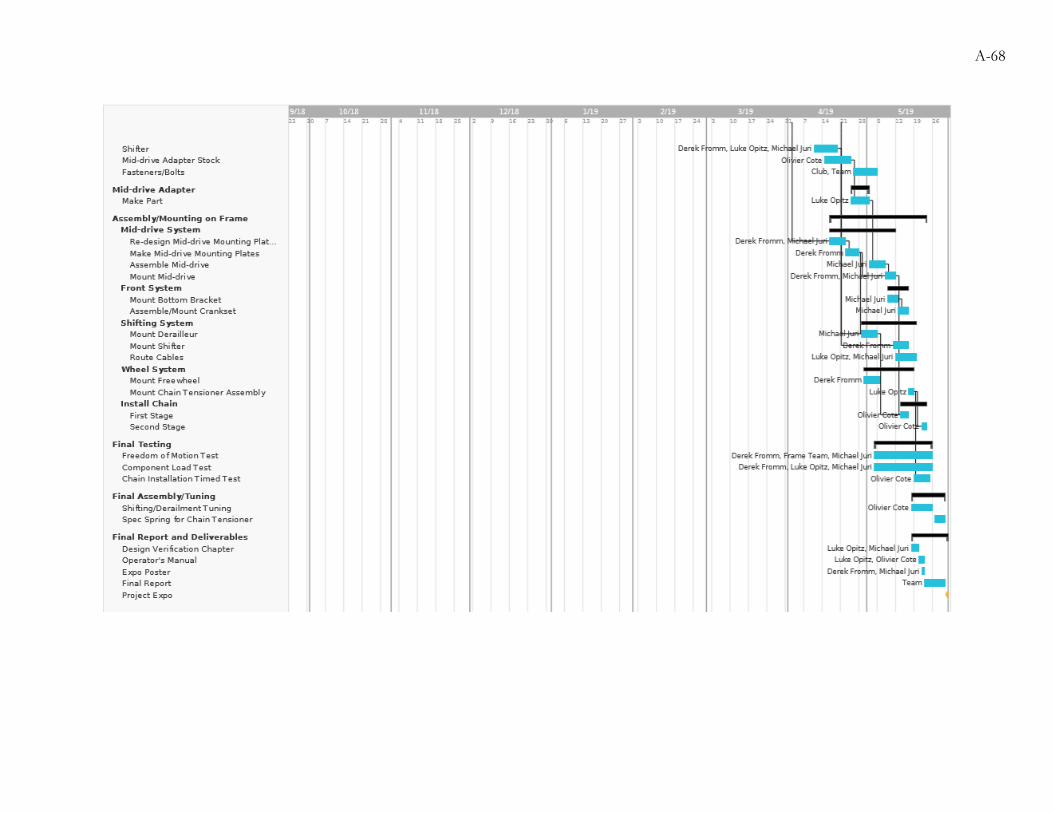
A-68

A-69