final cover.FH8 Tue Feb 20 11:42:00 2001 Page 1 Engineered Barriers ... Groundwater Remedies (FY...
49
Transcript of final cover.FH8 Tue Feb 20 11:42:00 2001 Page 1 Engineered Barriers ... Groundwater Remedies (FY...

final cover.FH8 Tue Feb 20 11:42:00 2001 Page 1
Composite
C M Y CM MY CY CMY K

final cover.FH8 Tue Feb 20 11:42:00 2001 Page 2
Composite
C M Y CM MY CY CMY K
i
Tab
le o
f Co
nte
nts
○ ○ ○ ○ ○ ○ ○ ○ ○ ○ ○ ○ ○ ○ ○ ○
Table of Contents
List of Acronyms ........................................................................................................... v
Notice ............................................................................................................................. vi
Acknowledgment ....................................................................................................... vii
Executive Summary ................................................................................................... viii
Overview ......................................................................................................................... 1
Introduction ............................................................................................................ 1
What Treatment Technologies Are Addressed in This Report? ................... 1
Sources of Information for This Report ............................................................ 2
Definitions of Specific Treatment Technologies .............................................. 2
Source Control Treatment Technologies ........................................................... 3
In Situ Groundwater Treatment Technologies ................................................... 5
In Situ Groundwater Containment Technology ................................................. 6
Section 1: Overview of RODs ....................................................................................... 7
RODs Signed by Fiscal Year ................................................................................... 8
Source Control RODs ............................................................................................. 9
Section 2: Treatment Technologies for Source Control ..................................... 10
Source Control RODs ........................................................................................... 10
In Situ Versus Ex Situ Technologies .................................................................. 10
Most Common Technologies For Source Control ......................................... 12
Implementation Status of TreatmentTechnology Projects ............................................................................................ 14
Contaminants Addressed ................................................................................... 17
Quantity of Soil Addressed ................................................................................. 19
Volumes of Soil Treated in Trains...................................................................... 20
Cumulative Soil Treatment Volumes ................................................................ 20Binders Used for Solidification/Stabilization .................................................. 20
Remedy Changes .................................................................................................. 23
Section 3: Innovative Applications ......................................................................... 25
Bioremediation ..................................................................................................... 25
Phytoremediation ................................................................................................ 28
Innovative Technology Treatment Trains ........................................................ 30
Section 4: Groundwater Remedies ......................................................................... 32
In Situ Groundwater Treatment ........................................................................ 32
Vertical Engineered Barriers .............................................................................. 32
Permeable Reactive Barriers .............................................................................. 34
Monitored Natural Attenuation ........................................................................ 34

Tab
le o
f C
on
ten
ts
ii
Section 5: Superfund Removal Actions .................................................................. 37
Section 6: References and Data Sources................................................................ 38
Appendix A - Superfund Treatment Technologies by Fiscal Year
Appendix B - Superfund Treatment Technology Summary Matrix
Appendix C - Treatment Trains with Innovative Technologies
Appendix D - Treatment Technologies: Summary of Status Report Updates,Changes, Deletions
Appendix E - Superfund Remedial Actions: RODs Selecting Natural Attenuation
Appendix F - Identification of Remedy and Record of Decision Types for SuperfundRemedial Actions
Index
iii
Tab
le o
f Co
nte
nts
Figures
Figure 1. Superfund Remedial Actions: Actual Remedy TypesAt Sites On The National Priorities List (FY 1982 - FY 1999)......................... 7
Figure 2. Superfund Remedial Actions: RODs Signed by Fiscal Year(FY 1982 - FY 1999) ................................................................................................ 8
Figure 3. Superfund Remedial Actions: Source Control RODs(FY 1982 - FY 1999) ................................................................................................ 9
Figure 4. Superfund Remedial Actions: Trends in Types of SourceControl RODs (FY 1982 - FY 1999) .................................................................... 10
Figure 5. Superfund Remedial Actions: Summary of Source ControlTreatment Technologies (FY 1982 - FY 1999) ............................................... 11
Figure 6. Superfund Remedial Actions: In Situ Technologies forSource Control (FY 1985 - FY 1999) ................................................................. 12
Figure 7. Superfund Remedial Actions: Trends for Soil Vapor Extractionfor Source Control (FY 1985 - FY 1999) .......................................................... 13
Figure 8. Superfund Remedial Actions: Trends for Solidification/Stabilization for Source Control (FY 1985 - FY 1999) .................................. 13
Figure 9. Superfund Remedial Actions: Trends for Incineration forSource Control (FY 1985 - FY 1999) ................................................................. 14
Figure 10. Superfund Remedial Actions: Cumulative Trends for MostCommon Technologies for Source Control (FY 1988 - FY 1999) .............. 14
Figure 11. Superfund Remedial Actions: Treatment Technologies Statusby Technology Type .......................................................................................... 15
Figure 12. Superfund Remedial Actions: Box-and-Whiskers Plot of CubicYards of Soil Treated (FY 1982 - FY 1999) ....................................................... 19
Figure 13. Superfund Remedial Actions: Cubic Yards of Soil Treated byTreatment Trains (FY 1982 - FY 1999) ............................................................. 21
Figure 14. Superfund Remedial Actions: Percentage of Soil Treated byTechnology Type (FY 1982 - FY 1999) .............................................................. 22
Figure 15. Superfund Remedial Actions: Innovative Applications ofSource Control Treatment Technologies (FY 1982 - FY 1999) .................. 26
Figure 16. Superfund Remedial Actions: Bioremediation Methods For SourceControl and In Situ Groundwater Treatment (FY 1982 - FY 1999) ........... 27
Figure 17. Superfund Remedial Actions: Contaminant Groups Treated byBioremediation (FY 1982 - FY 1999) ................................................................ 28
Figure 18. Superfund Remedial Actions: Treatment Trains with InnovativeTreatment Technologies (FY 1982 - FY 1999) ............................................... 31
Figure 19. Superfund Remedial Actions: Groundwater Remedies(FY 1982 - FY 1999) .............................................................................................. 32
Figure 20. Superfund Remedial Actions: Purpose For Vertical EngineeredBarriers (FY 1982 - FY 1999) .............................................................................. 34
Figure 21. Superfund Remedial Actions: RODs Specifying Monitored NaturalAttenuation for Groundwater (FY 1982 - FY 1999)...................................... 36
Tab
le o
f C
on
ten
ts
iv
Tables
Table 1. Superfund Remedial Actions: Project Status of TreatmentTechnologies (FY 1982 - FY 1999) .............................................................. 16
Table 2. Superfund Remedial Actions: Contaminants Treated byTechnology Type (FY 1982 - FY 1999)........................................................ 17
Table 3. Superfund Remedial Actions: Estimated Quantities of SoilTreated by Source Control Technologies (FY 1982 - FY 1999) ................ 18
Table 4. Superfund Remedial Actions: Binders and Reagents Used for90 Solidification/Stabilization Projects (FY 1982 - FY 1999) ................ 22
Table 5. Superfund Remedial Actions: Number of Most CommonlyChanged Technologies (FY 1982 - FY 1999) ............................................ 23
Table 6. Superfund Remedial Actions: Phytoremediation Projects(FY 1982 - FY 1999) ....................................................................................... 29
Table 7. Superfund Remedial Actions: In Situ Groundwater TreatmentTechnologies at 81 Sites Selecting These Technologies(FY 1982 - FY 1999) ....................................................................................... 33
Table 8. Superfund Remedial Actions: Types of Vertical EngineeredBarriers at 51 Sites Selecting This Technology (FY 1982 - FY 1999) ... 33
Table 9. Superfund Remedial Actions: Permeable Reactive BarrierProjects (FY 1982 - FY 1999) ....................................................................... 35
Table 10. Superfund Removal Actions: Project Status of TreatmentTechnologies (FY 1982 - FY 1999) ................................................................ 37

39
List of A
cron
ym
s: Tre
atme
nt Te
chn
olo
gie
s An
nu
al Status R
ep
ort
OB/OD Open burn/open detonation
OD Open detonation
OERR Office of Emergency and RemedialResponse
OSC On-scene coordinator
OSWER Office of Solid Waste and EmergencyResponse
OU Operable unit
PAH Polycyclic aromatic hydrocarbons
PCB Polychlorinated biphenyls
pCi/L Pico curies per liter
PRB Permeable reactive barrier
REACH IT EPA’s REmediation And CHaracter-ization Innovative Technologies on-line searchable database
ROD Record of Decision
RPM Remedial Project Manager
S/S Solidification/stablilization
SARA Superfund Amendments andReauthorization Act
SVE Soil vapor extraction
SVOC Semivolatile organic compounds
TIO Technology Innovation Office
ug/L Micrograms per liter
VEB Vertical engineered barrier
VOC Volatile organic compounds
ASR Annual Status Report
BTEX Benzene, toluene, ethylbenzene, andxylene
CERCLIS Comprehensive EnvironmentalResponse, Compensation, andLiability Information System
CLU-IN EPA’s CLeanUp INformation system
Cr Chromium
CROW™ Contained Recovery of Oily Waste
cy Cubic yard
DRE Destruction and removal efficiency
EOU Excess, obsolete, or unserviceable
EPA U.S. Environmental ProtectionAgency
ESD Explanation of significant differences
FRTR Federal Remediation TechnologiesRoundtable
FY Fiscal year
HTTD High temperature thermal desorption
LTTD Low temperature thermal desorption
mg/L Milligrams per liter
MNA Monitored natural attenuation
NAPL Nonaqueous phase liquids
NPL National Priorities List
OB Open burn
List of Acronyms
v

No
tice
: Tre
atm
en
t Te
chn
olo
gie
s A
nn
ual
Sta
tus
Re
po
rt
vi
Preparation of this report has been funded whollyor in part by the U.S. Environmental ProtectionAgency (EPA) under contract numbers 68-W-99-003 and 68-W-99-020. Mention of trade namesor commercial products does not constituteendorsement or recommendation for use. Alimited number of printed copies of TreatmentTechnologies for Site Cleanup: Annual StatusReport (ASR), Tenth Edition is available free ofcharge by mail or by facsimile from:
U.S. EPA/National Service Center forEnvironmental Publications (NSCEP)P.O. Box 42419Cincinnati, OH 45242-2419Telephone: (513) 489-8190 or (800) 490-9198Fax: (513) 489-8695
An HTML and a PDF version of the ASR areavailable for viewing or downloading from theHazardous Waste Cleanup Information (CLU-IN)
web site at http://clu-in.org/asr. Printed copies ofthe ASR can also be ordered through that webaddress, subject to availability.
The data for the ASR have been incorporated intoEPA’s REmediation And CHaracterizationInnovative Technologies (EPA REACH IT) on-linesearchable database at http://www.epareachit.org.EPA REACH IT, sponsored by EPA’s TechnologyInnovation Office, is a system that letsenvironmental professionals use the power of theInternet to search, view, download, and printinformation about innovative remediation andcharacterization technologies. EPA REACH ITprovides information about more than 750 serviceproviders that offer almost 1,300 remediationtechnologies and more than 150 characterizationtechnologies. EPA REACH IT fosterscommunication between technology vendors andusers by providing information about theavailability, performance, and cost associated withthe application of treatment and characterizationtechnologies.
Notice

Ack
no
wle
dg
me
nt
: Treatm
en
t Tech
no
log
ies A
nn
ual Statu
s Re
po
rt
This document was prepared for EPA’s TechnologyInnovation Office under contract numbers 68-W-99-003 and 68-W-99-020.
Special acknowledgment is given to the federaland state staff and other remediation
professionals for individual sites, for providingthe detailed information presented in thisdocument. Their cooperation and willingnessto share their expertise on treatmenttechnologies encourages the application of thosetechnologies at other sites.
vii
Acknowledgment

Ex
ecu
tiv
e S
um
ma
ry:
Tre
atm
en
t Te
chn
olo
gie
s A
nn
ual
Sta
tus
Re
po
rt
42viii
This report documents the status, as of the summerof 2000, of treatment technology applications forsoil, other solid wastes, and groundwater atSuperfund sites. The data in this report weregathered from Superfund Records of Decision(RODs) from fiscal year (FY) 1982 through 1999and project managers at Superfund remedial andremoval sites. The report examines both sourcecontrol technologies (addressing soil, sludge,sediment, and other solid-matrix wastes) andinnovative groundwater treatment technologies.The principal technologies for the treatment ofsoil and other solid wastes that are discussed inthe report are:
• on- and off-site incineration
• solidification/stabilization
• soil vapor extraction (SVE)
• thermal desorption
• bioremediation
The innovative groundwater treatment technologiesincluded in this report are:
• air sparging
• in situ bioremediation
• in situ chemical treatment
• dual-phase extraction (for soil and groundwater)
• thermally enhanced recovery
• surfactant flushing
• permeable reactive barriers (also known as passivetreatment walls).
In addition, one technology for groundwatercontainment, vertical engineered barriers (VEB),is addressed in this report.
This 10th edition provides a summary of thetechnology applications identified for Superfundremedial and removal actions. This report includesdata on 934 treatment technology projects, 834of which are being carried out under Superfundremedial actions. For the most frequently selectedtechnologies in the Superfund remedial program,the report analyzes selection trends over time,contaminant groups treated, quantities of soiltreated (for soil treatment technologies), and thestatus of project implementation.
The major findings of this report on the use oftreatment at Superfund remedial action sites are:
• At over half (58 percent) of Superfund sites, theremedy already implemented or currently plannedincludes treatment of a source or groundwater(including groundwater pump-and-treat remedies).
• For treatment technologies (excluding groundwaterpump-and-treat) at Superfund remedial action sites, atotal of 353 projects (42 percent) have been completedand another 276 (33 percent) are operational.
For the use of treatment technologies for source control:
• The percentage of RODs selecting treatment as amethod of managing sources of contaminationincreased from 40 percent in 1997 to 47 percent in1999, while the percentage selecting containment hasdecreased from 46 percent in 1997 to 32 percent in1999.
• More than half of all source control treatments atSuperfund remedial action sites (58 percent) are exsitu.
• More than twice as much contaminated soil isundergoing remediation by in situ treatment (34million cubic yards) than by ex situ treatment (14million cubic yards).
• Approximately 47 percent of source control treatmentprojects have been completed.
• In situ SVE is the most frequently used source controltreatment technology (26 percent of source controlprojects), followed by ex situ solidification/stabilization(19 percent) and off-site incineration (13 percent).
• Approximately 57 percent (27 million cubic yards)of the total volume of soil is being treated by SVE.
Results for contaminants treated at Superfund sitesindicate that:
• More than 80 percent of the Superfund remedialprojects in the report address organic contaminants.
• More than 20 percent of the remedial projects addressmetal contaminants.
Access to more detailed project information hasbeen made easier by the incorporation of the site-specific data used as the basis for this report intoEPA’s REmediation And CHaracterizationInnovative Technologies (EPA REACH IT) on-linesearchable database at http://www.epareachit.org.Additionally, an HTML version of this report isavailable at EPA’s hazardous waste CLeanUpINformation (CLU-IN) website at http://clu-in.org.
This report also includes a new appendix (AppendixF) that describes the classification of remedy typesand RODs. Appendix F provides details on themethodology for analyzing RODs and the remediesthey select and identifying specific remedy andROD types. The procedures contained in AppendixF are intended to provide a standard methodologyfor identifying remedy and ROD types. Establishingconsistent and reproducible remedy and RODevaluation procedures will facilitate technologytransfer and data collection and reporting.
Section 6Section 6Executive Summary

1
Ov
erv
iew
: Treatm
en
t Tech
no
log
ies A
nn
ual Statu
s Re
po
rt
○ ○ ○ ○ ○ ○ ○ ○ ○ ○
Introduction
The Treatment Technologies for Site Cleanup:Annual Status Report (ASR), Tenth Edition wasprepared by the Technology Innovation Office(TIO) of the U.S. Environmental ProtectionAgency’s (EPA) Office of Solid Waste andEmergency Response (OSWER) to document theuse of treatment technologies at hazardous wastesites. The report presents a list and an analysisof Superfund sites (both remedial and removalactions) at which treatment technologies arebeing used. Site managers can use this reportto evaluate cleanup alternatives for similar sites,while technology vendors can use it to identifypotential markets for their products. EPA alsouses the information to track progress in theapplication of established and innovativetreatment technologies.
The ASR usually is updated annually. The ninthedition of this report, published in April 1999,included data from Superfund Records of Decision(RODs) through fiscal year (FY) 1997. This tenthedition updates and expands informationprovided in the April 1999 report with theinclusion of data from FY 1998 and FY 1999RODs. This document includes a list of sitesand an analysis of 834 applications of treatmenttechnologies under remedial actions and 100applications under removal actions. Added tothe update is information about 66 applicationsof treatment technologies selected by RODs inFY 1998 and 67 selected in FY 1999. A ROD isthe decision document used to specify the way asite, or part of a site, will be remediated.
○ ○ ○ ○ ○ ○ ○ ○ ○ ○ ○ ○ ○ ○ ○ ○ ○ ○ ○ ○ ○ ○ ○
What� Treatment� Technologies
are�Addressed�in�This�Report?
Most RODs for remedial actions address thesource of contamination, such as soil, sludge,sediments, and solid-matrix wastes. Such“source control” RODs select “source controltechnologies.” Groundwater remedial action “anon-source control action” may be a componentof the “source control” ROD and the treatmenttechnologies chosen for groundwaterremediation are referred to as “groundwatertechnologies.” Appendix F to this document isa detailed description of the methodology usedto identify ROD types, including detaileddefinitions of “source control,” “groundwatertechnologies,” and other remedy types.
The ASR documents and tracks the use of sourcecontrol treatment, in situ groundwater treatment,and groundwater containment remedies atSuperfund remedial and removal action sites. TheASR also contains some limited information onother remedies, including groundwater pump-and-treat, and groundwater monitored naturalattenuation remedies.
The methodology used to determine ROD andremedy types has evolved over time. As newtechnologies are developed and innovativetechniques for site remediation are implemented,the methodology for identifying ROD andremedy types has been expanded toaccommodate them. Because the ROD andremedy type identification methodology haschanged over time, the methodology anddefinitions described in Appendix F may notbe applicable to all RODs issued before FY 1998and the remedies they contain. However, thetenth edition of the ASR does use thismethodology for FY 1998 and FY 1999 RODsand their remedies. The Appendix Fmethodology will be modified to account for theevolving nature of technologies.
The term “treatment technology” means any unitoperation or series of unit operations that altersthe composition of a hazardous substance orpollutant or contaminant through chemical,biological, or physical means so as to reducetoxicity, mobility, or volume of the contaminatedmaterials being treated. Treatment technologiesare an alternative to land disposal of hazardouswastes without treatment. (Federal Register,
OverviewNEW�IN�THE�TENTH�EDITION
� A presentation of the actual remediesbeing implemented at Superfundremedial action sites, on a site-specific basis, based on a historicalreview of RODs, ROD amendments,and Explanations of SignificantDifferences (ESDs).
� A more detailed look at twoinnovative treatment technologies,phytoremediation and permeablereactive barriers (PRB).
� A special analysis of verticalengineered barriers, one type ofgroundwater containment atSuperfund remedial action sites.

Ov
erv
iew
: Tre
atm
en
t Te
chn
olo
gie
s A
nn
ual
Sta
tus
Re
po
rt
2
volume 55, page 8819, 40 CFR 300.5:Definitions).
Established treatment technologies are those forwhich cost and performance information isreadily available. The most frequently usedestablished technologies are on- and off-siteincineration, solidification/stabilization, soilvapor extraction (SVE), thermal desorption, andpump-and-treat technologies for groundwater.Treatment of groundwater after it has beenpumped to the surface usually involves traditionalwater treatment and consequently pump-and-treatgroundwater remedies are considered establishedtechnologies.
Innovative treatment technologies are alternativetreatment technologies whose limited number ofapplications result in a lack of data on cost andperformance. In general, a treatment technologyis considered innovative if it has had limitedfull-scale application. Often, these technologiesare established in other fields, such as chemicalmanufacturing or hazardous waste treatment. In
such cases, it is the application of a technologyor process at a waste site (to soils, sediments,sludge, and solid-matrix waste [such as miningslag] or groundwater) that is innovative, not thetechnology itself. Innovative technologies arediscussed in greater detail in Section 3.
Both innovative and established technologies aregrouped as source control treatment or in situgroundwater treatment technologies on the basisof the type of application most commonlyassociated with the technology. Sometechnologies may be used for both source controland in situ groundwater treatment. Thesetechnologies and their respective groupings arelisted in Appendix F.
○ ○ ○ ○ ○ ○ ○ ○ ○ ○ ○ ○ ○ ○ ○ ○ ○ ○ ○ ○ ○ ○ ○ ○
Sources�of�Information�for�This
Report
EPA initially used RODs to compile informationabout Superfund remedial actions and used on-scene coordinator (OSC) reports and the OSWERRemoval Tracking System to compile data onremoval actions. EPA then verified and updatedthe draft information through interviews withremedial project managers (RPMs), OSCs, andother contacts for each site. Project status datain the Comprehensive Environmental Response,Compensation, and Liability Information System(CERCLIS 3), EPA’s Superfund tracking system,provided more detailed information about thespecific portion of the remedy involving atreatment technology. In addition, informationabout technologies and sites identified here maydiffer from information found in the CERCLIS3 database. Such differences occur when changesare made in the remedy during the design phaseof the project. The changes may not haverequired official documentation (that is, a RODamendment or an explanation of significantdifferences [ESD]), and hence, would not berecorded in CERCLIS 3.
○ ○ ○ ○ ○ ○ ○ ○ ○ ○ ○ ○ ○ ○ ○ ○ ○ ○ ○ ○ ○ ○ ○ ○ ○ ○
Definitions�of�Specific�Treatment
Technologies
This document reports on the use of thetreatment technologies listed previously and onegroundwater containment technology, VEB. Thissection provides brief definitions of the 20 typesof source control (primarily soil) treatmenttechnologies, five types of in situ groundwatertreatment technologies, and one groundwatercontainment technology, as they are discussed
REMEDY�TYPE�SUMMARY
Source Control Treatment� Treatment of a contaminant source.� Can include any of the source control
treatment technologies described inthis report.
Source Control Containment� Containment of a contaminant source.� Can include the use of caps, liners,
covers, and landfilling both on andoff site.
Source Control Other� Other forms of remediation of a
contaminant source.� Can include institutional controls,
monitoring, and population relocation.
Groundwater Remedy� Remediation of a contaminated aquifer.� Can include any of the in situ
groundwater treatment technologiesdescribed in this report, groundwatercontainment using vertical engineeredbarriers, groundwater pump-and-treat,and other groundwater remedies suchas institutional controls, monitoring,and alternate drinking water supply.
3
Ov
erv
iew
: Treatm
en
t Tech
no
log
ies A
nn
ual Statu
s Re
po
rt
in this document. The definitions are based onthe Remediation Technologies Screening Matrixand Reference Guide, Version 3.0, which canbe viewed at the Federal RemediationTechnologies Roundtable (FRTR) web site athttp://www.frtr.gov. Sketches for some of thenewer innovative treatment technologies areprovided.
Source�Control�Treatment�Technologies
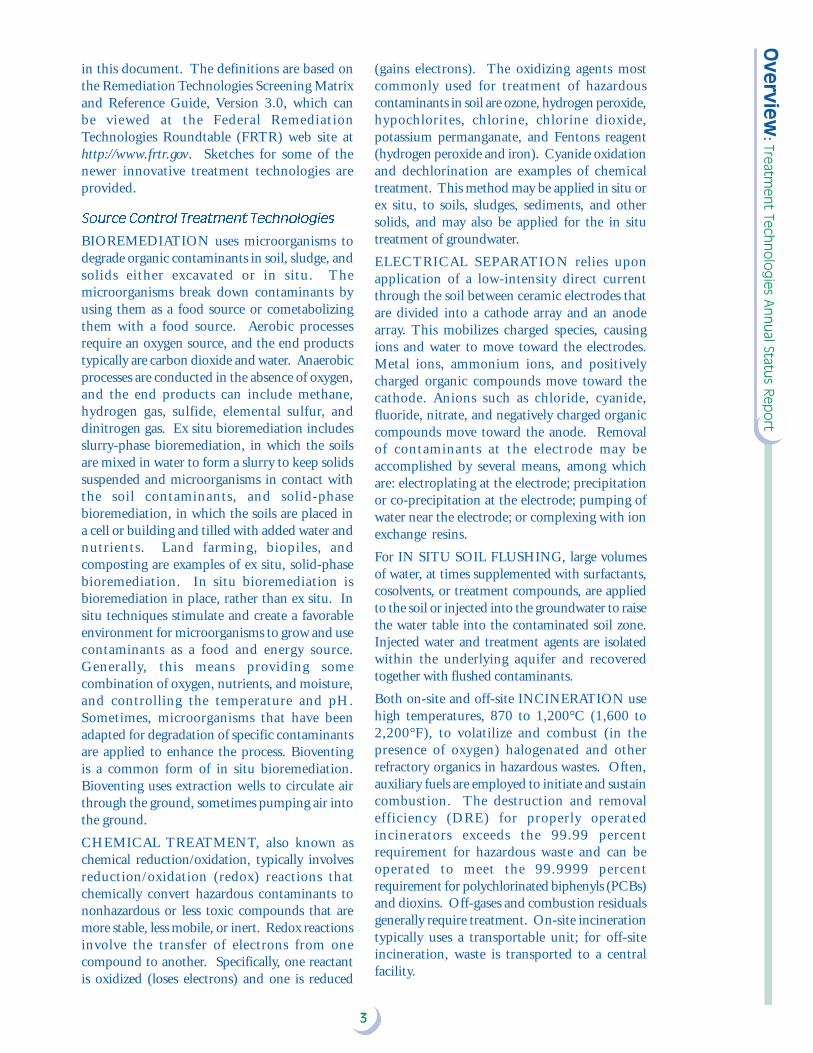
BIOREMEDIATION uses microorganisms todegrade organic contaminants in soil, sludge, andsolids either excavated or in situ. Themicroorganisms break down contaminants byusing them as a food source or cometabolizingthem with a food source. Aerobic processesrequire an oxygen source, and the end productstypically are carbon dioxide and water. Anaerobicprocesses are conducted in the absence of oxygen,and the end products can include methane,hydrogen gas, sulfide, elemental sulfur, anddinitrogen gas. Ex situ bioremediation includesslurry-phase bioremediation, in which the soilsare mixed in water to form a slurry to keep solidssuspended and microorganisms in contact withthe soil contaminants, and solid-phasebioremediation, in which the soils are placed ina cell or building and tilled with added water andnutrients. Land farming, biopiles, andcomposting are examples of ex situ, solid-phasebioremediation. In situ bioremediation isbioremediation in place, rather than ex situ. Insitu techniques stimulate and create a favorableenvironment for microorganisms to grow and usecontaminants as a food and energy source.Generally, this means providing somecombination of oxygen, nutrients, and moisture,and controlling the temperature and pH.Sometimes, microorganisms that have beenadapted for degradation of specific contaminantsare applied to enhance the process. Bioventingis a common form of in situ bioremediation.Bioventing uses extraction wells to circulate airthrough the ground, sometimes pumping air intothe ground.
CHEMICAL TREATMENT, also known aschemical reduction/oxidation, typically involvesreduction/oxidation (redox) reactions thatchemically convert hazardous contaminants tononhazardous or less toxic compounds that aremore stable, less mobile, or inert. Redox reactionsinvolve the transfer of electrons from onecompound to another. Specifically, one reactantis oxidized (loses electrons) and one is reduced
(gains electrons). The oxidizing agents mostcommonly used for treatment of hazardouscontaminants in soil are ozone, hydrogen peroxide,hypochlorites, chlorine, chlorine dioxide,potassium permanganate, and Fentons reagent(hydrogen peroxide and iron). Cyanide oxidationand dechlorination are examples of chemicaltreatment. This method may be applied in situ orex situ, to soils, sludges, sediments, and othersolids, and may also be applied for the in situtreatment of groundwater.
ELECTRICAL SEPARATION relies uponapplication of a low-intensity direct currentthrough the soil between ceramic electrodes thatare divided into a cathode array and an anodearray. This mobilizes charged species, causingions and water to move toward the electrodes.Metal ions, ammonium ions, and positivelycharged organic compounds move toward thecathode. Anions such as chloride, cyanide,fluoride, nitrate, and negatively charged organiccompounds move toward the anode. Removalof contaminants at the electrode may beaccomplished by several means, among whichare: electroplating at the electrode; precipitationor co-precipitation at the electrode; pumping ofwater near the electrode; or complexing with ionexchange resins.
For IN SITU SOIL FLUSHING, large volumesof water, at times supplemented with surfactants,cosolvents, or treatment compounds, are appliedto the soil or injected into the groundwater to raisethe water table into the contaminated soil zone.Injected water and treatment agents are isolatedwithin the underlying aquifer and recoveredtogether with flushed contaminants.
Both on-site and off-site INCINERATION usehigh temperatures, 870 to 1,200°C (1,600 to2,200°F), to volatilize and combust (in thepresence of oxygen) halogenated and otherrefractory organics in hazardous wastes. Often,auxiliary fuels are employed to initiate and sustaincombustion. The destruction and removalefficiency (DRE) for properly operatedincinerators exceeds the 99.99 percentrequirement for hazardous waste and can beoperated to meet the 99.9999 percentrequirement for polychlorinated biphenyls (PCBs)and dioxins. Off-gases and combustion residualsgenerally require treatment. On-site incinerationtypically uses a transportable unit; for off-siteincineration, waste is transported to a centralfacility.

Ov
erv
iew
: Tre
atm
en
t Te
chn
olo
gie
s A
nn
ual
Sta
tus
Re
po
rt
4
MECHANICAL SOIL AERATION agitatescontaminated soil, using tilling or other meansto volatilize contaminants.
NEUTRALIZATION is a chemical reactionbetween an acid and a base. The reactioninvolves acidic or caustic wastes that areneutralized (pH is adjusted toward 7.0), usingcaustic or acid additives.
OPEN BURN (OB) and OPEN DETONATION(OD) operations are conducted to destroy excess,obsolete, or unserviceable (EOU) munitions andenergetic materials. In OB operations,energetics or munitions are destroyed by self-sustained combustion, which is ignited by anexternal source, such as a flame, heat, or adetonation wave. In OD operations, explosivesand munitions are destroyed by detonation,which generally is initiated by an energeticcharge.
PHYSICAL SEPARATION processes usedifferent size sieves and screens to concentratecontaminants into smaller volumes. Mostorganic and inorganic contaminants tend tobind, either chemically or physically, to the finefraction of the soil. Fine clay and silt particlesare separated from the coarse sand and gravelsoil particles to concentrate the contaminantsinto a smaller volume of soil. The smaller volumethen can be treated further or disposed.
PHYTOREMEDIATION is a process that usesplants to remove, transfer, stabilize, or destroycontaminants in soil, sediment, and groundwater.The mechanisms of phytoremediation includeenhanced rhizosphere biodegradation (takes placein soil or groundwater immediately surroundingplant roots), phytoextraction (also known asphytoaccumulation, the uptake of contaminants
by plant roots and the translocation/accumulationof contaminants into plant shoots and leaves),phytodegradation (metabolism of contaminantswithin plant tissues), and phytostabilization(production of chemical compounds by plants toimmobilize contaminants at the interface of rootsand soil). Phytoremediation applies to allbiological, chemical, and physical processes thatare influenced by plants (including the rhizosphere)and that aid in cleanup of the contaminatedsubstances. Plants can be used in site remediation,both through the mineralization of toxic organiccompounds and through the accumulation andconcentration of heavy metals and other inorganiccompounds from soil into aboveground shoots.Phytoremediation may be applied in situ or exsitu, to soils, sludges, sediments, other solids, orgroundwater.
SOIL VAPOR EXTRACTION (SVE) is used toremediate unsaturated (vadose) zone soil. Avacuum is applied to the soil to induce thecontrolled flow of air and remove volatile andsome semivolatile organic contaminants from thesoil. SVE usually is performed in situ; however,in some cases, it can be used as an ex situtechnology.
For SOIL WASHING, contaminants sorbed ontofine soil particles are separated from bulk soilin a water-based system on the basis of particlesize. The wash water may be augmented with abasic leaching agent, surfactant, or chelatingagent or by adjustment of pH to help removeorganics and heavy metals. Soils and wash waterare mixed ex situ in a tank or other treatmentunit. The wash water and various soil fractionsare usually separated using gravity settling.
SOLIDIFICATION/STABILIZATION (S/S)reduces the mobility of hazardous substances andcontaminants in the environment through bothphysical and chemical means. The S/S processphysically binds or encloses contaminants within astabilized mass. S/S is performed both ex situ andin situ. Ex situ S/S requires excavation of thematerial to be treated, and the resultant materialmust be disposed. In situ S/S uses auger/caissonsystems and injector head systems to add bindersto the contaminated soil or waste withoutexcavation, and the resultant material is left in place.
SOLVENT EXTRACTION uses an organicsolvent as an extractant to separate organic andmetal contaminants from soil. The organicsolvent is mixed with contaminated soil in anextraction unit. The extracted solution then is
Model�of�Phytoremediation

5
Ov
erv
iew
: Treatm
en
t Tech
no
log
ies A
nn
ual Statu
s Re
po
rt
passed through a separator, where thecontaminants and extractant are separated fromthe soil. Organically bound metals may beextracted along with the target organiccontaminants.
For THERMAL DESORPTION, wastes areheated so that organic contaminants and watervolatilize. Typically, a carrier gas or vacuumsystem transports the volatilized water andorganics to a gas treatment system. Based onthe operating temperature of the desorber,thermal desorption processes can be categorizedinto two groups: high temperature thermaldesorption (HTTD) (320 to 560°C or 600 to1000°F) and low temperature thermaldesorption (LTTD) (90 to 320°C or 200 to600°F). Thermal desorption is an ex situtreatment process. In situ thermal desorptionprocesses are discussed below as thermallyenhanced recovery.
THERMALLY ENHANCED RECOVERY is anin situ treatment process that uses heat toincrease the volatilization rate of organics andfacilitate extraction. Volatilized contaminantsare typically removed from the vadose zone usingsoil vapor extraction. Specific types of thermallyenhanced recovery techniques include ContainedRecovery of Oily Waste (CROW™), radiofrequency heating, conductive heating, steamheating, in situ steam stripping, hot air injection,dynamic underground stripping, in situ thermaldesorption, and electrical resistance heating.Thermally enhanced recovery is usually appliedto contaminated soil but may also be applied togroundwater.
VITRIFICATION uses an electric current tomelt contaminated soil at elevated temperatures(1,600 to 2,000°C or 2,900 to 3,650°F). Uponcooling, the vitrification product is a chemicallystable, leach-resistant, glass and crystallinematerial similar to obsidian or basalt rock. Thehigh temperature component of the processdestroys or removes organic materials.Radionuclides and heavy metals are retainedwithin the vitrified product. Vitrification maybe conducted in situ or ex situ.
In�Situ�Groundwater�Treatment
Technologies
AIR SPARGING involves the injection of air oroxygen through a contaminated aquifer. Injectedair traverses horizontally and vertically in channelsthrough the soil column, creating an underground
stripper that removes volatile and semivolatileorganic contaminants by volatilization. Theinjected air helps to flush the contaminants intothe unsaturated zone. SVE usually isimplemented in conjunction with air spargingto remove the generated vapor-phasecontamination from the vadose zone. Oxygenadded to the contaminated groundwater andvadose-zone soils also can enhancebiodegradation of contaminants below and abovethe water table.
With IN SITU GROUNDWATERBIOREMEDIATION, substrates, nutrients, oran oxygen source (for aerobic processes), arepumped into an aquifer through wells to enhancebiodegradation of contaminants in groundwater.Specific types of enhanced in situ groundwaterbioremediation include biosparging andbioslurping.
DUAL-PHASE EXTRACTION, also known asmulti-phase extraction, uses a vacuum systemto remove various combinations ofcontaminated groundwater, separate-phasepetroleum product, and vapors from thesubsurface. The system lowers the water tablearound the well, exposing more of the formation.Contaminants in the newly exposed vadose zoneare then accessible to vapor extraction. Onceabove ground, the extracted vapors or liquid-phase organics and ground water are separatedand treated.
For IN-WELL AIR STRIPPING, air is injectedinto a double-screened well, causing the volatileorganic compounds in the contaminatedgroundwater to transfer from the dissolved phaseto the vapor phase in air bubbles. As the airbubbles rise to the surface of the water, thevapors are drawn off and treated by a SVEsystem.
Model�of�an�Air�Sparging�System

Ov
erv
iew
: Tre
atm
en
t Te
chn
olo
gie
s A
nn
ual
Sta
tus
Re
po
rt
6
Model�of�a�Permeable�Reactive�Barrier
PERMEABLE REACTIVE BARRIERS (PRBs)also known as passive treatment walls, are installedacross the flow path of a contaminatedgroundwater plume, allowing the water portionof the plume to flow through the wall. Thesebarriers allow the passage of water whileprohibiting the movement of contaminants byemploying agents within the wall such as zero-valent metals, chelators, sorbents, and microbes.The contaminants are either degraded or retainedin a concentrated form by the barrier material,which may need to be replaced periodically.
In�Situ�Groundwater�Containment
Technology
VERTICAL ENGINEERED BARRIERS (VEBs)are subsurface barriers made of an impermeablematerial designed to contain or divert groundwater.VEBs can be used to contain contaminatedgroundwater, divert uncontaminated groundwaterfrom a contaminated area, or divert contaminatedgroundwater from a drinking water intake or otherprotected resource.
Model�of�a�Vertical�Engineered�Barrier

7
Se
ction
1: O
vervie
w o
f RO
Ds
As of August 2000, 1,234 sites were on the NationalPriorities List (NPL); 217 sites had been removedfrom the NPL. Therefore, 1,451 sites are or havebeen listed. An additional 59 sites are proposedfor the NPL. Some sites may cover a large area,include several types of contaminated media, orinclude areas in which the types of contaminationdiffer. To facilitate the establishment of remediesat a complex site, the site may be divided intooperable units, with separate remedies for each.Remedies for NPL sites are documented in Recordsof Decision (RODs). A separate ROD may bedeveloped for each operable unit. In addition, eachoperable unit may require a number of RODs toaddress different media within that operable unitor to revise the selected remedy. Therefore, eachsite may have multiple RODs.
Through fiscal year (FY) 1999, approximately 2,292RODs (including ROD amendments) had beensigned. Of them, 1,561 RODs for remedial actionsaddress the source of contamination, such as soil,sludge, sediments, nonaqueous phase liquids(NAPL), leacheate, and solid-matrix wastes; theyare referred to as “source control” RODs. AppendixF to this report provides the definitions of the
various ROD types and the methodology used toassign a type to each ROD. A type was assigned toeach ROD based on the remedies in the ROD. Atype was then assigned to each site based on thetypes of RODs issued for that site. For sites forwhich a number of RODs have been signed, thehierarchy presented in Appendix F was used toassign a site type.
At over half of NPL sites (58 percent), sourcecontrol or groundwater treatment has beenimplemented or is planned as a remedy for someportion of the site. For another 15 percent of sites,the remedy does not include source control orgroundwater treatment but does include sourcecontainment or off-site disposal of the source. For17 percent of sites, no ROD has been issued.Figure 1 summarizes the number of NPL sites foreach type of remedy.
Previous editions of the ASR quantified the remedytypes at Superfund sites based on the remediesselected in RODs. However, the remedies selectedin RODs may not be the remedies actuallyimplemented at a site. For example, a treatmenttechnology that was selected in a ROD based onbench-scale treatability testing may prove to beineffective in pilot-scale tests conducted during thedesign phase; in such a case, a different remedy
Section 1: Overview of RODs
Sources: 1, 2, 3, 4, 5, 6: Data sources are listed in the References and Data Sources section on page 38.Note: Appendix F describes the methodology used to indentify remedy types for each site.
Figure�1.��Superfund�Remedial�Actions:��Actual�Remedy�Types
At�Sites�On�The�National�Priorities�List�(FY�1982�-�FY�1999)

8
Sect
ion
1:
Ove
rvie
w o
f R
OD
s may be substituted. Additional contamination atthe site may be discovered during theimplementation of a remedy; a remedy changemight then be necessary. Further, a particularremedy may have been included in a ROD only asa contingent remedy, with future site investigationsrevealing that implementation of that contingentremedy was not warranted. When remedies arechanged, the changes usually are documented in aROD amendment or Explanation of SignificantDifference (ESD). However, some remedy changesare not documented in that manner.
The information used to develop Figure 1 reflectsnot only the remedies selected in RODs, but alsothe remedies actually implemented or currentlyplanned at those sites. Sources for the informationinclude the RODs, ROD amendments, and ESDspublished for each site, and contacts with remedialproject managers (RPM) to identify the mostcurrent remedy selected for each site. Figure 1therefore reflects the current status of remedialactions at NPL sites, rather than only thedocumented historical decisions.
The HTML version of the tenth edition of the ASRincludes a downloadable spreadsheet to help sitemanagers, the regulated community, and remediationprofessionals identify sites at which particular remedytypes are being implemented. The spreadsheetcontains information for each NPL site where a RODhas been issued, including the site name, location,
and site type. The HTML version of the ASR canbe found at http://clu-in.org/asr.
○ ○ ○ ○ ○ ○ ○ ○ ○ ○ ○ ○ ○ ○ ○ ○ ○ ○ ○ ○
RODs�Signed�by�Fiscal�Year
Data from FY 1998 and FY 1999 RODs areincluded in this tenth edition of the ASR. Since1988, the total number of RODs signed in eachFY has fluctuated between 142 and 197. Figure 2shows the number of source control RODs,compared with the total number of RODs for eachFY since FY 1982. Non source control RODs arethose selecting groundwater remedies, no action,or no further action without selecting any sourcecontrol remedies. Those RODs that select both asource control remedy and a groundwater remedyare considered source control RODs.
Since 1988, the total number of source controlRODs has varied between 97 and 135. Sourcecontrol RODs represented between 58 percent and74 percent of all RODs signed in each of theseyears. In FY 1999, source control RODsrepresented 74 percent of all RODs signed in thatyear. Appendix F presents the definitions of thevarious ROD types and the methodology used toassign a type to each ROD.
As Figure 2 shows, from FY 1996 to FY 1999 therewas little change in the total number of RODs andthe percentage of RODs that specified a sourcecontrol remedy.
Figure�2.��Superfund�Remedial�Actions:
RODs�Signed�by�Fiscal�Year�(FY�1982�-�FY�1999)
Sources: 3, 4, 5, 6: Data sources are listed in the References and Data Sources section on page 38.

9
Se
ction
1: O
vervie
w o
f RO
Ds
○ ○ ○ ○ ○ ○ ○ ○ ○ ○ ○ ○ ○ ○ ○ ○
Source�Control�RODs
Source control RODs can be delineated further bythe general type of remedy selected: (1) RODsspecifying treatment, (2) RODs specifying on-sitecontainment or off-site disposal only, and (3) RODsspecifying institutional controls or other actions(such as monitoring or relocation of the affectedcommunity). Appendix F describes in detail howremedy and ROD types are identified.
Shown in Figure 3 is the number of source controlRODs of each type. RODs that select treatmentmay also include containment of treatment residuesor waste at another part of the site. In FY 1998and 1999, the number of source control treatment
RODs was 47 and 49, respectively, which is anincrease from the 41 source control treatmentRODs issued in 1997. In all years from FY 1988through FY 1999, the number of source controltreatment RODs was greater than 41. Figure 3also shows that, since FY 1991, the number ofRODs specifying other remedies, such asinstitutional controls, monitoring, relocation, orother nontreatment remedies, has increased. InFY 1998 and FY 1999, the highest number ofRODs specifying other remedies occurred, with25 such RODs in FY 1988 and 22 in FY 1999.Cumulatively, 899 source control RODs are of thetype “treatment”, 563 “containment or disposalonly”, and 99 “other”.
Figure�3.��Superfund�Remedial�Actions:
�Source�Control�RODs�(FY�1982�-�FY�1999)
Sources: 3, 4, 5, 6: Data sources are listed in the References and Data Sources section on page 38.

10
Sect
ion
2: T
reat
me
nt
Tech
no
log
ies
for
Sou
rce
Co
ntr
ol
Source control treatment technologies are designedto treat soil, sediment, sludge, or solid-matrixwastes (in other words, the source ofcontamination) and are not designed to treatgroundwater. In this section, source controlRODs are discussed first; however, most of theinformation in this section focuses ontechnologies, rather than RODs. It is importantto note that in each ROD that specified treatment,more than one technology may have been selected.Groundwater technologies are discussed inSection 4. Some of the figures presented in thissection include information on in situ groundwatertreatment to facilitate comparison of sourcecontrol treatment to in situ groundwatertreatment.
○ ○ ○ ○ ○ ○ ○ ○ ○ ○ ○ ○ ○ ○ ○ ○
Source�Control�RODs
The Superfund Amendments and ReauthorizationAct of 1986 (SARA) expressed a preference forpermanent remedies (that is, treatment) overcontainment or disposal in the remediation ofSuperfund sites. From FY 1988 through FY 1993,approximately 70 percent of source control RODscontained provisions for treatment of wastes. Asshown in Figure 4, the percentage of RODs thatspecify source control treatment has decreased from
a high of 73 percent (FY 1989, 1991, and 1992) tothe current level of 47 percent (FY 1999). However,the percentage of source control treatment RODseach year has exceeded the percentage of sourcecontrol containment RODs for the past 13 years,with the exception of FY 1997.
One notable observation is the increase in sourcecontrol RODs that select “other” remedies, suchas institutional controls, monitoring, and relocationof affected populations. Such “other” remediesrepresented less than 10 percent of source controlRODs from FY 1982 through FY 1996, but thatfigure has increased to about 20 percent of all sourcecontrol RODs in FY 1999. Cumulatively, 57percent of source control RODs are of the type“treatment”, 36 percent “containment or disposal”,and 6 percent “other source remedy”.
○ ○ ○ ○ ○ ○ ○ ○ ○ ○ ○ ○ ○ ○ ○ ○
In�Situ�Versus�Ex�Situ
Technologies
In situ technologies for source control are thoseapplications in which the contaminated medium istreated or the contaminant is removed from thecontaminated medium without excavating,pumping, or otherwise moving the contaminatedmedium to the surface. Implementation of ex situtechnologies requires excavation, dredging, or otherprocesses to remove the contaminated mediumbefore treatment either on site or off site.
Through FY 1999, 739 treatment technologieshave been, are currently being, or are planned to
Section 2: TreatmentTechnologies for SourceControl
Figure�4.��Superfund�Remedial�Actions:
Trends�in�Types�of�Source�Control�RODs�(FY�1982�-�FY�1999)
Sources: 3, 4, 5, 6: Data sources are listed in the References and Data Sources section on page 38.

11
Se
ction
2: Tre
atme
nt Te
chn
olo
gie
s for So
urce
Co
ntro
l
be implemented for source control. Figure 5provides a cumulative overview of in situ and exsitu treatment technologies selected for sourcecontrol. The cumulative number of source controltreatment RODs exceeds the total number oftreatment technologies because the remedy at somesites was changed from one that included a sourcecontrol treatment technology to one that does not.Therefore, the remedies described in RODs do notalways represent what is actually occurring at a site.
As Figure 5 indicates, SVE (196 projects, 26percent), solidification/stabilization (46 projects,6 percent), and bioremediation (35 projects, 5percent) are the most common in situtechnologies. The most common ex situtechnologies are solidification/stabilization (137projects, 19 percent); incineration (136 projects,19 percent), both off-site (94 projects, 13 percent)and on-site (42 projects, 6 percent); thermaldesorption (61 projects, 8 percent); andbioremediation (49 projects, 7 percent). Some42 percent of all treatments selected for sourcecontrol at Superfund remedial action sites werein situ technologies.
The HTML version of the tenth edition of theASR includes a downloadable spreadsheet to help
site managers, the regulated community, andremediation professionals identify sites at whichparticular in situ and ex situ treatment technologiesare being employed. The spreadsheet containsinformation for each source control treatmentproject tracked in the ASR, including the sitename, location, treatment technology, and whetherthe treatment is in situ or ex situ. The spreadsheetcan be used by RPMs, OSCs, and remediationprofessionals to identify the sites usingtechnologies similar to their own, and assist intechnology transfer between those sites. TheHTML version of the ASR can be found athttp:\\clu-in.org\asr.
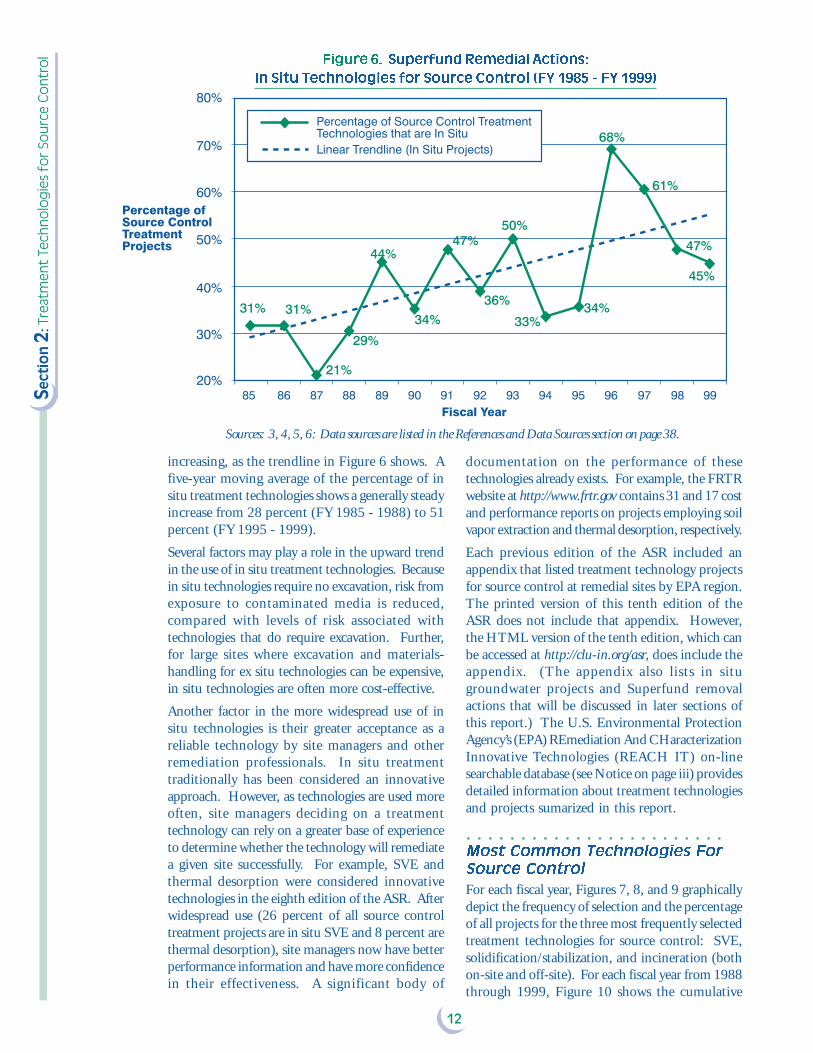
In situ treatment technologies increased as apercentage of all treatment technology projectsbetween FY 1985 and FY 1996. While thepercentage of in situ treatment projects decreasedfrom a peak of 68 percent in FY 1996 to 45percent in FY 1999, on average they remain at 42percent (see Figure 5) of all source controltreatment technologies from FY 1982 through FY1999. Figure 6 presents the number of in situtechnologies as a percentage of all treatmenttechnologies for source control by fiscal year.Over time, use of in situ technologies has been
Figure�5.��Superfund�Remedial�Actions:�Summary�of�Source�Control
Treatment�Technologies�(FY�1982�-�FY�1999)
Sources: 3, 4, 5, 6: Data sources are listed in the References and Data Sources section on page 38.
12
Sect
ion
2: T
reat
me
nt
Tech
no
log
ies
for
Sou
rce
Co
ntr
ol
increasing, as the trendline in Figure 6 shows. Afive-year moving average of the percentage of insitu treatment technologies shows a generally steadyincrease from 28 percent (FY 1985 - 1988) to 51percent (FY 1995 - 1999).
Several factors may play a role in the upward trendin the use of in situ treatment technologies. Becausein situ technologies require no excavation, risk fromexposure to contaminated media is reduced,compared with levels of risk associated withtechnologies that do require excavation. Further,for large sites where excavation and materials-handling for ex situ technologies can be expensive,in situ technologies are often more cost-effective.
Another factor in the more widespread use of insitu technologies is their greater acceptance as areliable technology by site managers and otherremediation professionals. In situ treatmenttraditionally has been considered an innovativeapproach. However, as technologies are used moreoften, site managers deciding on a treatmenttechnology can rely on a greater base of experienceto determine whether the technology will remediatea given site successfully. For example, SVE andthermal desorption were considered innovativetechnologies in the eighth edition of the ASR. Afterwidespread use (26 percent of all source controltreatment projects are in situ SVE and 8 percent arethermal desorption), site managers now have betterperformance information and have more confidencein their effectiveness. A significant body of
documentation on the performance of thesetechnologies already exists. For example, the FRTRwebsite at http://www.frtr.gov contains 31 and 17 costand performance reports on projects employing soilvapor extraction and thermal desorption, respectively.
Each previous edition of the ASR included anappendix that listed treatment technology projectsfor source control at remedial sites by EPA region.The printed version of this tenth edition of theASR does not include that appendix. However,the HTML version of the tenth edition, which canbe accessed at http://clu-in.org/asr, does include theappendix. (The appendix also lists in situgroundwater projects and Superfund removalactions that will be discussed in later sections ofthis report.) The U.S. Environmental ProtectionAgency’s (EPA) REmediation And CHaracterizationInnovative Technologies (REACH IT) on-linesearchable database (see Notice on page iii) providesdetailed information about treatment technologiesand projects sumarized in this report.
○ ○ ○ ○ ○ ○ ○ ○ ○ ○ ○ ○ ○ ○ ○ ○ ○ ○ ○ ○ ○ ○ ○ ○
Most�Common�Technologies�For
Source�Control
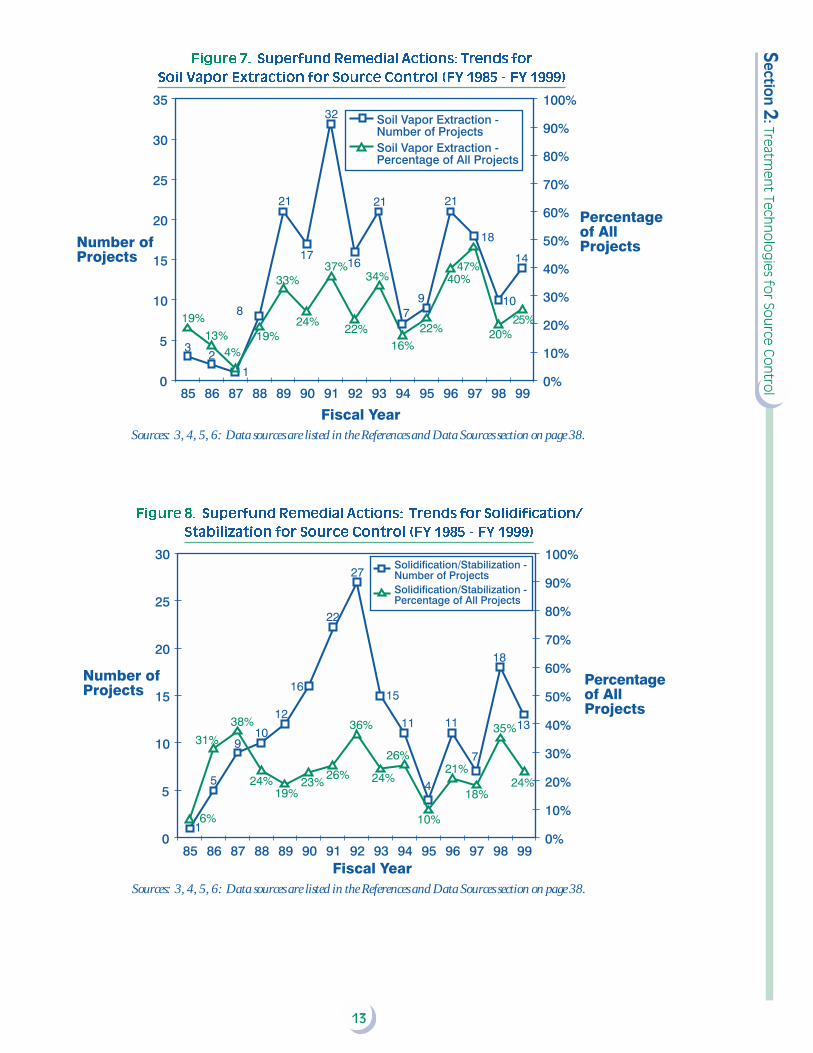
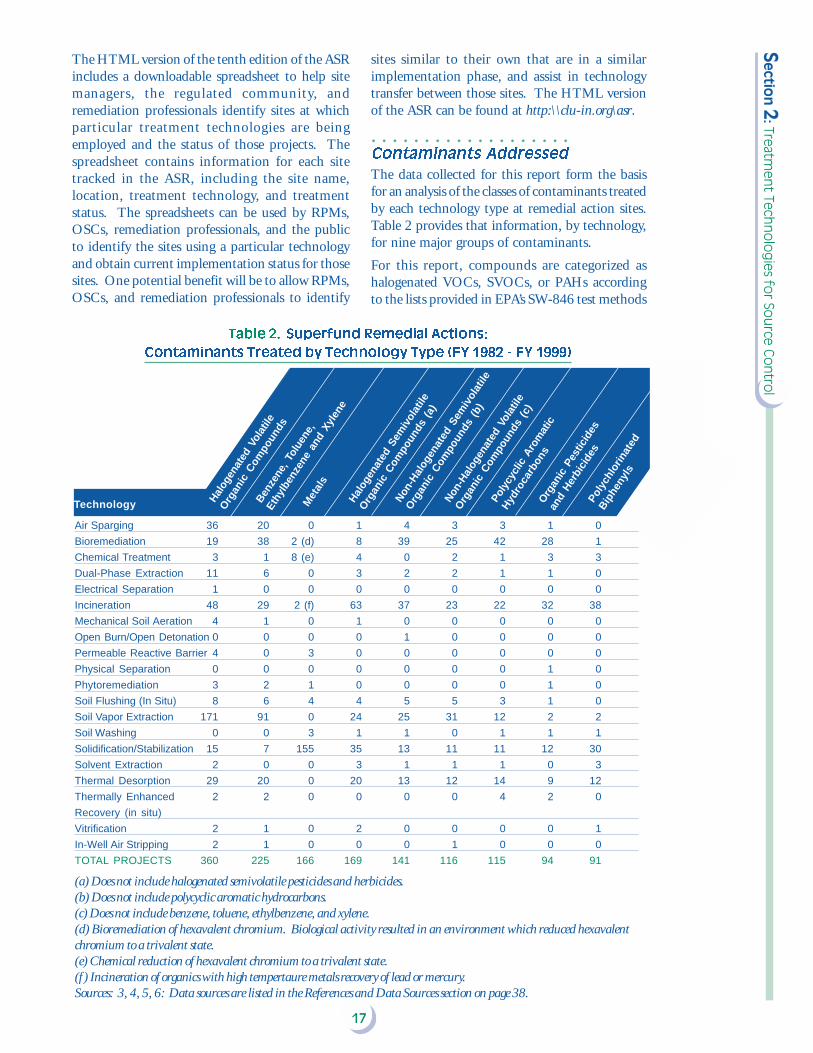
For each fiscal year, Figures 7, 8, and 9 graphicallydepict the frequency of selection and the percentageof all projects for the three most frequently selectedtreatment technologies for source control: SVE,solidification/stabilization, and incineration (bothon-site and off-site). For each fiscal year from 1988through 1999, Figure 10 shows the cumulative
Figure�6.��Superfund�Remedial�Actions:
In�Situ�Technologies�for�Source�Control�(FY�1985�-�FY�1999)
Sources: 3, 4, 5, 6: Data sources are listed in the References and Data Sources section on page 38.
13
Se
ction
2: Tre
atme
nt Te
chn
olo
gie
s for So
urce
Co
ntro
lFigure�7.��Superfund�Remedial�Actions:�Trends�for
Soil�Vapor�Extraction�for�Source�Control�(FY�1985�-�FY�1999)
Sources: 3, 4, 5, 6: Data sources are listed in the References and Data Sources section on page 38.
Figure�8.��Superfund�Remedial�Actions:��Trends�for�Solidification/
Stabilization�for�Source�Control�(FY�1985�-�FY�1999)
Sources: 3, 4, 5, 6: Data sources are listed in the References and Data Sources section on page 38.

14
Sect
ion
2: T
reat
me
nt
Tech
no
log
ies
for
Sou
rce
Co
ntr
ol
number of applications for source control. As thefigure shows, SVE, solidification/stabilization,incineration, bioremediation, thermal desorption,and in situ soil flushing continue to represent mostof the applications of source control treatmentremedies at remedial action sites.
○ ○ ○ ○ ○ ○ ○ ○ ○ ○ ○ ○ ○ ○ ○ ○ ○ ○ ○
Implementation�Status�of
Treatment�Technology�Projects
For in situ, ex situ, and groundwater treatmenttechnologies, Figure 11 shows how the status ofprojects has changed since the publication of theninth edition of the ASR. Published in April 1999,the ninth edition included data from FY 1982through FY 1997 RODs, updated by RPMs throughAugust 1998. This tenth edition of the ASR includesdata from FY 1982 through FY 1999 RODs,updated by RPMs through August 2000.Completed projects are those where the treatmenthas been performed and is no longer ongoing.Projects that are completed may not have met allcleanup goals.
Some observations on the status of treatmentselected in FY 1998 and FY 1999 at Superfundremedial action sites are:
• 106 additional treatment technology projects forsource control and 27 projects for in situgroundwater treatment were selected.
• Six projects selected in the period have beencompleted, including three ex situ solidification/stabilization projects, two off-site incinerationprojects, and one thermal desorption project.The completed projects used establishedtechnologies that generally require relativelyshort treatment times.
• An additional 40 projects became operational.• An additional 15 projects have progressed
Figure�9.��Superfund�Remedial�Actions:
Trends�for�Incineration�for�Source�Control�(FY�1985�-�FY�1999)
Sources: 3, 4, 5, 6: Data sources are listed in the References and Data Sources section on page 38.
Figure�10.��Superfund�Remedial
Actions:��Cumulative�Trends�for�Most
Common�Technologies�for�Source
Control�(FY�1988�-�FY�1999)
Sources: 3, 4, 5, 6:Data sources are listedin the References andData Sources sectionon page 38.

15
Se
ction
2: Tre
atme
nt Te
chn
olo
gie
s for So
urce
Co
ntro
l
beyond the design phase, and the remedies arebeing installed.
Some observations based on the data in Figure11 are:
• In August 1998, 51 percent of ex situ sourcecontrol projects were completed, and 25 percentwere in the design phase. As of August 2000,the percentage of ex situ source control projectsthat were completed increased to 65 percent,and the percentage in the design phase decreasedto 17 percent.
• The percentage of completed in situ sourcecontrol projects increased from 19 percent inAugust 1998 to 23 percent in August 2000.
• The percentage of completed groundwaterprojects increased from 4 percent in August 1998to 5 percent in August 2000.
For each technology type, Table 1 provides asummary of project status. Among ex situtechnologies, bioremediation represents the largestnumber of projects (24) that are operational, eventhough it is only the fourth most common ex situtechnology (see Figure 5). That high percentage is
most likely the result of the length of time requiredfor bioremediation, compared with other ex situtechnologies. For bioremediation, which enhancesthe ability of microorganisms to degradecontaminants, the time required to reach cleanupgoals often is limited by the natural degradationprocess. The rate of degradation also variesdepending on the contaminant. Other factors suchas temperature and moisture, which are influencedby the weather, play a large role in determiningthe degradation rate for bioremediation. Becauseof those considerations, treatment bybioremediation typically requires a longer periodof time than other ex situ technologies, such asincineration, thermal desorption, or solidification/stabilization, for which the treatment rate is limitedprimarily by the capacity and throughput of theequipment used.
Among in situ technologies, SVE represents thelargest number of projects. About 80 percent ofthe SVE projects are in the operational or completedphase. Among in situ groundwater treatmentprojects, air sparging is the most frequently selectedtechnology.
Figure�11.��Superfund�Remedial�Actions:�Treatment
Technologies�Status�by�Technology�Type
Sources: 3, 4, 5, 6: Data sources are listed in the References and Data Sources section on page 38.

16
Sect
ion
2: T
reat
me
nt
Tech
no
log
ies
for
Sou
rce
Co
ntr
ol Table�1.��Superfund�Remedial�Actions:
Project�Status�of�Treatment�Technologies�(FY�1982�-�FY�1999)
Technology Predesign/ Design Complete/ Operational Completed TotalDesign Being Installed
Ex Situ Source ControlSolidification/Stabilization 31 7 13 86 137
Incineration (off-site) 6 2 7 79 94
Thermal Desorption 12 4 5 40 61
Bioremediation 10 1 24 14 49
Incineration (on-site) 1 0 1 40 42
Chemical Treatment 4 0 2 4 10
Neutralization 0 0 3 4 7
Soil Washing 2 1 1 2 6
Mechanical Soil Aeration 0 1 0 4 5
Soil Vapor Extraction 1 1 2 1 5
Solvent Extraction 2 1 0 1 4
Open Burn/Open Detonation 0 0 1 1 2
Vitrification 2 0 0 0 2
Physical Separation 0 0 0 1 1
Total 71 18 59 277 425
Percentage of Ex Situ Technologies 17% 4% 14% 65% —
Percentage of All Source 10% 2% 8% 37% 58%
Control Technologies
Percentage of All Treatment Technologies 9% 2% 7% 33% 51%
In Situ Source ControlSoil Vapor Extraction 31 10 114 41 196
Solidification/Stabilization 15 3 5 23 46
Bioremediation 9 3 20 3 35
Soil Flushing 6 0 9 1 16
Thermally Enhanced Recovery 3 0 2 1 6
Chemical Treatment 3 1 0 1 5
Phytoremediation 2 1 2 0 5
Dual-Phase Extraction 0 2 1 0 3
Electrical Separation 0 1 0 0 1
Vitrification 0 0 0 1 1
Total 69 21 153 71 314
Percentage of In Situ Technologies 22% 6% 49% 23% —
Percentage of All Source 9% 3% 21% 10% 42%
Control Technologies
Percentage of All Treatment Technologies 8% 3% 18% 9% 38%
In Situ GroundwaterAir Sparging 12 1 32 3 48
Bioremediation 4 0 16 1 21
Dual-Phase Extraction 0 0 9 1 10
Permeable Reactive Barrier 2 2 4 0 8
Phytoremediation 3 0 1 0 4
Chemical Treatment 1 0 1 0 2
In-Well Air Stripping 1 0 1 0 2
Total 23 3 64 5 95
Percentage of Groundwater Technologies 24% 3% 67% 5% —
Percentage of All Technologies 3% 0% 8% 1% 11%
TOTAL FOR ALL TREATMENTS 163 42 276 353 834PERCENTAGE OF TOTAL FOR ALL 20% 5% 33% 42% —
TREATMENTS
Sources: 3, 4, 5, 6: Data sources are listed in the References and Data Sources section on page 38.
17
Se
ction
2: Tre
atme
nt Te
chn
olo
gie
s for So
urce
Co
ntro
lThe HTML version of the tenth edition of the ASRincludes a downloadable spreadsheet to help sitemanagers, the regulated community, andremediation professionals identify sites at whichparticular treatment technologies are beingemployed and the status of those projects. Thespreadsheet contains information for each sitetracked in the ASR, including the site name,location, treatment technology, and treatmentstatus. The spreadsheets can be used by RPMs,OSCs, remediation professionals, and the publicto identify the sites using a particular technologyand obtain current implementation status for thosesites. One potential benefit will be to allow RPMs,OSCs, and remediation professionals to identify
sites similar to their own that are in a similarimplementation phase, and assist in technologytransfer between those sites. The HTML versionof the ASR can be found at http:\\clu-in.org\asr.
○ ○ ○ ○ ○ ○ ○ ○ ○ ○ ○ ○ ○ ○ ○ ○ ○ ○ ○
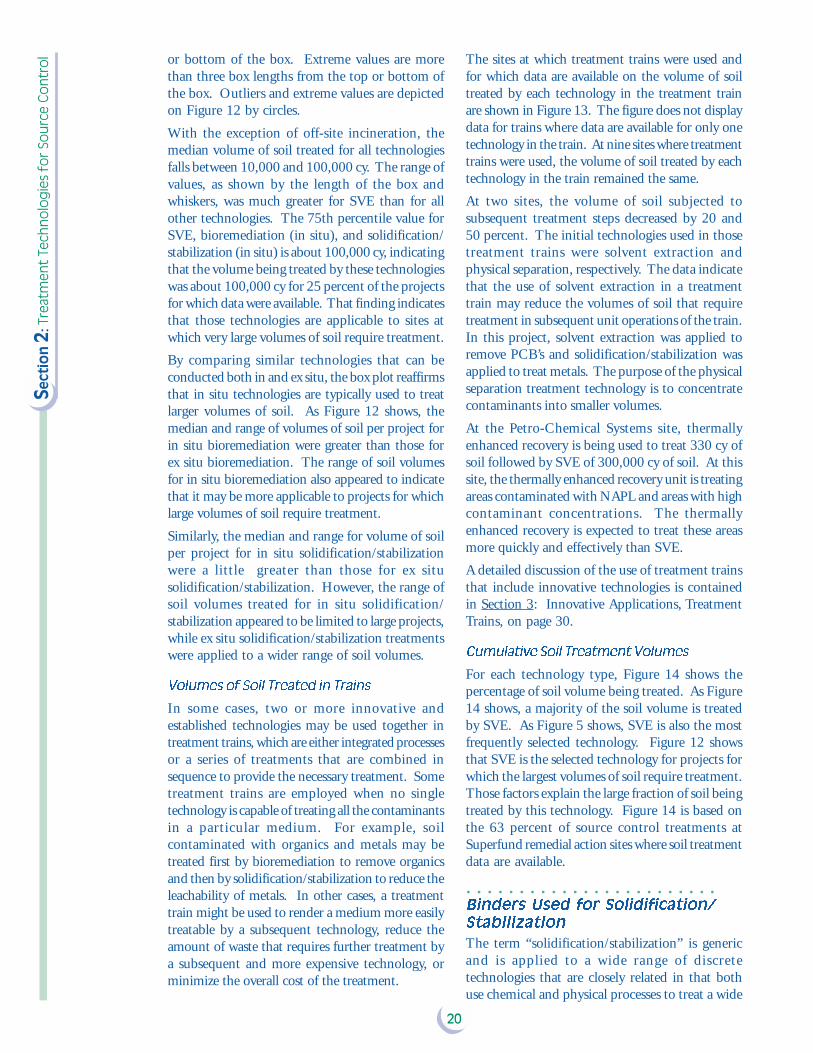
Contaminants�Addressed
The data collected for this report form the basisfor an analysis of the classes of contaminants treatedby each technology type at remedial action sites.Table 2 provides that information, by technology,for nine major groups of contaminants.
For this report, compounds are categorized ashalogenated VOCs, SVOCs, or PAHs accordingto the lists provided in EPA’s SW-846 test methods
Table�2.��Superfund�Remedial�Actions:
Contaminants�Treated�by�Technology�Type�(FY�1982�-�FY�1999)
Org
anic
Pes
ticid
es
and
Herb
icid
es
Poly
cycl
ic A
rom
atic
Hyd
roca
rbon
s
Non-
Halo
gena
ted
Vola
tile
Org
anic
Com
poun
ds (
c)
Halo
gena
ted
Sem
ivol
atile
Org
anic
Com
poun
ds (
a)
Met
als
Benz
ene,
Tol
uene
,
Ethy
lben
zene
and
Xyl
ene
Air Sparging 36 20 0 1 4 3 3 1 0
Bioremediation 19 38 2 (d) 8 39 25 42 28 1
Chemical Treatment 3 1 8 (e) 4 0 2 1 3 3
Dual-Phase Extraction 11 6 0 3 2 2 1 1 0
Electrical Separation 1 0 0 0 0 0 0 0 0
Incineration 48 29 2 (f) 63 37 23 22 32 38
Mechanical Soil Aeration 4 1 0 1 0 0 0 0 0
Open Burn/Open Detonation 0 0 0 0 1 0 0 0 0
Permeable Reactive Barrier 4 0 3 0 0 0 0 0 0
Physical Separation 0 0 0 0 0 0 0 1 0
Phytoremediation 3 2 1 0 0 0 0 1 0
Soil Flushing (In Situ) 8 6 4 4 5 5 3 1 0
Soil Vapor Extraction 171 91 0 24 25 31 12 2 2
Soil Washing 0 0 3 1 1 0 1 1 1
Solidification/Stabilization 15 7 155 35 13 11 11 12 30
Solvent Extraction 2 0 0 3 1 1 1 0 3
Thermal Desorption 29 20 0 20 13 12 14 9 12
Thermally Enhanced 2 2 0 0 0 0 4 2 0
Recovery (in situ)
Vitrification 2 1 0 2 0 0 0 0 1
In-Well Air Stripping 2 1 0 0 0 1 0 0 0
TOTAL PROJECTS 360 225 166 169 141 116 115 94 91
(a) Does not include halogenated semivolatile pesticides and herbicides.(b) Does not include polycyclic aromatic hydrocarbons.(c) Does not include benzene, toluene, ethylbenzene, and xylene.(d) Bioremediation of hexavalent chromium. Biological activity resulted in an environment which reduced hexavalentchromium to a trivalent state.(e) Chemical reduction of hexavalent chromium to a trivalent state.(f ) Incineration of organics with high tempertaure metals recovery of lead or mercury.Sources: 3, 4, 5, 6: Data sources are listed in the References and Data Sources section on page 38.
Poly
chlo
rinat
ed
Bip
heny
ls
Technology Halo
gena
ted
Vola
tile
Org
anic
Com
poun
ds
Non
-Hal
ogen
ated
Sem
ivol
atile
Org
anic
Com
poun
ds (
b)

18
Sect
ion
2: T
reat
me
nt
Tech
no
log
ies
for
Sou
rce
Co
ntr
ol 8010, 8270, and 8310, with the exceptions noted
above. Overall, approximately 80 percent of theSuperfund remedial projects address organics, withslightly more than 20 percent of projects addressingmetals. The number of projects in Table 2 exceedsthe total number of projects in Table 1 becausesome projects involve more than one type ofcontaminant. Such projects are therefore listed inTable 2 a number of times, once for eachcontaminant type.
The selection of a treatment technology for a siteoften depends on the physical and chemicalproperties of the contaminants at the site. Forexample, VOCs are amenable to treatment by certaintechnologies, such as SVE, because of their volatility.
In other cases, metals, which are not volatile and donot degrade, are not amenable to treatment by SVE,thermal desorption, or bioremediation. However,because metals form insoluble compounds whencombined with appropriate additives, such as Portlandcement, solidification/stabilization is most often usedfor treatment of those contaminants.
As Table 2 shows, halogenated VOCs, BTEX, andnon-halogenated VOCs are being treated mostoften by SVE. Non-halogenated SVOCs and PAHsare being treated most often by bioremediation.PCBs and halogenated SVOCs are being treatedmost often by incineration. Metals are beingtreated almost exclusively by solidification/stabilization.
Number ofTotal Number Projects with Quantity (cubic yards)(a)
Technology of Projects Data Minimum Median(a)Average Maximum Total Quantity
Ex SituBioremediation 49 44 21 14,000 77,000 1,900,000 3,400,000
Chemical Treatment 10 6 13,000 18,000 19,000 30,000 120,000
Incineration (off-site) 94 47 5 1,000 4,600 27,000 220,000
Incineration (on-site) 42 33 12 21,000 53,000 330,000 1,800,000
Mechanical Soil Aeration 5 2 2,100 NC NC 12,000 14,000
Neutralization 7 1 3,500,000 NC NC 3,500,000 3,500,000
Open Burn/Open Detonation 2 0 NC NC NC NC NC
Physical Separation 1 1 8,000 NC NC 8,000 8,000
Soil Vapor Extraction 5 5 540 2,300 3,500 10,000 17,000
Soil Washing 6 6 6,400 13,000 41,000 180,000 250,000
Solidification/Stabilization 137 85 18 13,000 45,000 1,000,000 3,900,000
Solvent Extraction 4 4 7,000 NC NC 20,000 49,000
Thermal Desorption 61 50 250 14,000 22,000 100,000 1,100,000
Vitrification 2 1 9,300 NC NC 9,300 9,300
AVERAGE — — 273,000 12,000 33,000 550,000 1,100,000
TOTAL 425 285 — — — — 14,000,000
In SituBioremediation 35 19 5,000 25,000 120,000 800,000 2,200,000
Chemical Treatment 5 3 2,600 NC NC 41,000 55,000
Dual-Phase Extraction 3 1 100,000 NC NC 100,000 100,000
Electrical Separation 1 1 1,000 NC NC 1,000 1,000
Phytoremediation 5 2 11,000 NC NC 60,000 71,000
Soil Flushing 16 10 2,000 37,000 140,000 1,000,000 1,400,000
Soil Vapor Extraction 196 126 75 32,000 220,000 6,100,000 27,000,000
Solidification/Stabilization 46 19 180 24,000 300,000 1,900,000 2,800,000
Thermally Enhanced Recovery 6 3 200 NC NC 1,000 1,500
Vitrification 1 1 4,600 NC NC 4,600 4,600
AVERAGE — — 13,000 30,000 200,000 1,000,000 3,400,000
TOTAL 313 185 — — — — 34,000,000
AVERAGE FOR ALL TECHNOLOGIES 160,000 18,000 87,000 740,000 2,100,000
TOTAL FOR ALL TECHNOLOGIES 738 470 48,000,000
Sources: 3, 4, 5, 6: Data sources are listed in the References and Data Sources section on page 38.NC = Not calculated(a) The median and average values were not calculated for technologies for which data on soil treatment volumes are available forfewer than five projects.
Table�3.��Superfund�Remedial�Actions:
Estimated�Quantities�of�Soil�Treated�by�Source�Control�Technologies�(FY�1982�-�FY�1999)

19
Se
ction
2: Tre
atme
nt Te
chn
olo
gie
s for So
urce
Co
ntro
l
○ ○ ○ ○ ○ ○ ○ ○ ○ ○ ○ ○ ○ ○ ○ ○ ○ ○ ○ ○
Quantity�of�Soil�Addressed
EPA analyzed the quantity of soil addressed bythe various treatment technologies, and the resultsof this analysis are shown in Table 3. Data onthe quantity treated are available for 185 in situprojects and 285 ex situ projects for which sourcecontrol treatment technologies were selected totreat soil. Typically, in situ technologies are usedto address larger quantities of soil, while ex situtechnologies are used to treat smaller quantities.Because quantities for in situ projects oftencannot be determined accurately and manyprojects have not been completed, the quantitiesin Table 3 should be considered estimates.
For ex situ technologies, the median volume ofsoil treated per project ranged fromapproximately 1,000 cubic yards (cy) for off-siteincineration to 21,000 cy for on-site incineration.After on-site incineration, chemical treatment hadthe next highest median (18,000 cy), followed bybioremediation and thermal desorption (both with
14,000 cy). For in situ technologies, the medianvolume of soil treated per project ranged from 24,000cy (solidification/stabilization) to 37,000 cy (in situsoil flushing).
The volume of soil treated by the nine technologiesfor which data on soil volume were available for atleast 10 projects were plotted for comparisonpurposes. Figure 12 presents a box-and-whiskersplot of the volume of soil treated by technology type.Because of the wide range in volumes of soil treated,the soil volumes are plotted on a logarithmic scale.
Presentation of data in the box-and-whiskers formatis useful because it shows how the data are distributedby displaying the median, 25th, and 75th percentiles,as well as the largest and smallest nonoutlier values.In a box plot, the 25th and 75th percentiles are shownas the ends of the box. The largest and smallestnonoutlier values are shown by the lines that extendfrom the ends of the box, which are known as the“whiskers.” Outliers represent values that are betweenone-and-one-half and three box lengths from the top
Sources: 3, 4, 5, 6: Data sources are listed in the References and Data Sources section on page 38.
Figure�12.��Superfund�Remedial�Actions:�Box-and-Whiskers�Plot
of�Cubic�Yards�of�Soil�Treated�(FY�1982�-�FY�1999)
20
Sect
ion
2: T
reat
me
nt
Tech
no
log
ies
for
Sou
rce
Co
ntr
ol or bottom of the box. Extreme values are more
than three box lengths from the top or bottom ofthe box. Outliers and extreme values are depictedon Figure 12 by circles.
With the exception of off-site incineration, themedian volume of soil treated for all technologiesfalls between 10,000 and 100,000 cy. The range ofvalues, as shown by the length of the box andwhiskers, was much greater for SVE than for allother technologies. The 75th percentile value forSVE, bioremediation (in situ), and solidification/stabilization (in situ) is about 100,000 cy, indicatingthat the volume being treated by these technologieswas about 100,000 cy for 25 percent of the projectsfor which data were available. That finding indicatesthat those technologies are applicable to sites atwhich very large volumes of soil require treatment.
By comparing similar technologies that can beconducted both in and ex situ, the box plot reaffirmsthat in situ technologies are typically used to treatlarger volumes of soil. As Figure 12 shows, themedian and range of volumes of soil per project forin situ bioremediation were greater than those forex situ bioremediation. The range of soil volumesfor in situ bioremediation also appeared to indicatethat it may be more applicable to projects for whichlarge volumes of soil require treatment.
Similarly, the median and range for volume of soilper project for in situ solidification/stabilizationwere a little greater than those for ex situsolidification/stabilization. However, the range ofsoil volumes treated for in situ solidification/stabilization appeared to be limited to large projects,while ex situ solidification/stabilization treatmentswere applied to a wider range of soil volumes.
Volumes�of�Soil�Treated�in�Trains
In some cases, two or more innovative andestablished technologies may be used together intreatment trains, which are either integrated processesor a series of treatments that are combined insequence to provide the necessary treatment. Sometreatment trains are employed when no singletechnology is capable of treating all the contaminantsin a particular medium. For example, soilcontaminated with organics and metals may betreated first by bioremediation to remove organicsand then by solidification/stabilization to reduce theleachability of metals. In other cases, a treatmenttrain might be used to render a medium more easilytreatable by a subsequent technology, reduce theamount of waste that requires further treatment bya subsequent and more expensive technology, orminimize the overall cost of the treatment.
The sites at which treatment trains were used andfor which data are available on the volume of soiltreated by each technology in the treatment trainare shown in Figure 13. The figure does not displaydata for trains where data are available for only onetechnology in the train. At nine sites where treatmenttrains were used, the volume of soil treated by eachtechnology in the train remained the same.
At two sites, the volume of soil subjected tosubsequent treatment steps decreased by 20 and50 percent. The initial technologies used in thosetreatment trains were solvent extraction andphysical separation, respectively. The data indicatethat the use of solvent extraction in a treatmenttrain may reduce the volumes of soil that requiretreatment in subsequent unit operations of the train.In this project, solvent extraction was applied toremove PCB’s and solidification/stabilization wasapplied to treat metals. The purpose of the physicalseparation treatment technology is to concentratecontaminants into smaller volumes.
At the Petro-Chemical Systems site, thermallyenhanced recovery is being used to treat 330 cy ofsoil followed by SVE of 300,000 cy of soil. At thissite, the thermally enhanced recovery unit is treatingareas contaminated with NAPL and areas with highcontaminant concentrations. The thermallyenhanced recovery is expected to treat these areasmore quickly and effectively than SVE.
A detailed discussion of the use of treatment trainsthat include innovative technologies is containedin Section 3: Innovative Applications, TreatmentTrains, on page 30.
Cumulative�Soil�Treatment�Volumes
For each technology type, Figure 14 shows thepercentage of soil volume being treated. As Figure14 shows, a majority of the soil volume is treatedby SVE. As Figure 5 shows, SVE is also the mostfrequently selected technology. Figure 12 showsthat SVE is the selected technology for projects forwhich the largest volumes of soil require treatment.Those factors explain the large fraction of soil beingtreated by this technology. Figure 14 is based onthe 63 percent of source control treatments atSuperfund remedial action sites where soil treatmentdata are available.
○ ○ ○ ○ ○ ○ ○ ○ ○ ○ ○ ○ ○ ○ ○ ○ ○ ○ ○ ○ ○ ○ ○ ○
Binders�Used�for�Solidification/
Stabilization
The term “solidification/stabilization” is genericand is applied to a wide range of discretetechnologies that are closely related in that bothuse chemical and physical processes to treat a wide

21
Se
ction
2: Tre
atme
nt Te
chn
olo
gie
s for So
urce
Co
ntro
lFigure�13.��Superfund�Remedial�Actions:��Cubic�Yards�of�Soil
Treated�by�Treatment�Trains�(FY�1982�-�FY�1999)
Sources: 3, 4, 5, 6: Data sources are listed in the References and Data Sources section on page 38.

22
Sect
ion
2: T
reat
me
nt
Tech
no
log
ies
for
Sou
rce
Co
ntr
ol
variety of wastes, both solid and liquid.Solidification refers to techniques that encapsulatethe waste, forming a solid material, and does notnecessarily involve a chemical interaction betweenthe contaminants and the solidifying additives.Stabilization refers to techniques that chemicallyreduce the hazard potential of a waste by convertingthe contaminants into less soluble, mobile, or toxicforms. Stabilization usually involves mixing acontaminated medium, such as soil or sludge, withagents such as Portland cement, lime, fly ash,cement kiln dust, or polymers to create a slurry,paste, or other semiliquid state. The mixture thenis allowed time to cure into a solid form. Thesolidification process also may include the additionof iron salts, silicates, clays, or pH adjustmentagents to enhance the setting or curing time,increase the compressive strength of the solidifiedwaste, or reduce the leachability of contaminants.
At Superfund sites, solidification/stabilization hasbeen implemented, or currently is planned for use,183 times, 137 times as an ex situ treatment and46 times as an in situ treatment. Solidification/stabilization is the most frequently occurring ex situtreatment technology (see Table 1).
Data on the binders used at solidification/stabilization sites is available for 49 percent ofthe 183 solidification/stabilization projects. Table4 shows the types of binders and reagents used.
They include cement, phosphate, lime, pHbuffering agents, asphalt, sulfur, other inorganiccomponents, proprietary additives, other organiccomponents, and other inorganic components.Other organics and other inorganics are bindersand reagents that do not fall under the othergroupings, such as polymers, iron salts, silicates,
Figure�14.��Superfund�Remedial�Actions:�Percentage�of�Soil
Treated�by�Technology�Type�(FY�1982�-�FY�1999)
Sources: 3, 4, 5, 6: Data sources are listed in the References and Data Sources section on page 38.
Table�4.��Superfund�Remedial�Actions:
Binders�and�Reagents�Used�for�90
Solidification/Stabilization�Projects
(FY�1982�-�FY�1999)
Binder or Reagent Number of Projects
Cement 50
Proprietary Additives 22
Other Inorganic 20
Phosphate 14
pH Buffering Agents(a) 11
Lime 10
Other Organic 6
Asphalt 4
Sulfur 4
TOTAL 141
(a) pH buffering and adjustment agents, such as sodiumhydroxide, are sometimes added during stabilizationprocesses to decrease post-treatment contaminantleachability.
Sources: 3, 4, 5, 6: Data sources are listed in the Referencesand Data Sources section on page 38.

23
Se
ction
2: Tre
atme
nt Te
chn
olo
gie
s for So
urce
Co
ntro
land clays. Proprietary additives are those thatare considered trade secrets and were notidentified further. The most commonly usedbinder or reagent was cement, followed byproprietary additives, other inorganics, andphosphate. Each solidification/stabilizationproject may use more than one reagent.
Solidification/stabilization is used most commonlyto treat media contaminated with metals (see Table2). Cement, other inorganics, phosphates, and limeare probably the most commonly usedsolidification/stabilization additives because theyoften are used in the solidification/stabilization ofmetals.
Additional information on the application ofsolidification/stabilization can be found on theCLU-IN website at http://www.clu-in.org. Inaddition to HTML and PDF versions of thisdocument, the CLU-IN website contains thefollowing recently published documents onsolidification/stabilization:
• Solidification/Stabilization Resource Guide.U.S. EPA: Office of Solid Waste and EmergencyResponse. EPA 542-B-99-0032. 1999.
• Solidification/Stabilization Use at SuperfundSites. U.S. EPA: Office of Solid Waste andEmergency Response. EPA-542-R-00-010. 2000.
○ ○ ○ ○ ○ ○ ○ ○ ○ ○ ○ ○ ○
Remedy�Changes
As indicated in Section 1, remedies selected forSuperfund remedial actions are documentedthrough a ROD. When a remedy is changed, thechange can be documented through another ROD,a ROD amendment, or an ESD. A RODamendment also can be used to add a new remedy.In some cases, a decisiondocument is not necessary todocument a change if the newremedy was included in the originalROD as a contingency. Remedychanges often occur during the pre-design or design phase of a projectwhen new information about sitecharacteristics is discovered ortreatability studies for the selectedtechnologies are completed.
Many of the treatment remediesthat were modified involved achange from a source controltreatment remedy to a remedy thatis not a source control treatmentremedy. Source control treatmentremedies have been changed to non-
treatment remedies at over 100 Superfund remedialaction sites. These remedies are often changed tosource control containment, groundwater pump-and-treat, monitored natural attenuation, orinstitutional controls. The most commonly citedreason for changing a source control remedy toanother type of remedy was that further siteinvestigation revealed that the concentration orextent of contamination was less than expected.Other frequently cited reasons included risinggroundwater levels making soil treatmentimpracticable, community concerns about on-siteremedies, and high costs. The Superfund programallows EPA and state environmental regulators theflexibility to modify remedies as site conditionschange. The frequency of remedy changes suggestthat regulatory officials are using that flexibility.
In 81 instances, one source control or in situgroundwater treatment technology was replacedwith another treatment technology. Table 5 providesinformation about the most frequently changedtreatment technologies, and the technologies thatreplaced them, as indicated by cumulative data fromFY 1982 through FY 1999.
The technologies that were most frequentlychanged to another technology were incineration,bioremediation (both in-situ and ex-situbioremediation), and thermal desorption. Thosetechnologies are the third, fourth, and fifth mostfrequently selected treatment technologies (seeFigure 5). Table 5 shows the technologies thatreplaced 26 incineration treatments, 13bioremediation treatments, and 12 thermaldesorption treatments. Incineration was replacedby other commonly selected treatmenttechnologies, including thermal desorption (9
New Technology Initially SelectedTreatment Incineration Bioremediation ThermalTechnology Desorption
Thermal Desorption 9 4 –Solidification/ Stabilization 6 1 0Bioremediation 5 – 0Soil Vapor Extraction 5 2 5Solvent Extraction 1 0 0Incineration – 5 5Air Sparging 0 1 0Chemical Treatment 0 0 1Soil Washing 0 0 1TOTAL NUMBER OF 26 13 12REMEDY REVISIONS
Sources: 3, 4, 5, 6: Data sources are listed in the References and Data Sourcessection on page 38.
Table�5.��Superfund�Remedial�Actions:
Number�of�Most�Commonly�Changed
Technologies�(FY�1982�-�FY�1999)

24
Sect
ion
2: T
reat
me
nt
Tech
no
log
ies
for
Sou
rce
Co
ntr
ol projects), solidification/stabilization (6 projects),
bioremediation (5 projects), and SVE (5 projects).Bioremediation also was replaced by othercommonly selected treatment technologies,including incineration (5 projects) and thermaldesorption (4 projects). Thermal desorption wasreplaced by other commonly selected treatmenttechnologies, including incineration (5 projects)and SVE (5 projects).
Previous editions of the ASR included an appendixthat listed all the technology changes, additions,and deletions made since the previous edition ofthe ASR. The printed version of the tenth editionof the ASR no longer includes that appendix.However, the on-line version, which can beaccessed at http://clu-in.org/asr, includes a revisedversion of that appendix.

25
Se
ction
3: In
no
vative A
pp
lication
s
This section discusses innovative treatmenttechnologies for source control. In the Overview,innovative technologies were defined as alternativetreatment technologies whose limited number ofapplications result in a lack of data on cost andperformance. In general, a treatment technology isconsidered innovative if it has had limited full-scaleapplication. Innovative technologies are used for avariety of reasons, and have the potential forproviding more cost-effective and reliable alternativesfor cleanup of contaminated soils and groundwater.
In some cases, it may be difficult to treat a particularwaste or medium using an established technology.For example, soil containing a high percentage oflarge particle sizes, such as cobbles, boulders, andlarge debris, may be difficult to treat using ex situthermal desorption because many thermal desorptionunits have limitations on the size of materials thatcan pass through them. However, in situbioremediation may effectively treat the soilregardless of its particle size distribution. In othercases, an innovative technology may be less expensivethan an established technology. It may be expensiveto treat soils deep below the ground surface byincineration because of the amount of excavationrequired to reach the soil. However, a thermallyenhanced recovery process may work effectively atthat depth, resulting in a lower cost. Other reasonsfor selecting innovative technologies can includereduction in the exposure of workers to contaminatedmedia; reduction in costs for excavation andmaterials handling (in situ technologies); andcommunity concern about off-site releases ofcontaminants, noise, or smell.
In the ninth edition of the ASR, SVE and thermaldesorption, formerly defined as innovative, werecategorized as established because of the largenumber of applications of those technologies. Inaddition, several reports and case studies werepublished documenting their cost and performance.In the tenth edition, no changes in technologyclassifications are made.
The Federal Remediation Technologies Roundtable(FRTR) has published more than 200 case studiescovering a wide range of treatment technologies thatare available for viewing online or downloading fromthe FRTR web site at http://www.frtr.gov. Of thosecase studies, 27 discuss SVE and 12 discuss thermaldesorption. The case studies were developed byEPA, DoD, and DOE. The case studies and abstractspresent available cost and performance informationfor full-scale remediation efforts and several large-
scale demonstration projects. They provideinformation about site background and setting,contaminants and media treated, technology, costand performance, and points of contact for thetechnology application. The levels of detail providedin the studies vary, reflecting differences in theavailability of data and information.
The FRTR website also contains the NorthAmerican Site Demonstrations Database andReports. This resource contains information ondemonstrations of site remediation treatmenttechnologies in North America, and can be accessedat http://www.frtr.gov/northa/scrguide.htm.
Although SVE and thermal desorption are no longerincluded in the innovative category, there areseveral innovative enhancements or adaptations ofthose technologies. For example, SVE can beenhanced by pneumatic fracturing or a variety ofthermal methods. Additional information aboutenhancements for SVE systems is presented inEPA’s Soil Vapor Extraction (SVE) EnhancementTechnology Resource Guide (EPA-542-B-95-003)and EPA’s Analysis of Selected Enhancement for SoilVapor Extraction (EPA-542-R-97-007), available athttp://clu-in.org.
For source control treatment, Figure 15 depictsthe number and types of innovative and establishedtechnologies used. As shown, innovative treatmenttechnologies represent approximately 20 percentof all technologies used for source control.Bioremediation represents most of the innovativeapplications (84). Soil flushing (in situ) andchemical treatment are the second and third mostfrequently selected innovative technologies.Innovative technologies being used for fewer thannine projects at Superfund sites are listed underthe other innovative technology category, a total of8 technologies and 29 applicaitons.
The remainder of this section discusses twoinnovative treatment technologies in depth,bioremediation and phytoremediation, anddescribes current experiences in jointly applyingseveral treatment technologies, i.e., treatmenttrains. Bioremediation is the most frequentlyapplied innovative technology. Phytoremediationis a technology for which there are relatively few,but a rapidly increasing number, of applications.The use of a treatment train can render sites withmultiple contaminants or media that are difficultto treat more amenable to treatment.
○ ○ ○ ○ ○ ○ ○ ○ ○ ○ ○ ○
Bioremediation
Bioremediation uses indigenous or inoculatedmicroorganisms (that is, fungi, bacteria, or other
Section 3: InnovativeApplications

26
Sect
ion
3:
Inn
ova
tive
Ap
plic
atio
ns
microbes) to degrade (metabolize) organiccontaminants found in soil or groundwater.Frequently, bioremediation techniques enhance theactivity of the microorganisms and subsequentcontaminant degradation through the use ofnutrients or, in aerobic bioremediation, oxygen,or by controlling temperature and pH.
Bioremediation may occur through either aerobicor anaerobic processes. The former involves theconversion of contaminants, in the presence ofsufficient oxygen, to carbon dioxide, water, andmicrobial cell mass. The latter involves themetabolism of contaminants, in the absence ofoxygen, to methane, limited amounts of carbondioxide, and trace amounts of hydrogen gas. Undersulfate-reducing conditions, sulfate may beconverted to sulfide or elemental sulfur. Undernitrate-reducing conditions, dinitrogen gasultimately is produced.
Bioremediation can be conducted in situ or ex situ.The information about bioremediation presentedhere includes its use on soil, sediment, sludge, orother solid media, both in situ and ex situ, as wellas on groundwater in situ. Examples of in situprocesses include bioventing and in situgroundwater bioremediation. Bioventing systemsdeliver air from the atmosphere into the soil abovethe water table through injection wells placed in
contaminated areas, while in situ groundwaterbioremediation involves engineering of subsurfaceconditions to induce or accelerate biodegradationof contaminants in an aquifer.
Examples of ex situ processes include slurry-phasetreatment and composting. Slurry-phase treatmentcombines contaminated soil, water, and otheradditives under controlled conditions in“bioreactors,” to create an optimum environmentfor microbial degradation. Composting involvesmixing contaminant-laden waste with a bulkingagent, such as straw or hay, to facilitate the deliveryof optimum levels of air and water to themicroorganisms.
Currently, 105 bioremediation projects have been,are currently being, or are planned to beimplemented for source control and in situgroundwater treatment. Figure 16 shows the typesof bioremediation for source control and in situgroundwater treatment. More than half (54 percent)of the bioremediation projects conducted atSuperfund sites are in situ projects, and 34 percentare in situ source control projects. Bioventing isthe most common type of bioremediation appliedfor in situ source control, with 24 remedies. Landtreatment is the most common form of ex situbioremediation, with 33 projects, followed bycomposting (8 projects).
Figure�15.�Superfund�Remedial�Actions:��Innovative��Applications
of�Source�Control�Treatment�Technologies�(FY�1982�-�FY�1999)
Sources: 3, 4, 5, 6: Data sources are listed in the References and Data Sources section on page 38.

27
Se
ction
3: In
no
vative A
pp
lication
s
Contaminant groups treated by bioremediation areshown in Figure 17, which lists the number ofprojects at Superfund remedial action sitesaddressing each of eight groups of contaminantsthrough bioremediation. At some sites, more thanone contaminant group is addressed. Wherecontaminants may fall into more than one group,the groups have been limited to ensure thatcontaminants are not double counted in Figure 17.For example, some organic pesticides andherbicides are also non-halogenated SVOCs.However, the group “non-halogenated SVOCs” inFigure 17 does not include any chemicals that arein the “organic pesticides and herbicides” group.
The contaminant groups treated most often arePAHs, non-halogenated SVOCs (not includingPAHs), and BTEX. The types of Superfund sitesmost commonly treated by bioremediation havebeen contaminated through processes or wastesassociated with wood preserving and petroleumrefining and reuse. Wood preserving commonlyemploys creosote, which has a high concentrationof PAHs and other non-halogenated SVOCs.Similarly, petroleum refining and reuse processesfrequently involve BTEX.
Because the two contaminant groups mostcommonly treated using bioremediation are
SVOCs (PAHs and other non-halogenatedSVOCs), it may be difficult to treat them usingtechnologies that rely on volatility, such as SVE.In addition, bioremediation treatment often doesnot require heating, requires relatively inexpensiveinputs, such as nutrients, and usually does notgenerate residuals requiring additional treatmentor disposal. Also, when conducted in situ, it doesnot require excavation of contaminated media.Compared with other technologies, such as thermaldesorption and incineration (which requireexcavation and heating), thermally enhancedrecovery (which requires heating), chemicaltreatment (which may require relatively expensivechemical reagents), and in situ soil flushing (whichmay require further management of the flushingwater), bioremediation may enjoy a cost advantagein the treatment of nonhalogenated SVOCs.Lower energy inputs are reflected in longerremmediation times, as discussed on page 15 andreflected in Table 1.
Additional information on the application ofbioremediation can be found on the CLU-INwebsite at http://www.clu-in.org. In addition toHTML and PDF versions of this document, theCLU-IN website contains the following recentlypublished documents on bioremediation:
Figure�16.��Superfund�Remedial�Actions:�Bioremediation�Methods
For�Source�Control�and�In�Situ�Groundwater�Treatment�(FY�1982�-�FY�1999)
(a) Bioslurping can be used to treat both soil and groundwater. Reported data indicate that the one bioslurping projectimplemented at a Superfund remedial action site treated only groundwater.
Sources: 3, 4, 5, 6: Data sources are listed in the References and Data Sources section on page 38.

28
Sect
ion
3:
Inn
ova
tive
Ap
plic
atio
ns
• Engineered Approaches to In SituBioremediation of Chlorinated Solvents:Fundamentals and Field Applications. U.S.EPA: Office of Solid Waste and EmergencyResponse. EPA 542-R-00-008. 2000.
• The Bioremediation and Phytoremediation ofPesticide-contaminated Sites. Chris Frazar.National Network of EnvironmentalManagement Studies (NNEMS) Fellow. 2000.
○ ○ ○ ○ ○ ○ ○ ○ ○ ○ ○ ○ ○ ○
Phytoremediation
Phytoremediation is the use of certain features ofplants, such as their biological processes or physicalcharacteristics, to remediate contaminated media.It encompasses a number of methods that canaddress a variety of contaminants and media.
Phytoremediation can be used either to contain,remove, extract, or destroy contaminants.Containment is achieved through phytostabilization,which immobilizes contaminants in soil. Removaland extraction techniques may includephytovolatilization, which is uptake and
volatilization of the contaminant, or rhizofiltration,which is a process by which contaminants areadsorbed onto the roots of the plants. Destructionof the contaminant may be achieved throughphytodegradation or rhizodegradation, the formerbeing uptake and metabolism within the plant, andthe latter being enhancement of biodegradation inthe root zone.
For optimum effectiveness, the various forms ofphytoremediation require different characteristicsin the plants used. In general, terrestrial plants aremore likely to be effective for phytoremediationthan aquatic plants because their root systems arelarger. Poplar and cottonwood trees commonly areused because they are fast-growing and have a widegeographic distribution. Examples of other typesof vegetation used in phytoremediation includesunflower, Indian mustard, and grasses (such asryegrass and prairie grasses).
Phytoremediation is a relatively new technology,for which there are only a few applications atSuperfund sites. Table 6 lists nine Superfund
Figure�17.��Superfund�Remedial�Actions:��Contaminant�Groups
Treated�by�Bioremediation�(FY�1982�-�FY�1999)
(a) Does not include polycyclic aromatic hydrocarbons.(b) Does not include benzene, ethylbenzene, toluene, and xylene.(c) Does not include organic pesticides and herbicides.Sources: 3, 4, 5, 6: Data sources are listed in the References and Data Sources section on page 38.
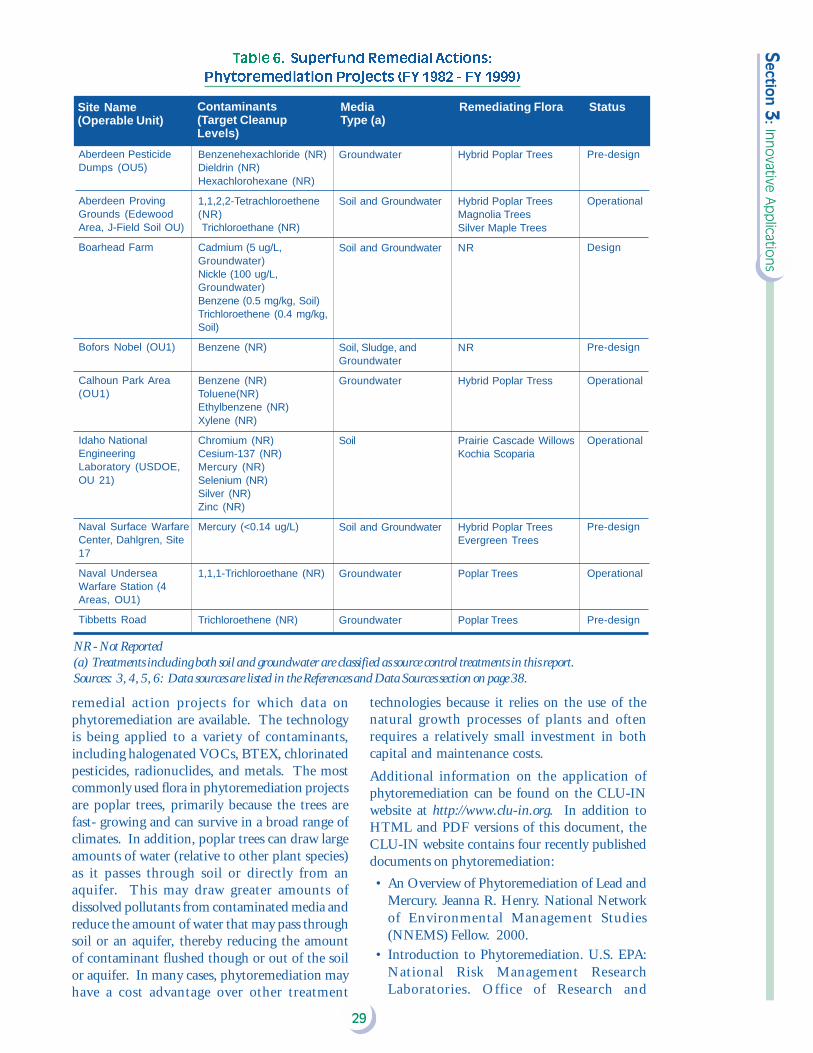
29
Se
ction
3: In
no
vative A
pp
lication
sTable�6.��Superfund�Remedial�Actions:
Phytoremediation�Projects�(FY�1982�-�FY�1999)
remedial action projects for which data onphytoremediation are available. The technologyis being applied to a variety of contaminants,including halogenated VOCs, BTEX, chlorinatedpesticides, radionuclides, and metals. The mostcommonly used flora in phytoremediation projectsare poplar trees, primarily because the trees arefast- growing and can survive in a broad range ofclimates. In addition, poplar trees can draw largeamounts of water (relative to other plant species)as it passes through soil or directly from anaquifer. This may draw greater amounts ofdissolved pollutants from contaminated media andreduce the amount of water that may pass throughsoil or an aquifer, thereby reducing the amountof contaminant flushed though or out of the soilor aquifer. In many cases, phytoremediation mayhave a cost advantage over other treatment
technologies because it relies on the use of thenatural growth processes of plants and oftenrequires a relatively small investment in bothcapital and maintenance costs.
Additional information on the application ofphytoremediation can be found on the CLU-INwebsite at http://www.clu-in.org. In addition toHTML and PDF versions of this document, theCLU-IN website contains four recently publisheddocuments on phytoremediation:
• An Overview of Phytoremediation of Lead andMercury. Jeanna R. Henry. National Networkof Environmental Management Studies(NNEMS) Fellow. 2000.
• Introduction to Phytoremediation. U.S. EPA:National Risk Management ResearchLaboratories. Office of Research and
Site Name(Operable Unit)
Contaminants(Target CleanupLevels)
MediaType (a)
Remediating Flora Status
Aberdeen PesticideDumps (OU5)
Aberdeen ProvingGrounds (EdewoodArea, J-Field Soil OU)
Boarhead Farm
Bofors Nobel (OU1)
Calhoun Park Area(OU1)
Idaho NationalEngineeringLaboratory (USDOE,OU 21)
Naval Surface WarfareCenter, Dahlgren, Site17
Naval UnderseaWarfare Station (4Areas, OU1)
Tibbetts Road
Benzenehexachloride (NR)Dieldrin (NR)Hexachlorohexane (NR)
1,1,2,2-Tetrachloroethene(NR) Trichloroethane (NR)
Cadmium (5 ug/L,Groundwater)Nickle (100 ug/L,Groundwater)Benzene (0.5 mg/kg, Soil)Trichloroethene (0.4 mg/kg,Soil)
Benzene (NR)
Benzene (NR)Toluene(NR)Ethylbenzene (NR)Xylene (NR)
Chromium (NR)Cesium-137 (NR)Mercury (NR)Selenium (NR)Silver (NR)Zinc (NR)
Mercury (<0.14 ug/L)
1,1,1-Trichloroethane (NR)
Trichloroethene (NR)
Groundwater
Soil and Groundwater
Soil and Groundwater
Soil, Sludge, andGroundwater
Groundwater
Soil
Soil and Groundwater
Groundwater
Groundwater
Hybrid Poplar Trees
Hybrid Poplar TreesMagnolia TreesSilver Maple Trees
NR
NR
Hybrid Poplar Tress
Prairie Cascade WillowsKochia Scoparia
Hybrid Poplar TreesEvergreen Trees
Poplar Trees
Poplar Trees
Pre-design
Operational
Design
Pre-design
Operational
Operational
Pre-design
Operational
Pre-design
NR - Not Reported(a) Treatments including both soil and groundwater are classified as source control treatments in this report.Sources: 3, 4, 5, 6: Data sources are listed in the References and Data Sources section on page 38.
30
Sect
ion
3:
Inn
ova
tive
Ap
plic
atio
ns Development. EPA 600-R-99-107. 2000.
• Phytoremediation Resource Guide. U.S. EPA:Office of Solid Waste and Emergency Response.EPA 542-B-99-003. 1999.
• The Bioremediation and Phytoremediation ofPesticide-contaminated Sites. Chris Frazar.National Network of EnvironmentalManagement Studies (NNEMS) Fellow. 2000.
• The Use of Plants for the Removal of ToxicMetals from Contaminated Soil. Mitch M.Lasat. American Association for theAdvancement of Science; EnvironmentalScience and Engineering Fellow. 2000.
○ ○ ○ ○ ○ ○ ○ ○ ○ ○ ○ ○ ○ ○ ○ ○ ○ ○ ○ ○ ○ ○ ○ ○ ○ ○
Innovative�Technology�Treatment
Trains
In some cases, more than one innovative orestablished technology may be used together in atreatment train, which is either an integratedprocess or a series of treatments that are combinedin sequence to provide the necessary treatment. Amore detailed description of treatment trains ispresented in Section 2. Treatment trains thatinclude one or more innovative technologies arethe selected source control remedy at 28 Superfundsites. Figure 18 identifies specific treatment trainsused in remedial actions.
Innovative treatment technologies may be usedwith established technologies or with otherinnovative technologies. The most commontreatment trains are air sparging used in conjunctionwith SVE and bioremediation followed bysolidification/stabilization. Technologies may becombined to reduce the volume of material thatrequires further treatment, prevent the emission
of volatile contaminants during excavation andmixing, or treat several contaminants in a singlemedium. In the case of air sparging used withSVE, the air sparging is used to removecontaminants from groundwater in situ, while theSVE captures the contaminants removed from thegroundwater and removes contaminants from thesoil above the groundwater (the vadose zone).
The treatment train of bioremediation followed bysolidification/stabilization is used at Superfund sitesfor media contaminated by both organics andmetals. The organic contaminants are remediatedby bioremediation, while the leachability of themetals is reduced through solidification/stabilization.
This report documents 28 treatment trains thatinclude innovative technologies. The ninth editionof the ASR documented 17 treatment trains. Theincrease is largely the result of classifying air spargingor bioslurping used in conjunction with SVE as atreatment train, as well as changes in orcancellations of some selected technologies. Inprevious editions, when air sparging or bioslurpingwas used in conjunction with SVE, only onetechnology was identified for the site. However,they are distinct technologies, are not always usedtogether, and are applicable to different media (airsparging and bioslurping are applicable primarilyto groundwater, while SVE is applicable primarilyto soil).
A detailed discussion of the volumes of soil treatedthrough treatment trains at Superfund remedialaction sites is contained in Section 2: TreatmentTechnologies for Source Control, Volumes of SoilTreated in Treatment Trains on page 20.

31
Se
ction
3: In
no
vative A
pp
lication
sFigure�18.��Superfund�Remedial�Actions:��Treatment�Trains�with
Innovative�Treatment�Technologies�(FY�1982�-�FY�1999)
Sources: 3, 4, 5, 6: Data sources are listed in the References and Data Sources section on page 38.
������������� ����
�������������� ����
����������
�������������
������������
����������� ����
����������������
���������������������
��������� �������!��"�� ������������
������������
������������������� ������ �� �
��������������� �� �
��������������������� �� �
�������������� �� �!� ���
��������������������� �� �
�������������!� ���
#���� �����������
�������"����� ���$� ���"������������
�!� ���
���������!� ���
�������������������!� ���
�������������!� ���
�����������!� ���
"�������#� ������!� ���
�������������������$����!� ���
%��������"�������� �� �
�������������������!� ���
�������������������$����!� ���
%��������"������!� ���
�������������!� ���
�������������������$������ �� �
�
�
���
�
���
�
����
���
���
���
���
���
���
���
���
���
���
���

32
Sect
ion
4: G
rou
nd
wat
er
Re
me
die
s
Section 4: GroundwaterRemedies
This section focuses on three groups of groundwatertreatment remedies: conventional pump-and-treatsystems, monitored natural attenuation (MNA), andin situ treatment. At least one of those groundwaterremedies has been selected for 749 sites. Pump-and-treat systems alone were selected for 521 sites,MNA alone for 92 sites, and in situ groundwatertreatment alone for 16 sites. When several typesof groundwater remedies were used at the samesite, a pump-and-treat approach was used mostfrequently with MNA (55 sites). Next in frequencywas a pump-and-treat system with in situ treatment(48). In addition this section highlights moredetailed information on the use of verticalengineered barriers (VEB) and permeable reactivebarriers (PRB) at Superfund remedial action sites.VEBs are highlighted becuase of new developmentsin their applications. PRBs are highlighted becauseof their innovative use in the treatment ofgroundwater in situ.
The data in Figure 19 are presented on a site basis.At some sites, several applications of the sametype of groundwater remedy may have occurred.At sites at which several types of groundwaterremediation, such as a pump-and-treat system andin situ remediation were used, the remediationmay not have occurred in the same aquifer or
groundwater plume. Information aboutSuperfund sites at which pump-and-treat andMNA remedies are in use was compiled from avariety of sources, including EPA’s CERCLIS 3database and RODs, ROD amendments, andROD abstracts.
○ ○ ○ ○ ○ ○ ○ ○ ○ ○ ○ ○ ○ ○ ○ ○ ○ ○ ○ ○ ○ ○ ○ ○
In�Situ�Groundwater�Treatment
The specific types of in situ treatment remediesfor groundwater selected at Superfund sites arelisted in Table 7. EPA has selected in situtreatment of groundwater 95 times at 81Superfund sites. Air sparging is the mostfrequently selected in situ groundwater treatmentremedy, with 48 projects, followed bybioremediation with 21 projects.
Information on the status of in situ groundwatertreatment projects is presented in Figure 11 andTable 1. Table 2 presents information on the typesof contaminants addressed by in situ groundwatertreatment remedies. Figure 16 presentsinformation on the use of bioremediation for insitu groundwater treatment.
○ ○ ○ ○ ○ ○ ○ ○ ○ ○ ○ ○ ○ ○ ○ ○ ○ ○ ○ ○ ○
Vertical� Engineered�Barriers
A groundwater containment remedy, verticalengineered barriers (VEB), was selected at 51Superfund remedial action sites. In the past,the ASR has not included information about
Figure�19.��Superfund�Remedial�Actions:
Groundwater�Remedies�(FY�1982�-�FY�1999)
Sources: 1, 2, 3, 4, 5, 6, 8: Data sources are listed in the References and Data Sources section on page 38.

33
Se
ction
4: G
rou
nd
wate
r Re
me
die
s
VEBs because a VEB is not a treatmenttechnology. However, it has been used to containgroundwater, and some innovative methods ofconstructing VEBs, such as deep soil mixing, andgeosynthetic walls have been undertaken. Table8 indicates the number of each type of VEB. Thetypes of barriers are:
• Slurry wall - Consists of a vertical trench that isfilled with a bentonite slurry to support the trenchand is subsequently backfilled with a low-permeability material.
• Geosynthetic wall - Constructed by placing ageosynthetic liner into a trench.
• Grout - Constructed by grouting or jet-groutingsoils to create a vertical grout curtain.
• Deep soil mixing - Overlapping columns createdby a series of large-diameter, counter-rotatingaugers that mix in situ soils with an additive,usually bentonite, cement, or grout, which isinjected through the augers.
• Sheet pile - Series of overlapping sheets ofimpermeable material, such as metal.
Definitions of barrier types are from Evaluation ofSubsurface Engineered Barriers at Waste Sites, EPAOSWER, 542-R-98-005, August 1998, available onthe internet at http://clu-in.org.
Overwhelmingly, slurry walls are the most frequentlyused type of barrier, with 44 applications. For eachof the other types of VEBs, there are fewer thanfive applications at Superfund remedial action sites.The total number of barrier types (55) exceeds thetotal number of projects (51) because some projectsuse more than one type of barrier.
VEBs may be used for a variety of purposes,including:
• Preventing uncontaminated groundwater fromflowing into a contaminated area (sourcecontainment upgradient)
• Stopping the migration of a contaminatedgroundwater plume at the edge of the plume(containment at plume edge)
• Completely encircling a site or subsurfacecontaminated area (encirclement of site)
• Preventing contaminated groundwater fromflowing out of a contaminated area (sourcecontainment downgradient)
• Preventing a contaminated plume frommigrating off site (containment at the boundaryof the site)
• Protecting an environmentally sensitive feature,such as surface water or a drinking- water well,from a contaminated groundwater plume(resource protection)
Some VEBs can be used for multiple reasons (forexample, a VEB that encircles a site and reaches animpermeable bed [that is, the aquitard] serves anumber of the purposes listed above). In addition,at some sites, several VEBs are used; each mayhave one or more of those purposes. Figure 20shows the number of VEB projects that wereconstructed for each of the reasons listed above.The most common purposes for which VEBs areused include encirclement of a site, as a sourcecontainment downgradient, and for containmentat a plume edge.
Additional information on the application of VEBscan be found on the CLU-IN website at http://www.clu-in.org. In addition to HTML and PDFversions of this document, the CLU-IN websitecontains the following recently publisheddocument on VEBs: Subsurface Containment andMonitoring Systems: Barriers and Beyond. LesliePearlman. National Network of EnvironmentalManagement Studies (NNEMS) Fellow. 1999.
Technology Number of Projects Selected
Air Sparging 48
Bioremediation 21
Dual-Phase Extraction 10
Permeable Reactive Barrier 8
Phytoremediation 4
Chemical Treatment 2
In-Well Air Stripping 2
TOTAL 95
Sources: 3, 4, 5, 6: Data sources are listed in theReferences and Data Sources section on page 38.
Table�7.��Superfund�Remedial
Actions:��In�Situ�Groundwater�Treatment
Technologies�at�81�Sites�Selecting
These�Technologies�(FY�1982�-�FY�1999)
Vertical Engineered Number ofBarrier Type BarriersSlurry Wall 44
Geosynthetic Wall 3
Grout 3
Deep Soil Mixing 2
Sheet Pile 2
Other - VEB 1TOTAL 55
Sources: 3, 4, 5, 6: Data sources are listed in theReferences and Data Sources section on page 38.
Table�8.��Superfund�Remedial�Actions:
Types�of�Vertical�Engineered
Barriers�at�51�Sites�Selecting�This
Technology�(FY�1982�-�FY�1999)

34
Sect
ion
4: G
rou
nd
wat
er
Re
me
die
s
○ ○ ○ ○ ○ ○ ○ ○ ○ ○ ○ ○ ○ ○ ○ ○ ○ ○ ○ ○ ○ ○
Permeable�Reactive�Barriers
Permeable reactive barriers (PRBs) are installedacross the path of a contaminated groundwaterplume, allowing the plume to move passively throughthe barrier while contaminants are precipitated ordegraded. PRBs may contain metal-based catalystsfor degrading organics; chelators for immobilizingmetals; or other reagents for degradingcontaminants into less toxic compounds,precipitating contaminants, or otherwise renderingthem less mobile.
PRBs may be constructed by excavating a trench ofthe appropriate width and backfilling it with areactive medium. In some cases, the trench may beshored up with an appropriate slurry or steel sheetpiling to keep the trench open during constructionand to contain the reactive medium during operation.The sheet piling or slurry is not intended to presenta barrier to groundwater flow, because the purposeof a PRB is to treat contaminants as the groundwaterpasses through the barrier.
Unlike VEBs, for which a soil-bentonite or cement-based slurry typically is used, it may be necessaryto use a biodegradable polymer in installing a PRBto avoid the problem of plugging the barrier withresidual slurry. PRBs also may be used inconjunction with VEBs, where VEBs guidegroundwater flow into the PRB. That type ofsystem is referred to as a funnel-and-gate system.
At superfund remedial action sites, PRBs are beingused to treat metals, chlorinated VOCs, and
cyanide. The most commonly used reactantsinclude reducing agents such as zero-valent ironand strong bases such as calcium hydroxide,magnesium hydroxide, and crushed agriculturallimestone. Through reductive reactions, zero-valentiron can dechlorinate organics and precipitateanions and oxyanions. Strongly basic reagents mayreduce the solubility of metals or cause them toprecipitate as metal hydroxides, such as convertingchromium (Cr) +6 to insoluble Cr +3 hydroxides.Table 9 lists all eight Superfund remedial actionsites at which PRBs are being implemented to treatgroundwater.
Additional information on the application of PRBscan be found on the CLU-IN website at http://www.clu-in.org. In addition to HTML and PDFversions of this document, the CLU-IN websitecontains the following recently published documentson PRBs:
• Field Applications of Remediation Technologies:Permeable Reactive Barriers. U.S. EPA: Officeof Solid Waste and Emergency Response. EPA542-R-99-002. 2000.
• Permeable Reactive Barriers for ChlorinatedSolvent, Inorganic, and RadionuclideContamination. U.S. EPA: Office of Researchand Development. U.S. EPA: TechnologyInnovation Office. 2000.
• Permeable Reactive Barriers for Inorganics.Nichole Ott. National Network ofEnvironmental Management Studies (NNEMS)Fellow. 2000.
○ ○ ○ ○ ○ ○ ○ ○ ○ ○ ○ ○ ○ ○ ○ ○ ○ ○ ○ ○ ○ ○ ○
Monitored�Natural�Attenuation
Monitored natural attenuation (MNA) is thereliance on natural attenuation processes (withinthe context of a carefully controlled and monitoredapproach to site cleanup) to achieve site-specificremediation objectives within a time frame that isreasonable compared with that offered by moreactive methods. The “natural attenuation processes”that are at work in such a remediation approachinclude a variety of physical, chemical, or biologicalprocesses that, under favorable conditions, actwithout human intervention to reduce the mass,toxicity, mobility, volume, or concentration ofcontaminants in soil or groundwater. The in situprocesses include biodegradation; dispersion;dilution; sorption; volatilization; radioactive decay;and chemical or biological stabilization,transformation, or destruction of contaminants.
EPA does not view MNA to be a “no action”approach, but rather considers it to be an alternativemeans of achieving remediation objectives that may
Figure�20.��Superfund�Remedial�Actions:
Purpose�For�Vertical�Engineered
Barriers�(FY�1982�-�FY�1999)
Sources: 3, 4, 5, 6: Data sources are listed in the Referencesand Data Sources section on page 38.

35
Se
ction
4: G
rou
nd
wate
r Re
me
die
s
be appropriate for specific, well-documented sitecircumstances where its use meets the applicablestatutory and regulatory requirements. As with anyother remedial alternative, MNA should be selectedonly where it meets all relevant remedy selectioncriteria, and where it will meet site remediationobjectives within a time frame that is reasonablecompared to that offered by other methods. MNAis commonly selected as part of an overall siteremedy that includes remediation of groundwatercontamination sources.
In recent years, an increasing number of RODshave specified MNA as a remedy for groundwatercontamination. Figure 21 shows the number ofRODs at which MNA was selected for groundwaterremediation at Superfund remedial action sites. Asthe figure shows, selection of MNA increased
steadily from FY 1985 through FY 1998. In FY1998, MNA was selected as a remedy for 39 sites,but in FY 1999, the number of sites for which MNAwas selected as a remedy decreased to 18.
EPA’s Office of Emergency and Remedial Response(OERR) analyzed FY 1982 through FY 1997 RODsin which MNA was selected. Data on MNA forFY 1998 and FY 1999 were obtained from ananalysis of RODs issued during those years.
The analysis revealed that the most common reasoncited for selecting MNA was low or decreasingconcentrations of contaminants at the site. Theanalysis also indicated that the contaminant mostfrequently present at such sites was VOCs (includingboth chlorinated and non-chlorinated). AppendixE lists the RODs selecting natural attenuation.
Table�9.��Superfund�Remedial�Actions:
Permeable�Reactive�Barrier�Projects�(FY�1982�-�FY�1999)
NR - Not Reported(a) - U.S. Federal Drinking Water Standards: Maximum Containment Levels, www.epa.gov/safewater/regs/cfr141.pdf(b) - Residential Risk-Based Groundwater Cleanup Levels. Developed based on EPA Human Health Evaluation Manual,Part B: Development of Risk Based Preliminary Remediation Goals, OSWER Directive 9285.7-01B, December 13,1991.Sources: 3, 4, 5, 6: Data sources are listed in the References and Data Sources section on page 38.
Site Name(Operable unit)
Contaminants(Target Cleanup Levels)
Construction Wall Material Status
Arrowhead Associates/Scovill Corporation
Brown’s BatteryBreaking Site
F.E. Wareen Air ForceBase - OU2
Lake City ArmyAmmunition Plant (NWLagoon) - OU3
Monticello Mill Tailings(USDOE) - OU3
Rocky Flats Plant(USDOE) - BufferZone
Somersworth SanitaryLandfill
Tonolli Corporation
Chromium (NR)Cyanide (NR)
Beryllium (1.9x10⁻⁴ mg/L)Cadmium (8.8x10⁻⁴ mg/L)Lead (<0.003 mg/L)Manganese (0.05 mg/L)Nickle (0.0029 mg/L)Sulfate (0.027 mg/L)
Trichloroethene
1,1-Dichloroethene (0.007 mg/L)a
Trichloroethene (0.005 mg/L)a
Vinyl Chloride (0.002 mg/L)a
Arsenic (0.05 mg/L)a
Molybdenum (0.183 mg/L)b
Radium 226 (5 pCi/L)a
Selenium (0.05 mg/L)a
Uranium (1.1 mg/L)b
Carbon Tetrachloride (NR)Tetrachloroethene (NR)Trichloroethene (NR)
Trichlorethene (0.005 mg/L)Vinyl Chloride (0.005 mg/L)
Lead (NR)Cadmium (NR)Arsenic (NR)Zinc (NR)Copper (NR)
Trench
Trench
NR
Funnel and Gate
Funnel and Gate
Funnel and Gate
Funnel and Gate
Trench
Zero-Valent Iron
CalciumHydroxideMagnesiumHydroxide
NR
Zero-Valent Iron
Zero-Valent Iron
Zero-Valent Iron
Zero-Valent Iron
Limestone
Design
Design
Operational
Operational
Operational
Operational
Operational
Operational

36
Sect
ion
4: G
rou
nd
wat
er
Re
me
die
s EPA guidelines on the use of MNA to remediategroundwater can be found in Use of MonitoredNatural Attenuation at Superfund, RCRACorrective Action, and Underground Storage TankSites, OSWER Directive Number 9200.4-17,which can be obtained by telephoning 800-424-9346 or 703-412-9810 or accessed on theInternet at http://www.epa.gov/swerust1/directiv/d9200417.htm.
Additional information on the application of MNAcan be found on the CLU-IN website at http://www.clu-in.org. In addition to HTML and PDF
versions of this document, the CLU-IN websitecontains the following recently published documentson MNA:
• Ground Water Issue Paper: Microbial ProcessesAffecting Monitored Natural Attenuation ofContaminants in the Subsurface. Ann Azadpour-Keeley, Hugh H. Russell, and Guy W. Sewell.EPA 540-S-99-001. 1999.
• Natural Attenuation of MTBE in the Subsurfaceunder Methanogenic Conditions. U.S. EPA:Office of Research and Development. EPA 600-R-00-006. 2000.
Figure�21.��Superfund�Remedial�Actions:��RODs�Specifying
Monitored�Natural�Attenuation�for�Groundwater�(FY�1982�-�FY�1999)
Sources: 1, 2, 3, 4, 5, 6, 8: Data sources are listed in the References and Data Sources section on page 38.

37
Se
ction
5: Su
pe
rfun
d R
em
oval A
ction
s
Removal actions usually are conducted in responseto a threat caused by a release of hazardous substancesthat is more immediate than threats addressed byremedial actions. Approximately 5,500 removalactions have been undertaken to address these moreimmediate threats. To date, innovative treatmenttechnologies have been used in relatively few removalactions. The treatment technologies addressed inthis report have been used 100 times in 54 removalactions (Table 10). The ninth edition of the ASRdocumented 97 removal actions for which innovativetechnologies were used.
The percentage of removal action projects thatinvolve treatment technologies and have beencompleted, as shown in Table 10, is 55 percent.
Since removal actions are responses to an immediatethreat and often involve smaller quantities ofhazardous wastes than those addressed by remedialactivities, implementation of a technology may becompleted more quickly at a removal site than at aremedial site.
Because removal actions involve immediate threats,quick action to alleviate the hazard is necessary.Often, such activities do not lend themselves toon-site treatment or innovative technologies. Inaddition, SARA does not establish the samepreference for innovative treatment for removalactions as it specifies for remedial actions.
Additional information on Superfund removalactions can be found in EPA’s REmediation AndCHaracterization Innovative Technologies (EPAREACH IT) on-line searchable database at http://www.epareachit.org.
Section 5: SuperfundRemoval Actions
Predesign/ Design Completed/Technology Design Being Installed Operational Completed Total
Table�10.��Superfund�Removal�Actions:
Project�Status�of�Treatment�Technologies�(FY�1982�-�FY�1999)
Ex Situ Source ControlBioremediation 1 0 0 14 15
Chemical Treatment 1 0 0 4 5
Incineration (off-site) 1 0 0 4 5
Soil Vapor Extraction 0 0 1 2 3Soil Washing 0 0 0 3 3Solidification/Stabilization 0 0 1 0 1Solvent Extraction 0 0 0 2 2Thermal Desorption 0 0 0 6 6Total 3 0 2 35 40Percent of Total 8% 0% 5% 88%
In Situ Source ControlBioremediation 0 0 17 5 22
Chemical Treatment 0 0 0 3 3
Soil Vapor Extraction 0 1 15 10 26Vitrification 0 0 0 1 1Total 0 1 32 19 52Percent of Total 0% 2% 62% 37%
In Situ GroundwaterAir Sparging 0 1 2 1 4
Bioremediation 0 0 3 0 3
In-Well Air Stripping 0 0 1 0 1Total 0 1 6 1 8Percent of Total 0% 13% 75% 13%
Sources: 9: Data sources are listed in the References and Data Sources section on page 38.
38
Sect
ion
6:
Re
fere
nce
s an
d D
ata
Sou
rce
s
1. List of NPL sites. www.epa.gov/superfund/sites/query/queryhtm/nplfina.txt (9/2000).
2. List of Superfund National Priority List (NPL) sitesthat have been deleted. www.epa.gov/superfund/sites/query/ queryhtm/npldela.txt (9/2000).
3. Compilation of Record of Decision (ROD)abstracts, site summaries, and fact sheets for fiscalyears (FY) 1982 through 1997. www.epa.gov/superfund/sites/query/advquery.htm (1/20/2000).
4. Records of Decision (RODs), ROD amendments,Explanations of Significant Difference, and RODabstracts from FY 1982 through FY 1999.
Section 6: References andData Sources
5. Contacts with remedial project managers, FY 1992through FY 1999.
6. ROD Annual Reports, EPA Office of Emergencyand Remedial Response(OERR), 1998 through1992.
7. Innovative Treatment Technologies: Annual StatusReport (ASR) Eighth Edition (EPA-542-R-99-001). EPA. Office of Solid Waste and EmergencyResponse. April 1999.
8. Personal communication from Ken Lovelace,OERR, to Tom Sinksi of Tetra Tech EM Inc., April,1998.
9. Contacts with EPA Superfund Removal BranchChiefs and On-Scene Coordinators.

A
Air sparging 5, 15, 16, 17, 23, 31, 32, 33, 36
B
Bioremediation 3, 5, 11, 12, 14, 15, 16, 17, 18,19, 20, 21, 22, 23, 24, 25-28, 31, 32, 33, 36
C
CERCLIS 2, 32
Chemical treatment 3, 11, 16, 17, 18, 19, 21,23, 25, 26, 27, 33, 36
Clu-in 12, 17, 23, 24, 27, 29, 33, 34, 36
D
Dual-phase extraction 5, 11, 16, 17, 18, 26, 33
E
Electrical separation 3, 11, 16, 17, 18, 26
F
FRTR 3, 12, 25
G
Groundwater 1, 2, 3, 4, 5, 6, 7, 8, 10, 12, 14,15, 16, 23, 25, 26, 27, 29, 31, 32-37
I
In-well air stripping 5, 16, 17, 33
Incineration (off-site) 11, 14, 16, 17, 18, 19,23, 26, 36
Incineration (on-site) 11, 14, 16, 17, 18, 19,23, 26
Innovative 1, 2, 3, 12, 20, 25, 26, 30, 31, 32,33, 37, 38
M
Mechanical soil aeration 3, 11, 16, 17, 18, 26
MNA 32, 34-36
N
Neutralization 4, 11, 16, 18, 26
NPL 7, 8, 38
O
OERR 35, 38
Open burn/open detonation 11, 16, 17, 18
P
Permeable reactive barrier (PRB) 1, 6, 16, 17,32, 33, 34, 35
Physical separation 4, 11, 16, 17, 18, 20, 21, 26
Phytoremediation 1, 4, 11, 16, 17, 18, 25, 26,28-31, 33
Pump-and-treat 1, 2, 23, 32
R
Remedial action 1, 11, 14, 17, 22, 23, 27, 28,31, 32, 33, 34, 35
Removal action 1, 37
ROD 1, 2, 7, 8, 9, 10, 11, 14, 23, 32, 35, 36, 38
S
Soil flushing 3, 11, 12, 14, 16, 17, 18, 19, 21,25, 27, 29
Soil vapor extraction (SVE) 2, 4, 5, 11, 12, 13,15, 16, 17, 18, 19, 20, 23, 24, 25, 26, 27, 31, 36
Soil washing 4, 11, 16, 17, 18, 21, 23, 26, 36
Solidification/stabilization (S/S) 2, 4, 11, 12,13, 14, 15, 16, 17, 18, 19, 20, 21, 22, 23, 24,26, 31, 36
Solvent extraction 4, 11, 16, 17, 18, 20, 21, 23,26, 36
Source control 1, 2, 3, 7, 8, 9, 10, 11, 12, 13,14, 15, 16, 18, 19, 22, 23, 25, 26, 27, 29, 31, 36
T
Thermal desorption2, 5, 11, 12, 14, 15, 16, 17, 18, 19, 21, 23, 24,25, 26, 27, 36
Thermally enhanced recovery 5, 11, 16, 17, 18,20, 21, 25, 26, 27
V
Vertical Engineered Barrier (VEB) 2, 6, 32-34
Vitrification 5, 11, 16, 17, 18, 21, 26, 36
Index