Consumption Experience and Sales Promotion Expenditure Claes ...
Upload
rigel-headCategory
view
52download
3description

Final Consumption Final Consumption Expenditure – NPISHs and Expenditure – NPISHs and
GovernmentGovernmentNational Institute of StatisticsNational Institute of Statistics
CAMBODIACAMBODIA
Final Consumption Final Consumption Expenditure – NPISHs and Expenditure – NPISHs and
GovernmentGovernmentNational Institute of StatisticsNational Institute of Statistics
CAMBODIACAMBODIA

2
Table of Contents
Introduction
Classifications
Data Sources
Focused Points
Compilation Methodology
Highlighted GDP
3
Introduction
�The National Institute of Statistics (NIS) of the Ministry of Planning (MoP) is the agency of the Royal Government of Cambodia (RGC) that is responsible for the compilation and dissemination of the official ANA, QNA and other related statistics of Cambodia. The statistical activities of the NIS are governed by the Sub-decree on Statistics Obligations, which was promulgated on October 15, 1997.

4
Introduction
�The national accounts (NA) statistics are compiled by the National Accounts Department (NAD) of NIS. The NIS has compiled official NA statistics since 1996. All series from 1993 onwards have been revised and are now compiled broadly in accordance with the United Nations’ System of National Accounts 1993 (SNA93). In principle, Cambodia’s NA statistics cover all transactions of government, households, individuals, and enterprises residing in Cambodia and between residents and non-residents..

5
Classification
�For compiling GDP by expenditure approach, 12 expenditure groups are used since the current practices do not include the use of detailed Classification of Individual Consumption of Households by Purposes (COICOP), Classification of Functions of Government (COFOG) and Classification of Consumption of Private Nonprofit Institutions (COPNI) classifications. Very few of other classifications required in SNA 1993 have been implemented at this stage. However, plans are in place to implement these classifications over the medium term.

6
Classification
�Final Consumption Expenditure (FCE)Household Final Consumption Expenditure (HFCE)
�Private Non Profit Organizations Serving Households (NPISHs)
�Government Consumption Expenditure (GCE)
�Gross Fixed Capital Formation (GFCF)� Livestock�
�Durable Equipment
�Construction
�
7
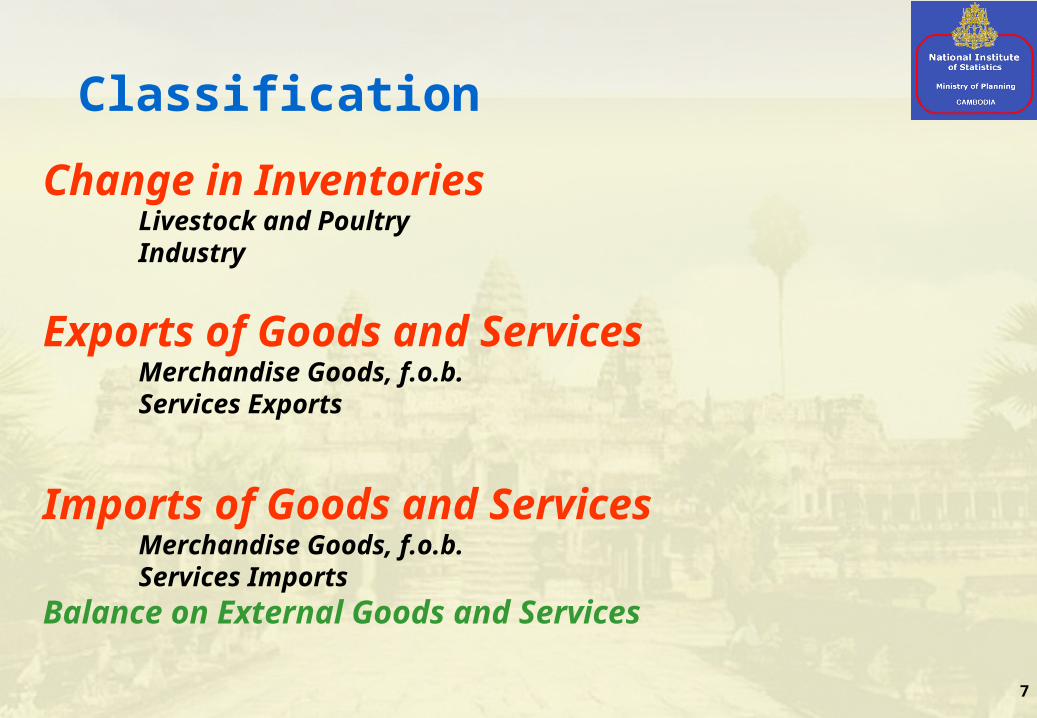
Classification
�Change in Inventories� Livestock and Poultry� Industry
�Exports of Goods and Services� Merchandise Goods, f.o.b.� Services Exports
�Imports of Goods and Services� Merchandise Goods, f.o.b.� Services Imports�Balance on External Goods and Services

8
Data sources�Administrative data
�1. Ministry of Economic and Finance (MEF)
�2. Direction of trade, Ministry of Commerce (MoC)
�3. Customs and Excises Department (CED)
�4. Councils for Development of Cambodia (CDC)
�5. Other organizations

9
Data sources
Survey and Other Data Collections
�1. Cambodia Socio-Economic Surveys (CSES) for 1993-1994, 1996, 1997 and 1999, 2004, 2007, 2008, and 2009�2. Quarterly Consumer Price Indices (CPI) for Phnom Penh and Urban, Cambodia;�3. Quarterly Producer Price Indices (PPI) from 2000 onwards; �4. Monthly Construction Permit Survey (MCPS); �5. Survey of Retail Trading Units (SRTU) 1996-1999; �6. Labor Force Surveys in Phnom Penh, 1997-1998 and Cambodia in 2000 and 2001;�

10
Focused Points
- Private Non Profit Organizations Serving Households (NPISHs)
- Government Consumption Expenditure (GCE)

11
Compilation Methodology
�Non Profit Organizations Serving Households (NPISHs)
�The data for non profit organizations serving households are sourced from the annual survey of expenditure on Non- Governmental Organizations (NGOs) conducted by CDC. Expenditure by NGOs, which is already used for the community services estimate on the production side of the account, has also been shown as final consumption expenditure. HFCE implicit price deflators are used to derive constant price estimates.

12
Compilation Methodology
�Government Final Consumption Expenditure
�For government final consumption expenditure, monthly report of Ministry of Economics and Finance (MEF) on government financial data on current expenditure is utilized. An implicit price deflator based on a combination of wages per employee and the all items HFCE implicit price deflator is used to compile constant price estimates.

13
GDP by Expenditure Approach at Current Price (2005-2010)in Billion Riels (Highlighted)
2005 2006 2007 2008 2009 2010
Final Consumption Expenditure 22,758 25,200 29,393 35,706 36,239 39,314
HFCE 21,104 23,500 26,627 32,512 31,874 34,392
NPISHs 606 666 758 830 918 993
GCE 1,048 1,033 2,008 2,365 3,447 3,929
Gross Fixed Capital Formation 4,864 5,775 6,928 7,247 8,670 7,531
Change in Inventories 347 947 500 566 566 566
Exports of Goods and Services 16,505 20,475 22,892 27,507 25,805 31,084
Less: Imports of Goods and Services 18,736 22,692 25,561 28,445 27,122 31,684
Balance on External Goods and Services (2,231) (2,217) (2,669) (937) (1,317) (600)
Statistical Discrepancy 16 146 890 (613) (1,092) (868)
GROSS DOMESTIC EXPENDITURES 25,754 29,849 35,042 41,968 43,066 45,943

14
GDP by Expenditure Approach at Constant 2000 Price (2005-2010) in Billion Riels (Highlighted)
2005 2006 2007 2008 2009 2010
Final Consumption Expenditure 19,386 20,591 22,500 25,249 25,605 27,443
HFCE 17,981 19,201 20,378 22,944 22,486 23,970
NPISHs 518 547 586 691 767 826
GCE 887 844 1,536 1,613 2,353 2,647
Gross Fixed Capital Formation 4,481 5,228 5,757 6,674 7,929 7,073
Change in Inventories 258 683 454 532 541 541
Exports of Goods and Services 15,333 18,275 20,129 23,281 21,817 25,530
Less: Imports of Goods and Services 17,438 20,220 22,659 27,780 26,429 30,835
Balance on External Goods and Services (2,105) (1,945) (2,529) (4,500) (4,612) (5,305)
Statistical Discrepancy (10) (178) 687 712 (920) 628
GROSS DOMESTIC EXPENDITURES 22,009 24,380 26,870 28,668 28,692 30,381
15
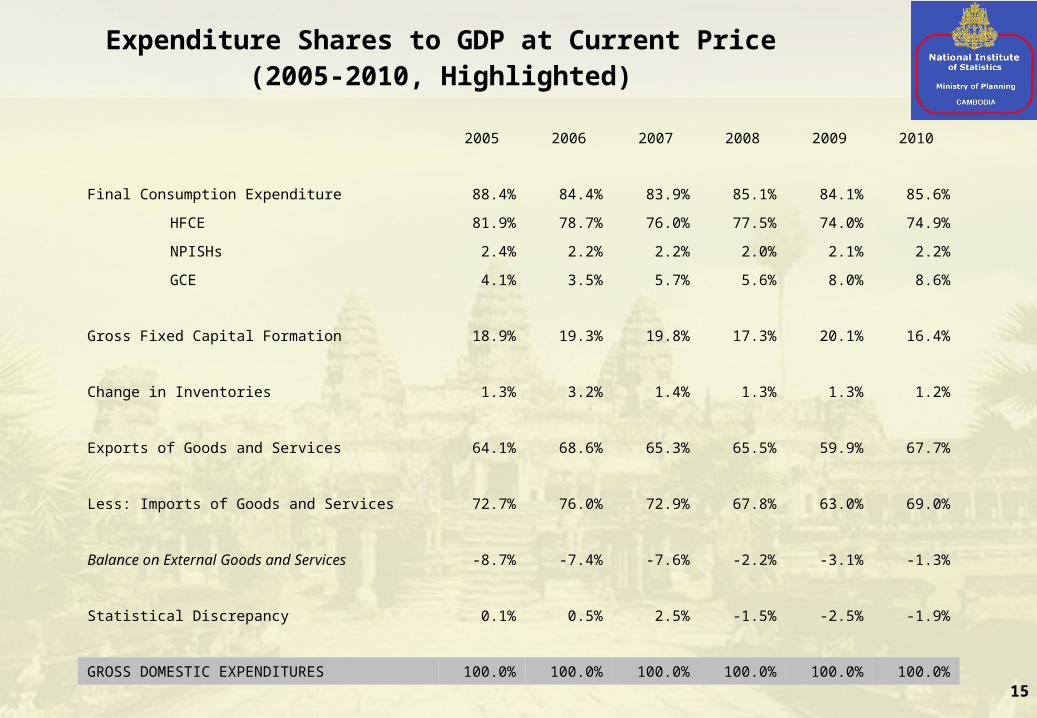
Expenditure Shares to GDP at Current Price(2005-2010, Highlighted)
2005 2006 2007 2008 2009 2010
Final Consumption Expenditure 88.4% 84.4% 83.9% 85.1% 84.1% 85.6%
HFCE 81.9% 78.7% 76.0% 77.5% 74.0% 74.9%
NPISHs 2.4% 2.2% 2.2% 2.0% 2.1% 2.2%
GCE 4.1% 3.5% 5.7% 5.6% 8.0% 8.6%
Gross Fixed Capital Formation 18.9% 19.3% 19.8% 17.3% 20.1% 16.4%
Change in Inventories 1.3% 3.2% 1.4% 1.3% 1.3% 1.2%
Exports of Goods and Services 64.1% 68.6% 65.3% 65.5% 59.9% 67.7%
Less: Imports of Goods and Services 72.7% 76.0% 72.9% 67.8% 63.0% 69.0%
Balance on External Goods and Services -8.7% -7.4% -7.6% -2.2% -3.1% -1.3%
Statistical Discrepancy 0.1% 0.5% 2.5% -1.5% -2.5% -1.9%
GROSS DOMESTIC EXPENDITURES 100.0% 100.0% 100.0% 100.0% 100.0% 100.0%
16
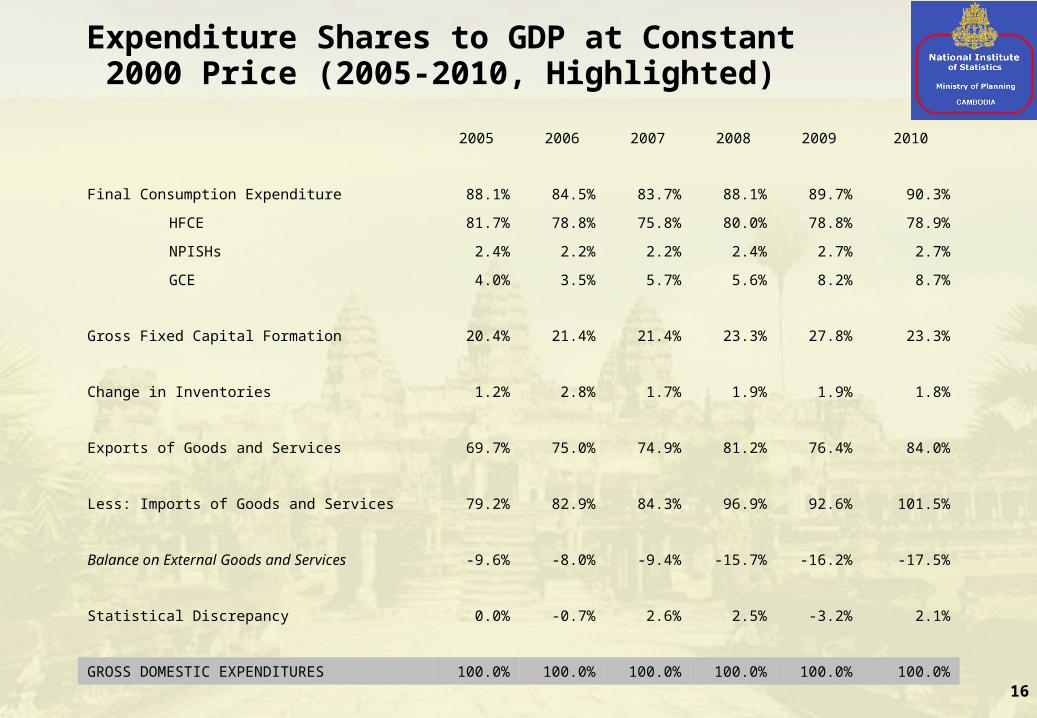
Expenditure Shares to GDP at Constant 2000 Price (2005-2010, Highlighted)
2005 2006 2007 2008 2009 2010
Final Consumption Expenditure 88.1% 84.5% 83.7% 88.1% 89.7% 90.3%
HFCE 81.7% 78.8% 75.8% 80.0% 78.8% 78.9%
NPISHs 2.4% 2.2% 2.2% 2.4% 2.7% 2.7%
GCE 4.0% 3.5% 5.7% 5.6% 8.2% 8.7%
Gross Fixed Capital Formation 20.4% 21.4% 21.4% 23.3% 27.8% 23.3%
Change in Inventories 1.2% 2.8% 1.7% 1.9% 1.9% 1.8%
Exports of Goods and Services 69.7% 75.0% 74.9% 81.2% 76.4% 84.0%
Less: Imports of Goods and Services 79.2% 82.9% 84.3% 96.9% 92.6% 101.5%
Balance on External Goods and Services -9.6% -8.0% -9.4% -15.7% -16.2% -17.5%
Statistical Discrepancy 0.0% -0.7% 2.6% 2.5% -3.2% 2.1%
GROSS DOMESTIC EXPENDITURES 100.0% 100.0% 100.0% 100.0% 100.0% 100.0%
17
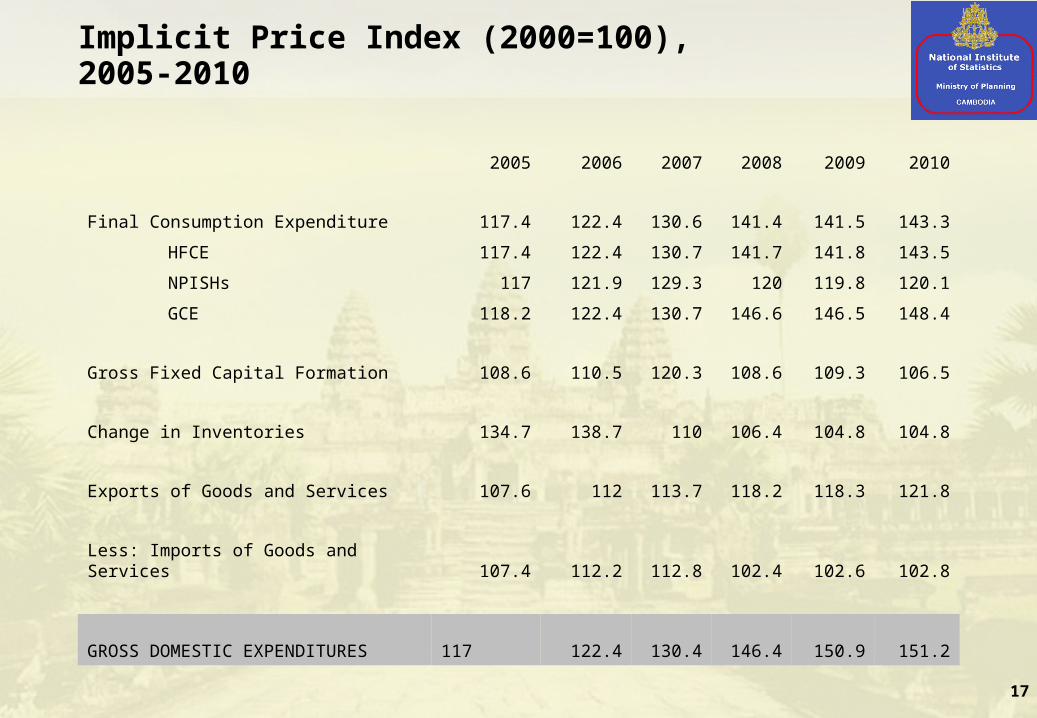
Implicit Price Index (2000=100), 2005-2010
2005 2006 2007 2008 2009 2010
Final Consumption Expenditure 117.4 122.4 130.6 141.4 141.5 143.3
HFCE 117.4 122.4 130.7 141.7 141.8 143.5
NPISHs 117 121.9 129.3 120 119.8 120.1
GCE 118.2 122.4 130.7 146.6 146.5 148.4
Gross Fixed Capital Formation 108.6 110.5 120.3 108.6 109.3 106.5
Change in Inventories 134.7 138.7 110 106.4 104.8 104.8
Exports of Goods and Services 107.6 112 113.7 118.2 118.3 121.8
Less: Imports of Goods and Services 107.4 112.2 112.8 102.4 102.6 102.8
GROSS DOMESTIC EXPENDITURES 117 122.4 130.4 146.4 150.9 151.2

18
Thank You for your attention!
Angkor Wat Sihanoukville Beach Royal Palace in Phnom Penh