Final Budget Outcome - treasury.sa.gov.au · revenue from MAC, contributed assets, fines, penalties...
62
2016–17 Final Budget Outcome
Transcript of Final Budget Outcome - treasury.sa.gov.au · revenue from MAC, contributed assets, fines, penalties...

2016–17Final Budget Outcome

Acknowledgements
Content from this publication may be reproduced with appropriate acknowledgement, as permitted under the Copyright Act 1968.
© Government of South Australia 2017
Final Budget Outcome 2016−17
General enquiries regarding financial information papers should be directed to:
Chief Executive Department of Treasury and Finance State Administration Centre 200 Victoria Square Adelaide SA 5000
Copies may be obtained from:
SERVICE SA Government Legislation Outlet Ground Floor EDS Centre 108 North Terrace Adelaide SA 5000
Website: www.treasury.sa.gov.au
© Government of South Australia 2017
ISSN 1036-3807 Public-I3-AI

Table of contents
Introduction .......................................................................................................................... 3
Chapter 1: 2016–17 Final Budget Outcome Overview .................................................................................................................................................. 5 General government sector operating results ........................................................................................... 6 Balance sheet indicators ......................................................................................................................... 11
Chapter 2: Economic performance South Australian economic performance for the year 2016–17 ............................................................. 15
Appendices Appendix A Uniform Presentation Framework tables and Loan Council allocation report ................ 17 Appendix B Consolidated Account ..................................................................................................... 39 Appendix C General government and non-financial public sector financial statistics time series ...... 46
Final Budget Outcome 2016–17 1

2 Final Budget Outcome 2016–17

Introduction
The Final Budget Outcome reports the 2016–17 financial results for the Government of South Australia against its key fiscal targets and provides an analysis of these results against earlier estimates.
Chapter 1 provides an overview of the 2016−17 final outcomes with a focus on the general government sector financial outcomes and financial liabilities. The chapter includes:
• a discussion of variations between the 2016−17 final outcome for revenues and expenses of the general government sector and 2016–17 estimates included in the 2017−18 Budget
• public sector net debt and superannuation liability levels as at 30 June 2017.
Chapter 2 provides an assessment of the performance of the South Australian economy in 2016−17.
The appendices to this document provide the following information.
• Appendix A contains the Uniform Presentation Framework reporting for the general government sector, the public non-financial corporations sector, the non-financial public sector and the public financial corporations sector. Further information is also provided on general government sector taxation revenue, grant revenue and expenses, and expenses and capital expenditure by function. This appendix also details the Loan Council Allocation for 2016−17.
• Appendix B summarises the receipts and payments of the Consolidated Account.
• Appendix C provides a time series of financial statistics.
Final Budget Outcome 2016–17 3

Introduction
4 Final Budget Outcome 2016–17
Chapter 1: 2016–17 Final Budget Outcome
Overview
The Government of South Australia recorded a net operating surplus of $443 million for 2016–17 for the general government sector. This represents an improvement of $204 million from the $239 million surplus estimated at the time of the 2017–18 Budget.
The improvement in 2016–17 compared with the estimate at the time of the 2017–18 Budget reflects a combination of higher than expected revenue ($211 million), partly offset by higher than expected expenditure ($7 million). This result includes a receipt and payment through the government of Compulsory Third Party (CTP) insurance premiums that were transferred from the Motor Accident Commission (MAC) to private insurers as part of the transition to the new CTP insurance arrangements. Excluding this transfer revenue was $101 million higher than expected and expenses were $114 million lower than expected. Revenues were also higher than expected as a result of once-off donated assets (including the Leigh Creek Township returning to government), higher than expected revenues from interstate health patients and other regulatory fees and a higher than expected income tax equivalent revenue from SA Water. The final outcome for expenses was also impacted by the delayed timing of payments from a number of grant and other programs, now scheduled to be paid in 2017–18.
The net operating surplus of $443 million in 2016–17 follows a surplus of $300 million in 2015–16.
General government expenses increased by 5.7 per cent in nominal terms from 2015–16, a real increase of 4.1 per cent. General government revenue increased by 6.4 per cent in nominal terms, a real increase of 4.8 per cent. Growth in revenues largely reflected growth in GST grants, with South Australia’s share of the national GST pool increasing in 2016–17.
The net lending deficit was $2.4 billion in 2016–17, an improvement of $224 million over the estimate at the time of the 2017–18 Budget. The improvement reflects a better than expected net operating surplus and lower than expected investment spending. The net lending deficit reflects the recognition of the $2.8 billion new Royal Adelaide Hospital.
Net debt for the general government sector at 30 June 2017 was $6.1 billion, $187 million lower than estimated at the time of the 2017–18 Budget. This is predominantly the result of a better than expected net operating surplus and net lending position than estimated at the time of the 2017–18 Budget.
The net debt to revenue ratio at 30 June 2017 was 33.1 per cent. The outcome is consistent with the government’s fiscal target of maintaining a net debt to revenue ratio below 35 per cent.
Table 1.1 shows the 2016−17 outcomes for key general government financial indicators compared with earlier estimates and the 2015–16 outcomes.
Final Budget Outcome 2016–17 5

Table 1.1: General government sector aggregates ($million)
2015–16 Outcome
2016–17 Estimate as
2016–17 Budget
2016–17 Estimate at
2017–18 Budget
2016–17 Outcome
Revenue 17 362 18 263 18 269 18 480Expenses -17 062 -18 009 -18 030 -18 037Net operating balance 300 254 239 443Net acquisition of non-financial assets 204 2 690 2 833 2 814Net lending 96 -2 436 -2 595 -2 371
Memorandum items:Net debt 4 393 6 246 6 297 6 110Net debt to revenue 25.3 34.2 34.5 33.1
Note: Totals may not add due to rounding.
General government sector operating results
The major items contributing to the variations in the general government sector financial outcome compared with previous estimates are discussed below.
Operating revenue
Operating revenues for the general government sector for 2016−17 were $211 million higher than estimated at the time of the 2017–18 Budget.
Table 1.2: Operating revenue ($million) 2016–17
Estimate at 2016–17 Budget
2016–17 Estimate at
2017–18 Budget
2016–17 Outcome
RevenueTaxation revenue 4 517 4 421 4 431Grants 10 246 10 005 9 958Sales of goods and services 2 487 2 527 2 568Interest income 24 24 25Dividend and income tax equivalent income 326 628 645Other 664 664 852Total revenue 18 263 18 269 18 480
Note: Totals may not add due to rounding.
Taxation revenue
Taxation revenue was around $10 million higher than the estimated result primarily due to higher than expected revenue from taxes on motor vehicles, insurance and payrolls partially offset by lower than expected revenues from property and gambling taxes. Table 1.3 summarises variations in actual tax receipts for 2016–17 relative to the estimated outcome at the time of the 2017–18 Budget.
6 Final Budget Outcome 2016–17
Chapter 1: 2016–17 Final Budget Outcome

Table 1.3: Taxation variations ($million)
Payroll tax 8Taxes on property -15Insurance taxes 9Gambling taxes -3Motor vehicle taxes 11Total taxation 10
Variation
Note: Totals may not add due to rounding.
Payroll tax revenue was $8 million higher than the estimated outcome in the 2017–18 Budget due to stronger than expected growth in taxable payrolls.
Property tax revenues were $15 million lower than anticipated. This reflected lower than expected revenues from land tax, emergency services levy collections on fixed property and conveyance duty.
Insurance duty revenue was $9 million higher than estimated largely due to higher than expected growth in general insurance premiums.
Gambling tax revenue was $3 million lower than estimated reflecting weaker than expected growth in the net gambling revenue from gaming machines in hotels and clubs.
Motor vehicle tax revenues were $11 million higher than estimated primarily due to higher than expected revenue from registration fees and stamp duty on the transfer of motor vehicle registrations.
Grant revenue
Total grant revenue was $47 million lower than estimated in the 2017–18 Budget, with higher than expected GST revenue grants offset by lower Specific Purpose payments, National Partnership payments and other contributions and grants.
GST revenue grants were $45 million higher than expected primarily due to higher than anticipated growth in the total GST pool available for distribution in 2016–17, partially offset by a lower than estimated population share following the release of ABS Census population data.
Specific Purpose payments were $44 million lower than expected mainly due to the timing of payments from the Commonwealth Government. This largely relates to funding under the National Health Reform Agreement which is now expected to be received in 2017–18.
National Partnership (NP) payments were $22 million lower than estimated mainly due to the timing of payments associated with a number of NPs including Remote Housing and Pay Equity for the Social and Community Services Sector, which are now expected to be received in 2017–18.
Total other contributions and grants were around $26 million lower than estimated mainly due to lower than expected education and health related revenue grants from outside government.
Sales of goods and services
Revenue from sales of goods and services was $41 million higher than estimated mainly due to higher than expected revenue from interstate health patients and regulatory fees. This is partially offset by lower than expected health unit and TAFE fees.
Dividend and income tax equivalent income
Dividend and income tax equivalent revenue was $17 million higher than estimated primarily reflecting higher than expected income tax equivalent revenue from SA Water.
Final Budget Outcome 2016–17 7
Chapter 1: 2016–17 Final Budget Outcome

Other revenue
Other revenues were $188 million higher than the estimated result reflecting the impact of higher revenue from MAC, contributed assets, fines, penalties and schools revenue, partially offset by lower than expected revenue from royalties.
Revenue of $110 million from residual third party motor vehicle insurance premiums was received in 2016–17 in addition to $11 million that was received in 2015–16. This was offset by total expenditure of $121 million in 2016–17 to the approved insurers associated with the transition to the new Compulsory Third Party insurance arrangements.
Contributed assets revenue was $54 million higher than estimated mainly reflecting the return of the Leigh Creek Township to the Government from Flinders Power and that the transition to new arrangements under the National Partnership on Essential Vaccines, where actual vaccines are received from the Commonwealth instead of funding, occurred earlier than expected.
Fines and penalties revenue was $16 million higher than the estimated result mainly due to higher court settlements, offset by corresponding expenditure associated with the pass through of these amounts to third parties.
Schools revenue was $14 million higher than estimated mainly due to higher than expected revenue from various sources including international education fees and fundraising activities.
Royalty revenues were $12 million lower than expected due to lower than anticipated mineral and petroleum production as well as a higher than expected Australian dollar.
Operating expenses
Table 1.4: Operating expenses ($million)
2016−17 Estimate at
2016−17 Budget
2016−17 Estimate at
2017−18 Budget
2016−17 Outcome
ExpensesEmployee expenses 7 899 8 009 8 010Superannuation expenses
Superannuation interest cost 392 345 345Other superannuation expenses 859 829 767
Depreciation and amortisation 963 888 928Interest expenses 346 191 192Other property expenses — — —Other operating expenses 4 613 4 562 4 771Grants 2 937 3 206 3 025Total expenses 18 009 18 030 18 037
Note: Totals may not add due to rounding.
The final outcome for total operating expenses in 2016–17 was $7 million higher than the estimate reported in the 2017–18 Budget.
Employee expenses were in line with the estimated result. Amounts reclassified from other superannuation expenses to employee expenses were largely offset by lower than expected employee expenses in a number of agencies.
Other superannuation expenses were $62 million lower than the estimated result primarily due to a reclassification from other superannuation expenses to employee expenses in the Department for Education and Child Development ($33.8 million) and South Australia Police ($13.7 million).
8 Final Budget Outcome 2016–17
Chapter 1: 2016–17 Final Budget Outcome

Depreciation expenses were $40 million higher than the estimated result primarily due to additional depreciation in the Department for Planning, Transport and Infrastructure. An $18 million increase in depreciation relates to the delay in the sale of the State Administration Centre and surrounding buildings precinct which was not sold as originally anticipated in 2016–17. Depreciation expenses are also higher following a reduction in the useful life of rail track and rolling stock ($13 million).
Other operating expenses were $209 million higher than estimated primarily due to the recognition of a $121 million payment to approved insurers under the new CTP arrangements for in force policies as at 30 June 2016. This additional expenditure was largely matched by residual premium revenue from MAC.
Grants expenses were $181 million lower than estimated primarily due to the timing of payments. The Department of Primary Industries and Regions SA’s grant expenses were around $41 million lower than estimated result due to later than expected payments relating to the implementation of the South Australian River Murray sustainability program ($24.4 million) and milestone payments from the Regional Development fund ($8.2 million). The Department of State Development’s (DSD) grant expenses were around $36 million lower than estimated mainly due to some grants being paid in 2017–18 rather than 2016–17 including from the Economic Investment Fund ($9.9 million) and Our Jobs Plan ($7.3 million).
Other agencies under budget as a result of later than expected payments in various grant programs include the Department of Treasury and Finance ($26 million), primarily due to later than expected payments for industry assistance under the Industry Financial Assistance Deposit Account, the Department of the Premier and Cabinet ($20 million), principally due to later than expected payments to support businesses under the Large Market Business Customer Electricity program, and the Department for Health and Ageing ($18 million), principally due to a later than expected payment from the Health and Medical Research fund.
Net acquisition of non-financial assets
Table 1.5: Net acquisition of non-financial assets ($million)
2016–17 Estimate at
2016–17 Budget
2016–17 Estimate at
2017–18 Budget
2016–17 Outcome
Net acquisition of non-financial assetsPurchases of non-financial assets 4 630 4 454 4 460less Sales of non-financial assets 976 733 722less Depreciation 963 888 928plus Change in inventories — — 3plus Other movements in non-financial assets — — —equals Total net acquisition of non-financial assets 2 690 2 833 2 814
Note: Totals may not add due to rounding.
Purchases of non-financial assets were largely in line with the estimate at the time of the 2017–18 Budget. Changes in the timing of expenditure which is now expected to occur in future years was largely offset by provisions held for underspending on capital projects.
Tables 1.6 and 1.7 summarise the variations to revenue, expenses and capital investment expenditure and the impact on net operating balance and net lending fiscal indicators in the general government sector since the estimates in the 2016–17 Budget.
Final Budget Outcome 2016–17 9
Chapter 1: 2016–17 Final Budget Outcome

Table 1.6: Net operating balance ― policy and parameter variations ($million)
2016–17Estimate at 2016–17 Budget 254Parameter and other variationsRevenue — taxation - 96Revenue — other 92Operating expenses 226Net effect of parameter and other variations 222Policy measures up to the budgetRevenue measures — taxation —Revenue measures — other —Revenue — offsets 10Operating expenses - 160Net effect of policy measures up to the 2017–18 budget - 150Policy measures in the BudgetRevenue — taxation —Revenue — other —Revenue offsets —Operating expenses - 87Net effect of policy measures in the 2017–18 Budget - 87
Estimate at 2017–18 Budget 239Parameter and other variationsRevenue — taxation 10Revenue — other 201Operating expenses - 7Net effect of parameter and other variations 204Final outcome 443
Note: Totals may not add due to rounding.
Table 1.7: Net lending ― policy and parameter variations ($million)
2016–17Estimate at 2016–17 Budget -2 436
Net effect of operating variations - 15
Investing variations(a)
Net effect of parameter variations - 118Policy variations up to the 2017–18 Budget - 24Policy variations in the 2017–18 Budget - 1Use of specific provisions to offset policy variations —Total investing variations - 144
Estimate at 2017–18 Budget -2 595
Net effect of operating variations after the 2017–18 Budget 204
Investing variations(a)
Net effect of parameter variations 19
Final outcome -2 371
Note: Totals may not add due to rounding.
(a) Investing variations relate to the movements in the net acquisition of non-financial assets.
10 Final Budget Outcome 2016–17
Chapter 1: 2016–17 Final Budget Outcome
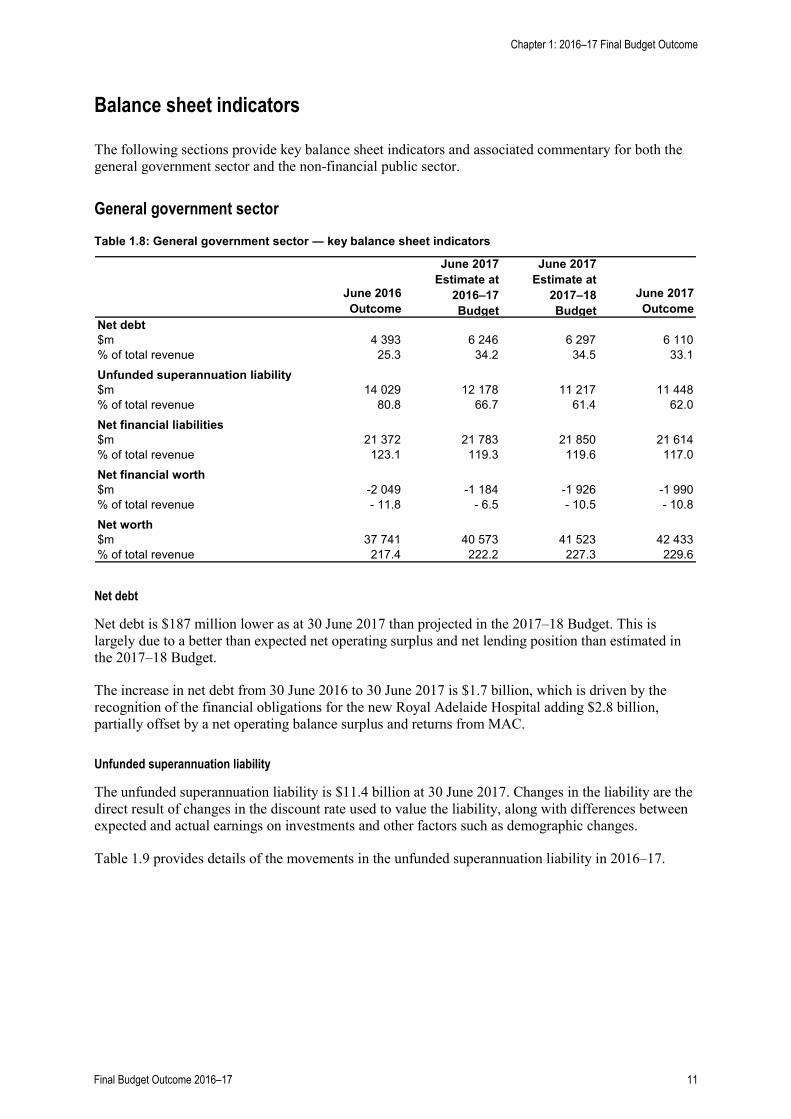
Balance sheet indicators
The following sections provide key balance sheet indicators and associated commentary for both the general government sector and the non-financial public sector.
General government sector
Table 1.8: General government sector ― key balance sheet indicators
June 2016 Outcome
June 2017 Estimate at
2016–17 Budget
June 2017 Estimate at
2017–18 Budget
June 2017 Outcome
Net debt$m 4 393 6 246 6 297 6 110% of total revenue 25.3 34.2 34.5 33.1Unfunded superannuation liability $m 14 029 12 178 11 217 11 448% of total revenue 80.8 66.7 61.4 62.0Net financial liabilities$m 21 372 21 783 21 850 21 614% of total revenue 123.1 119.3 119.6 117.0Net financial worth$m -2 049 -1 184 -1 926 -1 990% of total revenue - 11.8 - 6.5 - 10.5 - 10.8Net worth$m 37 741 40 573 41 523 42 433% of total revenue 217.4 222.2 227.3 229.6
Net debt
Net debt is $187 million lower as at 30 June 2017 than projected in the 2017–18 Budget. This is largely due to a better than expected net operating surplus and net lending position than estimated in the 2017–18 Budget.
The increase in net debt from 30 June 2016 to 30 June 2017 is $1.7 billion, which is driven by the recognition of the financial obligations for the new Royal Adelaide Hospital adding $2.8 billion, partially offset by a net operating balance surplus and returns from MAC.
Unfunded superannuation liability
The unfunded superannuation liability is $11.4 billion at 30 June 2017. Changes in the liability are the direct result of changes in the discount rate used to value the liability, along with differences between expected and actual earnings on investments and other factors such as demographic changes.
Table 1.9 provides details of the movements in the unfunded superannuation liability in 2016–17.
Final Budget Outcome 2016–17 11
Chapter 1: 2016–17 Final Budget Outcome

Table 1.9: Unfunded superannuation liability ($million)
Unfunded superannuation liability as at 30 June 2016 14 029Nominal superannuation interest expense(a) 345Past service payments - 458Impact of change in discount rate from 2.5% to 3.3% -2 000Higher than expected returns on investments(b) - 350Other movements - 349Estimate of 30 June 2017 unfunded superannuation liability as at 2017–18 Budget 11 217Impact of change in discount rate from 3.3% to 3.1% 447Lower than expected returns on investments in 2016–17(c) 62016 SA Superannuation Scheme triennial review - 178Other movements - 44Unfunded superannuation liability as at 30 June 2017 11 448
Note: Totals may not add due to rounding.
(a) The nominal superannuation interest expense represents the increase during the year in the present value of the defined benefit obligation because the benefits are one period closer to settlement.
(b) The forecast 2016–17 earnings rate at the time of the 2017–18 Budget was 12.5 per cent compared with the long-term earnings assumption of 7.0 per cent.
(c) The 2016–17 earnings rate at 30 June 2017 was 12.4 per cent compared to 12.5 per cent forecast at the time of the 2017–18 Budget.
The accounting standard for employee entitlements requires that superannuation benefits are valued at the net present value of future obligations. This is calculated by discounting the gross liability using market yields on government bonds. Small changes in the long-term bond rate can have a significant impact on the reported liability, irrespective of whether the underlying nature of the liability has changed.
In the period between the date of estimates used in the 2017–18 Budget and 30 June 2017, further material changes impacting on the value of the unfunded liability at 30 June 2017 included:
• a reduction in the discount rate used to value the liability (which is based on a composite of prevailing long-dated Commonwealth Government bond rates) from 3.3 per cent to 3.1 per cent, which resulted in a $447 million increase in the liability, and
• changes to demographic assumptions in the 2016 triennial review of the State Superannuation Scheme. Overall the 2016 assumptions have resulted in a lower accrued liability.
The last of the government’s defined benefit superannuation schemes closed to new members in 1994. These schemes create a liability for the government to pay future benefits to members in accordance with the terms of the schemes. Since 1994−95, the government has had a target to fully fund the superannuation liability by 2034. In 2016−17, a $458 million payment was made by the government to the superannuation schemes as part of meeting this target.
Net financial liabilities
In addition to net debt and unfunded superannuation liabilities, net financial liabilities include other financial liabilities and financial assets (excluding equity held in public non-financial corporations and public financial corporations).
Net financial liabilities amounted to $21.6 billion at 30 June 2017, which is $236 million lower than the estimate at the time of the 2017−18 Budget. This decrease is the result of a better than expected net operating surplus and net lending position than estimated in the 2017–18 Budget.
Aside from net debt and unfunded superannuation liabilities, other employee benefits liabilities are the next largest contributor to net financial liabilities. Other employee benefits, predominantly long service leave, totalled $2.8 billion at 30 June 2017 compared to the estimate of $2.9 billion at the time of the 2017–18 Budget.
12 Final Budget Outcome 2016–17
Chapter 1: 2016–17 Final Budget Outcome

Net financial worth
Between June 2016 and June 2017, general government sector net financial worth improved by $59 million to negative $2.0 billion as at 30 June 2017. This negative net financial worth position does not take into account the value of non-financial assets, which have been growing in recent years’ in line with the government’s infrastructure program.
Net worth
Table 1.10 shows movements in net worth attributable to operating transactions and other items during 2016−17.
Table 1.10: General government sector net worth ($million) 2016–17
Estimated Result
2016–17 Outcome
Net worth at 30 June 2016 37 741 37 741Total prior period adjustments — —
Restated net worth at beginning of year 37 741 37 741
Change in net worth from operating transactions:Net operating balance 239 443
Change in net worth from other economic flows:Movement in net assets of PNFCs(a) 346 17Movement in net assets of PFCs(a) 851 882Revaluation of non-financial assets - 72 1 007Writedown of non-financial assets — - 52Revaluation of unfunded superannuation liability 2 699 2 468Revaluation of annual leave liability - 15 - 17Revaluation of long service leave liability - 97 25Revaluation of workers compensation liability - 159 29Other revaluation adjustments - 9 - 109SubtotalTotal other economic flows 3 544 4 250Net worth at 30 June 2017 41 523 42 433
Note: Totals may not add due to rounding.
(a) Net of equity injections from, and the return of equity to, the general government sector.
General government sector net worth increased by $4.7 billion in 2016−17, partly due to the reduction in the value of the unfunded superannuation liability ($2.5 billion). This figure represents the movement in the unfunded liability not attributable to past service payments or nominal superannuation interest expense, but rather items such as the effect of changes in the discount rate, returns on investments and items such as changes in demographic and member data, as discussed earlier.
Also the value of non-financial assets within the general government sector increased in 2016−17 by $1.0 billion, mainly due to a $627 million increase in the value of buildings and improvements held by the Department for Education and Child Development and a $335 million increase in the value of land under roads.
Final Budget Outcome 2016–17 13
Chapter 1: 2016–17 Final Budget Outcome

Non-financial public sector
Table 1.11 sets out the key balance sheet indicators for the non-financial public sector, which is comprised of the general government sector and the public non-financial corporations sector.
Table 1.11: Non-financial public sector ― key balance sheet indicators
June 2016 Outcome
June 2017 Estimate at
2016–17 Budget
June 2017 Estimate at
2017–18 Budget
June 2017 Outcome
Net debt$m 10 912 13 770 13 837 13 529% of total revenue 59.1 71.2 71.8 69.6
Unfunded superannuation liability $m 14 029 12 178 11 217 11 448% of total revenue 76.0 62.9 58.2 58.9
Net financial liabilities$m 28 281 29 406 29 549 29 200% of total revenue 153.2 152.0 153.3 150.2
Net financial worth$m -27 355 -27 985 -28 422 -28 042% of total revenue - 148.2 - 144.6 - 147.5 - 144.2
Net worth$m 37 741 40 573 41 523 42 433% of total revenue 204.4 209.7 215.4 218.2
Net debt for the non-financial public sector at 30 June 2017 was $308 million lower than the estimate included in the 2017–18 Budget.
Between June 2016 and June 2017, non-financial public sector net debt increased by $2.6 billion to $13.5 billion. This is largely driven by increase in net debt in the general government sector with the recognition of the financial obligations for the new Royal Adelaide Hospital adding $2.8 billion, partially offset by a net operating balance surplus and returns from MAC. The public non-financial corporation component of net debt of $7.4 billion at 30 June 2017 was $900 million higher than at 30 June 2016. The increase in net debt in the public non-financial corporation predominantly relates to the acquisition of TAFE sites from the general government sector.
The negative net financial worth position of the non-financial public sector of $28.0 billion contrasts with the negative net financial worth of the general government sector of $2.0 billion. This variation largely reflects equity in the public non-financial corporations sector held by the general government sector and recognised as a financial asset of that sector. This asset is eliminated in the consolidation of the non-financial public sector.
The non-financial public sector net worth increase ($4.7 billion) in 2016−17 is driven by the revaluation of the unfunded superannuation liability and non-financial assets in the general government sector as discussed earlier.
14 Final Budget Outcome 2016–17
Chapter 1: 2016–17 Final Budget Outcome
Chapter 2: Economic performance
The international and national economic context for the year 2016–17
World economic growth in 2016 was the weakest since the global financial crisis at 3.2 per cent, but is strengthening in 2017 and is projected by the International Monetary Fund to accelerate to 3.6 per cent. As expected, growth in China slowed further in 2016 to 6.7 per cent, but is projected to rise to 6.8 per cent in 2017.
Growth in the Australian economy (as measured by Gross Domestic Product) was 2.0 per cent in 2016–17. This was lower than the 2.8 per cent growth recorded in the previous year. The slowing in growth in 2016–17 was largely attributable to Cyclone Debbie and other weather-related events. The major contributors to growth in 2016–17 were household and government consumption, public investment and exports.
Economic growth in 2016–17 was supported by the Reserve Bank of Australia (RBA) maintaining a low interest rate environment which kept borrowing costs low for businesses and households.
While the Australian dollar appreciated slightly through the course of 2016–17, against both the US dollar and on a trade-weighted basis, it remained around 30 per cent below its 2011 peak, assisting in the transition away from mining investment-led growth to broader-based sources of economic growth.
South Australian economic performance for the year 2016–17
South Australia’s economy as measured by real Gross State Product (GSP) grew by 2.2 per cent in 2016–17 to $101.8 billion.
State Final Demand (SFD), which measures total spending by households, business and governments in the South Australian economy, rose by 3.0 per cent in real terms in 2016–17, above the original 2016–17 Budget forecast of 2 per cent. This reflected growth in household and government consumption, which increased by 2.9 per cent and 2.1 per cent respectively. There was also strong growth in public investment over this period of 22 per cent in real terms (after adjusting for the net purchase of second hand assets, which largely reflects the transfer of the Royal Adelaide Hospital from the private to the public sector).
In volume terms, South Australia’s overseas exports were 0.8 per cent higher in 2016–17 than in the previous financial year. Goods exports fell by 1.0 per cent and services exports increased by 8.2 per cent.
Services exports in 2016–17 were boosted by increased international tourism and education. Assisted by the depreciation of the Australian dollar, international student enrolments were up 4.8 per cent during 2016–17. Similarly, international tourist numbers were also up in 2016–17 (3.1 per cent), with spending by international tourists up by 12 per cent over the same period.
South Australia had a bumper winter crop in 2016–17 (11.2 million tonnes), 61 per cent above the five-year average and up 83 per cent (or 5.1 million tonnes) from the 2015–16 season. The 2016–17 winter crop production estimate is the highest on record.
Final Budget Outcome 2016–17 15

The state’s labour market improved in 2016–17, with employment rising by 1.3 per cent (higher than the original 2016–17 Budget forecast of ¾ per cent). Although the participation rate increased over the period, the unemployment rate fell to 6.5 per cent in June 2017, down from 6.8 per cent a year earlier (trend estimates).
Table 2.1: Economic Parameters –– Australia and South Australia growth rates (% per annum), 2016–17
2016–17 Forecast
at 2016–17 Budget
2016–17 Forecast
at 2017–18 Budget Outcome
Australia Gross Domestic Product (real terms) 2½ 1¾ 2.0
South Australia Gross State Product (real terms) 2 2¼ 2.2 State Final Demand (real terms) 2 2¼ 3.0 Employment ¾ 1¼ 1.3 Consumer Price Index 1¾ 1½ 1.6
Source: 2016–17 and 2017–18 Commonwealth Budgets and South Australian Budgets, and the Australian Bureau of Statistics.
16 Final Budget Outcome 2016–17
Chapter 2: Econmic Performance

Appendix A: Uniform presentation framework tables
Final Budget Outcome 2016–17 17

UNIFORM PRESENTATION FRAMEWORK TABLES
Table A.1: General government sector operating statement ($million)
2016–17Estimate at
2017–18Budget
2016–17Outcome
Revenue Taxation revenue 4 421 4 431Grants 10 005 9 958Sales of goods and services 2 527 2 568Interest income 24 25Dividend and income tax equivalent income 628 645Other 664 852
Total revenue 18 269 18 480lessExpensesEmployee expenses 8 009 8 010Superannuation expenses
Superannuation interest cost 345 345Other superannuation expenses 829 767
Depreciation and amortisation 888 928Interest expenses 191 192Other property expenses — —Other operating expenses 4 562 4 771Grants 3 206 3 025
Total expenses 18 030 18 037equalsNet operating balance 239 443
plusOther economic flows 3 544 4 250equalsComprehensive result – total change in net worth 3 782 4 693
Net operating balance 239 443
lessNet acquisition of non-financial assetsPurchases of non-financial assets 4 454 4 460less Sales of non-financial assets 733 722less Depreciation 888 928plus Change in inventories — 3plus Other movements in non-financial assets — —
equals Total net acquisition of non-financial assets 2 833 2 814equalsNet lending / borrowing -2 595 -2 371
Note: Totals may not add due to rounding.
18 Final Budget Outcome 2016–17
Appendix A: Uniform presentation framework tables

Table A.2: Public non-financial corporations (public trading enterprises) sectoroperating statement ($million)
2016–17Estimate at
2017–18Budget
2016–17Outcome
Revenue Taxation revenue — —Grants 375 362Sales of goods and services 1 638 1 735Interest income 9 11Dividend and income tax equivalent income 4 4Other 170 77
Total revenue 2 196 2 189
lessExpensesEmployee expenses 201 198Superannuation expenses
Superannuation interest cost — —Other superannuation expenses 26 27
Depreciation and amortisation 440 439Interest expenses 287 285Other property expenses 193 212Other operating expenses 1 215 1 201Grants 56 50
Total expenses 2 418 2 412equalsNet operating balance -222 -224
plusOther economic flows 623 293equals
Comprehensive result – total change in net worth 401 70
Net operating balance -222 -224
lessNet acquisition of non-financial assetsPurchases of non-financial assets 1 231 1 110less Sales of non-financial assets 185 129less Depreciation 440 439plus Change in inventories 9 3plus Other movements in non-financial assets — —
equals Total net acquisition of non-financial assets 616 545equalsNet lending / borrowing -838 -769
Note: Totals may not add due to rounding.
Final Budget Outcome 2016–17 19
Appendix A: Uniform performance framework tables
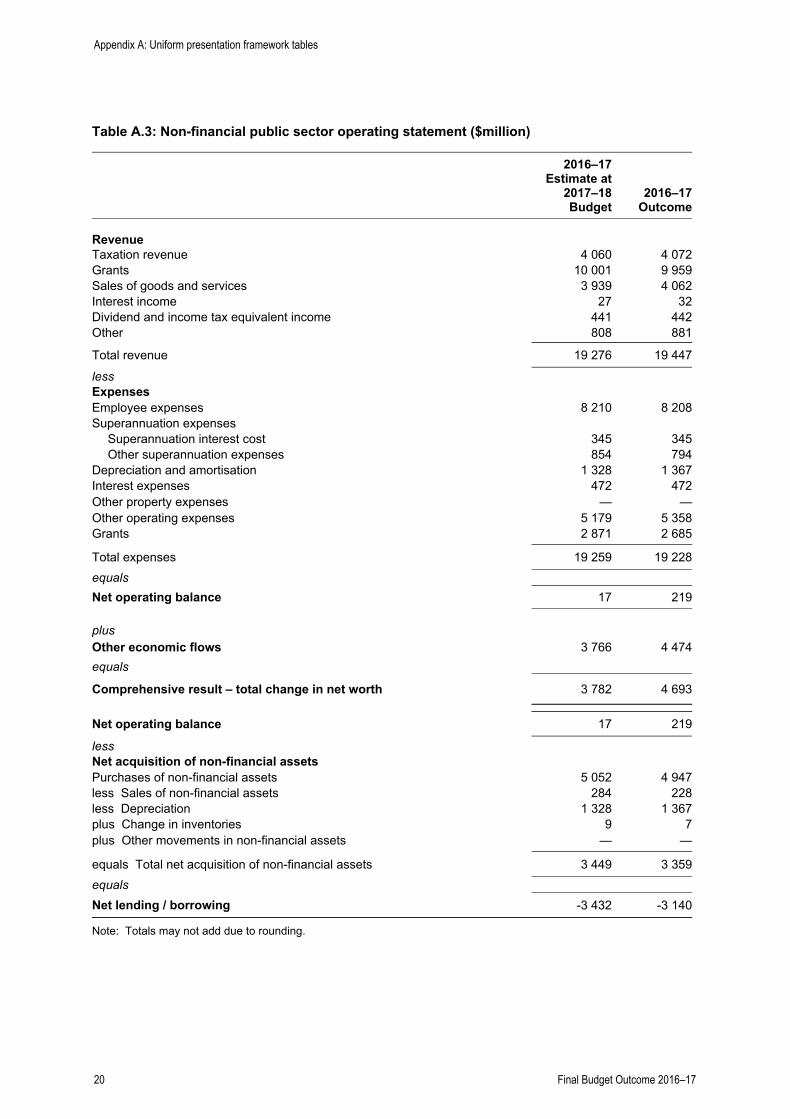
Table A.3: Non-financial public sector operating statement ($million)
2016–17Estimate at
2017–18Budget
2016–17Outcome
Revenue Taxation revenue 4 060 4 072Grants 10 001 9 959Sales of goods and services 3 939 4 062Interest income 27 32Dividend and income tax equivalent income 441 442Other 808 881
Total revenue 19 276 19 447
lessExpensesEmployee expenses 8 210 8 208Superannuation expenses
Superannuation interest cost 345 345Other superannuation expenses 854 794
Depreciation and amortisation 1 328 1 367Interest expenses 472 472Other property expenses — —Other operating expenses 5 179 5 358Grants 2 871 2 685
Total expenses 19 259 19 228equalsNet operating balance 17 219
plusOther economic flows 3 766 4 474equals
Comprehensive result – total change in net worth 3 782 4 693
Net operating balance 17 219
lessNet acquisition of non-financial assetsPurchases of non-financial assets 5 052 4 947less Sales of non-financial assets 284 228less Depreciation 1 328 1 367plus Change in inventories 9 7plus Other movements in non-financial assets — —
equals Total net acquisition of non-financial assets 3 449 3 359equalsNet lending / borrowing -3 432 -3 140
Note: Totals may not add due to rounding.
20 Final Budget Outcome 2016–17
Appendix A: Uniform presentation framework tables

Table A.4: Public financial corporations sector operating statement ($million)
2016–17Outcome
Revenue Taxation revenue —Grants 21Sales of goods and services 856Interest income 976Dividend and income tax equivalent income 50Other 212
Total revenue 2 114
lessExpensesEmployee expenses 48Superannuation expenses
Superannuation interest cost —Other superannuation expenses 4
Depreciation and amortisation 46Interest expenses 892Other property expenses 436Other operating expenses 1 148Grants —
Total expenses 2 574equalsNet operating balance -460
plusOther economic flows 692equals
Comprehensive result – total change in net worth 232
Net operating balance -460
lessNet acquisition of non-financial assetsPurchases of non-financial assets 67less Sales of non-financial assets 38less Depreciation 46plus Change in inventories —plus Other movements in non-financial assets —
equals Total net acquisition of non-financial assets -16equalsNet lending / borrowing -443
Note: Totals may not add due to rounding.
Final Budget Outcome 2016–17 21
Appendix A: Uniform performance framework tables
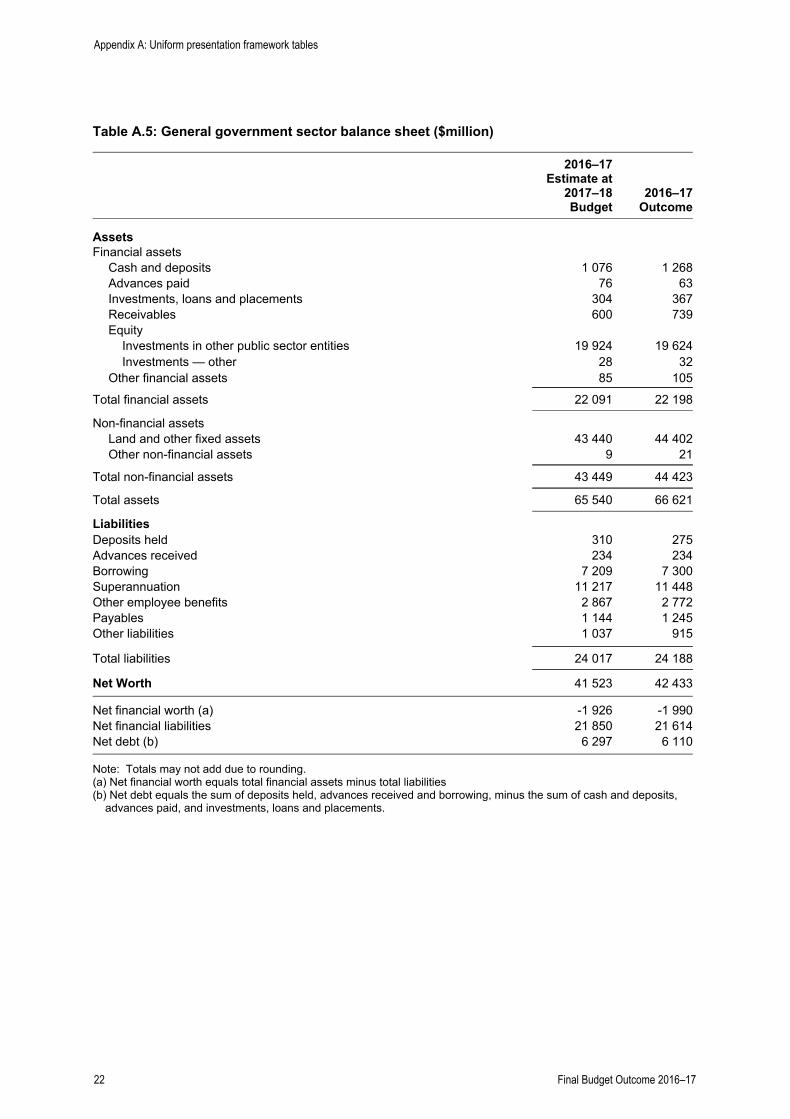
Table A.5: General government sector balance sheet ($million)
2016–17Estimate at
2017–18Budget
2016–17Outcome
AssetsFinancial assets
Cash and deposits 1 076 1 268Advances paid 76 63Investments, loans and placements 304 367Receivables 600 739Equity
Investments in other public sector entities 19 924 19 624Investments — other 28 32
Other financial assets 85 105
Total financial assets 22 091 22 198
Non-financial assetsLand and other fixed assets 43 440 44 402Other non-financial assets 9 21
Total non-financial assets 43 449 44 423
Total assets 65 540 66 621
LiabilitiesDeposits held 310 275Advances received 234 234Borrowing 7 209 7 300Superannuation 11 217 11 448Other employee benefits 2 867 2 772Payables 1 144 1 245Other liabilities 1 037 915
Total liabilities 24 017 24 188
Net Worth 41 523 42 433
Net financial worth (a) -1 926 -1 990Net financial liabilities 21 850 21 614Net debt (b) 6 297 6 110
Note: Totals may not add due to rounding.(a) Net financial worth equals total financial assets minus total liabilities(b) Net debt equals the sum of deposits held, advances received and borrowing, minus the sum of cash and deposits, advances paid, and investments, loans and placements.
22 Final Budget Outcome 2016–17
Appendix A: Uniform presentation framework tables

Table A.6: Public non-financial corporations (public trading enterprises) sectorbalance sheet ($million)
2016–17Estimate at
2017–18Budget
2016–17Outcome
AssetsFinancial assets
Cash and deposits 302 307Advances paid — —Investments, loans and placements 49 54Receivables 268 276Equity
Investments in other public sector entities — —Investments — other 14 13
Other financial assets 6 17
Total financial assets 639 668
Non-financial assetsLand and other fixed assets 26 487 26 051Other non-financial assets 12 4
Total non-financial assets 26 499 26 055
Total assets 27 138 26 724
LiabilitiesDeposits held 40 —Advances received 33 33Borrowing 7 818 7 747Superannuation — —Other employee benefits 74 71Payables 293 275Other liabilities 83 132
Total liabilities 8 341 8 258
Net Worth 18 797 18 466
Net financial worth (a) -7 702 -7 589Net financial liabilities 7 702 7 589Net debt (b) 7 540 7 418
Note: Totals may not add due to rounding.(a) Net financial worth equals total financial assets minus total liabilities(b) Net debt equals the sum of deposits held, advances received and borrowing, minus the sum of cash and deposits, advances paid, and investments, loans and placements.
Final Budget Outcome 2016–17 23
Appendix A: Uniform performance framework tables

Table A.7: Non-financial public sector balance sheet ($million)
2016–17Estimate at
2017–18Budget
2016–17Outcome
AssetsFinancial assets
Cash and deposits 1 254 1 443Advances paid 43 30Investments, loans and placements 353 421Receivables 849 975Equity
Investments in other public sector entities 1 127 1 158Investments — other 42 45
Other financial assets 90 118
Total financial assets 3 758 4 191
Non-financial assetsLand and other fixed assets 69 928 70 454Other non-financial assets 17 22
Total non-financial assets 69 945 70 476
Total assets 73 703 74 667
LiabilitiesDeposits held 226 143Advances received 234 234Borrowing 15 027 15 047Superannuation 11 217 11 448Other employee benefits 2 941 2 843Payables 1 378 1 481Other liabilities 1 158 1 038
Total liabilities 32 180 32 234
Net Worth 41 523 42 433
Net financial worth (a) -28 422 -28 042Net financial liabilities 29 549 29 200Net debt (b) 13 837 13 529
Note: Totals may not add due to rounding.(a) Net financial worth equals total financial assets minus total liabilities(b) Net debt equals the sum of deposits held, advances received and borrowing, minus the sum of cash and deposits, advances paid, and investments, loans and placements.
24 Final Budget Outcome 2016–17
Appendix A: Uniform presentation framework tables

Table A.8: Public financial corporations sector balance sheet ($million)
2016–17Outcome
AssetsFinancial assets
Cash and deposits 358Advances paid 14 408Investments, loans and placements 7 771Receivables 326Equity
Investments in other public sector entitiesInvestments — other 2 607
Other financial assets 5
Total financial assets 25 476
Non-financial assetsLand and other fixed assets 760Other non-financial assets 3
Total non-financial assets 764
Total assets 26 239
LiabilitiesDeposits held 243Advances receivedBorrowing 20 169SuperannuationOther employee benefits 21Payables 122Other liabilities 4 526
Total liabilities 25 081
Net Worth 1 158
Net financial worth (a) 395Net financial liabilities -395Net debt (b) -2 125
Note: Totals may not add due to rounding.(a) Net financial worth equals total financial assets minus total liabilities(b) Net debt equals the sum of deposits held, advances received and borrowing, minus the sum of cash and deposits, advances paid, and investments, loans and placements.
Final Budget Outcome 2016–17 25
Appendix A: Uniform performance framework tables
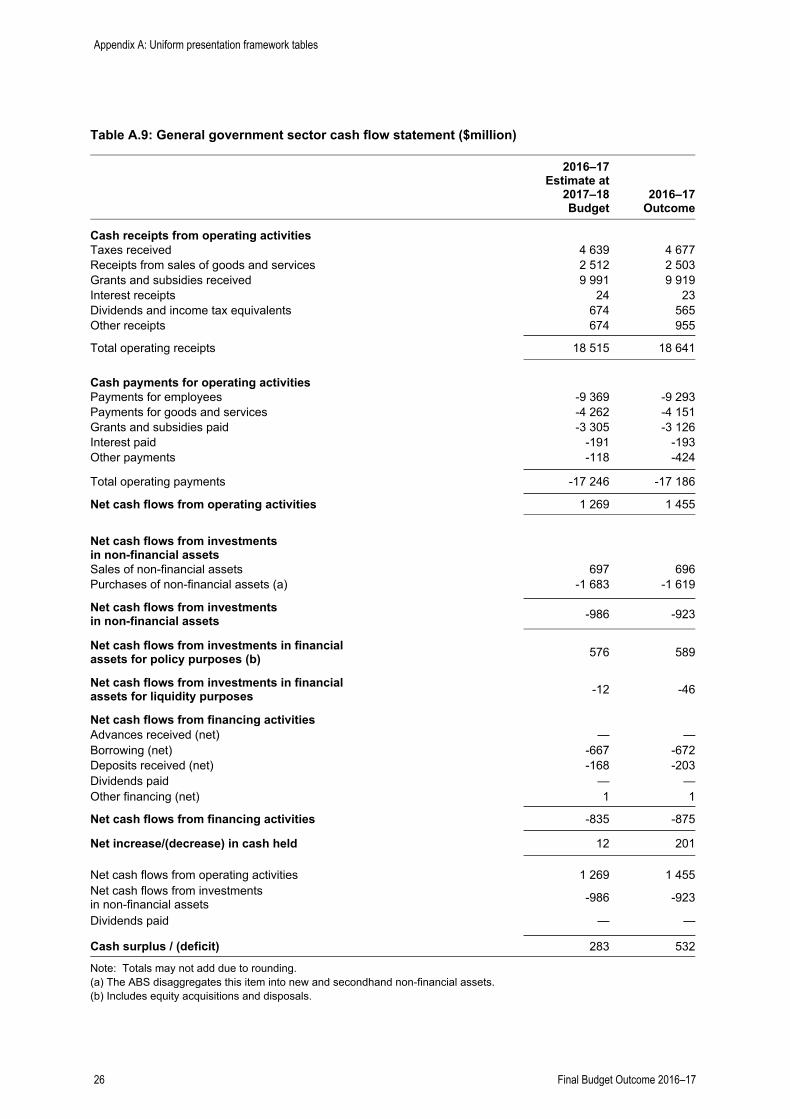
Table A.9: General government sector cash flow statement ($million)
2016–17Estimate at
2017–18Budget
2016–17Outcome
Cash receipts from operating activitiesTaxes received 4 639 4 677Receipts from sales of goods and services 2 512 2 503Grants and subsidies received 9 991 9 919Interest receipts 24 23Dividends and income tax equivalents 674 565Other receipts 674 955
Total operating receipts 18 515 18 641
Cash payments for operating activitiesPayments for employees -9 369 -9 293Payments for goods and services -4 262 -4 151Grants and subsidies paid -3 305 -3 126Interest paid -191 -193Other payments -118 -424
Total operating payments -17 246 -17 186
Net cash flows from operating activities 1 269 1 455
Net cash flows from investmentsin non-financial assetsSales of non-financial assets 697 696Purchases of non-financial assets (a) -1 683 -1 619
Net cash flows from investmentsin non-financial assets -986 -923
Net cash flows from investments in financialassets for policy purposes (b) 576 589
Net cash flows from investments in financialassets for liquidity purposes -12 -46
Net cash flows from financing activitiesAdvances received (net) — —Borrowing (net) -667 -672Deposits received (net) -168 -203Dividends paid — —Other financing (net) 1 1
Net cash flows from financing activities -835 -875
Net increase/(decrease) in cash held 12 201
Net cash flows from operating activities 1 269 1 455Net cash flows from investmentsin non-financial assets -986 -923
Dividends paid — —
Cash surplus / (deficit) 283 532
Note: Totals may not add due to rounding.(a) The ABS disaggregates this item into new and secondhand non-financial assets.(b) Includes equity acquisitions and disposals.
26 Final Budget Outcome 2016–17
Appendix A: Uniform presentation framework tables

Table A.10: Public non-financial corporations (public trading enterprises) sector cash flow statement ($million)
2016–17Estimate at
2017–18Budget
2016–17Outcome
Cash receipts from operating activitiesTaxes received — —Receipts from sales of goods and services 1 592 1 693Grants and subsidies received 375 357Interest receipts 9 11Dividends and income tax equivalents 4 5Other receipts 154 40
Total operating receipts 2 134 2 105
Cash payments for operating activitiesPayments for employees -238 -240Payments for goods and services -808 -763Grants and subsidies paid -56 -32Interest paid -288 -260Other payments -636 -682
Total operating payments -2 027 -1 977
Net cash flows from operating activities 108 128
Net cash flows from investmentsin non-financial assetsSales of non-financial assets 185 116Purchases of non-financial assets (a) -1 190 -1 071
Net cash flows from investmentsin non-financial assets -1 005 -954
Net cash flows from investments in financialassets for policy purposes (b) — 1
Net cash flows from investments in financialassets for liquidity purposes — —
Net cash flows from financing activitiesAdvances received (net) 55 52Borrowing (net) 617 545Deposits received (net) — -39Dividends paid -134 -132Other financing (net) — —
Net cash flows from financing activities 538 426
Net increase/(decrease) in cash held -359 -400
Net cash flows from operating activities 108 128Net cash flows from investmentsin non-financial assets -1 005 -954
Dividends paid -134 -132
Cash surplus / (deficit) -1 031 -958
Note: Totals may not add due to rounding.(a) The ABS disaggregates this item into new and secondhand non-financial assets.(b) Includes equity acquisitions and disposals.
Final Budget Outcome 2016–17 27
Appendix A: Uniform performance framework tables

Table A.11: Non-financial public sector cash flow statement ($million)
2016–17Estimate at
2017–18Budget
2016–17Outcome
Cash receipts from operating activitiesTaxes received 4 131 4 138Receipts from sales of goods and services 3 898 3 986Grants and subsidies received 9 987 9 919Interest receipts 27 29Dividends and income tax equivalents 438 353Other receipts 793 949
Total operating receipts 19 275 19 375
Cash payments for operating activitiesPayments for employees -9 595 -9 521Payments for goods and services -4 873 -4 722Grants and subsidies paid -2 982 -2 801Interest paid -473 -448Other payments -110 -431
Total operating payments -18 032 -17 924
Net cash flows from operating activities 1 243 1 451
Net cash flows from investmentsin non-financial assetsSales of non-financial assets 261 218Purchases of non-financial assets (a) -2 252 -2 095
Net cash flows from investmentsin non-financial assets -1 991 -1 877
Net cash flows from investments in financialassets for policy purposes (b) 630 641
Net cash flows from investments in financialassets for liquidity purposes -12 -46
Net cash flows from financing activitiesAdvances received (net) — —Borrowing (net) -51 -127Deposits received (net) — -83Dividends paid — —Other financing (net) 1 1
Net cash flows from financing activities -50 -210
Net increase/(decrease) in cash held -179 -41
Net cash flows from operating activities 1 243 1 451Net cash flows from investmentsin non-financial assets -1 991 -1 877
Dividends paid — —
Cash surplus / (deficit) -748 -426
Note: Totals may not add due to rounding.(a) The ABS disaggregates this item into new and secondhand non-financial assets.(b) Includes equity acquisitions and disposals.
28 Final Budget Outcome 2016–17
Appendix A: Uniform presentation framework tables

Table A.12: Public financial corporations sector cash flow statement ($million)
2016–17Outcome
Cash receipts from operating activitiesTaxes received —Receipts from sales of goods and services 808Grants and subsidies received 21Interest receipts 967Dividends and income tax equivalents 44Other receipts 42
Total operating receipts 1 881
Cash payments for operating activitiesPayments for employees -59Payments for goods and services -121Grants and subsidies paid —Interest paid -892Other payments -929
Total operating payments -2 001
Net cash flows from operating activities -120
Net cash flows from investmentsin non-financial assetsSales of non-financial assets 38Purchases of non-financial assets (a) -67
Net cash flows from investmentsin non-financial assets -29
Net cash flows from investments in financialassets for policy purposes (b) 157
Net cash flows from investments in financialassets for liquidity purposes -2 082
Net cash flows from financing activitiesAdvances received (net) —Borrowing (net) 2 915Deposits received (net) -225Dividends paid -718Other financing (net) —
Net cash flows from financing activities 1 972
Net increase/(decrease) in cash held -102
Net cash flows from operating activities -120Net cash flows from investmentsin non-financial assets -29
Dividends paid -328
Cash surplus / (deficit) -477
Note: Totals may not add due to rounding.(a) The ABS disaggregates this item into new and secondhand non-financial assets.(b) Includes equity acquisitions and disposals.
Final Budget Outcome 2016–17 29
Appendix A: Uniform performance framework tables
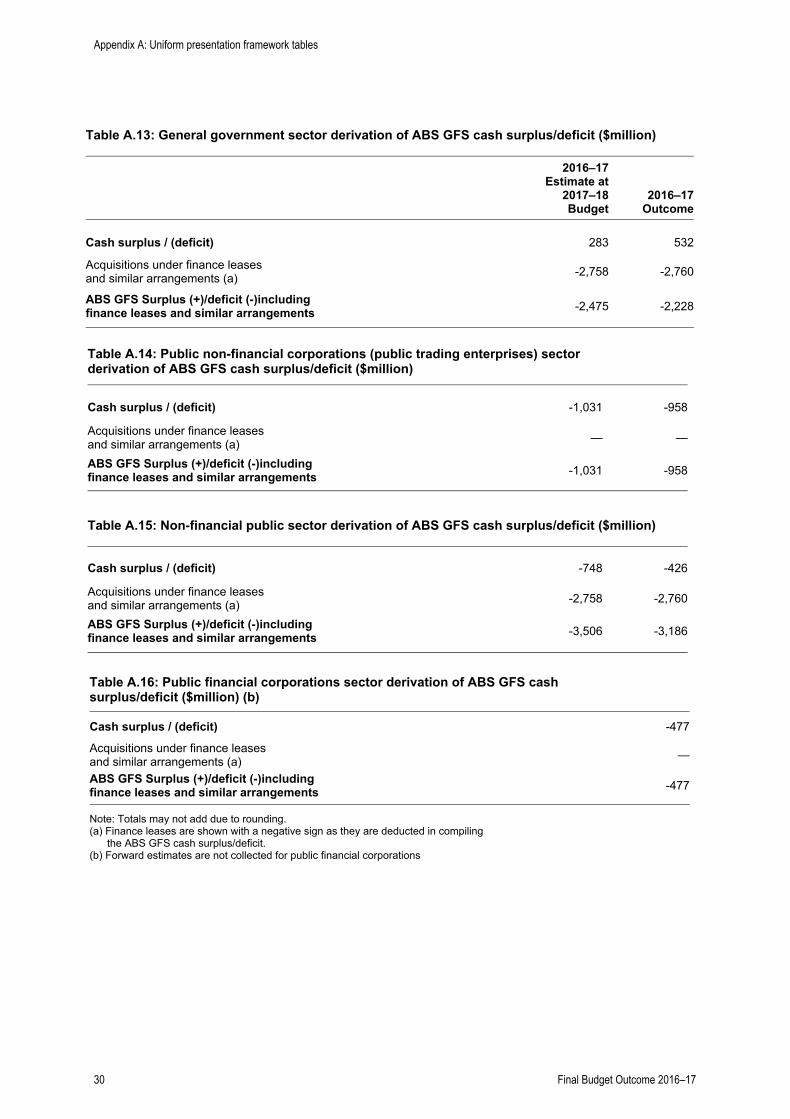
Table A.13: General government sector derivation of ABS GFS cash surplus/deficit ($million)
2016–17Estimate at
2017–18Budget
2016–17Outcome
Cash surplus / (deficit) 283 532
Acquisitions under finance leasesand similar arrangements (a) -2,758 -2,760
ABS GFS Surplus (+)/deficit (-)including finance leases and similar arrangements -2,475 -2,228
Table A.14: Public non-financial corporations (public trading enterprises) sectorderivation of ABS GFS cash surplus/deficit ($million)
Cash surplus / (deficit) -1,031 -958
Acquisitions under finance leasesand similar arrangements (a) — —
ABS GFS Surplus (+)/deficit (-)including finance leases and similar arrangements -1,031 -958
Table A.15: Non-financial public sector derivation of ABS GFS cash surplus/deficit ($million)
Cash surplus / (deficit) -748 -426
Acquisitions under finance leasesand similar arrangements (a) -2,758 -2,760
ABS GFS Surplus (+)/deficit (-)including finance leases and similar arrangements -3,506 -3,186
Table A.16: Public financial corporations sector derivation of ABS GFS cashsurplus/deficit ($million) (b)
Cash surplus / (deficit) -477
Acquisitions under finance leasesand similar arrangements (a) —
ABS GFS Surplus (+)/deficit (-)including finance leases and similar arrangements -477
Note: Totals may not add due to rounding.(a) Finance leases are shown with a negative sign as they are deducted in compiling the ABS GFS cash surplus/deficit.(b) Forward estimates are not collected for public financial corporations
30 Final Budget Outcome 2016–17
Appendix A: Uniform presentation framework tables

Table A.17: General government sector taxes ($million) (a)
2016–17Estimate at
2017–18Budget
2016–17Outcome
Taxes on employers' payroll and labour force 1 129 1 137
Taxes on propertyLand taxes 579 573Stamp duties on financial and capital transactions 986 981Financial institutions' transaction taxes — —Other 286 283
Total 1 851 1 837
Taxes on the provision of goods and servicesExcises and levies — —Taxes on gambling 363 359Taxes on insurance 455 465
Total 819 824
Taxes on use of goods and performance of activitiesMotor vehicle taxes 622 633
Total 622 633
Total GFS taxation revenue 4 421 4 431
Note: Totals may not add due to rounding.(a) Excludes taxes paid by general government entities.
Final Budget Outcome 2016–17 31
Appendix A: Uniform performance framework tables

Table A.18(a): General government sector grant revenue ($million)
2016–17Estimate at
2017–18Budget
2016–17Outcome
Current grant revenueCurrent grants from the Commonwealth
General purpose grants 5 934 5 979National partnership grants 303 288National partnership grants for on-passing 243 243Specific purpose grants 1 937 1 893Specific purpose grants for on-passing 830 829
Total current grants from the Commonwealth 9 247 9 232
Other contributions and grants 130 111
Total current grant revenue 9 377 9 344
Capital grant revenueCapital grants from the Commonwealth
General purpose grants — —National partnership grants 514 508Specific purpose grants 95 95Specific purpose grants for on-passing — —Other capital grants 13 13
Total capital grants from the Commonwealth 621 615
Other contributions and grants 7 —
Total capital grant revenue 628 615
Total grant revenue 10 005 9 958
Table A.18(b): General government sector grant expense ($million)
2016–17Estimate at
2017–18Budget
2016–17Outcome
Current grant expenseState/territory government 3 13Local government 60 50Local government on-passing 234 235Private and not-for-profit sector 1 368 1 268Private and not-for-profit sector on-passing 837 837Grants to other sectors of government 391 377Other 213 163
Total current grant expense 3 108 2 942
Capital grant expenseState/territory government — —Local government 25 18Local government on-passing — —Private and not-for-profit sector 74 64Private and not-for-profit sector on-passing — —Grants to other sectors of government — —Other — —
Total capital grant expense 98 83
Total grant expense 3 206 3 025Note: Totals may not add due to rounding.
32 Final Budget Outcome 2016–17
Appendix A: Uniform presentation framework tables

Table A.19: General government sector dividend and tax equivalent income ($million)
2016–17Estimate at
2017–18Budget
2016–17Outcome
Dividend and Income tax equivalent income from PNFC sector 190 207Dividend and Income tax equivalent income from PFC sector 436 436Other dividend income 1 2
Total dividend and income tax equivalent income 628 645
Note: Totals may not add due to rounding.
Final Budget Outcome 2016–17 33
Appendix A: Uniform performance framework tables

Table A.20: General government sector expenses by function ($million)(a)(b) 2016–17
Estimate at 2017–18 Budget
2016–17 Outcome
General public services 396 344Government superannuation benefits — —Other general public services 396 344
Defence(c) — —
Public order and safety 1 738 1 807Police and fire protection services 982 1 044Law courts and legal services 334 322Prisons and corrective services 334 352Other public order and safety 88 89
Education 4 356 4 505Primary and secondary education 3 523 3 738Tertiary education 556 482Pre-school education and education not definable by level 245 217Transportation of students 27 65Education n.e.c.(d) 5 4
Health 5 597 5 623Acute care institutions 4 750 4 825Mental health institutions n.a. n.a.Nursing homes for the aged n.a. n.a.Community health services 457 447Public health services 149 144Pharmaceuticals, medical aids and appliances 72 48Health research 20 5Health administration n.e.c.(d) 149 153
Social security and welfare 1 538 1 711Social security 110 117Welfare services 1 407 1 570Social security and welfare services n.e.c.(d) 20 24
Housing and community amenities 1 242 952Housing and community development 463 463Water supply 234 152Sanitation and protection of the environment 540 337Other community amenities 4 —
Recreation and culture 426 432Recreation facilities and services 183 198Cultural facilities and services 220 221Broadcasting and film production 7 8Recreation and culture n.e.c.(d) 15 5
34 Final Budget Outcome 2016–17
Appendix A: Uniform presentation framework tables

Table A.20: General government sector expenses by function ($million) (a)(b) (continued) 2016−17
Estimate at 2017−18 Budget
2016−17 Outcome
Fuel and energy 120 76Fuel affairs and services 40 40Electricity and other energy 55 1Fuel and energy n.e.c.(d) 26 36
Agriculture, forestry, fishing and hunting 230 169Agriculture 165 139Forestry, fishing and hunting 65 30
Mining and mineral resources other than fuels; manufacturing; 77 72and constructionMining and mineral resources other than fuels 48 41Manufacturing — —Construction 29 31
Transport and communications 1 329 1 295Road transport 638 662Water transport 16 33Rail transport 41 59Air transport 11 2Pipelines n.a. n.a.Other transport 522 526Communications 102 13
Other economic affairs 399 311Storage, saleyards and markets n.a. n.a.Tourism and area promotion 125 121Labour and employment affairs 50 45Other economic affairs 224 145
Other purposes 582 739Public debt transactions 191 192General purpose inter-government transactions 21 169Natural disaster relief 19 4Nominal superannuation interest expense 345 345Other purposes n.e.c.(d) 5 29Total GFS expenses 18 030 18 037
Note: Totals may not add due to rounding.
(a) Expenses by function data are derived from information submitted by government agencies. The processes for derivingthis data are subject to ongoing refinements. Consequently the data may be subject to future revisions.
(b) Some functional classifications are not readily distinguisable at agency level. Those instances are denoted as notavailable (n.a.).
(c) The ABS defines ‘defence’ as expenditure on military and civil defence affairs, foreign military aid and defence research.The expenditure of DefenceSA is included in other economic affairs.
(d) Not elsewhere classified.
Final Budget Outcome 2016–17 35
Appendix A: Uniform performance framework tables

Table A.21: General government sector capital expenditure by function ($million)(a)
2016–17 Estimate at
2017–18 Budget
2016–17 Outcome
General public services 26 22Defence(b) — —Public order and safety 151 116Education 73 74Health 3 146 3 110Social security and welfare 4 5Housing and community amenities 38 55Recreation and culture 48 57Fuel and energy 3 2Agriculture, forestry, fishing and hunting 10 12Mining and mineral resources other than fuels; manufacturing; and construction
1 1
Transport and communications 941 995Other economic affairs 13 11Other purposes — —Total capital expenditure 4 454 4 460
Note: Totals may not add due to rounding.
(a) Expenses by function data are derived from information submitted by government agencies. The processes for deriving this data are subject to ongoing refinements. Consequently the data may be subject to future revisions.
(b) The ABS defines ‘defence’ as expenditure on military and civil defence affairs, foreign military aid and defence research. The expenditure of DefenceSA is included in other economic affairs.
36 Final Budget Outcome 2016–17
Appendix A: Uniform presentation framework tables

Loan Council allocation report
The Australian Loan Council — a ministerial body established in 1927 comprising Commonwealth, state and territory Treasurers — requires all jurisdictions to nominate a Loan Council Allocation (LCA) for consideration at its annual meeting.
LCA nominations, usually prepared in February each year, are intended to provide an indication of each government’s probable call on financial markets over the forthcoming financial year. The Loan Council, having regard to each jurisdiction’s fiscal position and reasonable infrastructure requirements, along with the macroeconomic implications of the aggregate figure, then considers the nominations.
Following the endorsement of LCA nominations, jurisdictions are further required to update their nominated LCAs at budget time for changes in economic parameters and policy decisions, and also provide an LCA outcome at the end of the financial year. A tolerance limit of 2 per cent of total public sector revenue, set at nomination time, applies between both the nomination and budget, and the budget and outcome LCAs.
Nominated LCAs for 2016–17, for all jurisdictions and in aggregate, were reviewed and endorsed by the Australian Loan Council in April 2016.
South Australia’s Budget and outcome LCAs for 2016–17 are shown in Table B.1. This table is prepared in accordance with the requirements of the accrual UPF, endorsed by the Loan Council in March 2000 and revised in April 2008 to recognise acquisitions under finance leases and similar arrangements.
As Table B.1 indicates, South Australia recorded an LCA deficit of $2 billion for 2016–17. This is $532 million lower than the $2.5 billion deficit estimated in the 2016–17 Budget (June 2016), mainly reflecting higher than expected general government cash surplus and earnings on superannuation assets. This was partially offset by a higher than expected public non-financial corporation cash deficit.
As a result of these movements, South Australia’s 2016–17 LCA outcome will exceed the 2 per cent of total revenue tolerance limit included in the LCA nomination for that year.
Final Budget Outcome 2016–17 37
Appendix A: Uniform performance framework tables

Table A.22 Loan Council Allocation 2016–17 ($million)(a)
2016–17 Estimate
at 2016–17 Budget
2016–17 Outcome
General government sector cash deficit/surplus - 290 - 532
PNFC sector cash deficit/surplus 843 958
Non-financial public sector cash deficit/surplus(b) 553 426
Acquisitions under finance leases and similar arrangements 2 820 2 760
ABS Government Finance Statistics cash surplus 3 373 3 186
Less: Net cash flows from investments in financial assets for policy purposes
502 641
Adjusted total non-financial public sector deficit/surplus 2 871 2 545
Memorandum items(c)
Operating leases(d) - 110 40 Recourse asset sales — — Superannuation(e) - 267 - 622 Local government 29 27 Home finance schemes 15 17
Total memorandum items - 332 - 538
LCA deficit/surplus(f)(g) 2 539 2 007
Note: Totals may not add due to rounding. (a) For the purposes of this table a surplus amount is represented as a negative number while a deficit is shown as a positive
number. (b) The sum of the deficits of the general government and PNFC sectors may not equal the non-financial public sector deficit
due to intersectoral transfers, which are netted out in the calculation of the total figure. The figures exclude statutory marketing authorities.
(c) Excludes universities. (d) Increase/decrease in the net present value (NPV) of operating leases with a NPV of $5 million or greater. (e) Includes both ‘payments in excess of emerging costs of superannuation’ and ‘interest earnings on employer balances’. (f) The 2 per cent of total revenue tolerance limit for South Australia’s 2016–17 LCA nomination was $386 million. (g) South Australia did not have any proposed infrastructure projects with private sector involvement that meets the
recognition criteria for 2016–17.
38 Final Budget Outcome 2016–17
Appendix A: Uniform presentation framework tables

Appendix B: Consolidated Account
Table B.1: Summary of receipts and payments ($000)2016–17Budget
2016–17Outcome
ReceiptsTaxation 3 918 396 4 034 833Commonwealth general purpose grants 6 100 500 5 920 240Commonwealth specific purpose grants 304 349 303 525Commonwealth National Partnership payments 58 661 11 785Contributions from state undertakings 249 911 269 512Fees and charges 545 137 502 697Recoveries 709 881 871 543Royalties 251 538 214 104Other receipts 152 566 200 433Total receipts 12 290 939 12 328 672
PaymentsAppropriation Act 13 163 633 12 838 915Specific appropriation authorised in various Acts 106 359 107 323Total payments 13 269 992 12 946 238
Consolidated Account Financing Requirement(+)/surplus(-) 979 053 617 566
Note: Totals may not add due to rounding.
The deficit for 2016−17 has been funded by borrowings from the South Australian Government Financing Authority (SAFA), pursuant to section 16(2) of the Public Finance and Audit Act 1987, increasing the level of debt serviced from the Consolidated Account.
Final Budget Outcome 2016–17 39

Table B.2: Receipts ($000)
2016–17Budget
2016–17Outcome
Taxation Payroll tax 1 391 964 1 380 410Commonwealth places mirror payroll tax(a) 24 400 24 149Stamp duties 1 519 517 1 500 699Commonwealth places mirror stamp duties(a) 267 768Land tax 590 999 769 320Commonwealth places mirror land tax(a) 1 400 1 247Other taxes on property — 40Gaming machines tax 288 230 265 597Contribution from SA Lotteries 79 522 73 376Contribution from casino operations 18 800 15 865Contribution from South Australian Totalizator Agency Board 700 799Contribution from on-course totalizators, bookmakers and small lotteries 2 597 2 564Total taxation receipts 3 918 396 4 034 833
Commonwealth general purpose paymentsGST revenue grants 6 100 500 5 920 240Total Commonwealth general purpose payments 6 100 500 5 920 240
Commonwealth specific purpose payments(b)
Council of Australian Governments funding arrangements 304 349 303 525Natural disaster relief and recovery arrangements — — Total Commonwealth specific purpose payments 304 349 303 525
Commonwealth National Partnership payments(c)
Council of Australian Governments funding arrangements 58 661 11 785Total Commonwealth National Partnership payments 58 661 11 785
Note: Totals may not add due to rounding.
(a) Taxes akin to state taxes are levied on activities conducted on Commonwealth places under the authority of Commonwealth mirror tax legislation. Revenue is retained by the state.
(b) Refers only to those Commonwealth specific purpose payments paid to the Consolidated Account.
(c) Refers only to National Partnership payments that are paid to Consolidated Account. The remainder of National Partnership payments are paid into the Intergovernmental Agreement on Federal Financial Relations special deposit account for subsequent disbursement to the relevant line agencies.
40 Final Budget Outcome 2016–17
Appendix B: Consolidated Account

Table B.2: Receipts ($000) (continued)
2016–17Budget
2016–17Outcome
Contributions from state undertakingsAdelaide Cemeteries Authority Income tax equivalent — 61Adelaide Venue Management Corporation Dividend 1 600 1 600Arrangements with private electricity entities Local government rate equivalent 243 238Department of Planning, Transport and Infrastructure Income tax equivalent 2 614 588 Local government rate equivalent 1 016 696Flinders Ports Payment of lieu of other taxes 2 561 — ForestrySA Dividend — 3 571Funds SA Local government rate equivalent 227 243Generation Lessor Corporation Dividend — 2 900HomeStart Finance Dividend 6 801 7 115 Income tax equivalent 4 858 5 162Public Trustee Office Dividend 475 59 Income tax equivalent 296 — Renewal SA Dividend 2 650 2 059 Local government rate equivalent 1 078 236SA Water Corporation Dividend 121 758 121 829 Income tax equivalent 75 582 83 494 Local government rate equivalent 1 575 1 726Scope Global Pty Ltd (formerly Austraining Pty Ltd) Income tax equivalent 600 327South Australian Government Employee Residential Properties Dividend 1 706 — Income tax equivalent 465 799South Australian Government Financing Authority Dividend 13 093 23 050 Income tax equivalent 10 711 13 753West Beach Trust
Income tax equivalent 2 7Total contributions from state undertakings 249 911 269 512
Note: Totals may not add due to rounding.
Final Budget Outcome 2016–17 41
Appendix B: Consolidated Account
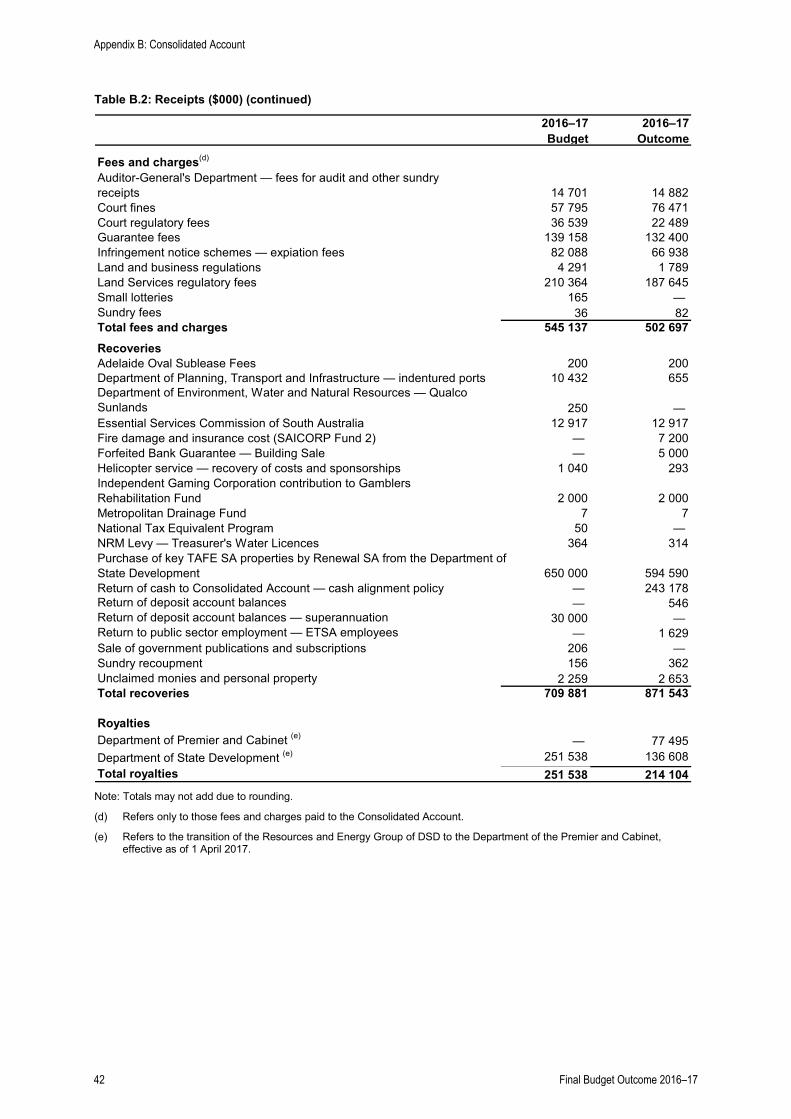
Table B.2: Receipts ($000) (continued)
2016–17Budget
2016–17Outcome
Fees and charges(d)
Auditor-General's Department — fees for audit and other sundry receipts 14 701 14 882Court fines 57 795 76 471Court regulatory fees 36 539 22 489Guarantee fees 139 158 132 400Infringement notice schemes — expiation fees 82 088 66 938Land and business regulations 4 291 1 789Land Services regulatory fees 210 364 187 645Small lotteries 165 — Sundry fees 36 82Total fees and charges 545 137 502 697RecoveriesAdelaide Oval Sublease Fees 200 200Department of Planning, Transport and Infrastructure — indentured ports 10 432 655Department of Environment, Water and Natural Resources — Qualco Sunlands 250 — Essential Services Commission of South Australia 12 917 12 917Fire damage and insurance cost (SAICORP Fund 2) — 7 200Forfeited Bank Guarantee — Building Sale — 5 000Helicopter service — recovery of costs and sponsorships 1 040 293Independent Gaming Corporation contribution to GamblersRehabilitation Fund 2 000 2 000Metropolitan Drainage Fund 7 7National Tax Equivalent Program 50 — NRM Levy — Treasurer's Water Licences 364 314Purchase of key TAFE SA properties by Renewal SA from the Department of State Development 650 000 594 590Return of cash to Consolidated Account — cash alignment policy — 243 178Return of deposit account balances — 546Return of deposit account balances — superannuation 30 000 — Return to public sector employment — ETSA employees — 1 629Sale of government publications and subscriptions 206 — Sundry recoupment 156 362Unclaimed monies and personal property 2 259 2 653Total recoveries 709 881 871 543
RoyaltiesDepartment of Premier and Cabinet (e) — 77 495Department of State Development (e) 251 538 136 608Total royalties 251 538 214 104
Note: Totals may not add due to rounding.
(d) Refers only to those fees and charges paid to the Consolidated Account.
(e) Refers to the transition of the Resources and Energy Group of DSD to the Department of the Premier and Cabinet, effective as of 1 April 2017.
42 Final Budget Outcome 2016–17
Appendix B: Consolidated Account

Table B.2: Receipts ($000) (continued)
2016–17Budget
2016–17Outcome
Other receipts
InterestInterest on investments 101 742 77 533Interest recoveries from general government entities 1 767 972Interest recoveries from the private sector 177 174
Repayment of advancesAdministered items for the Department of Planning, Transport and Infrastructure 209 302Department for Health and Ageing 3 157 3 033Department of Primary Industries and Regions 3 000 16 207Renmark Irrigation Trust 79 154Royal Zoological Society of South Australia 251 251
Repayment of equitySouth Australian Water Corporation — 71 208
OtherOther recoveries 3 359 1 452Sale of land and buildings 38 825 29 148Total other receipts 152 566 200 433
Total Consolidated Account receipts 12 290 939 12 328 672
Note: Totals may not add due to rounding.
Final Budget Outcome 2016–17 43
Appendix B: Consolidated Account

Table B.3: Payments ($000)
2016–17Budget
2016–17Outcome
Payments from Appropriation Act
Attorney-General’s Department 118 141 117 390Administered items for the Attorney-General’s Department 101 555 78 803Auditor-General’s Department 16 966 16 966Courts Administration Authority 93 592 85 533Defence SA 17 158 20 808Department for Child Protection — 326 592Department for Communities and Social Inclusion 1 090 488 1 125 583Administered items for the Department for Communities and Social Inclusion 195 310 190 688Department for Correctional Services 358 031 379 541Department for Education and Child Development 2 778 732 2 524 087 Development 252 286 250 638Department for Health and Ageing 3 711 780 3 392 296Department of Environment, Water and Natural Resources 144 698 144 698Administered items for the Department of Environment, Water and Natural Resources 19 193 18 706Department of Planning, Transport and Infrastructure 806 024 808 954Administered items for the Department of Planning, Transport and Infrastructure 9 719 8 670Department of Primary Industries and Regions 127 885 140 563Administered items for the Department of Primary Industries and Regions 3 989 3 989Department of the Premier and Cabinet 78 456 146 039Administered items for the Department of the Premier and Cabinet 1 930 1 930Department of State Development 672 950 614 193Administered items for the Department of State Development 10 448 8 446Department of Treasury and Finance 56 903 60 827Administered items for the Department of Treasury and Finance 1 582 470 1 453 363Electoral Commission of South Australia 5 228 4 442Administered items for Electoral Commission of South Australia 93 91House of Assembly 7 321 4 923Independent Gambling Authority 1 809 1 809Joint Parliamentary Services 12 070 11 309Administered Items for Joint Parliamentary Services 2 586 2 585Legislative Council 5 504 4 308Minister for Tourism 4 916 4 916Nuclear Fuel Cycle Royal Commission Engagement and Response Agency — 7 280South Australia Mental Health Commission — 2 547South Australia Police 790 854 790 854Administered items for South Australia Police 189 189South Australian Tourism Commission 80 371 80 371State Governor’s Establishment 3 988 3 988Total payments appropriated for administrative units, statutory authorities and ministers 13 163 633 12 838 915Payments for which specific appropriation is authorised in various Acts 106 359 107 323Total Consolidated Account payments 13 269 992 12 946 238
Note: Totals may not add due to rounding.
44 Final Budget Outcome 2016–17
Appendix B: Consolidated Account

Table B.4: Appropriation authorised in various Acts ($000)
2016–17Budget
2016–17Outcome
Payments for which specific appropriation is authorised in various Acts
Salaries and allowancesAgent-General — pursuant to Agent-General Act 1901 111 138Auditor-General — pursuant to Public Finance and Audit Act 1987 320 317Commissioners of Environment, Resourceand Development Court— pursuant to Remuneration Act 1990 1 264 1 141Commissioner of Police — pursuant to Police Act 1998 456 387State Coroner and Deputy Coroner — pursuant to Remuneration Act 1990 895 861Electoral Commissioner and Deputy Electoral Commissioner —pursuant to Electoral Act 1985 399 295Electoral District Boundaries Commission — pursuant to Constitution Act 1934
280 170
Governor — pursuant to Constitution Act 1934 347 331Health and Community Services Complaints Commissioner —pursuant to Remuneration Act 1990 126 105Judges — pursuant to Remuneration Act 1990
Chief Justice 717 699Judges and Masters 21 936 22 191
Magistrates — pursuant to Remuneration Act 1990 15 725 14 644Members of various standing committees — pursuant toParliamentary Remuneration Act 1990 and Parliamentary Committees Act 1991 248 188Ombudsman — pursuant to Ombudsman Act 1972 399 375Parliamentary salaries and electorate other allowances —pursuant to Parliamentary Remuneration Act 1990
Ministers, Officers and Members of Parliament 18 266 17 888Senior Judge and judges of the Industrial Relations Courtand Commission — pursuant to Remuneration Act 1990 1 948 1 774Solicitor-General — pursuant to Solicitor-General Act 1972 652 323South Australian Civil and Administrative Tribunal —pursuant to Remuneration Act 1990 586 527Valuer-General — pursuant to Valuation of Land Act 1971 139 200Total salaries and allowances 64 814 62 555
OtherCompensation for injuries resulting from criminalacts — pursuant to Victims of Crime Act 2001 8 428 8 428First Home Owner Grant — pursuant to First Home and Housing ConstructionGrants Act 2000 (formerly First Home Owner Grant Act 2000) 33 117 36 340Total other 41 545 44 768
Total payments for which specific appropriation is authorised invarious Acts 106 359 107 323
Note: Totals may not add due to rounding.
Final Budget Outcome 2016–17 45
Appendix B: Consolidated Account

Appendix C: General government and non-financial public sector financial statistics time series
The following tables provide historical data on key fiscal aggregates. Data provided (excluding the unfunded superannuation liability) are sourced for 1998−99 from Australian Bureau of Statistics Government Finance Statistics 2007−08 (catalogue number 5512.0) and 1999−2000 to 2015−16 from Budget Outcome publications for South Australia.
Data is provided from 1998−99, the first year for which information is available in the accrual format. Before 1998−99, government finances were measured using a cash-based methodology.
Gross State Product (GSP) and Consumer Price Index (for real-growth calculations) data is sourced from the latest Australian Bureau of Statistics (ABS) publications.
As historical data in this time series has not been back-cast to reflect classification and accounting changes, care must be taken in interpreting the data.
General government
Table C.1: General government sector key operating statement aggregates
Net operating
balance
Net acquisition
of non-financial
assetsNet
lending
$m% real
growth%
GSP $m% real growth
% GSP $m $m $m
1998–99 7 290 16.5 7 505 17.0 - 215 19 - 2331999–2000 7 644 2.3 16.4 7 974 3.6 17.1 - 330 140 - 4712000–01 8 108 3.0 16.3 8 406 2.4 16.9 - 297 102 - 3992001–02 8 538 2.1 15.9 8 713 0.5 16.3 - 174 - 50 - 1242002–03 9 346 5.2 16.5 8 898 -1.8 15.7 448 34 4142003–04 9 955 3.4 16.7 9 570 4.4 16.0 385 - 38 4242004–05 10 592 3.9 17.1 10 368 5.8 16.7 224 105 1192005–06 11 242 2.9 17.1 11 040 3.3 16.8 202 119 832006–07 11 757 1.9 16.6 11 547 1.9 16.3 209 139 712007–08 12 879 6.1 16.8 12 414 4.1 16.2 464 242 2222008–09 13 531 1.9 16.8 13 764 7.5 17.1 - 233 639 - 8722009–10(a) 15 534 12.3 18.3 15 347 9.1 18.1 187 1 279 -1 0922010–11(a) 15 017 -6.3 16.6 15 069 -4.9 16.6 - 53 1 370 -1 4222011–12 15 905 3.2 17.1 16 164 4.5 17.4 - 258 839 -1 0982012–13 15 333 -5.5 16.1 16 282 -1.3 17.1 - 948 55 -1 0032013–14(b) 15 343 -2.4 15.7 16 415 -1.7 16.8 -1 071 661 -1 7332014–15 16 549 6.2 16.7 16 738 0.4 16.9 - 189 - 78 - 1112015–16 17 362 4.0 17.4 17 062 1.1 17.1 300 204 962016–17 18 480 4.8 17.9 18 037 4.1 17.5 443 2 814 -2 371
Revenue Expenses
Note: Table may not add due to rounding.
(a) In 2009–10 and 2010−11 revenue, expenses and net acquisition of non-financial assets are impacted by the Commonwealth Government’s Nation Building ― Economic Stimulus Plan.
46 Final Budget Outcome 2016–17

(b) There is a structural break in 2013–14 in the presentation of interest income and interest expense. Interest income earned on cash and deposits is offset with interest expense on the borrowings the Treasurer has with the South Australian Government Financing Authority (SAFA). This results in a reduction to interest income and interest expense accordingly.
Table C.2: General government sector key balance sheet aggregates ($million) (b) Unfunded Net financial Net financial Net
% of % of superannuation liabilities worth worthAs at 30 June $m revenue GSP $m $m $m $m1989 6941990 8541991 1 8171992 4 6101993 7 8841994 7 1131995 5 8151996 5 5121997 4 9831998 4 7621999 4 779 65.6 10.8 3 909 9 733 1 894 10 6242000 1 920 25.1 4.1 3 543 6 911 2 986 12 4452001 1 246 15.4 2.5 3 249 6 093 4 091 14 8162002 1 303 15.3 2.4 3 998 6 907 3 559 14 7212003 666 7.1 1.2 4 445 6 974 3 500 15 2882004 224 2.3 0.4 5 668 7 858 3 842 15 7602005 144 1.4 0.2 7 227 9 393 3 853 16 3592006 - 119 -1.1 -0.2 6 146 8 171 5 846 19 7032007(c ) - 24 -0.2 0.0 5 075 7 254 8 110 22 1282008(d)(e)(f) - 276 -2.1 -0.4 6 468 8 078 7 580 23 7412009 475 3.5 0.6 8 939 11 562 5 551 24 1462010 1 402 9.0 1.7 9 478 13 182 6 551 36 2312011 2 930 19.5 3.3 9 096 14 313 7 299 40 9582012(g) 4 165 26.2 4.6 13 523 20 332 1 413 37 1992013 5 227 34.1 5.5 11 085 19 079 1 742 39 3632014(h) 7 071 46.1 7.3 10 877 20 761 1 056 39 6542015(i) 3 929 23.7 4.0 11 358 18 296 1 374 40 1212016(j) 4 393 25.3 4.4 14 029 21 372 -2 049 37 7412017 6 110 33.1 5.9 11 448 21 614 -1 990 42 433
Net debt (a)
Note: Table may not add due to rounding.
(a) Net debt data for the years before 1999 are sourced from ABS, Government Financial Estimates 2003–04 (catalogue number 5501).
(b) There is a structural break in the methodology used to calculate superannuation liabilities between June 2003 and June 2004. This accounting change, which involved the adoption of the Commonwealth Government bond rate for valuation purposes in line with AASB 119, Employee Benefits, resulted in a significant increase in superannuation liabilities.
(c) There is a structural break in 2007 reflecting the amalgamation of SAFA and SAICORP on 1 July 2006. The transfer of SAICORP’s assets and liabilities from the general government sector to the public financial corporations sector resulted in an increase in general government net debt of $99 million at 1 July 2006 and an increase in net financial liabilities of $90 million at 1 July 2006.
(d) There is a structural break in 2008 reflecting the transfer of rail assets from TransAdelaide to the general government sector. This resulted in an increase in net debt and net financial liabilities of $66 million in 2007–08, and a reduction in net financial worth of $591 million, with no impact on net worth.
(e) There is a structural break in 2008 reflecting the transfer of assets from the Adelaide Festival Centre Trust to the general government sector. This resulted in an increase in net debt and net financial liabilities of $28 million in 2007–08, and a reduction in net financial worth of $76 million, with no impact on net worth.
(f) There is a structural break in 2008 reflecting the first time recognition on the general government balance sheet of South Australia’s share of the net assets of the Murray-Darling Basin Commission. This had no impact on net debt, however resulted in a reduction in net financial liabilities of $615 million in 2007–08, and an increase in net financial worth and net worth of $615 million.
(g) There is a structural break in 2012 reflecting the transfer of the Rail Commissioner to the general government sector. This resulted in a reduction in net debt of $6 million, an increase in net financial liabilities of $37 million, and a reduction in net financial worth of $144 million in 2011–12, with no impact on net worth.
Final Budget Outcome 2016–17 47
Appendix C: General government and non-financial public sector financial statistics time series

(h) There is a structural break in 2014 reflecting the transfer of the Lotteries Commission of South Australia (SA Lotteries) to the general government sector. This resulted in a reduction in net debt of $46 million, a reduction in net financial liabilities of $1 million in 2013–14, with no impact on net worth.
(i) There is a structural break in 2015 reflecting the government’s decision to reduce its equity in SA Water. This resulted in a once-off $2.7 billion return of capital to the Consolidated Account in 2014–15. The restructure resulted in a reduction in distributions paid to government partially offset by increased guarantee fees payable and lower borrowing costs.
(j) There is a structural break in 2016 reflecting the transfer of the South Australia Motor Sport Board to the general government sector. This resulted in an increase in net financial liabilities of $3 million, and a reduction in net financial worth of $12 million in 2015–16, with no impact on net worth.
Table C.3: General government sector receipts, payments and surplus(a) ($million)
Receipts Payments ABS Cash Surplus1979–80 1 891 1 671 2201980–81 2 065 1 917 1481981–82 2 210 2 122 871982–83 2 664 2 507 1561983–84 2 988 2 734 2551984–85 3 380 3 057 3241985–86 3 634 3 161 4741986–87 3 956 3 416 5401987–88 4 307 3 858 4491988–89 4 630 3 977 6531989–90 4 973 4 370 6031990–91 5 260 4 796 4631991–92 5 387 5 396 - 101992–93 5 967 5 456 5121993–94 6 087 6 024 631994–95 6 155 6 220 - 661995–96 6 405 6 164 2411996–97 6 379 6 282 971997–98 6 988 6 724 2641998–99 7 165 7 041 1231999–2000 7 676 7 915 - 2392000–01 8 278 8 387 - 1082001–02 8 698 8 748 - 502002–03 9 522 8 864 6582003–04 10 023 9 502 5222004–05 11 252 11 059 1932005–06 11 480 11 293 1872006–07 12 090 12 116 - 262007–08 12 932 12 552 3792008–09 13 579 14 299 - 7212009–10 15 837 16 991 -1 1542010–11 15 331 16 851 -1 5202011–12 16 556 17 594 -1 0382012–13 16 489 17 655 -1 1662013–14 15 434 17 232 -1 7972014–15 16 768 16 652 1162015–16 17 144 17 357 - 2132016–17 19 338 21 566 -2 228
Note: Table may not add due to rounding.
(a) There is a break in the series between 1998–99 and 1999–2000. Data for the years before 1999–2000 are sourced from the ABS and are consistent with ABS Government Finance Statistics (GFS) reporting requirements on a cash basis. Capital receipts and payments, including payments associated with the provision of financial support for state owned financial institutions (which were treated by the ABS then as an ‘investment in financial assets for policy purposes’) are not included in the series before 1999–2000. After 1998–99, data is derived from an accrual ABS GFS reporting framework, with receipts proxied by receipts from operating activities and sales of non-financial assets, and payments proxied by payments for operating activities, purchases of non-financial assets and net acquisition of assets under finance leases and similar arrangements. Due to the associated methodological and data-source changes, time series data that encompass measures derived under both cash and accrual accounting should be used with caution.
48 Final Budget Outcome 2016–17
Appendix C: General government and non-financial public sector financial statistics time series

Tabl
e C
.4: G
ener
al g
over
nmen
t sec
tor o
pera
ting
stat
emen
t ($m
illio
n)
2007
–08
2008
–09
2009
–10
2010
–11
2011
–12
2012
–13
2013
–14
2014
–15
2015
–16
2016
–17
Rev
enue
Taxa
tion
reve
nue
3 57
03
537
3 64
93
831
3 85
44
104
4 08
54
376
4 40
94
431
Gra
nts
6 61
67
249
8 88
18
185
8 66
87
669
7 80
48
350
8 99
79
958
Sale
s of
goo
ds a
nd s
ervi
ces
1 57
21
697
1 93
61
879
2 01
52
115
2 26
52
329
2 45
52
568
Inte
rest
inco
me(a
) 2
03 1
50 1
38 1
68 1
72 1
34 4
0 2
8 2
4 2
5D
ivid
end
and
inco
me
tax
equi
vale
nt in
com
e 4
29 3
82 4
33 4
03 3
85 4
46 3
98 7
91 7
92 6
45O
ther
490
517
497
550
811
865
752
674
686
852
Tota
l rev
enue
12 8
7913
531
15 5
3415
017
15 9
0515
333
15 3
4316
549
17 3
6218
480
less
Exp
ense
sEm
ploy
ee e
xpen
ses
5 26
85
749
6 22
16
400
6 77
07
105
7 35
37
493
7 72
18
010
Supe
rann
uatio
n ex
pens
esSu
pera
nnua
tion
inte
rest
cos
t 2
76 3
83 4
55 4
27 4
07 3
14 4
68 4
38 4
02 3
45O
ther
sup
eran
nuat
ion
expe
nses
5
46 5
80 6
00 6
21 6
66 6
75 7
36 7
38 7
44 7
67D
epre
ciat
ion
and
amor
tisat
ion
525
566
633
670
718
762
812
853
890
928
Inte
rest
exp
ense
s(a)
218
180
204
308
427
386
300
254
210
192
Oth
er p
rope
rty e
xpen
ses
——
——
——
——
——
Oth
er o
pera
ting
expe
nses
3 24
63
624
3 69
53
824
3 99
34
313
4 16
94
173
4 39
84
771
Gra
nts
2 33
72
682
3 54
02
819
3 18
32
726
2 57
72
790
2 69
83
025
Tota
l exp
ense
s12
414
13 7
6415
347
15 0
6916
164
16 2
8216
415
16 7
3817
062
18 0
37eq
uals
Net
ope
ratin
g ba
lanc
e 4
64- 2
33 1
87- 5
3- 2
58- 9
48-1
071
- 189
300
443
plus
Oth
er e
cono
mic
flow
s1
149
708
11 8
302
905
-3 5
563
113
1 36
2 6
28-2
621
4 25
0eq
uals
Com
preh
ensi
ve re
sult
— to
tal c
hang
e in
net
wor
th1
613
475
12 0
172
852
-3 8
142
164
291
439
-2 3
214
693
Net
ope
ratin
g ba
lanc
e 4
64- 2
33 1
87- 5
3- 2
58- 9
48-1
071
- 189
300
443
less
Net
acq
uisi
tion
of n
on-fi
nanc
ial a
sset
sPu
rcha
ses
of n
on-fi
nanc
ial a
sset
s 8
751
305
2 14
42
122
1 87
62
008
1 59
0 9
371
162
4 46
0le
ss S
ales
of n
on-fi
nanc
ial a
sset
s 1
08 1
08 2
9 8
2 3
221
197
117
166
66
722
less
Dep
reci
atio
n 5
25 5
66 6
33 6
70 7
18 7
62 8
12 8
53 8
90 9
28pl
us C
hang
e in
inve
ntor
ies
— 7
3—
3 7
1 4
- 3 3
plus
Oth
er m
ovem
ents
in n
on-fi
nanc
ial a
sset
s—
—- 2
06—
——
——
——
equa
ls T
otal
net
acq
uisi
tion
of n
on-fi
nanc
ial a
sset
s 2
42 6
391
279
1 37
0 8
39 5
5 6
61- 7
8 2
042
814
equa
ls N
et le
ndin
g / b
orro
win
g 2
22- 8
72-1
092
-1 4
22-1
098
-1 0
03-1
733
- 111
96
-2 3
71
Not
e: T
otal
s m
ay n
ot a
dd d
ue to
roun
ding
.
(a)
Ther
e is
a s
truct
ural
bre
ak in
201
3–14
in th
e pr
esen
tatio
n of
inte
rest
inco
me
and
inte
rest
exp
ense
. Int
eres
t inc
ome
earn
ed o
n ca
sh a
nd d
epos
its is
offs
et w
ith in
tere
st e
xpen
se o
n th
e bo
rrow
ings
th
e Tr
easu
rer h
as w
ith S
AFA.
Thi
s re
sults
in a
redu
ctio
n to
inte
rest
inco
me
and
inte
rest
exp
ense
acc
ordi
ngly
.
Final Budget Outcome 2016–17 49
Appendix C: General government and non-financial public sector financial statistics time series

Tabl
e C
.5: G
ener
al g
over
nmen
t sec
tor b
alan
ce s
heet
($m
illio
n)
As a
t 30
June
2008
2009
2010
2011
2012
2013
2014
2015
2016
2017
Asse
tsFi
nanc
ial a
sset
sC
ash
and
depo
sits
(a)
2 76
03
084
3 27
73
675
916
1 11
31
104
1 11
01
088
1 26
8Ad
vanc
es p
aid
782
752
676
642
550
176
66
57
57
63
Inve
stm
ents
, loa
ns a
nd p
lace
men
ts 1
34 1
40 1
63 1
89 2
00 2
26 2
47 2
71 2
92 3
67R
ecei
vabl
es 4
98 6
10 7
13 5
75 5
39 7
30 6
71 6
10 8
96 7
39Eq
uity
Inve
stm
ents
in o
ther
pub
lic s
ecto
r ent
ities
15 6
5817
113
19 7
3421
612
21 7
4520
821
21 8
1619
669
19 3
2219
624
Inve
stm
ents
— o
ther
668
707
752
743
836
831
836
865
890
32
Oth
er fi
nanc
ial a
sset
s 3
8 4
3 4
7 8
0 1
25 5
6 3
9 7
9 8
6 1
05To
tal f
inan
cial
ass
ets
20 5
3922
449
25 3
6327
516
24 9
1223
954
24 7
7922
661
22 6
3222
198
Non
-fina
ncia
l ass
ets
Land
and
fixe
d as
sets
16 1
3818
590
29 6
7733
657
35 7
7937
616
38 5
9338
747
39 7
8144
402
Oth
er n
on-fi
nanc
ial a
sset
s 2
3 5
3 2
6 5
5 1
9 2
1To
tal n
on-fi
nanc
ial a
sset
s16
161
18 5
9529
680
33 6
5835
785
37 6
2138
599
38 7
4839
790
44 4
23To
tal a
sset
s36
700
41 0
4555
043
61 1
7560
698
61 5
7563
378
61 4
0962
422
66 6
21Li
abili
ties
Dep
osits
hel
d 3
28 3
35 3
87 3
54 3
97 3
92 3
56 3
77 4
78 2
75Ad
vanc
es re
ceiv
ed 6
44 6
28 6
10 5
92 5
90 2
32 2
14 2
52 2
34 2
34Bo
rrow
ing(a
)2
427
3 48
84
522
6 49
14
843
6 11
87
918
4 73
75
119
7 30
0Su
pera
nnua
tion
6 46
88
939
9 47
89
096
13 5
2311
085
10 8
7711
358
14 0
2911
448
Oth
er e
mpl
oyee
ben
efits
1 64
61
867
1 92
22
022
2 40
82
457
2 45
22
622
2 82
92
772
Paya
bles
665
760
1 00
4 8
10 8
981
019
936
1 08
91
089
1 24
5O
ther
liab
ilitie
s 7
79 8
81 8
88 8
53 8
40 9
08 9
70 8
52 9
04 9
15To
tal l
iabi
litie
s12
959
16 8
9818
811
20 2
1723
499
22 2
1223
723
21 2
8824
681
24 1
88Ne
t wor
th23
741
24 1
4636
231
40 9
5837
199
39 3
6339
654
40 1
2137
741
42 4
33N
et fi
nanc
ial w
orth
(b)(e
)7
580
5 55
16
551
7 29
91
413
1 74
21
056
1 37
4-2
049
-1 9
90N
et fi
nanc
ial l
iabi
litie
s(b)(c
)(e)
8 07
811
562
13 1
8214
313
20 3
3219
079
20 7
6118
296
21 3
7221
614
Net
deb
t(b)(c
)(d)
- 276
475
1 40
22
930
4 16
55
227
7 07
13
929
4 39
36
110
Not
e: T
otal
s m
ay n
ot a
dd d
ue to
roun
ding
. (a
) Th
ere
is a
stru
ctur
al b
reak
in 2
012
refle
ctin
g th
at c
ash
and
depo
sits
hel
d by
the
Trea
sure
r are
offs
et w
ith b
orro
wing
s th
e Tr
easu
rer h
as w
ith S
AFA.
Thi
s re
sulte
d in
a re
duct
ion
in c
ash
and
depo
sits
, and
bo
rrowi
ngs
of $
3.13
4 bi
llion
in 2
011–
12, w
ith n
o im
pact
on
both
net
wor
th a
nd n
et d
ebt.
(b)
Ther
e is
a s
truct
ural
bre
ak in
201
2 re
flect
ing
the
trans
fer o
f the
Rai
l Com
mis
sion
er to
the
gene
ral g
over
nmen
t sec
tor.
This
resu
lted
in a
redu
ctio
n in
net
deb
t of $
6 m
illion
, an
incr
ease
in n
et fi
nanc
ial l
iabi
litie
s of
$3
7 m
illion
, and
a re
duct
ion
in n
et fi
nanc
ial w
orth
of $
144
milli
on in
201
1–12
, with
no
impa
ct o
n ne
t wor
th.
(c)
Ther
e is
a s
truct
ural
bre
ak in
201
4 re
flect
ing
the
trans
fer o
f the
Lot
terie
s C
omm
issi
on o
f Sou
th A
ustra
lia (S
A Lo
tterie
s) to
the
gene
ral g
over
nmen
t sec
tor.
This
resu
lted
in a
redu
ctio
n in
net
deb
t of $
46 m
illion
, a
redu
ctio
n in
net
fina
ncia
l lia
bilit
ies
of $
1 m
illion
in 2
013–
14, w
ith n
o im
pact
on
net w
orth
.
50 Final Budget Outcome 2016–17
Appendix C: General government and non-financial public sector financial statistics time series

(d)
Ther
e is
a s
truct
ural
bre
ak in
201
5 re
flect
ing
the
gove
rnm
ent’s
dec
isio
n to
redu
ce it
s eq
uity
in S
A W
ater
. Thi
s re
sulte
d in
a o
nce-
off $
2.7
billio
n re
turn
of c
apita
l to
the
Con
solid
ated
Acc
ount
in 2
014–
15. T
he
rest
ruct
ure
resu
lted
in a
redu
ctio
n in
dis
tribu
tions
pai
d to
gov
ernm
ent p
artia
lly o
ffset
by
incr
ease
d gu
aran
tee
fees
pay
able
and
low
er b
orro
win
g co
sts.
(e
) Th
ere
is a
stru
ctur
al b
reak
in 2
016
refle
ctin
g th
e tra
nsfe
r of t
he S
outh
Aus
tralia
n M
otor
Spo
rt Bo
ard
to th
e ge
nera
l gov
ernm
ent s
ecto
r. Th
is re
sulte
d in
an
incr
ease
in n
et fi
nanc
ial l
iabi
litie
s of
$3
milli
on, a
nd a
re
duct
ion
in n
et fi
nanc
ial w
orth
of $
12 m
illion
in 2
015–
16, w
ith n
o im
pact
on
net w
orth
.
Final Budget Outcome 2016–17 51
Appendix C: General government and non-financial public sector financial statistics time series
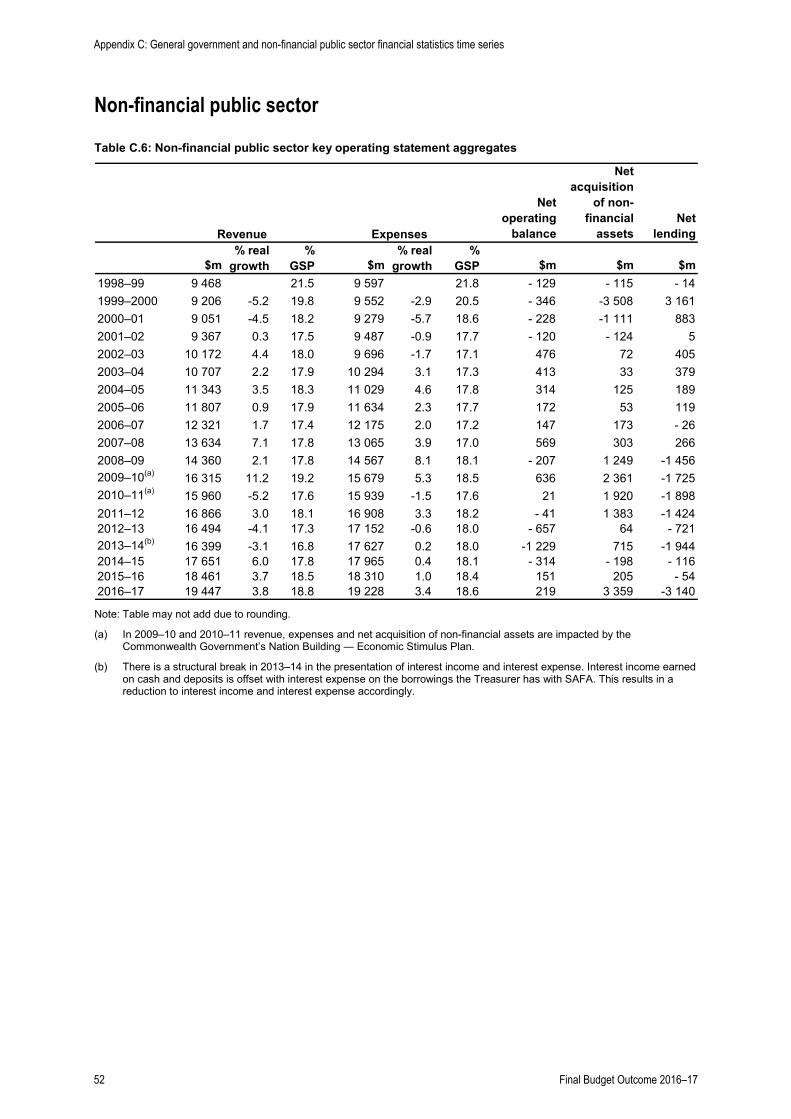
Non-financial public sector
Table C.6: Non-financial public sector key operating statement aggregates
Net operating
balance
Net acquisition
of non-financial
assetsNet
lending
$m% real
growth%
GSP $m% real
growth%
GSP $m $m $m1998–99 9 468 21.5 9 597 21.8 - 129 - 115 - 141999–2000 9 206 -5.2 19.8 9 552 -2.9 20.5 - 346 -3 508 3 1612000–01 9 051 -4.5 18.2 9 279 -5.7 18.6 - 228 -1 111 8832001–02 9 367 0.3 17.5 9 487 -0.9 17.7 - 120 - 124 52002–03 10 172 4.4 18.0 9 696 -1.7 17.1 476 72 4052003–04 10 707 2.2 17.9 10 294 3.1 17.3 413 33 3792004–05 11 343 3.5 18.3 11 029 4.6 17.8 314 125 1892005–06 11 807 0.9 17.9 11 634 2.3 17.7 172 53 1192006–07 12 321 1.7 17.4 12 175 2.0 17.2 147 173 - 262007–08 13 634 7.1 17.8 13 065 3.9 17.0 569 303 2662008–09 14 360 2.1 17.8 14 567 8.1 18.1 - 207 1 249 -1 4562009–10(a) 16 315 11.2 19.2 15 679 5.3 18.5 636 2 361 -1 7252010–11(a) 15 960 -5.2 17.6 15 939 -1.5 17.6 21 1 920 -1 8982011–12 16 866 3.0 18.1 16 908 3.3 18.2 - 41 1 383 -1 4242012–13 16 494 -4.1 17.3 17 152 -0.6 18.0 - 657 64 - 7212013–14(b) 16 399 -3.1 16.8 17 627 0.2 18.0 -1 229 715 -1 9442014–15 17 651 6.0 17.8 17 965 0.4 18.1 - 314 - 198 - 1162015–16 18 461 3.7 18.5 18 310 1.0 18.4 151 205 - 542016–17 19 447 3.8 18.8 19 228 3.4 18.6 219 3 359 -3 140
Revenue Expenses
Note: Table may not add due to rounding.
(a) In 2009–10 and 2010–11 revenue, expenses and net acquisition of non-financial assets are impacted by the Commonwealth Government’s Nation Building ― Economic Stimulus Plan.
(b) There is a structural break in 2013–14 in the presentation of interest income and interest expense. Interest income earned on cash and deposits is offset with interest expense on the borrowings the Treasurer has with SAFA. This results in a reduction to interest income and interest expense accordingly.
52 Final Budget Outcome 2016–17
Appendix C: General government and non-financial public sector financial statistics time series

Table C.7: Non-financial public sector key balance sheet aggregates ($million) (b) Unfunded Net financial Net financial Net
% of % of superannuation liabilities worth worthAs at 30 June $m revenue GSP $m $m $m $m1989 4 1971990 4 4571991 5 4181992 8 1421993 11 6101994 10 5501995 8 8441996 8 4321997 8 1701998 7 9271999 7 657 80.9 17.4 3 909 13 099 -12 256 10 6242000 4 355 47.3 9.4 3 543 9 914 -8 986 12 4452001 3 223 35.6 6.5 3 249 8 151 -7 109 14 8162002 3 317 35.4 6.2 3 998 8 973 -7 902 14 7212003 2 696 26.5 4.8 4 445 9 096 -8 811 15 2882004 2 285 21.3 3.8 5 668 10 031 -9 550 15 7602005 2 126 18.7 3.4 7 227 11 511 -11 004 16 3592006 1 786 15.1 2.7 6 146 10 451 -9 889 19 7032007(c) 1 989 16.1 2.8 5 075 9 518 -8 795 22 1282008(d)(e) 1 611 11.8 2.1 6 468 10 208 -10 487 23 7412009 2 872 20.0 3.6 8 939 14 302 -14 921 24 1462010 4 487 27.5 5.4 9 478 16 626 -16 997 36 2312011 6 541 41.0 7.3 9 096 18 273 -18 402 40 9582012 7 996 47.4 8.8 13 523 24 500 -25 123 37 1992013 8 949 54.3 9.5 11 085 23 064 -23 223 39 3632014 10 964 66.9 11.3 10 877 24 811 -24 080 39 6542015 10 676 60.5 10.8 11 358 25 167 -23 750 40 1212016 10 912 59.1 10.9 14 029 28 281 -27 355 37 7412017 13 529 69.6 13.0 11 448 29 200 -28 042 42 433
Net debt (a)
Note: Table may not add due to rounding.
(a) Net debt data for the years before 1999 are sourced from the ABS, Government Financial Estimates 2003–04 (Catalogue number 5501).
(b) There is a structural break in the methodology used to calculate superannuation liabilities between June 2003 and June 2004. This accounting change, which involved the adoption of the Commonwealth Government bond rate for valuation purposes in line with AASB 119, Employee Benefits, resulted in a significant increase in superannuation liabilities.
(c) There is a structural break in 2007 reflecting the amalgamation of SAFA and SAICORP on 1 July 2006. The transfer of SAICORP’s assets and liabilities from the general government sector to the public financial corporations sector resulted in an increase in non-financial public sector net debt of $99 million at 1 July 2006 and an increase in net financial liabilities of $90 million at 1 July 2006.
(d) There is a structural break in 2008 reflecting the amalgamation of South Australian Community Housing Authority (public financial corporation) with South Australian Housing Trust (public non-financial corporation). This resulted in an increase in net debt and net financial liabilities and a decrease in net financial worth of $98 million in 2007−08, with no impact on net worth.
(e) There is a structural break in 2008 reflecting the first time recognition on the general government balance sheet of South Australia’s share of the net assets of the Murray-Darling Basin Commission. This had no impact on net debt, however resulted in a reduction in net financial liabilities of $615 million in 2007–08, and an increase in net financial worth and net worth of $615 million.
Appendix C: General government and non-financial public sector financial statistics time series
Final Budget Outcome 2016–17 53

Table C.8: Non-financial public sector receipts, payments and surplus(a) ($million)
Receipts Payments ABS Cash Surplus1979–80 2 681 2 388 2921980–81 2 877 2 649 2281981–82 3 145 2 963 1821982–83 3 651 3 356 2951983–84 4 383 4 014 3691984–85 4 887 4 356 5311985–86 5 172 4 415 7571986–87 5 542 4 790 7521987–88 6 078 5 299 7801988–89 6 946 5 784 1 1621989–90 7 517 6 465 1 0521990–91 7 830 6 839 9911991–92 8 352 7 969 3831992–93 8 939 7 946 9931993–94 8 761 8 119 6421994–95 8 570 8 142 4281995–96 8 985 8 654 3311996–97 8 908 8 532 3751997–98 9 426 8 895 5321998–99 9 301 8 692 6091999–2000 13 014 9 501 3 5132000–01 10 572 9 414 1 1582001–02 9 726 9 722 42002–03 10 439 9 805 6342003–04 10 891 10 403 4882004–05 12 051 11 786 2652005–06 12 239 11 868 3702006–07 12 684 12 809 - 1252007–08 13 943 13 477 4662008–09 14 563 15 806 -1 2432009–10 16 847 18 695 -1 8492010–11 16 548 18 553 -2 0042011–12 17 431 18 863 -1 4322012–13 17 814 19 133 -1 3192013–14 16 640 18 647 -2 0072014–15 17 841 17 896 - 552015–16 18 485 18 623 - 1382016–17 19 593 22 779 -3 186
Note: Table may not add due to rounding.
(a) There is a break in the series between 1998–99 and 1999–2000. Data for the years before 1999–2000 is sourced from the ABS and is consistent with ABS GFS reporting requirements on a cash basis. Capital receipts and payments, including payments associated with the provision of financial support for state owned financial institutions, which were treated by the ABS then as an investment in financial assets for policy purposes, are not included in this series before 1999–2000. After 1998–99, data is derived from an accrual ABS GFS reporting framework, with receipts proxied by receipts from operating activities and sales of non-financial assets, and payments proxied by payments for operating activities, purchases of non-financial assets and net acquisition of assets under finance leases and similar arrangements. Due to the associated methodological and data-source changes, time series data that encompass measures derived under both cash and accrual accounting should be used with caution.
54 Final Budget Outcome 2016–17
Appendix C: General government and non-financial public sector financial statistics time series

Tabl
e C
.9: N
on-fi
nanc
ial p
ublic
sec
tor o
pera
ting
stat
emen
t ($m
illio
n)
2007
–08
2008
–09
2009
–10
2010
–11
2011
–12
2012
–13
2013
–14
2014
–15
2015
–16
2016
–17
Rev
enue
Taxa
tion
reve
nue
3 30
83
244
3 33
13
467
3 47
63
726
3 80
54
072
4 08
34
072
Gra
nts
6 61
67
262
8 89
78
223
8 70
57
697
7 80
68
350
8 99
69
959
Sale
s of
goo
ds a
nd s
ervi
ces
2 92
63
082
3 31
13
366
3 58
93
949
3 84
43
968
4 13
84
062
Inte
rest
inco
me(a
) 1
88 1
25 1
23 1
63 1
63 1
31 4
6 3
4 3
3 3
2D
ivid
end
and
inco
me
tax
equi
vale
nt in
com
e 2
4 3
6 5
8 9
1 5
1 5
6 8
1 5
04 4
66 4
42O
ther
572
611
594
651
883
935
816
724
746
881
Tota
l rev
enue
13 6
3414
360
16 3
1515
960
16 8
6616
494
16 3
9917
651
18 4
6119
447
less
Exp
ense
sEm
ploy
ee e
xpen
ses
5 45
05
944
6 43
66
625
6 95
97
299
7 54
47
683
7 91
38
208
Supe
rann
uatio
n ex
pens
esSu
pera
nnua
tion
inte
rest
cos
t 2
76 3
83 4
55 4
27 4
07 3
14 4
68 4
38 4
02 3
45O
ther
sup
eran
nuat
ion
expe
nses
5
68 6
05 6
28 6
49 6
92 7
00 7
62 7
64 7
71 7
94D
epre
ciat
ion
and
amor
tisat
ion
798
852
958
1 02
41
078
1 16
61
236
1 27
51
321
1 36
7In
tere
st e
xpen
ses(a
) 3
22 2
90 3
44 4
93 6
39 5
99 5
09 5
19 4
83 4
72O
ther
pro
perty
exp
ense
s 7
4—
——
——
——
——
Oth
er o
pera
ting
expe
nses
3 76
54
404
4 30
64
472
4 71
64
849
4 89
24
886
5 04
55
358
Gra
nts
1 81
12
089
2 55
32
249
2 41
72
224
2 21
82
401
2 37
62
685
Tota
l exp
ense
s13
065
14 5
6715
679
15 9
3916
908
17 1
5217
627
17 9
6518
310
19 2
28eq
uals
Net
ope
ratin
g ba
lanc
e 5
69- 2
07 6
36 2
1- 4
1- 6
57-1
229
- 314
151
219
plus
Oth
er e
cono
mic
flow
s1
044
682
11 3
822
831
-3 7
722
822
1 52
0 7
53-2
472
4 47
4eq
uals
Com
preh
ensi
ve re
sult
- tot
al c
hang
e in
net
wor
th1
613
475
12 0
172
852
-3 8
142
164
291
439
-2 3
214
693
Net
ope
ratin
g ba
lanc
e 5
69- 2
07 6
36 2
1- 4
1- 6
57-1
229
- 314
151
219
less
Net
acq
uisi
tion
of n
on-fi
nanc
ial a
sset
sPu
rcha
ses
of n
on-fi
nanc
ial a
sset
s1
399
2 32
83
762
3 21
72
750
2 68
32
126
1 42
91
704
4 94
7le
ss S
ales
of n
on-fi
nanc
ial a
sset
s 2
98 3
04 3
36 2
81 3
311
428
333
297
195
228
less
Dep
reci
atio
n 7
98 8
52 9
581
024
1 07
81
166
1 23
61
275
1 32
11
367
plus
Cha
nge
in in
vent
orie
s—
76
99
7 4
1- 2
6 1
58- 5
5 1
7 7
plus
Oth
er m
ovem
ents
in n
on-fi
nanc
ial a
sset
s—
—- 2
06—
——
——
——
equa
ls T
otal
net
acq
uisi
tion
of n
on-fi
nanc
ial a
sset
s 3
031
249
2 36
11
920
1 38
3 6
4 7
15- 1
98 2
053
359
equa
ls N
et le
ndin
g / b
orro
win
gN
et le
ndin
g / b
orro
win
g 2
66-1
456
-1 7
25-1
898
-1 4
24- 7
21-1
944
- 116
- 54
-3 1
40
Not
e: T
able
may
not
add
due
to ro
undi
ng.
(a)
Ther
e is
a s
truct
ural
bre
ak in
201
3–14
in th
e pr
esen
tatio
n of
inte
rest
inco
me
and
inte
rest
exp
ense
. Int
eres
t inc
ome
earn
ed o
n ca
sh a
nd d
epos
its is
offs
et w
ith in
tere
st e
xpen
se o
n th
e bo
rrow
ings
th
e Tr
easu
rer h
as w
ith S
AFA.
Thi
s re
sulte
d in
a re
duct
ion
to in
tere
st in
com
e an
d in
tere
st e
xpen
se a
ccor
ding
ly.
Final Budget Outcome 2016–17 55
Appendix C: General government and non-financial public sector financial statistics time series

Tabl
e C
.10:
Non
-fina
ncia
l pub
lic s
ecto
r bal
ance
she
et ($
mill
ion)
As a
t 30
June
2008
2009
2010
2011
2012
2013
2014
2015
2016
2017
Asse
tsFi
nanc
ial a
sset
sC
ash
and
depo
sits
(a)
3 04
03
360
3 57
33
961
1 20
71
440
1 35
41
326
1 50
61
443
Adva
nces
pai
d 8
1 7
1 7
2 9
9 7
7 6
2 5
5 2
4 2
4 3
0In
vest
men
ts, l
oans
and
pla
cem
ents
163
176
232
228
242
270
293
317
340
421
Rec
eiva
bles
521
520
766
635
662
877
803
837
951
975
Equi
tyIn
vest
men
ts in
oth
er p
ublic
sec
tor e
ntiti
es- 2
79- 6
19- 3
71- 1
28- 6
23- 1
59 7
311
416
926
1 15
8In
vest
men
ts —
oth
er 6
93 7
27 7
66 7
61 8
52 8
48 8
53 8
83 9
05 4
5O
ther
fina
ncia
l ass
ets
40
82
104
83
126
56
39
83
92
118
Tota
l fin
anci
al a
sset
s4
259
4 31
65
143
5 63
82
543
3 39
44
129
4 88
74
743
4 19
1N
on-fi
nanc
ial a
sset
sLa
nd a
nd fi
xed
asse
ts34
202
39 0
5953
224
59 3
0262
311
62 5
7463
726
63 8
6865
084
70 4
54O
ther
non
-fina
ncia
l ass
ets
25
8 4
57
12
12
8 4
13
22
Tota
l non
-fina
ncia
l ass
ets
34 2
2739
067
53 2
2859
359
62 3
2262
586
63 7
3463
872
65 0
9670
476
Tota
l ass
ets
38 4
8643
384
58 3
7164
997
64 8
6665
981
67 8
6368
759
69 8
3974
667
Liab
ilitie
sD
epos
its h
eld
166
174
171
171
177
172
183
204
226
143
Adva
nces
rece
ived
644
628
610
592
590
232
214
252
234
234
Borro
win
g(a)
4 08
45
677
7 58
310
065
8 75
510
318
12 2
7011
888
12 3
2215
047
Supe
rann
uatio
n 6
468
8 93
99
478
9 09
613
523
11 0
8510
877
11 3
5814
029
11 4
48O
ther
em
ploy
ee b
enef
its1
719
1 94
42
003
2 10
62
486
2 53
12
525
2 69
52
902
2 84
3Pa
yabl
es 8
01 9
071
319
1 07
71
204
1 21
51
102
1 30
41
320
1 48
1O
ther
liab
ilitie
s 8
62 9
69 9
75 9
32 9
321
064
1 03
8 9
371
066
1 03
8To
tal l
iabi
litie
s14
745
19 2
3722
140
24 0
4027
667
26 6
1728
209
28 6
3732
099
32 2
34N
et w
orth
23 7
4124
146
36 2
3140
958
37 1
9939
363
39 6
5440
121
37 7
4142
433
Net
fina
ncia
l wor
th-1
0 48
7-1
4 92
1-1
6 99
7-1
8 40
2-2
5 12
3-2
3 22
3-2
4 08
0-2
3 75
0-2
7 35
5-2
8 04
2N
et fi
nanc
ial l
iabi
litie
s10
208
14 3
0216
626
18 2
7324
500
23 0
6424
811
25 1
6728
281
29 2
00N
et d
ebt
1 61
12
872
4 48
76
541
7 99
68
949
10 9
6410
676
10 9
1213
529
Not
e: T
otal
s m
ay n
ot a
dd d
ue to
roun
ding
.
(a)
Ther
e is
a s
truct
ural
bre
ak in
201
2 re
flect
ing
that
cas
h an
d de
posi
ts h
eld
by th
e Tr
easu
rer a
re o
ffset
with
bor
row
ings
the
Trea
sure
r has
with
SAF
A. T
his
resu
lted
in a
redu
ctio
n in
cas
h an
d de
posi
ts,
and
borro
win
gs o
f $3.
134
billio
n in
201
1–12
, with
no
impa
ct o
n bo
th n
et w
orth
and
net
deb
t.
56 Final Budget Outcome 2016–17
Appendix C: General government and non-financial public sector financial statistics time series


Department of Treasury and Finance
State Administration Centre 200 Victoria Square, Adelaide South Australia, 5000
GPO Box 1045, Adelaide South Australia, 5001
Telephone: +61 (08) 8226 9500
www.treasury.sa.gov.au