
Final Benefit-Cost Analysis for the Grassland Reserve ... · Final Benefit-Cost Analysis . for the...
37
United States Department of Agriculture Natural Resources Conservation Service Final Benefit-Cost Analysis for the Grassland Reserve Program (GRP) Food, Conservation, and Energy Act of 2008 Title II – Conservation Subtitle E – Farmland Protection and Grassland Reserve Section 1238N – Grassland Reserve Program March 31, 2010
Transcript of Final Benefit-Cost Analysis for the Grassland Reserve ... · Final Benefit-Cost Analysis . for the...

United States Department of Agriculture Natural Resources Conservation Service
Final Benefit-Cost Analysis
for the
Grassland Reserve Program (GRP)
Food, Conservation, and Energy Act of 2008 Title II – Conservation
Subtitle E – Farmland Protection and Grassland Reserve Section 1238N – Grassland Reserve Program
March 31, 2010

USDA Nondiscrimination Statement The U.S. Department of Agriculture (USDA) prohibits discrimination in all its programs and activities on the basis of race, color, national origin, age, disability, and where applicable, sex, marital status, family status, parental status, religion, sexual orientation, genetic information, political beliefs, reprisal, or because all or a part of an individual’s income is derived from any public assistance program. (Not all prohibited bases apply to all programs.) Persons with disabilities who require alternative means for communication of program information (Braille, large print, audiotape, etc.) should contact USDA's TARGET Center at 202-720-2600 (voice and TDD). To file a complaint of discrimination write to USDA, Director, Office of Civil Rights, 1400 Independence Avenue, S.W., Washington, D.C. 20250-9410 or call 800-795-3272 (voice) or 202-720-6382 (TDD). USDA is an equal opportunity provider and employer.

2008 GRP Final Benefit-Cost Analysis i 03/31/2010
Table of Contents Executive Summary .......................................................................................................................1
Background ....................................................................................................................................2
Legislative Authority ................................................................................................................2
Rationale for the Rule ...............................................................................................................2
GRP Description and Features .....................................................................................................3
Program Objective ....................................................................................................................3
Program Overview ....................................................................................................................3
The 2008 Act – GRP Statutory Requirements .......................................................................4
The 2008 Act – GRP Discretionary Requirement ..................................................................6
Description of Baseline Conditions ..........................................................................................6
Analytical Model ............................................................................................................................7
Model Assumptions ...................................................................................................................7
Expected Producer Costs ..........................................................................................................8
Program Costs for the Government and Social Costs ...........................................................8
Expected Ecological and Economic Benefits ..........................................................................9
Direct and Indirect Beneficial Effects – Qualitative Discussion ......................................9
Direct and Indirect Beneficial Effects: Quantitative Discussion ..................................12
Discounting the Flow of Costs and Benefits over Time .......................................................14
GRP Policy Scenarios Considered ..............................................................................................15
Baseline One – No Action on the 2008 Act GRP Changes ..................................................16
Policy Scenario One – FY 2007 GRP Requirements Implemented with the 2008 Act GRP Acreage Goals .............................................................................................................19
Baseline Two – Full Implementation of the 2008 Act GRP Requirements ........................22
Policy Scenario Two – The 2008 Act GRP Requirements Implemented with Previous Acreage Targets ...................................................................................................................26
Conclusions and Recommendations ...........................................................................................29
References .....................................................................................................................................32
List of Preparers (in alphabetical order) ...................................................................................33

2008 GRP Final Benefit-Cost Analysis ii 03/31/2010
List of Tables Table 1. Estimated percentage decline in prairie acreage since 1830, selected States. .......7Table 2. Selected GRP performance and cost summary, FYs 2003–2007. ...........................8Table 3. Selected benefits from GRP. ....................................................................................12Table 4. Present value of estimated annual benefits and costs per acre. ............................15Table 5. Summary of varying assumptions in GRP baseline and policy scenarios. ..........16Table 6. Baseline One – Annual and cumulative acreage changes. ....................................17Table 7. Baseline One – Cost estimates, annual and cumulative, FY 2009–FY2012. ........17Table 8. Baseline One – Benefit estimates, annual and cumulative, FY 2009–FY2012. ...18Table 9. Baseline One – Estimated net benefits, annual and cumulative, FY 2009–
FY2012. ......................................................................................................................19Table 10. Policy Scenario One – Annual and cumulative acreage changes. ........................19Table 11. Policy Scenario One – Cost estimates, annual and cumulative, FY 2009–
FY2012. ......................................................................................................................20Table 12. Policy Scenario One – Benefit estimates, annual and cumulative, FY 2009–
FY2012. ......................................................................................................................21Table 13. Policy Scenario One – Estimated net benefits, annual and cumulative, FY
2009–FY2012. ............................................................................................................21Table 14. Baseline Two – Annual and cumulative acreage changes. ....................................23Table 15. Baseline Two – Cost estimates, annual and cumulative, FY 2009–FY2012. .......24Table 16. Baseline Two – Benefit estimates, annual and cumulative, FY 2009–FY2012. ...25Table 17. Baseline Two – Estimated net benefits, annual and cumulative, FY 2009–
FY2012. ......................................................................................................................25Table 18. Policy Scenario Two – Annual and cumulative acreage changes. ........................26Table 19. Policy Scenario Two – Cost estimates, annual and cumulative, FY 2009–
FY2012. ......................................................................................................................27Table 20. Policy Scenario Two – Benefit estimates, annual and cumulative, FY 2009–
FY2012. ......................................................................................................................28Table 21. Policy Scenario Two – Estimated net benefits, annual and cumulative, FY
2009–FY2012. ............................................................................................................28Table 22. Comparison of Key Findings of Interest in Baseline/Policy Scenarios. ...............30

2008 GRP Final Benefit-Cost Analysis 1 03/31/2010
Final Benefit-Cost Analysis Grassland Reserve Program (GRP)
Executive Summary Pursuant to Executive Order 12866, Regulatory Planning and Review, the Natural Resources Conservation Service (NRCS) has conducted a benefit-cost analysis of the Grassland Reserve program (GRP) as formulated for the Final Rule. This requirement provides decision makers with the opportunity to develop and implement a program that is beneficial and cost effective and that minimizes negative impacts to health, human safety, and the environment. GRP is a voluntary program for landowners and operators to protect, restore, and enhance grassland, including rangeland, pastureland, shrubland, and certain other lands. The program emphasizes support for grazing operations; enhancement of plant and animal biodiversity; and protection of grassland and land containing shrubs and forbs under threat of conversion. GRP is one tool in the suite of agricultural land retention mechanisms available to agricultural producers and local communities. Producers and local communities are the main drivers in efforts to retain agricultural land retention efforts, incurring the greatest costs but also having the greatest potential benefits. Agricultural retention efforts are driven by local decision makers and involve site-specific impacts that affect a host of non-use-valued attributes (scenic views, environmental amenities, etc.), making it difficult to accurately quantify the costs and benefits of various policy alternatives. Recognizing these problems, this analysis identifies the main costs and benefits in qualitative as well as quantitative terms as it explores policy and program alternatives. The main costs of agricultural land retention efforts include the restrictions on the range of activities landowners can pursue on the grazing land and the initial contract cost (in the case of easements) and annual payments (in the case of rental contracts) to the government. These costs must then be compared with the benefits of preserving its current land use in grazing or forage production. The benefits include the maintenance (and possible improvement) of the flow of ecological goods and services (EGS) emanating from its current use in agriculture; the possibility of increased forage production; and difficult to quantify non-use values associated with the provision of scenic views and recreational opportunities, wildlife habitat, and the preservation of current land-use patterns. In many cases, the funding provided through GRP leverages landowner donations, local government monies, and non-governmental contributions to preserve current land use in grazing. This qualitative benefit-cost analysis suggests that GRP assistance to local agricultural land preservation programs can bear positive net benefits. A main determinant whether positive net benefits are realized is the actual fate of the current land use (grazing) in the future with respect to its conversion to non-agricultural and non-grazing agricultural use. Programs such as GRP could play an important role in keeping this land in its most highly valued grazing use (taking into account its non-use-value attributes).

2008 GRP Final Benefit-Cost Analysis 2 03/31/2010
Final Benefit-Cost Analysis Grassland Reserve Program (GRP)
Background Legislative Authority GRP was authorized by the Farm Security and Rural Investment Act of 2002 (2002 Act), P.L. 107-171 Statute 134 (May 13, 2002), and was amended by the Food, Conservation, and Energy Act of 2008, P.L. 110-234 (May 22, 2008) (hereafter referred to as “the 2008 Act”). The 2008 Act mandates establishment of the Grassland Reserve Program (GRP) as a voluntary program for 3the purpose of assisting private and tribal landowners and operators in protecting grazing uses and related conservation values by restoring and conserving grassland and land containing shrubs and forbs, through rental contracts, easements, and associated restoration agreements. Participants are provided technical and financial assistance to restore eligible grassland functions and values. Rationale for the Rule The rationale for Natural Resources Conservation Service (NRCS) activities in preserving farm and ranch land through the use of easements and rental contracts is based on the agency’s strategic goal of maintaining connected landscapes to sustain a viable agricultural sector and a healthy environment. The current market fails to recognize fully the indirect value of benefits arising from the protection of working agricultural lands. In the absence of comprehensive land-use planning, real estate markets are based on many individual decisions that do not incorporate fully indirect and non-market benefits and therefore can result in excess conversion of agricultural lands. Excess conversion of agricultural lands to non-agricultural lands and non-agricultural use that may not be appropriate for the local conditions results in the loss of human enjoyment of rural amenities and a diminution of the ecological goods and services (EGS) the land can provide. Agricultural land maintained in its most appropriate use provides EGS benefits with respect to climate regulation, flood control, disease prevention, water purification, carbon sequestration, biodiversity and wildlife habitat, and a host of other areas.1 Because these outcomes are indirect and because many EGS can be classified as public goods,2
1For background on ecosystem services and their assessment, please see MEA 2005.
the market can be expected to fall short in supplying society’s desirable level, and EGS may appear “under-valued” or “under-appreciated” in private decision makers’ actions. When markets fail, they do not provide the proper signals to adjust current production practices accordingly and they do not inform
2Public goods differ from private goods in many respects. With public goods, the market cannot exclude non-paying consumers from enjoying their provision (non-excludability) and one person’s use of them does not deprive other consumers from using them (non-rivalry). Traditional examples include: public television, national defense, public health programs, public firework displays on the Fourth of July in the United States and to some extent, lighthouses.

2008 GRP Final Benefit-Cost Analysis 3 03/31/2010
consumers of the true nature of the products they are consuming. Without some intervention, or assistance to establish markets or market-like structures, this situation can be expected to have higher rates of agricultural land conversion to inappropriate agricultural and non-agricultural uses than is socially desirable. GRP Description and Features Program Objective The GRP objective is to help landowners and operators restore and protect grassland, including rangeland, pastureland, shrubland, and certain other lands. The program emphasizes support for grazing operations; enhancement of plant and animal biodiversity; and protection of grassland and land containing shrubs and forbs under threat of conversion to cropping, urban development, and other non-grazing uses. Program Overview Under the 2002 Act, the Secretary of Agriculture delegated the authority to administer GRP on behalf of the USDA’s Commodity Credit Corporation (CCC) to NRCS and the Farm Service Agency (FSA). NRCS has the lead responsibility for easements and FSA has the lead responsibility for rental contracts. The Secretary of Agriculture maintained the current delegation of responsibilities subsequent to the 2008 Act. GRP is available nationwide, including the District of Columbia, the Commonwealth of Puerto Rico, Guam, the Virgin Islands, American Samoa, and the Commonwealth of the Northern Marianna Islands. As authorized in the 2002 Act, GRP provides two broad kinds of agreements: long-term easements (a 30-year and a permanent easement) and rental agreements (10-year, 15-year, 20-year, and 30-year rental contracts). For permanent easements, USDA provides a one-time easement payment of the fair-market value, less the grassland value of the land encumbered by the easement. On 30-year easements, USDA provides an easement payment equal to 30 percent of the fair-market value of the land, less the grassland value of the land encumbered by the easement. For both easement options, USDA pays all administrative costs associated with recording the easement, including the appraisal fees, survey costs, title insurance, and recording fees. For rental contracts, USDA provides annual payments in an amount that is not more than 75 percent of the grazing value of the land covered by the contract for the life of the contract. Payments are paid on the contract anniversary date each year. Another GRP feature, restoration agreements, can be incorporated into either easement or rental contracts. Restoration agreements are optional and have not been a major program cost outlay. As was the case under the 2002 Act, under the 2008 Act, the Secretary establishes the criteria to evaluate and rank applications for GRP rental contracts and easements. USDA provides broad national guidelines for establishing State-specific project selection criteria at the State level. The 2008 Act specifies that, in establishing the criteria, the Secretary will emphasize support for:
• Grazing operations; • Plant and animal biodiversity; and

2008 GRP Final Benefit-Cost Analysis 4 03/31/2010
• Grassland, land containing forbs, and shrubland under the greatest threat of conversion to uses other than grazing.
This change in the 2008 Act elevates support for grazing operations while maintaining support for plant and animal biodiversity and grasslands under greatest threat of conversion to uses other than grazing. The 2008 Act Rule Changes to GRP: NRCS incorporates into the Final Rule several changes to GRP implementation in response to mandatory and discretionary provisions in the 2008 Act and in response to changes in policy recommended from the experience gained through implementation of the 2002 Act. The 2008 Act – GRP Statutory Requirements Change in purpose
: The 2008 Act modified GRP’s purpose from “protection, conservation and restoration of grassland resources on private lands,” as stated in the 2002 Act, to “assisting owners and operators in protecting grazing uses and related conservation values by restoring and conserving eligible lands through rental contracts, easements, and restoration agreements.” The program continues to emphasize support for working grazing operations as well as enhancement of grassland functions and values; thus the 2008 Act removed the prohibition on activities that break the soil surface.
Acreage
: The 2008 Act specifies that an additional 1.22 million acres of eligible land shall be enrolled in GRP during fiscal years (FYs) 2009 through 2012. This represents an acreage enrollment rate reduction from the levels authorized in the 2002 Act, which had a two million acre statutory cap for a six-year period versus a 1.22 million acre cap for a four-year period. However, if it is realized, the new cap will result in higher overall cumulative program acreage.
Removal of 30-year easements and 30-year rental contracts
• a 10-year, 15-year, or 20-year rental contract,
: The 2008 Act removes the 30-year rental contract and the 30-year easement enrollment options. Also, the 2008 Act changed the term “rental agreements” to “rental contracts.” Under GRP, as amended by the 2008 Act, the Secretary is authorized to enroll eligible lands in the program through the use of:
• a permanent easement; or, • in a State that imposes a maximum duration for easements, an easement for the maximum
duration allowed under the law of that State. Funding distribution goal
: The 2008 Act sets a goal for NRCS to acquire, to the extent practicable, rental contracts and easements in a way that achieves a goal of 40 percent rental contracts and 60 percent easements by funding totals (the “40-60 percent mix” provision).
Land previously enrolled in the Conservation Reserve Program: The 2008 Act requires the Secretary to place a priority on enrollment of land previously enrolled in the Conservation Reserve Program (CRP), providing the land is eligible as defined by statute and the Secretary determines that the land is of high ecological value and under significant threat of conversion to

2008 GRP Final Benefit-Cost Analysis 5 03/31/2010
uses other than grazing. There is, however, a limit to this enrollment priority; the number of acres shall not exceed ten percent of the total number of acres enrolled in GRP in each calendar year. Expansion of eligible lands
: The 2008 Act expanded the land eligibility criteria to include land historically dominated by grassland, forbs, or shrubland; land containing historical or archaeological resources; and land that addresses issues raised by State, regional, and national conservation priorities. Also, the 2008 Act removed the minimum eligible acreage enrollment of 40 contiguous acres.
Eligible lands are defined by the 2008 Act as private or tribal land that-- (1) is grassland, land that contains forbs, or shrubland (including improved rangeland and
pastureland) for which grazing is the predominant use; (2) is located in an area historically dominated by grassland, forbs, or shrubland, and the
land: (A) could provide habitat for animal or plant populations of significant ecological value
if the land-- (i) is retained in its current use, or (ii) is restored to a natural condition;
(B) contains historical or archaeological resources; or (C) would address issues raised by State, regional, and national conservation priorities;
or (3) is incidental to land described above, if the incidental land is determined by the
Secretary to be necessary for the efficient administration of a rental contract or easement under the program.
Added discretion to include prohibited activities
: The 2008 Act includes “prohibited” as well as “permissible” activities. The Secretary has the discretion to adopt additional provisions as the Secretary determines appropriate to carry out or facilitate the purposes and administration of the program.
Permissible activities include the following: • common grazing practices, including maintenance and necessary cultural practices, on the
land in a manner that is consistent with maintaining the viability of grassland, forb, and shrub species appropriate to that locality;
• haying, mowing, or harvesting for seed production, subject to appropriate restrictions, during the nesting season for birds in the local area that are in significant decline or are conserved in accordance with Federal or State law, as determined by the State Conservationist;
• fire pre-suppression, rehabilitation, and construction of fire breaks; and • grazing-related activities, such as fencing and livestock watering.
Prohibited activities include:
• the production of crops (other than hay), fruit trees, vineyards, or any other agricultural commodity that is inconsistent with maintaining grazing land; and

2008 GRP Final Benefit-Cost Analysis 6 03/31/2010
• except as permitted under a restoration plan, the conduct of any other activity that would be inconsistent with maintaining grazing land enrolled in the program.
Payments
: Several changes were made regarding payments and limitations. The 2008 Act contains separate payment limitations for rental contracts and restoration agreements, a reduction of the maximum allowable cost-share amount to 50 percent for practices implemented through restoration agreements, and a defined fair-market value determination process for easement compensation.
Compensation for easements
• the fair-market value of the land encumbered by the easement, as determined by the Secretary;
: Under the 2008 Act amendments, the Secretary will make easement payments in an amount not to exceed the fair-market value of the land, less the grazing value of the land encumbered by the easement as determined by an appraisal. In determining the compensation for an easement, the Secretary will pay the lowest of:
• the amount corresponding to a geographical cap, as determined by the Secretary in regulations; or
• the offer made by the landowner. Rental contract payment cap
: GRP allows the participant to receive annual payments during the contract term in an amount not to exceed 75 percent of the grazing value of the land covered by the contract. The 2008 Act amendments added a payment limitation specifying that aggregate payments made under one or more rental contracts to a person or legal entity, directly or indirectly, may not exceed $50,000 per year.
The 2008 Act – GRP Discretionary Requirement Cooperative agreements with eligible entities
: GRP allows an agency of State or local government or an Indian tribe, or an eligible non-governmental organization (land trust) to write, own, and enforce GRP conservation easements similar to the Farm and Ranch Lands Protection Program (FRPP). GRP will pay a maximum of 50 percent of the purchase price, which is defined as the fair-market value of the land minus the grazing value. Priority will be given to applications that provide more than 50 percent of the purchase price.
Description of Baseline Conditions Grassland in the United States: Before settlement, grasslands in the United States occupied approximately one billion acres, about one-half the landmass of the contiguous United States. By 1997 approximately 50 percent of these lands had been converted to cropland, urban, and other uses. The remaining 533 million grassland acres continue to be at risk of conversion as population and crop production pressures increase. The expansiveness and many uses and values of grasslands make them economically and environmentally important. Based on U.S. Geological Survey (USGS) estimates (Table 1), the percentage of prairie grasslands lost in selected States is significant.

2008 GRP Final Benefit-Cost Analysis 7 03/31/2010
Table 1. Estimated percentage decline in prairie acreage since 1830, selected States. State Tall Grass Mixed Grass Illinois
Short Grass 99.9 --- ---
Indiana 99.9 --- --- Iowa 99.9 --- --- Kansas 82.6 --- --- Minnesota 99.4 --- --- Missouri 99.5 --- --- Nebraska 98.0 75.3 --- North Dakota 99.9 68.3 --- South Dakota 99.2 70.0 35.0 Texas 90.0 30.5 79.5 Wisconsin 99.9 --- --- Wyoming --- --- 20.0 --- Indicates that the grassland type did not exist in the State. Between 1992 and 1997, about 24 million acres (4.6 percent) of grasslands were converted to cropland or non-agricultural uses such as development. However, because cropland, forestland, and other lands are converted to grassland, the net change in grassland is less. Between 1992 and 1997, net grassland loss totaled about 5.5 million acres or 1.1 percent of the remaining grassland (USDA, NRCS 1997). Past trends and current resource conditions suggest a need to preserve grasslands to capture the benefits described in this analysis. Analytical Model Model Assumptions Given the current backlog of GRP applicants, full producer participation is expected up to the acreage constraint mandated in the 2008 Act (an additional 1.22 million acres over the period FY 2009 through FY 2012). In implementing GRP, USDA is charged with “protecting and restoring eligible grasslands through easement purchases and rental contracts with private landowners and operators.” As authorized and funded by Congress, GRP is for a national program; this analysis therefore evaluates the potential costs and benefits at a broad scale. Environmental, economic, and social costs and benefits are identified for the land user, the government, and the general public. The analysis is then used in determining whether the benefits of implementing GRP contracts outweigh the program costs.

2008 GRP Final Benefit-Cost Analysis 8 03/31/2010
Expected Producer Costs Producer costs are expected to be minimal, consisting primarily of the time and effort in developing and following a grazing management plan, including time for plan development, record keeping, and implementation. It is assumed that most landowners already have grazing plans and simply need to document their activities to meet program requirements and improve their likelihood for funding. Program Costs for the Government and Social Costs The number of easement and rental contracts finalized during the period FY 2003 through FY 2007 totaled nearly 2,900 (Table 2). The associated financial assistance (FA) costs for these contracts were over $140 million. Based on historical records and discussions with program personnel, the corresponding amount of money spent on technical assistance (TA) was calculated based on seven percent of annual FA. Thus total government cost for GRP is estimated to be $150.6 million for the period FY 2003 through FY 2007. Table 2. Selected GRP performance and cost summary, FYs 2003–2007. ACRES Number of Number Acreage
ASSOCIATED COSTS
$/Acre/Year
Contracts of Acres Percent Obligations $/Contract FA 30-year Easement 22 9,785 1.4% $4,000,000 $181,818 $409 $416
FA+TA
Permanent Easement 222 105,563 15.6% $46,000,000Sub-total Easements 244 115,348 17.0% $50,000,000 $204,918 $433 $441
$207,207 $436 $443
10-year Contract 1,766 312,625 46.2% $37,373,936 $21,163 $120 $139 15-year Contract 320 80,117 11.8% $12,480,565 $39,002 $156 $169 20-year Contract 259 79,308 11.7% $15,570,222 $60,117 $196 $208 30-year Contract 287 89,973 13.3% $25,324,789Sub-total Contracts 2,632 562,023 83.0% $90,749,512 $34,479 $161 $178
$88,240 $281 $292
Total – FA 2,876 677,371 100.0% $140,749,512 $48,939 $208 N/A
Total – TA $ 9,852,466
Grand Total–FA+TA $150,601,978 N/A N/A $222
N/A N/A N/A
Costs borne by society at large (excluding the producer costs discussed above) include partner-supplied forms of assistance, such as technical assistance, financial assistance, and use of their equipment. Partners include public agencies, non-profit organizations, and corporate and other private entities. Another potential cost is that restricting land use changes could reduce the tax base and discourage local economic development. However, the analysis assumes that future economic activity would move to a more suitable location, perhaps a renovated urban area, and that the opportunity cost of less local economic activity is offset by reduced need for public infrastructure.

2008 GRP Final Benefit-Cost Analysis 9 03/31/2010
Expected Ecological and Economic Benefits Direct and Indirect Beneficial Effects – Qualitative Discussion Ecological benefits are hard to measure because variables making up the ecology are often inter-related. Improvements to one function often affect other functions in non-evident ways and can take years or even decades to aggregate or appear. Four inherent grassland characteristics make estimating their benefits especially difficult. First, each grassland has unique characteristics with their own unique set of values. Second, even though some characteristics may be clearly identified, quantifying the beneficial effect may be problematic. Third, because grasslands also help maintain water quality on lands not enrolled in GRP and air quality, fully accounting for all benefits is difficult. Finally, problems associated with identifying specific bio-geochemical grassland benefits and the difficulty in assigning monetary values to these non-market goods and services make it extremely difficult to evaluate using strict monetary benefit-cost techniques. However, whether or not the benefits of grassland can be adequately quantified, their importance is still recognized.
Benefits of Delaying or Preventing Grassland Conversion
Much of the ecological benefit derived from GRP stems from the value society places on delaying grassland conversion. Care must be taken in attributing these benefits to land solely because it is enrolled in GRP. If GRP enrollment simply results in the conversion of non-enrolled grasslands to other uses, then little is accomplished. On the other hand, if grasslands with unique and highly valued qualities (e.g., native grasslands, including native prairie) are enrolled and protected from conversion, GRP enrollments can provide significant ecological benefits. Native grasslands are variable in their quality and characteristics, ranging from virgin prairie to heavily grazed rangeland. By identifying and selecting ecologically significant and unique grasslands, GRP can secure many of the environmental benefits that grasslands provide. Converting cropland to permanent vegetation provides many soil, wildlife habitat, and water and air quality benefits. For each year that grassland is not converted to development or more intensive agricultural use, these benefits are maintained. While GRP enrollment may be targeted to lands threatened with conversion, it is difficult to determine whether conversion is actually delayed or prevented. The environmental benefits are discussed in detail below. Intergenerational Wealth Transfer
: Agricultural easements represent an intergenerational transfer of economic and environmental wealth. Lump-sum payments to compensate current landowners for relinquishing their development rights benefit future generations of farmers and ranchers because these parcels of land will never face development pressures; the current generation is thus bestowing financial benefits to future generations. These benefits include possibly lower land prices (and the possibility of profiting from even higher land values in the future) in exchange for never being able to use that value to raise capital or when land is re-sold.

2008 GRP Final Benefit-Cost Analysis 10 03/31/2010
Displacement Effect:
It is difficult to say with certainty whether greater net benefits are generated for the national economy and the environment with or without the actions of agricultural easements. The essence of this argument is, “Does the effect of agricultural easements simply force development pressures to go elsewhere at even greater economic and environmental costs?” Indirectly, consumers in both the current and future generations gain in potentially lower food prices and lower resource intensity because the relative price for one agricultural input (land) is effectively lowered – through the actions of the current generation. To the extent that agricultural easements bolster local actions to preserve such amenities (or in areas where no other means are available), they are probably beneficial.
Location-specific Benefits
: The main benefits from grassland retention are those mentioned in the rationale for the rule, that is, the benefits from: 1) open space in and around metropolitan areas; and 2) the continued provision of ecological goods and services derived from the particular operation. These benefits are location specific; they accrue to society indirectly and are difficult to quantify compared to direct-use benefits whose value is readily observable in the sale of agricultural products and other traded outputs (e.g., fees from hunting and fishing). In addition, land retention programs such as GRP preserve current land use patterns and can maintain a core of agricultural activities vital to many small communities to sustain their economies and their identities.
NRCS Role in GRP Easements
: Landowners with easements can invest more in their agricultural operations. Surveys indicate that producers who have easement-protected lands reinvest at least some of the easement payments into their operations, such as paying off mortgages or loans, purchasing equipment, improving buildings, and/or spending money on other farm business purposes. For example, in an evaluation of one federal easement program, “sixty nine percent of the respondents said that they spent most of their proceeds on agricultural expenses or spent as much on farm business-related items as on personal or household needs” (AFT 2006). In addition to providing an opportunity for participants to re-invest in farm operation, current and new agricultural producers may be able to purchase land in the future at a somewhat lower price. Older landowners will stay on the land longer and transfer knowledge, skills, and innovation to the next generation of farmers. Lands under easements help secure any NRCS investments in conservation practices that were implemented as part of other NRCS conservation programs. Finally, NRCS assistance in these efforts can supplement or leverage the funds of others, including producers and other entities, in their preservation efforts.
Environmental Benefits
Participants are required to implement and maintain an NRCS-approved conservation plan on grasslands enrolled in GRP. Conservation plans improve grassland management by enhancing infiltration, reducing soil erosion, increasing carbon sequestration, and reducing water runoff. Infiltration: Higher water infiltration rates could be the most important ecological benefit from improved grazing land management. Infiltration is determined by soil structure, amount of cover, and type of cover. Higher water infiltration rates improve forage production and site ecology and contribute to the recharge of underground aquifers and above-ground springs.

2008 GRP Final Benefit-Cost Analysis 11 03/31/2010
Before and after infiltration rates for six different regions including pasture lands were used to calculate a weighted average of 2.58 acre-inches per year (Spaeth 2000; Namken 2002. Soil Erosion
: Improved grazing management reduces average soil erosion 0.69 ton per acre per year (Spaeth 2000). Additional erosion reductions result if GRP prevents grassland conversion to cropland.
Carbon Sequestration
: Improved grassland management can increase carbon sequestration. Data indicate that an additional 0.11 tons of carbon per acre per year is sequestered (Follett, et al. 2000; Namken 2002).
Runoff
: The amount of grassland runoff generally declines if forage is in better condition. Average runoff reduction was estimated to be 2.58 acre-inches per year (Namken 2002). Less runoff increases water infiltration, enhancing forage production, aquifer recharge, and spring water production. Less runoff also means less erosion and sediment in the rivers and streams, improved water quality, enhanced recreational opportunities downstream, less reservoir silting, and reduced dredging.
Forage Production Benefits
Modification of grazing practices can often increase forage production. Research by the USDA Agricultural Research Service (Spaeth 2000) found that improved grassland management could provide an estimated 1,013 additional pounds of forage per acre per year. This translates into about 1.3 animal unit months per acre.
Wildlife Benefits
Slowing the loss of grassland habitats helps reduce the precipitous decline of wildlife species. Grasslands provide forage and habitat for many wildlife species, including declining populations of native-grassland-dependent birds and mammals such as the greater sage grouse and black-tailed prairie dog, whose declines have paralleled the overall decline in native grassland habitat (Mac 1998). In addition to sage grouse, other endemic grassland bird species showing significant declines include prairie chickens, mountain plover, western meadowlark, and ferruginous hawk. Prairie dogs, an indicator species for reduced grassland biodiversity, have declined an estimated 98 percent since settlement in the United States. The Conservation Reserve Program is estimated to provide annual wildlife-related benefits of $30 per acre (USDA, FSA 2003).
Recreational Benefits
In addition to providing livestock and wildlife forage, grasslands generate income for landowners who lease their acreage for hunting, fishing, wildlife observation, and other recreational activities. Improved management that increases forage production can benefit wildlife populations on participating acreage. Decreased runoff from maintaining grass cover results in decreased sedimentation which benefits downstream water quality and produces on- and off-site recreational benefits.

2008 GRP Final Benefit-Cost Analysis 12 03/31/2010
Direct and Indirect Beneficial Effects: Quantitative Discussion The benefits of protecting and restoring grasslands through easement purchases and rental contracts are variable among locations and often difficult to measure. It is also difficult to place a monetary value on many environmental and social benefits. However, it is possible to place a dollar value on improved forage production, wildlife habitat, and carbon sequestration. Table 3 summarizes the monetary value of benefits for GRP assumed in this analysis, and the following sections discuss how they were estimated. Table 3. Selected benefits from GRP.
Benefit Category
Source of Benefit Benefit per unit
(2007 dollars)
Citation
Grazing land productivity*
Productivity increase with grazing management plan.
$12.94 per acre per year Namken and Flanagan 2000
Wildlife habitat* Use value (improved wildlife viewing and improved pheasant hunting).
$10.65 per acre per year Feather et al. 1999
Carbon sequestration
Additional carbon sequestered, based on Chicago Climate Exchange (CCX) carbon credit values.
$0.47 per acre per year NRCS
Total Monetary Benefits: $24.06 per acre per year
*Seventy-five percent of the estimated benefits are credited to GRP, as GRP lands are working lands and most studies involved benefits derived from retiring lands.
Grazing land productivity
A grazing management plan was not required for GRP during the period FY 2003 through FY 2007, although a conservation plan was required. However, most land under a GRP contract had a minimal level of grazing and wildlife management, as a result of the landowner working closely with NRCS technical specialists that resulted in increased forage production. Namken and Flanagan (2000) report that typical grazing land conservation practices increase productivity by an average of 1.3 animal unit months (AUMs) per acre per year, with each AUM valued at $11.10, equivalent to $14.43 per acre. For this analysis, the $14.43 value was updated for 2007, resulting in a grazing land productivity benefit of $17.25 per acre per year. Namken and Flanagan, like most other studies, address benefits derived from retired lands. Because GRP lands are working land, this analysis assumes that the changes in the 2008 Act requiring a grazing plan and emphasizing increased productivity will yield a productivity benefit of $12.94 per acre per year (75 percent of the value found in the literature).

2008 GRP Final Benefit-Cost Analysis 13 03/31/2010
Wildlife habitat
GRP keeps grazed land available for wildlife habit. A great deal has been written about the values of wildlife conservation (Gibilisco and Filipek 1998). The 2006 National Survey of Fishing, Hunting, and Wildlife-Associated Recreation conducted by the U.S. Fish and Wildlife Service contains extensive data on consumer expenditures relating to wildlife-based activities (USDOI, USFWS 2007). For this analysis, benefits are calculated based on an Economic Research Service (ERS) model that calculated the environmental benefits for CRP based on the value of using the resource (Feather et al. 1999). Specifically, benefits are calculated for wildlife viewing and pheasant hunting. The ERS model evaluated the quantity and quality of the cover available for specific avian species, and then estimated the surplus resulting from converting land to CRP. Since establishing grassland or forest cover creates suitable habitat for small and large birds, game hunters and wildlife viewers benefit from these increased populations (Feather et al., p. 10). The model also incorporated travel costs, landscape diversity, and population density. The benefits resulting from GRP are similar to those resulting from CRP. For example, CRP land is retired from production and planted into grass and forbs. GRP land either remains in grass and forbs or is restored to grass and forbs. Even though it may be grazed, it is still available for wildlife. The minimum contract lengths for both programs are similar. This analysis of the annual benefits from improved wildlife habitat started with the two components of the CRP study: improved wildlife viewing ($10.02 per acre) and improved pheasant hunting ($2.36 per acre). These combined benefit estimates ($12.38) were reduced 25 percent (to $9.29 per acre) to account for factors such as expected lower per-acre benefits on GRP working lands than on CRP retired lands, different spatial proximity of GRP lands than CRP lands, longer contract length, etc. Adjusting the value from 2002 to 2007, the resulting benefit from GRP is $10.65 per acre. The benefit is based on expenditure or use data for the identified recreational purposes (wildlife viewing and pheasant hunting) and the surplus resulting from GRP. Other recreational activities such as nature walking or big game hunting are not covered. In addition, non-use values are not quantified, nor is an environmental resource that is not currently used, for example, bequest value or option value (Smith 1996).
Carbon sequestration
The value of carbon benefits are based on the “social cost of carbon” as discussed in the “Technical Support Document on Benefits of Reducing GHG Emissions” (EPA 2008). Wildlife habitat and range improvement practices are expected to increase carbon sequestration. Also, residue and tillage practices associated with erosion control are expected to reduce oxidation of carbon from cropland, and in some cases actually increase carbon sequestration on those lands as well.

2008 GRP Final Benefit-Cost Analysis 14 03/31/2010
For the purposes of this analysis, USDA utilizes the three percent discount rate mid-range domestic estimate of the social cost of carbon of $2.00 per metric ton,3
which yields a value per acre of carbon sequestration of $0.47 per acre per year.
Benefit Transfer Values Used in this Analysis: All GRP contracts and easements will include an on-site environmental evaluation and a grazing management plan that integrate economic, social, and ecological considerations to meet private and public needs. The expected effects of a conservation plan are assessed in the context of ecological, economic, and social considerations as documented in the relevant local Field Office Technical Guide (FOTG). The expected impacts of those effects on natural resource quality, economic needs, and social objectives are then used to help develop and evaluate individual management alternatives on each farm/ranch. This approach enables USDA to enhance the program's ability to address national grassland resource concerns and enables States to address unique grassland concerns within the context of a specific grassland ecosystem within their State. The efforts above, plus the fact that GRP retains the current “benefits kept in place” supports the assumption that some additional environmental benefits can accrue to existing grazing lands as a result of landowners entering into easement and rental contracts with NRCS. The analysis assumes the following: 1) lands realize a 75 percent gain in grazing land productivity ($12.94); 2) a 75-percent gain in wildlife habitat improvement ($10.65); and 3) carbon sequestration increases by a small amount ($0.47). Discounting the Flow of Costs and Benefits over Time Discounting the benefits and costs reduces the desirability of longer-term easements in favor of shorter-term contracts due to the high “up-front” costs of longer-term contracts and the long-term flow of benefits whose values are sensitive to the discount rate selected. This is especially evident in GRP, where the only costs considered are the government outlays related to the initial GRP payment while benefits accrue over time. Other costs associated with GRP land are assumed to be the same as if the land was not enrolled in GRP. This effect can be easily seen in all the scenarios presented in this analysis. Although discounting puts the longer-term contracts at an economic disadvantage, long-term contracts have the non-quantified benefit of added assurance that the land will remain in a GRP easement. Table 4 shows the value of per-acre costs and benefits applied to the various kinds of easement and rental contracts, both undiscounted and discounted. These values will be applied to total acreage and acreage composition assumptions in the various scenarios presented below. The impact of discounting— especially at seven percent—is evident on the net benefits produced when the policy scenario consists of a high proportion of permanent easements. This “penalty” is a common theme in the analysis and frequently noted in the discussion. These negative returns on permanent easements need to be weighed against the added assurance they provide compared with shorter-term easements and rental contracts. 3This $2.00 estimate varied from $7 to $0 per to, using a 2 and 7 percent discount rate (EPA 2008, p. 12). Given the relatively high degree of uncertainty surrounding this estimate and its relatively small impact on the benefit transfer values used in this analysis, the $2 per ton estimate was used in both the three and seven percent discount rate scenarios.

2008 GRP Final Benefit-Cost Analysis 15 03/31/2010
Table 4. Present value of estimated annual benefits and costs per acre. Undiscounted Discounted at 3% Discounted at 7%
Benefits on a per -acre basis1
30-year Easement $721.80 $471.59 $298.56
Permanent Easement2 $1,203.00 $619.06 $332.05
10-year Contract $240.60 $205.24 $168.99
15-year Contract $360.90 $287.23 $219.14
20-year Contract $481.20 $357.95 $254.89
30-year Contract $721.80 $471.59 $298.56
Costs on a per-acre basis3
30-year Easement $416.00 $403.88 $388.79
Permanent Easement2 $443.00 $430.10 $414.02
10-year Contract $139.00 $134.95 $129.91
15-year Contract $169.00 $164.08 $157.94
20-year Contract $208.00 $201.94 $194.39
30-year Contract $292.00 $283.50 $272.90
Net Benefits on a per-acre basis
30-year Easement $305.80 $67.70 –$90.22
Permanent Easement2 $760.00 $188.96 –$81.97
10-year Contract $101.60 $70.29 $39.08
15-year Contract $191.90 $123.15 $61.19
20-year Contract $273.20 $156.01 $60.50
30-year Contract $429.80 $188.09 $25.66 1Benefits are derived from $24.06 per acre annual stream of environmental benefits (see Table3). 2Permanent easement costs and benefits assume a 50-year stream of events. 3Costs include both financial and technical assistance costs associated with GRP over fiscal years 2003 through 2007 (see Table 2).
GRP Policy Scenarios Considered Two baselines were considered in this analysis. Baseline One assumes that no changes are made to GRP, with both program features and acreage levels continued at pre-2008 Act levels. Baseline Two assumes that all program and acreage changes mandated in the 2008 Act are implemented.

2008 GRP Final Benefit-Cost Analysis 16 03/31/2010
Against these baseline scenarios, two policy scenarios are considered. Policy Scenario One examines the impact of the expanded acreage targets in the 2008 Act without the program changes. Policy Scenario Two examines the impact of the program changes mandated in the 2008 Act without expanded acreage targets (i.e., using fiscal year 2007 acreage levels). Table 5 summarizes the baseline and policy scenarios. Table 5. Summary of varying assumptions in GRP baseline and policy scenarios. Baseline / Policy Scenar io Descr iption of Baseline / Policy Scenar io Baseline One
Information for FY 2009–FY 2012 GRP policy remains unchanged and acreage continues at FY 2007 acreage levels through FY 2009–FY 2012, that is, no action is taken on the 2008 Act GRP changes.
Baseline of pre-2008 program.
Policy Scenario One
GRP policy remains unchanged, but acreage increases during FY 2009 through FY 2012 to reflect the acreage goal levels in the 2008 Act.
Outcomes given the 2008 Act GRP acreage goals using “Baseline one” program provisions (pre-2008 program).
Baseline Two Full implementation of the GRP policy and acreage changes in the 2008 Act.
Outcomes given full implementation of the 2008 Act.
Policy Scenario Two
Implementation of the GRP policy changes in the 2008 Act, but funding/acreage goals set at FY 2007 acreage levels for the period FY 2009 through FY 2012.
Outcomes given the 2008 Act GRP statutory provisions with previous acreage goals.
Baseline One – No Action on the 2008 Act GRP Changes The no-action scenario involves not proceeding with implementation of the program changes to GRP required by Congress in the 2008 Act, i.e., maintaining existing contracts signed during the period FY 2003 through FY 2007 (a five-year period) and obligating new contracts at the FY 2007 annual acreage rate during the period FY 2009 through FY 2012 (a four-year period). This scenario provides a baseline against which to compare program changes and acreage goals set out in the 2008 Act. The expected annual and cumulative acreage increases during FY 2009 through FY 2012 under these assumptions are given in Table 6.

2008 GRP Final Benefit-Cost Analysis 17 03/31/2010
Table 6. Baseline One – Annual and cumulative acreage changes.
FY 2009 FY 2010 FY 2011 FY 2012
FY 2009–FY 2012
- - - - - - - - - - - - - - - - - - - - - - - - Acres - - - - - - - - - - - - - - - - - - - - - - - - 30-year Easement 1,957 1,957 1,957 1,957 7,828 Permanent Easement 21,113 21,113 21,113 21,113 Sub-Total – Easements
84,452 23,070 23,070 23,070 23,070 92,280
10-year Contract 62,525 62,525 62,525 62,525 250,100 15-year Contract 16,023 16,023 16,023 16,023 64,092 20-year Contract 15,862 15,862 15,862 15,862 63,448 30-year Contract 17,995 17,995 17,995 17,995 Sub-Total – Contracts
71,980 112,405 112,405 112,405 112,405 449,620
Total 135,475 135,475 135,475 135,475 541,900 Baseline One – Costs
:
Total obligations over the FY 2009–FY 2012 period are estimated at almost $120.5 million covering nearly 542,000 acres (Table 7). All costs are expressed in constant 2007 dollars except where they are discounted at three or seven percent. Table 7. Baseline One – Cost estimates, annual and cumulative, FY 2009–FY2012.
PROGRAM COSTS
Type of Easement Acres/Year Undiscounted Discounted
at 3% Discounted
at 7%
30-year Easement 1,957 $814,112 $790,400 $760,852 Permanent Easement 21,113 $9,353,059 $9,080,640 Sub-Total – Easements
$8,741,177 23,070 $10,167,171 $9,871,040 $9,502,029
10-year Contract 62,525 $8,690,975 $8,437,840 $8,122,407 15-year Contract 16,023 $2,707,887 $2,629,017 $2,530,736 20-year Contract 15,862 $3,299,296 $3,203,200 $3,083,454 30-year Contract 17,995 $5,254,540 $5,101,495 Sub-Total – Contracts
$4,910,785 112,405 $19,952,698 $19,371,551 $18,647,381
Annual Totals 135,475 $30,119,869 $29,242,591 $28,149,410 Cumulative Totals for FY 2009–2012
541,900 $120,479,476 $116,970,365 $112,597,641
Note: Costs are calculated by multiplying the acreage associated with each type of contract by the assumed costs listed in Table 4.

2008 GRP Final Benefit-Cost Analysis 18 03/31/2010
Baseline One – Total and Net Benefits
:
Table 8 shows the total program benefits, calculated by multiplying the per-acre annual benefits in Table 4 by the acreage in Table 6. Because benefits are a function of the length of each contract and its contract life, benefits are highly sensitive to the discount rate used, especially in the case of permanent easements. With the seven percent discount rate, total benefits generated from permanent easements are actually negative. The net benefits shown in Table 9 represent the difference between the annualized costs of the program (Table 7) and the annualized benefits (Table 8). These net benefit results suggest that increased federal government outlays for GRP, even without the program changes in the 2008 Act, produce positive net benefits in the aggregate. Because of the higher “up-front” costs of permanent easements in light of a long expected stream of relatively low annual benefits, the impact of the discount rate is very noticeable in the case of permanent easements. Table 8. Baseline One – Benefit estimates, annual and cumulative, FY 2009–FY2012.
PROGRAM BENEFITS
Type of Easement Acres/Year Undiscounted
Discounted at 3%
Discounted at 7%
30-year Easement 1,957 $1,412,563 $992,895 $584,285 Permanent Easement 21,113 $25,398,939 $13,070,174 Sub-Total – Easements
$7,010,486 23,070 $26,811,502 $13,993,069 $7,595,771
10-year Contract 62,525 $15,043,515 $12,832,423 $10,565,935 15-year Contract 16,023 $5,782,701 $4,602,234 $3,511,223 20-year Contract 15,862 $7,632,794 $5,677,835 $4,043,097 30-year Contract 17,995 $12,988,791 $8,486,201 Sub-Total – Contracts
$5,372,615 112,405 $41,447,801 $31,598,694 $23,492,870
Annual Totals 135,475 $68,259,303 $45,591,763 $31,087,641 Cumulative Totals for FY 2009–2012
541,900 $273,037,211 $182,367,051 $124,350,563
Note: Benefits are calculated by multiplying the acreage associated with each type of contract by the value of the estimated benefits listed in Table 4.
2008 GRP Final Benefit-Cost Analysis 19 03/31/2010
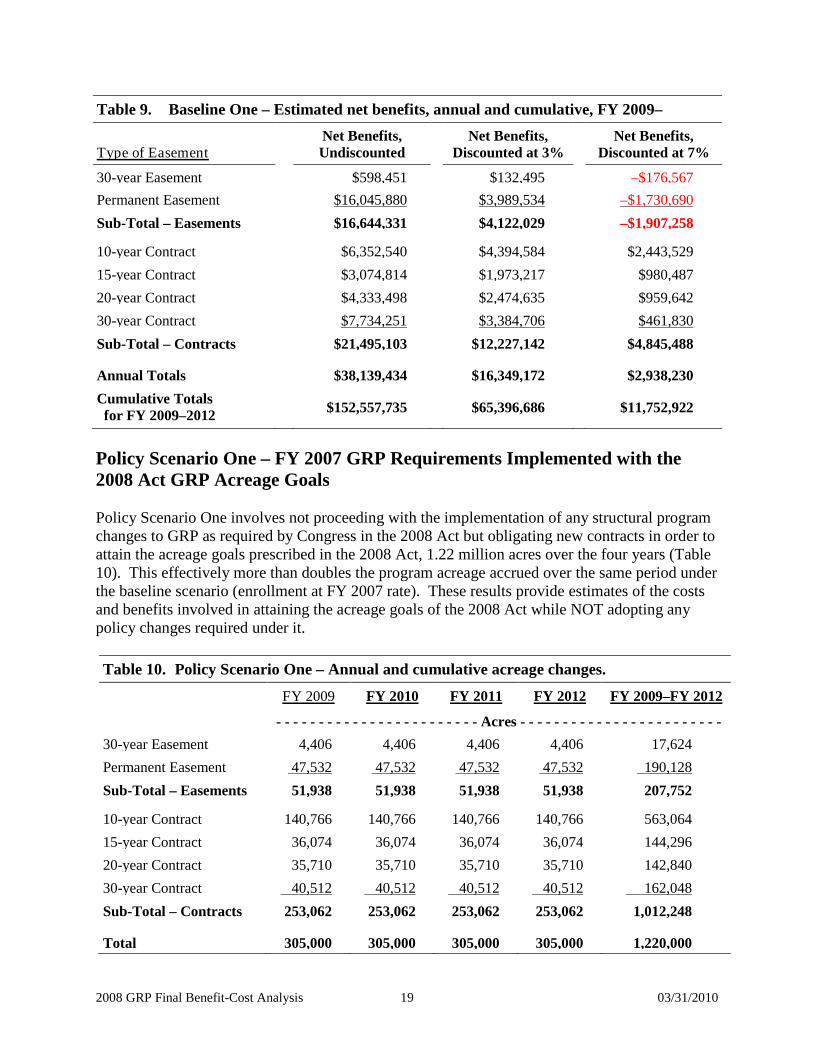
Table 9. Baseline One – Estimated net benefits, annual and cumulative, FY 2009–
Type of Easement Net Benefits, Undiscounted
Net Benefits, Discounted at 3%
Net Benefits, Discounted at 7%
30-year Easement $598,451 $132,495 –$176,567 Permanent Easement $16,045,880 $3,989,534 Sub-Total – Easements
–$1,730,690 $16,644,331 $4,122,029 –$1,907,258
10-year Contract $6,352,540 $4,394,584 $2,443,529 15-year Contract $3,074,814 $1,973,217 $980,487 20-year Contract $4,333,498 $2,474,635 $959,642 30-year Contract $7,734,251 $3,384,706 Sub-Total – Contracts
$461,830 $21,495,103 $12,227,142 $4,845,488
Annual Totals $38,139,434 $16,349,172 $2,938,230 Cumulative Totals for FY 2009–2012
$152,557,735 $65,396,686 $11,752,922
Policy Scenario One – FY 2007 GRP Requirements Implemented with the 2008 Act GRP Acreage Goals Policy Scenario One involves not proceeding with the implementation of any structural program changes to GRP as required by Congress in the 2008 Act but obligating new contracts in order to attain the acreage goals prescribed in the 2008 Act, 1.22 million acres over the four years (Table 10). This effectively more than doubles the program acreage accrued over the same period under the baseline scenario (enrollment at FY 2007 rate). These results provide estimates of the costs and benefits involved in attaining the acreage goals of the 2008 Act while NOT adopting any policy changes required under it. Table 10. Policy Scenario One – Annual and cumulative acreage changes.
FY 2009 FY 2010 FY 2011 FY 2012
FY 2009–FY 2012
- - - - - - - - - - - - - - - - - - - - - - - - Acres - - - - - - - - - - - - - - - - - - - - - - - - 30-year Easement 4,406 4,406 4,406 4,406 17,624 Permanent Easement 47,532 47,532 47,532 47,532 Sub-Total – Easements
190,128 51,938 51,938 51,938 51,938 207,752
10-year Contract 140,766 140,766 140,766 140,766 563,064 15-year Contract 36,074 36,074 36,074 36,074 144,296 20-year Contract 35,710 35,710 35,710 35,710 142,840 30-year Contract 40,512 40,512 40,512 40,512 Sub-Total – Contracts
162,048 253,062 253,062 253,062 253,062 1,012,248
Total 305,000 305,000 305,000 305,000 1,220,000

2008 GRP Final Benefit-Cost Analysis 20 03/31/2010
Policy Scenario One – Costs
:
Using the assumptions related to per-acre costs from Table 4, the more-than doubling of program acres implies that obligations under Policy Scenario One would grow to be over $271 million (in constant 2007 dollars) meeting the acreage goal of 1.22 million acres over the FY 2009-FY 2012 period (Table 11). Table 11. Policy Scenario One – Cost estimates, annual and cumulative, FY 2009–FY2012.
PROGRAM COSTS
Type of Easement Acres/Year Undiscounted
Discounted at 3%
Discounted at 7%
30-year Easement 4,406 $1,832,896 $1,779,511 $1,712,987 Permanent Easement 47,532 $21,056,676 $20,443,375 Sub-Total – Easements
$19,679,136 51,938 $22,889,572 $22,222,885 $21,392,123
10-year Contract 140,766 $19,566,474 $18,996,577 $18,286,424 15-year Contract 36,074 $6,096,506 $5,918,938 $5,697,669 20-year Contract 35,710 $7,427,680 $7,211,340 $6,941,757 30-year Contract 40,512 $11,829,504 $11,484,955 Sub-Total – Contracts
$11,055,611 253,062 $44,920,164 $43,611,810 $41,981,462
Annual Totals 305,000 $67,809,736 $65,834,695 $63,373,585 Cumulative Totals for FY 2009–2012
1,220,000 $271,238,944 $263,338,781 $253,494,340
Note: Costs are calculated by multiplying the acreage associated with each type of contract by the assumed costs listed in Table 4. Policy Scenario One – Total and Net Benefits
:
The acreage increase implied in Policy Scenario One applied to the per-acre benefit estimate in Table 4 yields nearly $614.7 million in benefits (Table 12); this is more than double the $273 million in Baseline One” (both in constant 2007 dollars). Table 13 shows the net benefits, arrived at by subtracting total costs (Table 11) from total benefits (Table 12). As discussed earlier, and as Table 13 illustrates, discounting the future stream of benefits shows reduced benefits for longer-term easements.

2008 GRP Final Benefit-Cost Analysis 21 03/31/2010
Table 12. Policy Scenario One – Benefit estimates, annual and cumulative, FY 2009–FY2012. PROGRAM BENEFITS
Type of Easement Acres/Year Undiscounted
Discounted at 3%
Discounted at 7%
30-year Easement 4,406 $3,180,251 $2,077,811 $1,315,462 Permanent Easement 47,532 $57,180,996 $29,425,071 Sub-Total – Easements
$15,782,808 51,938 $60,361,247 $31,502,881 $17,098,270
10-year Contract 140,766 $33,868,300 $28,890,347 $23,787,676 15-year Contract 36,074 $13,019,107 $10,361,417 $7,905,127 20-year Contract 35,710 $17,183,652 $12,782,468 $9,102,193 30-year Contract 40,512 $29,241,562 $19,104,917 Sub-Total – Contracts
$12,095,325 253,062 $153,673,867 $71,139,148 $52,890,321
Annual Totals 305,000 $153,673,867 $102,642,029 $69,988,591 Cumulative Totals for FY 2009–2012
1,220,000 $614,695,466 $410,568,116 $279,954,365
Note: Benefits are calculated by multiplying the acreage associated with each type of contract by the value of the estimated benefit listed in Table 4. Table 13. Policy Scenario One – Estimated net benefits, annual and cumulative, FY 2009–
FY2012.
Type of Easement Net Benefits, Undiscounted
Net Benefits, Discounted at 3%
Net Benefits, Discounted at 7%
30-year Easement $1,347,355 $298,300 –$397,525 Permanent Easement $36,124,320 $8,981,696 Sub-Total – Easements
–$3,896,328 $37,471,675 $9,279,996 –$4,293,853
10-year Contract $14,301,826 $9,893,770 $5,501,252 15-year Contract $6,922,601 $4,442,479 $2,207,458 20-year Contract $9,755,972 $5,571,128 $2,160,436 30-year Contract $17,412,058 $7,619,962 Sub-Total – Contracts
$1,039,714 $48,392,456 $27,527,338 $10,908,859
Annual Totals $85,864,131 $36,807,334 $6,615,006 Cumulative Totals for FY 2009–2012
$343,456,522 $147,229,336 $26,460,025

2008 GRP Final Benefit-Cost Analysis 22 03/31/2010
Baseline Two – Full Implementation of the 2008 Act GRP Requirements The Baseline Two scenario involves implementing GRP according to the program and acreage statutory requirements that Congress has placed on the program and the Final Rule developed by NRCS. This scenario incorporates the provisions that 30-year easements and 30-year contracts are no longer available and that 40 percent of the funding will be allocated to rental contracts and 60 percent to permanent easements (the 40-60 rental-easement mix), to the extent practicable. NRCS will promulgate the Final Rule at the national level to ensure consistency of program implementation across the nation. As such, it is assumed that the initial acreage distribution would be the same as under Policy Scenario One if the 40-60 rental-easement mix provision was not followed. Against that backdrop, one then must then make assumptions about how the acreage that would have been enrolled in 30-year contracts and 30-year easements will be allocated across the other contract types. In constructing the scenario, all of the 30-year contracts and 30-year easements initially were placed in the 20-year contract category on the assumption that participants prefer long-term arrangements and that the 20-year contract is the only alternative to the 30-year contract or 30-year easement that are no longer available to them. This placement of this acreage resulted in an annual rental-easement mix of 85-15 for program acreage and 65-35 for program obligations, far short of the goal of 60 percent for permanent easements. To move to an allocation solution that produces a 40-60 rental-easement mix, program enrollments need to move away from the apparently higher-cost rental contracts (long-term) to lower-cost rental contracts (short-term) to offset the higher-cost permanent easements. This movement is necessary to satisfy the 40-60 rental-easement mix while keeping overall program costs as low as possible. Nearly 45,000 acres (that formerly would have been enrolled in either a 30-year contract or a 30-year easement) need to move into the permanent easement category or short-term contracts. A feasible solution was found and resulted in the acreage shifts depicted in Table 14. This represents an annual rental-easement mix of 67-33 for program acreage, but is very close to the 40-60 rental-easement mix for program obligations, thus meeting the requirements of the 2008 Act.

2008 GRP Final Benefit-Cost Analysis 23 03/31/2010
Table 14. Baseline Two – Annual and cumulative acreage changes.
FY 2009 FY 2010 FY 2011 FY 2012
FY 2009–FY 2012
- - - - - - - - - - - - - - - - - - - - - - - - Acres - - - - - - - - - - - - - - - - - - - - - - - - 30-year Easement 0 0 0 0 0 Permanent Easement 100,000 100,000 100,000 100,000 Sub-Total – Easements
400,000 100,000 100,000 100,000 100,000 400,000
10-year Contract 140,000 140,000 140,000 140,000 560,000 15-year Contract 25,000 25,000 25,000 25,000 100,000 20-year Contract 40,000 40,000 40,000 40,000 160,000 30-year Contract 0 0 0 0 Sub-Total – Contracts
0 205,000 205,000 205,000 205,000 820,000
Total 305,000 305,000 305,000 305,000 1,220,000 Baseline Two – Costs
:
The per-acre cost was assumed to remain at the same levels as contracts made in the FY 2003–FY 2007 period. Thus the estimated costs for Baseline Two shown in Table 15 in constant 2007 dollars and discounted were determined by multiplying the per-acre costs in Table 4 by the acreage assumed in this scenario (Table 14).

2008 GRP Final Benefit-Cost Analysis 24 03/31/2010
Table 15. Baseline Two – Cost estimates, annual and cumulative, FY 2009–FY2012. PROGRAM COSTS
Type of Easement Acres/Year Undiscounted
Discounted at 3%
Discounted at 7%
30-year Easement 0 $0 $0 $0 Permanent Easement 100,000 $44,300,000 $43,009,709 Sub-Total – Easements
$41,401,869 100,000 $44,300,000 $43,009,709 $41,401,869
10-year Contract 140,000 $19,460,000 $18,893,204 $18,186,916 15-year Contract 25,000 $4,225,000 $4,101,942 $3,948,598 20-year Contract 40,000 $8,320,000 $8,077,670 $7,775,701 30-year Contract 0 $0 $0 Sub-Total – Contracts
$0 205,000 $32,005,000 $31,072,816 $29,911,215
Annual Totals 305,000 $76,305,000 $74,082,524 $71,313,084 Cumulative Totals for FY 2009–2012
1,220,000 $305,220,000 $296,330,097 $285,252,336
Note: Costs are calculated by multiplying the acreage associated with each type of contract (Table 14) by the assumed costs listed in Table 4. Baseline Two – Total and Net Benefits
:
With the acreage increase implied in Baseline Two along with the policy changes, total benefits of GRP are expected to be $182.2 million per year, or $729 million over the FY 2009–FY 2012 period in constant 2007 dollars (Table 16). The net benefits shown in Table 17 are obtained by subtracting the program costs under this scenario (Table 15) from the program benefits. Again, discounting these net benefits produces positive net benefits in the aggregate, but raises concerns about permanent easements due to their high “up-front” costs compared with the discounted flow of benefits in the future.

2008 GRP Final Benefit-Cost Analysis 25 03/31/2010
Table 16. Baseline Two – Benefit estimates, annual and cumulative, FY 2009–FY2012. PROGRAM BENEFITS
Type of Easement Acres/Year Undiscounted
Discounted at 3%
Discounted at 7%
30-year Easement 0 $0 $0 $0 Permanent Easement 100,000 $120,300,000 $61,905,812 Sub-Total – Easements
$33,204,596 100,000 $120,300,000 $61,905,812 $33,204,596
10-year Contract 140,000 $33,684,000 $28,733,135 $23,658,232 15-year Contract 25,000 $9,022,500 $7,180,668 $5,478,410 20-year Contract 40,000 $19,248,000 $14,318,082 $10,195,679 30-year Contract 0 $0 $0 Sub-Total – Contracts
$0 205,000 $61,954,500 $50,231,885 $39,332,322
Annual Totals 305,000 $182,254,500 $112,137,697 $72,536,917 Cumulative Totals for FY 2009–2012
1,220,000 $729,018,000 $448,550,789 $290,147,669
Note: Benefits are calculated by multiplying the acreage associated with each type of contract by the value of the estimated benefits listed in Table 4. Table 17. Baseline Two – Estimated net benefits, annual and cumulative, FY 2009–
FY2012.
Type of Easement Net Benefits, Undiscounted
Net Benefits, Discounted at 3%
Net Benefits, Discounted at 7%
30-year Easement $0 $0 $0 Permanent Easement $76,000,000 $18,896,103 Sub-Total – Easements
–$8,197,274 $76,000,000 $18,896,103 –$8,197,274
10-year Contract $14,224,000 $9,839,931 $5,471,316 15-year Contract $4,797,500 $3,078,726 $1,529,812 20-year Contract $10,928,000 $6,240,412 $2,419,978 30-year Contract $0 $0 Sub-Total – Contracts
$0 $29,949,500 $19,159,069 $9,421,107
Annual Totals $105,949,500 $38,055,173 $1,223,833 Cumulative Totals for FY 2009–2012
$423,798,000 $152,220,692 $4,895,332

2008 GRP Final Benefit-Cost Analysis 26 03/31/2010
Policy Scenario Two – The 2008 Act GRP Requirements Implemented with Previous Acreage Targets Keeping in mind that GRP is driven by an annual acreage target, the Policy Two Scenario looks at what would have occurred if the 2008 Act was enacted under the previous acreage target (135,500 acres per year). Acreage moves out of 30-year contracts and 30-year easements and migrates to other enrollment categories while still aiming to hit the acreage target. A feasible solution that satisfies the obligation 40-60 rental-easement mix goal is provided in Table 18. Table 18. Policy Scenario Two – Annual and cumulative acreage changes.
FY 2009 FY 2010 FY 2011 FY 2012
FY 2009–FY 2012
- - - - - - - - - - - - - - - - - - - - - - - - Acres - - - - - - - - - - - - - - - - - - - - - - - - 30-year Easement 0 0 0 0 0 Permanent Easement 43,500 43,500 43,500 43,500 Sub-Total – Easements
174,000 43,500 43,500 43,500 43,500 174,000
10-year Contract 63,000 63,000 63,000 63,000 252,000 15-year Contract 10,000 10,000 10,000 10,000 40,000 20-year Contract 19,000 19,000 19,000 19,000 76,000 30-year Contract 0 0 0 0 Sub-Total – Contracts
0 92,000 92,000 92,000 92,000 368,000
Total 135,500 135,500 135,500 135,500 542,000 Policy Scenario Two – Costs
:
The per-acre cost was assumed to remain at the same levels as contracts made in the FY 2003–FY 2007 period. The resultant obligations and annualized costs shown in Table 19 are calculated by simple multiplication of acres by the per-acre cost estimates in Table 4, both in constant 2007 dollars and discounted.

2008 GRP Final Benefit-Cost Analysis 27 03/31/2010
Table 19. Policy Scenario Two – Cost estimates, annual and cumulative, FY 2009–FY2012.
PROGRAM COSTS
Type of Easement Acres/Year Undiscounted
Discounted at 3%
Discounted at 7%
30-year Easement 0 $0 $0 $0 Permanent Easement 43,500 $19,270,500 $18,709,223 Sub-Total – Easements
$18,009,813 43,500 $19,270,500 $18,709,223 $18,009,813
10-year Contract 63,000 $8,757,000 $8,501,942 $8,184,112 15-year Contract 10,000 $1,690,000 $1,640,777 $1,579,439 20-year Contract 19,000 $3,952,000 $3,836,893 $3,693,458 30-year Contract 0 $0 $0 Sub-Total – Contracts
$0 92,000 $14,399,000 $13,979,612 $13,457,009
Annual Totals 135,500 $33,669,500 $32,688,835 $31,466,822 Cumulative Totals for FY 2009–2012
542,000 $134,678,000 $130,755,340 $125,867,290
Note: Costs are calculated by multiplying the acreage associated with each type of contract by the assumed costs listed in Table 4. Policy Scenario Two – Total and Net Benefits
:
With the lower acreage increase implied in Policy Scenario Two along with the policy changes in the 2008 Act, total benefits of GRP are expectably lower than at full implementation of the 2008 Act, valued at $180.2 million per year or $321 million over the FY 2009–FY 2012 period in constant 2007 dollars (Table 20). The net benefits shown in Table 21 are obtained by subtracting the program costs under this scenario (Table 19) from the program benefits. Again, discounting these net benefits produces positive net benefits in the aggregate, but raises concerns about permanent easements due to their high “up-front” costs compared with the discounted flow of benefits in the future.

2008 GRP Final Benefit-Cost Analysis 28 03/31/2010
Table 20. Policy Scenario Two – Benefit estimates, annual and cumulative, FY 2009–FY2012. PROGRAM BENEFITS
Type of Easement Acres/Year Undiscounted
Discounted at 3%
Discounted at 7%
30-year Easement 0 $0 $0 $0 Permanent Easement 43,500 $52,330,500 $26,929,028 Sub-Total – Easements
$14,443,999 43,500 $52,330,500 $26,929,028 $14,443,999
10-year Contract 63,000 $15,157,800 $12,929,911 $10,646,204 15-year Contract 10,000 $3,609,000 $2,872,267 $2,191,364 20-year Contract 19,000 $9,142,800 $6,801,089 $4,842,948 30-year Contract 0 $0 $0 Sub-Total – Contracts
$0 92,000 $27,909,600 $22,603,267 $17,680,516
Annual Totals 135,500 $80,240,100 $49,532,295 $32,124,515 Cumulative Totals for FY 2009–2012
542,000 $320,960,400 $198,129,181 $128,498,061
Note: Benefits are calculated by multiplying the acreage associated with each type of contract by the value of the estimated benefit listed in Table 4. Table 21. Policy Scenario Two – Estimated net benefits, annual and cumulative, FY 2009–
FY2012.
Type of Easement Net Benefits, Undiscounted
Net Benefits, Discounted at 3%
Net Benefits, Discounted at 7%
30-year Easement $0 $0 $0 Permanent Easement $33,060,000 $8,219,805 Sub-Total – Easements
–$3,565,814 $33,060,000 $8,219,805 –$3,565,814
10-year Contract $6,400,800 $4,427,969 $2,462,092 15-year Contract $1,919,000 $1,231,490 $611,925 20-year Contract $5,190,800 $2,964,196 $1,149,490 30-year Contract $0 $0 Sub-Total – Contracts
$0 $13,510,600 $8,623,655 $4,223,507
Annual Totals $46,570,600 $16,843,460 $657,693 Cumulative Totals for FY 2009–2012
$186,282,400 $67,373,841 $2,630,771

2008 GRP Final Benefit-Cost Analysis 29 03/31/2010
Conclusions and Recommendations The results of this final benefit-cost analysis suggest that GRP creates positive net benefits. Given the assumptions related to “annualized costs and benefits,” the scenario that maximizes undiscounted net benefits is the Baseline Two scenario, which represents full implementation of the 2008 Act. This scenario is driven by two key provisions: the 40-60 rental-easement mix and eliminating 30-year easements and contracts. Both provisions, in effect, raise initial program costs but assure a longer stream of benefits. When discounting is applied and effectively lowers this stream of benefits, the higher initial cost of permanent easements produces negative net benefits (only at the higher seven percent discount rate). This result is evident when one compares the results of the Baseline One scenario (which does not incorporate program changes related to the 2008 Act) and Policy Two scenario two (which does). This comparison shows that—even though total acreage is kept constant—the initial costs rise by 12 percent, but undiscounted net benefits rise by 22 percent. This result changes when high discount rates are applied to net benefits (Table 22). Substantial social, economic, and environmental benefits are associated with preserving grasslands in and around metropolitan and rural communities. These benefits include: maintenance of ecological goods and services (such as those affecting ground water recharge, storm water management, carbon emissions and capture of carbon through agricultural systems, air quality, water quality, and biodiversity and habitat); social or human valued amenities (such as protecting cultural resources and community heritage, recreational opportunities, scenic vistas, and sound stewardship of the land); and economic values (such as a diverse local economy; agro-tourism; possibly fewer “inputs” used and less need for “restorative” conservation practices through the preservation of prime and State-wide important farmlands for agricultural use; a more sustainable development pattern; fewer losses from natural resources disasters by not putting people in harms way; and better stewardship ethic and practices by agricultural landowners). For the community and society at large, there are tradeoffs involved in actions that protect grasslands from development. Development may simply be displaced to another location, perhaps creating even greater economic and environmental damage. However, if one assumes that agricultural producers and local communities are the chief decision makers in the choice of whether to develop or preserve grassland for the current and later generations, there is a strong possibility that alternative agricultural enterprises or non-agricultural land use (displaced by GRP contracts) will be driven to a location with less detrimental social impacts.

2008 GRP Final Benefit-Cost Analysis 30 03/31/2010
Table 22. Comparison of Key Findings of Interest in Baseline/Policy Scenarios.
ANNUAL ACRE LEVELS ANNUAL OBLIGATIONS
NET BENEFITS ($ millions) PERCENT IN: PERCENT IN: Baseline/ Scenario Description Total Easements
Contracts
Total ($ millions) Easements
Contracts
Not Discounted Discounted
Discounted at 3%
Baseline One
at 7% An acreage increase at the FY 2003–FY 2007 rate.
135,475 17% 83% $30.1 34% 66% $38.1 $16.3 $2.9
Policy Scenario One
An annual acreage increase as prescribed in 2008 Act but no other changes
305,000 17% 83% $67.8 34% 66% $85.9 $36.8 $6.6
Baseline Two
Full implementation of the 2008 Act
305,000 33% 67% $76.3 58% 42% $105.9 $38.0 $1.2
Policy Scenario Two
Implementation of 2008 Act with previous acreage targets
135,500 32% 68% $33.7 57% 43% $46.6 $16.8 $0.6

2008 GRP Final Benefit-Cost Analysis 31 03/31/2010
NRCS’s GRP may be able to play a special role in grassland retention programs. Through its leveraging of money, GRP can reach out to more acres than would otherwise be possible and might encourage similar actions on the part of others. Money producers receive from GRP could allow them to invest in their agricultural operations and secure past conservation investments that producers on easement-protected farmlands could have been taken on solely by the producer or as a participant in other NRCS programs. When ecological goods and services are included in the analysis, the benefits exceed the costs of protecting grassland. These benefits will be maintained (and possibly increase) by keeping current grasslands in agriculture. Non-market-valued amenities on working lands will be maintained and core agricultural activities in local communities will be preserved into the future. Development on grasslands is largely irreversible and would permanently close off these benefits to future generations. NRCS would recommend baseline two with assurances to OMB that every effort will be made to place agricultural easements on grassland facing extreme conversion to alternative agricultural or non-agricultural land use pressure and where local easement programs may benefit from NRCS efforts to supplement their efforts and funding sources.

2008 GRP Final Benefit-Cost Analysis 32 03/31/2010
References American Farmland Trust (AFT). (2006, May). An Evaluation of the Federal Farm and Ranch
Lands Protection Program. Feather, Peter, Daniel Hellerstein, and LeRoy Hansen. (1999). Economic Valuation of
Environmental Benefits and the Targeting of Conservation Programs. The Case of the CRP. U.S. Department of Agriculture, Economic Research Service, Agriculture Information Bulletin, No. 778 (April). Washington DC.
Follett, R.F., J.M. Kimble, and R. Lal. (2000). The Potential of U.S. Grazing Lands to
Sequester Soil Carbon. Ch. 16 in R.F. Follett, J.M. Kimble, and R. Lal, The Potential of U.S. Grazing Lands to Sequester Carbon and Mitigate the Greenhouse Effect.
Gibilisco, Chuck, Gregory M. Filipek. (1998). The Economic Benefits of Wildlife-Watching
Activities in Washington. Olympia: Washington Department of Fish and Wildlife. Mac, M. J., P. A. Opler, C. E. Puckett Haecker, and P. D. Doran. (1998). Status and trends of
the nation’s biological resources. 2 vols. U.S. Department of the Interior, U.S. Geological Survey, Reston, Va. Available at http://www.nwrc.usgs.gov/sandt.
Millennium Ecosystem Assessment (MEA). (2005). Ecosystems and Human Well-Being:
Synthesis. Washington, DC: Island Press. Namken, Jerry C., and Mitch L. Flanagan. (2000). Conservation of Private Grazing Lands
Program: Benefit-Cost Analysis. Staff Report. Washington, DC: U.S. Department of Agriculture, Natural Resources Conservation Service.
Namken, Jerry. (2002). Unpublished preliminary analysis of the Grassland Reserve Program. Smith, V. Kerry. (1996). Estimating Economic Values for Nature: Methods for Non-Market
Valuation. Cheltenham, UK: Edward Elgar. Spaeth, Kenneth E. (2000, July 18). Water Budgets for Selected Sites: Rangeland Benefits from
Proper Grazing Management and Technical Assistance. U.S. Department of Agriculture, Agricultural Research Service. Washington, D.C.
Thurow, T.L. (1991). Hydrology and Erosion. In: R.K. Heitschmidt and J.W. Stuth (eds.).
Grazing Management: An Ecological Perspective. Portland, Oregon: Timber Press, Inc., pp. 141-159.
U.S. Department of Agriculture, Farm Service Agency. (2003). Conservation Reserve
Program: Benefit-Cost Assessment. Washington, D.C.; U.S. Government Printing Office. U.S. Department of Agriculture, Natural Resources Conservation Service. Five-Year National
Resources Inventory. (1997). Available at http://www.nrcs.usda.gov/technical/NRI/1997/index.html.

2008 GRP Final Benefit-Cost Analysis 33 03/31/2010
U.S. Department of the Interior, U.S. Fish and Wildlife Service. (2007, Oct). 2006 National
Survey of Fishing, Hunting, and Wildlife-Associated Recreation. Available at: http://wsfrprograms.fws.gov/Subpages/NationalSurvey/nat_survey2006_final.pdf.
U.S. Environmental Protection Agency (EPA). (2008, June 12). Technical Support Document
on Benefits of Reducing GHG Emissions. Available at www.regulations.gov (search on full title of document).
List of Preparers (in alphabetical order) Theresa Bowen, Management Analyst, USDA NRCS. Hal Gordon, Economist, USDA NRCS WNTSC, Principal Investigator James Rowe, Economist, USDA, NRCS, NHQ. Felix Spinelli, Senior Economist, USDA NRCS RESSD, Team Leader. With valuable assistance from the developers of the 2008 EQIP Environmental Assessment.


![Grassland Reserve Program2)[Read-Only].pdf · •First GRP Cooperative Agreement •1,200 acre Conservation Easement •Total Protected Area 3,670 acres •Benefits: exceptional habitat](https://static.fdocuments.in/doc/165x107/5c01c27609d3f2377a8dcc71/grassland-reserve-2read-onlypdf-first-grp-cooperative-agreement-1200.jpg)


