
Final Analysis of the 2009 California Survey of Registered ... Analysis of the 2009 California...
54
Final Analysis of the 2009 California Survey of Registered Pleasure Craft Owners: Usage and Storage Prepared for the California Air Resources Board by the Institute for Social Research at California State University, Sacramento June 2009 Ernest L. Cowles, Ph.D., Director Val Logsdon, MA Research Analyst Jessica Hayes, Research Analyst with Rachael Ekins, Graduate Research Assistant Kelly Nelson, Graduate Research Assistant Andrea Nemeyer, Graduate Research Assistant
Transcript of Final Analysis of the 2009 California Survey of Registered ... Analysis of the 2009 California...
Final Analysis of the 2009 California Survey of Registered Pleasure Craft Owners: Usage and Storage Prepared for the California Air Resources Board by the Institute for Social Research at California State University, Sacramento June 2009 Ernest L. Cowles, Ph.D., Director Val Logsdon, MA Research Analyst Jessica Hayes, Research Analyst with Rachael Ekins, Graduate Research Assistant Kelly Nelson, Graduate Research Assistant Andrea Nemeyer, Graduate Research Assistant
Final Analysis of the 2009 California Survey of Registered Pleasure Craft Owners: Usage and Storage 2
Table of Contents
Table of Tables…………………………………………………………………………………………………..3
Section 1: Methodology ......................................................................................................................... 4 Section 2: Summary of Survey Responses ........................................................................................... 8
General Information on Pleasure Crafts ............................................................................................. 8 Usage Information on Pleasure Crafts: Average Usage by Days, Hours, and Number of Times Pleasure Craft is Successfully Started .......................................................... 14 Usage Information on PCs: Percentage Estimates of Usage during the Week and in Different Seasons .................................................................................................................. 18 Usage Information on PC’s: Percentage Estimates by County and Waterways .............................. 22 Storage Information on PC’s ............................................................................................................ 32 Demographics .................................................................................................................................. 39
Appendix .............................................................................................................................................. 40

Final Analysis of the 2009 California Survey of Registered Pleasure Craft Owners: Usage and Storage 3
Table of Tables Table 1: Survey Response Rate ................................................................................................................... 5 Table 2: Distribution of Study Population, Sample, and Survey Respondents by County .................... 6 Table 3: Length of PC in Feet ....................................................................................................................... 7 Table 4 : Model Year of Pleasure Craft in Ranges of 5 Years ................................................................... 8 Table 5: “What is the Propulsion Type of This Craft?” ............................................................................. 8 Table 6: “How Many Engines Does Your Pleasure Craft Use for Propulsion?” ..................................... 9 Table 7: “What Is the Horse Power of Your Engine?” ............................................................................... 9 Table 8: “Has the Engine in Your Pleasure Craft Ever Been Replaced?” ............................................. 10 Table 9: “Was the Replacement Engine a New or a Rebuilt Engine?” .................................................. 10 Table 10: “What is the Model Year of the New or Rebuilt Engine?” ...................................................... 10 Table 11: “Does the Engine Use a Carburetor or Fuel Injection?” ......................................................... 11 Table 12: “What Type of Fuel Do You Use in Your Pleasure Craft?” ..................................................... 11 Table 13: “Is it a 2 Stroke or a 4 Stroke?” ................................................................................................ 11 Table 14: “How Many Fuel Tanks Does Your Pleasure Craft Have?” .................................................... 12 Table 15: “What Is the Size of Your Fuel Tank?” ..................................................................................... 13 Table 16: “Of Which Material Is the Fuel Tank Made?” ........................................................................... 13 Table 17: “On Average How Many Days Did You Operate Your Pleasure Craft in the Last 12 Months?” .................................................................................................. 14 Table 18: “On a Typical Day of Use, Approximately How Many Hours Did You Operate Your Pleasure Craft?”......................................................................................... 15 Table 18a: Mean Number of Days and Hours the PC Is Used ................................................................. 15 Table 19: “Was the Use of Your Pleasure Craft in 2007 More Than, Less Than, or the Same as 2008?” ................................................................................................... 16 Table 20: “How Many Days Did You Use Your Pleasure Craft in 2007?” .............................................. 16 Table 21: “How Many Times Do You Usually Start the Engine Successfully On a Typical Day of Use?”a17 Table 22: “When Do You Use Your Pleasure Craft?” .............................................................................. 18 Table 22a: Mean Percent of Time PC Is Used on Weekends and Weekdays ........................................ 18 Table 23: “Could You Please Estimate the Percentage of Time You Use Your Pleasure Craft on the Weekends Compared to the Weekdays?” ......................................... 19 Table 24: “In Which Seasons Do You Use Your Pleasure Craft?” ......................................................... 20 Table 24a: Mean Percent of Time PC Is Used by Season ........................................................................ 20 Table 25: “Could You Please Estimate the Percentage of Time You Use Your Pleasure Craft in Each of the Following Seasons?” .............................................................. 21 Table 26: “Where Do You Typically Operate Your Pleasure Craft?” ...................................................... 22 Table 27: “In How Many Counties Do You Typically Use Your Pleasure Craft?” ................................. 22 Table 28: “Please Tell Me in Which County You Use Your Pleasure Craft?” ........................................ 24 Table 28a: Mean Percent of Time PC Is Used by County ........................................................................ 25 Table 29: “On How Many Different Waterways Do You Operate Your Pleasure Craft?” ..................... 26 Table 30: "Please List the Waterways Where You Use Your Pleasure Craft" ....................................... 27 Table 30a: Mean Percent of Time PC Is Used by Waterway .................................................................... 29 Table 31: “Is Your Pleasure Craft Stored With Fuel In It?” ..................................................................... 32 Table 32: “Do You Store Your Pleasure Craft in the Same Location Throughout the Year?” ............................................................................................................. 32 Table 33: “In What County Do You Store Your Pleasure Craft?” ........................................................... 33 Table 34: “Where Is Your Pleasure Craft Stored?” .................................................................................. 34 Table 35: Location of 1st Pleasure Craft by County of Storage .............................................................. 35 Table 35: Pleasure Craft Storage by Season and County ....................................................................... 36 Table 36: 2nd Pleasure Craft Storage by Season and County ............................................................... 38 Table 37: “Which of the Following Age Groups Includes You?” ............................................................ 39 Table 38: “What Is Your Gender?” ............................................................................................................ 39
Final Analysis of the 2009 California Survey of Registered Pleasure Craft Owners: Usage and Storage 4
Section 1: Methodology
The Institute for Social Research (ISR) at California State University, Sacramento conducted a computer assisted telephone interview (CATI) of registered pleasure craft (PC) owners to provide the California Air Resources Board (ARB) with information about statewide usage and storage of PCs. The ARB provided the ISR with Department of Motor Vehicles (DMV) registration records of PCs in the state of California. This dataset included all registrations for PCs statewide. ARB also provided data for pleasure crafts registered with the Coast Guard and requested that these respondents comprise five percent of the survey respondents. The Coast Guard data did not include propulsion type, so PC propulsion types were collected during the interview. Sample Selection: The study criteria for inclusion of owners in the sample consisted of the following elements: currently registered PC with model year of 1970 or later, propulsion types including I (Inboard), O (Outboard), A (Auxiliary and Sail), J (Jet), and N (Inboard/Outboard), and for non-commercial use only. The DMV registered PC population meeting these criteria is 670,118 and the Coast Guard registered PC population is 7,797. As requested by the ARB, potential respondents were disqualified if they had not used their PC in the past two years or if they had an electric engine only. Registration records for both the DMV and Coast Guard registration contained the name and address of registered owners, but did not contain a phone number. To conduct a household telephone survey, ISR had Scientific Telephone Samples (STS) match the DMV and Coast Guard registration data against an STS database and append matched phone numbers. The total sample sent to STS for the DMV data was 73,918. The phone numbers matched were 24,953, a match rate of 34 percent. The total sample for the Coast Guard data was 7,797 and the phone numbers matched were 2,222 for a match rate of 28 percent. To ensure that there was a representative sample of households with registered PC owners, a random sample was selected using the random selection function in SPSS (the Statistical Package for the Social Sciences). Then a multi-step process was undertaken to identify records of owners with multiple PCs. For the DMV registration data, duplicate names and addresses were identified and a single record was selected to get a random sample of households. After the phone numbers were appended, the sample was checked for duplicate phone numbers. Out of the 24,953 DMV sample records matched there were 24,394 unduplicated sample records available for the study. Due to the small population size of the Coast Guard registration data only a duplicate check of phone numbers was conducted. Of the 2,222 Coast Guard sample records matched there were 2,196 unduplicated records. Together these constitute the sampling frame for the study.
Final Analysis of the 2009 California Survey of Registered Pleasure Craft Owners: Usage and Storage 5
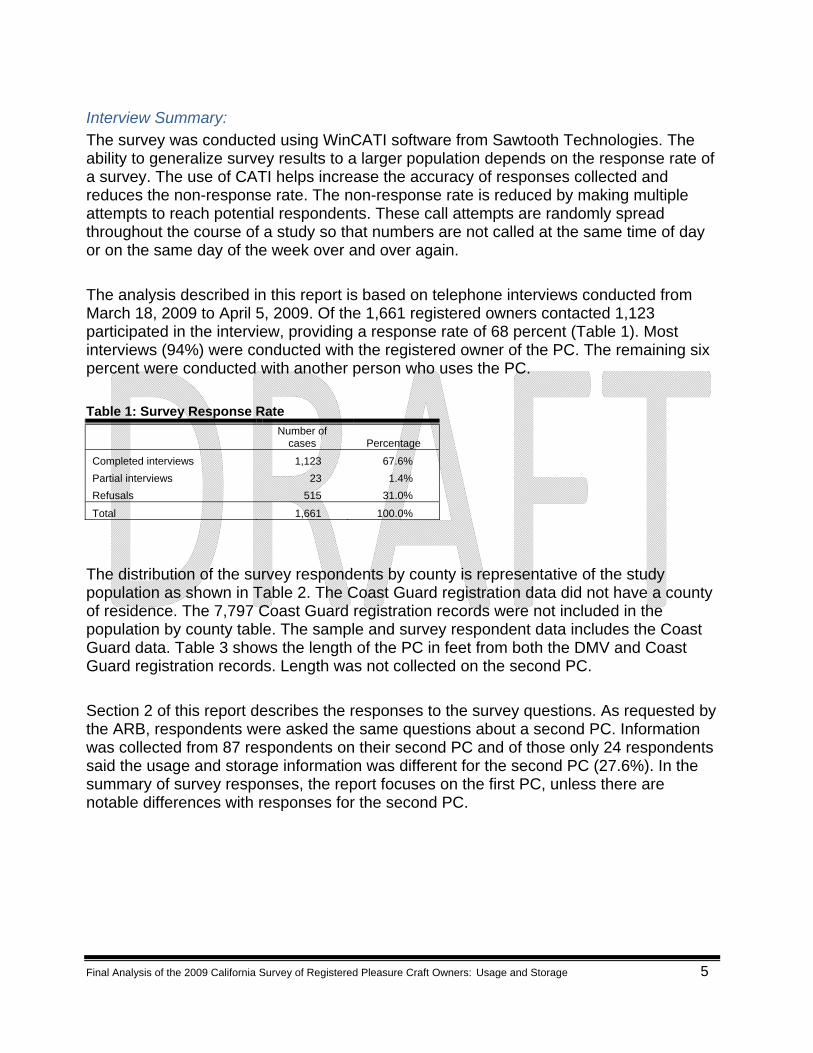
Interview Summary: The survey was conducted using WinCATI software from Sawtooth Technologies. The ability to generalize survey results to a larger population depends on the response rate of a survey. The use of CATI helps increase the accuracy of responses collected and reduces the non-response rate. The non-response rate is reduced by making multiple attempts to reach potential respondents. These call attempts are randomly spread throughout the course of a study so that numbers are not called at the same time of day or on the same day of the week over and over again. The analysis described in this report is based on telephone interviews conducted from March 18, 2009 to April 5, 2009. Of the 1,661 registered owners contacted 1,123 participated in the interview, providing a response rate of 68 percent (Table 1). Most interviews (94%) were conducted with the registered owner of the PC. The remaining six percent were conducted with another person who uses the PC. Table 1: Survey Response Rate
Number of cases Percentage
Completed interviews 1,123 67.6% Partial interviews 23 1.4% Refusals 515 31.0%
Total 1,661 100.0%
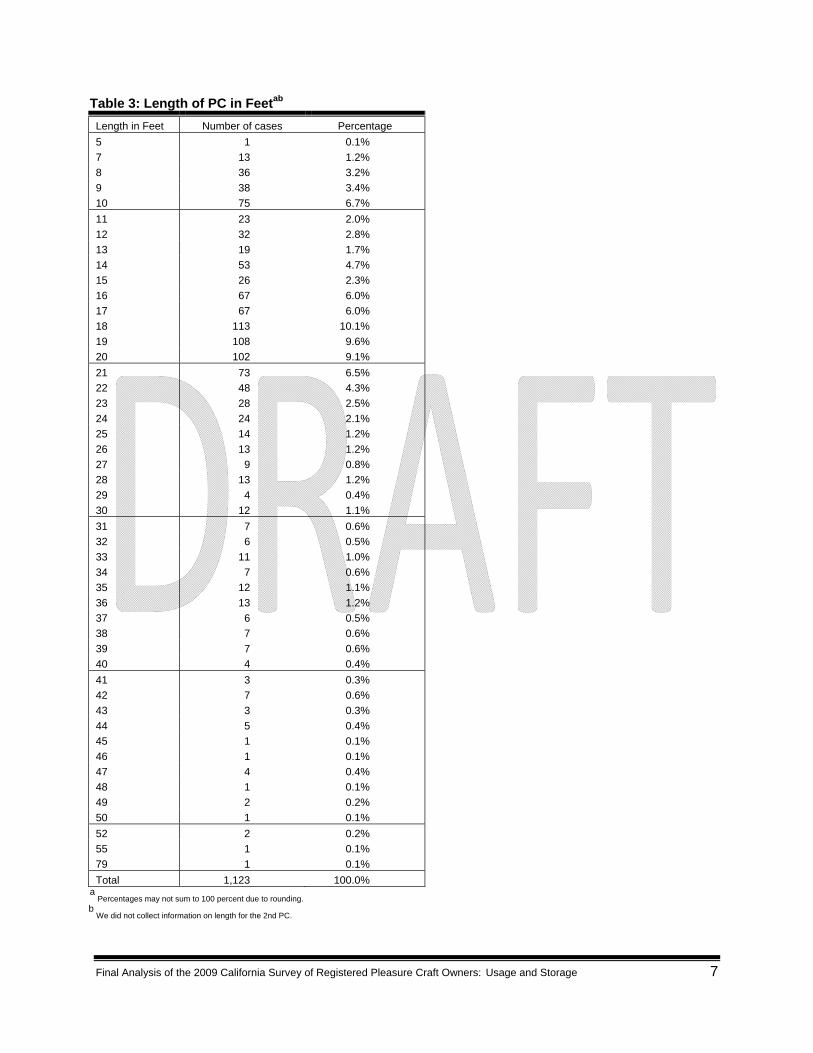
The distribution of the survey respondents by county is representative of the study population as shown in Table 2. The Coast Guard registration data did not have a county of residence. The 7,797 Coast Guard registration records were not included in the population by county table. The sample and survey respondent data includes the Coast Guard data. Table 3 shows the length of the PC in feet from both the DMV and Coast Guard registration records. Length was not collected on the second PC. Section 2 of this report describes the responses to the survey questions. As requested by the ARB, respondents were asked the same questions about a second PC. Information was collected from 87 respondents on their second PC and of those only 24 respondents said the usage and storage information was different for the second PC (27.6%). In the summary of survey responses, the report focuses on the first PC, unless there are notable differences with responses for the second PC.

Final Analysis of the 2009 California Survey of Registered Pleasure Craft Owners: Usage and Storage 6
Table 2: Distribution of Study Population, Sample, and Survey Respondents by Countya
Study Population Sample Population Survey Respondents N % N % N %
Alameda 18,547 2.8% 838 3.2% 34 3.0% Alpine 63 0.0% 2 0.0% 1 0.1% Amador 2,220 0.3% 55 0.2% 2 0.2% Butte 11,364 1.7% 513 1.9% 25 2.2% Calaveras 3,974 0.6% 118 0.4% 7 0.6% Colusa 1,024 0.2% 42 0.2% 2 0.2% Contra Costa 27,167 4.1% 1,303 4.9% 57 5.1% Del Norte 916 0.1% 37 0.1% 1 0.1% El Dorado 10,385 1.5% 411 1.5% 15 1.3% Fresno 15,877 2.4% 623 2.3% 19 1.7% Glenn 1,343 0.2% 53 0.2% 2 0.2% Humboldt 4,980 0.7% 236 0.9% 12 1.1% Imperial 1,612 0.2% 72 0.3% 4 0.4% Inyo 742 0.1% 31 0.1% 4 0.4% Kern 13,047 1.9% 503 1.9% 28 2.5% Kings 2,187 0.3% 102 0.4% 6 0.5% Lake 5,730 0.9% 188 0.7% 13 1.2% Lassen 2,064 0.3% 53 0.2% 1 0.1% Los Angeles 89,585 13.4% 3,421 12.9% 107 9.5% Madera 4,412 0.7% 158 0.6% 9 0.8% Marin 5,556 0.8% 298 1.1% 14 1.2% Mariposa 998 0.1% 39 0.1% 2 0.2% Mendocino 3,309 0.5% 142 0.5% 4 0.4% Merced 4,829 0.7% 181 0.7% 6 0.5% Modoc 426 0.1% 9 0.0% 1 0.1% Mono 719 0.1% 17 0.1% 2 0.2% Monterey 6,109 0.9% 250 0.9% 8 0.7% Napa 4,257 0.6% 232 0.9% 11 1.0% Nevada 6,606 1.0% 312 1.2% 19 1.7% Orange 51,833 7.7% 2,154 8.1% 76 6.8% Placer 15,705 2.3% 561 2.1% 25 2.2% Plumas 1,889 0.3% 58 0.2% 2 0.2% Riverside 43,433 6.5% 1,629 6.1% 54 4.8% Sacramento 33,988 5.1% 1,188 4.5% 65 5.8% San Benito 1,499 0.2% 73 0.3% 2 0.2% San Bernardino 39,925 6.0% 1,282 4.8% 45 4.0% San Diego 47,234 7.0% 1,891 7.1% 75 6.7% San Francisco 2,838 0.4% 143 0.5% 7 0.6% San Joaquin 18,802 2.8% 678 2.5% 32 2.8% San Luis Obispo 9,213 1.4% 452 1.7% 29 2.6% San Mateo 9,374 1.4% 438 1.6% 12 1.1% Santa Barbara 7,207 1.1% 337 1.3% 13 1.2% Santa Clara 21,400 3.2% 933 3.5% 47 4.2% Santa Cruz 5,145 0.8% 247 0.9% 11 1.0% Shasta 13,584 2.0% 557 2.1% 30 2.7% Sierra 156 0.0% 2 0.0% -- -- Siskiyou 2,701 0.4% 118 0.4% 11 1.0% Solano 11,795 1.8% 533 2.0% 32 2.8% Sonoma 13,828 2.1% 654 2.5% 31 2.8% Stanislaus 14,126 2.1% 586 2.2% 26 2.3% Sutter 4,321 0.6% 162 0.6% 7 0.6% Tehama 3,177 0.5% 135 0.5% 5 0.4% Trinity 1,107 0.2% 19 0.1% 1 0.1% Tulare 6,591 1.0% 256 1.0% 6 0.5% Tuolumne 3,540 0.5% 148 0.6% 8 0.7% Ventura 18,518 2.8% 796 3.0% 39 3.5% Yolo 4,573 0.7% 205 0.8% 9 0.8% Yuba 3,212 0.5% 114 0.4% 7 0.6% Out of State 9,356 1.4% 2 0.0% -- -- Total 670,118b 100.0% 26,590 100.0% 1,123 100.0%
a Percentages may not sum to 100 percent due to rounding.
b Coast Guard data was excluded from population due to not having county information.
Final Analysis of the 2009 California Survey of Registered Pleasure Craft Owners: Usage and Storage 7
Table 3: Length of PC in Feetab
a
Percentages may not sum to 100 percent due to rounding.
Length in Feet Number of cases Percentage 5 1 0.1% 7 13 1.2% 8 36 3.2% 9 38 3.4% 10 75 6.7% 11 23 2.0% 12 32 2.8% 13 19 1.7% 14 53 4.7% 15 26 2.3% 16 67 6.0% 17 67 6.0% 18 113 10.1% 19 108 9.6% 20 102 9.1% 21 73 6.5% 22 48 4.3% 23 28 2.5% 24 24 2.1% 25 14 1.2% 26 13 1.2% 27 9 0.8% 28 13 1.2% 29 4 0.4% 30 12 1.1% 31 7 0.6% 32 6 0.5% 33 11 1.0% 34 7 0.6% 35 12 1.1% 36 13 1.2% 37 6 0.5% 38 7 0.6% 39 7 0.6% 40 4 0.4% 41 3 0.3% 42 7 0.6% 43 3 0.3% 44 5 0.4% 45 1 0.1% 46 1 0.1% 47 4 0.4% 48 1 0.1% 49 2 0.2% 50 1 0.1% 52 2 0.2% 55 1 0.1% 79 1 0.1% Total 1,123 100.0%
b We did not collect information on length for the 2nd PC.

Final Analysis of the 2009 California Survey of Registered Pleasure Craft Owners: Usage and Storage 8
Section 2: Summary of Survey Responses
General Information on Pleasure Crafts
The most common model year range of the PCs in this study was 2001 to 2005 (21%) (Table 4).
Table 4 : Model Year of Pleasure Craft in Ranges of 5 Yearsa
Year of PC Number of cases Percentage
1st PC 1970 to 1975 68 6.1% 1976 to 1980 96 8.5% 1981 to 1985 120 10.7% 1986 to 1990 186 16.6% 1991 to 1995 158 14.1% 1996 to 2000 211 18.8% 2001 to 2005 233 20.7% 2006 to 2007 51 4.5%
Total 1,123b 100.0%
2nd PC 1969 or older 5 5.7% 1970 to 1975 8 9.2% 1975 to 1980 5 5.7% 1981 to 1985 7 8.0% 1986 to 1990 11 12.6% 1991 to 1995 16 18.4% 1996 to 2000 12 13.8% 2001 to 2005 11 12.6% 2006 to 2009 12 13.8%
Total 87c 100.0% a
Percentages may not sum to 100 percent due to rounding. b
Year provided by the DMV and Coast Guard registration data.
c Year provided by respondent.
More than one-third (36%) of respondents had outboard propulsion. The second most common propulsion type was inboard/outboard (28%) (Table 5). Table 5: “What is the Propulsion Type of This Craft?”a
Propulsion Type
1st PC 2nd PC
N % N %
Inboard 153 13.6% 10 11.5% Auxiliary and Sail 43 3.8% -- -- Outboard 407 36.2% 31 35.6% Jet 186 16.6% 32 36.8% Inboard/Outboard 315 28.0% 7 8.0% Don't know/ refused 19 1.7% 7 8.0%
Total 1,123 100.0% 87 100.0% a
Percentages may not sum to 100 percent due to rounding.

Final Analysis of the 2009 California Survey of Registered Pleasure Craft Owners: Usage and Storage 9
Nine-out-of-ten respondents (90%) indicated their PC had one engine while only six percent had more than one engine (Table 6).
Table 6: “How Many Engines Does Your Pleasure Craft Use for Propulsion?”a
Number of engines Number of cases Percentage
1st PC 1 1,008 89.8% 2 95 5.8% 3 or more 2 0.2% Don't know/ refused 18 1.6%
Total 1,123 100.0%
2nd PC 1 82 94.3% 2 3 3.4% Don’t know/refused 2 2.3% Total 87 100.0%
a Percentages may not sum to 100 percent due to rounding.
Seventeen percent of registered PC owners had 51 to 120 horsepower on the first engine. Thirty four percent of those who had a second engine had 251 to 500 horsepower. Nearly one-in-five (18%) respondents were unsure of the horsepower of their engines (Table 7).
Table 7: “What Is the Horse Power of Your Engine?”a
1st Engine 2nd Engine 3rd Engine
Horsepower N % N % N %
1st PC 0 to 2 4 0.4% 1 1.0% -- -- 3 to 15 100 9.0% 23 23.7% 1 50.0% 16 to 25 65 5.9% 3 3.1% -- -- 26 to 50 128 11.6% -- -- -- -- 51 to 120 187 16.9% 6 6.2% -- -- 121 to 175 115 10.4% 8 8.2% -- -- 176 to 250 125 11.3% 5 5.2% 1 50.0% 251 to 500 163 14.8% 33 34.0% -- -- 500 or more 16 1.4% 1 1.0% -- -- Don't know /refused 202 18.3% 17 17.5% -- -- Total 1,105b 100.0% 97 100.0% 2 100.0%
2nd PC 0 to 2 1 1.1% -- -- -- -- 3 to 15 10 11.5% 2 40.0% -- -- 16 to 25 4 4.6% -- -- -- -- 26 to 50 6 6.9% -- -- -- -- 51 to 120 14 16.1% -- -- -- -- 121 to 175 10 11.5% -- -- -- -- 176 to 250 7 8.0% 1 20.0% -- -- 251 to 500 17 19.5% -- -- -- -- 500 or more 4 4.6% -- -- -- -- Don't know /refused 14 16.1% 2 40.0% -- -- Total 87 100.0% 5 100.0% -- --
a Percentages may not sum to 100 percent due to rounding.
b Eighteen missing cases due to respondents who didn’t know or refused to answer how many engines in previous question.
Final Analysis of the 2009 California Survey of Registered Pleasure Craft Owners: Usage and Storage 10
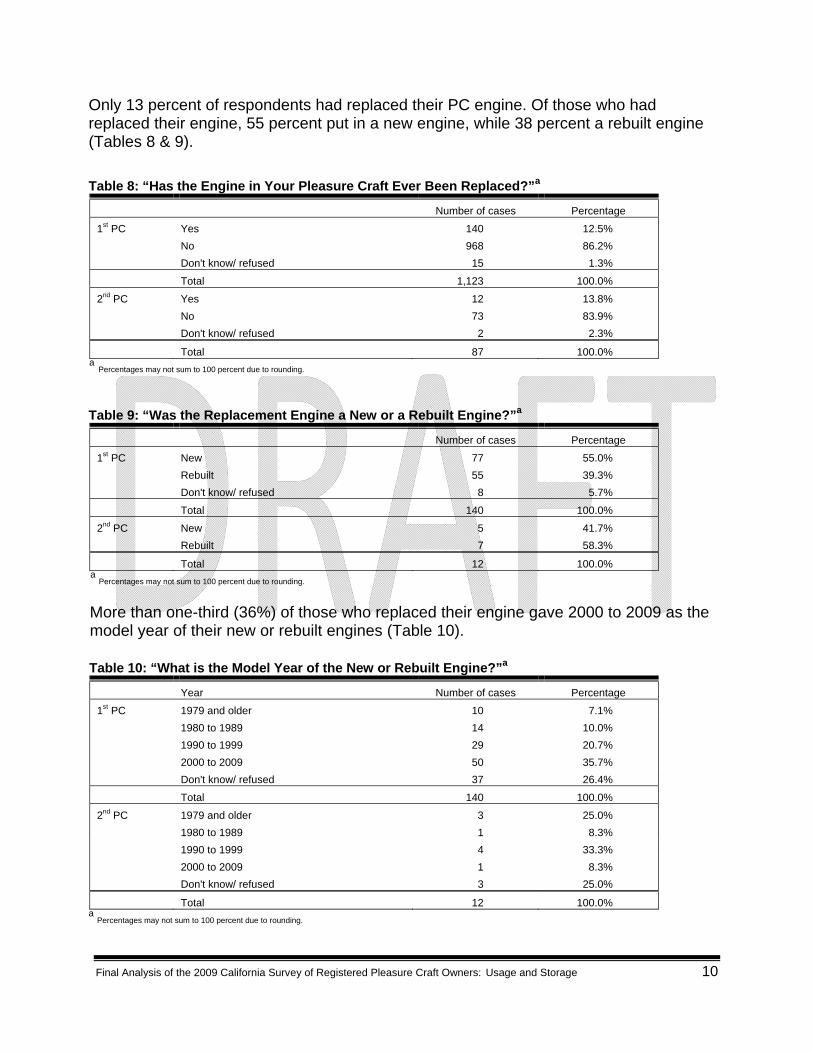
Only 13 percent of respondents had replaced their PC engine. Of those who had replaced their engine, 55 percent put in a new engine, while 38 percent a rebuilt engine (Tables 8 & 9).
Table 8: “Has the Engine in Your Pleasure Craft Ever Been Replaced?”a
Number of cases Percentage
1st PC Yes 140 12.5% No 968 86.2% Don't know/ refused 15 1.3%
Total 1,123 100.0%
2nd PC Yes 12 13.8% No 73 83.9% Don't know/ refused 2 2.3% Total 87 100.0%
a Percentages may not sum to 100 percent due to rounding.
Table 9: “Was the Replacement Engine a New or a Rebuilt Engine?”a Number of cases Percentage
1st PC New 77 55.0% Rebuilt 55 39.3% Don't know/ refused 8 5.7%
Total 140 100.0%
2nd PC New 5 41.7% Rebuilt 7 58.3% Total 12 100.0%
a Percentages may not sum to 100 percent due to rounding.
More than one-third (36%) of those who replaced their engine gave 2000 to 2009 as the model year of their new or rebuilt engines (Table 10).
Table 10: “What is the Model Year of the New or Rebuilt Engine?”a Year Number of cases Percentage
1st PC 1979 and older 10 7.1% 1980 to 1989 14 10.0% 1990 to 1999 29 20.7% 2000 to 2009 50 35.7% Don't know/ refused 37 26.4%
Total 140 100.0%
2nd PC 1979 and older 3 25.0% 1980 to 1989 1 8.3% 1990 to 1999 4 33.3% 2000 to 2009 1 8.3% Don't know/ refused 3 25.0% Total 12 100.0%
a Percentages may not sum to 100 percent due to rounding.

Final Analysis of the 2009 California Survey of Registered Pleasure Craft Owners: Usage and Storage 11
One-half (50%) of respondents said their engine used a carburetor while 39 percent said their engine used fuel injection (Table 11).
Table 11: “Does the Engine Use a Carburetor or Fuel Injection?”a Number of cases Percentage
1st PC Carburetor 556 49.5% Fuel injection 435 38.7% Don't know/refused 132 11.8%
Total 1,123 100.0%
2nd PC Carburetor 50 57.5% Fuel injection 30 34.5% Don't know/refused 7 8.0% Total 87 100.0%
a Percentages may not sum to 100 percent due to rounding.
Nearly nine-out-of-ten respondents (89%) said their PC used gasoline, and about one-half (49%) of those engines were 4 stroke (Tables 12 & 13).
Table 12: “What Type of Fuel Do You Use in Your Pleasure Craft?”a Type of fuel Number of cases Percentage
1st PC Gasoline 1,002 89.2% Diesel 110 9.8% Don't know/ refused 11 1.0%
Total 1,123 100.0%
2nd PC Gasoline 79 90.8% Diesel 6 6.9% Don't know/ refused 2 2.3% Total 87 100.0%
a Percentages may not sum to 100 percent due to rounding.
Table 13: “Is it a 2 Stroke or a 4 Stroke?”a
Number of cases Percentage
1st PC 2 stroke 381 38.0% 4 stroke 488 48.7% Don't know/ refused 133 13.3% Total 1,002 100.0%
2nd PC 2 stroke 35 44.3% 4 stroke 36 45.6% Don't know/ refused 8 10.1% Total 79 100.0%
a Percentages may not sum to 100 percent due to rounding.
Final Analysis of the 2009 California Survey of Registered Pleasure Craft Owners: Usage and Storage 12
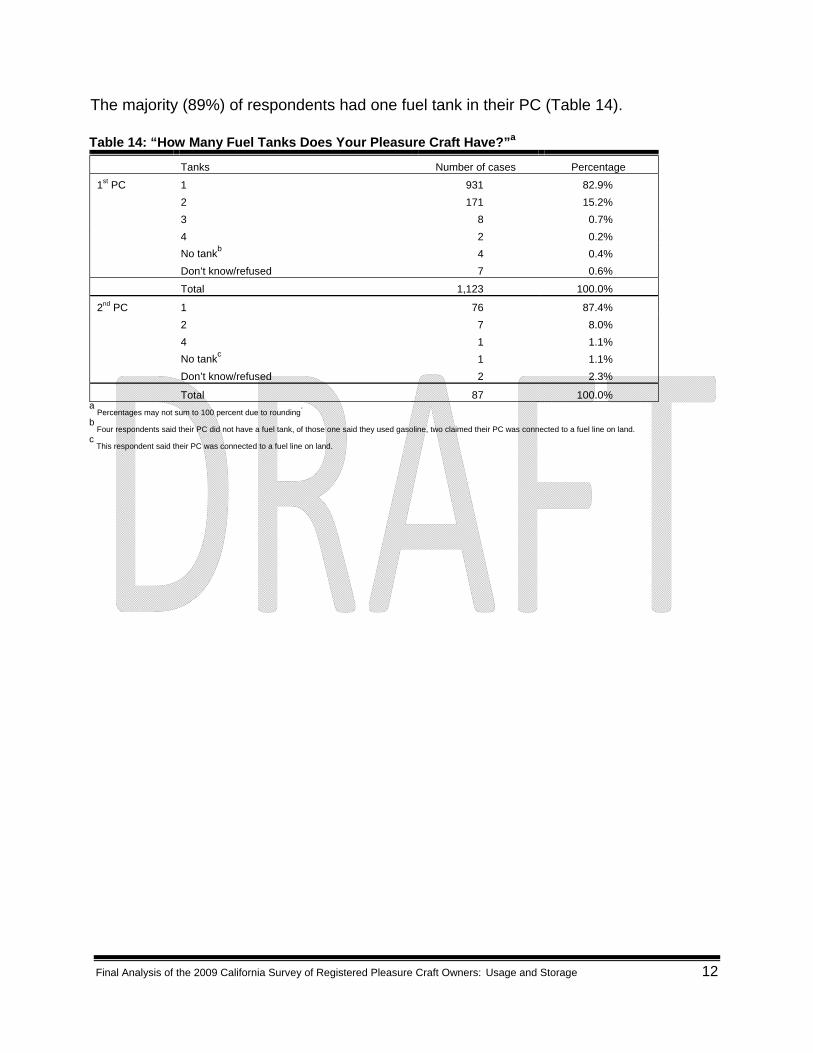
The majority (89%) of respondents had one fuel tank in their PC (Table 14).
Table 14: “How Many Fuel Tanks Does Your Pleasure Craft Have?”a Tanks Number of cases Percentage
1st PC 1 931 82.9% 2 171 15.2% 3 8 0.7% 4 2 0.2% No tankb 4 0.4% Don’t know/refused 7 0.6% Total 1,123 100.0%
2nd PC 1 76 87.4% 2 7 8.0% 4 1 1.1% No tankc 1 1.1% Don’t know/refused 2 2.3% Total 87 100.0%
a Percentages may not sum to 100 percent due to rounding
.
b Four respondents said their PC did not have a fuel tank, of those one said they used gasoline, two claimed their PC was connected to a fuel line on land.
c This respondent said their PC was connected to a fuel line on land.

Final Analysis of the 2009 California Survey of Registered Pleasure Craft Owners: Usage and Storage 13
Fuel tank sizes ranged from under five gallons to more than 100 gallons. The most common response to fuel tank size was between 11 and 20 gallons (27%) for the first fuel tank. This was also the most common response for the second fuel tank along with six to ten gallons (both 21%) (Table15). Table 15: “What Is the Size of Your Fuel Tank?”a
Size of gas tank in gallons
1st Tank 2nd Tank N % N %
1st PC Under 5 140 12.5% 24 13.0% 6 to 10 166 14.9% 38 20.5% 11 to 20 298 26.7% 38 20.5% 21 to 30 146 13.1% 10 5.4% 31 to 40 77 6.9% 6 3.2% 41 to 50 39 3.5% 9 4.9% 51 to100 71 6.4% 15 8.1% Over 100 63 5.6% 31 16.8% Don't know tank size 116 10.4% 14 7.6% Total 1,116b 100.0% 185 100.0%
2nd PC Under 5 14 16.1% -- -- 6 to 10 14 16.1% 2 18.2% 11 to 20 16 18.4% 1 9.1% 21 to 30 12 13.8% 2 18.2% 31 to 40 6 6.9% 1 9.1% 41 to 50 5 5.7% -- -- 51 to100 6 6.9% -- -- Over 100 3 3.4% 2 18.2% Don't know tank size 11 12.6% 3 27.3% Total 87 100.0% 11 100.0%
a Percentages may not sum to 100 percent due to rounding.
b Seven missing cases due to respondent not knowing how many fuel tanks their vessel had in the previous question.
Fuel tanks were most commonly made of plastic (38%) or metal (32%). One-in-five respondents (21%) did not know the material of their fuel tank (Table16).
Table 16: “Of Which Material Is the Fuel Tank Made?”a
Material 1st Tank 2nd Tank
N % N %
1st PC Metal 357 31.8% 96 50.0% Plastic 416 37.0% 52 27.1% Fiberglass 115 10.2% 15 7.8% Composite material 3 0.3% 0 0.0% Don't know /refused 232 20.7% 29 15.1% Total 1,123 100.0 192 100.0% 2nd PC Metal 33 37.9% 8 72.7% Plastic 34 39.1% -- -- Fiberglass 9 10.3% -- -- Composite material 1 1.1% 1 9.1% Don't know Material 10 11.5% 2 18.2% Total 87 100.0% 11 100.0%
a Percentages may not sum to 100 percent due to rounding.
Final Analysis of the 2009 California Survey of Registered Pleasure Craft Owners: Usage and Storage 14
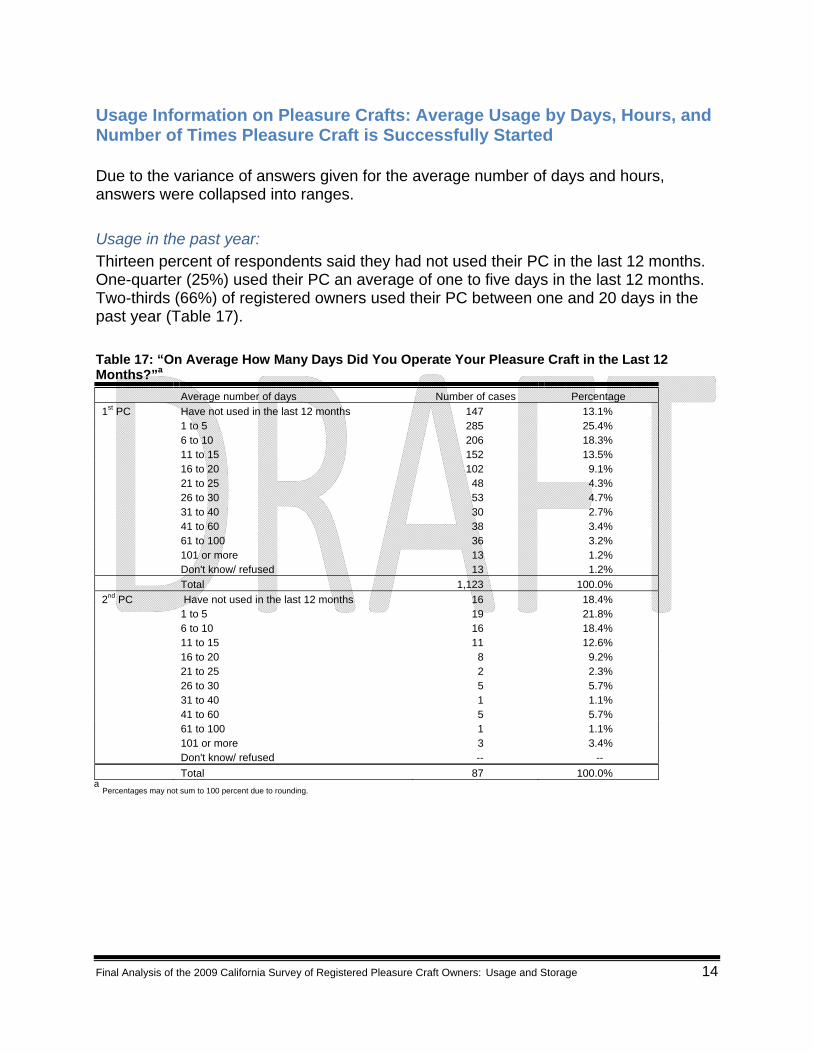
Usage Information on Pleasure Crafts: Average Usage by Days, Hours, and Number of Times Pleasure Craft is Successfully Started
Due to the variance of answers given for the average number of days and hours, answers were collapsed into ranges. Usage in the past year: Thirteen percent of respondents said they had not used their PC in the last 12 months. One-quarter (25%) used their PC an average of one to five days in the last 12 months. Two-thirds (66%) of registered owners used their PC between one and 20 days in the past year (Table 17).
Table 17: “On Average How Many Days Did You Operate Your Pleasure Craft in the Last 12 Months?”a
Average number of days Number of cases Percentage 1st PC Have not used in the last 12 months 147 13.1% 1 to 5 285 25.4% 6 to 10 206 18.3% 11 to 15 152 13.5% 16 to 20 102 9.1% 21 to 25 48 4.3% 26 to 30 53 4.7% 31 to 40 30 2.7% 41 to 60 38 3.4% 61 to 100 36 3.2% 101 or more 13 1.2% Don't know/ refused 13 1.2% Total 1,123 100.0% 2nd PC Have not used in the last 12 months 16 18.4% 1 to 5 19 21.8% 6 to 10 16 18.4% 11 to 15 11 12.6% 16 to 20 8 9.2% 21 to 25 2 2.3% 26 to 30 5 5.7% 31 to 40 1 1.1% 41 to 60 5 5.7% 61 to 100 1 1.1% 101 or more 3 3.4% Don't know/ refused -- -- Total 87 100.0%
a Percentages may not sum to 100 percent due to rounding.

Final Analysis of the 2009 California Survey of Registered Pleasure Craft Owners: Usage and Storage 15
Average daily use: The majority (65%) of respondents indicated their average daily use of their PC was up to 4 hours a day. Eleven percent of registered owners used their PC more than six hours on a typical day of use (Table 18). Table 18: “On a Typical Day of Use, Approximately How Many Hours Did You Operate Your Pleasure Craft?”a
Hours Number of cases Percentage
1st PC 1 155 13.8% 2 196 17.5% 3 188 16.7% 4 186 16.6% 5 125 11.1% 6 116 10.3% 7 to 10 108 9.6% 11 or more 16 1.4% Don't know/ refused 33 2.9%
Total 1,123 100.0%
2nd PC 1 14 16.1% 2 16 18.4% 3 10 11.5% 4 15 17.2% 5 5 5.7% 6 13 14.9% 7 to 10 7 8.0% 11 or more 3 3.4% Don't know/ refused 4 4.6%
Total 87 100.0% a Percentages may not sum to 100 percent due to rounding.
Table 18a: Mean Number of Days and Hours the PC Is Used
N Mean Standard Deviation Min Max 1st PC 2008 daysab 1,110 16.04 24.97 0 365
2007 daysac 1,036 20.31 27.47 0 365
Hours 1,090 3.94 2.53 1 20 2nd PC 2008 daysab 87 21.92 52.37 0 365
2007 daysac 82 26.18 53.52 0 365
Hours 85 4.26 4.00 0 24 a
One respondent said 365 days which skews the means and standard deviations. b
Fifty-four respondents di ot know the number of days they used their PC in 2007 and 33 respondents gave answers that did not make sense; these responses were d n excluded from the totals. c
Three respondent did not know usage in 2007 and two gave answers that did not make sense; these responses were excluded from the totals.

Final Analysis of the 2009 California Survey of Registered Pleasure Craft Owners: Usage and Storage 16
Year to year usage: The majority of respondents (52%) said their usage in 2007 was the same as 2008. Thirty-five percent of respondents reported using their PC more in 2007 than in 2008 and only 12 percent said their usage was less in 2007 than in 2008 (Table 19). Table 19: “Was the Use of Your Pleasure Craft in 2007 More Than, Less Than, or the Same as 2008?”a
Number of cases Percentage
1st PC More than 395 35.2% Less than 133 11.8% Same 583 51.9% Don't know/ refused 12 1.1%
Total 1,123 100.0%
2nd PC More than 28 32.2% Less than 11 12.6% Same 46 52.9% Don't know/ refused 2 2.3%
Total 87 100.0% a Percentages may not sum to 100 percent due to rounding.
Table 20: “How Many Days Did You Use Your Pleasure Craft in 2007?”a
Number of days Number of cases Percentage 1st PC Did not use in 2007 64 5.9% 1 to 5 208 19.1% 6 to 10 206 18.9% 11 to 15 144 13.2% 16 to 20 122 11.2% 21 to 25 63 5.8% 26 to 30 68 6.2% 31 to 40 55 5.0% 41 to 60 47 4.3% 61 to 100 37 3.4% 101 or more 22 2.0% Don't know/ refused 54 5.0% Total 1,090b 100.0% 2nd PC Did not use in 2007 11 13.3% 1 to 5 14 16.9% 6 to 10 10 12.0% 11 to 15 13 15.7% 16 to 20 11 13.3% 21 to 25 2 2.4% 26 to 30 5 6.0% 31 to 40 7 8.4% 41 to 60 4 4.8% 61 to 100 2 2.4% 101 or more 3 3.6% Don't know/ refused 1 1.2% Total 83b 100.0%
a Percentages may not sum to 100 percent due to rounding.
b Missing cases due to respondents who gave answers that did not make sense; these responses were excluded from the totals.

Final Analysis of the 2009 California Survey of Registered Pleasure Craft Owners: Usage and Storage 17
Successful starts:
More than one-half (55 %) of registered PC owners had one to four successful engine starts on a typical day of use. Twenty-two percent of registered owners had between seven and 20 successful starts on a typical day of use (Table 21).
Table 21: “How Many Times Do You Usually Start the Engine Successfully On a Typical Day of Use?”a
a Percentages may not sum to 100 percent due to rounding.
Number of times successfully started Number of cases Percentage
1st PC 1 169 15.0% 2 198 17.6% 3 120 10.7% 4 133 11.8% 5 95 8.5% 6 67 6.0% 7 to 10 131 11.7% 11 to 20 117 10.4% 21 or more 29 2.6% Don't know/ refused 64 5.7%
Total 1,123 100.0%
2nd PC 1 8 9.2% 2 11 12.6% 3 5 5.7% 4 12 13.8% 5 7 8.0% 6 8 9.2% 7 to 10 9 10.3% 11 to 20 16 18.4% 21 or more 3 3.4% Don't know/ refused 8 9.2%
Total 87 100.0%

Final Analysis of the 2009 California Survey of Registered Pleasure Craft Owners: Usage and Storage 18
Usage Information on PCs: Percentage Estimates of Usage during the Week and in Different Seasons
Weekly usage: Nearly one-half (49%) of registered owners said they used their PC on both the weekdays and weekends. Thirty-six percent indicated they only used their PC on the weekends while 14 percent used their PC during the week only (Table 22).
Table 22: “When Do You Use Your Pleasure Craft?”a
Number of cases Percentage
1st PC Weekends only (SAT-SUN) 403 35.9% Weekdays only (MON-FRI) 156 13.9% Both weekend and weekdays (SUN-SAT) 555 49.4% Don’t know/ refused 9 0.8%
Total 1,123 100.0%
2nd PC Weekends only (SAT-SUN) 26 29.9% Weekdays only (MON-FRI) 9 10.3% Both weekend and weekdays (SUN-SAT) 48 55.2% Don’t know/ refused 4 4.6%
Total 87 100.0% a Percentages may not sum to 100 percent due to rounding.
Table 22a: Mean Percent of Time PC Is Used on Weekends and Weekdays N Mean SD Min Mix
1st PC Weekend usage 953 71.86 27.63 1 100 Weekday usage 706 60.09 24.44 1 100
2nd PC Weekend usage 74 66.89 29.54 10 100 Weekday usage 57 58.77 26.02 10 100

Final Analysis of the 2009 California Survey of Registered Pleasure Craft Owners: Usage and Storage 19
Weekend usage was computed by combining respondents who used their PC on the weekends only with respondents that used it both weekends and weekdays. Of those, 42 percent used their PC only on the weekends (Table 23). Table 23: “Could You Please Estimate the Percentage of Time You Use Your Pleasure Craft on the Weekends Compared to the Weekdays?”a
Percent of time PC is used Weekend usage Weekday usage
Number of cases Percentage Number of cases Percentage 1st PC 1 to 10 19 2.0% 15 2.1% 11 to 20 22 2.3% 38 5.4% 21 to 30 57 6.0% 64 9.1% 31 to 40 15 1.6% 35 5.0% 41 to 50 285 29.9% 285 40.4% 51 to 60 31 3.3% 13 1.8% 61 to 70 44 4.6% 37 5.2% 71 to 80 62 6.5% 44 6.2% 81 to 90 14 1.5% 18 2.5% 91 to 99 1 0.1% 1 0.1% 100 403 42.3% 156 22.1% Total 953b 100.0% 706b 100.0% 2nd PC 1 to 10 2 2.7% 2 3.5% 21 to 30 2 2.7% 3 5.3% 31 to 40 11 14.9% 7 12.3% 41 to 50 1 1.4% 1 1.8% 51 to 60 19 25.7% 19 33.3% 61 to 70 2 2.7% 1 1.8% 71 to 80 1 1.4% 8 14.0% 81 to 90 8 10.8% 5 8.8% 91 to 99 2 2.7% 2 3.5% 100 26 35.1% 9 15.8% Total 74c 100.0% 57c 100.0%
a Percentages may not sum to 100 percent due to rounding.
b Five respondents who used their vessel on both weekend and weekday did not know the percentage of time they used their PC and nine respondents did not know when they used their vessel or the percentage of time used. c
Four respondents who used their vessel on both weekend and weekday did not know the percentage of time they used their PC.
Final Analysis of the 2009 California Survey of Registered Pleasure Craft Owners: Usage and Storage 20
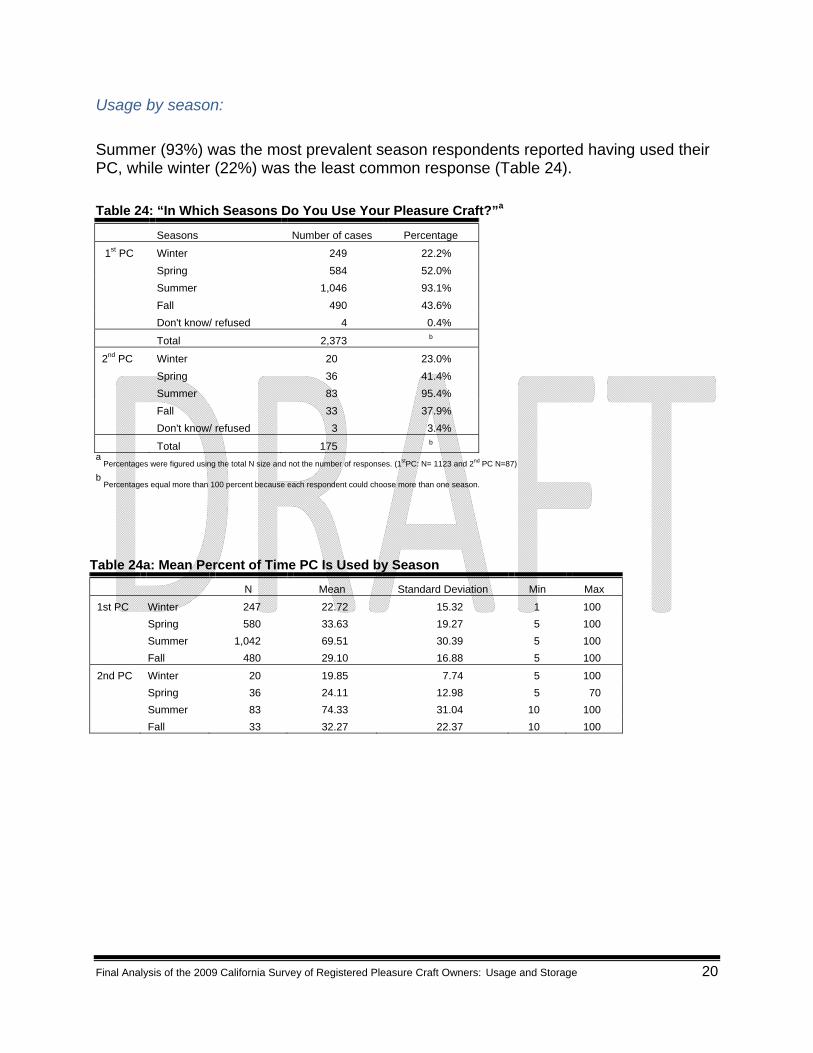
Usage by season:
Summer (93%) was the most prevalent season respondents reported having used their PC, while winter (22%) was the least common response (Table 24). Table 24: “In Which Seasons Do You Use Your Pleasure Craft?”a
Seasons Number of cases Percentage
1st PC Winter 249 22.2% Spring 584 52.0% Summer 1,046 93.1% Fall 490 43.6% Don't know/ refused 4 0.4%
Total 2,373 b
2nd PC Winter 20 23.0% Spring 36 41.4% Summer 83 95.4% Fall 33 37.9% Don't know/ refused 3 3.4%
Total 175 b
a Percentages were figured using the total N size and not the number of responses. (1stPC: N= 1123 and 2nd PC N=87)
b Percentages equal more than 100 percent because each respondent could choose more than one season.
Table 24a: Mean Percent of Time PC Is Used by Season
N Mean Standard Deviation Min Max
1st PC Winter 247 22.72 15.32 1 100 Spring 580 33.63 19.27 5 100 Summer 1,042 69.51 30.39 5 100 Fall 480 29.10 16.88 5 100
2nd PC Winter 20 19.85 7.74 5 100 Spring 36 24.11 12.98 5 70 Summer 83 74.33 31.04 10 100 Fall 33 32.27 22.37 10 100

Final Analysis of the 2009 California Survey of Registered Pleasure Craft Owners: Usage and Storage 21
Nearly one-half of registered owners (43%) said they used their PC 100 percent of the time in the summer (Table 25). Table 25: “Could You Please Estimate the Percentage of Time You Use Your Pleasure Craft in Each of the Following Seasons?”a
Winter Spring Summer Fall
Percentage N % N % N % N %
1st PC 1 to 10 62 25.1% 43 7.4% 7 0.7% 53 11.0% 11 to 20 33 13.4% 75 12.9% 16 1.5% 77 16.0% 21 to 30 137 55.5% 244 42.1% 170 16.3% 225 46.9% 31 to 40 2 0.8% 74 12.8% 72 6.9% 56 11.7% 41 to 50 6 2.4% 104 17.9% 152 14.6% 49 10.2% 51 to 60 -- -- 5 0.9% 51 4.9% 1 0.2% 61 to 70 1 0.4% 5 0.9% 43 4.1% 4 0.8% 71 to 80 -- -- 6 1.0% 67 6.4% 2 0.4% 81 to 90 -- -- -- -- 14 1.3% -- -- 91 to 99 -- -- -- -- 2 0.2% -- -- 100 6 -- 24 4.1% 448 43.0% 13 2.7%
Total 247b 100.0% 580b 100.0% 1,042b 100.0% 480b 100.0%
2nd PC 1 to 10 5 25.0% 8 22.2% 1 1.2% 4 12.1% 11 to 20 2 10.0% 3 8.3% -- -- 4 12.1% 21 to 30 13 65.0% 20 55.6% 315 18.1% 15 45.5% 31 to 40 -- -- 2 5.6% 3 3.6% 4 12.1% 41 to 50 -- -- 2 5.6% 9 10.8% 3 9.1% 51 to 60 -- -- -- -- 1 1.2% -- -- 61 to 70 -- -- 1 2.8% 3 3.6% -- -- 71 to 80 -- -- -- -- 6 7.2% 1 3.0% 81 to 90 -- -- -- -- 2 2.4% -- -- 91 to 99 -- -- -- -- -- -- -- -- 100 -- -- -- -- 43 51.8% 2 6.1%
Total 20 100.0% 36 100.0% 83 100.0% 33 100.0% a
Percentages may not sum to 100 percent due to rounding.
b Missing cases are respondents who said they did not know the percentage of time used in each season.

Final Analysis of the 2009 California Survey of Registered Pleasure Craft Owners: Usage and Storage 22
Usage Information on PC’s: Percentage Estimates by County and Waterways
Usage by county: More than one-third of respondents (36%) used their PC only in the county in which the PC is registered. Another one-third (34%) only used their PC outside their registered county (Table 26). Table 26: “Where Do You Typically Operate Your Pleasure Craft?”a
Number of cases Percentage
1st PC Inside registered county only 405 36.1% Outside county only 379 33.7% Both inside and outside county 334 29.7% Don't know/ refused 5 0.4%
Total 1,123 100.0%
2nd PC Inside registered county only 24 27.6% Outside your county only 34 39.1% Both inside and outside your county 26 29.9% Don't know/ refused 3 3.4%
Total 87 100.0% a Percentages may not sum to 100 percent due to rounding.
More than two-thirds (69%) of owners of registered PCs only used their PC in one or two counties (Table 27). Table 27: “In How Many Counties Do You Typically Use Your Pleasure Craft?”a
Counties Number of cases Percentage
1st PC 0 2b 0.2% 1 657 58.5% 2 224 19.9% 3 129 11.5% 4 57 5.1% 5 30 2.7% 6 to 10 9 0.8% 11 to 20 2 0.2% Don't know county/ refused 13 1.2%
Total 1,123 100.0%
2nd Pc 1 50 57.5% 2 14 16.1% 3 12 13.8% 4 5 5.7% 5 2 2.3% Don't know county/ refused 4 4.6%
Total 87 100.0% a Percentages may not sum to 100 percent due to rounding. b These two respondents said they only used their craft out of state.

Final Analysis of the 2009 California Survey of Registered Pleasure Craft Owners: Usage and Storage 23
Table 28 illustrates the responses to the top five counties of PC use. Answers were collapsed into one county variable. Los Angeles (10%) and Sacramento (9%) were the most common counties of use given. There were a significant number of respondents that did not know the county of usage (14%) or used their PC out of state (12%).

Final Analysis of the 2009 California Survey of Registered Pleasure Craft Owners: Usage and Storage 24
Table 28: “Please Tell Me in Which County You Use Your Pleasure Craft?”ab 1st PC 2nd PC
County N % N % Alameda 36 3.2% 2 2.3% Alpine 4 0.4% -- -- Amador 11 1.0% -- -- Butte 38 3.4% 3 3.4% Calaveras 18 1.6% -- 0.4% Colusa 13 1.2% 1 0.2% Contra Costa 64 5.7% 11 4.2% Del Norte 3 0.3% -- -- El Dorado 26 2.3% 1 1.1% Fresno 28 2.5% 2 0.7% Glenn 9 0.8% -- 0.7% Humboldt 12 1.1% 2 0.7% Imperial 3 0.3% 1 0.2% Inyo 11 1.0% -- 0.7% Kern 38 3.4% 1 1.3% Kings 6 0.5% -- -- Lake 38 3.4% 1 0.9% Lassen 12 1.1% -- 1.3% Los Angeles 112 10.0% 10 7.5% Madera 15 1.3% 2 0.9% Marin 26 2.3% 3 1.3% Mariposa 8 0.7% 1 0.2% Mendocino 13 1.2% -- 1.1% Merced 16 1.4% -- 0.4% Modoc 3 0.3% -- -- Mono 7 0.6% -- 0.9% Monterey 34 3.0% 1 2.9% Napa 33 2.9% 1 0.9% Nevada 31 2.8% 2 0.9% Orange 62 5.5% 4 2.4% Placer 24 2.1% 4 0.9% Plumas 18 1.6% 1 1.3% Riverside 47 4.2% 6 2.2% Sacramento 104 9.3% 10 4.8% San Benito 3 0.3% -- 0.2% San Bernardino 60 5.4% 8 1.1% San Diego 96 8.6% 7 4.6% San Francisco 43 3.8% 1 3.1% San Joaquin 75 6.7% 6 4.2% San Luis Obispo 47 4.2% 4 2.0% San Mateo 14 1.3% -- 1.1% Santa Barbara 18 1.6% -- 0.7% Santa Clara 17 1.5% -- 1.1% Santa Cruz 13 1.2% -- 0.7% Shasta 80 7.1% 9 3.5% Sierra 2 0.2% -- 0.4% Siskiyou 13 1.2% -- 1.1% Solano 30 2.7% 3 2.2% Sonoma 37 3.3% 1 1.3% Stanislaus 38 3.4% 1 2.0% Sutter 13 1.2% 1 0.7% Tehama 10 0.9% 1 0.7% Trinity 15 1.3% -- 0.9% Tulare 11 1.0% -- 0.2% Tuolumne 21 1.9% -- 1.5% Ventura 38 3.4% 2 1.8% Yolo 23 2.1% -- 2.0% Yuba 12 1.1% 1 0.7% Don’t Know County 159 14.2% 14 11.7% Out of State 133 11.9% 14 6.6%
a Percentages were figured using the total N size of respondents. (1st PC: N= 1,120 and 2nd PC N=87) Three respondents refused to answer this question.
b Answers were collapsed into one variable for respondents usage in top five counties.
Final Analysis of the 2009 California Survey of Registered Pleasure Craft Owners: Usage and Storage 25
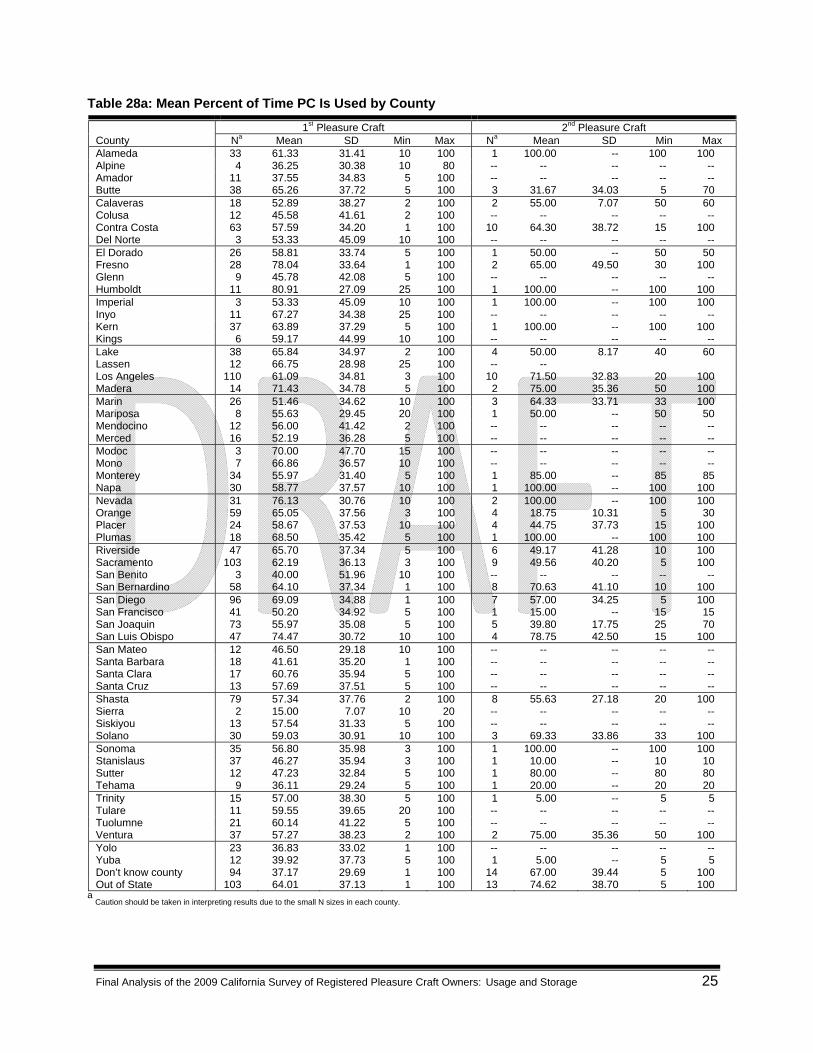
Table 28a: Mean Percent of Time PC Is Used by County
a Caution should be taken in interpreting results due to the small N sizes in each county.
1st Pleasure Craft 2nd Pleasure Craft County Na Mean SD Min Max Na Mean SD Min Max Alameda 33 61.33 31.41 10 100 1 100.00 -- 100 100 Alpine 4 36.25 30.38 10 80 -- -- -- -- -- Amador 11 37.55 34.83 5 100 -- -- -- -- -- Butte 38 65.26 37.72 5 100 3 31.67 34.03 5 70 Calaveras 18 52.89 38.27 2 100 2 55.00 7.07 50 60 Colusa 12 45.58 41.61 2 100 -- -- -- -- -- Contra Costa 63 57.59 34.20 1 100 10 64.30 38.72 15 100 Del Norte 3 53.33 45.09 10 100 -- -- -- -- -- El Dorado 26 58.81 33.74 5 100 1 50.00 -- 50 50 Fresno 28 78.04 33.64 1 100 2 65.00 49.50 30 100 Glenn 9 45.78 42.08 5 100 -- -- -- -- -- Humboldt 11 80.91 27.09 25 100 1 100.00 -- 100 100 Imperial 3 53.33 45.09 10 100 1 100.00 -- 100 100 Inyo 11 67.27 34.38 25 100 -- -- -- -- -- Kern 37 63.89 37.29 5 100 1 100.00 -- 100 100 Kings 6 59.17 44.99 10 100 -- -- -- -- -- Lake 38 65.84 34.97 2 100 4 50.00 8.17 40 60 Lassen 12 66.75 28.98 25 100 -- -- Los Angeles 110 61.09 34.81 3 100 10 71.50 32.83 20 100 Madera 14 71.43 34.78 5 100 2 75.00 35.36 50 100 Marin 26 51.46 34.62 10 100 3 64.33 33.71 33 100 Mariposa 8 55.63 29.45 20 100 1 50.00 -- 50 50 Mendocino 12 56.00 41.42 2 100 -- -- -- -- -- Merced 16 52.19 36.28 5 100 -- -- -- -- -- Modoc 3 70.00 47.70 15 100 -- -- -- -- -- Mono 7 66.86 36.57 10 100 -- -- -- -- -- Monterey 34 55.97 31.40 5 100 1 85.00 -- 85 85 Napa 30 58.77 37.57 10 100 1 100.00 -- 100 100 Nevada 31 76.13 30.76 10 100 2 100.00 -- 100 100 Orange 59 65.05 37.56 3 100 4 18.75 10.31 5 30 Placer 24 58.67 37.53 10 100 4 44.75 37.73 15 100 Plumas 18 68.50 35.42 5 100 1 100.00 -- 100 100 Riverside 47 65.70 37.34 5 100 6 49.17 41.28 10 100 Sacramento 103 62.19 36.13 3 100 9 49.56 40.20 5 100 San Benito 3 40.00 51.96 10 100 -- -- -- -- -- San Bernardino 58 64.10 37.34 1 100 8 70.63 41.10 10 100 San Diego 96 69.09 34.88 1 100 7 57.00 34.25 5 100 San Francisco 41 50.20 34.92 5 100 1 15.00 -- 15 15 San Joaquin 73 55.97 35.08 5 100 5 39.80 17.75 25 70 San Luis Obispo 47 74.47 30.72 10 100 4 78.75 42.50 15 100 San Mateo 12 46.50 29.18 10 100 -- -- -- -- -- Santa Barbara 18 41.61 35.20 1 100 -- -- -- -- -- Santa Clara 17 60.76 35.94 5 100 -- -- -- -- -- Santa Cruz 13 57.69 37.51 5 100 -- -- -- -- -- Shasta 79 57.34 37.76 2 100 8 55.63 27.18 20 100 Sierra 2 15.00 7.07 10 20 -- -- -- -- -- Siskiyou 13 57.54 31.33 5 100 -- -- -- -- -- Solano 30 59.03 30.91 10 100 3 69.33 33.86 33 100 Sonoma 35 56.80 35.98 3 100 1 100.00 -- 100 100 Stanislaus 37 46.27 35.94 3 100 1 10.00 -- 10 10 Sutter 12 47.23 32.84 5 100 1 80.00 -- 80 80 Tehama 9 36.11 29.24 5 100 1 20.00 -- 20 20 Trinity 15 57.00 38.30 5 100 1 5.00 -- 5 5 Tulare 11 59.55 39.65 20 100 -- -- -- -- -- Tuolumne 21 60.14 41.22 5 100 -- -- -- -- -- Ventura 37 57.27 38.23 2 100 2 75.00 35.36 50 100 Yolo 23 36.83 33.02 1 100 -- -- -- -- -- Yuba 12 39.92 37.73 5 100 1 5.00 -- 5 5 Don’t know county 94 37.17 29.69 1 100 14 67.00 39.44 5 100 Out of State 103 64.01 37.13 1 100 13 74.62 38.70 5 100

Final Analysis of the 2009 California Survey of Registered Pleasure Craft Owners: Usage and Storage 26
Usage by waterway:
More than one-half (52%) of respondents indicated they only used their PC on one waterway while nearly one-quarter (23%) used their PC on two waterways (Table 29). Table 29: “On How Many Different Waterways Do You Operate Your Pleasure Craft?”a
Waterways Number of cases Percentage
1st PC 1 587 52.3% 2 256 22.8%
3 131 11.7% 4 60 5.3% 5 25 2.2% 6 to 10 16 1.4% 11 to 20 5 0.4% 21 to 30 1 0.1% Don’t know/ refused 42 3.7%
Total 1,123 100.0%
2nd PC 1 45 51.7% 2 18 20.7% 3 12 13.8% 4 4 4.6% 5 4 4.6% 6 to 10 -- -- 11 to 20 1 1.1% 21 to 30 -- -- Don’t know/ refused 3 3.4%
Total 87 100.0% a Percentages may not sum to 100 percent due to rounding.
Table 30 shows the county, city and waterway (when applicable), however one-quarter (25%) of respondents gave an unspecified answer such as the Delta or Pacific Ocean. Common waterway names given were: Sacramento River/Sacramento Delta (11%) and Lake Havasu/Colorado River (10%).

Final Analysis of the 2009 California Survey of Registered Pleasure Craft Owners: Usage and Storage 27
Table 30: "Please List the Waterways Where You Use Your Pleasure Craft"ab
1st Pleasure Craft 2nd Pleasure Craft
County Waterway N % N % Alameda Oakland Estuary/ Alameda Bay/ Del Valle Reservoir 11 1.0% 1 1.2% Alpine Blue Lakes / Lake Alpine 9 0.8% -- -- Amador Camanche/Silver/Pardee/ Amador/Emerson/ Mokelumne River 25 2.3% 2 2.4% Butte Lake Oroville 29 2.7% 2 2.4%
Feather River 10 0.9% 2 2.4% Thermalito Afterbay 3 0.3% -- --
Calaveras New Hogan/Spring Valley/ New Melonies Reservoir/ Tulloch 31 2.9% 2 2.4% Colusa East Park Reservoir (Ladoga) 2 0.2% -- -- Contra Costa General Bay Area*/ San Pablo Bay 9 0.8% 1 1.2%
Discovery Bay/Specific area of Delta 6 0.6% 1 1.2% Maloney Reservior/ San Pablo Reservoir 4 0.4% -- --
El Dorado Ice House/ Stumpy Meadows Reservoir/Union Valley/ Loon/ Wright/ Desolation 13 1.2% 1 1.2%
El Dorado River 2 0.2% -- -- Lake Tahoe(also Placer County) 26 2.4% 1 1.2%
Fresno Lake Edison 3 0.3% -- -- Shaver Lake/ Huntington Lake 12 1.1% 1 1.2% Millerton Lake 4 0.4% -- -- Kings Lake 4 0.4% -- -- Pine Flat Lake 12 1.1% 1 1.2%
Glenn Stony Gorge Reservoir 1 0.1% -- -- Humboldt Big Lagoon/ Humboldt Bay 4 0.4% 1 1.2%
Fresh Water Lagoon 4 0.4% 2 2.4% Imperial Colorado River (specific location) 1 0.1% 1 1.2% Inyo Lake Sabrina/South Lake 7 0.6% -- --
Other, Inyo County 2 0.2% -- -- Kern Lake Buena Vista/Webber Lake 9 0.8% -- --
Lake Isabella 27 2.5% 1 1.2% Lake Clear Lake/ Pillsbury/ Indian Valley Reservoir 50 4.6% 3 3.6% Lassen Eagle Lake/ Lassen 13 1.2% -- -- Los Angeles Castaic Lake/ Lake Pyramid 31 2.9% -- --
Crystal Lake/ Little Rock Dam 2 0.2% -- -- Puddingstone Lake 9 0.8% -- -- LA Harbor/ Marina Del Rey/ Port of Long Beach/ San Pedro Bay 16 1.5% 2 2.4% Catalina Island 10 0.9% -- --
Madera Bass Lake 15 1.4% 1 1.2% Mammoth Pool Reservoir/Eastman Lake/ Hensley Lake 5 0.5% -- --
Marin Tomales Bay/ Ocean (specific location) 2 0.2% -- -- San Rafael Canal 1 0.1% -- -- Richardson Bay 2 0.2% 1 1.2%
Mariposa Lake McClure/ Lake McSwain 11 1.0% -- -- Yosemite 7 0.6% -- -- Merced River 1 0.1% -- --
Mendocino Lake Mendocino 8 0.7% -- -- Ocean (Specifically Mendocino County) 1 0.1% -- --
Merced San Luis Reservoir/ O'Neil Forebay 9 0.8% -- -- Mono Walker/June Lake /Grant Lake/ Parker 8 0.7% -- --
Twin Lakes /Bridgeport Reservoir/ Topaz Lake 5 0.5% -- -- Crowley Lake/ Convict Lake 10 0.9% -- --
Monterey Lake San Antonio 25 3.5% 2 2.4% Monterey Bay (also Santa Cruz County) 10 0.9% -- --
Napa Lake Berryessa/ Lake Hennessey 38 3.5% 2 2.4% Napa River 5 0.5% -- -- Other, Napa County 1 0.1% -- --
Nevada Lake of Pines/Rollings/ Wildwood/ Englebright Lake 20 1.9% 1 1.2% Scotts Flat Reservoir/ Donner Lake/ Boca Reservoir 10 0.9% 1 1.2% Fordyce/ Lake Spaulding/ Tulare 4 0.4% -- --
Orange Irvine 7 0.6% -- -- Dana Point Harbor/ Huntington Harbor/ Newport Harbor 15 1.4% 2 2.4%
Placer Placer 1 0.1% -- -- Hellhole 2 0.2% -- -- Sugar Pine Reservoir 1 0.1% -- --
Plumas Lake Almanor/ Butt Valley Reservoir 17 1.6% -- -- Bucks Lake/ Little Grass Valley Reservoir 6 0.6% 1 1.2%

Final Analysis of the 2009 California Survey of Registered Pleasure Craft Owners: Usage and Storage 28
Table 30 continued: "Please List the Waterways Where You Use Your Pleasure Craft”
1st Pleasure Craft 2nd Pleasure Craft
County Waterway N % N % Plumas Antelope Lake /Lake Davis 4 0.4% -- -- Riverside Salton Sea 2 0.2% -- --
Lake Perris 22 2.0% 1 1.2% Lake Elsinore/ Canyon 15 1.4% 2 2.4% Riverside/ Veil /Lake Skinner 4 0.4% 1 1.2% Diamond Valley Lake/ Lake Hemet 6 0.6% 1 1.2%
Sacramento Folsom Lake/Natomas/ Nimbus 34 3.1% 5 6.0% Sacramento River/ Sacramento Delta 113 10.5% 7 8.3% American River 11 1.0% 1 1.2% Cosumnes River 1 0.1% -- --
San Benito San Justo Reservoir 2 0.2% -- -- San Bernardino Big Bear Lake/Silverwood Lake /Lake Arrowhead 21 1.9% 2 2.4%
Lake Havasu/ Colorado River 105 9.7% 14 16.7% San Diego Mission Bay/ San Diego Bay/ Oceanside Harbor 39 3.6% 5 6.0%
El Capitan Lake/ Lake Cuyamaca 7 0.6% -- -- Hodges Reservoir/ San Vicente Reservoir/ Lake Jennings 6 0.6% -- -- Murray Reservoir/Lower Otay Lake 1 0.1% -- --
San Francisco San Francisco Bay 55 5.1% 3 3.6% Ocean (Specific location) 1 0.1% -- --
San Joaquin San Joaquin River/ Tinsley Island/ Other 26 2.4% 2 2.4% San Luis Obispo Lake Nacimiento 29 2.7% 3 3.6%
Santa Margarita Lake/ Lopez Lake 25 2.3% -- -- Morro Bay 1 0.1% -- -- Other, San Luis Obispo County 1 0.1% -- --
San Mateo Princeton Harbor/ Port of Redwood City/ Half Moon Bay 3 0.3% -- -- Santa Barbara Lake Cachuma/ Ocean (specific location) 7 0.6% -- -- Santa Clara Anderson Lake/ Coyote Lake 8 0.7% -- --
Milpitas/ Delta Area 2 0.2% -- -- Santa Cruz Pinto Lake 1 0.1% -- -- Shasta Shasta Lake/ Whiskeytown Lake/ Lake McCloud 80 7.4% 7 8.3%
Lake Britton/ Other, Shasta County 2 0.2% -- -- Sierra Stampede Reservoir/ Jackson Meadows Reservoir/ Gold Lake 6 0.6% -- -- Siskiyou Lake Siskiyou/ Tule Lake/Medicine Lake 8 0.7% -- --
Klamath River 4 0.4% -- -- Iron Gate Reservoir/ Lake Shastina/ Katherine 9 0.8% 2 2.4%
Solano Mare Island/ Suisun/ Rio Vista Delta 8 0.7% -- -- Lake Solano 1 0.1% -- --
Sonoma Lake Sonoma 18 1.7% -- -- Coast/ Petaluma River/ Other, Sonoma County 5 0.5% 1 1.2%
Stanislaus Woodward Reservoir/ Turlock Lake/ Modesto Reservoir 7 0.6% -- -- Tehama Black Butte Lake 8 0.7% -- -- Trinity Trinity Lake/ Ruth Lake 18 1.7% 2 2.4% Tulare Success Lake/ Kaweah Reservoir 6 0.6% -- -- Tuolumne Don Pedro Lake/ New Spicer Meadows Reservoir 29 2.7% 1 1.2% Ventura Channel Islands 4 0.4% 1 1.2%
Lake Piru 12 1.1% -- -- Yolo Beaver Lake 1 0.1% -- -- Yuba Yuba River 5 0.5% 1 1.2%
Bullards Bar Reservoir/ Camp Far West Lake 13 1.2% -- -- Collins Lake/ Eastlake 11 1.1.% 1 1.2%
Other Out of State 87 8.0% 17 20.2% Pacific Ocean 119 11.0% 12 14.3% Ocean, unspecific 46 4.3% 6 7.1%
Other River, unspecific 7 0.6% 4 4.8% Lake, unspecific 26 2.4% 3 3.6% Private body of water 2 0.2% -- -- Delta, unspecific 113 10.5% 13 15.5% Other, unspecific body of water 13 1.2% 1 1.2% Body of water given by respondent was unidentifiable 64 5.9% 2 2.4% No Answer/Don't Know/ Refused 77 7.1% 4 4.8%
a Percentage were figured using the total N size of respondents. (1st PC: N= 1,081 and 2nd PC N=84)
b Answers were collapsed into one variable for respondents usage in top five waterways.

Final Analysis of the 2009 California Survey of Registered Pleasure Craft Owners: Usage and Storage 29
Table 30a: Mean Percent of Time PC Is Used by Waterwaya 1st Pleasure Craft 2nd Pleasure Craft
County Waterway N Mean SD Min Max N Mean SD Min Max Alameda Oakland Estuary/ Alameda Bay/ Del Valle Reservoir 11 57.91 35.04 12 100 1 25.00 -- 25 25 Alpine Blue Lakes / Lake Alpine 9 38.22 28.00 5 100 -- -- -- -- -- Amador Camanche/Silver/Pardee/ Amador/Emerson/
Mokelumne River 25 33.20 31.32 3 100 2 29.00 5.66 25 33
Butte Lake Oroville 29 58.10 39.65 1 100 -- -- -- -- -- Feather River 10 39.50 26.08 10 100 2 70.00 42.43 40 100 Thermalito Afterbay 3 8.33 2.89 5 10 -- -- -- -- --
Calaveras New Hogan/Spring Valley/ New Melonies Reservoir/ Tulloch 29 48.28 33.35 10 100 2 56.50 33.23 33 80 Colusa East Park Reservoir (Ladoga) 2 57.50 60.10 15 100 -- -- -- -- -- Contra Costa General Bay Area/ San Pablo Bay 9 66.11 38.06 10 100 1 50.00 -- 50 50
Discovery Bay/Specific area of Delta 6 71.67 35.45 10 100 1 100.0 -- 100 100 Maloney Reservior/ San Pablo Reservoir 4 43.75 34.97 10 90 -- -- -- -- --
El Dorado Ice House/ Stumpy Meadows Reservoir/Union Valley/ Loon/ Wright/ Desolution 12 42.42 30.44 10 100 1 50.00 -- 50 50
El Dorado River 2 62.50 53.03 25 100 -- -- -- -- -- Lake Tahoe(also Placer County) 26 55.42 38.96 5 100 1 33.00 -- 33 33
Fresno Lake Edison 3 81.67 27.54 50 100 -- -- -- -- -- Shaver Lake/ Huntington Lake 11 53.64 32.26 20 100 1 50.00 -- 50 50 Millerton Lake 4 45.00 40.42 10 100 -- -- -- -- -- Kings Lake 4 76.25 47.50 5 100 -- -- -- -- -- Pine Flat Lake 12 66.67 33.93 10 100 1 100.0 -- 100 100
Glenn Stony Gorge Reservoir 1 40.00 -- 40 40 -- -- -- -- -- Humboldt Big Lagoon/ Humboldt Bay 4 30.50 23.69 2 50 -- -- -- -- --
Fresh Water Lagoon 4 95.00 10.00 80 100 2 90.00 14.14 80 100 Imperial Colorado River (specific location) 1 100.0 -- 100 100 1 100.0 -- 100 100 Inyo Lake Sabrina/South Lake 4 36.25 43.85 5 100 -- -- -- -- --
Other, Inyo County 2 55.00 63.64 10 100 -- -- -- -- -- Kern Lake Buena Vista/Webber Lake 9 30.00 18.88 10 60 -- -- -- -- --
Lake Isabella 27 57.96 33.49 10 100 1 100.0 -- 100 100 Lake Clear Lake/ Pillsbury/ Indian Valley Reservoir 48 54.33 40.89 2 100 1 100.0 -- 100 100 Lassen Eagle Lake/ Lassen 13 51.00 35.74 10 100 -- -- -- -- -- Los Angeles Castaic Lake/ Lake Pyramid 26 44.15 30.55 5 100 -- -- -- -- --
Crystal Lake/ Little Rock Dam 2 60.00 56.57 20 100 -- -- -- -- -- Puddingstone Lake 9 54.89 33.34 15 100 -- -- -- -- -- Los Angeles Harbor/ Marina Del Rey/ Port of Long Beach/ San Pedro Bay 16 61.44 36.83 10 100 2 37.50 17.68 25 50
Catalina Island 10 67.50 22.76 40 100 -- -- -- -- -- Madera Bass Lake 15 50.33 33.62 10 100 1 100.0 -- 100 100
Mammoth Pool Reservoir/Eastman Lake/ Hensley Lake 4 18.75 6.29 10 25 -- -- -- -- -- Marin Tomales Bay/ Ocean (specific location) 2 67.50 10.61 60 75 -- -- -- -- --
San Rafael Canal 1 100.0 -- 100 100 -- -- -- -- -- Richardson Bay 2 65.00 49.50 30 100 1 30.00 -- 30 30
Mariposa Lake McClure/ Lake McSwain 10 50.00 37.89 2 100 -- -- -- -- --

Final Analysis of the 2009 California Survey of Registered Pleasure Craft Owners: Usage and Storage 30
Table 30a continued: Mean Percent of Time PC Is Used by Waterway 1st Pleasure Craft 2nd Pleasure Craft
County Waterway N Mean SD Min Max N Mean SD Min Max Mariposa Yosemite 7 60.00 39.58 10 100 -- -- -- -- --
Merced River 1 100.0 -- 100 100 -- -- -- -- -- Mendocino Lake Mendocino 8 35.75 32.08 1 100 -- -- -- -- --
Ocean (Specifically Mendocino County) 1 100.0 -- 100 100 -- -- -- -- -- Merced San Luis Reservoir/ O'Neil Forebay 8 56.88 32.62 5 100 -- -- -- -- -- Mono Walker/June Lake /Grant Lake/ Parker 8 49.38 42.46 10 100 -- -- -- -- --
Twin Lakes /Bridgeport Reservoir/ Topaz Lake 4 43.75 36.37 10 80 -- -- -- -- -- Crowley Lake/ Convict Lake 8 56.88 41.23 10 100 -- -- -- -- --
Monterey Lake San Antonio 25 39.00 31.26 5 100 1 50.00 -- 50 50 Monterey Bay (also Santa Cruz County) 10 75.20 32.18 25 100 -- -- -- -- --
Napa Lake Berryessa/ Lake Hennessey 36 52.22 34.83 2 100 2 100.0 -- 100 100 Napa River 5 53.20 32.70 25 100 -- -- -- -- -- Other, Napa County 1 100.0 -- 100 100 -- -- -- -- --
Nevada Lake of Pines/Rollings/ Wildwood/ Englebright Lake 19 57.16 37.23 10 100 1 100.0 -- 100 100 Scotts Flat Reservoir/ Donner Lake/ Boca Reservoir 10 43.50 33.67 10 100 1 100.0 -- 100 100 Fordyce/ Lake Spaulding/ Tulare 4 21.25 13.15 10 40 -- -- -- -- --
Orange Irvine 7 57.86 38.93 10 100 -- -- -- -- -- Dana Point Harbor/ Huntington Harbor/ Newport Harbor 14 59.64 34.56 10 100 1 100.0 -- 100 100
Placer Placer 1 30.00 -- 30 30 -- -- -- -- -- Hellhole 2 17.50 10.61 10 25 -- -- -- -- -- Sugar Pine Reservoir 1 100.0 -- 100 100 -- -- -- -- --
Plumas Lake Almanor/ Butt Valley Reservoir 16 57.56 37.52 2 100 -- -- -- -- -- Bucks Lake/ Little Grass Valley Reservoir 6 46.67 41.43 15 100 1 100.0 -- 100 100 Antelope Lake /Lake Davis 4 28.75 14.36 20 50 -- -- -- -- --
Riverside Salton Sea 2 75.00 35.36 50 100 -- -- -- -- -- Lake Perris 22 42.09 29.03 5 100 1 10.00 -- 10 10 Lake Elsinore/ Canyon 15 44.67 32.96 7 100 1 15.00 -- 15 15 Riverside/ Veil /Lake Skinner 4 54.50 31.27 33 100 1 20.00 -- 20 20 Diamond Valley Lake/ Lake Hemet 6 51.00 38.40 20 100 1 20.00 -- 20 20
Sacramento Folsom Lake/Natomas/ Nimbus 34 62.24 35.31 5 100 4 67.00 28.04 33 100 Sacramento River/ Sacramento Delta 110 48.99 33.05 5 100 7 35.00 13.23 20 50 American River 11 43.45 31.13 5 100 1 33.00 -- 33 33 Cosumnes River 1 50.00 -- 50 50 -- -- -- -- --
San Benito San Justo Reservoir 2 75.00 35.36 50 100 -- -- -- -- -- San Bernardino Big Bear Lake/Silverwood Lake /Lake Arrowhead 21 56.29 36.08 5 100 1 100.0 -- 100 100
Lake Havasu/ Colorado River 97 65.73 35.54 1 100 12 78.75 30.16 5 100 San Diego Mission Bay/ San Diego Bay/ Oceanside Harbor 38 65.58 32.17 10 100 2 31.50 2.12 30 33
El Capitan Lake/ Lake Cuyamaca 5 44.00 33.62 20 100 -- -- -- -- -- Hodges Reservoir/ San Vicente Reservoir/ Lake Jennings 5 35.00 30.00 5 80 -- -- -- -- -- Murray Reservoir/Lower Otay Lake 1 20.00 -- 20 20 -- -- -- -- --
San Francisco San Francisco Bay 54 61.46 34.15 10 100 2 75.00 35.36 50 100 Ocean (Specific location) 1 70.00 -- 70 70 -- -- -- -- --
San Joaquin San Joaquin River/ Tinsley Island/ Other 26 51.54 30.58 9 100 1 50.00 -- 50 50

Final Analysis of the 2009 California Survey of Registered Pleasure Craft Owners: Usage and Storage 31
Table 30a continued: Mean Percent of Time PC Is Used by Waterway
1st Pleasure Craft 2nd Pleasure Craft
County Waterway N Mean SD Min Max N Mean SD Min Max San Luis Obispo Lake Nacimiento 29 54.59 35.55 10 100 3 83.33 28.87 50 100
Santa Margarita Lake/ Lopez Lake 21 38.33 32.84 5 100 -- -- -- -- -- Morro Bay 1 100.0 -- 100 100 -- -- -- -- -- Other, San Luis Obispo County 1 90.00 -- 90 90 -- -- -- -- --
San Mateo Princeton Harbor/ Port of Redwood City/ Half Moon Bay 3 66.67 49.33 10 100 -- -- -- -- -- Santa Barbara Lake Cachuma/ Ocean (specific location) 7 43.57 38.81 15 100 -- -- -- -- -- Santa Clara Anderson Lake/ Coyote Lake 8 28.75 30.68 5 100 -- -- -- -- --
Milpitas/ Delta Area 2 75.00 35.36 50 100 -- -- -- -- -- Santa Cruz Pinto Lake 1 20.00 -- 20 20 -- -- -- -- -- Shasta Shasta Lake/ Whiskeytown Lake/ Lake McCloud 72 55.92 36.75 3 100 7 47.57 37.70 13 100
Lake Britton/ Other, Shasta County 2 65.00 49.50 30 100 -- -- -- -- -- Sierra Stampede Reservoir/ Jackson Meadows Reservoir/
Gold Lake 6 22.50 4.18 20 30 -- -- -- -- --
Siskiyou Lake Siskiyou/ Tule Lake/Medicine Lake 7 31.43 14.92 15 50 -- -- -- -- -- Klamath River 4 53.25 31.55 25 98 -- -- -- -- -- Iron Gate Reservoir/ Lake Shastina/ Katherine 8 32.88 31.00 1 100 -- -- -- -- --
Solano Mare Island/ Suisun/ Rio Vista Delta 8 36.63 30.26 10 100 -- -- -- -- -- Lake Solano 1 10.00 -- 10 10 -- -- -- -- --
Sonoma Lake Sonoma 18 61.11 33.38 10 100 -- -- -- -- -- Coast/ Petaluma River/ Other, Sonoma County 5 36.00 12.94 25 50 -- -- -- -- --
Stanislaus Woodward Reservoir/ Turlock Lake/ Modesto Reservoir 6 40.67 28.72 10 89 -- -- -- -- -- Tehama Black Butte Lake 8 60.00 38.08 5 100 -- -- -- -- -- Trinity Trinity Lake/ Ruth Lake 17 52.47 39.32 5 100 2 16.00 5.66 12 20 Tulare Success Lake/ Kaweah Reservoir 6 63.00 42.19 5 100 -- -- -- -- -- Tuolumne Don Pedro Lake/ New Spicer Meadows Reservoir 29 52.76 36.79 3 100 -- -- -- -- -- Ventura Channel Islands 4 87.50 25.00 50 100 1 100.0 -- 100 100
Lake Piru 12 46.75 35.08 4 100 -- -- -- -- -- Yolo Beaver Lake 1 25.00 -- 25 25 -- -- -- -- -- Yuba Yuba River 5 24.60 11.33 5 33 -- -- -- -- --
Bullards Bar Reservoir/ Camp Far West Lake 13 39.92 24.14 1 90 -- -- -- -- -- Collins Lake/ Eastlake 11 35.45 35.25 5 100 -- -- -- -- --
Other Out of State 72 60.22 36.96 2 100 10 67.00 33.35 10 100 Pacific Ocean 119 76.92 31.70 5 100 11 85.00 30.08 5 100 Ocean, unspecific 45 67.64 36.04 10 100 4 66.25 39.45 25 100
Other River, unspecific 7 57.14 19.76 40 100 4 50.00 8.17 40 60 Private body of water 2 100.00 -- 100 100 -- -- -- -- -- Delta, unspecific 112 65.46 34.12 1 100 10 58.90 35.50 10 100 Other, unspecific body of water 12 58.75 35.43 10 100 1 25.00 -- 25 25 Body of water given by respondent was unidentifiable 61 53.15 36.10 5 100 2 70.00 42.43 40 100
a Caution should be taken in interpreting results due to the small N sizes in each waterway.

Final Analysis of the 2009 California Survey of Registered Pleasure Craft Owners: Usage and Storage 32
Storage Information on PC’s
Nearly three-quarters (74%) of respondents said their PC was stored with fuel in the tank (Table 31). Table 31: “Is Your Pleasure Craft Stored With Fuel In It?”a
Number of cases Percentage
1st PC Yes 832 74.1%
No 275 24.5%
Don't know/ refused 16 1.4%
Total 1,123 100.0%
2nd PC Yes 65 74.7%
No 21 24.1%
Don't know/refused 1 1.1%
Total 87 100.0% a Percentages may not sum to 100 percent due to rounding.
The majority (98%) of registered PC owners stored their PC in the same county throughout the year (Table 32). Table 32: “Do You Store Your Pleasure Craft in the Same Location Throughout the Year?”a
Number of cases Percentage
1st PC Yes 1,101 98.0%
No 18 1.6%
Don't know/refused 4 0.4%
Total 1,123 100.0%
2nd PC Yes 81 93.1%
No 6 6.9%
Total 87 100.0% a
Percentages may not sum to 100 percent due to rounding.
Table 33 shows the counties where the PC is stored throughout the year. San Diego and Los Angeles counties had the highest percentage of PCs stored throughout the year.

Final Analysis of the 2009 California Survey of Registered Pleasure Craft Owners: Usage and Storage 33
Table 33: “In What County Do You Store Your Pleasure Craft?”a
County 1st Pleasure Craft 2nd Pleasure Craft
Number of cases Percentage Number of cases Percentage Alameda 35 3.2% 2 2.5% Alpine 1 0.1% -- -- Amador 2 0.2% -- -- Butte 25 2.3% -- -- Calaveras 7 0.6% -- -- Colusa 3 0.3% -- -- Contra Costa 54 4.9% 7 8.6% Del Norte 1 0.1% -- -- El Dorado 10 0.9% 1 1.2% Fresno 17 1.5% 1 1.2% Glenn 3 0.3% -- -- Humboldt 11 1.0% -- -- Imperial 4 0.4% 1 1.2% Inyo 3 0.3% -- -- Kern 26 2.4% 2 2.5% Kings 6 0.5% -- -- Lake 18 1.6% 1 1.2% Lassen 2 0.2% -- -- Los Angeles 91 8.2% 11 13.6% Madera 10 0.9% 1 1.2% Marin 13 1.2% 1 1.2% Mariposa 2 0.2% -- -- Mendocino 5 0.5% -- -- Merced 7 0.6% -- -- Modoc 1 0.1% -- -- Mono 1 0.1% -- -- Monterey 9 0.8% -- -- Napa 14 1.3% -- -- Nevada 22 2.0% 1 1.2% Orange 66 6.0% 2 2.5% Placer 21 1.9% 3 3.7% Plumas 6 0.5% -- -- Riverside 44 4.0% 5 6.2% Sacramento 62 5.6% 6 7.4% San Benito 2 0.2% -- -- San Bernardino 38 3.4% 2 2.5% San Diego 75 6.8% 6 7.4% San Francisco 7 0.6% -- -- San Joaquin 37 3.3% 2 2.5% San Luis Obispo 31 2.8% 4 4.9% San Mateo 12 1.1% -- -- Santa Barbara 11 1.0% -- -- Santa Clara 31 2.8% 1 1.2% Santa Cruz 8 0.7% -- -- Shasta 30 2.7% 3 3.7% Siskiyou 11 1.0% 1 1.2% Solano 31 2.8% 2 2.5% Sonoma 30 2.7% 1 1.2% Stanislaus 23 2.1% 2 2.5% Sutter 7 0.6% 1 1.2% Tehama 7 0.6% 1 1.2% Trinity 2 0.2% -- -- Tulare 6 0.5% -- -- Tuolumne 11 1.0% -- -- Ventura 38 3.4% 3 3.7% Yolo 9 0.8% -- -- Yuba 7 0.6% -- -- Don't Know County 12 1.1% 1 1.2% Out of State 27 2.4% 6 7.4% Total 1,105b 100.0% 81b 100.0%
a Percentages may not sum to 100 percent due to rounding.
b Missing cases due to the respondents who did not store their PC in the same location throughout the year.

Final Analysis of the 2009 California Survey of Registered Pleasure Craft Owners: Usage and Storage 34
Seven-out-of-ten (71%) respondents stored their PC at their place of residence while only 16 percent stored their PC at a marina and ten percent in a storage facility (Table 34). Table 34: “Where Is Your Pleasure Craft Stored?”a
1st PC 2nd PC
Number of cases Percentage Number of cases Percentage
Home 782 70.8% 57 70.4%
Storage facility 105 9.5% 9 11.1%
Marina 176 15.9% 12 14.8%
Another residence 22 2.0% 3 3.7%
Other 6 0.5% -- --
Don't know/ refused 8 1.3% -- --
Total 1,105b 100.0% 81b 100.0% a
Percentages may not sum to 100 percent due to rounding. b
Missing cases due to the respondents who did not store their PC in the same location throughout the year.
Table 35 illustrates the county and location within the county where the PC is stored. The majority of people stored their PC at their residence regardless of the county of storage.

Final Analysis of the 2009 California Survey of Registered Pleasure Craft Owners: Usage and Storage 35
Table 35: Location of 1st Pleasure Craft by County of Storageab
a Percentages may not sum to 100 percent due to rounding.
County At Home Storage Facility Marina
Other Private Property Other
Don’t know/refused Total
N % N % N % N % N % N % Alameda 19 2.4% 4 3.8% 11 6.3% 1 4.5% -- -- -- -- 35 Alpine 1 0.1% -- -- -- -- -- -- -- -- -- -- 1 Amador 2 0.3% -- -- -- -- -- -- -- -- -- -- 2 Butte 22 2.8% -- -- 1 0.6% -- -- 2 28.6% -- -- 25 Calaveras 6 0.8% 1 1.0% -- -- -- -- -- -- -- -- 7 Colusa 1 0.1% 2 1.9% -- -- -- -- -- -- -- -- 3 Contra Costa 34 4.3% 7 6.7% 13 7.4% -- -- -- -- -- -- 54 Del Norte 1 0.1% -- -- -- -- -- -- -- -- -- -- 1 El Dorado 8 1.0% 2 1.9% -- -- -- -- -- -- -- -- 10 Fresno 14 1.8% 1 1.0% 1 0.6% 1 4.5% -- -- -- -- 17 Glenn 2 0.3% 1 1.0% -- -- -- -- -- -- -- -- 3 Humboldt 10 1.3% 1 1.0% -- -- -- -- -- -- -- -- 11 Imperial 4 0.5% -- -- -- -- -- -- -- -- -- -- 4 Inyo 3 0.4% -- -- -- -- -- -- -- -- -- -- 3 Kern 20 2.6% 3 2.9% 1 0.6% 1 4.5% 1 14.3% -- -- 26 Kings 5 0.6% 1 1.0% -- -- -- -- -- -- -- -- 6 Lake 11 1.4% 2 1.9% 3 1.7% 2 9.1% -- -- -- -- 18 Lassen 2 0.3% -- -- -- -- -- -- -- -- -- -- 2 Los Angeles 64 8.2% 7 6.7% 19 10.8% -- -- -- -- 1 7.7% 91 Madera 8 1.0% 2 1.9% -- -- -- -- -- -- -- -- 10 Marin 3 0.4% 1 1.0% 8 4.5% 1 4.5% -- -- -- -- 13 Mariposa 2 0.3% -- -- -- -- -- -- -- -- -- -- 2 Mendocino 4 0.5% 1 1.0% -- -- -- -- -- -- -- -- 5 Merced 6 0.8% -- -- 1 0.6% -- -- -- -- -- -- 7 Modoc 1 0.1% -- -- -- -- -- -- -- -- -- -- 1 Mono 1 0.1% -- -- -- -- -- -- -- -- -- -- 1 Monterey 5 0.6% 1 1.0% 3 1.7% -- -- -- -- -- -- 9 Napa 9 1.2% 1 1.0% 3 1.7% -- -- -- -- 1 7.7% 14 Nevada 16 2.0% 3 2.9% 1 0.6% 2 9.1% -- -- -- -- 22 Orange 37 4.7% 5 4.8% 22 12.5% 1 4.5% -- -- 1 7.7% 66 Placer 18 2.3% 3 2.9% -- -- -- -- -- -- -- -- 21 Plumas 5 0.6% -- -- 1 0.6% -- -- -- -- -- -- 6 Riverside 38 4.9% 4 3.8% 1 0.6% -- -- -- -- 1 7.7% 44 Sacramento 46 5.9% 5 4.8% 8 4.5% 1 4.5% -- -- 2 15.4% 62 San Benito 2 0.3% -- -- -- -- -- -- -- -- -- -- 2 San Bernardino 32 4.1% 4 3.8% 1 0.6% 1 4.5% -- -- -- -- 38 San Diego 39 5.0% 3 2.9% 29 16.5% 2 9.1% -- -- 2 15.4% 75 San Francisco -- -- -- -- 7 4.0% -- -- -- -- -- -- 7 San Joaquin 28 3.6% 2 1.9% 6 3.4% -- -- -- -- 1 7.7% 37 San Luis Obispo 22 2.8% 4 3.8% 3 1.7% 2 9.1% -- -- -- -- 31 San Mateo 6 0.8% 3 2.9% 2 1.1% -- -- 1 14.3% -- -- 12 Santa Barbara 7 0.9% 1 1.0% 3 1.7% -- -- -- -- -- -- 11 Santa Clara 24 3.1% 4 3.8% 2 1.1% 1 4.5% -- -- -- -- 31 Santa Cruz 3 0.4% -- -- 4 2.3% 1 4.5% -- -- -- -- 8 Shasta 25 3.2% 2 1.9% 3 1.7% -- -- -- -- -- -- 30 Siskiyou 11 1.4% -- -- -- -- -- -- -- -- -- -- 11 Solano 25 3.2% 3 2.9% 3 1.7% -- -- -- -- -- -- 31 Sonoma 25 3.2% 1 1.0% 1 0.6% 3 13.6% -- -- -- -- 30 Stanislaus 22 2.8% 1 1.0% -- -- -- -- -- -- -- -- 23 Sutter 6 0.8% 1 1.0% -- -- -- -- -- -- -- -- 7 Tehama 7 0.9% -- -- -- -- -- -- -- -- -- -- 7 Trinity 2 0.3% -- -- -- -- -- -- -- -- -- -- 2 Tulare 5 0.6% -- -- 1 0.6% -- -- -- -- -- -- 6 Tuolumne 9 1.2% 1 1.0% -- -- -- -- 1 14.3% -- -- 11 Ventura 27 3.5% 3 2.9% 7 4.0% 1 4.5% -- -- -- -- 38 Yolo 7 0.9% 1 1.0% 1 0.6% -- -- -- -- -- -- 9 Yuba 7 0.9% -- -- -- -- -- -- -- -- -- -- 7 Don’t Know County 2 0.3% 4 3.8% 1 0.6% 1 4.5% -- -- 4 30.8% 12 Out of State 11 1.4% 9 8.6% 5 2.8% -- -- 2 28.6% -- -- 27 Total 782 100.0% 105 100.0% 176 100.0% 22 100.0% 7 100.0% 13 100.0% 1,105
b Missing cases due to the respondents who did not store their PC in the same locations throughout the year. (N=18)

Final Analysis of the 2009 California Survey of Registered Pleasure Craft Owners: Usage and Storage 36
Table 35: Pleasure Craft Storage by Season and Countyab
County Season Home Storage Facility Marina
N % N % N % Alameda Winter 1 5.6% -- -- -- --
Spring 1 5.6% -- -- -- -- Summer 1 5.6% -- -- -- -- Fall 2 11.1% -- -- -- --
Butte Winter -- -- -- -- -- -- Spring 1 5.6% -- -- -- -- Summer -- -- -- -- -- -- Fall 1 5.6% -- -- -- --
Calaveras Winter -- -- -- -- -- -- Spring -- -- -- -- -- -- Summer 1 5.6% -- -- -- -- Fall -- -- -- -- -- --
Contra Costa Winter 1 5.6% -- -- -- -- Spring 2 11.1% -- -- -- -- Summer 1 5.6% -- -- -- -- Fall 1 5.6% -- -- -- --
El Dorado Winter -- -- -- -- -- -- Spring -- -- -- -- -- -- Summer 1 5.6% -- -- -- -- Fall 1 5.6% -- -- -- --
Humboldt Winter -- -- -- -- -- -- Spring -- -- -- -- -- -- Summer -- -- -- -- -- -- Fall 1 5.6% -- -- -- --
Inyo Winter 2 11.1% -- -- -- -- Spring 1 5.6% -- -- 1 5.6% Summer -- -- -- -- 1 5.6% Fall 1 5.6% -- -- 1 5.6%
Los Angeles Winter -- -- 1 5.6% -- -- Spring -- -- 1 5.6% -- -- Summer -- -- -- -- -- -- Fall -- -- 1 5.6% -- --
Mariposa Winter -- -- -- -- -- -- Spring -- -- -- -- -- -- Summer -- -- 1 5.6% -- -- Fall -- -- -- -- -- --
Mono Winter -- -- -- -- -- -- Spring -- -- -- -- -- -- Summer 1 5.6% -- -- -- -- Fall -- -- -- -- -- --
Napa Winter -- -- -- -- 1 5.6% Spring -- -- -- -- -- -- Summer -- -- -- -- -- -- Fall -- -- -- -- -- --
Nevada Winter -- -- -- -- -- -- Spring 1 5.6% -- -- -- -- Summer 1 5.6% -- -- -- -- Fall -- -- -- -- -- --
Orange Winter -- -- -- -- -- -- Spring -- -- -- -- -- -- Summer 1 5.6% -- -- -- -- Fall 1 5.6% -- -- -- --
Plumas Winter 1 5.6% -- -- -- -- Spring -- -- -- -- -- -- Summer 1 5.6% -- -- -- -- Fall -- -- -- -- -- --
Riverside Winter -- -- -- -- -- -- Spring 1 5.6% -- -- -- -- Summer -- -- -- -- -- -- Fall -- -- -- -- -- --
Sacramento Winter -- -- 1 5.6% -- -- Spring -- -- 1 5.6% -- -- Summer -- -- -- -- -- -- Fall -- -- -- -- -- --

Final Analysis of the 2009 California Survey of Registered Pleasure Craft Owners: Usage and Storage 37
Table 35 continued: Pleasure Craft Storage by Season and Countyab
County Season Home Storage Facility Marina
N % N % N % San Bernardino Winter 2 11.1% 1 5.6% -- --
Spring 1 5.6% -- -- 1 5.6% Summer -- -- -- -- 1 5.6% Fall 2 11.1% -- -- 1 5.6%
San Diego Winter -- -- -- -- -- -- Spring 1 5.6% -- -- -- -- Summer 1 5.6% -- -- -- --
Fall 1 5.6% -- -- -- -- San Francisco Winter -- -- -- -- 1 5.6% Spring -- -- -- -- -- -- Summer -- -- -- -- -- -- Fall -- -- -- -- -- -- San Joaquin Winter 1 5.6% -- -- -- -- Spring 1 5.6% -- -- -- -- Summer -- -- -- -- -- -- Fall 1 5.6% -- -- -- -- Santa Clara Winter -- -- 1 5.6% -- -- Spring -- -- -- -- -- -- Summer -- -- -- -- -- -- Fall -- -- -- -- -- -- Shasta Winter 1 5.6% -- -- -- -- Spring 1 5.6% -- -- -- -- Summer 1 5.6% -- -- -- -- Fall -- -- -- -- -- -- Sierra Winter -- -- -- -- -- -- Spring -- -- -- -- -- -- Summer -- -- 1 5.6% -- -- Fall -- -- -- -- -- -- Solano Winter -- -- -- -- -- --
Spring 1 5.6% -- -- -- -- Summer 1 5.6% -- -- -- -- Fall 1 5.6% -- -- -- --
Tuolumne Winter -- -- -- -- -- -- Spring -- -- -- -- -- -- Summer -- -- 1 5.6% -- -- Fall -- -- -- -- -- --
Ventura Winter -- -- -- -- 1 5.6% Spring -- -- -- -- 1 5.6% Summer -- -- -- -- 1 5.6% Fall 1 5.6% -- -- -- --
Out of State Winter 2 11.1% -- -- -- -- Spring 1 5.6% -- -- -- -- Summer 1 5.6% -- -- -- -- Fall -- -- -- -- -- --
Total -- -- -- -- -- -- a
Percentage was figured using the total number of respondents (N=18).
b Percentages equal more than 100 percent.
Final Analysis of the 2009 California Survey of Registered Pleasure Craft Owners: Usage and Storage 38
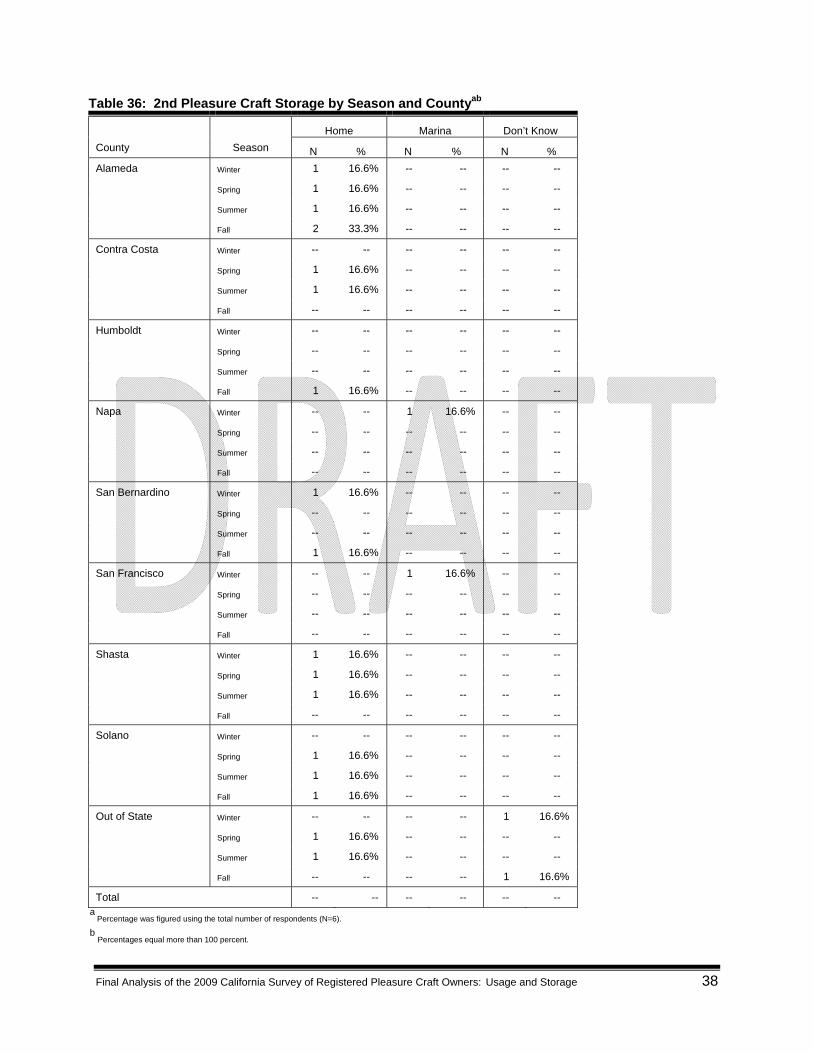
Table 36: 2nd Pleasure Craft Storage by Season and Countyab
County Season Home Marina Don’t Know
N % N % N % Alameda Winter 1 16.6% -- -- -- --
Spring 1 16.6% -- -- -- --
Summer 1 16.6% -- -- -- --
Fall 2 33.3% -- -- -- --
Contra Costa Winter -- -- -- -- -- --
Spring 1 16.6% -- -- -- --
Summer 1 16.6% -- -- -- --
Fall -- -- -- -- -- --
Humboldt Winter -- -- -- -- -- --
Spring -- -- -- -- -- --
Summer -- -- -- -- -- --
Fall 1 16.6% -- -- -- --
Napa Winter -- -- 1 16.6% -- --
Spring -- -- -- -- -- --
Summer -- -- -- -- -- --
Fall -- -- -- -- -- --
San Bernardino Winter 1 16.6% -- -- -- --
Spring -- -- -- -- -- --
Summer -- -- -- -- -- --
Fall 1 16.6% -- -- -- --
San Francisco Winter -- -- 1 16.6% -- --
Spring -- -- -- -- -- --
Summer -- -- -- -- -- --
Fall -- -- -- -- -- --
Shasta Winter 1 16.6% -- -- -- --
Spring 1 16.6% -- -- -- --
Summer 1 16.6% -- -- -- --
Fall -- -- -- -- -- --
Solano Winter -- -- -- -- -- --
Spring 1 16.6% -- -- -- --
Summer 1 16.6% -- -- -- --
Fall 1 16.6% -- -- -- --
Out of State Winter -- -- -- -- 1 16.6%
Spring 1 16.6% -- -- -- --
Summer 1 16.6% -- -- -- --
Fall -- -- -- -- 1 16.6%
Total -- -- -- -- -- -- a
Percentage was figured using the total number of respondents (N=6).
b Percentages equal more than 100 percent.

Final Analysis of the 2009 California Survey of Registered Pleasure Craft Owners: Usage and Storage 39
Demographics Table 37: “Which of the Following Age Groups Includes You?”a
Number of Cases Percentage
Under 18 2 0.2%
18-24 17 1.5%
25-44 198 17.6%
45-64 598 53.3%
65 and over 303 27.0%
Refused 5 0.4%
Total 1,123 100.0% a
Percentages may not sum to 100 percent due to rounding.
Table 38: “What Is Your Gender?”a
Number of Cases Percentage
Male 934 83.2%
Female 189 16.8%
Total 1,123 100.0% a Percentages may not sum to 100 percent due to rounding.

Final Analysis of the 2009 California Survey of Registered Pleasure Craft Owners: Usage and Storage 40
Appendix Pleasure Craft Survey Created by: The Institute for Social Research at California State University, Sacramento Introduction: Hello my name is __________ and I am a student calling from California State University, Sacramento on behalf of the California Air Resources Board. We are collecting information on boats and personal water crafts in the state of California. The questions are easy to answer and should only take about 5-10 minutes depending on your responses. I am calling about a <year> <make> <model> registered to <owner>. Q: Screen1 Do you or someone in your household use this <craft>? (KEY)
1. Yes 2. No, don’t have <craft> anymore (sold, gave away etc.) 3. No, owner has moved 4. No, wrong number, don’t know anything about <craft> 5. No, boat owner is deceased 6. DON’T KNOW 7. REFUSED
If (QScreen1 >1) skip to not qualified Q: Screen2 May I speak with the registered owner or a person that is familiar with or most often uses the <craft>? (KEY)
1. Owner agrees to be interviewed 2. Another person agrees to be interviewed 3. Appropriate person is not available (schedule callback)
GENERAL INFO Q1. How many engines does your<craft> use for propulsion? (KEY)
1. 1 engine 2. 2 engines 3. 3 or more engines 4. DON’T KNOW 5. REFUSED
Final Analysis of the 2009 California Survey of Registered Pleasure Craft Owners: Usage and Storage 41
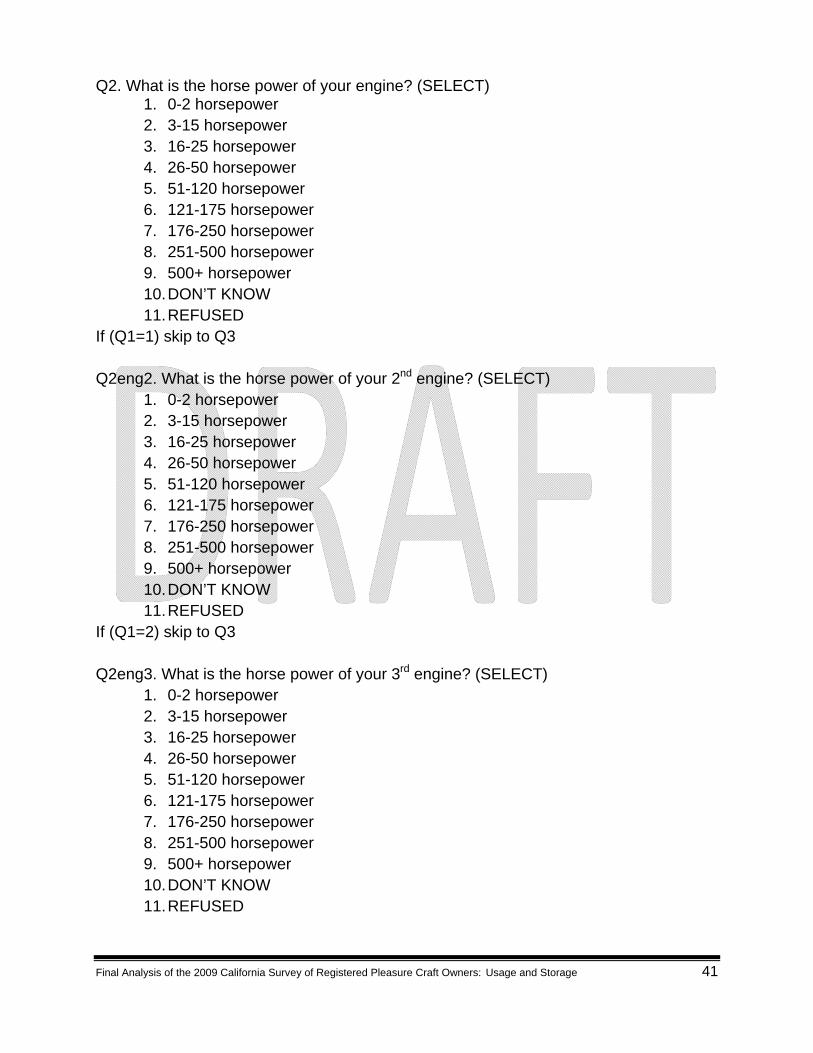
Q2. What is the horse power of your engine? (SELECT) 1. 0-2 horsepower 2. 3-15 horsepower 3. 16-25 horsepower 4. 26-50 horsepower 5. 51-120 horsepower 6. 121-175 horsepower 7. 176-250 horsepower 8. 251-500 horsepower 9. 500+ horsepower 10. DON’T KNOW 11. REFUSED
If (Q1=1) skip to Q3 Q2eng2. What is the horse power of your 2nd engine? (SELECT)
1. 0-2 horsepower 2. 3-15 horsepower 3. 16-25 horsepower 4. 26-50 horsepower 5. 51-120 horsepower 6. 121-175 horsepower 7. 176-250 horsepower 8. 251-500 horsepower 9. 500+ horsepower 10. DON’T KNOW 11. REFUSED
If (Q1=2) skip to Q3 Q2eng3. What is the horse power of your 3rd engine? (SELECT)
1. 0-2 horsepower 2. 3-15 horsepower 3. 16-25 horsepower 4. 26-50 horsepower 5. 51-120 horsepower 6. 121-175 horsepower 7. 176-250 horsepower 8. 251-500 horsepower 9. 500+ horsepower 10. DON’T KNOW 11. REFUSED

Final Analysis of the 2009 California Survey of Registered Pleasure Craft Owners: Usage and Storage 42
Q3. Does/do the engine(s) use a carburetor or fuel injection? (KEY) 1. CARBURETOR 2. FUEL INJECTION 3. DON’T KNOW 4. REFUSED
Q4. Has/have the engine(s) in your <craft> ever been replaced? 1. Yes 2. No 3. DON’T KNOW 4. REFUSED If (Q4 >1) skip to Q5 Q4a. Was the engine(s) a new or a rebuilt engine?
1. NEW ENGINE 2. REBUILT ENGINE 3. DON’T KNOW 4. REFUSED
Q4b. What is the model year of the engine(s)? (NUM) _YYYY__ Q5. What type of fuel do you use in your <craft>? (KEY)
1. Gasoline 2. Diesel 3. DON’T KNOW 4. REFUSED
If (ans <> 1) skip to Q6 Q5a. Is it a 2 stroke or 4 stroke? (KEY)
1. 2 STROKE 2. 4 STROKE 3. DON’T KNOW 4. REFUSED
Q6. How many fuel tanks does your <craft> have? (KEY w OTH)
1. 1 tank 2. 2 tanks 3. OTHER __________ 4. DON’T KNOW 5. REFUSED

Final Analysis of the 2009 California Survey of Registered Pleasure Craft Owners: Usage and Storage 43
Q6a. What size is your fuel tank? ___________ Gallons (NUM) INTERVIEWER NOTE: IF RESPONDENT SAYS DON’T KNOW ENTER 98 AND FOR REFUSED ENTER 99. If (Q6=1) skip to Q7 Q6a2nd. What size is your 2nd fuel tank? ___________ Gallons (NUM) INTERVIEWER NOTE: IF RESPONDENT SAYS DON’T KNOW ENTER 98 AND FOR REFUSED ENTER 99. Q7. What material is the fuel tank made of? (KEY)
1. Metal 2. Plastic 3. Fiberglass 4. Other_________________ 5. DON’T KNOW 6. REFUSED
If (Q6=1) skip to Q8 Q72nd. What material is the 2ND fuel tank made of? (KEY)
1. Metal 2. Plastic 3. Fiberglass 4. Other_________________ 5. DON’T KNOW 6. REFUSED
Q8. We have the overall length of your vessel as <DMV record for Length>. Is this correct? (KEY)
1. Yes 2. No 3. DON’T KNOW 4. REFUSED
If (ans =1, 3, or 4) skip to Q9 Q8a. What is the correct length of your vessel? (NUM) ________FEET _______INCHES INTERVIEWER NOTE: IF RESPONDENT SAYS DON’T KNOW ENTER 98 AND FOR REFUSED ENTER 99.
Final Analysis of the 2009 California Survey of Registered Pleasure Craft Owners: Usage and Storage 44
USAGE Q9. On average, how many days did you operate your <craft> in the last 12 months? (NUM) _____________ Days INTERVIEWER NOTE: IF RESPONDENT SAYS DON’T KNOW ENTER 98 AND FOR REFUSED ENTER 99. Q10. On a typical day of use, approximately how many hours do you operate (with the engine on) your <craft>? (NUM) _________ Hours INTERVIEWER NOTE: IF RESPONDENT SAYS DON’T KNOW ENTER 98 AND FOR REFUSED ENTER 99. Q11. How many times do you usually start the engine successfully on a typical day of use? (NUM) __________ Times INTERVIEWER NOTE: IF RESPONDENT SAYS DON’T KNOW ENTER 98 AND FOR REFUSED ENTER 99. Q12. When do you use your <craft>? (KEY)
1. Weekends only (Sat-Sun) 2. Weekdays only (Mon-Fri) 3. Both weekends and weekdays (Mon-Sun) 4. DON’T KNOW 5. REFUSED
If (ans < 3) skip to Q13 Q12a. Could you please estimate the percent of time you use the <craft> on the weekends compared to the weekdays? (Select w/Other)
1. Weekends ___________________ 2. Weekdays _______________________ 3. Total____________________________ 4. DON’T KNOW 5. REFUSED
INTERVIEWER NOTE: THE TOTAL SHOULD EQUAL 100 PERCENT. PLEASE VERIFY AND ENSURE THE TOTAL IS 100 PERCENT. Q13. In which seasons do you use your <craft>?
1. Winter (Dec- Jan-Feb) 2. Spring (Mar- Apr-May) 3. Summer (June-July-Aug) 4. Fall (Sep-Oct-Nov) 5. DON’T KNOW 6. REFUSED
Final Analysis of the 2009 California Survey of Registered Pleasure Craft Owners: Usage and Storage 45
Q13a. Could you please estimate the percentage you use your <craft> in each of the following seasons? (Select w/Other)
1. Winter _________ 2. Spring __________ 3. Summer _________ 4. Fall _____________ 5. Total ____________ 6. DON’T KNOW 7. REFUSED
INTERVIEWER NOTE: THE TOTAL SHOULD EQUAL 100 PERCENT. PLEASE VERIFY AND ENSURE THE TOTAL IS 100 PERCENT. Q13b. Was the use of your <pleasure craft> in 2007 more than, less than, or the same as 2008?
1. MORE THAN 2. LESS THAN 3. SAME 4. DON’T KNOW 5. REFUSED
If (ans =2) skip to Q13d, If (ans >2) skip to Q14 Q13c. Please estimate how many more days you used your <Pleasure craft> in 2007 compared to 2008? (NUM) ________________ more days in 2007 than 2008. Q13d. Please estimate how many more days you used your <Pleasure craft> in 2008 compared to 2007? (NUM) ________________ more days in 2008 than 2007. Q14. Our records indicate your <craft> is registered in <DMV record of county>. Is that correct? (KEY)
1. Yes 2. No 3. DON’T KNOW 4. REFUSED
If (ans =1) skip to Q14b

Final Analysis of the 2009 California Survey of Registered Pleasure Craft Owners: Usage and Storage 46
Q14a. In Which county is your <craft> registered ? (SELECT ONLY ONE) 1. Alameda 21. Marin 41. San Mateo 2. Alpine 22. Mariposa 42. Santa Barbara 3. Amador 23. Mendocino 43. Santa Clara 4. Butte 24. Merced 44. Santa Cruz 5. Calaveras 25. Modoc 45. Shasta 6. Colusa 26. Mono 46. Sierra 7. Contra Costa 27. Monterey 47. Siskiyou 8. Del Norte 28. Napa 48. Solano 9. El Dorado 29. Nevada 49. Sonoma 10. Fresno 30. Orange 50. Stanislaus 11. Glenn 31. Placer 51. Sutter 12. Humboldt 32. Plumas 52. Tehama 13. Imperial 33. Riverside 53. Trinity 14. Inyo 34. Sacramento 54. Tulare 15. Kern 35. San Benito 55. Tuolumne 16. Kings 36. San Bernardino 56. Ventura 17. Lake 37. San Diego 57. Yolo 18. Lassen 38. San Francisco 58. Yuba 19. Los Angeles 39. San Joaquin 59. Don’t Know County 20. Madera 40. San Luis Obispo 60. Out of State Q14b. Do you only use your <craft> in that county? (KEY)
1. Yes 2. No 3. DON’T KNOW 4. REFUSED
If (ans =1) skip to Q17 Q15. Where do you typically operate your < craft>? (KEY)
1. Outside your county 2. Both inside and outside your county 3. Unsure of county where it is used if 4. DON’T KNOW 5. REFUSED
If (ans =3) skip to Q17 Q15a. In how many counties do you use the <craft>? (NUM) _____________ INTERVIEWER NOTE: IF RESPONDENT SAYS DON’T KNOW ENTER 98 AND FOR REFUSED ENTER 99. T16. The next few questions will pertain to the top 5 counties in which you use the <craft> most often. INTERVIEWER NOTE: WE ARE INTERESTED IN THE COUNTIES WHERE THEY USE THE PLEASURE CRAFT THE MOST OFTEN (UP TO 5 COUNTIES)

Final Analysis of the 2009 California Survey of Registered Pleasure Craft Owners: Usage and Storage 47
Q16. Please tell me in which counties you use your <craft>? (SELECT 5 THAT APPLY) 1. Alameda 21. Marin 41. San Mateo 2. Alpine 22. Mariposa 42. Santa Barbara 3. Amador 23. Mendocino 43. Santa Clara 4. Butte 24. Merced 44. Santa Cruz 5. Calaveras 25. Modoc 45. Shasta 6. Colusa 26. Mono 46. Sierra 7. Contra Costa 27. Monterey 47. Siskiyou 8. Del Norte 28. Napa 48. Solano 9. El Dorado 29. Nevada 49. Sonoma 10. Fresno 30. Orange 50. Stanislaus 11. Glenn 31. Placer 51. Sutter 12. Humboldt 32. Plumas 52. Tehama 13. Imperial 33. Riverside 53. Trinity 14. Inyo 34. Sacramento 54. Tulare 15. Kern 35. San Benito 55. Tuolumne 16. Kings 36. San Bernardino 56. Ventura 17. Lake 37. San Diego 57. Yolo 18. Lassen 38. San Francisco 58. Yuba 19. Los Angeles 39. San Joaquin 59. Don’t Know County 20. Madera 40. San Luis Obispo 60. Out of State Q16a. Could you please estimate the percentage of time you use the < craft> in each county? (SEL & OTH) SHOW County 1______________ SHOW County 2_____________ SHOW County 3_____________ SHOW County 4_____________ SHOW County 5_____________ INTERVIEWER NOTE: IF THEY SAY DON’T KNOW ENTER 98 INTO COUNTY ONE. IF THEY SAY REFUSED PLEASE ENTER 99 INTO COUNTY ONE. PLEASE ENSURE THE TOTAL IS EQUAL TO 100 PERCENT. IF IT DOES NOT = 100 THAN VERFIY EVERY ANSWER. Q17. Please list the water ways on which you use your < craft>? (SEL & OTH) 1________________________ 2________________________ 3________________________ 4________________________ 5________________________ INTERVIEWER NOTE: IF THEY SAY DON’T KNOW ENTER 98 INTO ONE. IF THEY SAY REFUSED PLEASE ENTER 99 INTO ONE.

Final Analysis of the 2009 California Survey of Registered Pleasure Craft Owners: Usage and Storage 48
Q17a. Could you please estimate the percentage of time the <craft> is operated on each waterway? (NUM) SHOW answer 1______________________ SHOW answer 2______________________ SHOW answer 3______________________ SHOW answer 4______________________ SHOW answer 5______________________ INTERVIEWER NOTE: IF THEY SAY DON’T KNOW ENTER 98 INTO ANSWER ONE. IF THEY SAY REFUSED PLEASE ENTER 99 INTO ANSWER ONE. PLEASE VERFIY AND ENSURE THE TOTAL IS 100 PERCENT. STORAGE Q18. Is your <craft> stored with fuel in the tank? (KEY)
1. Yes 2. No 3. DON’T KNOW 4. REFUSED
Q19. Do you store your <craft> in the same location throughout the year? (KEY)
1. Yes 2. No 3. DON’T KNOW 4. REFUSED
If (ans >1) skip to T20 Q19a. In which county do you store your <craft>? ______________(Open ended) INTERVIEWER NOTE: IF RESPONDENT SAYS DON’T KNOW ENTER 98 AND FOR REFUSED ENTER 99. Q19b. Where is your <craft> stored? (KEY) 1. At home 2. At a storage facility 3. At a marina 4. Other _____________ 5. DON’T KNOW 6. REFUSED Skip to Q21 T20. The next series of questions pertains to where your pleasure craft is stored during each of the following seasons. (KEY) INTERVIEWER NOTE: ENTER 1 TO CONTINUE

Final Analysis of the 2009 California Survey of Registered Pleasure Craft Owners: Usage and Storage 49
Q20acoun. In which county do you store your <craft> in the winter (Dec-Jan-Feb)? ____________ (Open ended) INTERVIEWER NOTE: IF RESPONDENT SAYS DON’T KNOW ENTER 98 AND FOR REFUSED ENTER 99. Q20a. Where is your <craft> stored during the winter (Dec-Jan-Feb)? (KEY) 1. At home 2. At a storage facility 3. At a marina 4. Other _____________
5. DON’T KNOW 6. REFUSED
Q20bcoun. In which county do you store your <craft> in the spring (Mar-Apr-May)? _____________ (Open ended) INTERVIEWER NOTE: IF RESPONDENT SAYS DON’T KNOW ENTER 98 AND FOR REFUSED ENTER 99. Q20b. Where is your <craft> stored during the spring (Mar-Apr-May)? (KEY) 1. At home 2. At a storage facility 3. At a marina 4. Other _____________
5. DON’T KNOW 6. REFUSED Q20ccoun. In which county do you store your <craft> in the summer (June-July-Aug)? ____________ (Open ended) INTERVIEWER NOTE: IF RESPONDENT SAYS DON’T KNOW ENTER 98 AND FOR REFUSED ENTER 99. Q20c. Where is your <craft> stored during the summer (June-July-Aug)? (KEY) 1. At home 2. At a storage facility 3. At a marina 4. Other _____________
5. DON’T KNOW 6. REFUSED Q20dcoun. In which county do you store your <craft> in the fall (Sep-Oct-Nov)?__________ (Open ended) INTERVIEWER NOTE: IF RESPONDENT SAYS DON’T KNOW ENTER 98 AND FOR REFUSED ENTER 99.

Final Analysis of the 2009 California Survey of Registered Pleasure Craft Owners: Usage and Storage 50
Q20d. Where is your <craft> stored during the fall (Sep-Oct-Nov)? (KEY) 1. At home 2. At a storage facility 3. At a marina 4. Other _____________
5. DON’T KNOW 6. REFUSED
OTHER PLEASURE CRAFTS Q21. Do you own any other boats or personal water crafts? (KEY)
1. Yes 2. No 3. DON’T KNOW 4. REFUSED
If (ans>1) skip to QAGE Q22. I would like to ask you about this other <craft>, this should only take a few more minutes now that you are familiar with the questions. Would that be okay? (KEY)
1. Yes 2. No 3. DON’T KNOW 4. REFUSED
If (ans>1) skip to QAGE Q22a. Please provide the model year of that craft?(NUM) __YYYY__ Q22b. the make? _________________ (Openended) Q22c. the model? ________________ (Openended) Q22d. Pleasure craft type?__________(Openended) Q232nd. How many engines does this craft use for propulsion? (KEY)
1. 1 engine 2. 2 engines 3. 3 or more engines 4. DON’T KNOW 5. REFUSED

Final Analysis of the 2009 California Survey of Registered Pleasure Craft Owners: Usage and Storage 51
Q232nd. What is the horse power of the engine? (SELECT) 1. 0-2 horsepower 2. 3-15 horsepower 3. 16-25 horsepower 4. 26-50 horsepower 5. 51-120 horsepower 6. 121-175 horsepower 7. 176-250 horsepower 8. 251-500 horsepower 9. 500+ horsepower 10. DON’T KNOW 11. REFUSED
INTERVIEWER NOTE: IF THEY SAID MORE THAN ONE ENGINE IN THE PREVIOUS QUESTION PLEASE SAY 1ST ENGINE. If (Q232nd=1) skip to Q24 Q23eng2. What is the horse power of your 2nd engine? (SELECT)
1. 0-2 horsepower 2. 3-15 horsepower 3. 16-25 horsepower 4. 26-50 horsepower 5. 51-120 horsepower 6. 121-175 horsepower 7. 176-250 horsepower 8. 251-500 horsepower 9. 500+ horsepower 10. DON’T KNOW 11. REFUSED
If (Q232nd =2) skip to Q24 Q23eng3. What is the horse power of your 3rd engine? (SELECT)
1. 0-2 horsepower 2. 3-15 horsepower 3. 16-25 horsepower 4. 26-50 horsepower 5. 51-120 horsepower 6. 121-175 horsepower 7. 176-250 horsepower 8. 251-500 horsepower 9. 500+ horsepower 10. DON’T KNOW
Final Analysis of the 2009 California Survey of Registered Pleasure Craft Owners: Usage and Storage 52
11. REFUSED Q24. Does/do the engine(s) use a carburetor or fuel injection? (KEY)
1. CARBURETOR 2. FUEL INJECTION 3. DON’T KNOW 4. REFUSED
Q25. Has/have the engine(s) in your <craft> ever been replaced? 1. Yes 2. No 3. DON’T KNOW 4. REFUSED If (q25>1) skip to Q26 Q25a. Was the engine(s) a new or a rebuilt engine?
1. NEW ENGINE 2. REBUILT ENGINE 3. DON’T KNOW 4. REFUSED
Q26. What is the model year of the engine(s)? (NUM) _YYYY__ Q27. What type of fuel do you use in your <craft>? (KEY)
1. Gasoline 2. Diesel 3. DON’T KNOW 4. REFUSED
If (ans <> 1) skip to Q28 Q26a. Is it a 2 stroke or 4 stroke? (KEY)
1. 2 STROKE 2. 4 STROKE 3. DON’T KNOW 4. REFUSED
Q28. How many fuel tanks does your <craft> have? (KEY w OTH)
1. 1 tank 2. 2 tanks 3. OTHER _________ 4. DON’T KNOW 5. REFUSED

Final Analysis of the 2009 California Survey of Registered Pleasure Craft Owners: Usage and Storage 53
Q28a. What size is your fuel tank? ___________ Gallons (NUM) INTERVIEWER NOTE: IF RESPONDENT SAYS DON’T KNOW ENTER 98 AND FOR REFUSED ENTER 99. If (Q6=1) skip to Q29 Q28a2nd. What size is your 2nd fuel tank? ___________ Gallons (NUM) INTERVIEWER NOTE: IF RESPONDENT SAYS DON’T KNOW ENTER 98 AND FOR REFUSED ENTER 99. Q29. What material is the fuel tank made of? (KEY)
1. Metal 2. Plastic 3. Fiberglass 4. Other_________________ 5. DON’T KNOW 6. REFUSED
If (Q6=1) skip to Q28 Q292nd. What material is the 2ND fuel tank made of? (KEY)
1. Metal 2. Plastic 3. Fiberglass 4. Other_________________ 5. DON’T KNOW 6. REFUSED
Q30. Is any of the usage or storage information for this craft different than the information already collected? 1. Yes 2. No 3. DON’T KNOW 4. REFUSED If (Q28=1) skip to Q9, If (Q28=3) skip to Q9 (repeat 2nd PC) QAGE. Which of the following age groups includes you? (KEY) 1. Under 18 2. 18-24 3. 25-44 4. 45-64 5. 65+ 6. DON’T KNOW 7. REFUSED

Final Analysis of the 2009 California Survey of Registered Pleasure Craft Owners: Usage and Storage 54
QGEND. What is your gender? (KEY) 1. Male 2. Female 3. DON’T KNOW 4. REFUSED END SCRIPT: Thanks, those are all the questions I have for you. Thank you for your time. If you are interested in learning more about this study you can visit the Air Resources board online at www.arb.ca.gov.


