FINAL-062509-Failure Analysis Report VolI-rev
121
K:\PROJECTS\60095742 - TVA\Final\FINAL Revisions\Volume 1\completed\FINAL-062509-Failure_Analysis_Report_VolI-rev.doc Root Cause Analysis of TVA Kingston Dredge Pond Failure on December 22, 2008 Volume I – Summary Report Volume II – Geological and Field Explorations Volume III – Laboratory Testing and Results Volume IV – Seepage and Stability Analyses Kingston Fossil Plant, Harriman, Tennessee Project No. 60095742 June 25, 2009
Transcript of FINAL-062509-Failure Analysis Report VolI-rev

K:\PROJECTS\60095742 - TVA\Final\FINAL Revisions\Volume 1\completed\FINAL-062509-Failure_Analysis_Report_VolI-rev.doc
Root Cause Analysis of TVA Kingston Dredge Pond Failure on December 22, 2008
Volume I – Summary Report Volume II – Geological and Field Explorations Volume III – Laboratory Testing and Results Volume IV – Seepage and Stability Analyses
Kingston Fossil Plant, Harriman, Tennessee Project No. 60095742 June 25, 2009

AECOM
AECOM750 Corporate Woods Parkway, Vernon Hills, IL 60061T 847.279.2500 F 847.279.2510 www.aecom.com
June 25, 2009
Mr. Ralph E. RodgersTennessee Valley Authority400 West Summit Hill DriveKnoxville, Tennessee 37902-1401
RE: Root Cause Analysis Report, TVA Kingston Dredge Pond Failure - AECOM Project No. 60095742
Dear Mr. Rodgers:
AECOM has completed the four volume set containing our Root Cause Analysis of the December 22, 2008Failure of the Ash Disposal Cells at the Tennessee Valley Authority (TVA) Kingston Fossil Plant in RoaneCounty, Tennessee. This report summarizes field exploration, laboratory testing, analysis and the evaluation ofprobable failure modes leading to failure.
We have been pleased to provide our engineering services for this project. If you have questions or commentsregarding the information presented herein or if we may provide further assistance, please contact us.
Respectfully,~~4t~William H. Walton, P.E., S.E.Senior Principal EngineerVice President
Tennessee Professional EngineerLicense No. 00110328Expiration Date 12/31/09
.~. ~~¿~William ButlerSenior eotechnical Engineer
Tennessee Professional EngineerLicense No. 00110967Expiration Date 12/31/10
(Ç AECOM 2009, ALL RIGHTS RESERVED
Attachments
~l,\lIlU"'ll~.~.:\\\.L1AM ~lR#
","; ~, .......... ~./~"##:
...... O...~t.1lED !'Ñ...y)l~~1$.. t)l: -d Ø'. ~lt. ~\'- .ti.a~ ~ ~.,,~.-S ! II .;;-:~\:ø i. . .. . .. a . .!tn~ : E.. ~. II ..~ ..~ ~o~:t ,,~l: ~t.:'~..O \lUE\\C ib'" ..r;yl:~.. 'l-....001109...cJ"'..
~.~..O.lt..II.tI~\~J~l.~~... t: TE~\"\~..."I/"ii,,"'~
K:\PROJECTS\60095742 - TVA\Final\FINAL RevisionsWolume 1\FINAL-062209-Failure _ Analysis_Report_ Voll.doc

K:\PROJECTS\60095742 - TVA\Final\FINAL Revisions\Volume 1\completed\FINAL-062509-Failure_Analysis_Report_VolI-rev.doc
Root Cause Analysis of TVA Kingston Dredge Pond Failure on December 22, 2008 Kingston Fossil Plant, Harriman, Tennessee
Volume I – RCA Report Project No. 60095742 June 25, 2009

AECOM
K:\PROJECTS\60095742 - TVA\Final\FINAL Revisions\Volume 1\completed\FINAL-062509-Failure_Analysis_Report_VolI-rev.doc
Table of Contents Volume I – RCA Report Part 1
1.1 Introduction............................................................................1 1.1.1 General.........................................................................1 1.1.2 Objectives and Scope of Work.....................................1 1.2 Site History and Ash Pond Development ..............................3 1.2.1 General.........................................................................3 1.2.2 Site Prior to 1951 .........................................................3 1.2.3 Site Development from 1951 to 1958 ..........................3 1.2.4 Site Development from 1958 to 1996 ..........................4 1.2.5 Site Development from 1996 to 2008 ..........................5 1.2.6 Dredge Pond Design, Permit and Construction Records............................................8 1.2.6.1 Pre-failure Field and Laboratory Exploration ...............9 1.2.6.2 Pre-failure Stability Analyses .....................................10 1.2.6.3 Construction of Upstream Dikes ................................11 1.2.6.4 Dredge Cell Filling Rates ...........................................12 1.2.7 Chronology of Failure.................................................13 1.2.8 Post Failure Observations..........................................15 1.3 Field Exploration..................................................................17 1.3.1 General Field Explorations.........................................17 1.3.2 Field Observations to Locate Relics ..........................18 1.3.2.2 High Water Marks ......................................................19 1.3.3 Geology......................................................................20 1.3.3.1 Regional Geology.......................................................20 1.3.3.2 Site Geology...............................................................20 1.3.3.2.1 Soils..................................................................20 1.3.3.2.2 Bedrock Geology..............................................21 1.3.3.2.3 Regional Groundwater .....................................23 1.3.3.2.4 Seismic Activity ................................................23 1.3.3.3 Site Hydrology............................................................24 1.3.4 Field Exploration ........................................................24 1.3.4.2 General Ash and Soil Descriptions ............................25 1.3.4.3 100-Series Findings ...................................................27 1.3.4.4 200-Series Findings ...................................................27 1.3.4.5 300-Series Findings ...................................................27 1.3.4.6 400-Series Findings ...................................................28

AECOM
K:\PROJECTS\60095742 - TVA\Final\FINAL Revisions\Volume 1\completed\FINAL-062509-Failure_Analysis_Report_VolI-rev.doc
1.3.4.7 500-Series Findings ...................................................28 1.3.4.8 600-Series Findings ...................................................28 1.3.4.9 700 and 800-Series Findings .....................................28 1.3.5 Test Excavations........................................................29 1.3.5.1 Spillway Test Trenches No. 1 and No. 2....................29 1.3.5.2 Cell 1 Test Trench No. 3 ............................................30 1.3.6 Geophysical Surveys .................................................32 1.3.6.1 Methodology...............................................................32 1.3.6.2 Summary ....................................................................33 1.4 Laboratory Testing and Results ..........................................34 1.4.1 General.......................................................................34 1.4.2 Geotechnical Index Tests, Gradations and Classification .......................................................35 1.4.3 Proctor Density Tests.................................................36 1.4.4 Hydraulic Conductivity Testing...................................36 1.4.5 Direct Shear Testing ..................................................36 1.4.6 Triaxial Shear Strength Testing .................................36 1.4.7 Direct Simple Shear Testing ......................................38 1.4.8 Consolidation Testing.................................................38 1.4.9 Tube Photographs......................................................38 1.4.10 Scanning Electron Microscopy Analysis of Slimes ....39 1.4.11 pH Testing of Ash.......................................................39 1.4.12 Carbon Content Testing of Ash..................................39 1.5 Summary of Parameters Used For Analysis.......................40 1.5.1 Sluiced Ash ................................................................40 1.5.2 Dikes ..........................................................................45 1.5.2.1 Ash Dikes (Compacted Ash) ......................................45 1.5.2.2 Dike C Fill at Perimeter of Dredge Cell ......................46 1.5.2.3 Railroad Embankment................................................46 1.5.3 Alluvial Clays, Silts, and Silty Sands..........................46 1.5.4 Slimes and Young Interface Clay...............................48 1.6 Seepage and Stability Analyses..........................................51 1.6.1 Selection of Seepage and Stability Analysis Sections ..................................51 1.6.2 Seepage Analysis ......................................................51 1.6.2.1 Calibration to Historic Data ........................................51 1.6.2.2 Summary of Cross Sections.......................................52 1.6.2.3 Dredge Cell No. 2 Northwest - Analysis.....................52 1.6.2.4 Dredge Cell No. 2 Southwest - Analysis ....................53 1.6.2.5 Phase I Emergency Dredge Cell East - Analysis.......53 1.6.3 Stability Analysis ........................................................54 1.6.3.1 Stability Model ............................................................54

AECOM
K:\PROJECTS\60095742 - TVA\Final\FINAL Revisions\Volume 1\completed\FINAL-062509-Failure_Analysis_Report_VolI-rev.doc
1.6.3.2 Stability Model Parameters ........................................54 1.6.3.3 Infinite Slope Analysis ................................................56 1.6.3.3.1 Dry Slope..........................................................56 1.6.3.3.2 Seepage Parallel to Slope................................56 1.6.3.3.3 Seepage Emerging from the Slope..................57 1.6.3.4 Dredge Cell No. 2 Northwest – Analysis....................57 1.6.3.5 Limit Equilibrium Method Analysis by SLOPE/W.......58 1.6.3.5.1 Stage 1 – Pre-Failure of the Upstream Dike Area.........................................58 1.6.3.5.2 Stage 2 – Stability Analysis of the Failure at the Upstream Dikes..........................59 1.6.3.5.3 Stage 3 – Stability of Dike C Pre- and Post-Failure of the Upstream Dikes ..........59 1.6.3.5.4 Stage 4 – Stability of an Upstream Dredge Cell Progressive Failure ......................60 1.6.3.5.5 Dredge Cell No. 2 Southwest...........................60 1.6.3.5.6 Phase I Emergency Dredge Cell East - Analysis..........................................................61 1.6.3.6 Cell 2 Simple Wedge Block Analysis .........................62 1.6.3.7 Flow Slide Analysis ....................................................63 1.6.3.8 Evaluation and Conclusions of the RCA Stability Analyses ..............................................64 1.7 Failure Modes Analyses......................................................69 1.7.1 General.......................................................................69 1.7.2 Earthquake Shaking and other Vibration Sources.....69 1.7.3 Excess Rainfall...........................................................69 1.7.4 Rapid Reservoir Draw Down......................................70 1.7.5 Karstic Limestone Sinkhole or Bedrock Instability .....71 1.7.6 Artesian Groundwater Instability ................................71 1.7.7 Shallow Dike Instability Due to Seepage Outbreak on Slopes or a Piping Failure......72 1.7.8 Intermediate Depth Instability of Dredge Cell or its Dikes..................................................................74 1.7.9 Deep Seated Instability of Dredge Cell through Ash Only .......................................................74 1.7.10 Increased Filling Rates into Dredge Cells.................75 1.7.11 Deep Seated Instability along a Weak Foundation Layer .............................................76 1.7.12 Consequential Undrained Failure of Ash Causing Flow Slide (Static Liquefaction) ........78 1.7.13 Progressive Failure of Fill after Initial Cell 2 and Dike C Breach .....................................................79

AECOM
K:\PROJECTS\60095742 - TVA\Final\FINAL Revisions\Volume 1\completed\FINAL-062509-Failure_Analysis_Report_VolI-rev.doc
1.7.14 Summary ....................................................................80 1.8 Summary of Root Cause Analysis ......................................81 1.9 References ..........................................................................84 1.9.1 TVA Documents Reviewed ........................................84 1.9.2 Technical References Cited by AECOM for RCA......99 1.10 AECOM’s Project Team...........................................102
AECOM’s Project Team
AECOM Organizational Chart, Schedule and Resumes
Tables
Part 2 Figures Photographs Appendix A – AECOM Proposal

AECOM
K:\PROJECTS\60095742 - TVA\Final\FINAL Revisions\Volume 1\completed\FINAL-062509-Failure_Analysis_Report_VolI-rev.doc
Table of Contents Volume II – Geological and Field Explorations
Part 1 2.1 Geological and Field Explorations 1 2.1.1 General 1 2.1.2 Field Observations to Locate Relics 2 2.1.2.1 Description and Purpose 2 2.1.2.2 Methods 2 2.1.2.3 Observations 3 2.1.3 Geology 4 2.1.3.1 Physiographic Setting 4 2.1.3.2 Native Soils 4 2.1.3.3 Bedrock Geology 5 2.1.3.4 Regional Groundwater Information 7 2.1.3.5 Seismic Activity 7 2.1.4 Field Explorations 7 2.1.4.1 CPTu Testing 8 2.1.4.2 Soil Borings 10 2.1.4.3 Vane Shear Testing 12 2.1.4.4 Undisturbed Sampling 13 2.1.4.5 Site Instrumentation 13 2.1.5 Test Excavations 14 2.1.5.1 Test Trenches No. 1 and No. 2 – Search for Outfall Pipe 14 2.1.5.2 Test Trench No. 3 – South Dike 16 2.1.6 Topographic Surveys 19 2.1.7 Geophysical Surveys 20
References

AECOM
K:\PROJECTS\60095742 - TVA\Final\FINAL Revisions\Volume 1\completed\FINAL-062509-Failure_Analysis_Report_VolI-rev.doc
Figures Figure 2.1.1_1 Site Feature Map
Figure 2.1.2_2 Field Exploration Location Diagram
Figure 2.1.4_1 Cross Section 100 Series Boreholes
Figure 2.1.4_2 Cross Section 200 Series Boreholes
Figure 2.1.4_3 Cross Section 400 Series Boreholes
Figure 2.1.4_4 Cross Section 600 Series Boreholes
Part 2 Appendices Appendix 2A – Relics Location Data
Appendix 2B – Geology
Appendix 2C – CPTu Soundings
Series 100 – 300
Part 3 Appendix 2C – CPTu Soundings
Series 400 – 800
Part 4 Appendix 2D – CPTu Dissipation Tests
Series 100 – 800
Appendix 2E – SPT Soil Borings
Series 100 - 900
Appendix 2F – GRL Report
Appendix 2G – Vane Shear Tests
Appendix 2H – Site Instrumentation
Appendix 2I – Geophysical Surveys
AECOM
K:\PROJECTS\60095742 - TVA\Final\FINAL Revisions\Volume 1\completed\FINAL-062509-Failure_Analysis_Report_VolI-rev.doc
Table of Contents Volume III – Laboratory Testing Part 1 3.1 Laboratory Testing and Results 1 3.1.1 Geotechnical Index Tests, Gradations and Classification 1 3.1.2 Proctor Tests 3 3.1.3 Hydraulic Conductivity Testing 5 3.1.4 Direct Shear Testing 8 3.1.5 Consolidation Testing 8 3.1.6 Triaxial Testing 15 3.1.6.1 Equipment and General Procedure 15 3.1.6.2 Tests on Undisturbed Cohesive Soils 18 3.1.6.3 Tests on Reconstituted Granular Samples 19 3.1.7 Tube Photographs 23 3.2 Testing Program at University of Massachusetts 46 3.3 Microscopy Analysis on Slimes 48
Appendices Appendix 3A - Index Tests Series 100 - 800
Appendix 3B - Proctor Tests
Appendix 3C - Hydraulic Conductivity Testing
Appendix 3D - Direct Shear Testing
Appendix 3E - Consolidation Testing Series 100
Part 2 Appendix 3E - Consolidation Testing (continued) Series 200 – 600
AECOM
K:\PROJECTS\60095742 - TVA\Final\FINAL Revisions\Volume 1\completed\FINAL-062509-Failure_Analysis_Report_VolI-rev.doc
Part 3 Appendix 3F - Triaxial Testing
Appendix 3G - Tube Photographs (by boring series)
Appendix 3H - University of Massachusetts Report Clay - CIU Reconstituted Ash – CIU Reconstituted Ash – CIU Reconstituted Ash – CKU Reconstituted Ash – RTXE
Appendix 3I - University of Kentucky Petrographic Analysis

AECOM
K:\PROJECTS\60095742 - TVA\Final\FINAL Revisions\Volume 1\completed\FINAL-062509-Failure_Analysis_Report_VolI-rev.doc
Table of Contents Volume 4 – Seepage and Stability Analyses
4.1 Hydrology 1 4.1.1 Site Hydrology 1 4.2 Seepage Analysis 2 4.3 Stability Analysis 3 4.3.1 General 3 4.3.2 Stability Model Parameters 3 4.3.3 Limit Equilibrium Analysis 5 4.3.3.1 Dredge Cell No. 2 Northwest 5 4.3.3.2 Dredge Cell No. 2 Southwest 5 4.3.3.3 Phase I Emergency Dredge Cell East 5 4.3.4 Cell 2 Wedge Block Stability Analysis 6 4.3.5 Infinite Slope Analysis 6 4.3.6 Flow Slide Analysis 6 4.4 Dredge Cell Filling Rates 7
Appendices Appendix 4A - Hydrology
Appendix 4B - Seepage Analysis
Appendix 4C - Stability Analysis
Appendix 4D - Dredge Cell Filling Rates

AECOM
K:\PROJECTS\60095742 - TVA\Final\FINAL Revisions\Volume 1\completed\FINAL-062509-Failure_Analysis_Report_VolI-rev.doc
1
1.1 Introduction 1.1.1 General Just after 1:00 a.m. Eastern Standard Time (EST) December 22, 2008, the dikes and contents of Dredge Cell 2
slid suddenly beyond the limits of the containment dikes and covered water bodies and uplands owned by the
Tennessee Valley Authority (TVA), inundated eight acres of private property, severely damaging three homes
and had ash and dike material spill out into the former Emory River channel which is now known as Watts Bar
Reservoir. TVA surveyors estimated 5.4 million cubic yards of ash were released. TVA started an immediate
recovery effort by surveying the failure, shoring up unfailed dikes, managing water flowing from Swan Pond
Creek, re-establishing the railroad line to the coal-fired fossil plant, re-establishing Swan Pond Road and Swan
Pond Circle roadways and installing instrumentation along Dike D. TVA also monitored the Watts Bar Reservoir
for ash transport downstream and offsite fugitive ash dust movement. Efforts were also made by the TVA to
regrade the failure mass to reduce fugitive ash dust emissions.
On January 8, 2009 AECOM Technology Corporation (AECOM) was selected to visit the site and begin a full-
time Root Cause Analysis (RCA) of the dredge cell failure. TVA offered archival search assistance, heavy
equipment operators and surveyors to study and access the site, thereby allowing AECOM to perform forensic,
geologic and geotechnical exploration and measurement studies. AECOM has been working on this assignment
on a full-time basis since January 8, 2009 to the date of this report.
Figure 1.1.1_1 presents a site plan with pertinent features labeled. This figure serves as a site map and legend
for key project features.
1.1.2 Objectives and Scope of Work AECOM was retained to perform a Root Cause Analysis (RCA) of the December 22, 2008 dredge cell failure to
determine the most probable cause(s) and location of failure at the site. AECOM conducted interviews, reviewed
project files, performed site reconnaissance, drilled test borings, advanced piezocone probes, collected
undisturbed samples, observed test pits, logged test trenches, performed laboratory testing and conducted
seepage and stability analyses to define the probable failure mode leading up the sudden failure. A summary of
the RCA methodology employed by AECOM follows:
• Define the problem
• Gather physical data/evidence
• Identify the technical issues impacting failure
• Perform testing and analyses
• Identify the root causes (most probable failure scenario)
• Report the findings
• Peer review remedial designs by others at Kingston and to check if the designs are consistent with the
post-failure geotechnical conditions encountered in AECOM investigations

AECOM
K:\PROJECTS\60095742 - TVA\Final\FINAL Revisions\Volume 1\completed\FINAL-062509-Failure_Analysis_Report_VolI-rev.doc
2
AECOM was not assigned to opine or offer services in the following areas:
• Review the standard of practice used by TVA or their consultants for the design and construction of the
ash ponds and dredge cells
• Review the fate and transport of potential ash and possible contaminates from the cells into
environment
• Design of remedial construction measures to clean-up and restore the Kingston site
• Review of designs and operations at other TVA wet dredge cell disposal sites
It was not AECOM’s charge to implement the restoration program nor was it to institute performance monitoring
to ensure effectiveness of the restoration/cleanup program. This work was and will be performed by TVA or by
consultants and contractors retained by TVA.

AECOM
K:\PROJECTS\60095742 - TVA\Final\FINAL Revisions\Volume 1\completed\FINAL-062509-Failure_Analysis_Report_VolI-rev.doc
3
1.2 Site History and Ash Pond Development 1.2.1 General The Kingston fly ash and bottom ash storage site is located near Harriman, Roane County, Tennessee adjacent
to the Watts Bar Reservoir and over a former flood plain area. The site is on TVA property north of the Kingston
Fossil Fuel fired power generation station. The site is located over flood plain that lies between the former Swan
Pond Creek and Emory River. Two overall site plans showing the oldest (1941) and latest USGS (1998)
topographic quadrangles are shown as Figures 1.2.1_1 and 1.2.1_2, respectively.
1.2.2 Site Prior to 1951 The TVA provided AECOM with a copy of the 1924 aerial and plane table survey that shows the flood plain area
between Swan Pond Creek and the original Emory River channel. The map shows 5-foot contour lines for the
flood plain area. This copy of this survey is shown on Figure 1.2.2_1 with the 5-foot contours in red. The river
level at the time of the 1924 survey is below elevation 710, reported approximately six miles upstream of the
present dredge cell on the former Emory River, just downstream of the village of Harriman, Tennessee. Figure
1.2.2_2 shows the TVA map that was used to depict the land to be flooded by the Watts Bar Dam and new
reservoir. According to TVA records, the Watts Bar dam gates were closed in December 1941 to start filling the
reservoir. Figure 1.2.2_3 shows an aerial photograph of the inundated flood plain or Watts Bar Reservoir in
1949 before the Kingston Power Plant was constructed. The 1949 aerial photograph was marked up by
AECOM to show the approximate limits of the future ash pond containment Dike C. Figure 1.2.2_4 shows the
1940 contours superimposed onto the pre-failure May, 2008 landfill survey to show old and new topographic
features.
1.2.3 Site Development from 1951 to 1958 This time frame represents the period of design, construction, and initial operations of the coal fired power plant
immediately south of the future ash pond site. According to TVA records, the fossil plant began construction in
1951 and the first unit at Kingston was on-line during February 1954 with ash slurry discharged directly to the
slack water area created by Watts Bar Reservoir. Figures 1.2.3_1 and 1.2.3_2 are attached to show the August
1951 TVA design drawings of the ash pond and the gap between the East and North Dikes that formed the
initial ash pond storage area. The gap allowed ash to commingle with waters of the reservoir. It was reported by
TVA that by 1958 the northern 275-acre ash pond containment dike was completed, as evidenced by Figure
1.2.3_3, a 1959 aerial photograph that shows the completed ash pond containment Dike C which was built of
nearby clay residuum and bottom ash. The initial ash pond dikes had a reported crest elevation of 748 feet.

AECOM
K:\PROJECTS\60095742 - TVA\Final\FINAL Revisions\Volume 1\completed\FINAL-062509-Failure_Analysis_Report_VolI-rev.doc
4
During the period of 1942 to 1954, the slack water embayment collected runoff silt and clay as bottom
sediments over the permanently inundated flood plain. From 1954 to 1958 ash, river silt and Dike C clay runoff
was deposited over the slack water embayment. This layer of laminated slimes was deposited under deltaic
conditions over the northern half of the dredge cell foundation area. As discussed later in this report, this layer
of slimes was a major factor in the December 2008 failure.
1.2.4 Site Development from 1958 to 1996 This time frame represents the filling of the initial ash pond bounded by the North and East Dike area. The initial
ash disposal cell bounded by the North and East Dikes was filled in circa 1965. Ash then was directed into the
main ash disposal cell that progressively filled as a deltaic deposit from south to north. Waters in this cell were
released back to the Reservoir through a dual Dike C riser pipe spillway system operating at the north end of the
ash pond from 1958 to 1977. During this time period the plant discharged ash to the initial ash pond, where the
coarsest fractions would drop out in the southern end of the ash pond and only the finest or smallest grain
materials would collect as sediments near the north end spillway that discharged to a slough that was excavated
to promote flow to the Reservoir during winter pool levels. In addition to photographs from 1959 and 1962,
shown as Figures 1.2.3_3 and 1.2.4_1 respectively, the vertical expansion of ash pond was shown in marked
revisions to the 1951 TVA drawings.
In 1975, TVA’s Singleton Laboratories (Singleton) completed boreholes, and performed sampling and testing to
determine soil conditions under Dike C and the North Dike. They also completed an on-site borrow study with
laboratory testing to support the design for raising Dike C and constructing a new Dike B from elevation (El.) 748
to 765 feet to develop more air-space for ash disposal. Dike B was added to prevent inundation of Swan Pond
Road and the railroad tracks located west of the site. A photograph, shown as Figure 1.2.4_2, shows the site in
1976 with Dike C in-place with a divider dike creating Cell 1 in the ash disposal cell immediately north of the
North Dike. After reviewing the mid 1970 inspection reports and 1976 TVA design drawings (Drawing Numbers
10N420 and 10N421), AECOM understands that by 1978 a new ash settling pond was constructed on the east
side of the original ash disposal cell to operate at a pool El. of 754 to 755 feet while the main ash collection pond
would be operating at El. 760 to 761 feet. The settling pond was likely needed to attain higher water quality and
less turbidity of the ash laden process water that was discharged back to the intake channel of the Reservoir.
AECOM understands this was done to meet the requirements of the “Clean Water Act.”

AECOM
K:\PROJECTS\60095742 - TVA\Final\FINAL Revisions\Volume 1\completed\FINAL-062509-Failure_Analysis_Report_VolI-rev.doc
5
AECOM understands that in 1984 TVA retained a contractor to dredge material out of the ash collection pond
and deposit sluiced ash behind two divider dikes making up Cells 1 and 2. Evidence of this activity is presented
on Figure 1.2.4_3 which shows the August 24, 1984 aerial photograph of the site after the August 8, 1984 failure
of the divider dike. Reportedly, the dredge contractor excavated too much ash material, which undermined a
new north-south divider dike. The undermining of this divider dike reportedly caused total failure of the dike and
substantial loss of dredged ash toward the east, causing a flood wave that overtopped the divider dike between
the ash collection pond and the settling basin. This over-dredging removed original slime deposits as AECOM
borings did not encounter these slime deposits under the south end of Dike D where AECOM drilled 09-602, 09-
603 and 09-604. We actually saw inclined dredge cutter cuts in undisturbed Osterberg tube samples that show
unfailed ash or slimes over native clay in Borings 09-604B and 09-605B at the south and north ends of Dike D at
the east side Phase I cell, respectively.
In a 1987 aerial photograph, shown as Figure 1.2.4_4, Dredge Cells 1, 2 and 3 are visible from the air. By
1994, Dike C was raised to its third level and Dike D raising had taken place as Dredge Cells 1, 2 and 3 were
actively being sluiced into. Figures 1.2.4_4 and 1.2.4_5 are aerial photographs that show the progression of
Dredge Cell vertical expansion in 1987 and 1994, respectively.
In 1995, TVA prepared design drawings showing the Dredge Cells that would operate through 2014 with
approximately 350,000 cubic yards per year of fly ash and bottom ash systematically deposited into Cells 1, 2
and 3. TVA Drawing No. 10W245, Sheets 1 through 18 shows systematically this vertical expansion. Figures
1.2.4_6 and 1.2.4_7 show dredge cell expansion, in plan and section views respectively. The drawings show
proposed vertical expansion of the dredge cells from El. 770 up to El. 866 feet using upstream dike construction
methods.
1.2.5 Site Development from 1996 to 2008 An aerial photograph from 1996, shown as Figure 1.2.5_1, shows active filling in Dredge Cells 1, 2, and 3, and
had a reported initial footprint area of approximately 120 acres. Based on topographic surveys, by early 2000
the three dredge cells were reduced to two active Dredge Cells 1 and 2.
The systematic upward progression of the dredge cells was interrupted on November 6, 2003 when the west
side perimeter dike developed seepage and there was a shallow slide near the base of Dredge Cell 2 adjacent
to Swan Pond Road. The TVA stopped dredging into Cells 1 and 2. Geotechnical analyses by Parsons Energy
and Chemical Group (Parsons), GeoSyntec Consultants (GeoSyntec), and MACTEC Engineering and
Consulting, Inc. (Mactec, formerly Law Engineering) were performed. Parsons prepared design drawings for the
repair of the west dike and a seepage control overlay blanket that was constructed by TVA. The initial repair
involved placing 100 tons of riprap over a geotextile placed over the seep and slide area. Subsequent repairs
involved managing seepage by constructing underdrain seepage interceptor trench drains beneath the surface

AECOM
K:\PROJECTS\60095742 - TVA\Final\FINAL Revisions\Volume 1\completed\FINAL-062509-Failure_Analysis_Report_VolI-rev.doc
6
along the two benches of Dikes A and B. This west slope improvement work was reportedly performed between
June 7 and September 15, 2005.
During the two year interim period when Dredge Cells 1and 2 were rarely used, TVA initiated designs for the
lateral expansion of the Dredge Cell System toward the east. Undated TVA Drawing Nos. 10W425-24 and
10W425-34 prepared by Parsons show a Phase I Emergency Dredge Cell. TVA records indicate that the Phase
1 Emergency Dredge Cell operated in 2004, most of 2005, and 2006. TVA commenced filling Dredge Cell 1 on
November 10, 2005. Figure 1.2.5_2 2005 aerial photograph shows the Phase 1 Emergency Dredge Cell in
2004 with the Phase 1 Emergency Dredge Cell active and the stone fill over the 2003 west slide area.
On November 1, 2006 another seepage and surface slide occurred just south of the 2003 slope instability area
on the west facing dike. According to the records, the 2005 geotextile and stone blanket could not handle
localized seepage anomalies that allowed a small piping failure. Figure 1.2.5_3 illustrates the location of the
2006 repair, well points, piezometers, and Mactec test borings. It also shows the location of well point WP02
which has historically been wet since early 2007 and will be discussed later in this report. In response to this
event, the TVA stopped dredging into Cells 1 and 2 from November 2, 2006 to April 9, 2007 and continued to
only fill the Phase 1 Emergency Dredge Cell. GeoSyntec performed analyses and prepared designs that were
implemented. TVA installed seep collection “spring boxes” and installed a non-woven geocomposite drainage
layer with 1-foot of soil cover over a bottom portion of the impacted west slope from El. 775 feet down to El. 760
feet along portions of the west slope. This work was completed on January 26, 2007. In addition, 26 shallow
well points were reportedly installed by November 2006 with daily readings up to the date of the failure. In
addition, 18 piezometers were placed along the west toe of Cell 2 to monitor groundwater levels. These 18
piezometers were installed by TVA; installations completed in March 28, 2007, and were monitored until the
date of failure.
The activities to control seepage are documented in the TVA annual inspection reports and in studies performed
by Parsons and GeoSyntec. At issue was the fact that each upstream dike for Cells 1 and 2, and Phase 1
Emergency Dredge Cell have a heel (upstream) side “French drain” that intercepts dredge cell seepage and is
directed to the outside slope of the dikes. Collected seepage at the heel of the dike is then passed through a
solid pipe on approximate 200-foot centers to the exterior slope of the dikes where seepage water discharges
onto the slope and then seepage infiltrates back into the near surface of the dike and partially saturates the
slope. This detail is shown on Figure 1.2.5_4 which illustrates AECOM’s composite representation of the dikes
from TVA Sketches from 1995 and Drawing Nos. 10W425-1, 2, 4 and 6 that illustrate upstream dike
construction details for the south, west and north sides of the Dredge Cells. No slope improvements were made
to the north Cell 2 slopes, to the south Cell 1 slopes, or to the east side slope of the Phase 1 Emergency Dredge
Cell.

AECOM
K:\PROJECTS\60095742 - TVA\Final\FINAL Revisions\Volume 1\completed\FINAL-062509-Failure_Analysis_Report_VolI-rev.doc
7
To address the issue of slope saturation, GeoSyntec prepared drawings in the fall of 2007 for TVA to install
surface drainage systems to intercept the west slope seepage drains and create top of bench drains along the
west side of Cells 1 and 2 on the dike benches. To install these “spring boxes” and top of bench drains, the
TVA stopped sluicing ash to Cells 1 and 2 from November 19, 2007 to March 31, 2008. After stopping sluicing
into Cells 1 and 2, TVA constructed the west side bench drains from January through February 2008.
Based on an AECOM review of the TVA records, no gypsum at any time was disposed of in the Kingston Cells
1, 2, 3, or in the Phase 1 Emergency Dredge Cell.
Figure 1.2.5_5 shows the four Dredge Cells (1, 2, Phase 1 Emergency Dredge Cell and Phase 2 Lateral
Expansion) in April 2008. Figure 1.2.5_5 also shows a photograph of the bench drains along the west slope and
active filling Cell 1 and into the Phase 2 Lateral Expansion Cell dated April 5, 2005. Figure 1.2.5_6 is a
photograph of the failed dredge cells on December 30, 2008.
The TVA conducted a site walkover inspection on the dredge cells and perimeter Dike C on October 20, 2008,
just after dredging into Cell 2 started on October 16, 2008. The October 2008 inspection was documented by
the TVA in a report dated January 12, 2009, prepared after the failure. The TVA inspection team noted several
dredge cell conditions that required action and/or further inspection. These issues were:
• Standing water on the upstream dike benches along the east side of the Phase I Cell that needed to
have positive water management and grading.
• Rainfall eroded ditches and gullies near the toe of Dike A or B on the north slope of Cell 2 and on the
east slope of the Phase 1 Cell. Recommendations for backfilling gullies were provided.
• Standing water and seepage along the west toe of Cell 2 near several of the 2006 well points were
noted.
• There were large trees along the bottom toe of Dike C along the slough or back-water of the Watts Bar
Reservoir. There was no mention of cutting these mature trees, but the brush and trees on the dredge
cells were to be removed.
• Fix some broke off seepage water observation well pipes.
The October 20 site inspection photographs were examined by AECOM and we did not see evidence of active
piping, excessive seepage, slides or subsidence on the slopes of Cell 2. There were several shallow dips in the
west side slope of Cell 2 that were covered with grass and appear stable, with no visible hydric vegetation or
excessive wetness. There was however, active seepage and standing water on the upper dike benches of the
east facing Phase 1 Cell. We noted the tree covered slopes just above the water line along starter Dike C.
These slopes appeared steeper than the original design slope of 6H:1V.

AECOM
K:\PROJECTS\60095742 - TVA\Final\FINAL Revisions\Volume 1\completed\FINAL-062509-Failure_Analysis_Report_VolI-rev.doc
8
1.2.6 Dredge Pond Design, Permit and Construction Records The dredge cells were engineered structures based on AECOM’s review of project records. The following is a
summary of drawings AECOM found especially relevant to the RCA.
• USACE Field Surveys of Swan Pond - 1924 and April 1940
• TVA Swan Pond Land Map - 1940
• USGS Maps – 1941, 1952, 1968, and 1998
• TVA Drawings showing Ash Pond and Dikes– August 1951 to 1976
• TVA Drawings10N400, 410 and 420 Series
• Top of Dike C (3 raisings) Elevation 748 up to 774 at Cell 2
• TVA Vertical Dredge Cell Expansion up to Elevation 866 – September 1995, Revised 1998 to a
proposed 2014
• TVA Drawings10N425 Series, Sheet 1 thru 18
• Phase 1, 2 & 3 Lateral & Vertical Dredge Cell Expansions up to Elevation 972 – 2000’s
o Parsons 10N425 Drawings, Sheets 20 through 93 January 3, 2006 and many undated sheets
• GeoSyntec Drawings Nos. 001 through 010 for west slope bench drains, September 2007
• TVA Topographic Surveys:
o 1995, June 2, 1998, June 28, 2000, June 28, 2003, March 19, 2004, August 15, 2006, May 7,
2007, May 23, 2008 and December 23, 2008
Based on TVA records, the engineered dredge cell expansion drawings were submitted to the TDEC in 1996 to
secure a solid waste landfill permit. On September 26, 2000, TDEC issued a permit to operate the ash landfill
as a Class II solid waste storage facility. On September 12, 2006 TDEC issued permit Registration No.
IDL 73-0094 to the TVA to operate the dredge cells as a TDEC Class II fly ash and gypsum storage facility. It
was to be known as the “TVA Fossil Plant Ash Landfill”. The facility was permitted to accept fly ash and bottom
ash from burning coal, and dry gypsum from the air pollution control scrubbers. The permit allowed the facility
to operate with no geologic buffer (liner) requirement, because the landfill will be constructed on an area already
disturbed by un-permitted storage of coal ash by-products, which have been placed below the existing water
table over the site footprint. The Division of Solid Waste Management also concluded that additional
environmental impacts from continued ash storage over this area in the absence of a geologic buffer should be
negligible. The TVA was allowed to dispose of slurried coal and gypsum, which contain free liquids to the facility.
The facility is permitted to discharge waters from the Dredge and Ash Pond areas into the Watts Bar Reservoir
per Tennessee National Pollutant Discharge Elimination System (NPDES) Permit No. TN0005452 dated
October 1, 2003.

AECOM
K:\PROJECTS\60095742 - TVA\Final\FINAL Revisions\Volume 1\completed\FINAL-062509-Failure_Analysis_Report_VolI-rev.doc
9
1.2.6.1 Pre-failure Field and Laboratory Exploration AECOM has reviewed TVA files and understands that no explorations at the ash pond were made prior to
construction of the East, North and Dike C ash containment embankments. In 1975, TVA requested Singleton
(a division of TVA) to complete a Soils Investigation Report for raising the perimeter ash storage area dikes.
Drilled and sampled borings (SS-1 through SS-20) were advanced around the full perimeter of Dike C and North
Dike as part of this exploration. Standard penetration test (SPT) borings and undisturbed tube samples (US-1
and US-7) were taken for development of plans and profiles to raise Dike B and Dike C perimeter dikes. The
laboratory testing program included unconsolidated, undrained triaxial (UU or Q tests), consolidated, undrained
compressive (CIU or R tests), Atterberg limits, sieve/hydrometers and water content on Dike C fill and
foundation soils.
Due to observed seepage outbreak on Dike C slopes, Singleton completed 17 supplemental shallow auger
holes (AH-1 through 17) and four test borings (SS-35 through SS-38) in the ash ponds and along Dike C in
1984. From samples collected, soil gradation tests were performed. In 1988, Law Engineering drilled four test
borings (J-13A, 13B, 16A and 16B) at the site.
As part of the vertical expansion, Singleton in 1994 made ten additional test borings at the site, SS-1 through
SS-10, two undisturbed sample borings, US-1 and US-9, and four shallow auger holes A-1 through A-4.
Singleton ran sieve/hydrometer, Atterberg limit, water content, consolidation, CIU and UU triaxial tests on dike
fill and ash.
In 1995, TVA retained Law Engineering to sample and test fly ash and bottom ash from Kingston and their other
fossil plants. Measurement of gradation, specific gravity, compaction, consolidation, strength, permeability and
other physical properties of sluiced ash was completed on Dredge Cells 1 samples, including bottom ash from
the flume that empties into the ash collection pond. This work was done to aid vertical expansion design efforts.
Mactec (formerly Law Engineering) in 2004 advanced 17 test borings B-1, 1A, 1B, 2, 2A, 3, 4, 5, 5A, 6, 7, 8, 8A,
9, 10, 11, 12, and installed Monitoring Wells MW-1 through MW-3. In 2004 Mactec retained Conetec to push 11
piezocone soundings (CPT-N, S, 1, 1A, 4, 6, 8 through 12 and 12A) with pore pressure dissipation testing at
discrete depths. Mactec also determined water content and performed grain size analyses, and Atterberg limits
testing on alluvium. They also performed CIU triaxial compression tests and permeability tests on the ash and
one consolidation test on alluvium. In 2005 Mactec drilled seven more test borings B05-3 through B05-9 at the
site.
In 2006, twenty six (26) well points and eighteen (18) shallow piezometers were installed along the base on the
west slopes of Cells 1 and 2 along Swan Pond Road to monitor west dike seepage. These well points and
piezometers have been monitored routinely since early 2007.

AECOM
K:\PROJECTS\60095742 - TVA\Final\FINAL Revisions\Volume 1\completed\FINAL-062509-Failure_Analysis_Report_VolI-rev.doc
10
The plan location of the pre-failure test borings from 1975 through 2006 are shown on Figure 1.2.6_1.
1.2.6.2 Pre-failure Stability Analyses AECOM has also reviewed several embankment stability analyses that were performed prior to failure. The first
analysis reported by TVA consisted of circular-arc slope stability analyses of the Dike C embankments built up
to a crest El. of 765 feet. The results indicated an initial construction minimum factor of safety (FS)1 of 2.6 for
the exterior slope and 1.9 for the interior slope. With water raised to El. 761 feet behind the second Dike C, the
computed minimum FS for the exterior slope increased to 2.7 and the minimum FS for the interior slope
decreased to 1.6. This information is shown on Drawing No. 10N420, dated October 20, 1976 and is based on
soil strength data from Singleton dated 1975.
The second documented stability analysis was conducted by TVA in 1985 when seepage was noted along the
downstream slope along the interface where the second starter dike was placed over the original Dike C. Based
on borings and observations there appeared to be a layer of bottom ash that separates the two dikes. Figure
1.2.6_2 shows a reported minimum FS of 1.2 for the downstream slope. An April 3, 1985 TVA memorandum
suggests the desired FS should be 1.5. They write:
• “…Since a factor of safety of 1.5 is desirable, we recommend continued daily inspections of this
dike by plant personnel.
• Construction of an engineered dredge pond dike adjacent to Dike C will not increase the probability
of a slide failure of the exterior dike; however, the dredge pond would increase the risk of seepage
through Dike C.”
In 1995 the TVA performed circular-arc slope stability analyses of the Cell 2 upstream dikes located
approximately 200 feet south of Dike C. TVA used a search routine in the computer model UTEXAS3 to
compute upstream dike stability using compacted bottom ash or compacted fly ash. The computed minimum
FS was 1.75 for original bottom ash dike material and 1.8 for revised dike fill materials using compacted fly ash.
Review of the UTEXAS3 search routine shows that failure surfaces without earthquakes would remain shallow.
Only if the slide mass was accelerated would the failure plane find a deep circular arc to gain mass, thereby
producing lower yield acceleration. The analysis did not consider a weak soft foundation layer under the 30 or
40 feet of previously placed wet ash upon which the vertical dredge cells would be founded. The TVA’s
computer model output assumes a strong soil layer under approximately 40 feet of ash that supports the new
dikes built after 1996 to form upstream Dikes A through E3.
1 “The factor of safety, FS, is defined with respect to the shear strength of the soil as FS = s/τ where s is the available shear strength and τ is the equilibrium shear stress.” (Duncan and Wright, 2005.) Another expression for FS is the ratio of resisting forces divided by the driving forces when the driving forces are greater than resisting forces: there will generally be instability.

AECOM
K:\PROJECTS\60095742 - TVA\Final\FINAL Revisions\Volume 1\completed\FINAL-062509-Failure_Analysis_Report_VolI-rev.doc
11
In 2004 Parsons performed slope stability analyses using the computer model PCSTABL5M for the end of a
Phase 1 eastward expansion of the dredge cells. They computed a static minimum FS of 2.0. It appears that
these analyses looked at a section that would potentially slide from west to east. The Parsons’ analyst used
circular-arc and wedge block translational failure surfaces. No weak or soft zones were defined along the base
of the ash and over a clay alluvium.
Parsons issued a PowerPoint presentation in 2007 where they presented seepage and stability analyses
performed on the west slope of Cell 2. Parsons employed two widely used computer programs to compute
stability of the west dike slope of Cell 2 after the 2004 seepage repairs. Parsons computed minimum FS of 1.34
and 1.38 using UTEXAS3 and SLOPE/W™, respectively for a Dredge Cell filled just above the TVA proposed
Dike E3 level (El. 841 feet) with the water pool set at elevation 842 feet. Parsons defined El. 842 as a “permit
level.”
1.2.6.3 Construction of Upstream Dikes The TVA dredge cells were constructed of bottom ash collected out of the bottom ash sluice channel and of
sluiced fly ash from rim ditches excavated from the interior side of the dredge cell dikes. The fly ash and bottom
ash were collected and transported with trucks and scrapers to the dredge cell dike location. According to
interviews and written plans, TVA Heavy Equipment Division (HED) used scraper pans, dozers,
backhoe/loaders, front end loaders, and haul trucks to shape and compact the upstream dikes in general
accordance with the 1995 TVA Design Drawings. The desired compaction was a minimum of 95% of the
maximum dry density per ASTM D698 Standard Proctor compaction requirements. Each dike was to be
constructed over a layer of woven slip-film geotextile per TVA Drawing Nos. 10W425-1 through 10W425-18.
AECOM was told by TVA designers and HED this geotextile material was not placed under the dikes. AECOM
conducted a test trench through the south dike of Cell 1 in March 2009 and did not find this geotextile separator
between dike fill and sluiced ash at dike five levels exposed. Reportedly, bottom ash was placed to serve as a
stable base fill over loose sluiced ash for each new dike. TVA and HED stated that the bottom ash base for the
fill dike will provide improved stability when compared with the geotextile.
For upstream dike fill stage, a heel dike drainage system was installed as a continuous “French drain” with 8-
inch slotted corrugated plastic pipe placed within an 18-inch square envelope of crushed stone, with a geotextile
envelope, and located near the upstream end of each interior dike level. The French drain discharges to the
downstream dike slope every 200 feet along each dike level through 8-inch non-perforated, corrugated plastic
pipe. The dredge cell side slopes were designed to be 3H:1V with 15-foot wide benches at defined levels, per
the 1995 TVA design drawings.

AECOM
K:\PROJECTS\60095742 - TVA\Final\FINAL Revisions\Volume 1\completed\FINAL-062509-Failure_Analysis_Report_VolI-rev.doc
12
During normal operations, fly ash is periodically dredged from the ash collection pond and hydraulically
deposited to the interior of the dredge cell. It generally takes four to five months to fill a cell. The minimum free-
board distance between the crest of each dike level and sluiced ash pool is 2 feet.
The water level in each pool is controlled by a decant stand pipe system with aluminum stop-logs to maintain
dredge cell pool levels and would allow the 5,000 gallon per minute dredge pump water to discharge to the east
side of the cells and then flow to the west side of the cells to allow the ash to drop out and then recirculate back
to the ash collection pond using a hard piped decant spillway system that is shown in TVA Drawing No.
10W425-12. The wet ash storage within the dredge cells and perimeter dike construction process is essentially
a continuous incremental procedure. The outside slopes are vegetated and no daily cover is used. However,
dormant cells, dikes and sluiced ash are watered or flooded at least once per week to reduce fly ash dust
emissions.
1.2.6.4 Dredge Cell Filling Rates AECOM reviewed TVA 1995 drawing (10W425-13) and engineering sketches which are shown on Figure
1.2.4_7 that show fly ash and bottom ash generation rates for storage into the Dredge Cells. Using the 1995
ash generation production assumptions, TVA expected to dispose of 394,000 cubic yards per year (cy/yr) for the
D-stage dikes (e.g., D1, D2 and D3). TVA uses with HED to dredge between 630,000 and 660,000 cy/yr.
However, for future planning TVA reported an average bottom and fly ash generation rate of 467,000 cy/yr for
2009 through 2012.
Based on surveys and TVA HED dredge pond measurements, TVA reported the volume of fly ash and bottom
ash deposited into Cells 1, 2 and the Phase 1 Emergency Dredge Cell were:
• FYE 2006 416,000 cy (TVA Survey) to 471,000 cy (HED)
• FYE 2007 596,000 cy (HED)
• FYE 2008 462,000 cy (HED)
• FYE 2009 (10/1 through 12/18) 127,000 cy (HED)
Note: The TVA’s fiscal year end (FYE) is September 30.
TVA records show that the last stage of Cell 2 filling began on October 16, 2008 and the last day of active
sluicing into Cell 2 was on December 18, 2008. Based on HED records, more than 100,000 cy was deposited
into the regulated 31-acre active Cell 2 during the two months prior to failure. TVA surveys very little ash was
deposited into Phase 1 Emergency Dredge Cell in 2008. Additional information on this subject is provided later
in this report.

AECOM
K:\PROJECTS\60095742 - TVA\Final\FINAL Revisions\Volume 1\completed\FINAL-062509-Failure_Analysis_Report_VolI-rev.doc
13
1.2.7 Chronology of Failure The last TVA inspection of the intact dredge cell area was early Sunday afternoon (12:15 p.m. Eastern Standard
Time [EST]) on December 21, 2008 with no documented visual evidence of observable distress. On Monday
December 22, 2008, the Dredge Cells failed around 01:00 a.m. EST. Based on TVA records, the first indication
of a problem was at 01:21 a.m. EST when an unidentified person called in to TVA and mentioned a situation in
Roane County, and said they would call back. At 01:28 a.m. EST TVA police with Roane County emergency
personnel and on-site TVA police reported a dike failure at Kingston Fossil Plant with a house inundated by an
ash slide.
There were two eye-witness accounts of the incident by TVA personnel, Mr. William Wallace and Mr. James
Settles.
Mr. Wallace’s account from a January 2009 memorandum of what he remembers on December 22, 2008 is
noted below.
William G. Wallace
Shift Operations Supervisor (SOS)
Kingston Fossil Plant
The following is the original entry, as copied, from the SOS log dated December 22, 2008. The sequence of
events is also shown, and although times are approximate, Mr. Wallace feels certain he is very close (within
minutes) of the actual times. He does remember looking at his watch while the truck was stopped on the dike
and it was 01:35 am EST.
His written log entry reads as flows:
“At approximately 0120 EST Bob Rehberg called and asked what had happened to the dike at the ash
containment cell. I was unaware there were any issues with the dike. I drove around the dike past the
skimmer dam and about 2/3rds of the way to the northwest corner of the cell was astounded to discover the
dike of ash containment cell #2 had completely collapsed. I went to Swan Pond road to assess the damage
on that side of the dike and spoke with the police and local emergency management personnel. I got what
information that was available from them, came back to the office and began the emergency management
notification matrix.
The notifications were completed at app. 0200. The incident command center was established in the OCC
at 0230. [Wallace, William G., SOS]”
Sequence of events based on Mr. Wallace written narrative of the sequence of events is listed below:

AECOM
K:\PROJECTS\60095742 - TVA\Final\FINAL Revisions\Volume 1\completed\FINAL-062509-Failure_Analysis_Report_VolI-rev.doc
14
01:20 a.m., Received phone call from Bob Rehberg.
01:25 a.m., Departed loading dock parking area in a TVA truck.
01:30 a.m., Drove along east side ash pond past the intake bridge, past skimmer wall (at this time the
navigation lights on the skimmer wall were working), and along the dike road toward the extreme northwest
corner of cell. Drove past the “Y” staying on the low road and stopped at a point approximately 200 yards
past the “Y”.
01:35 a.m., after assessing the situation as best as possible (the only lighting was the truck headlights) I
backed the truck to the “Y” in order to turn around. I then went to Swan Pond road to determine if the failure
extended to that portion of the dike.
See Figure 1.2.7_1 for route taken by Mr. Wallace and approximate point on dike at which Mr. Wallace stopped
to assess situation.
Mr. Settles described the incident in February 2009 from his memory in an email he issued on February 5, 2009.
Mr. James T. Settles
Foreman of Dredge Cells
Kingston Fossil Plant
“I received a call on 12/22/09 @ 01:00, Kevin Abner said he heard on police scanner that ash was blocking
Swan Pond Road, I was getting dressed and he called again at 01:02 saying it’s worse that we thought, the
scanner now is reporting that a house is off of it’s foundation. I drove to circle rd and the house looked like
it was sitting in road, a police car was present, two more police came in behind me, I backed into a
driveway, then traveled west on circle rd,, went across Pine Ridge and came to the plant dike area, a
county deputy sheriff was at the entrance, Approximately 01:20 I stopped told him I work here and wanted
to see what was happening. I got into my truck went to the upper area cell approx. 01:25 parked near the
#1 cell drain area, I could not see the #2 cell area, wind was blowing and it felt like the ground was moving,
left this area and went toward the #2 cell on the lower dike road around the ash pond, I parked where the
road splits into two roads approx. 01:30 got out and looked where the #2 cell had been, again it felt like the
ground was moving, I thought it was the wind blowing against me, but when entering the truck I saw a
bottle of water in the cup holder and it was shaking, now I think we are having an earthquake, so I felt the
whole area could be at risk, I went back to the divider dike between the ash pond and the stilling pond
started call all of my managers, approx. 01:35. Soon after this my phone was very busy, everyone was
calling me, went back to my office approx. 02:00, and I met Kevin Abner, and his wife, I told him we should

AECOM
K:\PROJECTS\60095742 - TVA\Final\FINAL Revisions\Volume 1\completed\FINAL-062509-Failure_Analysis_Report_VolI-rev.doc
15
wait on people to arrive, and approx. 02:15 people started arrive. This was such an event, I was excited
that’s why I put approximately on these time.”
See Figure 1.2.7_2 for route taken by Mr. Settles and approximate locations where his observations were made.
Mr. Settles indicated his home is 0.7 miles from the intersection of Swan Pond Road and Swan Pond Circle. He
also indicated to AECOM that late in the evening his dog was barking incessantly. He wondered why the dog
was out of his doghouse on such a cold and windy night. He was quite sure his first call was at 01:00 a.m. EST.
When he left the house he told his wife what time it was and that he would not get any sleep since he expected
the 2003 or 2006 seep had reoccurred.
From TVA’s call summary, it appears that the events Mr. Settles’ describe may have actually occurred 20
minutes earlier than he recollects. This is evident from Mr. Wallace’s access onto Dike C beyond point “Y”
(shown on Figure 1.2.7_1) while Mr. Settles indicated that he was unable to proceed beyond the “Y” because
Dike C was no longer present. Mr. Wallace and Mr. Settles do not remember crossing paths that early morning
hour.
Since there is no video record of the failure, we have used the TVA telephone call in logs and Messrs. Settles
and Wallace accounts of the failure to understand the sequence of failure. We are confident that the north end
of Cell 2 and Dike C failed first since the first reported damage was to the Schean home. Furthermore, the
nearly intact movement of Dike C across the Tail Water to the north created a water wave that reached
approximately El. 784, 47 feet above the measured pool El. 737 at 1:00 am EST. Evidence that Dike C moved
virtually as a single unit is based on the fact that very little ash was deposited by the surge of water up the
hillside. AECOM’s review of records and field and laboratory observations indicate the failure was a very
sudden and dramatic event, with each successive slide causing rapid movements of the failing mass, with
minimal delay between slides leading to total event duration of about one hour.
1.2.8 Post Failure Observations AECOM interviewed TVA staff about post-failure excavations along Swan Pond Road to restore infrastructure
after the failure. According to Steve Whittier of TVA:
“I searched some of the site photos and also talked with Brad Workman about the rail track condition
after the spill. Brad arrived the day of the event and walked the entire rail line from south to north. He
said that the first 700 – 1,000 feet or so the track was covered by 10' or so of ash. After the first 1,000'
the track was pushed up and away from the dredge cell near the curve and some of the rails were
twisted and raised up above the ash level. I have attached a few pictures that show the area of the
raised up and twisted rail.”

AECOM
K:\PROJECTS\60095742 - TVA\Final\FINAL Revisions\Volume 1\completed\FINAL-062509-Failure_Analysis_Report_VolI-rev.doc
16
The TVA surveyors and witnesses reported 10 to 20 feet of failed ash over the buried railroad tracks. Beyond
the first 1,000 feet, the railroad tracks and ties slid off their foundation in an area of ponded water and along the
northwest curve where the railroad and Swan Pond Road bends around the natural hill to the west. Figure
1.2.8_1 shows an aerial photograph taken by TVA during the morning of December 22, 2008 of the northwest
corner where the locomotive was stuck in the ash piled over the tracks. The Figure also shows relics of Cell 1
and Cell 2 dikes floating on liquefied ash that moved from south to north along the west side of the dredge cell.
This aerial photograph also illustrates the alignment of the inundated railroad base grade and Swan Pond Road.
Figure 1.2.8_2 is a photograph taken by the TVA on December 22, 2008 showing the displaced rails, existing
wetland, and the 2006 disturbed seepage control blanket stone near its expected position when compared with
GeoSyntec’s 2007 drawing. The figure also shows the Swan Pond Road guard rail having been pulled toward
the east by relic Cell 1 and Cell 2 upstream dike flows that moved from south to north. The displaced west
facing slopes covered with vegetation are also visible on the photo without evidence of having been inundated
by liquefied ash.
Approximately one week following the failure, an aerial photograph (Figure 1.2.8_3) was taken showing exposed
subgrades of both the railroad and Swan Pond Road. These exposures were supporting conventional heavy
construction equipment with the historic pre-failure ditches exposed and in original locations. In addition, the
wetland observed pre-failure had been re-established with no evidence of Swan Pond Road or railroad base
grade having been displaced by a deep-seated east to west failure.
AECOM observed that only the upper contents of the Phase 1 Emergency Dredge Cell were lost due to a
breach of Cell 2 dikes. There was no apparent distress to the east face of the Phase 1 dike system. AECOM
also noted evidence of partially sluiced ash under Dike D, south of point “Y” as cracks and sand boils. There
were also lateral spreading cracks in the Phase 2 starter dike immediately east of Dike D. AECOM witnessed
numerous sand boils and extensive liquefied ash across the failed dredge and former slough area during our
first day at the site on January 8, 2009.
AECOM
K:\PROJECTS\60095742 - TVA\Final\FINAL Revisions\Volume 1\completed\FINAL-062509-Failure_Analysis_Report_VolI-rev.doc
17
1.3 Field Exploration 1.3.1 General Field Explorations AECOM arrived on site on January 8, 2009 to conduct a site reconnaissance and prepare an estimate of
personnel and materials required to conduct the field exploration. A helicopter tour provided the initial overview
of the site and assisted with assessment of the scope and nature of the failure.
AECOM dispatched a field engineer from their Oak Ridge, Tennessee office on January 12, 2009, to assist TVA
personnel with a high-water-mark identification and location survey.
On January 12, 2009, AECOM arrived on site to prepare for the arrival of the personnel. On January 14 and 15,
2009, AECOM began mobilizing drilling crews and equipment from their Chicago, Illinois and Green Bay,
Wisconsin offices to the site. AECOM personnel arriving on site were required to clear security, attend safety
training and were given an orientation by TVA personnel. Field explorations commenced at the site on January
17, 2009.
Additional AECOM staff including geotechnical engineers and draftspersons set up a base of operation at TVA
headquarters in Chattanooga, Tennessee. TVA and AECOM personnel at Chattanooga provided logistical
support and review of archival documents. With operational information provided by TVA, AECOM provided
engineering expertise to assist with the field exploration.
At the peak of site activity, AECOM had six drill rigs operated by five, two-man crews working 10 to 12 hour
shifts. The total AECOM on-site staff was 18 to 21 persons. Accounting for rotation of drill crews, field staff,
professional engineers and geologists, over 30 AECOM staff members worked in Tennessee during completion
of the field exploration.
With this staff, the following exploratory and research tasks were completed:
• 59 SPT borings
8 of the 59 borings included rock coring
25 of the 59 borings included inclinometer installations
21 piezometer locations and 54 piezometers installed
• 48 vane shear with Shelby tube test borings
• Advanced 40 3-inch Osterberg tube sampling holes
• Pushed 87 Cone Penetrometer CPTu test probes
• Drilled and installed cross-hole geophysical test borings for Stantec
• Located, surveyed, and logged identifiable relics associated with the dredge cells
• Observed two test trenches for location of outfall piping
• Conducted interviews with TVA personnel to assist establishment of timelines

AECOM
K:\PROJECTS\60095742 - TVA\Final\FINAL Revisions\Volume 1\completed\FINAL-062509-Failure_Analysis_Report_VolI-rev.doc
18
• Reviewed TVA records to established dredge fill rates and system hydrology
• Completed a test trench on the south side of the Dredge Cell 1 dike
1.3.2 Field Observations to Locate Relics As part of the RCA, relics transported and deposited by the liquefied ash were located and identified in the
debris flow. Relics were defined as identifiable pieces of man-made and natural objects found after failure that
had the potential to provide information regarding point of origin. Using point of origin and location where an
object was found post-failure, an estimate of the flow path of the debris was developed. Approximately 170
relics were identified and cataloged during the RCA field survey. Of these, a dozen or more relics proved
particularly valuable for estimating movement of water and ash during the course of the failure.
Of particular value are relics with precise points of origin.
Relics located that fit this description include:
• TVA Survey Monument CHT-2 (Photo 1 in the photograph section of this volume),
• Dozer and scraper that were parked on divider dike between the Phase 1 Emergency Dredge Cell and
Cell 2 (Photo 2),
• Cellular telephone repeater tower formerly located at the northwest corner of Dike C (Photos 3 and 4),
• Railing from the top of the concrete headwall at the original ash pond spillway outfall pipe (Photo 5), and
• Original spillway skimmer cap formerly on shore next to the outfall pipe (Photo 6).
Relics providing additional clues regarding ash movement but with less precise points of origin include:
• Cattail covered sections of the setback area upstream of Dike C (Photo 7),
• A 5/8-inch dragline cable (Photo 8),
• General remnants of Dike C (red clay fill material over native silty clay (Photo 9),
• Corrugated polyethylene (PE) pipe (24-inch diameter) (Photo 10),
• 10-inch HDPE dredge pipe (Photo 11),
• Unique varieties of tree that were growing at known locations along the toe of Dike C (Photo 12), and
• Relic portions of Dike C (e.g., north shore of Tail Water) (Photo 13). (referred to as Tail Water on the
slope stability cross sections and on the initial figure with geographic locations)

AECOM
K:\PROJECTS\60095742 - TVA\Final\FINAL Revisions\Volume 1\completed\FINAL-062509-Failure_Analysis_Report_VolI-rev.doc
19
Figure 1.3.2_1 illustrates the point of origin for the above described items along with an estimated path taken
(vector) to reach the location where each was found. Based on these vectors, the northwest corner of the
failure area followed a general path to the north-northwest. The central portion of the north Dike C followed a
general path north or northeast to a hillside that is on the opposite side of the Tail Water. The remainder of the
ash that flowed following failure of Dike C followed either a direct path across the backwater and Slough 3
(5/8-inch cable) or an arching path around the remaining Dike C and into the Emory River channel (24-inch
diameter corrugated PE pipe). The rubber-tired backhoe which reportedly flowed into the former Emory River
Channel could not be found.
Relics were transported varying distances. Some as little as a few feet, others traveled over 3,200. Of the relics
described above, the survey monument, skimmer cap, and railing from the outfall headwall traveled the shortest
distance at just under 700 feet. The cattails traveled the farthest at nearly 3,300 feet. The approximate distance
of transport for the individual relics is included on photographs for this section.
1.3.2.2 High Water Marks Relics were not only moved by flowing ash. A surge of water or flood wave preceded the ash flow during failure.
Evidence of the flood wave, surge or seiche (e.g., high water marks) was identified, surveyed, and locations
were placed on a map to illustrate areas affected by water but not ash. AECOM postulates that the surge of
water ahead of the moving ash and displaced dikes was generated as the initial failure impacted the backwater
and pools associated with Swan Pond Creek and the former Emory River channel within the Watts Bar
Reservoir. Figure 1.3.2_2 depicts the high water mark along with the post failure ash boundary. The surge of
the water reached maximum height immediately west of the intersection of Swan Pond Circle roadway and the
driveway for the two-story white home, where the elevation of the peak surge was measured at approximately
784 feet, almost 47 feet above the Watts Bar Reservoir pool level of El. 737.0 feet.
Three home sites and numerous locations around the periphery of the impacted area displayed direct evidence
of impact/movement by water and dike remnants. Relics having evidence of water-assisted transport include:
• The hillside bank on the northern side of the Tail Water north of Dike C where trees, remnants of Dike
C, and relics from the southern shore were deposited with little to no ash and some areas of the bank
were washed clean with no detectable ash left behind (Photo 13).
• The Schean home was moved off its foundation approximately 65 feet to the north and onto Swan Pond
Circle likely by both the water surge and remnants of Dike C (Photo 14).
• The back yard to the northwest of the James home where water deposited small relics and bent the
lawn grass down-slope leaving a thin veneer of ash deposited in the grass on the west and north sides
of the home which was mostly washed away by rain after the event (Photo 15).
• Large trees, concrete block, pieces of piers, and assorted small relics on the peninsula between Slough
3 and Watts Bar Reservoir near the Hanover home (Photo 16).

AECOM
K:\PROJECTS\60095742 - TVA\Final\FINAL Revisions\Volume 1\completed\FINAL-062509-Failure_Analysis_Report_VolI-rev.doc
20
Evidence of the water surge is present around the entire periphery of the affected area. A surge of water also
traveled across Watts Barr Reservoir damaging docks on the eastern shore in the vicinity of the ash flow. This
surge wave dissipated rapidly with distance. A long peak in water levels were measured at the Kingston water
gage and Watts Bar Dam reservoir gage as documented in Volume IV, Appendix 4A.
1.3.3 Geology 1.3.3.1 Regional Geology The TVA ash storage site is located in the Valley and Ridge province of the Appalachian Mountains north-
northwest of Kingston, Tennessee (Swingle, et al. 1966). The regional northeast-southwest trend of bedrock
units can be observed on a portion of the Geologic Map of Tennessee, 1966, East-Central Sheet included as
Figure 1.3.3_1. Physiographic boundaries of the site are Pine Ridge to the west of the site, Swan Pond Creek
drainage to the north and the former Emory River/Watts Bar Reservoir to the east and south. Early maps of the
area indicate the ash storage area was formerly a seasonal backwater or flood plain of the Emory River. The
backwater was likely subject to periodic flooding based on the location of buildings (all constructed above El.
735 feet) and the drain tile installed beneath tilled areas shown on a 1940 Land Acquisition topographic map
compiled by TVA Maps and Survey Division. A rendition of the 1940 TVA land acquisition map is included in
Appendix 2B in Volume II, along with reproductions of the United States Geological Survey (USGS) and TVA
topographic 7.5 minute quadrangle maps from 1941, 1952, 1968, and 1998 to illustrate the progressive changes
at the site. The entire area beneath the ash storage site was flooded as a result of the creation of Watts Bar
Reservoir in 1942.
Photographs for referenced in this section are included in Section 1.13.1 Geology Photographs.
1.3.3.2 Site Geology 1.3.3.2.1 Soils The Soil Survey of Roane County, Tennessee, available on the internet via the United States Department of
Agriculture (USDA) Natural Resource Conservation Service (NRCS) Web Soil Survey contains data from 2006
following development of the Kingston Fossil Plant. Inquiry was made with the NRCS office in Kingston and the
University of Tennessee at Knoxville (UT) to determine if historical (pre-fossil plant construction) soils data was
available. UT provided a reference for an original Soil Survey of Roane County, Tennessee published in 1942,
prior to construction of the Fossil Plant; however, a copy could not be located to review.

AECOM
K:\PROJECTS\60095742 - TVA\Final\FINAL Revisions\Volume 1\completed\FINAL-062509-Failure_Analysis_Report_VolI-rev.doc
21
In the absence of data prior to filling the reservoir, the “native” soil beneath the ash storage site likely consists of
USDA NRCS-defined Melvin Series silt loam. The Melvin Series is typical of floodplains and occurs in areas of
frequent flooding. A small area of Melvin Series soil is identified in Slough 1 northeast of the reservoir water
boundary. Melvin Series soils are derived from weathering and runoff of inter-bedded sedimentary rock such as
those found beneath and surrounding the site. Melvin Series soils are poorly-drained, with flooding or ponding
common. The USDA silt loam designation corresponds well with the Unified Soil Classification System (USCS)
(CL-ML) classification. Field descriptions, in particular color and texture, sieve and hydrometer analyses, and
limits conducted on laboratory samples also support this conclusion. Figures 1.3.3_2 through 1.3.3_2B are a
soils map and accompanying information depicting soils in the site area. The Melvin Series is highlighted in red,
and illustrates the location of the valley-bottom soils of the region. The soils information was obtained via the
NRCS Web Soil Survey at the internet site: http://websoilsurvey.nrcs.usda.gov/app/WebSoilSurvey.aspx.
In addition to silts, silty clay, and clay (e.g., overbank flood deposits), coarser sediments were observed in
isolated samples. Some fine to coarse sand, small gravel and shells were recovered at Location 09-600. These
sediments are fluvial deposits resulting either from Swan Pond Creek or the Emory River meandering back and
forth across the floodplain prior to impoundment of Watts Bar Lake. USDA NRCS does not classify subaqueous
deposits in rivers or lakes.
1.3.3.2.2 Bedrock Geology According to the “Geologic Map of the Harriman Quadrangle, Roane and Morgan Counties, Tennessee” (Moore,
et al., 1993), the ash storage area is underlain by Cambrian-age sedimentary rock comprising two primary units:
The Conasauga Shale and the Rome Formation shale. Other units in the vicinity include the Maynardville
limestone and the Knox Group limestone.
The Conasauga Shale/Rome Formation contact is located near the northwestern edge of the TVA property and
dips to the southeast beneath the ash storage area. Based on the angle of dip of the bedrock and depth of
penetration by rock core, the Conasauga Shale was the only rock encountered in borings conducted by AECOM
at the ash storage facility. The color of the Conasauga Shale has been described as gray, red, light green and
dull purple.2 Conasauga Shale observed in core recovered from AECOM borings ranged from dark green and
greenish-gray, to black. Most recovered shale was soft to moderately hard, fissile, and thinly bedded to finely
laminated, with bedding dipping approximately 10 to 30 degrees from the horizontal at all locations except
Boring 09-211 where bedding was observed to be nearly horizontal. Oriented cores were not collected, but
bedding in recovered core appears to mimic the regional southwest-northeast strike and low to moderate (15 to
45 degree) dip. Much of the core recovered was shattered by drilling activity due to the fissile nature of the rock.
Plugged core bits were problematic and likely resulted from soft zones in the shale and widely scattered clay
seams. Consistent loss of drilling fluids indicated that the rock is highly fractured and permeable. Nearly
2 Moore, J. L., et. al., Geologic Map of the Harriman Quadrangle, Tennessee, 1993.

AECOM
K:\PROJECTS\60095742 - TVA\Final\FINAL Revisions\Volume 1\completed\FINAL-062509-Failure_Analysis_Report_VolI-rev.doc
22
vertical, hairline fractures filled with calcite were noted in many samples. These fractures likely result from
tectonic activity in the region with the calcite deposited as liquid moved into the Conasauga from the adjacent
limestone formations. Joints within the core display slickensides, indicating historic movement along these
planes. An outcrop of weathered Conasauga Shale at the northeast corner of the intersection of State Highway
70 and Pine Ridge Road illustrates the thinly bedded, highly fractured nature of the rock in this area (see Photo
17).
Figure 1.3.3 _3 is a portion of the “Geologic Map of the Harriman Quadrangle, Tennessee” (Moore, J. L., et al,
1993) that illustrates the bedrock beneath the site. Figure 1.3.3_4 is a geologic cross section developed for the
Harriman Quadrangle by Moore, et al., 1993. The southeastern end of the cross section illustrates the rock
structures beneath the ash storage site. The cross section was compiled from data collected within 0.25-mile of
the site. The approximate location of the ash storage site has been projected onto the cross section. Note that
there is no vertical exaggeration on the cross section, and the Conasauga Shale attains a thickness of over 800
feet toward the eastern side of the site. It is possible (although unlikely) that rock cores encountered the Rome
Formation, since the cores recovered from six borehole locations appeared to be similar in texture, color, and
composition.
A major structure, the Chattanooga Fault, traverses the area to the northwest of the ash storage site, on the far
side of Pine Ridge west of Swan Pond Road. The Chattanooga Fault trends southwest to northeast and is a low
to moderate angle thrust fault with rocks of the Rome Formation thrust over the top of Knox Group. Rocks
beneath the thrust fault have been overturned, resulting in complex stratigraphy beneath the site. An outcrop in
a small quarry at the northeast corner of the intersection of US Highway 70 and TN Highway 29 (Pine Ridge
Road) contains rock very near the fault contact. Rocks within this quarry are distorted and highly fractured due
to faulting. A tight fold can be seen at the western edge of this outcrop. Strike of the rock was measured to be
north 65 east and dip angle of 34 degrees to the southeast was measured at this location. A photograph of this
outcrop is included as Photo 17 appended to this report.
The ash storage area is located on the overthrust block. A smaller, less extensive, unnamed fault has been
identified approximately 0.25 mile south of the failure area and is inferred because of the lack of an identifiable
contact between the Knox Group and the Maynardville Limestone.
A second major thrust fault, the Kingston Fault, traverses the area to the southeast of the ash storage site and is
parallel to the Chattanooga Fault. This fault is not present within the dredge cell failure area.

AECOM
K:\PROJECTS\60095742 - TVA\Final\FINAL Revisions\Volume 1\completed\FINAL-062509-Failure_Analysis_Report_VolI-rev.doc
23
Also noted by historical and anecdotal evidence is the presence of caves and sinkhole(s) in the area. A UT
Master’s Thesis by J. L. Poole (1949) indicates that caves and sinkholes “though present, are not common.”3
Poole also states that identified sinkholes are confined to the limestone of the Knox Group. A large sinkhole
was identified at the contact between the Conasauga Shale and the Knox Group limestone at a location now
beneath the southwest-central portion of the existing power plant, approximately 1,600 feet southwest of the
dredge cell area. The sinkhole is identified in an initial site study titled, “Preliminary Geological Investigations for
Eastern Area Steam Plant” (Benziger, C.P. and Kellberg, J. M., 1951) and also by personal communication with
a TVA surveyor’s assistant (Mr. Tim Isham) whose grandparents’ spoke of the sinkhole – as well as others –
located in the area.
1.3.3.2.3 Regional Groundwater Springs are present along breaks in the slope west of Swan Pond Road. Springs are a manifestation of the
groundwater table intersecting the ground surface. Bedding along Pine Ridge dips toward the southeast, thus
transmission of groundwater would be expected to be parallel to bedding toward the southeast. These springs
are likely fed from the uplands along Pine Ridge, discharging below Swan Pond Road and above Swan Pond
Creek.
The fractured and fissile nature of the bedrock precludes the Conasauga Formation from acting as a cap rock,
thus any hydraulic head generated on the highland to the west is likely dissipated before generating artesian
pressures beneath the ash. A lack of artesian conditions is also confirmed by data recorded in piezometers
installed as part of AECOM’s field exploration.
1.3.3.2.4 Seismic Activity Kingston, Tennessee is in a seismically active area. Many small earthquakes occur in eastern Tennessee.
Several earthquakes were recorded in the vicinity of the Kingston plant in the months before (and since) the
failure. Earthquake magnitude (M) is a measure of energy released by the quake as measured by a seismic
network monitored by the USGS. Earthquakes less than M2 typically cannot be felt and do no damage. M2 and
M3 are considered to have only “weak” shaking, and typically do not cause damage. Table 1.3.3_T1 is a listing
of earthquake activity in Tennessee between September 30 and December 17, 2008. Note that the four
earthquakes recorded closest to the time of the failure were over 200 miles from the site. An M2.9 quake was
registered approximately 50 miles east of the site on December 17, 2008. Figure 1.3.3_5 illustrates the location
of the M2.9 quake. An M2.5 quake was registered on November 9, 2008 and was located approximately 8
miles southeast of Rockwood, Tennessee, less than 5 miles from the Kingston site and represents the quake in
closest proximity to the site. Figure 1.3.3_6 illustrates the location of the M2.5 earthquake. It should also be
noted that the earthquake in closest proximity was a relatively deep earthquake (occurring at a depth of >78,000
3 Poole, J.L., The Geology of the Harriman Quadrangle, Roane and Morgan Counties, Tennessee, University of Tennessee at Knoxville, 1949, p.10.

AECOM
K:\PROJECTS\60095742 - TVA\Final\FINAL Revisions\Volume 1\completed\FINAL-062509-Failure_Analysis_Report_VolI-rev.doc
24
feet [24 km]) making it even less likely that any effects of the earthquake would be felt at the base of the dredge
pond. No earthquakes were reported in Tennessee on December 21 or 22, 2008.
1.3.3.3 Site Hydrology The Kingston Dredge Cell is a confined watershed within the limits of the perimeter dikes of two cells which are
identified as Dredge Cell 1 and Dredge Cell 2. Since the failure emanated from the northwest side of Dredge
Cell 2, a simplified watershed model was developed to estimate flood inflows and evaluate the flood capacity of
Dredge Cell 2. The watershed modeling was performed with USDA Natural Resource Conservation Service
(NRCS) TR-55 methodology using the HydroCAD computer software. Point precipitation frequency estimates
were utilized from NOAA Atlas 14. There was no dredge pumping for three days prior to the failure event. The
Dredge Pond had the capacity to store runoff from a 500-year, 24-hour duration storm event without considering
any outflow from the decant spillway structure.
The Emory River is immediately adjacent to the Dredge Cell. The FEMA flood insurance rate map (FIRM)
provides a 100-year flood elevation of 748 feet for the Emory River north of the Dredge Cell.
The TVA operates several dams on the Tennessee Rivers which are downstream of the Dredge Cell. Hourly
rain gage data for Kingston reported 7.95 inches for the month between November 20 and December 21, 2008,
of which 1.28 inches fell over 9 hours on December 20 and 21, 2008. This contradicts somewhat the data from
the Kingston Plant HED Office (Gage No. 2), which recorded 0.63 inches on December 21, and the Dredge Cell
Foreman’s rain gauge at the baseball field trailer (0.83 inches from December 21 through 22, 2008). However,
the total for the month from the Dredge Cell Foreman’s records is similar to the Kingston hourly gage data (7.51
versus 7.95 inches of rain).
The TVA also records hourly headwater elevation at the Kingston plant intake. The record shows a 0.5-foot (6-
inch) spike in river level from elevation 737.21 to 737.71, at 1:00 a.m. EST on December 22, 2008. At Watts
Bar Dam, approximately 44 miles downstream from the Kingston Plant, a perturbation (peak to trough) in the
water level of Watts Bar Reservoir occurred between approximately 2:00 to 5:00 a.m. EST on December 22,
2008. More information on this matter is presented in Volume IV.
1.3.4 Field Exploration The field exploration program included 87 cone penetrometer test (CPTu) soundings, 59 standard penetration test
(SPT) borings, 48 vane shear test (VST) borings and 40 borings to collect undisturbed samples using an
Osterberg piston sampler (OST). The soil boring logs are located in Appendix 2E - Soil Boring Logs in Volume II
and CPTu soundings are included in Appendix 2C - CPTu Soundings also in Volume II. The exploration methods,
sampling, and testing procedures are described in Section 2.2.1.4 Field Explorations also included in Volume II.

AECOM
K:\PROJECTS\60095742 - TVA\Final\FINAL Revisions\Volume 1\completed\FINAL-062509-Failure_Analysis_Report_VolI-rev.doc
25
There were 71 test locations where one or multiple soil borings and/or CPTu soundings were performed. These
locations are shown on Figure 1.3.4_1. The test locations were grouped into nine series (e.g., 100 through 900):
• 100-series boring locations were performed 10 feet downstream of the toe of the upstream Dike A. The
10-test locations for this series were spaced at approximately 200-foot intervals along the north side of
Dredge Cell 2.
• 200-series boring locations were performed along the original Dike C crest level (El. 748 feet). There were
13 test locations spaced at approximate 200-foot intervals.
• The 300-series borings consisted of four locations and were located on the remaining unfailed portion of
Dredge Cell 1.
• The 400-series boring locations were generally performed over former Dike B which was constructed at
the toe of the western Dredge Cells 1 and 2 along Swan Pond Road, with the exception of locations where
AECOM instrumentation was installed. Instrumented locations were offset eastward to avoid inference
with the construction of Swan Pond Road at the time of exploration. These locations were spaced at 200-
foot intervals. At several locations, 09-401, 09-403, 09-405, 09-407 and 09-411, only CPTu soundings
were conducted.
• The 500-series boring locations were performed within the failed portions of Dredge Cell 2.
• The 600-series boring locations were performed along intact Dike D, east of the Dredge Cells.
• The 700-series boring locations were performed along the Phase 2 Lateral Expansion for Stantec and
TVA.
• The 800-series were performed to obtain sampling and testing on the Divider Dikes between the Ash
Collection Pond and Settling Pond away from the failed portion of the dredge cell.
• The 900-series boring locations were performed as part of the seismic design and categorization effort
drilled near the location of 09-103 by Stantec and TVA.
1.3.4.2 General Ash and Soil Descriptions The following generalized soil profiles have been prepared using the information gathered from the soil borings,
undisturbed sampling boreholes, CPT soundings and test pits. This information is intended to provide a summary
of the general ash and soil conditions encountered at the site. There are some locations where these
generalizations are not necessarily applicable. Please refer to the boring logs, CPT soundings (Volume II) and
laboratory testing results (Volume III) for specific information at each exploration location. A more detailed
discussion of the laboratory results and the parameters used in the modeling of these units can be found in
Sections 1.4 and 1.5, Laboratory Testing and Results and Summary of Parameters Used for Failure Modes
Analysis.

AECOM
K:\PROJECTS\60095742 - TVA\Final\FINAL Revisions\Volume 1\completed\FINAL-062509-Failure_Analysis_Report_VolI-rev.doc
26
Unfailed Ash – Unfailed ash at this site consists of hydraulically sluiced fly ash and mechanically placed fly and
bottom ash that has apparently not been disturbed or substantially altered by the failure event that took place on
December 22, 2008. The intact sluiced ash materials are generally in a very loose to medium dense state, as
indicated in the SPT borings. These materials tend to exhibit horizontal layering. The mechanically placed ash
materials exhibit less evidence of horizontal layering and are somewhat more homogenized and tend to be
somewhat denser.
Failed Ash – The failed ash fill encountered during this exploration program was similar to the unfailed ash, in that
it appears to be similar or identical in overall composition. However, the failed ash has been split into two
categories; liquefied or tortured.
1. Liquefied ash, (as identified in this text and an example shown in Figure 1.3.4_2 is ash that has fully failed
and flowed as a liquid during the December 22, 2008 failure. This material is generally relatively
homogenized and shows no evidence of horizontal layer and, in many cases, shows little or no layering.
2. Tortured or disturbed ash has some bedding planes evident but they are not laminar and indicate a
fractured or turbulent re-depositional environment or disturbance of previous horizontal bedding. This
layer has often been encountered above the liquefied ash and apparent slide plane as shown in Figure
1.3.4_3.
Slimes – Underlying the ash, failed or unfailed, is a thin (<6-inch) layer of interbedded, silt and laminated, sensitive
silt, clay and slimes at many boring locations. Figure 1.3.4_4 shows a photograph of this material at the slide
plane at Boring 09-500B. This mixture of mostly ash and trace silt material has high water contents of 60 to 140
percent, is highly structured, shows clear horizontal laminations and upon remolding, becomes somewhat like
viscous slurry. The material has three to six percent of organic content by weight. Two of the samples have
liquidity indices of four to seven percent, unusually high for this test. Photomicrographs of this material can be
found in a letter report from the University of Kentucky attached in Volume III. Figure 1.3.4_5 shows the scanning
electron microscopic image of ash slime particles.
Clay and Silt Alluvium – The natural primarily clay and silt alluvium was encountered at most of the soil boring/
CPTu locations. This layer generally had a substantial sand content with shear strengths well in excess of those in
the slime layer, and could generally be considered medium to very stiff.
Silty Sand and Silt Alluvium – The clay alluvium transitioned over depth to a primarily natural sand and silt
alluvium. The relative density of this layer was generally very loose to medium dense and extended to the surface
of the bedrock.

AECOM
K:\PROJECTS\60095742 - TVA\Final\FINAL Revisions\Volume 1\completed\FINAL-062509-Failure_Analysis_Report_VolI-rev.doc
27
Shale – Weathered to solid Conasauga shale was encountered at the boring locations. Several cores were
performed within the shale to obtain samples around the periphery and the center of the dredge cells. Additional
information regarding the shale bedrock and its geologic characteristics are described in detail in Section 2.2.1.3
Geology.
1.3.4.3 100-Series Findings All of the borings 09-100 through 09-109 show failed ash down to an apparent slide plane on undisturbed native
soil. The thin horizontal bedding planes, as would be expected in hydraulically placed ash, were not encountered
in the 100-series borings, except at Soil Boring 09-110, which was located in an unfailed area. Instead the ash
was found to be highly disturbed and homogenized, resulting from the ash flow that occurred. This failed or
tortured ash, in many cases, exhibited distorted or turbulent bedding planes or no bedding planes at all. We refer
you to the photos included in the Appendix G of Volume III and the Dr. DeGroot Laboratory Results.
Below this failed and distorted ash, sensitive silts, clays and interbedded ash were encountered. This layer was
found to be very thin, ranging in thickness from 0.5 to 6 inches and was identified in CPTu soundings and borings
where undisturbed sampling was taken. Some SPT soil borings also have shown this thin layer. Pictures of this
material are shown in the above noted photo Appendices. This sensitive slime layer has water content ranging
from 60% to more than 100%, Liquidity Indices of approximately 4 to 7, and organic contents of approximately
3% to 6%.
A geologic profile showing the 100-series borings is attached as Figure 1.3.4_6.
1.3.4.4 200-Series Findings In the 200-series borings, the horizontal bedding planes were again not present in the ash and the ash exhibited
failed, liquefied and turbulent characteristics previously discussed. However, in contrast to the 100-series
locations, there was no evidence of the slimes layer. Instead, the clay and silt alluvium was generally encountered
directly beneath the failed ash layers.
A geologic profile showing the 200-series borings is attached as Figure 1.3.4_7.
1.3.4.5 300-Series Findings The ash encountered in the 300-series locations exhibit the clear, unfailed, horizontal bedding planes. The relative
density of the ash in the 300-series was generally very loose to medium dense. Occasional layers were found to
be dense to extremely dense. The clay and silt alluvium was encountered directly underlying the unfailed ash.
The sensitive slime layer was not found in the soil borings or encountered within CPTu soundings at these
locations.

AECOM
K:\PROJECTS\60095742 - TVA\Final\FINAL Revisions\Volume 1\completed\FINAL-062509-Failure_Analysis_Report_VolI-rev.doc
28
1.3.4.6 400-Series Findings The ash encountered in the 400-series boring locations was found to be both failed and unfailed, depending on
location and depth. The soil borings and CPTu sounding were performed from a surface that had been
substantially reformed following the December 22, 2008 failure. Much of the surface (up to 10 feet) was filled
with blast-rock and gravel to form a stable running surface for heavy equipment. Beneath the ash in these
locations, the slime layer was found intermittently.
A review of AECOM boring logs along the toe of Swan Pond Road reveals that with the exception of Borings 09-
404 and 09-408 drilled at least 80 feet south of Swan Pond Road edge, there is only a shallow layer of failed
ash along this alignment. Below this failed material were intact samples of Dike B fill. In AECOM Borings 09-
404 and 09-408 there was evidence of deep ash failure in the interior portions of Dredge Cells 1 and 2 on no
evidence of intact Dike B fill. These deep sluiced ash layers liquefied, and weakened the foundation of the
mechanically-placed, west facing dikes and allowed the first 1,000 feet of the west facing dike slide over the
railroad track. A geologic profile showing the 400-series borings is attached as Figure 1.3.4_8.
1.3.4.7 500-Series Findings In the 500-series locations were through failed Cells 2 and 3. Borings encountered ash that was either liquefied
or tortured. The slime layer was encountered below the failed ash and above the clay alluvium at two of the four
borehole locations.
1.3.4.8 600-Series Findings The ash in the 600-series locations along Dike D was found to be generally unfailed with minor evidence of
partial ash liquefaction in 09-600 and 09-601). The slimes were found at two AECOM boring locations on the
northern portion of Dike D (09-600 and 09-605). This layer was not encountered in the southern portion of the
unfailed dike under the Phase I Emergency Dredge Cell. Figure 1.3.4_9 shows the interface between the
unfailed ash and the slimes. This photo shows the horizontal bedding, typical of this slime layer; however, it
shows that the interface between the two materials is inclined, possibly due to previous mechanical dredging
which occurred prior to the 1984 Dike D failure.
A geologic profile showing the 600-series borings is attached as Figure 1.3.4_10.
1.3.4.9 700 and 800-Series Findings The CPTu and soil borings in the 700 and 800 series were performed in the area of the Phase 2 lateral
expansion of the dredge cells (700 holes), and along the divider dike between the ash collection pond and
settling pond (800 holes). The ash in these locations was unfailed and exhibited horizontal bedding. The
sensitive slime layer was encountered only in a couple of the locations in the 700 series. No slime or failed ash
was encountered in the 800 series locations.

AECOM
K:\PROJECTS\60095742 - TVA\Final\FINAL Revisions\Volume 1\completed\FINAL-062509-Failure_Analysis_Report_VolI-rev.doc
29
1.3.5 Test Excavations 1.3.5.1 Spillway Test Trenches No. 1 and No. 2 The original ash pond spillway outfall piping was shown at two locations on historic drawings in TVA archives,
leading to uncertainty regarding the actual location of the original ash pond spillway. Recollection of long-time
TVA staff interviewed during this study also provided somewhat conflicting information regarding locations. Two
probable locations for the spillway piping were identified for exploration. The locations explored by Test
Trenches No. 1 and 2, along with Test Trench No. 3 are depicted on Figure 1.3.5_1. Photographs for this
section are included in Section 1.13.2 of this report.
The first possible location for the spillway outfall piping shown on the 1951 design drawings, at Test Trench No.
1 excavation, was probed on January 25, 2009. Test Trench No. 1 proved difficult to excavate because of the
high water content of ash, and efforts consisted of “fishing” to depths of approximately 10 feet below grade with
two amphibious trackhoes (ATH). Activity at Test Trench No. 1 was suspended when no sign of the concrete
pipe or clay dike material was encountered.
Excavation of Test Trench No. 2 commenced on the afternoon of January 30, 2009 using a conventional ATH
and a long-stick ATH. Dike clay cap material was encountered almost immediately and the spillway pipe was
exposed on February 1, 2009. Only one of two concrete spillway pipes was identified and fully excavated.
Despite probing in the vicinity of the first pipe, the second pipe was not located.
The exposed pipe was 30-inch inside diameter, flush jointed reinforced concrete pipe with okum gasket material
in the grooved joints. The pipe was exposed over a length of approximately 55 feet. The outfall end (northeast)
of the pipe extended beneath one of the major west-to-east drainages, thus continued excavation to the
northeast end of the spillway pipe would have risked flooding the entire excavation. The excavation was halted
and a berm created adjacent to the drainage to prevent flooding. Following exposure of the concrete pipe, a
four-foot long section of the pipe was removed approximately half-way along the exposed section. The
transverse sections of pipe had only minor amounts (less than two inches thick) of ash in them. Staining on the
pipe walls indicate that when in operation, the pipes flowed at least half-full. The spillway intake pipe was
located to the southwest of the Test Trench No. 2 excavation. However, because of seepage from the ash, a
berm had to be left in place between the intake structure and the spillway pipe. Only the upper rim of the intake
structure was exposed by excavation. The intake was plugged with ash. Photographs illustrating the spillway
pipe and intake structures are included in Section 1.13.2 of this report.
Although the dike material had been disturbed by excavation (Photos 23 and 24), Figure 1.3.5_2 illustrates a
schematic cross-section through the dike with the spillway pipe shown on the section.

AECOM
K:\PROJECTS\60095742 - TVA\Final\FINAL Revisions\Volume 1\completed\FINAL-062509-Failure_Analysis_Report_VolI-rev.doc
30
1.3.5.2 Cell 1 Test Trench No. 3 The design perimeter of the excavation was staked by TVA surveyors and a temporary benchmark was installed
to facilitate manual surveys if necessary. A Work Plan and Job Safety Analysis (JSA) were prepared for the
excavation and approved by TVA prior to commencement of excavation activities.
Excavation of the south-facing Dredge Cell 1 upstream dikes allowed direct observation, sampling, and testing
of the upstream construction dikes (placed and compacted ash) and also the dredged material that was sluiced
behind the dikes. The excavation also facilitated observation and sampling of the lateral drainage system
installed as the dike was raised. Figures 1.3.5_3 and 1.3.5_4 illustrate the approximate extent of excavation
and a cross-section through the existing dikes, respectively.
Material excavated from the south-facing dikes C1 through D2 was transported to an instrumented area located
to the northwest of the excavation and east of Boring/Inclinometer Location 09-404 identified as the Test Trench
Ash Disposal Area (TADA) permitted by TDEC. Prior to ash placement, four settlement plates were constructed
and installed at random locations within the TADA. The area was not amenable to proof rolling prior to ash
placement due to the soft surface and underlying material. The four settlement plates are illustrated on Figure
1.3.5_5 included with this report. The settlement plate elevations (surface plate and top of pipe) were surveyed
using both GPS Station and conventional transit methods prior to ash placement. Table 1.3.5_T1 summarizes
the initial elevation and location data for the settlement plates.
Most of the ash transported from the excavation was dry. The inclinometer installed at 09-404 and settlement
plates were read frequently during the initial stages of ash placement.
Also installed as part of the excavation activities were four surveyed monuments located on the slope created by
the grading of the former high wall. These monuments were designated UT-1 through UT-4. The location of the
UT monuments is illustrated on Figure 1.3.5_5. Elevation and location data for the UT monuments are also
included on Table 1.3.5_T1.
Prior to commencement of the excavation, AECOM subcontracted Roto Rooter of Knoxville, Tennessee, to
televise accessible drainage pipes along the south-facing Dredge Cell 1 dikes. Only non-perforated
polyethylene pipe (PE) was video taped. The perforated PE pipe was present as laterals, but the camera was
not able to negotiate the 90 degree corners to view the perforated pipe alignment. None of the video-taped
pipes were obstructed and most carried water in the past as evidenced by staining on the sidewalls of the pipe.
Two of the drains had standing water where the drain pipe was installed with downward sag. Photos 1 through
8 illustrate the surface expression of the pipes and video equipment, including one pipe that was observed to be
obstructed at the surface. Photos 5 through 8 are representative still photos captured from selected video
illustrating conditions encountered in the drains.

AECOM
K:\PROJECTS\60095742 - TVA\Final\FINAL Revisions\Volume 1\completed\FINAL-062509-Failure_Analysis_Report_VolI-rev.doc
31
Excavation of the Cell 1 trench excavation commenced on March 7, 2009 at El. 821 feet, in loose material
placed as part of the future Stage D3 Dike. Three feet of material was removed prior to sampling. Following
removal of material to El. 818 feet, the excavation proceeded downward in two-foot depth increments. Samples
were collected from five unique dike stages (C1 through D2). Figure 1.3.5_4 illustrates the approximate cut
limits of the excavation cut on a cross section with individual dikes labeled.
Contrary to the expected moist or wet conditions, the majority of the excavation encountered dry material. Two
isolated pockets of soft material were encountered where water had become trapped behind the clay cover
material along the south outer edge of the dike. After the initial 8 feet of excavation was completed, the JSA
was revised to reflect the dry conditions, with the revised JSA remaining in force for the duration of trench
excavation activities. One area of softer ash was encountered during a later phase of the excavation along the
north side of the excavation in sluiced ash. None of these wet/soft spots were laterally or vertically extensive
and neither excavation activities nor safety protocols were adjusted by their discovery.
As the excavation proceeded, three randomly selected sand cone density (SC) tests were conducted on each of
14 excavation cuts. SC locations are identified as “SC-” in the report, on figures, and in data tables. SC
samples 1 through 48 were collected during the initial excavation, working from El. 818 feet downward to El. 790
feet. Material in these samples was collected from both compacted bottom ash in the Stage D2 through Stage
C1 Dikes as well as non-compacted sluiced ash placed behind the dikes. The majority of SC samples 49
through 68 were collected from sluiced ash placed behind the dikes from El. 816 feet downward to El. 792 feet.
Figures 1.3.5_6 through 1.3.5_19 illustrate each cut and corresponding sample locations.
Upon completion of the sand cone tests, two of the three SC test locations were chosen for Shelby Tube (ST)
sampling. Shelby tube (ST) samples are identified as “ST-” in the report, on figures and data tables. Four ST
samples were attempted at each lift of the excavation, two horizontally and two vertically. The locations for the
ST samples were chosen to collect samples from differing types of materials if present (e.g., bottom ash versus
fly ash, wet versus, dry, etc.). ST samples 1 through 62 were collected during the initial excavation working
from El. 818 feet downward to El. 790 feet. The majority of ST samples 63 through 90 were collected from
sluiced ash placed behind the dikes from El. 816 feet downward to El. 792 feet.
The density of the in-situ ash was calculated in general conformance with the latest version of ASTM D 1556,
“Test Method for Density and Unit Weight of Soil in Place by the Sand-Cone Method.” Figure 1.3.5_20 is a plot
of dry density versus elevation with sluiced ash and compacted ash (dike material) plotted separately.
Determination of sluiced versus compacted ash was made based primarily on location, however density
differences noted between ash placement type was also considered. The range of density of sluiced ash (56.0
to 82.2 pounds per cubic foot [pcf]) is slightly lower than that for compacted ash (56.0 to 106.5 pcf). A best fit
line for each data set illustrates the difference in dry density between sluiced and compacted ash. Table
1.3.5_T2 is a summary of the results of SC and ST dry density measurements.
AECOM
K:\PROJECTS\60095742 - TVA\Final\FINAL Revisions\Volume 1\completed\FINAL-062509-Failure_Analysis_Report_VolI-rev.doc
32
Periodically, drain piping installed during construction was encountered. Drain pipe between the lateral and
daylight, perpendicular to the dike axis, was installed using 8-inch inside diameter (I.D.) non-perforated
polyethylene (PE) piping. The non-perforated piping was placed directly into the ash. Lateral drains running
parallel to the dike were completed using 8-inch inside diameter, perforated PE pipe. The laterals were placed
into a trench lined with geotextile (both woven and non-woven were observed). The trench drain consisted of a
geotextile lined 18-square trench backfilled with Number 57 gravel and perforated pipe. All of the drains
observed had transmitted water in the past as evidenced by gravel dust and iron oxide staining on and inside
the pipes. In general, the gravel packs trench drains were clean with only small amounts of ash present inside
the observed geotextile. Only one of the pipes had sediment deeper than the corrugations on the inside. The
remainder appeared to be virtually sediment free. Samples of the drain pipe, geotextile, and filter pack were
collected for potential testing. Photos of the drain piping are included in the Test Trench No. 3 Photo Log in
Section 13.2.
1.3.6 Geophysical Surveys Seismic shear wave velocity testing was performed at four locations (shown on Figure 1.3.6_1) and the shear
wave velocity was calculated for unfailed and failed ash, alluvium, and the upper shale unit at the site. The
results were used to determine soil properties for liquefaction analysis for future design of the closure of the
dredge cell.
1.3.6.1 Methodology Two geophysical methods were employed. It was difficult to obtain shear wave velocities in the fractured shale.
Crosshole Seismic Testing: Crosshole Seismic (CHS) surveys were conducted in general accordance with
ASTM D-4428/D-4428M. These procedures provide a means of measuring in-situ shear-wave velocity (VS).
The first tested interval was between 0.5 to 1 feet below ground surface (bgs). The remaining digital seismic
records were recorded at 5-foot vertical depth increments to 100 feet bgs. Tests were performed in
inclinometer-cased boreholes at 09-103, 09-211 and 09-301. Inclinometer-corrected distance measurements
were used to calculate the final seismic wave velocities.
Multichannel Analysis of Surface Waves/Microtremor Array Measurements (MASW/MAM) Testing: The
combined multichannel analysis of surface waves (MASW) and microtremor array measurement (MAM) in situ
shear wave velocity testing was performed at 09-103, 09-208 and 09-211. MASW/MAM uses changes in
surface wave frequency with increasing distance from the energy source location. For MASW testing, the
waves are initiated by a source at the surface (i.e., hammer and plate, or acoustic wave generator), and the
response is measured by geophones placed at discrete intervals along a specified survey line. The MAM
method operates on the same principle, but records lower frequencies from ambient vibrations at the site
(generated by vehicles, swaying trees, etc.) Combining these methods provides a wider frequency range and
increases the depth of the calculated velocity model.

AECOM
K:\PROJECTS\60095742 - TVA\Final\FINAL Revisions\Volume 1\completed\FINAL-062509-Failure_Analysis_Report_VolI-rev.doc
33
The MASW/MAM methods are not a direct measurement of the s-wave (i.e., shear wave) at discrete depth
intervals, but rather an average across the length of the seismic array. Therefore, modeled sections are
expected to vary from direct interval measurements as would be performed in CHS surveys.
1.3.6.2 Summary CHS testing was performed in inclinometer-cased holes at three locations within the dredge cell area. No shear
waves from the CHS tests were observed below the top of the bedrock surface due to problems in the
casing/grout interface with the drilled shale. The testing program was supplemented by MASW/MAM surface
wave methods to obtain shale bedrock shear wave velocity information. Velocity ranges observed for the
various materials at the site are as follows:
• Clayey dike material - 650 to 900 feet per second (ft/s);
• Loose surface materials and fly ash - 250 to 680 ft/s; bottom ash 780 to 1,040 ft/s;
• Natural clays below ash - 420 to 800 ft/s;
• Natural sands above shale bedrock - 700 to 950 ft/s; and
• Fractured shale bedrock - 880 to 1,790 ft/s.
In general, there is a strong correlation between shear wave velocities and CPTu resistances across the site.
The shear wave velocities also correlate well with variations shown on the boring log (i.e., material descriptions).
The SPT N-values show a general conformance to shear wave variations in the section but still vary
considerably when in materials with very low SPT blow counts (WOH or WOR). The MASW/MAM testing
performed at Boring 09-211 shows shear wave velocities that are 25 to 35 percent higher than the tests
performed at Borings 09-301 and 09-208. This may be a directional bias in the deeper values caused by using
a MAM array that had to be laid out in a straight line and not an “L” shaped array (due to space considerations
next to wet ash). The MASW/MAM modeled average velocities through a larger zone of material and as a result
are less precise than CHS testing at discrete depth intervals. The CHS testing should be relied upon for shear
wave velocities above bedrock in soil and ash fill and MASW/MAM data used for shear wave velocities in shale
bedrock. Tables in Volume II summarize the collected data versus depth and test method. Figure 1.3.6_2
shows a graphic depiction of the changes in shear wave velocity with depth for each of the tests.

AECOM
K:\PROJECTS\60095742 - TVA\Final\FINAL Revisions\Volume 1\completed\FINAL-062509-Failure_Analysis_Report_VolI-rev.doc
34
1.4 Laboratory Testing and Results Throughout and upon completion of the field exploration program, samples were returned to AECOM’s in
Vernon Hills, Illinois laboratory for additional testing and observation. In addition, undisturbed Osterberg tube
samples were delivered to the University of Massachusetts in Amherst, Massachusetts for specialized testing on
samples from the ash/native soil interfaces. In general, the intent of the laboratory testing program was to
properly classify the encountered materials in relation to the Unified Soils Classification System (USCS), to aid
in the stratification of the encountered materials, to measure the strength and deformation properties of the
encountered materials and to evaluate the permeability and seepage characteristics of the soils.
1.4.1 General Representative samples of the encountered materials were selected for testing based on geotechnical
considerations, failure location and material characteristics.
Soil types were selected for index testing to aid in classification and stratification of the soils. The ash was
tested at various void ratios to evaluate the strength and deformation properties for various modes of loading.
Additionally, the permeability of the ash material was tested so the seepage of water through the dredge cell
impoundments could be evaluated. The compacted moisture-density relationship of the ash was measured to
aid in the evaluation of the compacted ash dikes around the perimeter of the site.
Due to the finite amount of the laminated sensitive slimes that were recovered, the testing program needed to
be carefully selected and reviewed by senior engineers. Index testing was completed so the material could be
classified in detail. The shear strength and deformation properties of the slime layer were important in the
stability analysis, consequently specialized testing was completed at the University of Massachusetts soils
testing laboratory to accurately measure strength and compressibility properties.
The index properties of the alluvial clays and silts were measured. In addition, the compressibility,
preconsolidation pressure and shear strength parameters were measured.
Limited testing was completed on the alluvial silts, sands and gravels which were encountered. Basic index
properties were determined to aid in the classification.
The carbon content of a selection of ash and natural soil samples was determined. The pH of ash was also
tested. The results of these tests are presented in Volume III of this report.

AECOM
K:\PROJECTS\60095742 - TVA\Final\FINAL Revisions\Volume 1\completed\FINAL-062509-Failure_Analysis_Report_VolI-rev.doc
35
1.4.2 Geotechnical Index Tests, Gradations and Classification The index testing completed for this project included grain size distribution, liquid limit, plastic limit, plasticity
index, specific gravity and density determinations. Specific details related to the testing procedures
implemented for this series of tests are presented in Volume III of this report. Individual test results are included
in the appendix of Volume III.
In total, the grain size distributions of approximately 180 samples were determined. The ash consisted primarily
of silt size particles with trace to little sand and clay. The slime layer tended to be finer grained silt than the ash.
The alluvial silts and clays were primarily fine grained with trace to some sand content. The alluvial sand were
composed of primarily fine to coarse sand size particles with trace to some silt sized particles and trace amounts
of gravel and clay.
The liquid limit, plastic limit and plasticity index of approximately 230 samples were determined. The ash was
determined to be non plastic. The slime was generally determined to have a relatively low plasticity, the
plasticity index ranged from approximately 10 to 25. Liquid limits on the order of 30 to 60 were measured in the
slimes. The alluvial clays were generally low plasticity clays and silts. The alluvial sands were of low plasticity
to non-plastic. The results of the Atterberg limit testing is summarized in Table 1.4_T1 at the end of this report.
Individual tests plots are included in Volume III of this report. The Atterberg limits are also presented on the soil
boring logs in Volume II of this report. The Atterberg limits for soils and ash which were determined to be non-
plastic have not been presented on the soil boring logs.
The specific gravity of approximately 145 samples was measured. Thirty-three samples of the ash were tested.
The specific gravity of the ash varied from 2.2 to 2.6 with an average of approximately 2.37. The specific gravity
of the slime ranged from 2.2 to 2.3. The specific gravity of 108 samples of the alluvial deposits was measured.
The specific gravity ranged from 2.6 to 2.8 with an average of 2.7. The results of the specific gravity testing are
summarized in Table 1.4.2_T1
The wet density, dry density and void ratio of the ash were also evaluated as part of the index testing. In total,
the wet and dry density of 73 samples of the fly ash was determined. The wet density of the ash varied from 90
to 130 pounds per cubic foot (pcf) with an average of 106 pcf. The dry unit weight was calculated to range from
50 to 116 pcf with an average of 76 pcf. The void ratios were calculated to range from 0.3 to 1.3 with an
average of 0.97

AECOM
K:\PROJECTS\60095742 - TVA\Final\FINAL Revisions\Volume 1\completed\FINAL-062509-Failure_Analysis_Report_VolI-rev.doc
36
1.4.3 Proctor Density Tests Laboratory moisture density testing was performed on bulk samples of the ash collected from the test trench
which was excavated at the site. The intent of the testing was to evaluate the degree of compaction of the ash
dikes which were constructed at the site. Please refer to Section 1.3.5.2 for a comparison of the laboratory
determined maximum dry densities to the densities determined from field sand cone testing.
1.4.4 Hydraulic Conductivity Testing Horizontal and vertical triaxial hydraulic conductivity testing was completed on thin walled tube samples
collected from the test trench excavation. The testing was performed to determine the hydraulic conductivity of
the ash at the site so seepage through the impoundment could be modeled. The average horizontal and
vertical hydraulic conductivities of the ash were determined to be 1.3E-04 cm/sec.
1.4.5 Direct Shear Testing Direct shear testing was performed at the Vernon Hills laboratory on the alluvial clay soils and reconstituted
samples of the fly ash. A more comprehensive discussion on testing procedures is included in the Volume III of
this report. These tests were performed in a drained condition at a very slow rate of shear. On average, the
internal angle of friction for the reconstituted ash was determined to be approximately 34 degrees. However, at
low confining stress the friction angle of the ash was measured between 38 to 42 degrees. For analysis
purposes, AECOM chose 37 degrees for ash at low confinement. The alluvial clays were determined to have an
average drained friction angle of 32 degrees. The direct shear tests closely represent the horizontal mode of
shear that would be experienced by the soils along the base of the failure wedge.
1.4.6 Triaxial Shear Strength Testing An extensive program of triaxial shear strength testing was performed for this project. Two modes of shear
were tested as part of the analysis. Triaxial compression testing was the predominant mode of shear. The
compression test is most applicable to the driving portion of the failure wedge (active zone); however, the
strengths derived from this test can reasonably used to analyze most modes of shear. The basic principal of the
test is a constant confining stress is applied while the axial stress is increased.
The second mode of shear analyzed was triaxial lateral compression. This mode of shear is most applicable to
the passive zone of the failure surface. This mode was tested using reduced triaxial extension testing which is
equivalent to lateral compression for undrained testing of saturated soils. In reduced triaxial extension testing, a
constant confining stress is applied while an upward axial force is applied.
Besides the variation in the loading type, the drainage conditions were also modified for various triaxial tests.
The majority of the tests were performed in an undrained condition. During shear, no water was permitted to
enter or leave the sample making the sample volume constant. The water pressure within the sample is
measured so that the behavior of the soil can be determined.

AECOM
K:\PROJECTS\60095742 - TVA\Final\FINAL Revisions\Volume 1\completed\FINAL-062509-Failure_Analysis_Report_VolI-rev.doc
37
A second series of tests were performed in a drained condition. For this scenario, a constant cell pressure is
maintained while the volume of water in the sample is allowed to change. The change in volume is measured to
help evaluate the behavior of the sample.
The final variable in the triaxial testing program was the consolidation method of the samples. The majority of
the samples were consolidated isotropically. In isotropic consolidation, the horizontal confining stress and axial
stress are the same.
Some samples were also consolidated anisotropically. In anisotropic consolidation the horizontal confining
stress is less than the vertical consolidating stress. For the series of tests completed for this project, the
consolidation was performed in the Ko condition. Ko consolidation is intended to simulate the consolidation
stresses and modes that would be experienced by the soil in their deposited condition. Kv is determined by
preventing radial expansion of the sample during consolidation.
A significant amount of time and effort focused on the triaxial testing was on the ash which was recovered from
the site. Because of the granular nature of the ash, it was not possible to extrude undisturbed samples for
testing. Therefore, the testing program on the ash was performed on reconstituted ash specimens. Two
methods were employed for reconstituting the samples. Initially, the samples were reconstituted by water
pluviation. In general, water pluviation consists of creating a slurry of the ash and water. The slurry is poured
into a mold and allowed to settle and consolidate to create a specimen for testing. The second method of
sample preparation was moist-tamp. The moist-tamp method consists of preparing a mixture of water and ash,
placing the mixture into a mold in lifts and then compacting the lifts to a specific density. After the samples were
molded, they were saturated and consolidated. A more comprehensive explanation of the sample preparation
methods is provided in Volume III of this report.
Table 1.4.6_T1 – Summary of Results – Triaxial Testing on Ash
Test Type Behavior Number of Tests
Average Friction Angle
Average Peak Strain
Contractive 6 27.4 deg 1.4% Isotropic Consolidated Undrained Compression Dilative 4 30.3 deg 12.4%
Contractive 3 35.6 deg 0.4% Ko Consolidated Undrained Compression Marginal 4 32.2 deg 11.5%
Isotropic Consolidated Drained Compression Contractive 10 30.4 deg 18.8%
Anisotropic Consolidated Undrained Reduced Extension Contractive 1 19.2 deg 0.2%

AECOM
K:\PROJECTS\60095742 - TVA\Final\FINAL Revisions\Volume 1\completed\FINAL-062509-Failure_Analysis_Report_VolI-rev.doc
38
A second series of Triaxial testing was performed on samples of the alluvial clays and silts. All of these tests
were performed as CIU-TXC. The average results are summarized in the following table. The results of each
test are included in the table at the end of this chapter and plots of each test are included in Volume III of this
report.
Table 1.4.6_T2 – Summary of Results – Triaxial Tesing on Alluvial Clay and Silt
Soil Type Number of
Tests Average Friction
Angle Average
Su Average Peak
Strain Silty Clay 22 35.3 deg 2,390 psf 20.0%
Clayey Silt 16 32.8 deg 2,190 psf 22.3% Silty Sand 4 34.7 deg 2,460 psf 15.1%
1.4.7 Direct Simple Shear Testing Osterberg Sample tubes were carefully transported from Kingston, Tennessee and Vernon Hills, Illinois to
University of Massachusetts in Amherst, Massachusetts on six occasions. Tubes were released to Dr. Don
DeGroot for classification, index testing, constant rate of strain consolidation and direct simple shear tests.
The goal of this testing was to open tubes that were expected to contain the interface between ash and the
native foundation soils. These explorations determined that many of the suspected failure planes were at this
interface. After carefully opening several dozen tubes, AECOM and Dr. DeGroot were able to isolate and test
loose slimes and foundation clay. A total of five clay and seven slime tests using the constant rate of strain
consolidation device. Dr. DeGroot sheared two clay and eleven slimes undisturbed tube samples, using the
undrained direct simple shear devise. In Appendix 3H is Dr. DeGroot’s report describing test methods and
results.
1.4.8 Consolidation Testing The purpose of the consolidation testing program was to evaluate the stress history of the foundation clay soils
encountered at the site. Oedometer testing was used for all consolidation tests completed at the AECOM lab.
A tightly defined load increment was selected to clearly define the preconsolidation pressure using the work-
energy method of reduction. The preconsolidation pressures in the native alluvial clay ranged from 2.5 to 4.5 tsf
indicating that the samples tested were overconsolidated, likely due to desiccation in the former Swan Pond
floodplain.
1.4.9 Tube Photographs Selected photographs of Osterberg tube samples extracted in the AECOM Vernon Hills laboratory are provided
in Volume III of this report.

AECOM
K:\PROJECTS\60095742 - TVA\Final\FINAL Revisions\Volume 1\completed\FINAL-062509-Failure_Analysis_Report_VolI-rev.doc
39
1.4.10 Scanning Electron Microscopy Analysis of Slimes One sample of the slimes from AECOM Boring 503B (37.5 to 38.0 feet) was tested by the University of
Kentucky Center for Applied Energy Research, using a scanning electron microscope (SEM). Their letter report
is included in Appendix 3I. See Figure 1.3.4_5 for SEM photographs of the slimes showing an abundance of
small spherical fly ash particles.
Three scanning electron micrographs were produced at a magnification of 600X. Fly ash spheres of varying
sizes are clearly visible in the micrographs. The D50 for the spheres was reported to be 11.2 microns. The
material was determined to be representative of very fine fly ash, with effectively no clay particle content, and
judged by the analyst to be “classic F fly ash”. Further, the particles are mostly round in shape, have little
mineral growth and no polar tendency for surface charges, thus making them “thixotropic”, and subject to
“almost infinite creep.” Thixotropic materials are similar to yogurt and ketchup; i.e. they are very soft but do not
flow until they are disturbed.
1.4.11 pH Testing of Ash The pH of the soil profile in Boring 09-302 was determined in general accordance with ASTM D4972.
The pH varied from approximately 7.3 to 10. In general, the pH decreased with depth. Please refer to
Table 1.4.11_T1 for a summary of the testing results.
1.4.12 Carbon Content Testing of Ash The carbon content of ash samples was evaluated from multiple borings across the project site. The testing
was performed in general conformance with ASTM Standard D2974 Method C. The carbon content of the ash
samples ranged from approximately zero to 5.5%. No significant trend was noted in terms of variation of carbon
content with depth or location across the site. Please refer to Table 1.4.12_T1 for the results of the testing
program.
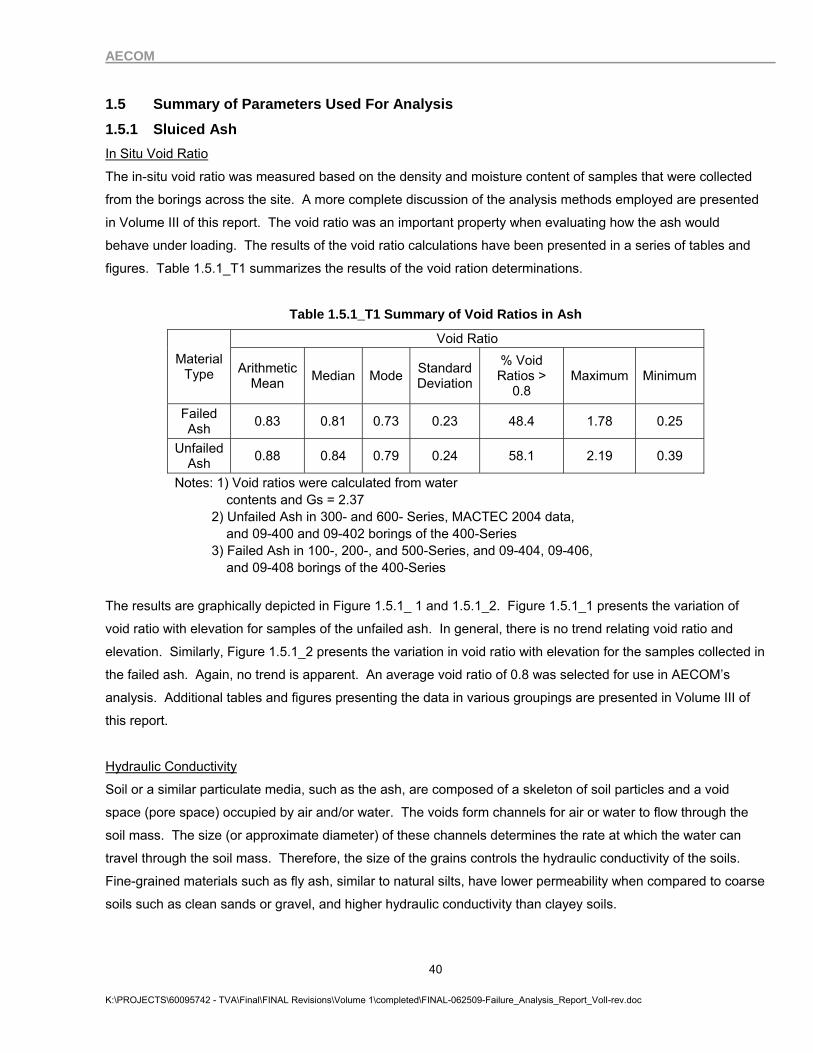
AECOM
K:\PROJECTS\60095742 - TVA\Final\FINAL Revisions\Volume 1\completed\FINAL-062509-Failure_Analysis_Report_VolI-rev.doc
40
1.5 Summary of Parameters Used For Analysis 1.5.1 Sluiced Ash In Situ Void Ratio
The in-situ void ratio was measured based on the density and moisture content of samples that were collected
from the borings across the site. A more complete discussion of the analysis methods employed are presented
in Volume III of this report. The void ratio was an important property when evaluating how the ash would
behave under loading. The results of the void ratio calculations have been presented in a series of tables and
figures. Table 1.5.1_T1 summarizes the results of the void ration determinations.
Table 1.5.1_T1 Summary of Void Ratios in Ash
Void Ratio Material
Type Arithmetic Mean Median Mode Standard
Deviation
% Void Ratios >
0.8 Maximum Minimum
Failed Ash 0.83 0.81 0.73 0.23 48.4 1.78 0.25
Unfailed Ash 0.88 0.84 0.79 0.24 58.1 2.19 0.39
Notes: 1) Void ratios were calculated from water contents and Gs = 2.37 2) Unfailed Ash in 300- and 600- Series, MACTEC 2004 data, and 09-400 and 09-402 borings of the 400-Series 3) Failed Ash in 100-, 200-, and 500-Series, and 09-404, 09-406, and 09-408 borings of the 400-Series
The results are graphically depicted in Figure 1.5.1_ 1 and 1.5.1_2. Figure 1.5.1_1 presents the variation of
void ratio with elevation for samples of the unfailed ash. In general, there is no trend relating void ratio and
elevation. Similarly, Figure 1.5.1_2 presents the variation in void ratio with elevation for the samples collected in
the failed ash. Again, no trend is apparent. An average void ratio of 0.8 was selected for use in AECOM’s
analysis. Additional tables and figures presenting the data in various groupings are presented in Volume III of
this report.
Hydraulic Conductivity
Soil or a similar particulate media, such as the ash, are composed of a skeleton of soil particles and a void
space (pore space) occupied by air and/or water. The voids form channels for air or water to flow through the
soil mass. The size (or approximate diameter) of these channels determines the rate at which the water can
travel through the soil mass. Therefore, the size of the grains controls the hydraulic conductivity of the soils.
Fine-grained materials such as fly ash, similar to natural silts, have lower permeability when compared to coarse
soils such as clean sands or gravel, and higher hydraulic conductivity than clayey soils.

AECOM
K:\PROJECTS\60095742 - TVA\Final\FINAL Revisions\Volume 1\completed\FINAL-062509-Failure_Analysis_Report_VolI-rev.doc
41
Based on laboratory hydraulic conductivity tests on ash tube samples recovered in horizontal and vertical
orientations from the walls and floor of the test excavation, the average hydraulic conductivities (Kh and Kv from
19 tests in each orientation) were measured at 6.3E-05 and 5.3E-05 cm/sec, respectively. The computed Kh/Kv
ratio of 1.2 was rounded to 1 for use in the seepage analysis. Of note, an average Kh value approximately one
order of magnitude lower (6.2E-06 cm/sec) was determined from the CPTu dissipation tests. This value was not
used in the seepage analysis since there is no corresponding Kv from which to compute a Kh/Kv ratio.
Shear Strength
When stresses are applied to a particulate media, these stresses are carried in part by the solid particles (soil
skeleton) and in part by the water in the pore spaces. The effective stresses are the stresses carried by actual
solid particles or soil skeleton. The pressure in the water is also called porewater pressure. The applied
stresses in a soil are therefore equal to the sum of the effective stress and the pore water pressure. The
importance of the effective stress concept relies on the fact that the shear strength of a soil does not depend on
the total stresses, but on the effective stress.
Soil can withstand shear stresses to a certain limit (peak strength) before constant strength (perfect plasticity)
or loss of strength (strain softening) is observed. This limit is called the peak shear strength. The shear
strength of the soil is provided by the friction developed between the soil grains and it is related to the friction
angle of the soil. The friction angle is not a unique property of a soil, as it does not depend only on the grain
type, shape and size but also on the confining pressure and density. For instance, a mass of soils formed by
the same soil particles could have a high friction angle when placed in a dense condition at low confining
pressures and low friction angle when encountered in a loose condition at high confining pressures.
As mentioned, the shear strength is only related to the effective stress acting on; and thus strength of the soil;
the actual strength in a certain sliding plane is computed as tangent of the friction angle multiplied by the
effective stress acting in a perpendicular direction to the sliding plane. Since the total stress is equal to the
effective stress plus the pore water pressure, the effective stress cannot be computed unless the porewater
pressure is known.
Estimating the porewater pressure can be difficult since it may vary during shearing. When soil is stressed, the
stresses are initially resisted by the water, causing an initial change in the porewater pressure. However, this
excess porewater pressure dissipates over time by flowing away from or to areas of stress concentration. This
dissipation may be almost instantaneous (sands and gravels) or may take long periods of time (silts and clays).
AECOM
K:\PROJECTS\60095742 - TVA\Final\FINAL Revisions\Volume 1\completed\FINAL-062509-Failure_Analysis_Report_VolI-rev.doc
42
Two opposite scenarios of excess porewater pressure, and consequently of soil strength, can be assumed and
used for stability analysis:
Undrained Response: Corresponds to the scenario where no porewater pressures are able to dissipate
as loads are applied. The strength developed during an undrained response is referred to as Undrained
Shear Strength.
Drained Response: Corresponds to the scenario where most or all excess porewater pressure
dissipates as the loads were applied. The strength developed during a drained response is referred to
as Drained Shear Strength.
The selection of the appropriate shear strength (drained or undrained) depends on the development of excess
porewater pressure which depends on the permeability of the soil and on the rate of loading. For instance, the
fly ash could have a drained response when subjected to normal rates of dredge deposition (loading), but it
could have an undrained response if subjected to quick loading or to cyclic loading such as during an
earthquake.
Critical Void Ratio and Steady State Line
When a soil that is sheared exhibits a drained response, the soil particles tend to rearrange causing a change in
volume of the soil mass. In general, when sheared, tightly packed soil particles tend to separate from one
another (dilate); and loosely packed soil particles tend to get closer to one another (contract). The tendency to
dilate or contract depends on the particle arrangement and on the effective stresses. As described by
Casagrande (1936), when samples of a soil with different initial densities (or void ratio) but at the same initial
confining stresses are sheared, the change in volume during shearing will be such that all samples will reach a
unique final density (or void ratio) at large strains. The locus of points of these unique void ratios for different
initial confining pressures forms the Critical Void Ratio line. The Critical Void Ratio line was estimated for the
sluiced ash based on results of AECOM’s drained triaxial tests performed on ash and is shown in Figure
1.5.1_3.
If soil is not allowed to change in volume, such as during undrained loading, the tendency of the soil to contract
results in an increase of porewater pressure; and the tendency to dilate manifests in a decrease in porewater
pressures. An increase in porewater pressure causes a decrease in effective stress, and consequently, a
decrease in shear strength. A decrease in porewater pressure causes an increase in effective stresses, and
consequently, an increase in shear strength. For this reason, a soil with a tendency to dilate shows higher
shear strength when sheared undrained than when sheared drained. Conversely, a soil with a tendency to
contract shows higher shear strengths when sheared drained than when sheared undrained.

AECOM
K:\PROJECTS\60095742 - TVA\Final\FINAL Revisions\Volume 1\completed\FINAL-062509-Failure_Analysis_Report_VolI-rev.doc
43
Figure 1.5.1_4 shows the results of two undrained triaxial tests performed on fly ash during the AECOM
laboratory testing program, showing the typical contractive and dilative response with similar initial confining
pressure. The deviatoric stress shown in Figure 1.5.1_4 is a measurement of the shear strength. As shown by
the results, when two samples with the same initial state of stresses are sheared undrained, the dilative or
dense sample shows higher peak strength than the loose sample with a tendency to contract.
Figure 1.5.1_5 shows the results of drained and undrained triaxial tests performed on a loose or contractive
sample of fly ash. This figure shows that the excess porewater pressure developed during undrained shear
reduces the peak shear strength of the soil, when compared to the drained response. Even more significantly
the undrained response shows a substantial and rapid decrease in strength beyond the peak. Towards the end
of the undrained test, the strength of the ash is approaching a steady state (Poulos, 1981), i.e., a condition of
constant strength at constant pore pressure and also at constant volume, since the test is undrained and the
ash is saturated. The strength at steady state is referred to as undrained steady state strength (Sus) or
undrained residual strength (Seed, 1987). The value of Sus is a unique function of void ratio and defines the
Steady State Line (SSL), which is plotted in figure 1.5.1_3 from the results of the undrained tests on the ash.
The concept of critical void ratio and steady state are the same, i.e. constant resistance at constant volume,
whether reached by drained or undrained loading, and thus the critical void ratio and steady state lines should
be one and the same as has been found to be the case in several investigations, e.g., Castro et al, 1992. A
possible explanation of the different between the two lines obtained for the ash and shown in Figure 1.5.1_3 is
that the drained tests and the undrained tests were performed from the same batch of ash but the samples had
to be reused. Some grain breakage of the ash was noted when comparing the initial gradation with one obtained
after most tests had been performed. All drained tests were performed after the undrained tests, and thus the
drained tests represented ash with more grain breakage than the ash used in the undrained tests. In any case,
the main purpose of determination of the steady state line was to analyze the undrained behavior of the ash,
and thus the appropriate line to use is the one determined from the undrained tests, labeled as steady state line
in Figure 1.5.1_3.
Figure 1.5.1_3 depicts the range of initial effective stresses and void ratios anticipated in the field. In the case of
the sluiced ash, the range of stresses and void ratios in the field plot above the Steady State Line. Thus, it can
be concluded that the majority of the sluiced ash at the project site had a tendency to contract, and would
develop positive porewater pressure if sheared in an undrained fashion. Consequently, the undrained shear
strength of the fly ash in-situ is much lower than the drained strength.

AECOM
K:\PROJECTS\60095742 - TVA\Final\FINAL Revisions\Volume 1\completed\FINAL-062509-Failure_Analysis_Report_VolI-rev.doc
44
Residual or Steady State Undrained Shear Strength
Since at steady state conditions, the shear strength is nearly constant, the vertical and horizontal effective
stresses are also constant. At steady state, for most of the tests, a ratio of vertical to horizontal effective stress
of three (3) was measured. Since the undrained strength is computed as the difference between vertical to
horizontal stress divided by two, it can be shown that the undrained shear strength is equal to the horizontal
effective stress. Therefore, Figure 1.5.1_3 can also be utilized to estimate the undrained steady state strength
at various void ratios.
Figure 1.5.1_4 shows that there is a dramatic reduction from the peak undrained strength occurring at a very
small strain to the steady state strength. This reduction or strain softening during undrained loading in granular
materials is often referred to as Static Liquefaction. The word “static” is utilized to differentiate this phenomenon
from liquefaction observed during earthquake loading. This phenomenon was also referred by Terzaghi and
Peck (1967) as “Spontaneous Liquefaction.” However, this terminology may be misleading and confusing,
because, as recognized by Terzaghi, the shear stresses on the soils do not occur spontaneously and there is
always an event that triggers this increase in stresses.
Based on the steady state line shown in Figure 1.5.1_3 , an undrained steady-state strength of 100 psf is
estimated for the average void ratio measured in the field for the unfailed ash of 0.88, and thus this value was
utilized in AECOM’s analyzes for the sluiced ash.
Peak Undrained Strength
As mentioned, the actual shear strength is estimated as the tangent of the friction angle multiplied by the normal
effective stress. To estimate the normal effective stresses during undrained shear, the excess porewater
pressures need to be computed. Considering the difficulty of quantifying this excess porewater pressure during
shearing, an alternative procedure was utilized.
As described by Olson and Stark (2002), the peak undrained strength measured in the laboratory can be
normalized with the pre-shear confining pressure. This ratio, also called peak strength ratio, can be utilized to
estimate the peak undrained strength in-situ. The results of AECOM’s analyses show a range of peak strength
ratios shown on Figure 1.5.1_6.
A peak strength ratio of 0.3 for sluiced ash was utilized for AECOM’s analyses.
Drained Strength
Contractive soils develop similar friction angles during drained and undrained shearing, and the results from
these tests were used to estimate the drained friction angles for the analyses.

AECOM
K:\PROJECTS\60095742 - TVA\Final\FINAL Revisions\Volume 1\completed\FINAL-062509-Failure_Analysis_Report_VolI-rev.doc
45
On the other hand, dilative samples show higher friction angles during drained shearing than during undrained
shearing. This increase of friction angle measured during drained shearing is directly related to the actual
volume change. A lower friction angle is observed during undrained shearing because the dilation is
suppressed, since no volume change is allowed. At constant volume conditions, the friction angle developed
during undrained shearing of dilative materials is similar to the one observed for contractive samples.
Therefore, the results from undrained tests performed on dilative samples were also utilized to estimate the
drained friction angles for the contractive sluiced fly ash in AECOM’s analyses.
The table below lists the mobilized friction angles from both drained and undrained tests on contractive samples
and the mobilized friction angles in the undrained tests for the dilative samples. An average friction angle of 30
degrees for sluiced ash was selected for the analysis. It should be noted that several tests showed values
below 30 degrees. However, in most of these cases the peak friction angle could not be fully mobilized since
the tests had to be stopped before the peak was reached. This premature stopping of the test was caused by
inherent limitations of the triaxial equipment.
1.5.2 Dikes 1.5.2.1 Ash Dikes (Compacted Ash) Hydraulic Conductivity
Using AECOM CPTu dissipation test data, Kh was estimated at 1.4 E-05 cm/sec. Kv values were not measured
by this test method. A horizontal to vertical hydraulic conductivity ratio (Kh/Kv) of 2 was chosen for the seepage
analysis, which matches the value agreed to by Parsons E&C and GeoSyntec for their 2005 analyses.
Drained Strength
The ash used to build the dikes (mostly fly ash with some bottom ash, depending on the vintage of construction)
was compacted to a minimum of 95% of Standard Proctor maximum dry unit weight. The low void ratios of the
fly ash and the low confining stresses (near the surface) in these dikes plot below the Steady State line.
Therefore, strong dilation is anticipated during shearing. As discussed before, materials that have such a strong
tendency to dilate will develop very high undrained shear stresses; higher than the drained shear strength.
Therefore, these materials were accounted in AECOM’s models used for analysis as purely frictional materials
since one should not rely on negative pore pressures associated with dilation.
For the slope stability analysis of the west side of the dredge cells, AECOM adopted shear strength parameters
for Dike B from Parsons (2004) and TVA Drawing No. 10N400, Rev. 6 dated February 16, 1977 for the type and
physical properties of this fill. A unit weight of 114 psf, a friction angle of 37 degrees and a cohesion intercept of
0 psf were assigned. This fill was placed in the mid 1970’s as part of the vertical expansion of the ash pond to
prevent inundation of Swan Pond Road and the railroad tracks serving the plant. Much of this fill was disturbed
by the failure.

AECOM
K:\PROJECTS\60095742 - TVA\Final\FINAL Revisions\Volume 1\completed\FINAL-062509-Failure_Analysis_Report_VolI-rev.doc
46
1.5.2.2 Dike C Fill at Perimeter of Dredge Cell Hydraulic Conductivity
None of Dike C fill north of Dredge Cell 2 remained in its design position after the breach. For the remnant Dike
C material that remained, it was shoved up against the north hillside in pieces, was relatively inaccessible and
was disturbed by the failure event. As such, AECOM did not take undisturbed samples of this material. For the
seepage analysis, AECOM adopted a Kh value of 5.0E-06 cm/sec and a (Kh/Kv) ratio of 2 agreed to by Parsons
and GeoSyntec in their 2005 analysis.
Drained Strength
For reasons listed under hydraulic conductivity, we adopted the Singleton Laboratories shear strength
parameter for the SLOPE/W™ analysis. Singleton Laboratories (1975) used a unit weight of 120 pcf, a friction
angle of 15 degrees and cohesion intercept of 600 psf for the two original Dike C embankments. These adopted
shear strength values are not critical to the analysis as the ash and water pressures against the compacted
dikes are resisted by ash, slimes and the foundation clay under Dike C that control pre-failure and post failure
stability conditions. Based on failure relics examined, the failure plane went through native clay soils under and
not through Dike C fills.
1.5.2.3 Railroad Embankment Hydraulic Conductivity
AECOM did not take samples of ballast and the reported clay shale fill under the railroad embankment. For the
seepage analysis purposes, similar to the clay dike material, a Kh value of 5.0E-06 cm/sec and a (Kh/Kv) ratio of
2 were used for this material.
Drained Strength
AECOM assumed shear strength parameters from geotechnical judgment for this well-compacted fill material on
the extreme west side of the dredge cells, since it was an early feature for the project and no prior testing was
reported in this area. AECOM assigned a unit weight of 120 pcf, a friction angle of 37 degrees and a cohesion
intercept of 0 psf. These parameters were input into the slope stability model as a boundary condition,
excluding the ballast, ties and steel rails. The west perimeter of the dredge cell failure slide covered most of the
rails and ballast, which had to be replaced.
1.5.3 Alluvial Clays, Silts, and Silty Sands Hydraulic Conductivity
For the silt and clay alluvium, CPTu dissipation tests yielded a Kh of 1.5E-06 cm/sec, and laboratory
consolidation tests were used to compute a Kv of 1.9E-06, which results in a (Kh/Kv) ration of 0.8 (a value of 1
was used in the seepage analysis).

AECOM
K:\PROJECTS\60095742 - TVA\Final\FINAL Revisions\Volume 1\completed\FINAL-062509-Failure_Analysis_Report_VolI-rev.doc
47
For the deeper silty sand and silt alluvium, using CPTu dissipation test data, Kh was estimated at 9.1 E-06
cm/sec. Kv values were not measured. A (Kh/Kv) ratio of 2 was chosen for the seepage analysis.
Undrained Shear Strength – Silty Clay Alluvium
The alluvium at the project site is composed by a series of layers of generally cohesive materials, such as silty
clay and clayey silts, and deeper generally non-cohesive, granular alluvium, mostly silty sands and silts.
The undrained shear strength of the cohesive layers of the alluvium was measured in a series of undrained
triaxial compression tests and in situ vane shear tests. The undrained shear strength was also measured
indirectly using cone penetration tests, although the cone tip resistance is used to estimate rather than measure
directly, the undrained shear strength.
The results of the vane shear test were used to develop correlations for the piezocone tip resistance. The tip
resistance is typically correlated to the undrained shear strength by a linear function. This linear function
calibrating coefficient, Nkt is defined as the ratio between the CPTu tip resistance, qt, minus the vertical total
stress, σv0, and the known undrained shear strength; for this site the undrained strength measured in the vane
shear tests.
This calibration or correlation was performed using the computer program Rockworks™. A three-dimensional
interpolation of the tip resistance minus the total vertical stress was performed. After this interpolation, the
nodes (in the interpolation grid) closest to each of the vane shear tests were selected. The values (qt-σv0),
stored in each of these selected nodes were utilized to estimate Nkt. A plot depicting qt-σv0 versus the undrained
shear strength for two different soil groups were used to estimate Nkt is shown in Figure 1.5.3_1 showing an Nkt
of 4 for the unusual sensitive silts and Figure 1.5.3_2 showing an Nkt of 11 which is typical clayey soils. The
estimated value of Nkt was used to estimate the undrained strength at all locations where vane shear tests were
not performed.
Figures 1.5.3_3 through 1.5.3_5 show the estimated undrained shear strength for the upper silty clay alluvium
only using an Nkt of 11 for the three stability sections located at Cell 2 NW, Cell 2 Southwest, and Phase 1
Emergency Dredge Cell, respectively. Figures 1.5.3_6 through 1.5.3_9 show that the undrained shear strength
in the alluvium that had a tip to sleeve resistance ratio typical of a clayey soil at the 100-, 200-, 400-, and
600-series boring alignments, respectively. Since no soil samples were obtained in the CPTu, the type of soil
was estimated based on the relationship between the tip resistance and sleeve friction. As reported by
(Roberston, 1990), the different soils have characteristic relations between the tip and sleeve resistance.
Therefore, this relation can be utilized to estimate the soil type, in absence of direct observations.

AECOM
K:\PROJECTS\60095742 - TVA\Final\FINAL Revisions\Volume 1\completed\FINAL-062509-Failure_Analysis_Report_VolI-rev.doc
48
Based on the cone and vane shear data, a lower estimated undrained shear strength of 1,200 psf for the silty
clay was selected for analysis under the three active dredge cells. This shear strength was confirmed on a
CKU-DSS test on an Osterberg tube sample foundation clay at Boring 09-301B that had a measured Sus of
1,190 psf with an overconsolidation ratio of 1.1.
Drained Shear Strength – Silty Sand and Silt Alluvium
AECOM performed one drained direct shear test on a sample of native silt from boring 09-402B, sample S-9 at
El. 713 feet. A drained friction angle of 36.1 degrees with zero intercept was determined using the direct shear
test.
AECOM adopted Parsons (2004) shear strength parameters for this very loose to dense material under the
alluvial silty clays. AECOM used Parson’s (2004) analysis parameters to model the shear strength of the silty
alluvium. Parson’s recommended using a unit weight of 130 pounds per cubic feet (pcf), a friction angle of 30
degrees and cohesion intercept of 600 pounds per square foot (psf) for this natural soil. AECOM measured a
friction angle of 36 degrees and zero cohesion in this silt. There was no physical evidence that this material
contributed to the failure of the Dredge Cells so either strength parameter can be used.
1.5.4 Slimes and Young Interface Clay Hydraulic Conductivity
From a CPTu dissipation test in Boring 09-104-C1 at 24 feet, the horizontal hydraulic conductivity (Kh) of the
slimes is estimated at 2.4 E-07 cm/second. This layer was of limited thickness such that the recovered samples
of this material were used for CRS/DSS testing and thus, a vertical hydraulic conductivity on a tube specimen
was not completed. Kh/Kv was chosen as 2 for this material.
Undrained Shear Strength
The peak undrained shear strength for the slimes and young clay was selected based on the results of the
consolidated-undrained, at-rest, direct simple shear tests (CKU-DSS) performed at University of Massachusetts,
and in situ vane shear tests performed by AECOM. The results of the CKU-DSS tests produced a range of
undrained shear strengths (600 to 1,250 psf). The measured strengths were directly proportional to the
prefailure ground surface elevation at the test locations. In the slimes, nine CKU-DSS tests and five field vane
shear tests were completed on samples collected under Dredge Cell 2. There were also vane shear tests in the
young soft clay under Dike C.
The orange-brown slimes had thicknesses of 0.5 to 6 inches. The slimes layers are laminated with orange-
brown, black and gray layers ranging from 1 to 5 millimeters thick, and were found typically at the bottom of the
sluiced ash, on or just above the contact with the native soils. Some slimes layers were found as separate
zones, with gray sluiced ash in-between. Tube photographs of the slimes and contact zones are included in
Volume III, Appendix 3G.

AECOM
K:\PROJECTS\60095742 - TVA\Final\FINAL Revisions\Volume 1\completed\FINAL-062509-Failure_Analysis_Report_VolI-rev.doc
49
At each test location, the data indicates that the preconsolidation pressure and strength gain in these interface
materials is related to the past pressure applied by the dredge cell structures. It is considered unlikely that this
layer was subjected to the cycles of desiccation as it was likely deposited below El. 735 feet, starting in 1954. It
is evident from vane shear, consolidation tests and triaxial tests that preconsolidation by desiccation caused
strengthening of the underlying silty clay alluvium. For this reason, since the pressure applied by the dredge
cells and ash at each test location is related to the prefailure ground surface elevation, the observed relationship
between elevation and strength should not be considered coincidental, but expected.
A typical approach to estimate strength parameters for analysis or design involves estimating the maximum pre-
existing effective stresses to determine the relationship between the maximum past pressure and the undrained
shear strength of fine-grained soils, and extrapolating this relation to estimate undrained shear strength
parameters in regions where tests were not performed. However, assumptions need to be made when
computing the effective stresses in areas with non-horizontal and time dependent groundwater tables and
ground surfaces. To avoid the effects of these assumptions in the analysis, the measured undrained strengths
were interpolated, using the pre-failure ground surface elevation as a general guideline to determine regions
with similar values. We combined undrained shear strength parameters from direct simple shear testing even if
not from the same cross sections next to the Swan Pond Road, railroad and hillside to develop a strength
model, (e.g., 09-101B and 09-408B).
Figure 1.5.4_1 and 1.5.4_2, shows the available data on this layer, the interpolation criteria and the actual
parameters utilized for the slope stability analysis. Plastic materials tend to develop undrained shear strength
when loaded rapidly. For this reason, the slime and young clay layers were analyzed using undrained
parameters.
The average undrained strengths in the slimes input into the slope stability analysis ranged from 700 to 1,500
psf. The lower bound estimate for the undrained strengths is 600 to 1,400 psf. An average moist unit weight of
90 pcf was measured for the slimes. The results of the slimes testing are included in Appendix 3G.
One vane shear measured undrained shear strength of 250 psf (by vane shear) was measured on a sample of
isolated young clay under the former location of Dike C (Boring 09-205A). A summary of vane shear tests at the
toe of former Dike C for the North Cell 2 analysis is included in Volume II, Section 2.1.4 and Appendix 2G.
Creep Leading to Failure in Slimes
In addition to standard DSS tests discussed above, one DSS creep test was performed at the University of
Massachusetts. This test is of particular importance as it explains the concept behind what is considered to be
the primary mode of failure under Cell 2.

AECOM
K:\PROJECTS\60095742 - TVA\Final\FINAL Revisions\Volume 1\completed\FINAL-062509-Failure_Analysis_Report_VolI-rev.doc
50
During the creep test, a stress-controlled DSS test was performed on an undisturbed slime sample from
AECOM Boring 09-101B. The sample was first loaded to 80% of the peak undrained shear strength (as
measured on the sample directly below the creep test sample). During this first increment of load, a very stiff
response was observed, with a small strain of approximately 1.8% recorded. Upon reaching this 80% stress
level the load was held for 4,000 minutes (66 hours), developing a horizontal shear strain of approximately 4.5%
under that constant load. The load was then increased to 85% of the peak undrained shear strength. After the
second load increment, a second creep cycle at constant load was commenced. Large, accelerated strains
leading to failure were observed after approximately 7,000 minutes (116 hours from the beginning of the creep
test). The test was stopped after 17% shear strain.
From this and in general from all the CKU-DSS performed on the slimes, it can be concluded that this material
responds as if it has some sort of secondary structure or an initial brittle bonding between particles; developing
very small strains to a high stress level. After a certain stress level is reached, it appears that there is sudden
loss in stiffness, leading to sudden and large creep deformations. This is supported by a recent scanning
electron micrograph of a slimes sample from Boring 09-503B at 37.5 to 38.0 feet which shows a significant
number of spherical ash particles.
From the creep tests, it can be concluded that failure (i.e., large deformations) can occur when the slimes are
sheared at stresses of 80% to 85% of the peak strengths. Therefore, it should be realized that material failure
can and will likely occur if loading is sustained at stresses lower than the peak strength in Figure 1.5.4_3.

AECOM
K:\PROJECTS\60095742 - TVA\Final\FINAL Revisions\Volume 1\completed\FINAL-062509-Failure_Analysis_Report_VolI-rev.doc
51
1.6 Seepage and Stability Analyses 1.6.1 Selection of Seepage and Stability Analysis Sections Seepage and slope stability analyses were completed on three representative cross-sections: one north-south
section through the northwest part of Dredge Cell 2 where the initial failure occurred, one east-west cross-
section on the west side of Dredge Cell 2 where surface instability was observed in 2003 and 2006; and one
east-west cross-section on the east side of the Phase 1 Emergency Dredge Cell where failure did not occur in
2008, but was rapidly loaded from 2004 through 2006.
The objective of the seepage analysis was to estimate the position of the pre-failure phreatic surface at each
cross-section, for use in the slope stability analysis. The objective of the slope stability analysis was to evaluate
global stability of each cross-section using a combination of hand calculations using traditional wedge and
infinite slope methods and more rigorous computer modeling method to locate the critical failure surface
locations and compare both methods with actual dredge cell slope behavior.
The as-recorded geometry and geological profile of three cross-sections were prepared from 2008 pre-failure
topography provided by TVA, as shown in Appendix 4. The section topography was combined with the as-built
geological profiles prepared from AECOM field exploration data, TVA as-built records and prior studies by
others, and are shown in the corresponding cross-section drawings.
The seepage and slope stability analyses were performed using SEEP/W™ 2007 (Version 7.13), and
SLOPE/W™ 2007 (Version 7.13), finite element flow and slope stability software developed by GEO-SLOPE
International Ltd. SEEP/W is able to model steady-state flow, unsaturated flow conditions and multiple
boundary conditions (i.e., total head, seepage face, specified boundary flows, sources and sinks, etc.).
SLOPE/W™ is able to compute the global factor of safety by multiple traditional methods, for various slope
geometries, stratigraphy, soil strength, porewater pressure and imposed loading, using a force and moment limit
equilibrium approach. Infinite slope and wedge block are force equilibrium methods.
1.6.2 Seepage Analysis 1.6.2.1 Calibration to Historic Data Hydraulic Conductivity
Prior to running a seepage model for the RCA, a review of hydraulic conductivity data from historical seepage /
groundwater studies was completed using TVA archival reports. Those prior works covered the period from
1980 through 2005 and are summarized in Volume IV, Table 4.2.1_T1.

AECOM
K:\PROJECTS\60095742 - TVA\Final\FINAL Revisions\Volume 1\completed\FINAL-062509-Failure_Analysis_Report_VolI-rev.doc
52
The results of the prior studies indicate average horizontal hydraulic conductivities (Kh) of the fly ash, bottom ash
and alluvial foundation materials generally of the order of magnitude of 1E-05 cm/sec, 1E-04 cm/sec, and 1E-04
to 1E-06 cm/sec, respectively. Specific values of vertical hydraulic conductivity (Kv) were not generally
measured, except in certain laboratory tests. The ratio of Kh/Kv was agreed to in 2005 seepage studies by
Parsons E&C and GeoSyntec to be about two (2) for each of the primary strata in the storage area (fly ash,
bottom ash and alluvial soils).
Groundwater Levels
Historical dredge cell groundwater levels as measured by monitoring wells are summarized in Volume IV, Table
4.2.1_T2. With the exception of the Mactec data from February 2005, most of the groundwater data is from
monitoring wells on the periphery of the dredge cells, which limits its use in the seepage modeling to establish
boundary conditions.
Regarding the short piezometers and well points installed along the west toe of the impoundment, most of the
data from these devices for their period of operation (January 2007 through December 2008) were observational
(visual note of seepage or wet condition) versus quantitative (measured water depth). Where measurements
were recorded in January 2007, the results indicated water levels of a few inches to one or two feet above or
below the ground surface.
1.6.2.2 Summary of Cross Sections Seepage analyses were completed on three (3) representative cross-sections: one north-south section through
the northwest part of Dredge Cell 2 where the initial failure occurred, one east-west cross-section on the west
side of Dredge Cell 3 where surface instability was observed in 2003 and 2006; and one east-west cross-section
on the east side of the Phase 1 Emergency Cell where failure did not occur in 2008. The objective of the
seepage analysis was to determine the position of the pre-failure phreatic surface at each cross-section, for use
in the slope stability models discussed in Section 1.6.2. The hydraulic conductivity parameters used in the
seepage analysis models are listed in Table 1.6.2_T1.
1.6.2.3 Dredge Cell No. 2 Northwest - Analysis The pre-failure topographic information indicated that the dike top elevation was El. 819 feet at the ash pond
(inboard) side and El. 820 feet at the downstream side. The water level in the ash pond was at El. 815.5 feet,
the same as the top elevation of the sluiced ash. The reservoir water level at the toe of Dike C was modelled at
El. 737.0 feet based on river records. The sluiced ash was assumed to extend down to the 1940 survey level
El. 732 feet. A thin layer (assumed as 4-feet thick for numerical simplification) of laminated sensitive slimes was
assumed below the sluiced ash. A potential seepage face boundary condition was assigned along the
downstream face of the upstream dikes and the perimeter Dike C. Internal drains were installed in the
upstream-constructed dikes and were modelled in the analysis.

AECOM
K:\PROJECTS\60095742 - TVA\Final\FINAL Revisions\Volume 1\completed\FINAL-062509-Failure_Analysis_Report_VolI-rev.doc
53
The seepage model results indicate that the perimeter drain at the inboard heel of upstream Dike B is
submerged, and that there is predicted seepage outbreak at the toe or the first upstream Dike A (confirmed by
the presence of former cattails growing at that location). This wetness is included in the seepage and stability
model for this section.
1.6.2.4 Dredge Cell No. 2 Southwest - Analysis The dike top elevation was understood to be El. 819 feet at the ash pond side and El. 820 feet at the
downstream side. The ash pond water level was modelled at El. 816 feet, the same as the top elevation of the
sluiced ash. The Dike B was built at the toe of the upstream dikes, with bottom ash per TVA Drawing
No. 10N400 R6 dated 8/8/1951, to El. 765 feet. A clay fill embankment for Swan Pond Road and railroad
embankment (clay shale fill) were modeled on the downstream side of the Dike B. A thin layer of laminated
sensitive slimes was modeled at approximate El. 732 feet to match 1940 survey levels. Below the slimes layer,
an approximately 10-foot thick layer of silt and clay alluvium was modelled and in turn underlain by the silty sand
and silt alluvium. Internal drains installed in the upstream-constructed dikes were modelled in the analysis.
The seepage model results indicate that the perimeter drains at the inboard toe of upstream Dikes A and B are
submerged, and that seepage outbreak is predicted near the toe of Dike B1 (current location of Swan Pond
Road), a result confirmed by the 2003 and 2006 shallow instability occurrences along the west toe of Dredge
Cell 2 and wetness noted at Well Point WP02 on December 21, 2008. This wetness is included in the seepage
and stability model for this section.
1.6.2.5 Phase I Emergency Dredge Cell East - Analysis The Phase 1 Emergency Dredge Cell was modeled with a dike top elevation at El. 809 feet on the ash pond
side and El. 810 feet at the downstream side. The water level in the ash pond was understood to be El. 807
feet. A total of three dikes were built by the upstream construction method. The water level at the tail pond (in
this case the ash collection pond) was assumed at El. 760 feet (based on operations records). The bottom of
the sluiced ash was assumed at El. 725 to 730 feet. Laminated sensitive slimes were not encountered along
this particular cross section and other locations on the east side of the Phase 1 Emergency Dredge Cell;
therefore, this layer was not modelled in the analysis. The sluiced ash was underlain directly by the clay and silt
alluvium to El. 715 feet, which was in turn underlain by silty sand and silt alluvium. The hydraulic conductivity
properties of the strata are shown in Volume IV, Table 4.2-T1. Internal drains were installed in the three
upstream-constructed dikes and were modelled in the analysis.
The seepage model results indicate that the inboard perimeter drain near El. 780 feet is submerged, and that
the east toe of this slope leading to the ash pond (controlled at El. 760) is saturated.

AECOM
K:\PROJECTS\60095742 - TVA\Final\FINAL Revisions\Volume 1\completed\FINAL-062509-Failure_Analysis_Report_VolI-rev.doc
54
1.6.3 Stability Analysis 1.6.3.1 Stability Model
Slope stability analyses were performed using the commercial computer program SLOPE/W™ 2007 (Version
7.13). SLOPE/W™ provides numerical tools to analyze the stability of embankments using limit equilibrium
methods. Different numerical methods can be utilized to solve for stability. Among the available methods, the
Morgenstern-Price Method is considered to be the most mathematically rigorous, since it satisfies both force
and moment equilibrium; thus, it was adopted for analysis. The solution of the Morgenstern-Price Method
involves the assumption of an interslice force function. The half-sine was selected. Additionally, the
optimization function, provided by SLOPE/W™ was also selected. The optimization function is a numerical
routine that automatically searches for the minimum FS. The geometry of the sections used in AECOM’s
analysis were based on AECOM’s estimate of the conditions on December 22, 2008, when the failure was about
to occur. These sections were built based on multiple sources of information, such as survey data, design
drawings, photographs, etc.
In addition to the limit equilibrium slope stability analyses, a hand calculation using wedge block stability
methods were performed. This method has been described by Taylor (1948), Sowers (1979), and Terzaghi,
Peck and Mesri (1996), and it compliments the analysis performed with SLOPE/W™.
1.6.3.2 Stability Model Parameters The shear strength parameters are chosen based on the field and laboratory tests AECOM performed for the
study. Discussion of the criteria used for the selection these parameters are presented in Section 1.5.
The Table 1.6.3_T1 summarize the strength parameters used for analysis and described in Section 1.5.:
Table 1.6.3_T1 Summary of Stability Model Parameters Sluiced Ash Unit Weight: 107 pcf below groundwater table (gwt); 102 pcf above groundwater table
Analysis Type Units Value Drained Friction Angle, φ’ degrees 30 Undrained (Peak) Strength ratio, su/σ’vo None 0.3 Undrained (Residual) Undrained Strength, sus psf 100
Compacted Bottom Ash (Dikes) Unit Weight: 120 pcf
Analysis Type Units Value Cohesion Intercept, c’ psf 0 Drained Friction Angle, φ' degree 37

AECOM
K:\PROJECTS\60095742 - TVA\Final\FINAL Revisions\Volume 1\completed\FINAL-062509-Failure_Analysis_Report_VolI-rev.doc
55
Slimes Unit Weight: 90 pcf
Analysis Type Units Value Undrained Undrained Strength, su psf 600~1,500
(see figures 1.5.4_1 [Northwest Cell C2]
and 1.5.4_2 [Southwest Cell C2])
Young Clay Deposit (Dike C) Unit Weight: 110 pcf
Analysis Type Units Value Undrained Undrained Strength, su psf 250 to 600
(from Boring 09-205A)
Alluvium (Cohesive Soils) Unit Weight: 110 pcf
Analysis Type Units Value Undrained Undrained Strength, su psf 1,200
Alluvium (Silty Sands and Silts) Unit Weight: 120 pcf
Analysis Type Units Value Cohesion Intercept, c’ psf 600 AECOM Adopted
Parsons (2004) Shear Strength Parameters
Friction Angle, φ' degree 30
Railroad Fill Unit Weight: 114 pcf
Analysis Type Units Value Cohesion Intercept, c’ psf 0 Drained Friction Angle, φ' degree 37
Road Fill (Dike B) Unit Weight: 120 pcf
Analysis Type Units Value Cohesion Intercept, c’ psf 600 AECOM Adopted
Parsons (2004) Shear Strength Parameters
Friction Angle, φ' degree 15

AECOM
K:\PROJECTS\60095742 - TVA\Final\FINAL Revisions\Volume 1\completed\FINAL-062509-Failure_Analysis_Report_VolI-rev.doc
56
Compacted Clay Fill Unit Weight: 120 pcf
Analysis Type Units Value Cohesion Intercept, c’ psf 600 AECOM Adopted
Parsons (2004) Shear Strength Parameters
Friction Angle, φ' degree 15
1.6.3.3 Infinite Slope Analysis Infinite slope analyses were performed for dry slope conditions, seepage parallel to the slope and seepage
emerging from the slope performed. AECOM references the U.S. Army Corps of Engineers Manual
EM1110-2-1902, Figure E-7, to review the following cases TVA’s design slope of 3H:1V for upstream ash dike
construction.
1.6.3.3.1 Dry Slope For a dry slope, the infinite slope FS equation is:
FS = tan φ / tan β
where φ is the measured drained angle of internal friction of the compacted slope material, and β is the angle of
the slope, measured from the horizontal. For the upstream dike construction slopes at the dredge cell φ’ = 30
degrees and β = 18.4 degrees (for a 3H:1V slope), the resulting factor of safety for a dry ash dike is 2.3. These
results are presented in Volume IV.
1.6.3.3.2 Seepage Parallel to Slope For an assumed shallow slide depth of 3 feet, and seepage moving parallel to but below the slope surface at a
depth of 2 feet (both measured perpendicular to the slope surface), the factor of safety (for a material with no
cohesion) is:
FS = A (tanφ / tan β)
AECOM adopted an ‘A’ factor of 0.6. It is related to the pore water pressure ratio and is less than 1.0 for all but a
dry slope, resulting in a FS of 1.4.
When this case is run with seepage parallel to the slope and effectively at the surface, the FS reduces to
approximately 1.0, indicating that shallow sloughing is likely. These results are presented in Volume IV.

AECOM
K:\PROJECTS\60095742 - TVA\Final\FINAL Revisions\Volume 1\completed\FINAL-062509-Failure_Analysis_Report_VolI-rev.doc
57
1.6.3.3.3 Seepage Emerging from the Slope For the 3H:1V slope (18.4 degrees from horizontal), and seepage exiting at an assumed angle of 10 degrees
(from the horizontal), an A value of 0.38 is computed by a different equation but is effectively lower than for the
parallel seepage case above, resulting in a FS of about 0.9, indicating that shallow sloughing is also likely. This
calculation is indicative of the conditions that existed at the time of the shallow slide on the west side of Dredge
Cell 2 in November 2003 and November 2006. These results are presented in Volume IV.
1.6.3.4 Dredge Cell No. 2 Northwest – Analysis The failure at the northwest corner of Dredge Cell No. 2 on December 22, 2008 was evaluated in four stages as
the failure occurred in a progressive manner as discussed in Section 1.5 of this report. These stages include:
1. Stage 1 - Evaluates the initial pre-failure conditions at the upstream dike area of the northwest dike
section. The sluiced ash is in a drained strength state and slimes are in an undrained strength state
and are in the initial stages of yielding (creep) but with no reduction assumed due to creep.
2. Stage 2 - Analyzes conditions after the sluiced ash goes to an undrained strength condition and the
slimes continue to yield but with no reduction due to creep.
3. Stage 3 - Evaluates the stability of Dike C, before and after the upstream dikes have failed and the
sluiced ash has liquefied and stacks up against Dike C.
4. Stage 4 - After the failure of Dike C, the stability of the remaining dredge cell south of the upstream
dikes is evaluated for an inward (southward) progressive failure.
For Stages 1 and 2, two cases for the undrained strength of the slimes were modeled as discussed in Section
1.6.2.2. Limit Equilibrium Method Analyses were used for Stages 1 though 4 for this section and simplified
sliding block analysis was conducted for Stage 2 and are discussed in Sections 1.6.3.4.1 and 1.6.3.4.2,
respectfully.
In the slope stability model for the Dredge Cell No. 2 northwest section, the dike top elevation was understood to
be El. 819 feet at the ash pond side and El. 820 feet at the downstream side. The geometry for the stability
analysis was from TVA surveys of this section. Water and sluiced ash level in the ash pond was at El. 815.5
feet. The first two dikes in Dike C embankment were built with compacted clay fill, and above that, the dikes
were built with ash by upstream construction method. The Tail Water level downstream of Dike C was assumed
at El. 737 feet. Sluiced ash was modelled at elevations varying from El. 815.5 to 732 feet.

AECOM
K:\PROJECTS\60095742 - TVA\Final\FINAL Revisions\Volume 1\completed\FINAL-062509-Failure_Analysis_Report_VolI-rev.doc
58
An assumed 4-foot thick layer of laminated sensitive slimes was modelled below the sluiced ash. As discussed
in other Sections, AECOM determined that the thin layer of the laminated sensitive slimes will likely control the
stability analysis results. AECOM’s soil borings, field and laboratory tests indicate that this layer is only up to
approximately 6 inch thick in reality. However, in the stability analyses, AECOM modeled this thin layer having
a thickness of 4-foot to facilitate practical analyses without numerical instability. AECOM adopted failure
surfaces that used wedge block shapes to model possible slide planes through the weak slime layer. It is
AECOM’s opinion that the 4-foot thickness of the weak slimes layer would not change the computed FS. Below
the slimes, AECOM modeled a 10-foot thick layer of clays and clayey silt alluvium over the silty sand and silt
alluvium. The soil properties input into the models are shown in Subsection 1.6.2.2. The pore water pressure
piezometric surface was imported from the seepage analysis for the same cross-section discussed in Seepage
Section 1.6.
1.6.3.5 Limit Equilibrium Method Analysis by SLOPE/W The stability of Dredge Cell No. 2 northwest section (Stages 1 though 4) was evaluated using the SLOPE/W™
limit equilibrium methods:
1.6.3.5.1 Stage 1 – Pre-Failure of the Upstream Dike Area This stage evaluates the initial pre-failure conditions at the upstream dike area of the northwest dike section.
The sluiced ash is in a drained strength state for this stage analysis. Average (Case 1) and lower bound
(Case 2) undrained shear strength parameters of the slimes were evaluated as the slimes were in the initial
stages of yielding (creep) at low computed safety factors.
AECOM used SLOPE/W to locate critical sliding surfaces that generally show an active block originating from
the top of Upstream Dike D2 at El. 820 feet progressing downward to the slime layer, running along the weak
slime layer for the central block over clay, and then sliding upward through the passive block day lighting just
beyond the toe of Upstream Dike A in the 200-foot set back area. In addition, a circular failure surface of the
lower factor of safety wedge analysis was also performed for comparison even though one would expect that a
circular surface would be less critical than the wedge since it cannot follow as much of the weak slimes layer.
The stability results are included in Table 1.6.3_T2.
Table 1.6.3_T2 Stage 1 Results of Stability Analyses – Cell 2 Northwest
Runs Figure Number Analysis Conditions FS
Case 1 1.6.3_1 Wedge Shear strength of slimes in Case 1 1.3 (1.32)
Case 2 1.6.3_2 Wedge Shear strength of slimes in Case 2 1.2 (1.24)
Stage 1 (Drained ash
model φ = 30°) Case 2 1.6.3_3 Circular Shear strength of slimes in Case 2 1.6
(1.60)
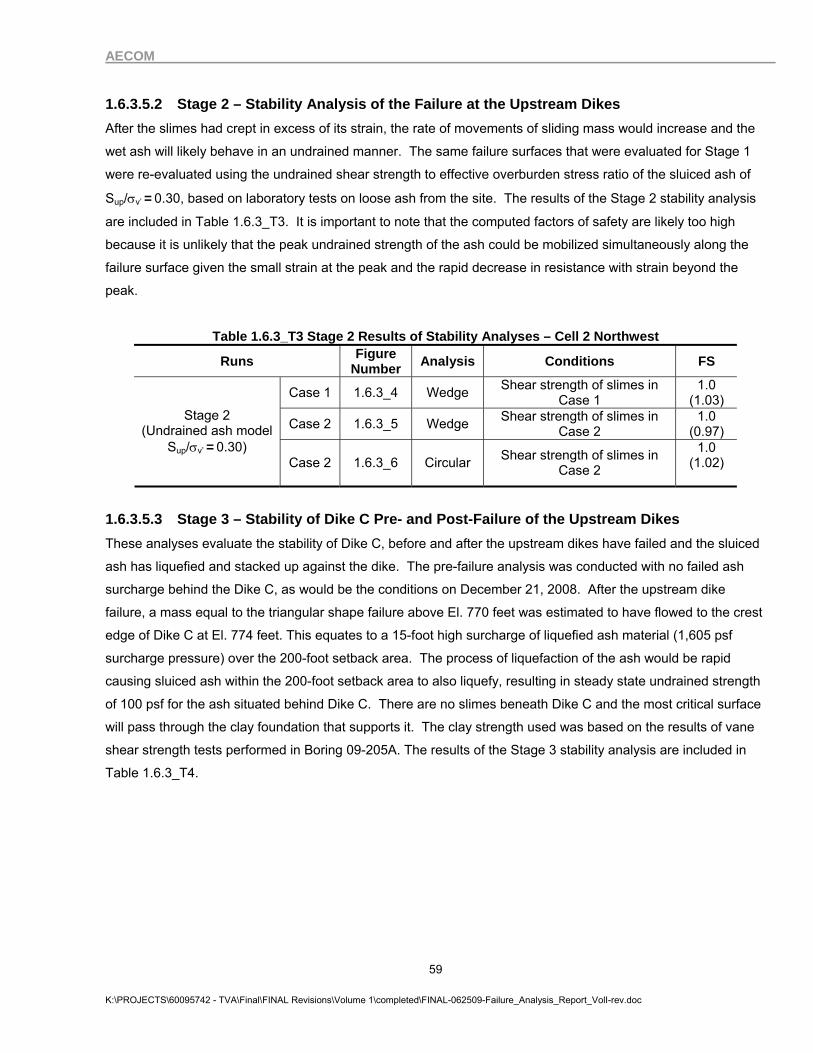
AECOM
K:\PROJECTS\60095742 - TVA\Final\FINAL Revisions\Volume 1\completed\FINAL-062509-Failure_Analysis_Report_VolI-rev.doc
59
1.6.3.5.2 Stage 2 – Stability Analysis of the Failure at the Upstream Dikes After the slimes had crept in excess of its strain, the rate of movements of sliding mass would increase and the
wet ash will likely behave in an undrained manner. The same failure surfaces that were evaluated for Stage 1
were re-evaluated using the undrained shear strength to effective overburden stress ratio of the sluiced ash of
Sup/σv’ = 0.30, based on laboratory tests on loose ash from the site. The results of the Stage 2 stability analysis
are included in Table 1.6.3_T3. It is important to note that the computed factors of safety are likely too high
because it is unlikely that the peak undrained strength of the ash could be mobilized simultaneously along the
failure surface given the small strain at the peak and the rapid decrease in resistance with strain beyond the
peak.
Table 1.6.3_T3 Stage 2 Results of Stability Analyses – Cell 2 Northwest
Runs Figure Number Analysis Conditions FS
Case 1 1.6.3_4 Wedge Shear strength of slimes in Case 1
1.0 (1.03)
Case 2 1.6.3_5 Wedge Shear strength of slimes in Case 2
1.0 (0.97)
Stage 2 (Undrained ash model
Sup/σv’ = 0.30) Case 2 1.6.3_6 Circular Shear strength of slimes in
Case 2
1.0 (1.02)
1.6.3.5.3 Stage 3 – Stability of Dike C Pre- and Post-Failure of the Upstream Dikes These analyses evaluate the stability of Dike C, before and after the upstream dikes have failed and the sluiced
ash has liquefied and stacked up against the dike. The pre-failure analysis was conducted with no failed ash
surcharge behind the Dike C, as would be the conditions on December 21, 2008. After the upstream dike
failure, a mass equal to the triangular shape failure above El. 770 feet was estimated to have flowed to the crest
edge of Dike C at El. 774 feet. This equates to a 15-foot high surcharge of liquefied ash material (1,605 psf
surcharge pressure) over the 200-foot setback area. The process of liquefaction of the ash would be rapid
causing sluiced ash within the 200-foot setback area to also liquefy, resulting in steady state undrained strength
of 100 psf for the ash situated behind Dike C. There are no slimes beneath Dike C and the most critical surface
will pass through the clay foundation that supports it. The clay strength used was based on the results of vane
shear strength tests performed in Boring 09-205A. The results of the Stage 3 stability analysis are included in
Table 1.6.3_T4.

AECOM
K:\PROJECTS\60095742 - TVA\Final\FINAL Revisions\Volume 1\completed\FINAL-062509-Failure_Analysis_Report_VolI-rev.doc
60
Table 1.6.3_T4 Stage 3 Results of Stability Analyses – Cell 2 Northwest
Runs Figure Number Analysis Conditions FS
Stage 3 Pre-Failure 1.6.3_7 Wedge No Failed Ash Surcharge 1.7 (1.72)
Stage 3 Pre-Failure 1.6.3_8 Circle No Failed Ash Surcharge 1.5 (1.50)
Stage 3 Post-Failure 1.6.3_9 Wedge Surcharge = 1,605 psf;
shear strength of liquefied ash Sus=100 psf
0.7 (0.68)
1.6.3.5.4 Stage 4 – Stability of an Upstream Dredge Cell Progressive Failure After the upstream dikes failure and the breach of Dike C, the ash fill or head wall will likely fail progressively
moving from north to south. AECOM evaluated the stability of this head wall using SLOPE/W™. AECOM used
the peak undrained strength of the wet ash uphill of the head cut, and liquefied ash strength downstream of the
face to compute instability shown in Table 1.6.3_T5.
Table 1.6.3_T5 Stage 4 Results of Stability Analyses – Cell 2 Northwest
Runs Figure Number Conditions FS
Stage 4 1.6.3_10 Undrained shear strength of sluiced ash Sup/σv’ = 0.30
0.7 (0.66)
1.6.3.5.5 Dredge Cell No. 2 Southwest The geometry for the stability analysis was obtained from TVA surveys of this section. The dike crest elevation
of the Dredge Cell No. 2 southwest section was understood to be El. 819 feet at the ash pond side and El. 820
feet at the downstream side. The ash pond water level was modelled at El. 816 feet, the same as the top
elevation of the sluiced ash. Dike B1 was built with road fill over previous Swan Pond Road to El. 765 feet. The
railroad embankment was modeled at the downstream side of Dike B1. Above Dike B1, the dikes were built
with compacted ash by the upstream construction method.
In the models, the sluiced ash is assumed to be present down to El. 730 feet, the 1940 survey level. Since
AECOM found slimes in Borings 09-408B and 09-503B using the Osterberg sampler, a 4-foot thick layer of
laminated slimes below the sluiced ash was adopted for the analysis cross-section as a conservative way to
facilitate multiple failure plane search analyses on a layer that is less than 6 inches thick. Below the silt layer,
an approximately 10-foot thick layer of clays and silts alluvium was modelled and underlain by the sands and
gravels alluvium. The soil properties are shown in Table 1.6.3_T1. The pore water pressure piezometric
surface was imported from the seepage analysis for the same cross-section as discussed in Section 1.6.2.

AECOM
K:\PROJECTS\60095742 - TVA\Final\FINAL Revisions\Volume 1\completed\FINAL-062509-Failure_Analysis_Report_VolI-rev.doc
61
Two cases on this cross-section were analyzed: Case 1 for the sluiced ash having drained shear strength with
an effective friction angle of 30° and no cohesion and Case 2 for the sluiced ash having undrained shear
strength versus effective overburden stress ratio of Sup/σv’ = 0.30. In Case 1, the potential slip surface runs
through the laminated sensitive silts, touches the bottom of clay alluvium, and drives out through the Dike B.
Case 2 indicates the potential slip surface runs through the sluiced ash and drives out along the upstream side
of the road fill Dike B. The results of the stability analyses for Dredge Cell No. 2 southwest section are shown in
Table 1.6.3_T6.
Table 1.6.3_T6 Results of Stability Analyses
Runs Figure Number Conditions FS
Case 1
1.6.3_11 Drained Model φ = 30° 1.5 (1.49)
Case 2
1.6.3_12 Undrained Model Sup/σv’ = 0.30 1.1 (1.08)
1.6.3.5.6 Phase I Emergency Dredge Cell East - Analysis Phase 1 Emergency Dredge Cell was modeled having a crest elevation of the dike at El. 810 feet at the ash
pond side and El. 764 to 760 feet at the downstream side. The geometry for the stability analysis was from TVA
surveys of this section. Water level in the ash pond was understood to be El. 807 feet. A total of three dikes
were built with compacted ash by upstream construction method. Water level in the Tail Water was assumed at
El. 760 feet.
In the models, bottom of the sluiced ash is assumed at elevations varying from El. 725 to 730 feet using the
1940 surveys. No laminated sensitive slimes were modelled in the analyses. The sluiced ash was underlain by
the clays and silts alluvium directly to El. 715 feet. Underlying the clays and clayey silt alluvium, the silty sands
and sand alluvium are modeled. The soil properties are shown in Table 1.6.3_T1. The pore water pressure
piezometric surface was imported from the seepage analysis for the cross-section as discussed in Section 1.6.2.
Two cases on the cross-section were analyzed by Grid and Radius circular slip surface method: Case 1 for
sluiced ash having drained shear strength with an effective friction angle of 30° and no cohesion and Case 2 for
sluiced ash having undrained shear strength of Sup/σv’ = 0.30. In Case 1, the potential slip surface runs through
the bottom of clays alluvium (and top of silty sand alluvium). In Case 2, the potential slip surface runs within the
sluiced ash. The results of the stability analyses for east Phase 1 Cell cross-section are shown in Table
1.6.3_T2.

AECOM
K:\PROJECTS\60095742 - TVA\Final\FINAL Revisions\Volume 1\completed\FINAL-062509-Failure_Analysis_Report_VolI-rev.doc
62
Table 1.6.3_T2 Results of Stability Analyses
Runs Figure Number Shear Strength of Sluiced Ash FS
Case 1 1.6.3_13 Drained Model φ = 30° 1.6
(1.56)
Case 2 1.6.3_14 Undrained Model Sup/σv’ = 0.30 1.0
(1.01)
1.6.3.6 Cell 2 Simple Wedge Block Analysis In addition, to limit equilibrium slope stability analyses, AECOM performed a simple force equilibrium hand
computation for stability for the Northwest and Southwest Cell 2 stability sections using hand computed wedge
block stability analysis methods described in Taylor (1948), Sowers (1979), Terzaghi, Peck and Mesri (1996),
and considering active and passive wall movement theory from the Naval Facilities Design Manual (NAVFAC
DM 7.2, 1986). These analyses were performed to evaluate strain compatibility between ash and slime
materials resisting instability in the active, central and passive blocks. For simplicity AECOM postulated an
active wall pushed against a central block on soft material and the passive wall that resists sliding. In summary,
stability must account for compatible strength development along the slide plane. In SLOPE/W™ or other force
and moment equilibrium methods, the strength developed in each zone are in direct proportion to the available
shear strength in each zone independent of the stress-strain relationship for each material. For example, a
computed factor of safety of 1.25 means that 80% of the shear strength has been used by each material
independent of material stiffness.
The wedge block stability using 5% and 20% strain in a slime layer assumed 6 inches thick was compared with
active and passive earth pressures consistent with 0.3 and 1.2 inches of movement, respectively, which are 5%
and 20% of the 6-inch layer thickness. The active earth pressure coefficient of Ka of 1/3 is appropriate for this
range of movements, but the passive earth pressure coefficient Kp would increase only slightly from 1.0 and 1.2
for 0.3 and 1.2 inches of sliding block movement, respectively. Keep in mind that the strain of 1.2 inches in 39
feet of ash is roughly equivalent to a strain of 0.25%, which is very close to triggering liquefaction if the ash turns
to undrained behavior based on the CKU triaxial tests on reconstituted ash samples from this site. Furthermore,
it would be nearly impossible to develop full passive earth pressure response during undrained loading if the
slime were to slip below its peak shear strength. Based on the NAVFAC chart, a large displacement would be
required (say greater than 28 inches) to mobilize full Kp of 3 for a 30 degree ash for a passive wall 39 feet high.
For these large displacements, the shear strain in the slimes would be approaching 500% and given its high
liquidity index (4.6 to 7.0), the strength of the slimes would become negligible. In reality, this condition would not
be reached because the ash behavior would become undrained earlier, quickly reaching its very low value of
steady state undrained strength and thus controlling the subsequent mechanism of the flow slide.

AECOM
K:\PROJECTS\60095742 - TVA\Final\FINAL Revisions\Volume 1\completed\FINAL-062509-Failure_Analysis_Report_VolI-rev.doc
63
It is very likely that the peak strength of the slimes cannot be attained due to creep failure which has been
measured on an undisturbed slime sample from this site. Test results on slimes show an average shear strain
at peak strength of 5% and that at 20% shear strain the strength decreases by about 25%.
Northwest Cell 2 Results - The hand calculated wedge block stability analyses results for the Northwest Cell 2
that failed first are shown on Figures 1.6.3_15 and 1.6.3_16 indicate that when the strain in the slimes goes
from 5% and then reaches 20%, the factor of safety decreases from 1.1 to 0.9, respectively. Note that a strain
of 20% in the slimes represents a horizontal displacement of the failure mass of just over one inch, which likely
could not be seen as a surface manifestation, but it may be sufficient to trigger undrained behavior in the ash.
Southwest Cell 2 Results - The hand calculated wedge block stability analyses results for the Southwest Cell 2,
that failed by undermining, are shown on Figures 1.6.3_17 and 1.6.3_18 indicating that when the strain goes
from 5% to 20%, the factor of safety decreases from 1.5 to 1.2. However, a factor of safety of 1.5 at 5% strain
should not creep to the 20% strain. A factor of safety of 1.3 means that there must be a 76% decrease in
strength to reach unity. Recall, laboratory creep tests show vulnerability to creep failure between 80 and 85% or
peak strength mobilized. It is evident by the hand wedge analysis, that the Northwest Cell 2 has a lower FS than
the Southwest Cell 2 section. The higher factor of safety at the southwest side can be attributed to an overall
flatter dike slope and the toe area is buttressed by the Swan Pond Road and the railroad (RR) fills.
Phase 1 Emergency Dredge Cell - The hand computed wedge block stability of the east facing Phase 1
Emergency Dredge Cell had a FS equal to 1.2, which is non failure. Figure 1.6.3_19 shows the Phase hand
wedge block analysis results. The Phase 1 dredge cell is not underlain by slimes.
Volume IV includes supplemental hand computed wedge block analyses of the Northwest Cell 2, Southwest
Cell 2 and East Phase 1 Emergency Dredge Cell. The results show the Northwest Cell 2 to be the least stable
section with suspected loose ash and slimes.
1.6.3.7 Flow Slide Analysis With a maximum constructed sluiced ash elevation of El. 817 feet at the top of Cell 1 and a failure slide plane
elevation at approximately El. 730 feet, portions of the 87-foot-tall body of wet ash exhibited a total displaced
movement of about 4,600 feet northwest along Slough No. 2, and about 3,300 feet north then east to reach the
Watts Bar Reservoir. From the base of the primary head scarp on the north side of Dredge Cell 1, the final
difference in elevation of the ash flow was about 11 to 18 feet over the above-referenced distances, which
indicates an overall final angle of repose for the ash estimated at 0.15 to 0.3 degrees (from horizontal).
AECOM
K:\PROJECTS\60095742 - TVA\Final\FINAL Revisions\Volume 1\completed\FINAL-062509-Failure_Analysis_Report_VolI-rev.doc
64
From the work of Jeffries and Been (2006) and Lambe and Whitman (1969), the undrained steady-state shear
strength (Sus) of the ash can be estimated as follows:
Sus = σ’vo (γt / γ’) cos θ sin θ
Using a total unit weight Yt of 107 pcf, a submerged unit weight of 45 pcf, and an angle of repose (θ) of 0.15 to
0.3 degrees, Sus of the ash is estimated at 25 to 50 psf. Since this analysis does not correct for momentum
effects, these results are expected to represent lower-bound values for Sus strength of the ash. The results of
the consolidated undrained triaxial test data measured by AECOM on loose ash laboratory samples (typically
Sus of 100 to 250 psf).
The residual or undrained steady state strength of the slimes can be estimated using a figure from Terzaghi et
al., (1996) that shows residual strength versus liquidity index (LI). Using measured LI for the slimes the
apparent undrained strength is very low on the chart as shown on Figure 1.6.3_20. In other words, the unusual
slimes should have very low undrained strength when compared with LI of natural soils. The only soils with a LI
as high as the slimes are the Leda Clays or Champlain Clays that exist along the St. Lawrence River Valley in
Quebec, Canada or the quick clays in Scandinavia were marine clays have been raised above sea level and the
salt leached out of them to make them very sensitive to flow slides.
1.6.3.8 Evaluation and Conclusions of the RCA Stability Analyses AECOM performed stability analyses at three critical dredge cell sections to assess the stability of the dikes
against failure. A section along Northwest Cell 2 was selected because the failure initiated in this general area,
as evidence by the origin of distress calls and by the relic movements. A section along the Southwest Cell 2
was selected because shallow seepage outbreaks were reported in this area in 2003 and 2006. Finally, a
section along the east side of the Phase 1 Emergency Dredge Cell was selected because although records
show that this area was filled at a very high rate between 2004 and the end of 2006, failure did not occur at this
location. Key features that differ at each of these sections help explain the computed factors of safety and the
observed performance. These key features include:
1. Average actual slope of the dredge cell dikes (from actual surveys)
2. Historic sluiced ash filling rates
3. Structural height of the fill above toe area
4. Geometry of the containment at the toe of the dredge cell dikes
5. Material encountered between the sluiced ash and alluvium (i.e., clay or slimes)

AECOM
K:\PROJECTS\60095742 - TVA\Final\FINAL Revisions\Volume 1\completed\FINAL-062509-Failure_Analysis_Report_VolI-rev.doc
65
Table 1.6.3_T8, shown below summarizes the features listed above for each of the analyzed sections.
TABLE 1.6.3_T8 – Summary of Geometry, Filling and Foundation Factors
Description East Phase 1 Emergency Cell
Northwest Cell 2
Southwest Cell 2
Avg. Surveyed Cell Slopes 3.7H:1V 4.5H:1V 5.3H:1V
Rate of Filling (ft/day)
(Active fill dates)
14.6
(2004 ~ 2006)
6.0 to 6.1
(Fall 2008)
4.0
(Fall 2008)
Maximum Dike Crest Elev. (feet) 810 820 820
Elevation of Cell Toe. (feet) 764 771 765
Maximum Height from Dike Crest
to Dike Toe (feet)
46 49 55
Presence of Slimes Under Ash No Yes Yes
Containment of Ash
at Dredge Cell toe
No No Yes
(Dike B and Swan
Pond Road, RR)
Type of Observed Failure Shallow Surface
Slides With Seepage
Initial Section
Instability, then
Total Failure
Consequential
Failure
Pre-failure FS at 5% Strain
(Hand Computed Wedge Block)
1.2 in Clay 1.1 in Slimes 1.5 in Slimes

AECOM
K:\PROJECTS\60095742 - TVA\Final\FINAL Revisions\Volume 1\completed\FINAL-062509-Failure_Analysis_Report_VolI-rev.doc
66
It is evident to AECOM, from the known sequence of events and relic movements that the failure initiated at or
very close to the Northwest Cell 2 section. Therefore, the Northwest Cell 2 section became unstable before the
east side of the Phase I Emergency Dredge Cell and the Southwest Cell 2 sections were impacted. Even
though ash was lost from behind the east side of the Phase I Emergency Dredge Cell and failure took place at
the Southwest Cell 2 section, the order of events implies that failure at these locations was a consequence, or
domino effect, caused by the failure at the Northwest Cell 2 section.
Figure 1.6.3_21 below shows the computed FS against slope stability using SLOPE/W for the three sections
discussed above. In this chart, a two stage analysis was performed. Stage 1 is defined by the condition where
no excess water pressures are developed in the fly ash. Therefore, the fly ash is modelled in AECOM’s analysis
using drained strength parameters, representing a long term and stable condition. Stage 2 is modelled
assuming that the sluiced ash develops positive excess pore water pressures due to its contractive behaviour.
Therefore, the fly ash is modelled in Stage 2 using undrained strength parameters.
Figure 1.6.3_21 Comparison of Undrained Ash Computed Stability at Critical Sections Using SLOPE/W
As it has been explained in AECOM’s discussion of the results of the laboratory testing program in Section
1.5.1, for the sluiced fly ash, when the fly ash is sheared rapidly, not allowing time for porewater pressure
dissipation, the ash has a much lower undrained strength when compared to the drained shear strength.

AECOM
K:\PROJECTS\60095742 - TVA\Final\FINAL Revisions\Volume 1\completed\FINAL-062509-Failure_Analysis_Report_VolI-rev.doc
67
The three dredge cell sections in AECOM’s analysis show factors of safety on the order of unity (FS=1.0) for
Stage 2. A factor of safety of unity represents failure in a stability analysis. In this case the actual factor of
safety for undrained behaviour in the ash would be even lower because the peak undrained strength of the ash
would not be mobilized simultaneously in the clay as assumed in the stability analysis methodology. Similar
factors of safety near unity in the three sections imply that the three analyzed sections are equally vulnerable to
failure if the ash is loaded, deformed or sheared rapidly enough to trigger an undrained response. In other
words, the three sections likely would have failed if the ash behaved undrained. However, considering the
sequence of events, AECOM can conclude that an undrained response triggered failure in Northwest Cell 2
section first.
It is interesting to note that the Northwest Cell 2 section did not have the steepest slope; it did not have the
highest structural height, and it did not experience the fastest rate of historic filling, when compared to the other
stability sections. Therefore, it can be concluded that none of these factors triggered undrained response of the
sluiced ash. However, Northwest Cell 2 and Southwest Cell 2 encountered slimes overlying the alluvium
deposits. The difference between the conditions at Northwest Cell 2 and Southwest Cell 2 sections is that the
Southwest Cell 2 section had a FS of 1.5 for Stage 1, while the FS against slope failure for the Northwest Cell 2
section was only 1.2 to 1.3. The Southwest Cell 2 has flatter slopes, no setback area having exposed loose wet
ash, and is buttressed by Swan Pond Road and the RR fill adjacent to the west hillside.
The AECOM computed FS of 1.2 to 1.3 during Stage 1 (drained response of fly ash) for Northwest Cell 2
indicates that at least 75% to 85% (or 1/1.3 or 1/1.2) of the strength of the ash and slimes had been mobilized.
The results of the DSS tests performed in the slimes show that at these high stress levels, a loss in stiffness is
typically observed during undrained simple shear. This loss of stiffness under constant or increasing stresses
could lead to a rapid deformation of the slimes. During the creep test, stress levels on the order of 85% of peak
were maintained. During this loading, a sudden material failure was observed at a stress level lower than the
peak shear strength measured in the strain controlled DSS tests.
AECOM considered that the low FS in the Northwest Cell 2 section caused the slimes to have a sudden loss in
stiffness due to material creep failure. The sudden softening of the slimes or possible creep failure likely
triggered the rapid loading condition that lead to the undrained response of the ash.
Additionally, AECOM considered that the distribution of stresses may not have been necessarily uniform for all
layers (and inversely related to the factor of safety), as described above. It is more likely that the stresses
among the different layers of ash and slimes shared the loads in accordance to their relative stiffness under
somewhat equal relative displacements along the shearing plane. Limit equilibrium analyses cannot model stain
compatibility between materials of varying moduli, just their shear strength model (e.g., Mohr Coulomb [φ,c] or
undrained shear strength [c or Su]).

AECOM
K:\PROJECTS\60095742 - TVA\Final\FINAL Revisions\Volume 1\completed\FINAL-062509-Failure_Analysis_Report_VolI-rev.doc
68
Therefore, AECOM attempted to estimate a more realistic stress and deformation distribution through a
simplified wedge block analysis. This analysis, included as Volume IV, was performed using a simplified
geometry.
This simplified analysis for Stage 1, included the selection of strength parameters for the different layers based
on an assumed equal relative displacement along the failure plane. Two scenarios, corresponding to two
different strains levels (i.e., 5% and 20%) developed in the slimes were analyzed. The strength parameters for
the fly ash were selected from AECOM’s test results; and the strength in the uphill (active block) and downhill
(passive block) of the section were based on the tests results published in NAVFAC, 1982 (Terzaghi studies and
Princeton tests).
The results of this analyses indicated that for equal relative displacement along the slip surface and shear
strains on the slimes in the order of 5%, the overall factor of safety was approximately 1.1 The second analysis,
performed for a strain of 20% in the slimes, shows a FS of 0.9 (failure). AECOM realizes that this analysis has
some assumption and simplification; however, we consider that displacement compatibility effect likely played a
major role in the stress distribution in the different soil units; and that the consequence of this distribution likely
overstressed the slimes. Therefore, the FS of 1.2 to 1.3 for Stage 1, for the Northwest Cell 2 section is not too
high, when compared to the actual factor of safety if strain compatibility is accounted for.
AECOM also performed infinite slope stability analysis of dry and seeping slopes (3H:1V). These analyses
showed a FS above 2.0 for dry slopes and below 1.0 for seeping slopes. This simple analysis explains the
observed shallow slope stability failures in 2003 and 2006 along the West Slopes of Cell 2. These results are
presented in Volume IV.

AECOM
K:\PROJECTS\60095742 - TVA\Final\FINAL Revisions\Volume 1\completed\FINAL-062509-Failure_Analysis_Report_VolI-rev.doc
69
1.7 Failure Modes Analyses 1.7.1 General AECOM identified twelve potential failure modes and then reviewed their likelihood individually and in concert
with each other based on observations, measurements and testing. All of the failure modes were considered
plausible and their possible contribution to the failure were judged after review of available facts and information.
1.7.2 Earthquake Shaking and other Vibration Sources Facts: Based on the United States Geologic Survey (USGS), there were two documented pre-failure
earthquakes in eastern Tennessee. The largest was on December 17, 2008 in New Market, Tennessee, as
shown on Figure 1.3.3_5. It was recorded as magnitude 2.9 and 10 kilometer (km) deep located approximately
50 miles east of the Kingston site. The closest earthquake was on November 9, 2008 southeast of Rockwood,
Tennessee. It was a magnitude 2.5 event, 25 km deep and located approximately eight miles south of the
Kingston site. The last coal train delivery to the site was on December 21, 2008, just after noontime. Recall the
early morning train to the site on December 22, 2008 slid into the failure slide mass early Monday morning
during an emergency stop.
Conclusions: The fly ash is saturated, loose (contractive) and vulnerable to seismic liquefaction. However, since
there were no earthquakes in the vicinity of the site on December 21 or 22, 2008 AECOM concludes that
seismic activity did not trigger landfill instability. Known earthquake liquefaction normally occurs during or with
minutes of an earthquake (Kramer, 1996). Railroad traffic vibration does not have sufficient energy to trigger
liquefaction and there was no train traffic within the 12 hours preceding the failure. Thus earthquakes or
train-generated vibrations did not contribute to dredge cell instability.
1.7.3 Excess Rainfall Facts: There was above average rainfall from November 20 through December 21, 2008. Figure 1.7.3_1 shows
the cumulative rainfall collected at the rain gage at the Kingston dredge site for a month preceding dredge cell
failure. Based on a TVA rain gage data from the dredge site there were 7.51 inches of rain during this 31-day
period, this compares to 7.95 inches recorded at the Kingston power plant. This rainfall information is presented
in Appendix 4A of this report. Based on the average of two TVA rain gages at the site, there was a total of 0.83
inches or 1.28 inches of rain during the December 20 to 21, 2008 storm event. This two day event would have
added vertical pressure across the top of active Cell 2. There was a weir at the decant structure at Cell 2 that
was reportedly set 4 feet below the reported crest El. 820 feet for Dike D2. This would limit the water levels
slightly above El. 616 feet. Over the 31 acre Cell 2 footprint at the Dike D3 stage and using 1.28 inches of rain
during the two-day rain event, this would be the equivalent to 3.3 acre-feet of water. This is low when compared
to 10 hours per day of ash dredge sluicing using a TVA reported 5,000 gallons per minute (gpm) pump
discharging the equivalent of 9.2 acre-feet of 80 to 85 percent (%) water and 15 to 20% solids being deposited
daily into Cell 2 from December 15 through 18, 2008. There was no evidence of overtopping of the dike at Cell

AECOM
K:\PROJECTS\60095742 - TVA\Final\FINAL Revisions\Volume 1\completed\FINAL-062509-Failure_Analysis_Report_VolI-rev.doc
70
2 after the December 20 and 21 rain storms. AECOM interviews with Mr. Settles recalled that approximately
30% of Cell 2 was covered with water on December 21, 2008 during inspection of the dredge cells.
Conclusions: The rainfall event of December 20 and 21, 2008 added the weight of water to Cell 2. In AECOM’s
opinion, the rainfall event was a de minimus amount and did not contribute significantly to trigger the failure of
Cell 2. The weight of added fly ash to the pond four days per week is much greater loading when compared to
the Sunday rainfall event. For comparison, the largest measured volume of rainfall event of December 20 and
21 was 36% of the volume of water and solids pumped into the 31-acre cell on an active pumping day.
Furthermore, the sluice water is heavier than rain water and the decant structure on top of Dredge Cell 2 would
control the maximum water level in the dredge cell. Thus, in AECOM’s opinion this two day rainfall event was a
minor contributing factor to dredge cell instability.
1.7.4 Rapid Reservoir Draw Down Facts: Based on TVA records there was rainfall over the site and the Tennessee River Watershed on December
10 and 11, 2008 that caused the Watts Bar Reservoir to rise from El. 735.5 feet on December 10 up to 739.6
feet on December 13, 2008. As a result of this rain, the Reservoir was drawdown to elevation 737.0 feet at
01:00 am EST on December 22, 2008. A relatively rapid draw down could destabilize the downstream slope of
perimeter Dike C due to perched water in the containment dike. Figure 1.7.4_1 shows the Watts Bar Reservoir
levels for a couple of weeks prior to the failure.
According to annual TVA records the following Watts Bar Reservoir elevation from date of gate closure at Watts
Bar Dam through 2008 are provided for reference:
• Maximum Recorded Annual Reservoir Low El. 747.35 May 7, 2003 • Minimum Recorded Annual Reservoir High El. 733.44 March 20, 1945 • Lowest Pool in 2008 El. 735.55 February 29, 2008 • Highest Pool in 2008 El. 741.24 June 7, 2008 • 100 Year flood Elevation El. 748.0 Never attained • 500 Year Flood Elevation El. 750.5 Has not happened
Conclusions: The perimeter dikes have previously experienced drawdown from a summer normal high pool of
El. 742 feet to normal minimum low of El. 735 feet. Drawdown normally takes place in September and after fall
and winter storms, and is then raised back in April to a normal summer pool at El. 742 feet. The rapid
drawdown is a normal and expected response by the TVA during the history of Watts Bar reservoir operations
since 1942. This winter time pond lowering after a rainfall event is a normal operation procedure to keep the
winter pool low for mosquito control and ponding of rain water during the winter months. In AECOM’s opinion,
Cell 2 failed first and Dike C failed as a consequence of Cell 2 failure that surcharged Dike C causing a larger
failure. Drawdown of the Watts Bar Reservoir did not cause instability of Cell 2 as there is ample evidence that
failure of Dike C, which could have been affected by drawdown, did not fail first as computed factors of safety by
AECOM of Dike C prior to failure without surcharge are greater than 2.0.

AECOM
K:\PROJECTS\60095742 - TVA\Final\FINAL Revisions\Volume 1\completed\FINAL-062509-Failure_Analysis_Report_VolI-rev.doc
71
1.7.5 Karstic Limestone Sinkhole or Bedrock Instability Facts: AECOM drilled five bedrock cores at the compass corners and center of the dredge cells and found
weathered Conasauga Shale at elevations ranging from El. 702 to 716 feet, with the rock lower in the south area
of the site. Due to the fractured nature of the weathered shale, AECOM did not get full recovery due to the fissile
nature of the shale that would tend to bind the core barrels. However penetration rates did not show evidence of
sinkholes or voids. Based on bedrock geology mapping by the Tennessee Division of Geology in 1993, the
Swan Pond Flood Plain is underlain by Conasauga Shale over the Rome Formation Shale. Both older shale
units were over the younger Knox Group Limestone that is over 1,000 feet below the surface of the shale units.
The Knox Group is known to have karstic and sinkhole features just downstream of the Kingston Power Plant
outfall channel where soil units are underlain by the Knox Group Limestone. These locations south of the power
plant have reported sinkholes, see TVA (1951). Figures 1.3.3_3 and 1.3.3_4 show the State Geology plan of
the site geology and a geologic profile of the site, respectively.
Conclusions: AECOM’s test cores and Tennessee geologic mapping show the entire dredge cells are over
alluvium founded on fractured and weathered shale, with the potentially karstic limestone being over 1,000 ft.
below the top of the shale at the site. Thus karstic activity in the limestone would not affect dredge stability.
There is no evidence of recent movement along the Chattanooga Fault. It was millions of years ago when the
older shales were thrust up and over the younger limestone. The fractured Conasauga shale is massive, without
voids and showed very high Standard Penetration Test blow counts, indicative of rock that is highly
over-consolidated and not subject to train vibrations, local shifting or micro-seismic instability that might be
impacted by 80 to 90 feet of ash fill placed over the 54 years. Furthermore, the shale bedrock is sufficiently
cemented and over consolidated to not be deformed significantly by 80 to 90 feet of ash fill. Thus one can
conclude that there is no evidence of bedrock instability associated with the December 22, 2008 dredge cell
failure.
1.7.6 Artesian Groundwater Instability Facts: AECOM installed isolated, low-volume, pneumatic piezometers with the sand collection zone at the
interface of the fractured and weathered Conasauga Shale and soil alluvium. Figure 1.7.6_1 shows the
expected hydrogeologic flow regime at the dredge cell site based on historic TVA information and 2004
permitting efforts by the agency. The fact that the ash ponds were constructed by sluicing water up to El. 816
feet during the week prior to the failure, that the ash collection pond was maintained at El. 760 to 761 feet for
years and that the Watts Bar Reservoir pond was falling from El. 739 back to El. 737 feet in mid December 2008
gives us reason to believe that water in the Dredge cells was moving vertically downward and laterally to the
ash collection pond and to ultimately to the Reservoir. Figure 1.7.6_2 shows the measured head levels at the
top of shale on March 23, 2009. The Shale units were highly fractured and several core holes noted drilling
water losses.

AECOM
K:\PROJECTS\60095742 - TVA\Final\FINAL Revisions\Volume 1\completed\FINAL-062509-Failure_Analysis_Report_VolI-rev.doc
72
Conclusions: Based on March 23, 2009 piezometer readings, with the ash collection pond operating between
El. 760 and 761 feet most of the piezometers had water levels between El. 762 and 746 feet. The piezometers
located above the rock level had water levels between the ash collection pond and reservoir levels and that
indicate the Dredge Cell water was generally moving downward. There is no evidence of artesian conditions and
no evidence that regional rainfall could have caused excessive bedrock aquifer uplift. The shale is relatively
fractured and is likely hydraulically connected to the reservoir level. The water table is likely elevated
(mounded) beneath the ash by vertical flow from the former dredge cells and ash collection pond that maintains
water heads in the shale above the Reservoir that fluctuates between El. 735 and 742 feet, depending on
season. In AECOM’s opinion, artesian conditions did not exist under the Dredge Cells and thus could not have
contributed to the failure on December 22, 2008.
1.7.7 Shallow Dike Instability Due to Seepage Outbreak on Slopes or a Piping Failure Facts: The slopes of the Dredge Cells have 3H:1V slopes with 15-foot benches that form an average intended
design slope of 4H:1V above El. 770 feet on the north, El. 760 feet to the east and El. 765 feet for the south and
west of the Dredge Cell.
Actual slopes were surveyed by TVA. The as-built surveys by the TVA show actual average slopes to be the
following:
• 4.5H:1V - North Side of Dredge Cell 2
• 5.3H:1V - Southwest End of Dredge Cell 2 over former Cell 3
• 3.7H:1V - East Side of the Phase 1 Emergency Dredge Cell
There has been a history of shallow surface slides and minor piping (internal erosion of ash due to seepage
forces) on the west side of former Cell 3 that became Cell 2 after 2000. The reported slides were on November
6, 2003 and November 1, 2006. They were located along the bottom two benches of the Dike B and upstream
Dike A that were constructed prior to 1996 when the upstream dikes (A and B) were not formally designed or
shown on design drawings. The two historic shallow dike slides on the Dredge Cells were associated with
seepage emanating from the dikes. The dikes were constructed of compacted fine grained fly ash and bottom
ash and there was evidence of internal movement of wet fly ash outward. This movement is termed “piping” in
soil mechanics. This stability condition can reduce the FS against sliding by 50% if a dry slope become wet and
they negatively impact the exterior slope by seepage breakout due to buoyancy of water acting on solids.
These areas showed minor internal erosion of wet ash. We know from TVA records that multiple slope
repair operations were conducted by HED between 2003 and early winter 2008 to manage surface
seepage. There was documented evidence that one of the 26 well points (WP02) had a water level
above the wet ground surface on December 21, 2008. Well Point WP02 is located just east of the 2006

AECOM
K:\PROJECTS\60095742 - TVA\Final\FINAL Revisions\Volume 1\completed\FINAL-062509-Failure_Analysis_Report_VolI-rev.doc
73
surface improvement to the west facing Cell 2 upstream dikes. Well Point WP02 is on the slope of
original Dike B.
AECOM’s permeability measurements and seepage modeling along the southwest slope of Cell 2 show
potential seepage outbreak and standing water at the toe of the northwest Cell 2 toe area, which is
consistent with observed wetland biota (cattails) that thrived in the 200-foot setback area. No observed
piping or silt boils were ever documented along the north or northwest edge of Dike A at Cell 2.
Since there are areas of the dike slope or toe area without a seepage collection system or filter blanket,
there is a potential for seepage outbreak with internal soil erosion due to seepage forces that can carry
wet ash without confinement. Daily inspection of these Cell 1 and 2 slopes or toe areas in December
2008 did not observe shallow slides or evidence of ash flowing or piping from the west side slopes of
Cells 1 and 2. There was evidence of gully due to surface runoff, but no evidence of shallow slides or
piping failures.
Shallow wet slope stability is discussed in Section 1.6 of this report and in Volume IV of this report.
Conclusions: The computed dry slope (3H:1V or 18.4 degrees) stability safety factor (Lambe and Whitman,
1969) equal to tangent of 37 degrees divided by the tangent 18.4 degrees yields a safety factor of 2.3. AECOM
concludes that dry slope instability did not cause the December 22, 2008 Dredge Cell failure.
Slope repairs along the west side were conducted between 2003 and during early 2008. During January and
February of 2008, bench drains were constructed on the west face of Cells 1 and 2. TVA directed Mactec and
GeoSyntec to install more than 26 well points and 18 piezometer along the west slope in November 2006 and
March 2007, respectively. Based on December 21, 2008 well readings, only one well, WP02, had dike seepage
water levels above grade. Inspection reports from 2008 did not report shallow slides during fall of 2008. It was
noted that the bottom drains pipe along the north side of Cell 2 began to flow clear water on December 9, 2008,
which was the intended purpose of the drains.
The last inspection of the dikes occurred in the early afternoon on December 21, 2008 and no unusual
conditions or seepage was noted. In AECOM’s opinion, seepage outbreak around the perimeter of the dikes
above El. 765 feet did not contribute to Dredge Cell 2 instability on December 22, 2008.

AECOM
K:\PROJECTS\60095742 - TVA\Final\FINAL Revisions\Volume 1\completed\FINAL-062509-Failure_Analysis_Report_VolI-rev.doc
74
1.7.8 Intermediate Depth Instability of Dredge Cell or its Dikes Facts: Intermediate depth stability could have been potentially affected by slippage along woven geotextile
shown in the 1995 design drawings under each upstream dike for Cell 2 dikes A through E3. However, AECOM
was told by TVA designers, TVA by-product managers and TVA plant personnel that no slip film woven
geotextile was placed under the A through D2 level dikes and only bottom ash was used as a stabilizing
material. This was confirmed by a test pit excavated into the intact dikes at the southern edge of Cell 1. There
are French drains along the heel of each dike above El. 765 feet shown on the 1995 TVA design drawings.
There was severe damage and movement of the west facing dredge cell dikes along Cell 1 and 2 with evidence
that these dikes were carried north by liquefied ash that flowed under the dikes from south to north.
Conclusions: AECOM was told, and observed in the Cell 1 test trench, that Dikes C1 up to D2, were placed on
fly ash or bottom ash with no evidence of slip film woven geotextile. Furthermore, AECOM has evidence from
the Cell 1 Test Trench No. 3 and by video photography of the south side slope drains by Roto Rooter that the
intact Cell 1 drains were functional and did not show plugging or accumulation of fines in the French drains.
Without the geotextile and with the operational drainage system as evidenced by piezometer readings, the dikes
are stable for potential failure surfaces at an intermediate depth.
1.7.9 Deep Seated Instability of Dredge Cell through Ash Only Facts: Based on water content measurements and void ratio computations from borings made through Cell 1
and along Dike D AECOM has good reason to believe that ash under the Cell 2 and under the 200-foot setback
area had a metastable high-void ratio structure. Testing data provided in Volume III, shows that the majority of
the fly ash is in the contractive zone or above the steady state line and sits in a stress regime that, if there was
rapid loading or an earthquake the material would immediately liquefy and a rapid flow failure could occur in the
dredge cells due to limited containment.
Conclusions: There are static liquefaction failures that have been documented in which the triggering
mechanism has been associated with a weak foundation, submergence or an earthquake that has led to a
sudden failure. For the Kingston cells and in the absence of an earthquake, AECOM believes that the only
possible way to cause static liquefaction would be to force undrained ash behavior by too rapid a loading on the
top of the dredge cells. AECOM knows from TVA surveys that the Phase 1 Emergency Dredge Cell was loaded
between May 2004 and January 2007 at an average filling rate of 14.6 feet/year, which is substantially higher
than the rate of loading for Cell 2 of 4.0 to 6.1 feet at the southwest and north ends of the Cell 2 Dredge Cell,
respectively (See Fig. 1.7.9_1). However static liquefaction was not triggered in the Phase 1 Emergency Dredge
Cell.

AECOM
K:\PROJECTS\60095742 - TVA\Final\FINAL Revisions\Volume 1\completed\FINAL-062509-Failure_Analysis_Report_VolI-rev.doc
75
Static liquefaction did occur deep in the ash after the containment cells were breached, as evidenced by the fact
that the majority of the contents of Cell 2 and its foundation ash poured out of the site. It is obvious during the
history of filling that the wet loose ash behaved in a drained behavior except on the morning of December 22,
2008, otherwise liquefaction would have occurred earlier, given the low strain and peak when the ash behaves
undrained and the precipitous decline in undrained strength once the strain at peak is exceeded. AECOM
believes that the undrained behavior in the ash was triggered by creep and deformations in the unusually
sensitive slime that has very high water contents, high liquidity indices and is creep sensitive with strain
softening after creep or peak shear strengths are mobilized. AECOM also has photographs of the slide plane in
slimes from Osterberg tube samples from 09-101B, 09-104B, and 09-500B. These photographs are clear visual
evidence of the slide plane location in the slime layer. In AECOM’s opinion, the failure did not occur solely in
ash.
Thus in AECOM’s opinion, static liquefaction of the ash did not cause the initiation of the failure, but was a
consequence of an initial failure through the slimes layer.
1.7.10 Increased Filling Rates into Dredge Cells Facts: Cell 2 was an active discharge area during December 2008. Active filling into Cell 2 began October 16,
2008 and the last day of filling took place on December 18, 2008. Based on TVA information the initial sluiced
ash grade in early October 2008 was at El. 814 and was likely filled to El. 815.5 to 816 feet at the time of failure.
According to TVA records Cell 2 filling generally took place four days per week using a 5,000 gallon per minute
pump discharging sluiced into the cell. Based on ash generation rates reported in Section 1.2.6.3 of this report
at least 100,000 cubic yard of ash was placed into the 31-acre Cell 2 from October 16 to December 18, 2008.
This correlates to 1-foot of new fill placed into Cell 2 over this two month period. This correlates to a 6-foot per
year fill rate at Cell 2. Based on TVA topographic surveys, AECOM reviewed top of Cell elevation at three
locations:
• North End of Cell 2
• Southwest End of Cell 2 over former Cell 3
• East Side of the Phase 1 Emergency Dredge Cell
AECOM plotted the measured survey elevation of these three locations versus the time from 1998 to the time of
the failure. This is shown on attached Figure 1.7.9_1. This figure shows the North End of Cell 2 to have been
filled the fastest since 2007 at a rate of 6.1 feet per year, or 1-foot for a two month period. The next fastest fill
was the Southeast End of Cell 2 over old Cell 3 at a rate of 4.0 feet per year, and essentially no ash was placed
into the South End of the Phase 1 Cell since the beginning of 2008. The dredge cell surface area for each Dike
decreases due to the inward slope of the upstream dike system that pitches inward on an intended average
slope of 4H:1V.

AECOM
K:\PROJECTS\60095742 - TVA\Final\FINAL Revisions\Volume 1\completed\FINAL-062509-Failure_Analysis_Report_VolI-rev.doc
76
As the landfill gains in elevation, the ash storage area gets smaller and therefore, if ash generation rates stay
the same or increase, the landfill will fill gain height faster with time. In other words, as the footprint gets
smaller, the height of the fill must increase to contain the same volume.
The annual fill placement rate at the Kingston Dredge Cell from TVA HED records was 471,000 cubic yards (cy)
for fiscal year ending (FYE) September 30, 2006. The ash storage rates for FYE September 2007 and 2008
were 596,000 and 462,000 cy, respectively. The TVA reported ash deposited to Cell 1 and 2 were 127,000 cy
since October 1, 2008. If the fall of 2008 rate of ash pumping is projected forward using the data from October 1
and December 18, the annualized volume of ash pumped into the dredge cells would be 601,000 cy for
projected FYE 2009.
Conclusions: The rate of filling at the north end of Dredge Cell 2 was higher than Dredge Cell 1 or the Phase 1
Emergency Dredge Cell filling rates since early 2007. However, the filling rates (i.e., gain in elevation rate) at the
Phase 1 Emergency Dredge Cell between 2005 and late 2006 were more than twice the filling rate than the
rates used to fill the north end of Cell 2 (e.g., 14.6 versus 6.1 feet/yr.) The rate of 1-foot of cell rise in the 31
acre Cell 2 over a two month period matches agrees with dredge cell input pumping rates and the surveyed top
of Cell 2 sluiced level estimate of El. 815.5 to 816 feet. The crest elevation at Cell 2 agrees with TVA personnel
observations that indicated there was 4-feet of freeboard between the sluice pool and the Dike D2 crest at El.
820 feet. AECOM concludes that active filling contributed additional driving pressure (soil and water) against
the Dredge Cells. Note that as the fill heights increase, the soil and hydrostatic force against the containment
dikes of foundation system increase with a power function. In other words, as the force of fluid or near-fluid
pressure acting on containment system, increases as a function of the square of height of the fill and water
retained. AECOM’s opinion is that the increase in fill volume and the higher rate of fill height due to an ever
decreasing cell footprint area were factors that contributed to the failure at active Cell 2.
1.7.11 Deep Seated Instability along a Weak Foundation Layer Facts: AECOM obtained Osterberg tube samples of the ash/slime/clay interface at the base of the Dredge Cells
and found the slide plane at or just above the slime/ash below the Cell 2 Dike A toe alignment. Figure 1.3.4_6
shows a geologic profile along the toe of Dike A from the west side Swan Pond Road and Dike D to the east.
The slide plane from observations is shown in the red lines and generally follows the slime layer from elevation
727 to 737 feet. Figure 1.7.11_1 show red circles where AECOM Osterberg and/or SPT boreholes encountered
slimes, and blue circles were used to denote where sampling did not find slimes. The red and blue rectangles
indicate where, using the CPTu piezocone, AECOM expects or does not expect sensitive slimes. Note that the Cell
2 footprint has abundance of red slimes, and Dike C, Cell 1 and Phase 1 Emergency Dredge Cell footprints do not.

AECOM
K:\PROJECTS\60095742 - TVA\Final\FINAL Revisions\Volume 1\completed\FINAL-062509-Failure_Analysis_Report_VolI-rev.doc
77
Stantec inclinometers show movement along and just below the ash/slime/clay interface at El. 728 to 718 feet
where the Dredge Cell 2 once abutted Dike D. These movements are toward the west as shown in Stantec plan
and section Figures 1.7.11_2 and 1.7.11_3, respectively.
The north end of Dredge Cell 2 was constructed over 35 to 40 feet of loose wet ash. There was no containment
or buttress dam holding the toe of Cell 2 Dike A in place. The fact that the rising Cell 2 fill above El. 770 feet
was founded on loose wet ash over a layer of low undrained shear strength slimes comprised of high water
content silt and ash offered a weak, deep seated slide plane in a material that can strain soften and has creep
potential. Dr. DeGroot of the University of Massachusetts performed a creep test on the slimes and determined
that creep can occur after 80% of the peak shear strength is reached and failure can occur at 85% strength with
sustained undrained loading. The peak undrained shear strengths of the slimes ranged from 600 to 1,250 psf
depending on the effective overburden stresses prior to dredge cell failure based on prefailure topography
known from TVA surveys. Based on nine direct simple shear tests on slimes, the strain at peak was found to be
about 5%. At 20% strain the undrained shear strength drops to approximately 75% of the peak. High liquidity
indices indicate that at higher strain the strength will continue to decrease substantially.
Based on relic movements shown on Figure 1.3.2_2 the failure could not have originated along the west side of
Cells 1 and 2 as major sections of the Containment Dike C and the 200-foot wide setback zone have been
thrust northwest and north with most of Dike C intact and shoved against the north abutment of the Tail Water.
Early telephone calls indicate early damage at the northwest of the site. Furthermore, several of the series 400
borings have intact ash east of former Swan Pond Road. In other words, the foundation ash supporting the
west side of the Dredge Cell 1 and 2 did not completely fail along Swan Pond Road. The Swan Pond Road and
railroad subbase were generally intact and borings along the 400-series holes at roadway edge only have
shallow failed ash.
Conclusions: The failure started under the north end of Cell 2 upstream dike system as a primarily translational
failure (wedge block) since this cell was under active ash loading. It had a driving force associated with 85 to 90
feet of lateral water and wet ash pressure and resisting force of low strength and creep sensitive slimes, and
passive wedge of 35 to 40 feet of loose wet ash that had no buttress or dike. A failure originating in the creep
sensitive slime layer is the probable initial mode of failure based on photographs showing this condition; see
Figures 1.7.11_4 and 1.7.11_5 showing the slide plane at the slime interface under Cell 2. The results of
stability analysis for this failure mode based on measured strengths in the slimes presented in Section 1.5.4
provide confirmation that it was the most critical mode of failure.

AECOM
K:\PROJECTS\60095742 - TVA\Final\FINAL Revisions\Volume 1\completed\FINAL-062509-Failure_Analysis_Report_VolI-rev.doc
78
1.7.12 Consequential Undrained Failure of Ash Causing Flow Slide (Static Liquefaction) Facts: The sluiced ash under and below the upstream dikes of Cell 2 is saturated, has a high void ratio, and
flowed into three sloughs and into the Watts Bar Reservoir with an angle of final repose less than 0.5 degrees.
The measured void ratios of unfailed ash below the Dredge Cell averaged 0.87 and showed contractive
behavior during the failure in samples fabricated in the laboratory. Figure 1.5.1_1 shows the void ratios in
unfailed ash under the dredge cells. It is evident by review of data that the decrease in void ratio from tube and
split spoon samples with depth, as would be expected due of increased overburden pressure, is negligible in
comparison to the scatter in the data.
The project site clearly underwent consequential static liquefaction due to undrained behavior of the ash likely
due to excess deformation of the foundation slimes due to creep under sustained loading. With creep in the
slimes the stability of the fill had to then rely on the undrained strength of the ash to support the post 1996
dredge cells. Little undrained strength is available in the loose wet ash when driving stress levels are close to
peak undrained strengths, if loading is sustained and drainage can not be provided.
Conclusions: Active loading on the top Cell 2 (the TVA reported 100,000 cubic yards was placed with Cell 2
from El. 814 up to El. 815.5 feet from October 16 to December 18, 2008) with an additional 1.28 inches of rain
from December 20 to 21, 2008 brings the computed factor of safety with drained strength in the ash to about 1.2
to 1.3 at the northwest corner of Dredge Cell 2, with the critical surface day lighting within the 200-foot setback
zone. As the factor of safety became smaller as the height of the ash fill increased, the deformations to mobilize
the strength of the slimes became higher together with creep deformations of the slimes. These deformations
occurred relatively faster leading to undrained behavior in the ash. With the peak undrained strength in the ash
of approximately Sup/σv’ of 0.3 the computed factor of safety dropped to one.
Furthermore, the slimes have a shear strain at peak of about 5% and at 20% strain the available undrained
shear resistance of the slimes drops to about 75% of its peak undrained strength. At this point the computed
factor of safety drops below unity and the failure is progressing rapidly with the undrained strength of the ash
dropping precipitously from its peak and the very low undrained steady state strength controlling the subsequent
flow slide. Static liquefaction occurred as a result of creep failure of the slimes.

AECOM
K:\PROJECTS\60095742 - TVA\Final\FINAL Revisions\Volume 1\completed\FINAL-062509-Failure_Analysis_Report_VolI-rev.doc
79
1.7.13 Progressive Failure of Fill after Initial Cell 2 and Dike C Breach Facts: The Cell 2 Dikes A through D2 had no confinement from Dike C which was located 200 feet away which
allowed the initial deep seated failure to daylight into the 200-foot wide wet buffer zone between Cell 2
Upstream dikes and Dike C. The initial failure under Dike A stacks ash and dike material behind Dike C. This
surcharge of failed Dredge Cell 2 ash results in Dike C foundation failure. Observed Dike C failure relics show
the slide plane below Dike C fills and clay interface by sliding through the native clay alluvium (Note that there
were no slimes found beneath the initial perimeter Dike C). Figures 1.7.13_1 and 1.7.13_2 show the slide plane
through the clay under Dike C fill at borings 09-201B and 09-202B, respectively. AECOM conducted a vane
shear test immediately below the ash at boring 09-201A that shows peak undrained shear strengths equal to the
remolded strength of the clay, indicating that the foundation clay had failed during this event. Furthermore,
sections of Dike C found against the north hill shows that it moved together with some foundation soil.
As Dike C and its foundation clay failed, the liquefied ash behind it pushed the dikes and dredge cell contents
north and west causing Sloughs 1 and 2 to fill in with ash and slide material and created a 45-foot high water
wave (seiche) without ash up the north hill. Fragments of Dike C appear to have pushed the Schean home off
its foundation on to Swan Pond Circle. A sequential series of failures occur behind the scarp caused by the
initial failure, as the ash is suddenly loaded and thus behaves undrained and its strength decreases to its
undrained steady state strength. The slide had sufficient volume and energy to enter Watts Bar Reservoir. The
southern progression of the failure ended when it reached Cell 1 Divider Dike. Cell 1 was not operational since
early October 2008.
Conclusions: The loose wet ash fill on creep sensitive slimes was on the verge of deep failure at north end of
Cell 2 due to increased ash loading (sluiced ash and rain), and limited containment due to Dike A being founded
on wet ash. Vulnerable Cell 2 was founded on loose wet ash that has contractive undrained behavior and
slimes that can creep. Both the loose fly ash and slimes have low undrained shear strength. Subsequent static
liquefaction of most of the ash within Cell 2 caused a retrogressive failure back to Cell 1. This progressive
liquefaction undermined the west facing dikes of Cell 1 and 2 and allowed partial release of liquefied ash from
the Phase 1 Emergency Dredge Cell. With added loading in active Cell 2, the foundation creep failure of the
containment systems allowed the wet ash to become undrained, liquefy and then flow out of its containment due
to high void and low undrained shear strength and quickly retrograde rapidly back to Cell 1. This event caused
distress to Dike D that did not let go and partially emptied the upper wet ash in the Phase 1 Emergency Dredge
Cell. The failure of the west side Cell 1 and 2 dikes were the consequence of ash liquefaction and ash flow from
south to north under the dikes that caused the west dikes to ride on liquefied ash and flow north. This failure
mode is a consequence of the initial failure of the ash and slime foundation on which Dredge Cell 2 was
founded.

AECOM
K:\PROJECTS\60095742 - TVA\Final\FINAL Revisions\Volume 1\completed\FINAL-062509-Failure_Analysis_Report_VolI-rev.doc
80
1.7.14 Summary The loading of active Cell 2 caused the undrained behavior of the loose wet ash and slimes that supported the
interior Dikes A through D2. This undrained behavior caused a translational failure through the slimes and
foundation ash under the upstream dredge cells. This undrained failure displacement then surcharged out onto
the 200-foot setback area, with the liquefied ash and surcharge causing Dike C to fail through alluvial clay. This
breach of the north containment dikes then caused the rapid release of liquefied wet loose ash until progressive
static liquefaction came to rest at the Cell 1 relic and Dike D divider dikes. In summary, there are a number of
factors that contribute to failure, not just one trigger or event. Active loading, cell location, high water level, dike
geometry, loose ash fill, and creep sensitive foundation slime material provided an unstable system that was on
the verge of failure and did so in a sudden way without warning or visible pre-failure symptoms.
There is little evidence that the west slopes contributed to the initial failure as the majority of the 400-series test
borings show intact ash below intact Dike B fill with a thin surface layer of failed ash above it. Furthermore, the
majority of the Swan Pond Road and railroad subbases were intact after being inundated with consequential
slide debris. The fact that Cell 1 and the Phase 1 Emergency Dredge Cell did not show evidence of slimes
underneath reduced the potential for liquefaction of ash due to foundation creep. AECOM adds that the Phase 1
Emergency Dredge Cell was loaded twice as fast as the north cell which shows that ash itself can remain
undrained while dike stability is preserved.

AECOM
K:\PROJECTS\60095742 - TVA\Final\FINAL Revisions\Volume 1\completed\FINAL-062509-Failure_Analysis_Report_VolI-rev.doc
81
1.8 Summary of Root Cause Analysis AECOM reviewed twelve (12) failure modes discussed within Section 1.8 to identify the most probable failure
mechanisms or factors that contributed to the failure that occurred early in the morning on December 22, 2008.
After reviewing subsurface information from the RCA field and laboratory program, AECOM’s fundamental
conclusions are that the dredge cell impoundment was on the verge of failure with no visible signs of distress
reported that would have indicated that a deep-seated failure was about to occur. Rapid failure of active Dredge
Cell 2 was progressive in nature due to four concurrent factors:
1. Fill Geometry – AECOM analyzed actual TVA surveyed slopes for the dredge cells. Dikes A through D2
were built on an upstream, high-void-ratio sluiced ash. The dikes were located 200 feet back from the
original containment Dike C, and thus did not benefit from the more stable foundation conditions present
under the original Dike C which was founded on silt and clay alluvium with no slimes present.
2. Increased Fill Rates - The dredge cell footprint at Cell 2 was becoming smaller with each dike rising.
Therefore, more cell dike height was required to store the same annualized volume of generated ash
and thus the elevation of the ash was increasing more rapidly compared to earlier years. The added
height of ash behind the upstream dike construction added load to the wet ash and to the underlying
unusual slimes situated over the former flood plain alluvium clays and silts.
3. Soft Foundation Soils - Creep failure of the submerged loose slimes was occurring under the load of 40
to 85 feet of loose wet ash. Creep deformations caused a reduction in the available strength of the
slimes. The slimes deposited early during the ash pond history, have high water contents, unusually
high liquidity indices and relatively low undrained shear strengths as determined from strain controlled
undrained direct simple shear (CKU-DSS) and field vane shear tests by AECOM. A stress controlled
CKU-DSS creep test was preformed at the University of Massachusetts on a sample of the slimes and
the results indicated that undrained creep type failure of the slimes can occur at a stress levels
approaching 80% to 85% of the peak undrained strength.
4. Loose Wet Ash - The initial loose, sluiced ash was deposited under water, with a resulting high void
ratio and with little benefit from consolidation or densification under the surcharge weight of ash placed
above the initial deposits. As a result, the ash remained very loose and became highly contractive,
leading to low undrained shear strength with a very sensitive structure (low strain at peak shear
strength). AECOM quantified the loose nature of unfailed ash under the remaining sections of the
dredge cells. Extensive testing was done on loose ash by AECOM at void ratios at or higher than those
measured in the field in unfailed ash. Undrained behavior in the metastable ash requires less than 0.5%
shear strain to reach peak strengths in both triaxial compression and extension tests. If cell loading
stresses exceed the peak undrained shear strength the available strength decreases rapidly towards an
undrained steady state shear strength which may be as low as 100 psf.

AECOM
K:\PROJECTS\60095742 - TVA\Final\FINAL Revisions\Volume 1\completed\FINAL-062509-Failure_Analysis_Report_VolI-rev.doc
82
The failure occurred four days after the last date that dredging from the Ash Collection Cell to Dredge Cell 2
took place. The failure was sudden, complex and the reason for failure was likely the result of creep of the
slimes due to active loading (e.g., 4.0 to 6.1 feet/year) in Dredge Cell 2, which in turn triggered the undrained
behavior of the ash and the associated large decrease in available strength. It was further aggravated by the
fact that Upstream Dikes A through D2 were built on wet loose ash with limited containment. The slime layer at
the base of loose wet ash is very thin, less than 6 inches thick. It took an extensive forensic type study to locate
the slime layer and measure its properties. Extensive void ratio data in unfailed areas of the Dredge Cells
showed a lack of significant consolidation of the loose wet ash with depth. In AECOM’s opinion the foundation
slimes and wet ash that shows no significant reduction of void ratio with depth were latent conditions, were
highly unusual, and rarely encountered. The consequence of failure in the slimes and undrained behavior of the
loose wet ash led to collapse of the dredge cell and loss of the saturated loose ash contents by flow slide
liquefaction. From AECOM’s review of the records and our observations the failure took place over a period of
approximately one hour. It was a very sudden and dramatic failure, with each successive slide causing rapid
movements of the failing mass, with some delay in between slides leading to the total duration of the event of
about one hour. In our opinion, the initial of failure of the Northwest Cell 2 and then the Dike C breach only
taking several minutes, as evidenced by the high water marks on the north hillside due to the dramatic 47-foot
flood wave caused by the rapid failure of Dike C and its clay foundation.
Initially the study focused on sliding in native clay alluvium that underlies the site and on static liquefaction
failure of the loose ash which was activity being loaded in Cell 2 as the two primary failure modes. However,
after viewing photographs of the failure plane in several Osterberg tube samples from under Cell 2, namely
samples from borings 09-101B, 09-104B, and 09-500B, it became apparent that the slide plane passed through
the loose ash and reached the deep soft slime layer that caused initial instability.
AECOM also reviewed why the steeper exterior sloped Phase1 Emergency Dredge Cell did not experience a
static liquefaction failure when it was loaded from 2004 through late 2006 with an average filling rate of 14.6 feet
per year based on TVA topographic surveys. The filling rate into Cell 2 in late 2008 was in the range of 4.0 to
6.1 feet per year, less than the 2004 to 2006 Phase 1 Emergency Dredge Cell filling rate. AECOM was
compelled to determine why the rapidly loaded Phase 1 Emergency Dredge Cell adjacent to the open water Ash
Collection Pond did not fail by static liquefaction. The only difference between the North Cell 2 and the Phase 1
Emergency Dredge Cell is that there were there soft slimes under North Cell 2 that were not present under the
Phase I Emergency Cell. Therefore, it can be concluded that the actively loaded Cell 2 founded on liquefiable
ash over creep susceptible slimes were the contributing causes of failure on December 22, 2008.
AECOM also reviewed post-failure conditions along the west side of Cell 2 and concluded that slides were
shallow above an intact Dike B, Swan Pond and railroad fill. Instability of ash behind and under the west slopes
of Cell 1 and 2 failed resulting in loss of support of the upstream dikes above El. 765. Failure of Cell 1 and 2
dikes along the west side were a consequence of north side Cell 2 dike failures.

AECOM
K:\PROJECTS\60095742 - TVA\Final\FINAL Revisions\Volume 1\completed\FINAL-062509-Failure_Analysis_Report_VolI-rev.doc
83
Failures of structural systems are typically complex and have numerous factors involved that are not fully
quantifiable or duplicated. It is likely that most failures are site specific and set in motion by decisions made
decades ago. It is certainly fitting to quote the late Dr. George Sowers (1979), one of the most talented local
geotechnical engineers in the southeast United States, who opined on the cause of slope failure as:
“In most cases, several ‘causes’ exist simultaneously; therefore, attempting to decide which one finally
produced failure is not only difficult but also technically incorrect. Often the final factor is nothing more
than a trigger that sets a body in motion that was already on the verge of failure. Calling the final factor
the cause is like calling the match that lit the fuse that detonated the dynamite that destroyed the
building the cause of the disaster.”
Figure 1.8_1 is attached showing the relationship of four primary contributing factors that existed at the north
end of the Dredge Cell 2. The failure on December 22, 2008 depended on all four factors, without them working
in combination, the failure of Dredge Cell 2 would have not likely occurred on this date.
Figures 1.8._2 through 1.8._7 show in plans and sections AECOM’s concept of how the loose wet fly ash
liquefied and flowed north into the sloughs and waterways at lower elevations. It is likely the failure started as a
wedge block or translational mass that slid over the weak foundation slime layer at the north end of site under
Dredge Cell 2. AECOM is confident of the four identified failure modes at the north end of Dredge Cell 2, as
computational instability was demonstrated using measured material strengths and fill geometries to show a
progressive failure sequence at this active dredge cell. Computations also show northwest dike slope stability at
Cell 2 to be less stable than the west face of Dredge Cell 2 dike slope and less stable than the east face dike
slope of the Phase 1 Emergency Dredge Cell.
After the initial sudden failure there was a sequential series of liquefaction (flow) slides caused by the rapid
loading of the ash and its consequential loss in strength. The sequential failures moved gradually southward and
stopped when they reached a former divider dike within Cell 1. It is readily apparent that the Swan Pond Road
and railroad fills channeled flow slide debris without evidence of failure to their foundations. The overall failure
took place in less than one hour but the material involved at the north end of Cell 2 and the subsequent Dike C
failure occurring relatively fast, as indicated by the 45-foot high water wave that occurred when Dike C was
pushed against the north hillside by liquefied ash. The wet ash contents flowed out of the containment system
until enough energy was lost to attain a final angle of repose of the liquefied ash of less than 1/2 degree.
AECOM
K:\PROJECTS\60095742 - TVA\Final\FINAL Revisions\Volume 1\completed\FINAL-062509-Failure_Analysis_Report_VolI-rev.doc
84
1.9 References 1.9.1 TVA Documents Reviewed Documents Cited Kingston Fossil Plant, Monitoring Wells Installation, January 2005
Landfill Permitting or Closure Study, 14 March 1994
Cost Estimate – Scope of Work
Letter from TDHE, 24 October 1990
Operations Manual – Dredge Cell Lateral Expansion, Kingston Fossil Plant; IDL 73-0094; Volume II, 1 June
2004, Revised May 2006
Operations Manual – Dredge Cell Lateral Expansion, Kingston Fossil Plant; IDL 73-0094; Volume I, 1 June
2004, Revised 20 March 2006
Drawing ION421, 20 May 1976, Ash Pond Dike, Section & Details (superseded by IOW421R3; date 24 February
2003)
Drawing ION422R1, 20 May 1976, Ash Pond Spillway
Drawing ION423R0, 20 May 1976, Weir for Ash Disposal Spillway
Kingston Steam Plant Dike C, 10 January 1985
Kingston Steam Plant Dike C Soils Investigation on EN DES Soil Schedule 82.3, 22 June 1984
Singleton Laboratories – Kingston Fossil Plant Dredge Cells/Closure Soil Investigation, 29 September 1994
Volumes I and II
Kingston Steam Plant Ash Disposal Area Dikes Raising Soils Investigation Report, 3 November 1975 and
Evaluation of Report
Kingston Steam Plant Acidic Drain & Hot H20 Studies September 1985
Engineering Peer Review of Coal Byproduct Disposal Plans, GeoSyntec Consultants, no Date

AECOM
K:\PROJECTS\60095742 - TVA\Final\FINAL Revisions\Volume 1\completed\FINAL-062509-Failure_Analysis_Report_VolI-rev.doc
85
Miscellaneous info including internal memos from post spill - also include memos regarding previous breach in
1993
Kingston Dredge Cell Calcs, Hydraulic Calcs, Stability Calcs 1995
Kingston Fossil Plant, Dredge Cells & Closure, Additional Laboratory Testing, 31 May 1995, Singleton
Bottom Ash Drainage Layers Memo, Dredge Cell Lateral Expansion Kingston Fossil Plant, GeoSyntec 18 June
2007
Kingston Environmental Assessment for Fly Ash Disposal, Carpenter & Bohge, No Date
Kingston Ash Disposal Facility, Response to GeoSyntec Consultants’ Review Comments, Parsons
Field Density Test Results & Record of Site Visits MACTEC, 5 April 2007
Report of Geotechnical Laboratory Testing of Geotextile Composite Material, MACTEC, 25 January 2006
Report of Monitoring Well Installation, Dredge Cell Dike Restoration, MACTEC, 16 September 2005
Report of Geotechnical Exploration, Monitoring Well Installation, Ash Disposal Area, MACTEC, 23 February
Drawings – Closure/Post Closure Plan Ash Pond Area, Vol. 2, September 1995
Documents – Closure/Post Closure Plan Ash Pond Area, September 1995, revised April 1998
Preliminary Geological Investigations for Eastern Area Steam Plant, Benziger & Kellberg, February 1951
Unfiled Drawings (PDF format) TVA 00000217-219 Proposed Design Drawings from 1951 and 1952
TVA 00000220-222, 000013630-3651, 000013777-3785 Study and Proposed Design drawings for potential
FGD Storage/Disposal made in 2005
TVA 00000223-225 Acidic Drainage drawings from 1983
TVA 00000226-227 Project Layout drawings from 1984
US Army War Department, Topographic Map of Clinch and Emory River Valleys, Sheet C1 or E1, 1924.

AECOM
K:\PROJECTS\60095742 - TVA\Final\FINAL Revisions\Volume 1\completed\FINAL-062509-Failure_Analysis_Report_VolI-rev.doc
86
Annual Inspections
TVA 00023703 January 12, 2009, Kingston Fossil Plant – Annual Ash Pond Dike Stability Inspection – FY 2009,
Prepared by Chris Buttram
TVA 00013789 January 31, 2008, Kingston Fossil Plant – Annual Ash Pond Dike Stability Inspection – FY 2008,
Prepared by Jamey Dotson
TVA 00005701 February 26, 2007, Kingston Fossil Plant – Annual Ash Pond Dike Stability Inspection – FY
2007, Prepared by John Albright and Jeff Gray, January 31, 2007.
TVA 00005684 – March 29, 2006, Kingston Fossil Plant – Annual Ash Pond Dike Stability Inspection, Prepared
by Michael S. Hughes
TVA 00005671 – January 26, 2005, Kingston Fossil Plant (KIF) – Annual Stability Inspection of Waste Disposal
Area Dikes, Prepared Sherman G. Garrett, December 13, 2004
TVA 00005653 – March 1, 2004, Kingston Fossil Plant (KIF) – Annual Ash Pond Dike Stability Inspection,
Prepared by John Albright and Jeff L. Gray, February 24, 2004
TVA 00005637 – December 3, 2002, Kingston Fossil Plant (KIF) – Annual Ash Pond Dike Stability Inspection,
Prepared by John Albright, October 25, 2002
TVA 00005621 – December 12, 2001, Kingston Fossil Plant (KIF) – Annual Ash Pond Dike Stability Inspection,
Prepared by John Albright, November 9, 2001
TVA 00005610 – March 5, 2001, Kingston Fossil Plant – Annual Inspection of Waste Disposal Areas, Prepared
by John Albright and Victor Davis
December 12, 2000, Kingston Fossil Plant (KIF) – Annual Ash Pond Dike Stability Inspection, Prepared by
Sherman G. Garrett, December 12, 2000
TVA 00005597 – March 29, 2000, Kingston Fossil Plant (KIF) – Annual Inspection of Waste Disposal Areas,
Prepared by Sherman G. Garrett
TVA 00005947April 16, 1999, Kingston Fossil Plant (KIF) – Annual Inspection of Waste Disposal Areas,
Prepared by Cherie Minghini
TVA 00005937 – April 29, 1998, Kingston Fossil Plant (KIF) – Annual Inspection of Waste Disposal Areas,
Prepared by Keith Elder, April 28, 1998
TVA 00005920 – April 14, 1997, Kingston Fossil Plant (KIF) – Annual Inspection of Waste Disposal Areas,
Prepared by Cherie Minghini, April 10, 1997
TVA 00005908 – April 26, 1996, Kingston Fossil Plant (KIF) – Annual Inspection of Waste Disposal Areas,
Prepared by K.W. Burnett and C M Minghini

AECOM
K:\PROJECTS\60095742 - TVA\Final\FINAL Revisions\Volume 1\completed\FINAL-062509-Failure_Analysis_Report_VolI-rev.doc
87
TVA 00005900 – May 3, 1995, Kingston Fossil Plant (KIF) – Annual Fossil Engineering Inspection of Ash
Disposal Areas, Prepared by C.L. Mount and K.W. Burnett
TVA 00005892 – May 19, 1994, Kingston Fossil Plant (KIF) –Inspection of the Ash Disposal Areas, Prepared by
K.W. Burnett
TVA 00005883 – September 30, 1993, Prepared by J D Paris and Ralph G Johnson
TVA 00005870 – September 28, 1990, Prepared by J D Paris and J H Coulson
TVA 00005860 – May 24, 1988 by R E Harris
TVA 00005851 – June 4, 1987, Kingston Steam Plant – Annual Joint Power Engineering and Fossil and Hydro
Power Inspection of the Ash Disposal Area. by D R Galloway and W M Bivens
TVA 00005842 – May 27, 1986 by D R Galloway and W M Bivens
TVA 00005830 – July 11, 1985, Kingston Steam Plant – Annual Joint Inspection of the Ash Disposal Areas by
OE and F&H PR, Prepared by R D Powerll and R G Domer
TVA 00005820 – September 12, 1984, Inspection of the Kingston Steam Plant Ash Disposal Area, Prepared by
D R Galloway and R G Domer
TVA 00005814 – September 22, 1983, Kingston Steam Plant – Annual Ash Disposal Area Inspection, Prepared
by D R Galloway and M N Sprouse
TVA 00005806 – August 25, 1982, Kingston Steam Plant – Annual Ash Disposal Area Inspection, Prepared by
M N Sprouse and I.L. Burroughs
TVA 00005798 – September 24, 1981, Kingston Steam Plant – Annual Ash Disposal Area Inspection, Prepared
by C L Buchanan and Frank Stansberry
TVA 00005790 – October 14, 1980, Kingston Steam Plant – Annual Ash Disposal Area Inspection, Prepared by
Joseph Touchton and M N Sprouse
TVA 00005782 – November 1, 1979, Kingston Steam Plant – Annual Ash Disposal Area Inspection, Prepared
by Roy H. Dunham and F.P. Lucy
TVA 00005778 – September 25, 1978, Kingston Steam Plant – Annual Ash Disposal Area Inspection, Prepared
by Larry Wall and J P Hillier Stivers
TVA 00005777 – Note stating 1977 Inspection deferred until 1978
September 27, 1976, Kingston Steam Plant – Annual Ash Disposal Area Inspection, Prepared by JP Hillier
Stivers
TVA 00005764 – August 27, 1976, Kingston Steam Plant – Raising of Ash Disposal Area Dikes – Installation of
New Spillways – Foundation Improvements by Oliver Raine and JP Hillier Stivers

AECOM
K:\PROJECTS\60095742 - TVA\Final\FINAL Revisions\Volume 1\completed\FINAL-062509-Failure_Analysis_Report_VolI-rev.doc
88
TVA 00005771 – Duplicate of above
September 23, 1975, Kingston Steam Plant – Annual Ash Disposal Area Inspection, Prepared by FP Hillier
Stivers
TVA 00005758 – TVA 00005741 October 1, 1974, Kingston Steam Plant – Annual Ash Disposal Area
Inspection, Prepared by J P Hillier Stivers and F.P. Lacy
TVA 00005753 – October 2, 1973, Kingston Steam Plant – Annual Ash Disposal Area Inspection, Prepared by
F.P. Lacy and Roy H. Dunham
TVA 00005748 – September 1972, Kingston Steam Plant – Annual Ash Disposal Area Inspection, Prepared by
JR Parrish
September 19, 1972, Kingston Steam Plant – Annual Ash Disposal Area Inspection, Prepared by JR Parrish
September 28, 1971, Kingston Steam Plant – Annual Ash Disposal Area Inspection, Prepared by JR Parrish
TVA 00005735 – November 5, 1970, Kingston Steam Plant – Annual Pond Dike Inspection, Prepared by JR
Parrish
November 5, 1970, Kingston Steam Plant – Annual Ash Pond Dike Inspection, Prepared by JR Parrish
TVA 00005723 – February 3, 1970, Kingston Steam Plant – Annual Ash Dike Inspection, Prepared by JR
Parrish
TVA 00005720 – October 24 1968, Kingston Steam Plant – Ash Dikes, Prepared by WN Calvert
TVA 00005710 – July 12, 1967 by (not readable)
Ash Pond Consultant Investigative Reports
ByProduct Disposal-Path Forward - taking Geosyntec Peer Review and move forward 1-Dec-2004
Engineering Peer Review of Coal Byproducts Disposal Plans GeoSyntec Consultants 1-Nov-2004
Quality Assurance Procedure TVA 26-Apr-1994
Corrective Action Documents
Management Review Committee- KIF Dredge Cell Failure - 2006 2006 TVA Corrective Action Program- PER Detail Report - KIF Dredge Cell Dike Leakage TVA 21-Jan-2009
AECOM
K:\PROJECTS\60095742 - TVA\Final\FINAL Revisions\Volume 1\completed\FINAL-062509-Failure_Analysis_Report_VolI-rev.doc
89
Correspondence
Plont & Cook Paula & Larry Proposed Modification to approved construction and operations plans
TN Dept of Environment & Conservation 22-Feb-2005
Purkey R.E. Dry Fly Ash Collection - Design & Install New Fly Ash Handling System TVA 11-Dec-2003
Scope of Work / Cost Estimate - Relocate Ash Pond Discharge TVA 22-Mar-1990
Daily Inspections
Daily Monitoring Log TVA 1/5/02 to 1/13/09
TVA Drawing Series 10N400 through 10W425 (Parsons After 2004)
General 4-Dec-1973
General Plan 8-May-1951
General Grading Coal Yard 30-Aug-1951
Ash Disposal Area 8-Aug-1951
Plan-Raising Ash Disposal Area Dike 20-May-1976
Section 8 Details 20-May-1976
Ash Disposal Spillway 20-May-1976
Weir for Ash Disposal Spillway 20-May-1976
Ash Disposal Area Divider Dike & Floating Boom 23-Sep-1977
General Plan 28-Apr-1981
Concrete Ash Sluice Pipe Trench & Supports Outline & Reinforcement - SH 1 17-Apr-1953
Concrete Ash Sluice Pipe Trench & Supports Outline & Reinforcement - SH 2 17-Apr-1953
Site Details 12-Aug-2002
Wetlands Closure Plan 19-Dec-2002
Concrete Diversion Flume -Outline & Reinforcing Sh 1 15-Feb-1991
Concrete Diversion Flume -Outline & Reinforcing Sh 2 15-Feb-1991
Concrete Diversion Flume -Outline & Reinforcing Sh 3 15-Feb-1991
Section and Details 20-May-1976
Ash Disposal Area Lateral Expansion Weir & Skimmer Details 13-Oct-2005
Ash Pond Area Existing Contours (1994) No Date
Redwater Treatment Using Engineered Wetlands (Manmade) Sheet 1 28-Jul-1987
Abandoned Ash Pond Drainage Diversion Plan & Sections sh1 No Date
Abandoned Ash Pond Drainage Diversion Plan & Sections sh2 No Date
Intake channel Dike Plan & Section 19-Sep-1952
Dredge Cells Existing Contours and Stage A Plan 6-Apr-1998
Dredge Cells Typical Sections Stage A 6-Apr-1998
Dredge Cells Existing / Future Contours and Stage B Plan 6-Apr-1998
Dredge Cells Typical Section Stage B 6-Apr-1998
Dredge Cells Existing / Future Contours and Stage C Plan 6-Apr-1998

AECOM
K:\PROJECTS\60095742 - TVA\Final\FINAL Revisions\Volume 1\completed\FINAL-062509-Failure_Analysis_Report_VolI-rev.doc
90
Dredge Cells typical Sections Stages C D & E 6-Apr-1998
Dredge Cells Stage C Profile 6-Apr-1998
Dredge Cells Existing / Future Contours and Stage D Plan 6-Apr-1998
Dredge Cells Stage D Profile 6-Apr-1998
Dredge Cells Existing / Future Contours and Stage E Plan 6-Apr-1998
Dredge Cells Stage E Profile 6-Apr-1998
Dredge Cells Spillway / Skimmer Details 6-Apr-1998
Dredge Cells Cover Details and Schedule 6-Apr-1998
Dredge Cells Typical Drainage Details 6-Apr-1998
Dredge Cells Final Closure Contours 6-Apr-1998
Dredge Cells Cross-Section 16 6-Apr-1998
Dredge Cells Cross-Section 17 6-Apr-1998
Dredge Cells Equipment Routing and Haul Road Details 6-Apr-1998
Dredge Cell Lateral Expansion Site Location Plan 28-Apr-1981
Dredge Cell Lateral Expansion Phasing Sh 1 Undated (Parsons)
Dredge Cell Lateral Expansion Phasing Sh 2 Undated (Parsons)
Phase 1 Dredge Cell Lateral Expansion Development Plan Sh 1 Undated (Parsons)
Phase 1 Dredge Cell Lateral Expansion Development Plan Sh 2 Undated (Parsons)
Dredge Cell Existing Conditions & Drainage Sh 1 Undated (Parsons)
Dredge Cell Existing Conditions & Drainage Sh 2 Undated (Parsons)
Dredge Cell Existing Conditions & Drainage Sh 3 Undated (Parsons)
Dredge Cell Existing Conditions & Drainage Sh 4 Undated (Parsons)
Dredge Cell Existing Conditions & Drainage Sh 5 Undated (Parsons)
Dredge Cell Existing Conditions & Drainage Sh 6 Undated (Parsons)
Dredge Cell Existing Conditions & Drainage Sh 7 Undated (Parsons)
Dredge Cell Existing Conditions & Drainage Sh 8 Undated (Parsons)
Dredge Cell Lateral Expansion Stage 1 - Sh 1 Undated (Parsons)
Dredge Cell Lateral Expansion Stage 1 - Sh 2 Undated (Parsons)
Dredge Cell Lateral Expansion Stage 1 - Sh 3 Undated (Parsons)
Dredge Cell Lateral Expansion Stage 1 - Sh 4 Undated (Parsons)
Dredge Cell Lateral Expansion Stage 2 - Sh 1 Undated (Parsons)
Dredge Cell Lateral Expansion Stage 2 - Sh 2 Undated (Parsons)
Dredge Cell Lateral Expansion Stage 2 - Sh 3 Undated (Parsons)
Dredge Cell Lateral Expansion Stage 2 - Sh 4 Undated (Parsons)
Dredge Cell Lateral Expansion Stage 3 - Sh 1 Undated (Parsons)
Dredge Cell Lateral Expansion Stage 3 - Sh 2 Undated (Parsons)
Dredge Cell Lateral Expansion Stage 3 - Sh 3 Undated (Parsons)
Dredge Cell Lateral Expansion Stage 3 - Sh 4 Undated (Parsons)
Dredge Cell Lateral Expansion Stage 3 - Sh 5 Undated (Parsons)
Dredge Cell Lateral Expansion Stage 3 - Sh 6 Undated (Parsons)
Dredge Cell Lateral Expansion Stage 4 - Sh 1 Undated (Parsons)
Dredge Cell Lateral Expansion Stage 4 - Sh 2 Undated (Parsons)
Dredge Cell Lateral Expansion Stage 4 - Sh 3 Undated (Parsons)
AECOM
K:\PROJECTS\60095742 - TVA\Final\FINAL Revisions\Volume 1\completed\FINAL-062509-Failure_Analysis_Report_VolI-rev.doc
91
Dredge Cell Lateral Expansion Stage 4 - Sh 4 Undated (Parsons)
Dredge Cell Lateral Expansion Stage 4 - Sh 5 Undated (Parsons)
Dredge Cell Lateral Expansion Stage 4 - Sh 6 Undated (Parsons)
Dredge Cell Lateral Expansion Stage 5 - Sh 1 Undated (Parsons)
Dredge Cell Lateral Expansion Stage 5 - Sh 2 Undated (Parsons)
Dredge Cell Lateral Expansion Stage 5 - Sh 3 Undated (Parsons)
Dredge Cell Lateral Expansion Stage 5 - Sh 4 Undated (Parsons)
Dredge Cell Lateral Expansion Stage 6 - Sh 1 Undated (Parsons)
Dredge Cell Lateral Expansion Stage 6 - Sh 2 Undated (Parsons)
Dredge Cell Lateral Expansion Stage 6 - Sh 3 Undated (Parsons)
Dredge Cell Lateral Expansion Stage 6 - Sh 4 Undated (Parsons)
Dredge Cell Lateral Expansion Sections Sh 1 Undated (Parsons)
Dredge Cell Dredged Fly Ash/Dry Fly Ash Disposal Option Sections Sh 2 Undated (Parsons)
Dredge Cell Dredged Fly Ash/Dry Fly Ash Disposal Option Sections Sh 1 Undated (Parsons)
Dredge Cell Lateral Expansion Ph 2/3 Typical Cross Section & Details Undated (Parsons)
Dredge Cell Lateral Expansion Details Sh 1 Undated (Parsons)
Dredge Cell Lateral Expansion Details Sh 2 Undated (Parsons)
Dredge Cell Lateral Expansion Ph 2/3 Typical Cross Section & Details Undated (Parsons)
Dredge Cell Lateral Expansion Details - Wet Cast Gypsum Dike Raising Sh 4 Undated (Parsons)
Dredge Cell Lateral Expansion Ditch Details & Misc Details Sh 1 Undated (Parsons)
Dredge Cell Expansion Type Sections -Fly Ash Option Stages 1-5 Undated (Parsons)
Existing Dredge Cell Underdrain Installation on Existing Slope El 760-795 Undated (Parsons)
Dredge Cell Lateral Expansion Compacted Clay Details Final Cover Undated (Parsons)
Dredge Cell Lateral Expansion Geocomposite Undated (Parsons)
Dredge Cell Lateral Expansion Final Cover Drainage Plan & Schedule 9-Jun-2004
Dredge Cell Weir Replacement Overall Plan 16-Feb-2005
Dredge Cell Weir Replacement Final Dike & Weir Layout 16-Feb-2005
Dredge Cell Weir Replacement Initial Dike Layout 16-Feb-2005
Dredge Cell Weir Replacement Cross Sections & Details 16-Feb-2005
Ash Pond Area Final Closure Contours 6-Apr-1998
Dredge Cells Existing Contours and Stage A Plan Undated (Parsons)
Dredge Cell Lateral Expansion Index and Legend Undated (Parsons)
Phase 1 Dredge Cell Lateral Expansion Development Plan Sh 1 Undated (Parsons)
Ash Disposal Area Lateral Expansion Weir & Skimmer Details Undated (Parsons)
Dredge Cell Weir Replacement Overall Plan Undated (Parsons)
Dredge Cell Weir Replacement Initial Dike Layout Undated (Parsons)
Dredge Cell Weir Replacement Final Dike & Weir Layout Undated (Parsons)
Dredge Cell Weir Replacement Cross Sections & Details Undated (Parsons)
Existing Conditions General Notes Legend & Draining Index Undated (Parsons)
Dredge Cell Lateral Expansion Site Location Plan Undated (Parsons)
Dredge Cell Dike Restoration Plan Sh 1 Undated (Parsons)
Dredge Cell Dike Restoration Plan Sh 2 Undated (Parsons)
Dredge Cell Dike Restoration Plan Sh 3 Undated (Parsons)

AECOM
K:\PROJECTS\60095742 - TVA\Final\FINAL Revisions\Volume 1\completed\FINAL-062509-Failure_Analysis_Report_VolI-rev.doc
92
Dredge Cell Dike Restoration Plan Sh 4 Undated (Parsons)
Dredge Cell Dike Restoration Plan Sh 5 Undated (Parsons)
Dredge Cell Dike Restoration Section & Detail Sh 1 Undated (Parsons)
Dredge Cell Dike Restoration Section & Detail Sh 2 Undated (Parsons)
Dredge Cell Dike Restoration Section & Detail Sh 3 Undated (Parsons)
Dredge Cell Dike Restoration Details Sh 1 Undated (Parsons)
Dredge Cell Dike Restoration Ditch Profiles Undated (Parsons)
Dredge Cell Dike Restoration Borrow Pit Area Undated (Parsons)
Ash Pond Area Closure/Post Closure Plan 6-Apr-1998
Main Ash Complex Undated (Parsons)
Main Ash Complex Undated (Parsons)
Main Ash Complex Undated (Parsons)
Main Ash Complex Undated (Parsons)
Main Ash Pond Undated (Parsons)
Main Ash Pond Undated (Parsons)
Main Ash Complex Undated (Parsons)
Main Ash Complex Undated (Parsons)
Main Ash Complex Undated (Parsons)
Main Ash Complex Undated (Parsons)
Main Ash Pond Undated (Parsons)
Main Ash Pond Undated (Parsons)
Main Ash Pond Undated (Parsons)

AECOM
K:\PROJECTS\60095742 - TVA\Final\FINAL Revisions\Volume 1\completed\FINAL-062509-Failure_Analysis_Report_VolI-rev.doc
93
Geotechnical Reporting
Dredge Cells / Closure Soil Investigation United Energy Services Corp. / Singleton Laboratories 29-Sep-1994
Report of Geotechnical Exploration MACTEC 4-May-2004 Closure/Post Closure Plan Ash Pond Area TVA 1-Jul-1995 Closure/Post Closure Plan Ash Pond Area TVA 1-Sep-1995 Monitoring Wells Installation 1-Jan-2005 Seepage Analysis Summary Report Parsons E & C 1-May-2005
Supplementary Soil Borings & Soil Permeability Evaluation Ground Engineering & Testing Service, Inc.
Engineering Peer Review of Coal Byproducts Disposal Plans GeoSyntec Consultants 1-Nov-2004 Soils Investigation Report & Evaluation of Report - Ash Disposal Area Dikes Raising (partial) 3-Nov-1975 Portions of MACTEC Report MACTEC 4-May-2004 Portions of report re; borrow areas A B C 12-Nov-1975
Dike C Singleton Materials Engineering Laboratory 10-Jan-1985
Preliminary Geological Investigations for Eastern Area Steam Plant TVA 1-Feb-1951 Report of Geotechnical Exploration Monitoring Wells Installation MACTEC 23-Feb-2005 Report of Geotechnical Exploration - Ash Disposal Area MACTEC 4-May-2004 Report of Monitoring Well Installation MACTEC 16-Sep-1994
Operations Manuals
Minor Permit Modification -Ash Landfill TVA - 5D Outlook Place 15-Mar-2006
Hydrogeologic Evaluation of Coal Combustion Byproduct Disposal Facility Expansion
TVA - River System Operations & Environment 1-Nov-2004
Operations Manual Dredge Cell Lateral Expansion V1 6/4/04 revised TVA - Fossil Engineering Services 1-Jul-2006
Operations Manual Dredge Cell Lateral Expansion V2 6/4/04 revised TVA - Fossil Engineering Services 1-May-2006
Operations Manual Dredge Cell Lateral Expansion V2 6/1/04 revised TVA - Fossil Engineering Services 1-Jun-2004
Operations Manual Dredge Cell Lateral Expansion TVA - Fossil Engineering Services 1-Jul-2006
Approval Letter - Drainage Structure Design Dept of Environment & Conservation 20-Mar-2006
Operations Manual- Parsons Engineering Proposed Major Modification IDL 73-0094 TVA 1-Jun-2004
Operations Manual- Parsons Engineering Proposed Major Modification IDL 73-0095 (Continued) TVA 1-Jun-2004
Operations Manual- Parsons Engineering Proposed Major Modification IDL 73-0095 (Continued) TVA 1-Jun-2004
Operations Manual- Parsons Engineering Proposed Major Modification IDL 73-0095 (Continued) TVA 1-Jun-2004

AECOM
K:\PROJECTS\60095742 - TVA\Final\FINAL Revisions\Volume 1\completed\FINAL-062509-Failure_Analysis_Report_VolI-rev.doc
94
TVA Documents from TDEC Production Information http://tva.gov/kingston/tdec/index.htm
Appendix F- Work plan Groundwater Monitoring TVA 29-Apr-1994
Appendix G - Slope Stability Evaluation & Recommendations Parsons 26-May-2004
Appendix I - QA/QC Plan TVA 7-Jun-2004
Appendix A - Soil Boring Logs MACTEC 4-May-2004
Appendix B - Monitoring Well Diagrams Law Eng & Env 4-May-2004
Appendix D - Tabulated Groundwater Level Data for Selected Monitoring Wells 14-Jun-2004
Appendix E - Hydrogeologic Evaluation of Ash Pond Area TVA 1-Nov-2004
3 pages from a report unnamed
Figure 2-1 Site Geologic map
Figure 2-2 Top of Rock Elevation Map through Figure 2-7 Groundwater Surface
remaining report text with figures
Appendix F - Facility Subregions and Profiles for Seepage Model Simulations Appendix G - Option B - Facility Subregions and Profiles for Seepage Model Simulations
Appendix H - Option A - Leachate Seepage and COC Mass Loading Estimates
Appendix I - Option B - Leachate Seepage and COC Mass Loading Estimates Appendix J - Selected Groundwater Quality Data for Monitoring Wells 4A 4B 5 5A and 5B
Appendix A - TVA Vegetation Specifications
Powerpoint by Parsons E &C analysis to support proposed dredge cell repair 1-Apr-2005
Dredge Cell Restoration - Pond for Detention of 25 yr storm event Parsons 26-Apr-2005
same as above Attachment C - Seepage Flows Parsons 26-Apr-2005
Appendix C - Groundwater Sample collection Techniques and QA Procedures
Drawings
Description of Principle Design Features
Closure/ Post Closure Plan Ash Pond Area TVA 1-Sep-1995
Proposed Dredge Cell Repair Supporting Information TVA 26-Apr-2005 Summary handout - TDEC/TVA Meeting April 27, 2005 Kingston Dredge Cell Repair Minor Modification Request TVA 27-Apr-2005 Ash Stacks Proposed Dredge Cell Restoration Supporting Information, TVA, April 2005

AECOM
K:\PROJECTS\60095742 - TVA\Final\FINAL Revisions\Volume 1\completed\FINAL-062509-Failure_Analysis_Report_VolI-rev.doc
95
TVA Drawings
Coal-Combustion By-Product (Ash) Undated Coal-Combustion By-Product (Ash), Existing Site Plan Undated Coal-Combustion By-Product (Ash), Proposed Bench and Drainage Ditch Regrade and Underdrain Extensions Undated Coal-Combustion By-Product (Ash), Surface Water Downdrain Details Undated Coal-Combustion By-Product (Ash), Ground Water Underdrain Details Undated Coal-Combustion By-Product (Ash), Drainage Bench Ditch Details Undated Coal-Combustion By-Product (Ash), Bench 1 Cross Sections Details Undated Coal-Combustion By-Product (Ash), Bench 2 Cross Sections Details Undated Coal-Combustion By-Product (Ash), Bench 3 Cross Sections Details Undated Coal-Combustion By-Product (Ash), Bench 4 Cross Sections Details Undated
Palo, G.P., The Kingston Steam Plant – A report on the Planning, Design, Construction, Costs and First Power
Operations – Technical Report No. 34, TVA Knoxville, TN 1965
KIF Solid Waste Permit Operations Manuals – Volume 1 and 2 1995, revised 1998
Operations Manuals – Volume 1 and 2 2004, revised 2006
Water Permits Comments on Draft Permit, June 30, 2003
Application for Renewal, December 20, 2002
Renewed Permit Transmittal, September 9, 2003
Notification of Mexel 432/0 Study for Improved Condenser Performance, TDEC, April 30, 2008
Toxicity Testing of Outfall 002, CTR 2L-M, August 25, 2208
Submission of 316(B) Biological Monitoring Data, TVA, January 2, 2008
Kingston Fossil Plant Spillway (Weir) Certification, CTR 2L-M, July 3, 2008
Regulatory Inspection Summary, TVA, February 3, 2006
Regulatory Inspection Summary, TVA, November 9, 2006
Toxicity Testing of Outfall 002, CTR 2L-M, August 25, 2008
DMR-QA Study, TVA, October 17, 2008
Discharge Monitoring Report-November 2008, TVA, December 8, 2008
Discharge Monitoring Report-December 2007, TVA, January 11, 2008
Red Water Seep Inspection Annual Report, TVA, January 11, 2008
Water Withdrawal Annual Update, TVA, January 22, 2008
Discharge Monitoring Report-January 2008, TVA, February 7, 2008
Discharge Monitoring Report-February 2008, TVA, March 5, 2008
Discharge Monitoring Report-March 2008, TVA, April 3, 2008
Discharge Monitoring Report-April 2008, TVA, May 8, 2008
Discharge Monitoring Report-May 2008, TVA, June 5, 2008

AECOM
K:\PROJECTS\60095742 - TVA\Final\FINAL Revisions\Volume 1\completed\FINAL-062509-Failure_Analysis_Report_VolI-rev.doc
96
Discharge Monitoring Report-June 2008, TVA, July 7, 2008
Discharge Monitoring Report-July 2008, TVA, August 7, 2008
Biomonitoring Report, TVA, September 8, 2008
Discharge Monitoring Report-August 2008, TVA, September 8, 2008
Discharge Monitoring Report-September 2008, TVA, October 7, 2008
DMR-QA Study 28 Data Reporting Forms, TVA, August 28, 2008
Red Water Seep Inspection Annual Report, TVA, February 6, 2003
Dike Inspection Annual Report, TVA, February 19, 2002
Application for Renewal, TVA, December 20, 2002
Renewed Permit Transmittal, TVA, September 9, 2003
TVA Correction Action Program, TVA, June 16, 2006
Compliance Toxicity Testing of Outfall 002 – February 2002, TVA, April 1, 2002
Discharge Monitoring Report-July 2002 (Correction), TVA, December 16, 2002
Discharge Monitoring Report-November 2002, TVA, December 16, 2002
Discharge Monitoring Report-January, May, July, August and October 2004 and January, February (2 Outfalls),
March, April, May, July, August, September, October, and November, 2005 – (Corrections), March 22, 2006
Discharge Monitoring Report-January, 2007, TVA, February 13, 2007
Discharge Monitoring Report-February, March, April, May, and June 2005 - (Correction), TVA, September 1,
2005
Peninsula Site – Hydrogeologic Evaluation of Coal-Combustion Byproduct Disposal Facility Kingston Fossil Plant – Peninsula Site Hydrogeologic Evaluation of Coal-Combustion Byproduct Disposal
Facility, TVA, October 2005
Rainfall Data Kingston Fossil 0712 Rainfall Data, 1/1/2008 to 1/1/2009, Spreadsheet
Worley Parsons Scanned Documents Backup Sewage Pump Station, Various Documents
Response to Request for Proposal to Assist in the Preparation of Construction Documents for a Coal
Combustion Byproduct Disposal Facility, Peninsula Site, Civil & Environmental Consultants, Inc., November 15,
2007
Construction Documents for Coal Combustion Byproduct Disposal Facility, Consolidated Technologies Inc.,
November 16, 2007
KIF Dredge Cell, Weir Closure Sketch, Augstu 14, 2007
KIF FGD Disposal, Calculation, September 21, 2007
Request for Proposal – To Provide Assistance in Permitting Various Fly ash Expansion Projects, TVA, October,
2007
Field Density Test Results and Records of Site Visits, MACTEC, April 5, 2007
Bottom Ash Drainage Layers, MACTEC, June 18, 2007
TVA-Kingston Fossil Plant and Bull Run Fossil Plant, Presentation to TDEC, TVA, December 5, 2007

AECOM
K:\PROJECTS\60095742 - TVA\Final\FINAL Revisions\Volume 1\completed\FINAL-062509-Failure_Analysis_Report_VolI-rev.doc
97
Report of Geotechnical Laboratory Testing of Geotextile Composite Material, TVA, January 25, 2006
Kingston Steam Plant April 1986, Photographs
Kingston Steam Plant, Spillway Relocation & Dike “C” Seepage Repairs, Various Documents, Drawings and
Sketches, Various Dates
Photographs, No caption, No date
Kingston Steam Plant, Red Water Discharge, TVA, March 20, 1986
Kingston Steam Plant-Dredge Cell Dike, Stability Analysis-Results, TVA, August 4, 1986
Kingston Steam Plant 1983, Photographs
Kingston Fossil Plant-Meeting on Ash Pond, TVA, April 15, 1986
Kingston Fossil Plant Dredge Cells/Closure-Additional Laboratory Testing, Singleton Laboratories, May 31, 1995
Correspondence, April 19, 2006
Report of Geotechnical Exploration, Monitoring Well Installation Ash Disposal Area, MACTEC, February 23,
2005
Report of Monitoring Well Installations, Dredge Cell Dike Restoration, MACTEC, September 16, 2005
Kingston Environmental Assessment for Fly Ash Disposal, Carpenter and Bohac, Unknown Date
Kingston Fossil Plant, Dredge Cells/Closure, Soil Investigation, Singleton Laboratories, September 29, 1994
Storm Water Permit Daily Rainfall Gauge Record, Handwritten, Various Dates
Kingston Fossil Plant, Effluent Cut-off Concentration Exceedance and Correction Actions, TVA, November 17,
2008
Kingston Fossil Plant-Tennessee Multi-Sector General Permit for Industrial Activity-TNR051787-Annual
Monitoring Report-2007, March 5, 2008
Kingston Fossil Plant, Effluent Cut-off Concentration Exceedance and Correction Actions, TVA, April 9, 2008
Kingston Fossil Plant, Effluent Cut-off Concentration Exceedance and Correction Actions, TVA, October 9, 2003
Kingston Fossil Plant, Effluent Cut-off Concentration Exceedance and Correction Actions, TVA, November 10,
2003
Kingston Fossil Plant, Effluent Cut-off Concentration Exceedance and Correction Actions, TVA, January 31,
2007
Kingston Fossil Plant, Effluent Cut-off Concentration Exceedance and Correction Actions, TVA, October 18,
2005
Kingston Fossil Plant, Effluent Cut-off Concentration Exceedance and Correction Actions, TVA, July 21, 2003
Kingston Fossil Plant-Tennessee Multi-Sector General Permit for Industrial Activity-TNR051787-Annual
Monitoring Report, February 24, 2006
Kingston Fossil Plant-Tennessee Multi-Sector General Permit for Industrial Activity-TNR051787-Annual
Monitoring Report-2006, February 2, 2007
Kingston Plant – NPDES Permit No. TN0005452 Discharge Monitoring Report (DMR)-February, June, August,
and September, 2004-(Correction), TVA, February 28, 2005
Use of Coal Combustion By-Product as Engineered Fills by LAW Engineering

AECOM
K:\PROJECTS\60095742 - TVA\Final\FINAL Revisions\Volume 1\completed\FINAL-062509-Failure_Analysis_Report_VolI-rev.doc
98
TVA-Kingston Ponded Fly Ash (Cell I) – Various Test Results, Undated TVA-Kingston Ponded Fly Ash (Cell III) – Various Test Results, No Date
TVA-Kingston Bottom Ash – From Pond – Various Test Results, No Date

AECOM
K:\PROJECTS\60095742 - TVA\Final\FINAL Revisions\Volume 1\completed\FINAL-062509-Failure_Analysis_Report_VolI-rev.doc
99
1.9.2 Technical References Cited by AECOM for RCA ASTM Standard D4428 / D4428M - 07 “Standard Test Methods for Crosshole Seismic Testing”, ASTM
International, West Conshohocken, PA, www.astm.org
ASTM Standards D422, D698, D854, D1140, D1556, D1587, D2113, D2166, D2216, D2435, D2487, D2573,
D2850, D3080, D3441, D4186, D4228, D4228M, D4254, D4318, D4767, D5186, and D5778 (various years of
revision). American Society for Testing and Materials International, West Conshohocken, Pennsylvania.
Benziger, Charles P. and Kellberg, John M., 1951, Preliminary Geological Investigation for Eastern Area Steam
Plant, Tennessee Valley Authority, Division of Water Control Planning, Geologic Branch, Knoxville, Tennessee.
Boggs, Mark J., P.G., et al., 1995, Hydrogeologic Evaluation of Ash Pond Area, Kingston Fossil Plant, Report
No. WR28-2-36-124, Tennessee Valley Authority Resource Group, Engineering Services, Norris Engineering
Laboratory.
Castro, G., Seed, R.B., Keller, T.O., and Seed, H.B. (1992) “Steady-State Strength Analysis of Lower San
Fernando Dam Slide”, Journal of Geotechnical Engineering, Vol. 118, No. 3, pp. 406-427, March 1992.
Casagrande, A. (1936). Characteristics of Cohesionless Soils Affecting the Stability of Earth Fills. Journal of
Boston Society of Civil Engineers, pp. 23, 257-276.
Duncan, J.M. and Wright, S.G. (2005). Soil Strength and Slope Stability, John Wiley & Sons, New Jersey, pp.
297.
GRL Engineers, Inc. report “Standard Penetration Test Energy Measurements”, dated March 3, 2009,
Isham, Tim, 2009, Personal communication.
Jefferies, M. and Been, K. (2006). Soil Liquefaction, Taylor & Francis, London, 479pp.
Lambe, T.W. and Whitman, R.V. (1969). Soil Mechanics, John Wiley & Sons, Inc., New York, 553 pp.
Land Acquisition Map, Map No. 10N39, TVA Maps and Surveys Division, 1940.
Louie, J, N., 2001, Faster, Better: Shear-wave velocity to 100 meters depth from refraction microtremor arrays:
Bulletin of the Seismological Society of America, v. 91, p. 347-364.

AECOM
K:\PROJECTS\60095742 - TVA\Final\FINAL Revisions\Volume 1\completed\FINAL-062509-Failure_Analysis_Report_VolI-rev.doc
100
Mebane, R. Allen, The Geology of the South Harriman Area, Roane County, Tennessee [master’s thesis],
University of Tennessee, December 1957.
Moore, James L., Finlayson, C. P., and Milici, R. C., 1993, Geologic Map and Mineral Resources Summary of
the Harriman Quadrangle, Tennessee. State of Tennessee Department of Environment and Conservation.
Natural Resource Conservation Service (NRCS) Web Soil Survey:
Http://websoilsurvey.nrcs.usda.gov/app/WebSoilSurvey.aspx
Naval Facilities Engineering Command (1986). Design Manual 7.02, Alexandria, Virginia, 234pp.
Olson, S.M. and Stark, T.D. (2002). Liquefied Strength Ratio for Liquefaction Flow Failure Case Histories,
Canadian Geotechnical Journal, pp. 39, 629-647.
Park, C.B., Miller, R.D., and Xia, J., 1999, Multichannel analysis of surface waves (MASW); Geophysics, 64,
800-808. [PDF available online, 1.3 MB]
Poole, Joe L., The Geology of the Harriman Quadrangle, Roane and Morgan Counties, Tennessee [master’s
thesis], University of Tennessee, August 1949.
Poulos, Steve J., (1981) “The Steady State of Deformation”, Journal of Geotechnical Engineering Division,
ASCE, 107, (GT5), May 5514-5562. Closure Discussion in 108 (GT8), August 1982.
Robertson, P.K. (1990). Soil Classification Using the Cone penetration test. Canadian Geotechnical Journal,
pp. 27, 1, 151-158.
Seed, H.B. (1987). Design problems in soil liquefaction. Journal of Geotechnical Engineering, ASCE, 113,
GT8, 827-845.
Seepage Modeling with SEEP/W™ 2007, GEO-SLOPE International Ltd., (2008), Third Edition.
Sowers, G.F. (1979). Introductory Soil Mechanics and Foundations: Geotechnical Engineering, MacMillan
Publishing Company, Inc., New York, p 572.
Stability Modeling with SEEP/W™ 2007, GEO-SLOPE International Ltd., (2008), Third Edition.
Swingle, George D., et al., 1966, Geologic Map of Tennessee, East-Central Sheet, State of Tennessee
Department of Environment and Conservation.

AECOM
K:\PROJECTS\60095742 - TVA\Final\FINAL Revisions\Volume 1\completed\FINAL-062509-Failure_Analysis_Report_VolI-rev.doc
101
Taylor, D.W. (1948). Fundamentals of Soil Mechanics, John Wiley & Sons, Inc., New York, 700 pp.
Terzaghi, K. and Peck, R.B. (1967). Soil Mechanics in Engineering Practice, 2nd Edition, John Wiley & Sons,
New York, 729 pp.
Terzaghi, K., Peck, R.B. and Mesri, G. (1996). Soil Mechanics in Engineering Practice, 3rd Edition, John Wiley &
Sons, New York, 549 pp.
The Kingston Steam Plant: A Report on the Planning, Design, Construction, Costs, and First Power Operations,
Technical Report No. 34 (a.k.a. TVA Brown Book, TVA 00020036), Tennessee Valley Authority, Knoxville,
Tennessee, 1965.
The United States Geologic Survey Earthquakes Hazards Program http://earthquake.usgs.gov/eqcenter/
(Individual files locate at urls: http://earthquake.usgs.gov/eqcenter/dyfi/events/se/hnw1110a/us/ and
http://earthquake.usgs.gov/eqcenter/dyfi/events/se/hnw1218a/us/)
The University of Memphis Center for Earthquake Research and Information (CERI)
http://www.ceri.memphis.edu/index.shtml
USACE No. 30, “Soil Sampling” (2000)
US Army Corps of Engineers, Engineering and Design, Slope Stability, EM 1110-2-1902, 31 October, 2003.
United States Department of the Interior Geologic Survey and TVA Maps and Surveys Division, Harriman
Quadrangle, Tennessee, 1941.
United States Department of the Interior Geologic Survey and TVA Maps and Surveys Division, Harriman
Quadrangle, Tennessee, 1952.
United States Department of the Interior Geologic Survey and TVA Maps and Surveys Division, Harriman
Quadrangle, Tennessee, 1968 (and photorevised).
Walton, W.H., et al. (2002), “Evaluation of Static Liquefaction Potential of Upstream Dike Construction for Iron
Mine Tailings Impoundment,” Tailings Dams 2002 Proceedings, Association of State Dam Safety Officials and
US Society on Dams, pp. 257 to 276.
AECOM
K:\PROJECTS\60095742 - TVA\Final\FINAL Revisions\Volume 1\completed\FINAL-062509-Failure_Analysis_Report_VolI-rev.doc
102
1.10 AECOM’s Project Team AECOM Technologies Corporation (AECOM) was retained by the Office of General Counsel of the Tennessee
Valley Authority (TVA) under Contract No. 000755097, effective January 7, 2009, to provide advice and
assistance in connection with the Root Cause Analysis (RCA) study of the failure of the ash pond containment
structures at the TVA’s Kingston Fossil Plant. AECOM’s work has been full-time since January 9, 2008.
AECOM’s scope of work is described in this report with the culmination of AECOM’s assignment being the
issuance of this RCA report.
AECOM organization chart is attached as Figure 1.10_1 and work schedule as Figure 1.10_2 is attached. Mr.
William Walton, P.E. was Principal-in-Charge, Mr. William Butler, P.E. was the Project Engineer who directed all
field, laboratory and analyses, and Dr. Elliott Drumright, P.E was the project administrator. All three engineers
are registered professional engineers in Tennessee. Their resumes are attached. AECOM’s personnel and
equipment were used to perform field explorations, testing and analyses. AECOM selected several
subcontractors; they include Dr. Don DeGroot, P.E. of the University of Massachusetts to test interface samples
of ash and soils under the ash dredge cells, GRL Engineers to perform calibration and dynamic analyses of
AECOM’s drill rig, standard penetration test hammers, and Roto Rooter to perform camera surveys of the dike
drainage systems.
Attached as Appendix A in Volume I is a copy our proposal to TVA that was developed in PowerPoint to
expedite the RCA consultant section process. Prior to retaining AECOM, The TVA wanted to know about
AECOM’s proposed work scope, schedule and experience.
AECOM recommended the TVA retain a member of the National Academy of Engineering to serve as AECOM’s
peer reviewer. AECOM and TVA agreed upon Dr. Gonzalo Castro, P.E., retired principal of GEI Consultants,
Inc. and recognized authority on soil liquefaction and embankment engineering. Dr. Gonzalo Castro was
retained by TVA directly and reviewed our work throughout the assignment.
The TVA provided AECOM access to staff, archives, surveyors to locate borings, and contractors to help us
access boring locations and make test excavations.

AECOM
K:\PROJECTS\60095742 - TVA\Final\FINAL Revisions\Volume 1\completed\FINAL-062509-Failure_Analysis_Report_VolI-rev.doc
AECOM Organizational Chart, Schedule and Resumes

AECOM
K:\PROJECTS\60095742 - TVA\Final\FINAL Revisions\Volume 1\completed\FINAL-062509-Failure_Analysis_Report_VolI-rev.doc
Tables

AECOM
K:\PROJECTS\60095742 - TVA\Final\FINAL Revisions\Volume 1\completed\FINAL-062509-Failure_Analysis_Report_VolI-rev.doc
Figures

AECOM
K:\PROJECTS\60095742 - TVA\Final\FINAL Revisions\Volume 1\completed\FINAL-062509-Failure_Analysis_Report_VolI-rev.doc
Photographs

AECOM
K:\PROJECTS\60095742 - TVA\Final\FINAL Revisions\Volume 1\completed\FINAL-062509-Failure_Analysis_Report_VolI-rev.doc
Relic Photographs

AECOM
K:\PROJECTS\60095742 - TVA\Final\FINAL Revisions\Volume 1\completed\FINAL-062509-Failure_Analysis_Report_VolI-rev.doc
Test Trenches No. 1, No. 2 and No. 3 Photographic Logs

AECOM
K:\PROJECTS\60095742 - TVA\Final\FINAL Revisions\Volume 1\completed\FINAL-062509-Failure_Analysis_Report_VolI-rev.doc
Appendix A – AECOM Proposal