Fin-408 Final Term Paper
59
Term paper On Analysis of Financial Statements Pepared for Md. Lutfur Rahman Senior Lecturer and Assistant Proctor Department Of Business Administration East West University Prepared By Arman Khan Emu(Monno Fabrics) ID: 2006-3-10-095 Mohammad Sumsul Alam(HR Textile) ID: 2006-3-10-033 Md.Mamunur Rahman (Saiham Textile) ID: 2006-3-10-090 Nikita Mashiat(Prime Textile) 2007-1-10-140 Tanzia Islam(Dandy Dyeing) 2007-1-10-095 Date of submission : 18 April 2010 EAST WEST UNIVERSITY
Transcript of Fin-408 Final Term Paper
7/30/2019 Fin-408 Final Term Paper
http://slidepdf.com/reader/full/fin-408-final-term-paper 1/59
Term paperOn
Analysis of Financial Statements
Pepared forMd. Lutfur Rahman
Senior Lecturer and Assistant ProctorDepartment Of Business Administration
East West University
Prepared By
Arman Khan Emu(Monno Fabrics)
ID: 2006-3-10-095
Mohammad Sumsul Alam(HR Textile)
ID: 2006-3-10-033
Md.Mamunur Rahman (Saiham Textile)
ID: 2006-3-10-090
Nikita Mashiat(Prime Textile)
2007-1-10-140
Tanzia Islam(Dandy Dyeing)2007-1-10-095
Date of submission : 18 April 2010
EAST WEST UNIVERSITY
7/30/2019 Fin-408 Final Term Paper
http://slidepdf.com/reader/full/fin-408-final-term-paper 2/59
Letter of transmittal
18 April 2010
Md. Lutfur Rahman
Senior Lecturer and Assistant Proctor
Department of Business Administration
East West University
Subject: “Submission of term paper on “Analysis of Financial Statements”
Dear Sir:
It’s our pleasure to submit a term paper on “Analysis of Financial Statements”, in the semester
spring-2010 for the course Financial Statement Analysis.
In this term paper, We have tried my best to focus relative ratios of selected companies and make
comparison among them. We believe that this term paper will help us to find the current market
situation of the selected companies to make investment decision.
For any further clarification, We will be more than glad to comply.
With Regards & Sincerity,
Arman Khan Emu
2006-3-10095
Mohammad Sumsul Alam(HR Textile)
ID: 2006-3-10-033
Md.Mamunur Rahman (Saiham Textile)
ID: 2006-3-10-090
Nikita Mashiat(Prime Textile)
2007-1-10-140
Tanzia Islam(Dandy Dyeing)
2007-1-10-095
2

7/30/2019 Fin-408 Final Term Paper
http://slidepdf.com/reader/full/fin-408-final-term-paper 3/59
Acknowledgement:
.
This Report would have never seen the face of light without the help and cooperation of a
number of individuals. Following few names, We must quote individually for special citation.
First of all I would like to thank Md. Lufur Rahman, our academic supervisor, whose guidanceand care inspired us. We would also like to thank Mr. Shamim, financial manager in Elan Corp.
for his clear guidelines that enabled me to understand the structure of the paper. Despite his over-
demanded schedule, he always found some time to advice & guide me in the right direction
Besides, we must express our thanks to numerous academics and publishers whose papers we
used to prepare the secondary analysis
3

7/30/2019 Fin-408 Final Term Paper
http://slidepdf.com/reader/full/fin-408-final-term-paper 4/59
Table of Contents
1.Inroduction………………………………………………….………………….6
1.1 objective of the study………………………………………………………6
1.2 scope of the study………………………………………………….………7
1.3 limitation…………………………………………………………………….…7
1.4 Methodology…………………………………………………………….…..7
2. A short profile of the organization………………………………………..7
2.1 Analysis of Common Size statement…………………………….……..7
2.2 Analysis of ratios……………………………………………………….......7
2.2.1 Monno Fabrics…………………………………………………………..11
2.2.2 HR textile………………………………………………………………….16
2.2.3 Dandy Dyeing…………………………………………………….……..232.2.4 Prime Textile …………………………………………………….………26
2.2.5 Saiham
Textile…………………………………..................................30
2.3 Comparison the ratios with
industry………………………………….34
3.Recommendation………………………………………………………..57
4.Conclusion…………………………………………………………………….57
4

7/30/2019 Fin-408 Final Term Paper
http://slidepdf.com/reader/full/fin-408-final-term-paper 5/59
Executive summary
This report is prepared for the better understanding of the studies wehave learned in Financial Statement Analysis in the practical industry.
Here we have worked on five companies in the Textile industry find out
their common size statement and the ratio they have.
We first collected the data of five consecutive years from 2002 to 2006
and then analyzed them individually to find out position they have in the
industry. Then we have analyzed the five companies as a whole industry.
Through process of preparing the report we got a better understanding
about the real world business process.
5
7/30/2019 Fin-408 Final Term Paper
http://slidepdf.com/reader/full/fin-408-final-term-paper 6/59
Introduction
Financial ratios are used to compare the risk and return of different
firms in order to help equity investors and creditors make intelligent
investment and credit decision. Such decisions require both an
evaluation of changes in performance over time for a particular
investment and a comparison among all firms with in a single industry
at a specific point of time.
The informational needs and appropriate analytical techniques used for
these investment and credit decision depend on the decision maker’s
time horizon.
1.1 objective of the study
Primary objectives
To present the relative ratios among the selected companies
To explain the ratios and analysis whether the ratio is performing good or bad.
To find out industry average and compare the ratios with the industry to better
understand.
Secondary Objectives
To have Knowledge about financial ratios.
To improve corresponding and term writing ability.
To fulfill requirement of the term paper.
6
7/30/2019 Fin-408 Final Term Paper
http://slidepdf.com/reader/full/fin-408-final-term-paper 7/59
1.2 scope of the study
The scope of the study is limited with the selected companies. So it’s is difficult to find out how
the overall industry is performing. As well we conducted our analysis on the basis of anuual
financial report of the companies so that ignoring the fact of economic, social and political
stability of Bangladesh which can influence on investment decision.
1.3 Limitation
Sometimes it was difficult for us to understand the financial statement as there are many
regulation and form regarding. We also cannot able to calculate some ratios like Capital
Expenditure Ration because of scarcity of information.
1.4 Methodology
For the purpose of the term paper we only use the primary source of information that is
respective annual reports of the companies. We did not use any secondary data here. The
relevant information collected from the DSE library. Our academic experience of working on
ratios in this course helped us a lot for conducting this analysis.
2. A short profile of the organizations
Monno Fabrics
Vision We see business as a means to the well-being of the shareholders and all other stakeholders,
society as well as the national interest as a whole.
Mission Our Mission is to provide world class quality products to our valued customers, strictly
maintain ethical standard in business operation.
7

7/30/2019 Fin-408 Final Term Paper
http://slidepdf.com/reader/full/fin-408-final-term-paper 8/59
Objectives Our objectives are to conduct transparent business operation within the legal & social
framework with aims to attain the mission with a quantitative/qualitative target in business operation.
Corporate Focus Our vision, our mission and our objectives are to emphasise on the continuous
development in making value addition to our products for producing the higher end products, to keep
well prepared for competitive world market.
Financial Management Policy
All financial policies like investments policy, dividend policy and financing policy is to maximise the
value of the organisation.
Corporate Governance:
Top Management : Board of Directors
As per provisions of the Article of Association, Board of Directors hold periodic meetings to resolve
issue of policies and strategies, recording minutes/decisions for implementation by the Executive
Management.
Executive Management:
The Executive Management is headed by the Managing Director, the Chief Executive Officer (CEO)
who has been delegated necessary and adequate authority by the Board of Directors. The Executive
Management operates through further delegations of authority at every echelon of the line
management. The Executive Management is responsible for preparation of segment plans/sub-
segment plans for every profit centres with budgetary targets for every items of goods & services and
are held accountable for deficiencies with appreciation for exceptional performance.
8

7/30/2019 Fin-408 Final Term Paper
http://slidepdf.com/reader/full/fin-408-final-term-paper 9/59
Arman Khan Emu(Monno
Fabrics)
ID: 2006-3-10-095
Analysis of commonsize statement
Gross Profit: HR Textile’s gross profit is maximum in the year 2005 that is 23.70% of sales in
that particular year. That means HR Textile managed its COGS most efficiently in 2006.
Monno Fabrics LimitedCommon size for I/S Year 2002 2003 2004 2005 2006
Sales 100% 100% 100% 100%100.00
%
Cost of goods sold 76.41% 76.38% 76.37% 76.30% 77.96%
Gross Profit 23.59% 23.62% 23.63% 23.70% 22.04%
operating expenses& tax Provision 2.28% 16.48% 17.33% 18.23% 17.21%
Operating Income 21.31% 7.15% 6.30% 5.47% 4.82%Non-operating
Income 0.01% 0.02% 0.02% 0.01% 0.05%EBIT 21.33% 7.17% 6.32% 5.48% 4.88%
Interest 14.20% 0.00% 0.00% 0.00% 0.00%Contribution toW.P.P.F & welfarefund 0.34% 0.34% 0.35% 0.26% 0.23%
EBT 6.78% 6.83% 5.97% 5.22% 4.65%
Tax 0.00% 0.00% 0.00% 0.00% 0.00%
Net Income 6.78% 6.83% 5.97% 5.22% 4.65%
9

7/30/2019 Fin-408 Final Term Paper
http://slidepdf.com/reader/full/fin-408-final-term-paper 10/59
Operating income: HR Textile’s operating income is maximum in the year 2002 that is 21.31%
of sales in that particular year. That means it managed its administrative expenses most
efficiently in 2002.
EBT: HR Textile’s EBT is maximum in the year 2003 that is 6.83% of sales in that particular
year.
Net Income: HR Textile’s Net Income is maximum in the year 2003 that is 6.78% of sales in
that particular year.
Over all performance: From the income statement common size analysis it is observed that HR
Textile’s over all performance is good in the year 2003.
Monno Fabrics Limited
Common Size Assets 2002 2003 2004 2005 2006
Cash and Cash equivalents 0.97% 0.81% 0.88% 0.30% 0.59%
Inventories 9.50%10.45
% 9.73% 9.67%13.56
%Loan,Advances,Deposits & pre-
payments 2.11% 1.77% 2.18% 3.51% 4.00%
Accounts Receivable16.20
%20.21
%19.71
%19.15
%15.93
%
Total Current Assets28.78
%33.25
%32.49
%32.63
%34.08
%
Net Property,Plant & Equipment71.09
%65.36
%67.51
%67.37
%65.92
%
Capital Work-in-Progress 0.13% 1.40% 0.00% 0.00% 0.00%
Total Fixed Assets71.22
%66.75
%67.51
%67.37
%65.92
%
Total Assets100.0
0%100.00
%100.00
%100.00
%100.00
%
Liabilities and Stockholder's Equity
Accounts Payable 2.00% 5.76% 3.12% 1.98% 5.12%
Short-term Borrowings15.23
%17.97
%21.27
%21.77
%22.21
%
10

7/30/2019 Fin-408 Final Term Paper
http://slidepdf.com/reader/full/fin-408-final-term-paper 11/59
Accured Expenses 1.07% 1.08% 0.64% 0.76% 1.07%
Long Term Loans(Current Portion) 0.00% 1.76% 1.94% 2.19% 2.36%
Unclaimed Dividend 0.00% 0.12% 0.20% 0.27% 0.38%
Provision for Income Tax 0.00% 0.54% 1.11% 0.00% 0.00%
Liabilities for other Finance 0.33% 0.26% 0.27% 0.30% 0.30%
Total Current Liabilities18.63
%27.48
%28.56
%27.28
%31.45
%
Long-term Debt39.73
%31.41
%27.58
%24.79
%20.29
%
Deferred Liability: Gratuity payable 0.00% 0.23% 0.29% 0.36% 0.41%
Total Long-Term Liabilities39.73
%31.64
%27.87
%25.15
%20.70
%
Total Liabilities58.36
%59.12
%56.43
%52.43
%52.15
%
Issued and Paid-up Share Capital34.76
%33.10
%34.20
%36.08
%36.27
%
Share Premium11.20
%10.67
%11.02
%11.63
%11.69
%
Tax holiday reserve 2.06% 2.25% 2.33% 0.00% 0.00%
Proposed Divdend 1.74% 1.65% 1.71% 2.16% 2.18%
Retained Earnings-
8.12% -6.79% -5.69% -2.30% -2.28%
Total Shareholder's Equity 41.64
% 40.88
% 43.57
% 47.57
% 47.85
%Total Liabilities and Shareholder'sEquity
100.00%
100.00%
100.00%
100.00%
100.00%
Investment in Fixed Asset:
Maximum investment in fixed asset is in the year 2002 that is 71.22% of total asset in that
particular year.
Financing From outsider: its long term loan is minimum in the year 2006 that is 20.29% of
total asset.
Trade debt: Trade debt of HR textile is lowest in the year 2005 that is 1.98%
11
7/30/2019 Fin-408 Final Term Paper
http://slidepdf.com/reader/full/fin-408-final-term-paper 12/59
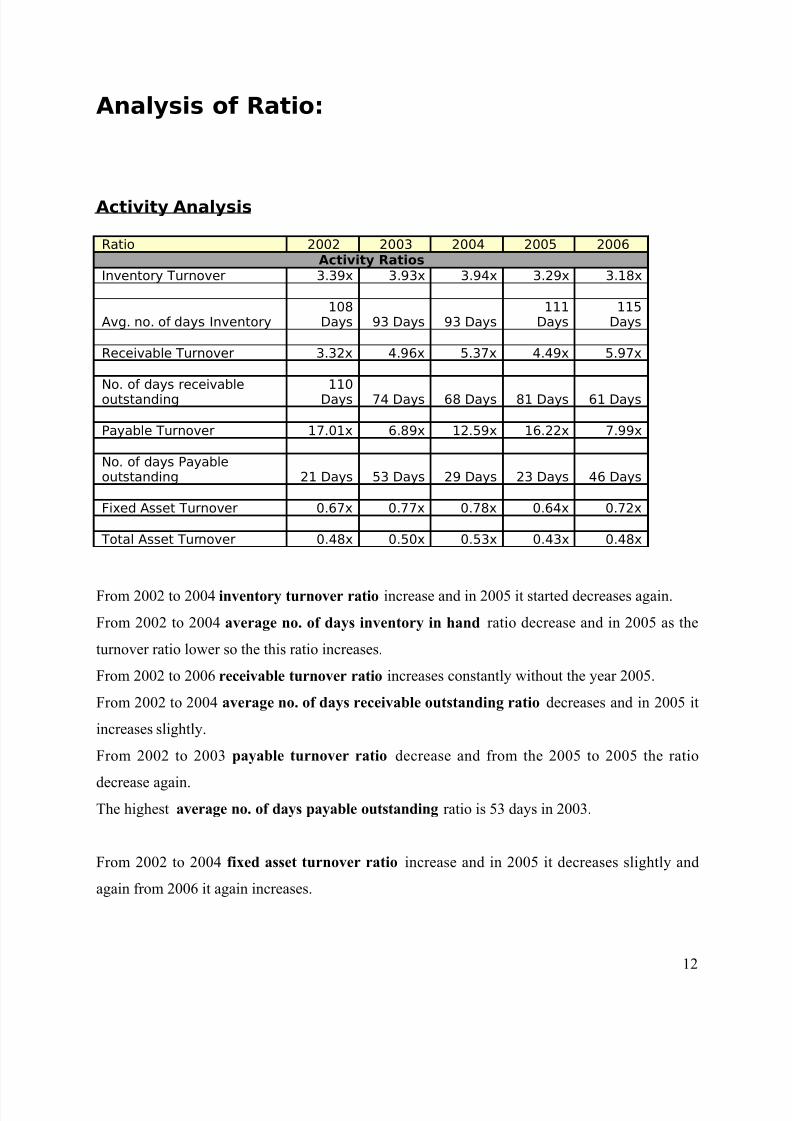
Analysis of Ratio:
Activity Analysis
Ratio 2002 2003 2004 2005 2006Activity Ratios
Inventory Turnover 3.39x 3.93x 3.94x 3.29x 3.18x
Avg. no. of days Inventory108
Days 93 Days 93 Days111
Days115
Days
Receivable Turnover 3.32x 4.96x 5.37x 4.49x 5.97x
No. of days receivableoutstanding
110Days 74 Days 68 Days 81 Days 61 Days
Payable Turnover 17.01x 6.89x 12.59x 16.22x 7.99x
No. of days Payableoutstanding 21 Days 53 Days 29 Days 23 Days 46 Days
Fixed Asset Turnover 0.67x 0.77x 0.78x 0.64x 0.72x
Total Asset Turnover 0.48x 0.50x 0.53x 0.43x 0.48x
From 2002 to 2004 inventory turnover ratio increase and in 2005 it started decreases again.
From 2002 to 2004 average no. of days inventory in hand ratio decrease and in 2005 as the
turnover ratio lower so the this ratio increases.
From 2002 to 2006 receivable turnover ratio increases constantly without the year 2005.
From 2002 to 2004 average no. of days receivable outstanding ratio decreases and in 2005 it
increases slightly.
From 2002 to 2003 payable turnover ratio decrease and from the 2005 to 2005 the ratio
decrease again.The highest average no. of days payable outstanding ratio is 53 days in 2003.
From 2002 to 2004 fixed asset turnover ratio increase and in 2005 it decreases slightly and
again from 2006 it again increases.
12

7/30/2019 Fin-408 Final Term Paper
http://slidepdf.com/reader/full/fin-408-final-term-paper 13/59
From 2002 to 2004 total asset turnover ratio increase and in 2005 it decreases slightly and
again from 2006 it again increases.
So, we can say that Monno Fabric manages their inventory efficiently and the company also
credit management of the company is efficient. As they delaying their payables so the company
has reputation in the market.
Liquidity Analysis:
Liquidity Ratios Year 2002 2003 2004 2005 2006
Current 1.54x 1.21x 1.14x 1.20x 1.08x
Quick 1.03x 0.83x 0.80x 0.84x 0.65x
Cash 0.05x 0.03x 0.03x 0.01x 0.02x
From 2002 to 2006 current ratio constatntly.
From 2002 to 2006 quick ratio decrease but in year 2005 it increase a little.
From 2002 to 2005 cash ratio decrease and in 2006 the ratio increases.
So we can say that the company’s liquidity position is not that much good.
Long-Term Debt and Solvency Ratios Year 2002 2003 2004 2005 2006
Debt to Total Capital 35.02% 31.83% 32.14% 31.35% 28.79%
Debt to Equity132.01
% 120.80% 112.12% 97.88% 88.82%
Times Interest Earned 1.50x - - - -
Fixed ChargeCoverage 1.50x
- - - -
CFO to Debt 0.13x 0.14x 0.17x 0.17x 0.23x
13

7/30/2019 Fin-408 Final Term Paper
http://slidepdf.com/reader/full/fin-408-final-term-paper 14/59
From 2002 to 2003 debt to total capital ratio decline and in 2004 it started increase afterwards
from 2005 to 2006 it decreases again.
From 2002 to 2006 debt to equity ratio decreases consecutively.
The company maintain 1.5 times interest earned ratio in 2002 afterwards, it did not pay any
interest.
From 2002 to 2006 CFO to debt ratio increases constantly it means CFO is increasing for the
firm.
Therefore, we can say the company capital structure is proper.
Profitability Analysis:
Profitability Ratios
Year 2002 2003 2004 2005 2006
Gross Margin23.59
%23.62
%23.63
%23.70
%22.04
%
Operating Margin21.31
% 7.15% 6.30% 5.47% 4.82%
Margin before interest and taxes21.33
% 7.17% 6.32% 5.48% 4.88%
Pretax Margin 6.78% 6.83% 5.97% 5.22% 4.65%
Profit Margin 6.78% 6.83% 5.97% 5.22% 4.65%
ROA10.05
% 3.42% 3.16% 2.24% 2.21%
ROTC10.37
% 7.19% 6.68% 4.71% 4.64%
ROE 1.99% 4.19% 3.62% 2.36% 2.31%
Return on common equity 9.34%10.34
% 9.23% 6.22% 6.09%
From 2002 to 2006 gross margin more or less remain same.
From 2002 to 2006 operating margin declining constantly.
14

7/30/2019 Fin-408 Final Term Paper
http://slidepdf.com/reader/full/fin-408-final-term-paper 15/59
From 2002 to 2006 margin before interest and tax also decrease consecutively.
In 2003 pretax margin was highest but in the other respective years this ratio has declining
trend.
From 2002 to 2006 profit margin was same as pretax margin as the company did not pay the
taxes in the related years.
In 2002, ROA is 10.05%, decreases from 2003 to 2006.
In 2002, Return on capital is 10.37%, decreases from 2003 to 2006.
In 2002, ROE is 1.99%, increase in 2003 and from 2004 to 2006 it decreases.
In 2002, return on common equity is 9.34%, increase in 2003 and from 2004 to 2006 it
decreases.
Leverage
Year 2002 2003 2004 2005 2006
Operation Leverage Effect 1.11 3.31 3.75 4.33 4.57
Financial Leverage Effect 3.14 1.05 1.05 1.05 1.04
Total Leverage Effect 3.48 3.46 3.96 4.54 4.74
From 2002 to 2006, OLE increase
The company maintain 1.05 financial leverage over the years.
From 2003 to 2006, TLE increase
Therefore, we can say that Monno Fabrics has some operating leverage as well as some financial
leverage. But the leverage is in the uptrend which is may not be good for the company.
15

7/30/2019 Fin-408 Final Term Paper
http://slidepdf.com/reader/full/fin-408-final-term-paper 16/59
Mohammad Sumsul Alam(HR
Textile)
ID: 2006-3-10-033
HR Textile Limited
Table 1
Hr Textile Limited
Income Statement
Year 2002 2003 2004 2005 2006
Sales 100.00% 100.00% 100.00% 100.00% 100.00%
Cost of goods sold 87.83% 88.64% 89.47% 86.89% 85.84%
Gross Profit 12.17% 11.36% 10.53% 13.11% 14.16%
Admnistrative &general Expense 7.56% 7.62% 7.83% 10.16% 11.31%
Operating Income 4.61% 3.74% 2.70% 2.95% 2.85%
Other income 0.00% 0.00% 0.00% 0.06% 0.05%
Contribution to W.P &welfare fund 0.23% 0.20% 0.15% 0.15% 0.15%
EBT 4.38% 3.54% 2.55% 2.80% 2.70%
Tax/provision forincome taxd 0.09% 0.00% 0.22% 0.35% 0.41%
Net Income 4.29% 3.54% 2.33% 2.45% 2.29%
Gross Profit: HR Textile’s gross profit is maximum in the year 2006 that is 14.16% of sales in
that particular year. That means HR Textile managed its COGS most efficiently in 2006.
Operating income: HR Textile’s operating income is maximum in the year 2002 that is 4.16%
of sales in that particular year. That means it managed its administrative expenses most
efficiently in 2002.
EBT: HR Textile’s EBT is maximum in the year 2002 that is 4.38% of sales in that particular
year.
16

7/30/2019 Fin-408 Final Term Paper
http://slidepdf.com/reader/full/fin-408-final-term-paper 17/59
Net Income: HR Textile’s Net Income is maximum in the year 2002 that is 4.29% of sales in
that particular year.
Over all performance: From the income statement common size analysis it is observed that HR
Textile’s over all performance is good in the year 2002.
HR Textile LimitedTable -2
HR textile
Common Size for Balance Sheet Assets 2002 2003 2004 2005 2006
Current Asset
Stocks and stores 10.02% 9.70% 10.91% 10.03% 16.55%
Trade debtors 16.14% 20.09% 4.21% 19.70% 19.31%
Export incentives receivables 13.24% 11.41% 5.04% 4.27% 2.40%Advance, deposits and payments 0.93% 0.80% 0.73% 1.47% 1.13%
Cash and bank balance 0.20% 2.17% 1.38% 1.89% 1.85%
Deferred lease interest 0.00% 0.00% 18.39% 1.72% 0.00%
Total Current Assets 40.52% 44.17% 40.66% 39.08% 41.24%
Fixed asset 59.48% 55.83% 59.34% 60.92% 52.33%
Deferred lease interest 0.00% 0.00% 0.00% 0.00% 6.43%
Total long term asset 59.48% 55.83% 59.34% 60.92% 58.76%
Total Asset100.00
%100.00
%100.00
%100.00
%100.00
%
0.00% 0.00% 0.00% 0.00% 0.00%
current liabilites: 0.00% 0.00% 0.00% 0.00% 0.00%Bank overdraft- secured 5.61% 4.32% 5.18% 4.13% 3.70%
Liability against Trust Receipt 4.33% 0.56% 2.43% 2.03% 7.51%
Creditors 19.52% 26.53% 22.92% 27.40% 24.81%
Accrued Expenses 3.32% 2.79% 3.06% 2.79% 1.05%
Provision for tax 0.15% 0.20% 0.33% 0.39% 0.20%
Worker' participation/ Welfare funds 1.01% 0.99% 0.93% 0.85% 0.61%
Dues to associated companies 7.56% 7.68% 5.43% 3.12% 2.22%
17
7/30/2019 Fin-408 Final Term Paper
http://slidepdf.com/reader/full/fin-408-final-term-paper 18/59
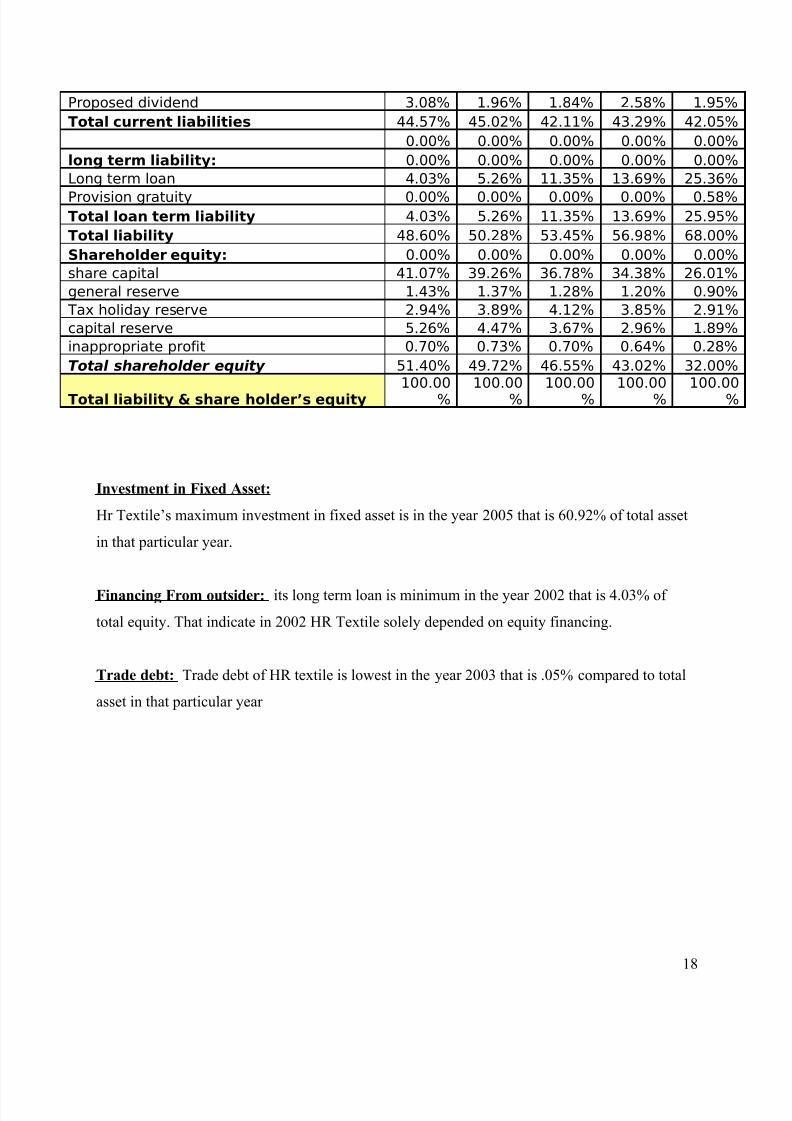
Proposed dividend 3.08% 1.96% 1.84% 2.58% 1.95%
Total current liabilities 44.57% 45.02% 42.11% 43.29% 42.05%
0.00% 0.00% 0.00% 0.00% 0.00%
long term liability: 0.00% 0.00% 0.00% 0.00% 0.00%
Long term loan 4.03% 5.26% 11.35% 13.69% 25.36%
Provision gratuity 0.00% 0.00% 0.00% 0.00% 0.58%Total loan term liability 4.03% 5.26% 11.35% 13.69% 25.95%
Total liability 48.60% 50.28% 53.45% 56.98% 68.00%
Shareholder equity: 0.00% 0.00% 0.00% 0.00% 0.00%
share capital 41.07% 39.26% 36.78% 34.38% 26.01%
general reserve 1.43% 1.37% 1.28% 1.20% 0.90%
Tax holiday reserve 2.94% 3.89% 4.12% 3.85% 2.91%
capital reserve 5.26% 4.47% 3.67% 2.96% 1.89%
inappropriate profit 0.70% 0.73% 0.70% 0.64% 0.28%
Total shareholder equity 51.40% 49.72% 46.55% 43.02% 32.00%
Total liability & share holder’s equity100.00
%100.00
%100.00
%100.00
%100.00
%
Investment in Fixed Asset:
Hr Textile’s maximum investment in fixed asset is in the year 2005 that is 60.92% of total asset
in that particular year.
Financing From outsider: its long term loan is minimum in the year 2002 that is 4.03% of
total equity. That indicate in 2002 HR Textile solely depended on equity financing.
Trade debt: Trade debt of HR textile is lowest in the year 2003 that is .05% compared to total
asset in that particular year
18

7/30/2019 Fin-408 Final Term Paper
http://slidepdf.com/reader/full/fin-408-final-term-paper 19/59
HR Textile Limited
Table 3(Activity Ratios)
Ratio 2002 2003 2004 2005 2006
Activity Ratios
Inventory Turnover 7.67x 8.57x 9.66x 8.77x 6.44x
Avg. no. of days Inventory 48 Days 43 Days38
Days42
Days57
Days
Receivable Turnover 6.91x 5.25x 9.38x 8.64x 5.29x
No. of days receivableoutstanding 53 Days 70 Days
39Days
42Days
69Days
Payable Turnover 9.94x 11.09x 15.59x 21.63x 37.82x
No. of days Payable outstanding 37 Days 33 Days23
Days17
Days10
Days
Fixed Asset Turnover 1.52x 1.67x 1.82x 1.68x 1.73x
Total Asset Turnover 0.90x 0.93x 1.08x 1.02x 0.91x
Inventory turnover: For HR Textile highest inventory turn over occurred in the year 2004 that is
9.66x. That indicates purchase to sales process occurs 9.66 times.
And one turnover took 38 days in 2004 that is minimum compared to other year.
Receivable turnover: Highest receivable turnover incurred in 2004 that is 9.38 times. And it took
on an average 39 days to turnover one receivable.
Payable turnover: Lowest payable turnover incurred in 2002 that is 9.94 times, and one payable
turnover took 37 days.
Fixed and Total asset turnover: Highest fixed asset turnover incurred in 2004 that is 1.82 times.
Highest Total asset turnover also incurred in 2004 that is 1.08 times.
Overall performance: Activity ratios of HR Textile show that its overall performance was good
in 2004.
19

7/30/2019 Fin-408 Final Term Paper
http://slidepdf.com/reader/full/fin-408-final-term-paper 20/59
HR Textile Limited
Table 4 (liquidity rato)
Hr textiles ability to pay its current liability using its current asset was maximum in 2003 and
2006 that is 0.98 times. Firms quick ratio and cash was also good in 2003 .
HR Textile Limited
Table 5(Long- Term debt and solvency Ratios)
Ratio 2002 2003 2004 2005 2006
Long-Term Debt and Solvency Ratios
Debt to Total Capital 4.03% 5.26% 11.35% 13.69% 25.36%
Debt to Equity 7.84% 10.58% 24.37% 31.82% 79.26%
Times Interest Earned - - - -
Fixed Charge Coverage 0.98x 0.63x 0.24x 0.21x 0.10x
CFO to Debt 1.20x 2.75x 0.89x 1.30x 0.10x
In 2006 debt to capital ratio was 25.36% and it highest amount of debt in a particular year that
company used in 2006.
Ratio 2002 2003 2004 2005 2006
Liquidity Ratios
Current 0.91x 0.98x 0.97x 0.90x 0.98x
Quick 0.68x 0.77x 0.71x 0.67x 0.59x
Cash 0.004 0.048 0.033 0.044 0.044
20

7/30/2019 Fin-408 Final Term Paper
http://slidepdf.com/reader/full/fin-408-final-term-paper 21/59
For every hundred Taka equity share holder bears 79.26 Taka liability that is also in 2006.
Ability to pay fixed charge was highest in 2002 that is 0.98 times.
Cash flow generated from operation to pay debt is highest in 2003.
HR Textile Limited
Table 6(Profitability Ratios)
Ratio 2002 2003 2004 2005 2006
Profitability RatiosGross Margin 12.17% 11.36% 10.53% 13.11% 14.16%
Operating Margin 4.61% 3.74% 2.70% 2.95% 2.85%
Pretax Margin/ EBT 4.38% 3.54% 2.55% 2.86% 2.76%
Profit Margin 4.29% 3.54% 2.33% 2.51% 2.34%
ROA 4.04% 3.37% 2.60% 2.65% 2.41%
ROTC 12.98% 11.13% 8.73% 9.60% 8.17%
ROE 7.71% 6.63% 5.91% 6.79% 7.79%
Return on common equity 9.64% 8.40% 7.48% 8.49% 9.59%
Hr Textile gross margin in 2006 is 14.16% that is maximum compared to other years and
indicate it managed its COGS most efficiently.
Profitability of company from its core operation is maximum in 2002 that is 4.61%
ROA is maximum in 2002 on the other hand ROE is maximum in 2006.
21

7/30/2019 Fin-408 Final Term Paper
http://slidepdf.com/reader/full/fin-408-final-term-paper 22/59
HR Textile Limited
Table 7 (leverage)
For one percent change in sales, EBIT could change by 4.97 times in 2006. It is maximum
change in EBIT that could take place.
For one percent change in EBIT, net income could change by 1.22 times in 2006. It is maximum
change in net income that could take place.
For one percent change in sales, net income could change by 6.04 times in 2006. It is maximum
change in net income that could take place.
22
7/30/2019 Fin-408 Final Term Paper
http://slidepdf.com/reader/full/fin-408-final-term-paper 23/59
Tanzia Islam(Dandy Dyeing)2007-1-10-095
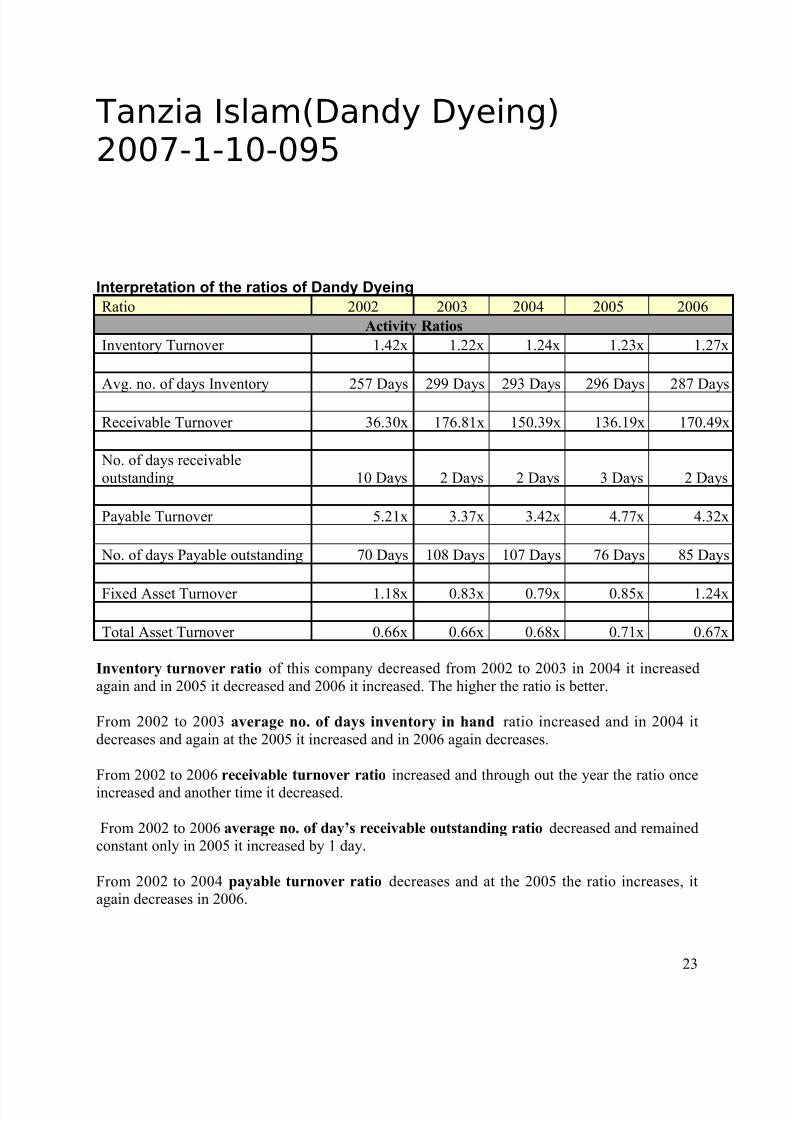
Interpretation of the ratios of Dandy Dyeing
Ratio 2002 2003 2004 2005 2006
Activity Ratios
Inventory Turnover 1.42x 1.22x 1.24x 1.23x 1.27x
Avg. no. of days Inventory 257 Days 299 Days 293 Days 296 Days 287 Days
Receivable Turnover 36.30x 176.81x 150.39x 136.19x 170.49x
No. of days receivable
outstanding 10 Days 2 Days 2 Days 3 Days 2 Days
Payable Turnover 5.21x 3.37x 3.42x 4.77x 4.32x
No. of days Payable outstanding 70 Days 108 Days 107 Days 76 Days 85 Days
Fixed Asset Turnover 1.18x 0.83x 0.79x 0.85x 1.24x
Total Asset Turnover 0.66x 0.66x 0.68x 0.71x 0.67x
Inventory turnover ratio of this company decreased from 2002 to 2003 in 2004 it increased
again and in 2005 it decreased and 2006 it increased. The higher the ratio is better.
From 2002 to 2003 average no. of days inventory in hand ratio increased and in 2004 it
decreases and again at the 2005 it increased and in 2006 again decreases.
From 2002 to 2006 receivable turnover ratio increased and through out the year the ratio onceincreased and another time it decreased.
From 2002 to 2006 average no. of day’s receivable outstanding ratio decreased and remainedconstant only in 2005 it increased by 1 day.
From 2002 to 2004 payable turnover ratio decreases and at the 2005 the ratio increases, itagain decreases in 2006.
23

7/30/2019 Fin-408 Final Term Paper
http://slidepdf.com/reader/full/fin-408-final-term-paper 24/59
From 2002 to 2006 average no. of day’s payable outstanding ratio increases and at the 2005
the ratio decreases it again increases in 2006.
From 2002 to 2004 fixed asset turnover ratio decrease and from the 2005 to 2006 again
increases.
From 2002 to 2005 total asset turnover ratio increase and in 2006 it decreases again.
So, we can say that Dandy Dyeing ltd. management is not consistent but the credit managementof the company is efficient. As they delaying their payables so the company has reputation in the
market. From the asset turnover ratios we can say dandy dyeing efficiently manage their asset.
Liquidity Ratios
Current 1.36x 2.05x 1.73x 1.51x 1.68x
Quick 0.10x 0.16x 0.04x -0.50x 0.07x
Cash 0.09x 0.15x 0.01x -0.51x 0.06x
The Current Ratio of this company was in an increasing trend from 2002 to 2003 and it kept
falling from 2004 to 2006.
The Quick ratio of the company increased from 2002 to 2003 and it drastically felled at 2003 andat 2005 it was negative but in 2006 it increased again.
The Cash ratio of the company increased from 2002 to 2003 and it drastically felled at 2003 andat 2005 it was negative but in 2006 it increased again.
The liquidity position of the company is not satisfactory we can say that by seeing the difference
between the Quick Ratio and liquidity ratio. The quick ratio of the company is calculated byexcluding inventory, and here the difference shows that there is huge amount of inventory is
stored.
Long-Term Debt and Solvency Ratios
24

7/30/2019 Fin-408 Final Term Paper
http://slidepdf.com/reader/full/fin-408-final-term-paper 25/59
Debt to Total Capital 91.57% 96.81% 102.97% 108.11% 110.26%
Debt to Equity 1086.20% 3033.46% -3471.86% -1332.91% -1074.70%
Times Interest Earned 1.19x 0.84x 0.33x 0.50x 0.10x
CFO to Debt 0.09x 0.10x 0.09x 0.06x 0.16x
The debt to capital ratio kept increasing from 2002 to 2006.
The debt to equity ratio increased form 2002 to 2003 and it decreased and became negative valuefrom 2004 to 2006.
The TIE ratio decreased from 2002 to 2004 and it increased again 2005 and again decreased in
2006.The CFO to Debt ratio increased from 2002 to 2003 and it decreased from 2004 to 2005 and in
2006 it increased again.From the ratios of Dandy Dyeing we can say that the firm has less internal fund that’s the reasontheir interest cost increased and the TIE ratio shows that their earnings is not satisfactory to
support the interest payment. Their cash flow generating capacity is very low to pay the debt so
we can say the long term solvency of the company is not good.
Profitability Ratios
Gross Margin 31.50% 30.03% 28.33% 31.72% 23.98%
Operating Margin 16.02% 10.81% 3.98% 5.77% 1.28%
Margin before interest and taxes 16.02% 10.81% 3.98% 5.77% 1.28%
Pretax Margin 2.61% -2.11% -8.23% -5.68% -11.44%
Profit Margin 2.61% -2.11% -8.23% -5.68% -11.44%
ROA 10.85% 7.08% 2.61% 4.18% 0.82%
ROTC 13.91% 9.78% 3.43% 5.85% 1.17%
ROE 17.50% -33.88% -2649.86% 105.39% 113.72%
Return on common equity 8.17% -6.56% -24.76% -18.59% -32.29%
The gross margin of the company decreased from 2002 to 2004 and it increased in 2005 and it
again decreased in 2006.
25

7/30/2019 Fin-408 Final Term Paper
http://slidepdf.com/reader/full/fin-408-final-term-paper 26/59
The operating margin and the margin before interest and taxes of the company decreased from
2002 to 2004 and it increased in 2005 and it again decreased in 2006.
The Pretax margin and profit margin of the company kept decreasing and became negative from2002 to 2006.
The ROA decreased from 2002 to 2004 and it again increased in 2005 and decreased in 2006.
The ROTC decreased from 2002 to 2004 and it again increased in 2005 and decreased in 2006.The ROE decreased from 2002 to 2004 and it increased from 2005 to 2006.
The return to common equity ratio kept decreasing from 2002 to 2006.
The profitability position of Dandy Dyeing is not satisfactory the ROA and ROTC keptfluctuating over the years which increases the risk and the return to common stock holder were
negative.
Leverage
Operation Leverage Effect 1.97 2.78 7.12 5.50 18.70
Financial Leverage Effect 6.13 -5.12 -0.48 -1.01 -0.11
Total Leverage Effect 12.05 -14.21 -3.44 -5.58 -2.10
The operating leverage of the company kept increasing from 2002 to 2004 it decreased at 2005
and again it increased at 2006The financial leverage of the company kept decreasing and became negative from 2002 to 2006.
The total leverage of the company was positive at 2002 and it became negative from 2003 to
2006.A highly leveraged firm is risky but it shows good potential for future earnings with increased
sales. Dandy Dying is showing highly operating leverage but their financial leverage is negative
because of their negative earnings. So we can say that this firm is a highly leveraged firm withgood potential of earnings.
Common size of the Dandy Dyeing
Dandy Dyeing Limited
Income Statement Year 2002 2003 2004 2005 2006
Sales and services 100.00% 100.00% 100.00% 100.00% 100.00%
Cost of goods sold 68.50% 69.97% 71.67% 68.28% 76.02%
Gross Profit 31.50% 30.03% 28.33% 31.72% 23.98%Loss on sale of vechile 0.00% -0.10% 0.00% 0.00% 0.00%Administritive expand selling &distribution exp
15.48% 19.31% 24.35% 25.95% 22.70%
26

7/30/2019 Fin-408 Final Term Paper
http://slidepdf.com/reader/full/fin-408-final-term-paper 27/59
OperatingIncome(EBIT) 16.02% 10.81% 3.98% 5.77% 1.28%
Interest 13.41% 12.92% 12.21% 11.45% 12.72%
EBT 2.61% -2.11% -8.23% -5.68% -11.44% Tax 0.00% 0.00% 0.00% 0.00% 0.00%
Net Income 2.61% -2.11% -8.23% -5.68% -11.44%
Nikita Mashiat(Prime Textile)
27

7/30/2019 Fin-408 Final Term Paper
http://slidepdf.com/reader/full/fin-408-final-term-paper 28/59
2007-1-10-140
Activity Analysis:
From 2002 to 2004 inventory turnover ratio increase and in 2005 it decreases and againincreases in 2006.
From 2002 to 2004 average no. of days inventory in hand ratio decrease and in 2005 it
increases and again decreases in 2006.
From 2002 to 2004 receivable turnover ratio decreases and from the 2005 to 2006 the ratioincreases.
From 2002 to 2004 average no. of day’s receivable outstanding ratio increases and from the2005 to 2006 the ratio decreases.From 2002 to 2004 payable turnover ratio decreases and in 2005 the ratio increases and again
decreases in 2006.
From 2002 to 2004 average no. of days payable outstanding ratio increases and in 2005 itdecreases and again increases in 2006.
So, we can say that Prime textile Spinning Mills Limited manages their inventory efficiently and
the company also credit management of the company is efficient. As they delaying their payablesso the company has reputation in the market.
Long Term activity ratio 2006 2005 2004 2003 2002
Fixed Asset Turnover 0.86 0.75 0.81 0.62 0.41Total Asset Turnover 0.59 0.55 0.58 0.45 0.31
From 2002 to 2004 fixed asset turnover ratio increases and in 2005 it decreases and again
increases in 2006.From 2002 to 2004 total asset turnover ratio increases and in 2005 it decreases and again
increases in 2006.
So we can say that Prime textile Spinning Mills Limited efficiently manage their long-term asset.
Liquidity Analysis:
Liquidity Analysis 2006 2005 2004 2003 2002
Current Ratio 1.10 1.14 1.16 1.19 1.18
Quick Ratio 0.52 0.41 0.62 0.59 0.41
Cash Ratio 0.02 0.03 0.02 0.02 0.02
From 2002 to 2003 current ratio increases and from 2004 to 2006 the ratio decreases.From 2002 to 2004 quick ratio increases and decreases in 2005 and again increases in 2006.
28

7/30/2019 Fin-408 Final Term Paper
http://slidepdf.com/reader/full/fin-408-final-term-paper 29/59
From 2002 to 2004 cash ratio is same and from in 2005 the ratio increases and again decreases
in 2006.
So we can say that the Prime textile Spinning Mills Limited’s liquidity position is not so good.
Long-term debt and solvency ratio:
Lon term debt-solvency ratio 2006 2005 2004 2003 2002
Debt to Total Capital 114.65% 130.82% 126.38% 130.68% 147.09%
Debt to equity Ratio 159.05% 163.27% 170.09% 176.38% 180.22%
Times Interest Earned 20.99 21.00 21.00 21.00 21.00
Fixed Charge Coverage 20.99 21.00 21.00 21.00 21.00
CFO to Debt Ratio 0.08 0.04 0.09 0.08 0.11
Capital Expenditure
From 2002 to 2004 debt to total capital ratio decrease and in 2005 the ratio increases and againdecreases in 2006.
From 2002 to 2006 debt to equity ratio gradually decreases.
The company maintains 21.00 times interest earned ratio.
From 2002 to 2006 fixed charge coverage ratio remains same that is 21.00.From 2002 to 2003 CFO to debt ratio decreases, in 2004 it increases, in 2005 it decreases and
again the ratio increases in 2006.
Therefore, we can say the Prime textile Spinning Mills Limited’s capital structure is proper to
pay its long-term obligation.
Profitability Analysis:
Profitability Analysis 2006 2005 2004 2003 2002
Gross Margin 9.62% 10.22% 9.54% 11.31% 17.88%
Operating Margin 3.00% 2.10% 2.17% 2.48% 3.83%
Margin BIT 3.00% 2,10% 2.17% 2.48% 3.83%
Pretax Margin 2.85% 2.00% 2.07% 2.36% 3.65%
Profit Margin 2.71% 2.00% 1.45% 1.80% 2.84%
ROA 1.78% 1.16% 1.27% 1.10% 1.19%
Return on Capital 2.94% 2.07% 2.22% 2.01% 2.30%
ROE 3.89% 2.47% 2.84% 2.59% 2.68%
Return on Common Equity
10.61% 7.00% 5.63% 5.53% 5.79%
From 2002 to 2004 gross margin decreases, it increases in 2005 and again decreases in 2006.
From 2002 to 2005 operating margin decreases and in 2006 it increases.
From 2002 to 2005 margin before interest and tax decreases, in 2006 it increases.From 2002 to 2005 pretax margin decreases and in 2006 it increases.
From 2002 to 2004 profit margin decreases and it increases from 2005 to 2006.
29

7/30/2019 Fin-408 Final Term Paper
http://slidepdf.com/reader/full/fin-408-final-term-paper 30/59
From 2000 to 2003, ROA decreases, increases in 2004, decreases in 2005 and increases in 2006.
From 2002 to 2003, Return on capital decreases, increases in 2004, decreases in 2005 and again
increases in 2006.From 2002 to 2003, ROE decreases, increases in 2004, decreases in 2005 and again increases in
2006.
From2002 to 2003, return on common equity decreases and from 2004 to 2006 it increases.
Leverage:
Operating Leverage 2006 2005 2004 2003 2002
OLE 3.21 4.86 4.40 4.57 4.67
Financial Leverage
Fin Leverage Effect 1.11 1.05 1.49 1.37 1.35
Total Leverage Effect 3.55 5.10 6.57 6.27 6.31
From 2002 and 2004, OLE decreases and in 2005 the ratio increases and it decreases in 2006.
From 2002 to 2004 financial leverage increases, in 2005 it decreases and in 2006 the ratio again
increases..From 2002 and 2003, TLE decreases, in 2004 the ratio increases and from 2005 to 2006 itdecreases.
Therefore, we can say that Prime textile Spinning Mills Limited’s has operating leverage as wellas financial leverage.
Saiham Textile ltd (RATIO ANALYSIS)
Ratio 2002 2003 2004 2005 2006Activity Ratios
Inventory Turnover 1.721 1.772 2.045 1.791 1.476
Avg. no. of days Inventory 212 206 178 204 247
Receivable Turnover 24.48 35.68 37.36 34.09 11.06
No. of days receivableoutstanding 14.91 10.23 9.77 10.71 33.00
Payable Turnover
No. of days Payable outstanding
Fixed Asset Turnover 0.99 1.05 1.20 0.97 0.88
30

7/30/2019 Fin-408 Final Term Paper
http://slidepdf.com/reader/full/fin-408-final-term-paper 31/59
Total Asset Turnover 0.63 0.67 0.77 0.62 0.54
Inventory turnover: For Saiham Textile highest inventory turn over occurred in the year 2004 that is 2.045x. That indicates purchase to sales process occurs 2.045 times.
And one turnover took 178 days in 2004 that is minimum compared to other year.
Receivable turnover: Highest receivable turnover incurred in 2004 that is 37.36 times. And it took on an average 9.77 days to turnover one receivable.
Fixed and Total asset turnover: Highest fixed asset turnover incurred in 2004 that is 1.20times.
Highest Total asset turnover also incurred in 2004 that is .77 times.
Overall performance: Activity ratios of HR Textile show that its overall performance wasgood in 2004.
Liquidity Ratios
Current 1.12 1.00 1.04 0.76 1.12
Quick 0.28 0.13 0.26 0.16 0.37
Cash 0.07 0.02 0.03 0.01 0.05
Saiham textile's ability to pay its current liability using its current asset was maximum in 2002 and2006 that is 1.12 times. Firms quick ratio good in 2006 and cash was also good in 2002 .
Long-Term Debt and Solvency RatiosDebt to Total Capital 30% 11% 6% 13% 4%
Debt to Equity 79% 19% 10% 29% 6%
Times Interest Earned 1.29 1.26 1.20 1.29 1.29
CFO to Debt 0.24 3.26 1.32 -0.19 5.27
31

7/30/2019 Fin-408 Final Term Paper
http://slidepdf.com/reader/full/fin-408-final-term-paper 32/59
In 2006 debt to capital ratio was 4% and it highest amount of debt in 2002 is 30% .
For every hundred Taka equity share holder bears 79 Taka liability that is also in 2002. And for every hundred taka equity share holder bears 6 taka liability in 2006.
Cash flow generated from operation to pay debt is highest in 2006.
Profitability Ratios
Gross Margin 24% 23% 23% 18% 22%
Operating Margin
Margin before interest and taxes
Pretax Margin 0% 4% 4% 4% 5%
Profit Margin 5% 3% 3% 3% 4%
ROA 3% 2% 2% 2% 2%
ROTC 3% 7% 6% 5% 6%
ROE 8% 4% 4% 3% 4%
Return on common equity 13% 7% 8% 7% 8%
Saiham textile's gross margin in 2006 is 22%.in 2002 is 24% that is maximum comparedto other years and indicate it managed its COGS most efficiently.
ROA is maximum in 2002 on the other hand ROE is maximum in 2002.
Saiham Textile (Leverage Ratios)Leverage
32

7/30/2019 Fin-408 Final Term Paper
http://slidepdf.com/reader/full/fin-408-final-term-paper 33/59
Operation Leverage Effect 4.41 4.87 6.00 4.48 4.42
Financial Leverage Effect 1.07 1.64 1.26 1.25 1.29
Total Leverage Effect 4.72 8.00 7.58 5.61 5.68
For one percent change in sales, EBIT could change by 6.00 times in 2004. It ismaximum change in EBIT that could take place.
For one percent change in EBIT, net income could change by 1.29 times in 2006. It ismaximum change in net income that could take place.
For one percent change in sales, net income could change by 5.68 times in 2006. It ismaximum change in net income that could take place.
33

7/30/2019 Fin-408 Final Term Paper
http://slidepdf.com/reader/full/fin-408-final-term-paper 34/59
Comparison the ratios with
industries
For the year 2002
Activity Analysis
Name of the RatioMonnoFabrics
DandyDyeing
HR Textile
SaihamTextile
PrimeTextile
IndusAvg.
Inventory Turnover 3.39x 1.42x 7.67x 1.72x 1.74x
Compared with the Industry Good Bad Good Bad Bad
Ave. no. of days Inventory 108 Days 257 Days
48
Days 212 Days 210 Days 167
Compared with the Industry Good Bad Good Bad BadReceivable Turnover 3.32x 36.30x 6.91x 24.48x 6.37x 1
Compared with the Industry Bad Good Bad Good Bad
Ave. no. of days Rec.outstanding 110 Days 10 Days
53Days 15 Days 57 Days 49
Compared with the Industry Bad Good Bad Good Bad
Payable Turnover 27.34x 5.21x 9.94x - 0.47x 1
Compared with the Industry Bad Bad Bad - Bad
Avg. No. of days Payable
Outstanding 13 Days 70 Days
37
Days 779 Days 225
Compared with the Industry Bad Bad Bad Bad Good
Fixed Asset Turnover 0.67x 1.18x 1.52x 0.99 0.41x
Compared with the Industry Bad Good Good Good Bad
Total Asset Turnover 0.48x 0.66x 0.90x 0.63 0.31x
Compared with the Industry Bad Good Good Good Bad
Interpretation of 2002
Monno Fabrics ; This firms inventory management is good compared to the industry
average. At the same time the firm lacks efficiency in the collection of receivables and in
the credit management or managing in the payables compared with the industry
average. The asset turnover ratios of the firm are also in worse position compared with
the industry average.
Dandy Dyeing: This firm is less efficient in inventory management but they are efficient
in receivables management compared to industry average. The firm also lacks in
34

7/30/2019 Fin-408 Final Term Paper
http://slidepdf.com/reader/full/fin-408-final-term-paper 35/59
managing the payables but the fixed asst turnover ratios are in good position compared
to industry average.
HR Textile: This firm is in good position in managing the inventory and fixed asset
turnover ratio compared to the industry average. The firm is suffering in managing the
receivables and inventory compared to the industry average.
Saiham Textile : This firm is only suffering through the management of inventory but
other then that the firms receivables and fixed turnover ratio is in good position
compared to the industry average.
Prime Textile : This firm is very seriously suffering in the management of inventory,
payables, receivables and in the fixed asset turnover compared to the industry average.
Liquidity Analysis
Name of the RatioMonnoFabrics
DandyDyeing
HR Textile
SaihamTextile
PrimeTextile
IndustryAvg.
Current Ratio 1.54x 1.36x 0.91x 1.12 1.18x 1.22x
Compared with the
Industry Good Good Bad Bad Bad
Quick Ratio 1.03x 0.10x 0.68x 0.28 0.41x 0.50x
Compared with theIndustry Good Bad Good Bad Bad
Cash Ratio 0.05x 0.09x 0.004 0.07 0.02x 0.05x
Compared with the
Industry Good Good Bad Good Bad
Monno Fabrics: this firm has a very good liquidity position compare to the industry average.
The firm is able to defend the indefinite cash crisis in future.
Dandy Dyeing: this firm has a good current ratio but the quick ratio is bad compared to the
industry average which indicates the firm has stored a huge number of inventory that’s the
reason of the difference between the current ratio and quick ratio. But the firm has a good cash
ratio compared to the industry average indicates the can survive without the support of operatin
income.
HR Textile: this firms current and cash ratio is in bad position compared to industry average
which is not a good indication but the quick ratio is good compared to the industry average.
35

7/30/2019 Fin-408 Final Term Paper
http://slidepdf.com/reader/full/fin-408-final-term-paper 36/59
Saiham Textile : the firm is struggling with the current and quick ratio but it has a good cash
ratio compared to the industry average indicates that the firm has other sources for which it can
survive for a period without the operating income.
Prime Textile : this firm is in very bad liquidity position compared with the industry average.
Debt Solvency Ratio
Monno
Fabrics
Dandy
Dyeing
HR
Textile
Saiham
Textile
Prime
Textile
Industry
Avg.
Debt to Total Capital 56.90% 91.57% 4.03% 30% 147.09% 65.86%Compared with the
Industry Good Bad Good Good Bad
Debt to equity Ratio 132.01% 1086.20% 7.84% 79% 180.22% 297.08%
Compared with theIndustry Good Good Bad Bad Bad
Times Interest Earned 1.50x 1.19x 21.00x 789.88%
Compared with the
Industry Bad Bad Bad Bad Good
CFO to Debt Ratio 0.13x 0.09x 1.20x 0.24 0.11x 35.49%
Compared with the
Industry Bad Bad Good Bad Bad
Dandy Dyeing : the firm is in good position in the Debt to equity Ratio but the
Debt to Total Capital
Times Interest Earned and CFO to Debt Ratio is in bad position Compared with the
Industry average indicates the firm has less access to the internal fund and as the
debt is high so their income is not good enough to pay the interest.
HR Textile ; this firm has good access to internal fund but so the debt is very low that’s whythe cash flow generated is enough to pay the debt compared to the industry average.
Saiham Textile: the Debt to Total Capital of this firm is good position at the same timeDebt to
equity Ratio is in bad position compared to the industry average. as a result the cash flow
generated is not enough to repay the debt.
36

7/30/2019 Fin-408 Final Term Paper
http://slidepdf.com/reader/full/fin-408-final-term-paper 37/59
Prime Textile: except the TIE ratio this firm has bad position in the Debt to Total Capital, Debt
to equity Ratio and CFO to Debt Ratio compared to the industry average.
Monno Fabrics : this firm has a good debt to capital and debt to equity ratio according to
industry average. At the same time TIE and CFO to Debt ratio is not good indicates the doest not
hae enough earning to pay the interst.
Protitability Analysis
Name of the Ratio
Monno
Fabrics
Dandy
Dyeing
HR
Textile
Saiham
Textile
Prime
Textile
Industry
Avg.
Gross Margin 23.59% 31.50%
12.17
% 23.86% 17.88% 21.80%
Compared with the
Industry Good Good Bad Good Bad
Oparating Margin 21.31% 16.02% 4.61% - 3.83% 11.44%
Compared with the
Industry Good Good Bad - Bad
Margin BIT 21.33% 16.02% 4.38% - 3.83% 11.39%Compared with theIndustry Good Good Bad - Bad
Pretax Margin 6.78% 2.61% 4.38% 0.00% 3.65% 3.49%
Compared with the
Industry Good Bad Good Bad Good
Profit Margin 6.78% 2.61% 4.29% 5.05% 2.84% 4.31%
Compared with the
Industry Good Bad Bad Good Bad
ROA 10.05% 10.85% 4.04% 3.21% 1.19% 5.87%
Compared with the
Industry Good Good Bad Bad Bad
Return on Capital 10.41% 13.91%12.98
% 3.43% 2.30% 8.61%
Compared with theIndustry Good Good Good Bad Bad
ROE 7.94% 17.50% 7.71% 8.44% 2.68% 8.85%
Compared with the Bad Good Bad Bad Bad
37

7/30/2019 Fin-408 Final Term Paper
http://slidepdf.com/reader/full/fin-408-final-term-paper 38/59
Industry
Return on Common
Equity 9.34% 8.17% 9.64% 12.66% 5.79% 9.12%
Compared with the
Industry Good Bad Good Good Bad
Monno Fabrics ; this firm has a good profitability position in the industry only the retun on
equity is in the bad position compared to the industry.
Dandy Dyeing : the firm has good earnings position is not satisfactory as a result the return on
equity is not good compared to the industry average.
HR Textile : this firms earnings is not satisfactory compared to the industry average but the
return to capital is good and they provide a good return to their common stock holder.
Saiham Textile: this firm has agood earning capacity but the ROA and ROE and ROC is not
good compared to the industry average. Despite of all this the firms return on common equity is
good compared to industry.
Prime Textile ; this firm is strolling with the earnings and as well as with the ROA, ROE and
ROC is in the bad position compared with the industry.
Leverage
Operating LeverageMonnoFabrics
DandyDyeing
HR Textile
SaihamTextile
PrimeTextile
IndustryAvg.
Operating LeverageEffect 1.11 1.97 2.64x 4.41 4.67 2.96
Compared with theIndustry Good Good Good Bad Bad
Fin Leverage Effect 3.14 6.13 1.08x 1.07 1.35 2.55
Compared with the
Industry Bad Good Bad Bad Bad
Total Leverage Effect 3.48 12.05 2.84x 4.72 6.31 5.88
Compared with the
Industry Bad Good Bad Bad Good
Dandy Dyeing : this firms OLE and FLE is in good position as a result the TLE is indicating
positive result but for any reason if the sales changes negatively then the profit will also decline
by 12.05 times.
38

7/30/2019 Fin-408 Final Term Paper
http://slidepdf.com/reader/full/fin-408-final-term-paper 39/59
HR Textile : this firm has a good number of operating leverage but the firms financial leverage
is very low as a result the TLE is low indicates that if the sales change by 1 percent positively or
negatively then the profit will be affected by 2.84 times.
Saiham Textile: This firm OLE, FLE, and TLE is in bad position compared to industry average.
The TLE is indicates that if the sales change by 1 percent positively or negatively then the profit
will be affected by 4.72 times.
Prime Textile: the firms OLE and FLE are in bad position but the TLE is in good position
indicates that if the sales change by 1 percent positively or negatively then the profit will be
affected by 4.72 times.
Monno Fabrics : this firm has a good OLE but the FLE is very high as result the TLE is badwhich indicates the company has a significant possibility to be effected negatively with the
change in the sale.
2003 interpretation…………………
Activity Analysis
Name of the RatioMonnoFabrics
DandyDyeing
HR Textile
SaihamTextile
PrimeTextile
IndusAvg.
Inventory Turnover 3.93x 1.22x 8.57x 1.772 2.71x
Compared with the Industry Bad Good Bad Good Good
Ave. no. of days Inventory 93 Days 299 Days43
Days 206 135 Days 155
Compared with the Industry Good Bad Good Bad Good
Receivable Turnover 2.81x 176.81x 5.25x 35.68 6.15x 4
Compared with the Industry Bad Good Bad Bad Bad
Ave. no. of days Rec.
outstanding 130 Days 2 Days
70
Days 10.23 59 Days 54
Compared with the Industry Bad Good Bad Good Bad
Payable Turnover 10.36x 3.37x 11.09x - 0.24x
Compared with the Industry Bad Good Bad - Good
Avg. No. of days PayableOutstanding 35 Days 108 Days
33Days -
1526Days 426
Compared with the Industry Bad Bad Bad - Good
Fixed Asset Turnover 0.77x 0.83x 1.67x 1.05 0.62x
Compared with the Industry Bad Bad Good Good Bad
Total Asset Turnover 0.50x 0.66x 0.93x 0.67 0.45x
Compared with the Industry Bad Good Good Good Bad
39
7/30/2019 Fin-408 Final Term Paper
http://slidepdf.com/reader/full/fin-408-final-term-paper 40/59
Monno Fabrics: the firm is suffering in the management of inventory, receivables collection, in
credit management and in the asset turnover ratios compared to the industry average.
Dandy Dyeing: the firm has good control over the inventory management and receivablescollection the firm is also showing a good control over credit management compared to the
industry. The asset turnover ratios are not satisfactory compared to industry.
HR Textile ; the firm lacks in managing the inventory, collecting receivables and delaying the
payment of payable but the asset turn over ratios are satisfactory compared top industry.
Saiham Textile: the firms control over the inventory and receivables is not satisfactory but theasset turns over ratios are satisfactory compared to industry. The firm has no access to the
payables which is not a good sign.
Prime Textile : this firms efficiency over inventory and receivables is satisfactory but the payables position is not good compared to industry. The firms asset turn over ratios are good
Liquidity Analysis
Name of the Ratio
Monno
Fabrics
Dandy
Dyeing
HR
Textile
Saiham
Textile
Prime
Textile
Industry
Avg.
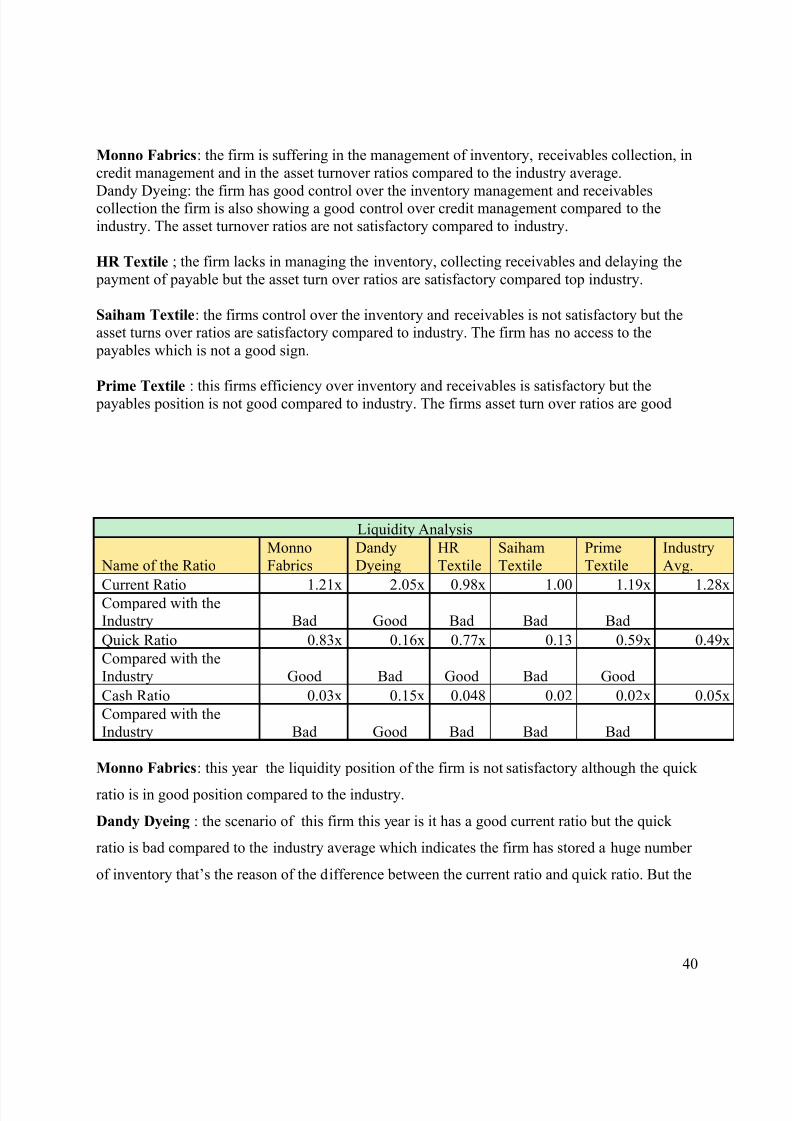
Current Ratio 1.21x 2.05x 0.98x 1.00 1.19x 1.28xCompared with theIndustry Bad Good Bad Bad Bad
Quick Ratio 0.83x 0.16x 0.77x 0.13 0.59x 0.49x
Compared with the
Industry Good Bad Good Bad Good
Cash Ratio 0.03x 0.15x 0.048 0.02 0.02x 0.05x
Compared with the
Industry Bad Good Bad Bad Bad
Monno Fabrics: this year the liquidity position of the firm is not satisfactory although the quick
ratio is in good position compared to the industry.
Dandy Dyeing : the scenario of this firm this year is it has a good current ratio but the quick
ratio is bad compared to the industry average which indicates the firm has stored a huge number
of inventory that’s the reason of the difference between the current ratio and quick ratio. But the
40

7/30/2019 Fin-408 Final Term Paper
http://slidepdf.com/reader/full/fin-408-final-term-paper 41/59
firm has a good cash ratio compared to the industry average indicates the can survive without the
support of operating income.
HR Textile: this year the liquidity position of the firm is not satisfactory although the quick ratio
is in good position compared to the industry.
Prime Textile: this year the liquidity position of the firm is not satisfactory although the quick
ratio is in good position compared to the industry.
Saiham Textile; this year the firm is seriously suffering through the liquidity position compared
to the industry average.
Debt Solvency Ratio
Name of the Ratio
Monno
Fabrics
Dandy
Dyeing
HR
Textile
Saiham
Textile
Prime
Textile
Industry
Avg.
Debt to Total Capital 54.71% 96.81% 5.26% 11% 130.68% 59.68%
Compared with the
Industry Good Bad Good Good Bad
Debt to equity Ratio 120.80% 3033.46% 10.58% 19% 176.38% 672.06%
Compared with the
Industry Good Bad Good Good Good
Times Interest Earned - 0.84x - 1.26 21.00x 461.90%
Compared with the
Industry Bad Bad Bad Bad Good
CFO to Debt Ratio 0.14x 0.10x 2.75x 3.26 0.08x 126.58%
Compared with theIndustry Bad Bad Good Good Bad
Monno Fabrics: this year the Debt to equity Ratio and the Debt to Total Capital ratio is in good
position but the TIE and CFO to Debt Ratio is in bad position which is not a good indication
compared to industry average.
Prime Textile: this year the Debt to Total Capital is in bad position but the Debt to equity Ratio
and the TIE ratio is in good position compared to industry average which is good.
HR Textile ; this year the Debt to equity Ratio, the Debt to Total Capital ratio and CFO to Debt
Ratio is in good position but the TIE ratio is in bad position which is not a good indication
41

7/30/2019 Fin-408 Final Term Paper
http://slidepdf.com/reader/full/fin-408-final-term-paper 42/59
compared to industry average. It shows the firm is not having enough cash flow to repay the
debt.
Saiham Textile: this year the Debt to equity Ratio, the Debt to Total Capital ratio and CFO to
Debt Ratio is in good position but the TIE ratio is in bad position which is not a good indication
compared to industry average. It shows the firm is not having enough cash flow to repay the
debt.
Dandy Dyeing: the solvency position of this firm this very is very poor compared to the
industry average.
Protitability Analysis
Name of the Ratio
Monno
Fabrics
Dandy
Dyeing
HR
Textile
Saiham
Textile
Prime
Textile
Industry
Avg.
Gross Margin 23.62% 30.03%
11.36
% 23.05% 11.31% 19.88%
Compared with the
Industry Good Good Bad Good Bad
Oparating Margin 7.15% 10.81% 3.74% - 2.48% 6.04%
Compared with the
Industry Good Good Bad - Bad
Margin BIT 7.17% 10.81% 4.38% - 2.48% 6.21%
Compared with theIndustry Good Good Bad - Bad
Pretax Margin 6.83% -2.11% 3.54% 4.43% 2.36% 3.01%Compared with the
Industry Good Bad Good Good Bad
Profit Margin 6.83% -2.11% 3.54% 2.88% 1.80% 2.59%
Compared with theIndustry Good Bad Good Good Bad
ROA 3.51% 7.08% 3.37% 2.06% 1.10% 3.43%
Compared with the
Industry Good Good Bad Bad Bad
Return on Capital 3.94% 9.78%
11.13
% 6.79% 2.01% 6.73%
Compared with theIndustry Bad Good Good Good Bad
ROE 16.75% -33.88% 6.63% 3.91% 2.59% -0.80%
Compared with the
Industry Bad Good Bad Bad Bad
Return on Common
Equity 10.34% -6.56% 8.40% 7.20% 5.53% 4.98%
42

7/30/2019 Fin-408 Final Term Paper
http://slidepdf.com/reader/full/fin-408-final-term-paper 43/59

7/30/2019 Fin-408 Final Term Paper
http://slidepdf.com/reader/full/fin-408-final-term-paper 44/59
Monno Fabrics: this year the firm has a good OLE but the FLE is in bad position as a result the
TLE is in bad position bad which indicates the company has a significant possibility to be
affected negatively in the profit 3.46 times with the change in the sale by 1 percent .
44

7/30/2019 Fin-408 Final Term Paper
http://slidepdf.com/reader/full/fin-408-final-term-paper 45/59
For the year 2004
Monno fabrics: The company is struggling with its short term activities. Compared withthe industry average its performance on managing inventory is good but payable andreceivable management is bad.Dandy dyeing: This company is doing very good with its short term activities. It isperforming well in Inventory, receivable and payable management compared to theindustry average.HR Textile: The company is struggling with its short term activities. Compared with theindustry average its performance on managing inventory is bad and payable andreceivable management is also bad.Saiham textile: This company’s efficiency on short term activities is fair compared to theindustry. Compared to the industry average it is good performing on its inventory and badperforming in receivable management.Prime textile: Compared to the industry average its performance in managing inventoryis good, but receivables and payable is poor. So it can be said that the company is notefficient in its short term activities compared to the other companies in the industry.
Monno febrics: This company is not efficient on its long term activity. Its performance omanaging both fixed assets and total assets is bad compared with the industry average.
Activity Analysis
Name of the Ratio Monno Dandy HR
Saiha
m Prime
Industry
Avg.Inventory Turnover 3.94x 1.24x 9.66x 2.045 3.83x 4.14x
Compared with the Industry Good Good Bad Good Good
Ave. no. of days Inventory93
Days293Days
38Days 178 95 Days 139 Days
Compared with the Industry Good Bad Good Bad Good
Receivable Turnover 2.60x150.39
x 9.38x 37.36 5.66x 41.08x
Compared with the Industry Bad Good Bad Bad Bad
Ave. no. of days Rec. outstanding140Days 2 Days
39Days 9.77 64 Days 51 Days
Compared with the Industry Bad Good Good Good Bad
Payable Turnover 8.67x 3.42x15.59
x - 0.11x 6.95x
Compared with the Industry Bad Good Bad - Good
Avg. No. of days Payable Outstanding42
Days107Days
23Days -
3211Days 846 Days
Compared with the Industry Bad Bad Bad - Good
Fixed Asset Turnover 0.78x 0.79x 1.82x 1.20 0.81x 1.08x
Compared with the Industry Bad Bad Good Good Bad
Total Asset Turnover 0.53x 0.68x 1.08x 0.77 0.58x 0.73x
Compared with the Industry Bad Bad Good Good Bad
45

7/30/2019 Fin-408 Final Term Paper
http://slidepdf.com/reader/full/fin-408-final-term-paper 46/59
Dandy dyeing: This company is not efficient on its long term activity. Its performance onmanaging both fixed assets and total assets is poor compared with the industry average.HR Textile: This company is very efficient on its long term activity. Its performance onmanaging both fixed assets and total assets is good compared with the industry average.Saiham textile: This company is very efficient on its long term activity. Its performanceon managing both fixed assets and total assets is good compared with the industryaverage.
Liquidity Analysis
Name of the Ratio Monno Dandy
HR
Textile
Saiha
m
Prim
e Industry AvCurrent Ratio 1.14x 1.73x 0.97x 1.04 1.16x 1.21x
Compared with the Industry Bad Good Bad Bad Bad
Quick Ratio 0.80x 0.04x 0.71x 0.26 0.62x 0.49x
Compared with the Industry Good Bad Good Bad Good
Cash Ratio 0.03x 0.01x 0.033 0.03 0.02x 0.03x
Compared with the Industry Good Bad Good Good Bad
46

7/30/2019 Fin-408 Final Term Paper
http://slidepdf.com/reader/full/fin-408-final-term-paper 47/59
Protitability Analysis
Name of the Ratio Monno DandyHR
TextileSaiham
Prime
IndustryAvg.
Gross Margin23.63
% 28.33% 10.53%22.69
%9.54
% 18.95%
Compared with the Industry Good Good Bad Good Bad
Oparating Margin 6.30% 3.98% 2.70% -2.17
% 3.79%
Compared with the Industry Good Good Bad - Bad
Margin BIT 6.32% 3.98% 3.54% - 2.17%
4.00%
Compared with the Industry Good Bad Bad - Bad
Pretax Margin 5.97% -8.23% 2.55% 3.52% 2.07%
1.18%
Compared with the Industry Good Bad Good Good Good
Profit Margin 5.97% -8.23% 2.33% 2.99% 1.45%
0.90%
Compared with the Industry Good Bad Good Good Good
ROA 3.11% 2.61% 2.60% 2.32% 1.27
%
2.38%
Compared with the Industry Good Good Good Bad Bad
Return on Capital 3.60% 3.43% 8.73% 5.87% 2.22%
4.77%
Compared with the Industry Bad Bad Good Good Bad
ROE 14.49%
-2649.86
%
5.91% 3.64% 2.84%
-524.59%
Compared with the Industry Bad Good Bad Bad Bad
Return on Common Equity 9.23% -24.76% 7.48% 7.91% 5.63%
1.10%
Compared with the Industry Good Bad Good Good Good
Debt Solvency Ratio
MonnoFabrics
DandyDyeing
HR Textile
Saiham Textile
Prime Textile
IndustrAvg.
Debt to Total Capital 52.86% 102.97%11.35
% 6% 126.38% 59.87%Compared with theIndustry Good Bad Good Good Bad
Debt to equity Ratio 112.12% -3471.86%24.37
% 10% 170.09% -631.13Compared with theIndustry Good Bad Good Good Good
Times Interest Earned - 0.33x
- 1.20 21.00x 450.52%Compared with theIndustry Bad Bad Bad Bad Good
CFO to Debt Ratio 0.17x 0.09x 0.89x 1.32 0.09x 51.17%Compared with theIndustry Bad Bad Good Good Bad
Monno Febrics: Compared to the industry average it usesnot too much debt more over its times
interest earned is not good. its CFO to debt ratio is poor. So overall it became a very risky firm onthis industry.
Dandy dyeing: Its debt management is very poor. Its times interest earned is bad.
HR textile: it debt for this year is good also time interest earned is nil. so it is a less risky firm.
Saiham textile: This firm is using very low portion of debt in this year, but it compared to the
industry it has not sufficient earnigs to pay its interest and its CFO to debt ratio is also good
compared to the industry. So it can be said that the firm is able to borrow fund but not using it.
That’s not a very good news for the investors.
Prime textile: This firm is using very high debt in this year, but it compared to the industry it hassufficient earnings to pay its interest and its CFO to debt ratio is bad compared to the industry.
47
7/30/2019 Fin-408 Final Term Paper
http://slidepdf.com/reader/full/fin-408-final-term-paper 48/59
Monno febrics: Compared to the industry its margin ratios are good but it is notdoing well in managing its capital and equity.Dandy dyeing: On an average the profitability of this company is not good.HR textile: Its profit margin is good, but it is not doing well in managing its equity.Saiham textile: it’s all profitability ratios are good compared with the industryaverage. In fact it is one of the best profitable company in this industry of this year.Prime textile: the company is struggling with its management of production activity(related to cost of goods sold) but apart from that it’s profitability condition is goodcompared to the industry average.
48

7/30/2019 Fin-408 Final Term Paper
http://slidepdf.com/reader/full/fin-408-final-term-paper 49/59
Activity Analysis
Name of the Ratio Monno Dandy HRSaiham Prime
IndustryAvg.
Inventory Turnover 3.29x 1.23x 8.77x 1.791 3.27x 3.6Compared with the Industry Good Good Bad Good Good
Ave. no. of days Inventory111Days
296Days
42Days 204
111Days 153 Da
Compared with the Industry Good Bad Good Bad Good
Receivable Turnover 2.15x136.19
x 8.64x 34.09 6.51x 37.5Compared with the Industry Bad Good Bad Bad Bad
Ave. no. of days Rec. outstanding170Days 3 Days
42Days 10.71
56Days 56 Da
Compared with the Industry Bad Good Good Good GoodPayable Turnover 12.20x 4.77x 21.63 - 0.32x 9.7
Leverage
Operating LeverageMonnoFabrics
DandyDyeing
HR Textile
Saiham Textile
Prime Textile
IndustryAvg.
Operating LeverageEffect 3.75 7.12 3.90x 6.00 4.40 5.Compared with theIndustry Good Bad Good Bad GoodFin Leverage Effect 1.05 -0.48 1.16x 1.26 1.49 0.Compared with theIndustry Bad Good Bad Bad BadTotal Leverage Effect 3.96 -3.44 4.52x 7.58 6.57 3.Compared with theIndustry Bad Good Bad Bad Bad
Monno febrics: it has a good OLE, but its too high FLE and TLE made it as a risky firm in theindustry.Dandy dyeing: : it has a bad OLE, but its too low FLE and TLE made it as a less risky firm in theindustry.HR textile: it has a good OLE, but its too high FLE and TLE made it as a risky firm in the industry.Saiham textile:Its overall leverage scenario is poor campared with the industry average.Prime textile: it has a good OLE, but its too high FLE and TLE made it as a risky firm in the industr
49

7/30/2019 Fin-408 Final Term Paper
http://slidepdf.com/reader/full/fin-408-final-term-paper 50/59
xCompared with the Industry Bad Good Bad - GoodAvg. No. of days PayableOutstanding
30Days
76Days
17Days -
1143Days 317 Da
Compared with the Industry Bad Bad Bad - GoodFixed Asset Turnover 0.64x 0.85x 1.68x 0.97 0.75x 0.98Compared with the Industry Bad Bad Good Bad Bad
Total Asset Turnover 0.43x 0.71x 1.02x 0.62 0.55x 0.6Compared with the Industry Bad Good Good Bad Bad
Liquidity Analysis
Name of the Ratio Monno Dandy HRSaiha
mPrim
eIndustry
Avg.Current Ratio 1.20x 1.51x 0.90x 0.76 1.14x 1.10xCompared with the Industry Good Good Bad Bad GoodQuick Ratio 0.84x -0.50x 0.67x 0.16 0.41x 0.32x
Monno fabrics: The company is struggling with its short term activities. Compared with theindustry average its performance on managing inventory is good but payable and receivablemanagement is bad.
Dandy dyeing: This company is doing good with its short term activities. It is performing wellin Inventory, receivable and payable management compared to the industry average.HR Textile: The company is struggling with its short term activities. Compared with theindustry average its performance on managing inventory is bad and payable and receivablemanagement is also bad.Saiham textile: This company’s efficiency on short term activities is fair compared to theindustry. Compared to the industry average it is good performing on its inventory and badperforming in receivable management.Prime textile: Compared to the industry average its performance in managing inventory isgood, but receivables turnover is bad and payable is good. So it can be said that the company isnot efficient in its short term activities compared to the other companies in the industry.Monno febrics: This company is not efficient on its long term activity. Its performance on
managing both fixed assets and total assets is bad compared with the industry average.Dandy dyeing: This company is more or less efficient on its long term activity. Its performanceon managing fixed assets is bad but total assets is good compared with the industry average.HR Textile: This company is very efficient on its long term activity. Its performance onmanaging both fixed assets and total assets is good compared with the industry average.Saiham textile: This company is very inefficient on its long term activity. Its performance onmanaging both fixed assets and total assets is bad compared with the industry average.Prime textile: This company is also not very efficient on its long term activity. Its performanceon managing both fixed assets and total assets is poor compared with the industry average.
50

7/30/2019 Fin-408 Final Term Paper
http://slidepdf.com/reader/full/fin-408-final-term-paper 51/59
Compared with the Industry Good Bad Good Bad GoodCash Ratio 0.01x -0.51x 0.04x 0.01 0.03x -0.08xCompared with the Industry Bad Good Bad Bad Bad
Monno febrics: Its current and quick ratios are higher than the industry average butit has a bad cash ratio than that of the industry. Now as most of the time we cannotconvert the current assets (except cash) into cash, we consider the cash ratio as themost conservative measurement of the liquidity position of the firm. In that case wecan say this firm’s liquidity position is not good in the industry.Dandy dyeing: Its liquidity and cash position is very good compared to the industryaverage.HR textile: It is struggling with liquidity positionSaiham textile: this company also struggling with liquidity position, infact the worstin case of liquidityPrime textile: It has very good current and good quick ratio but its cash ratio is lowerthan the industry average. So we can say its liquidity position is quite bad.
Debt Solvency Ratio
Monno Dandy HRSaiham Prime
IndustryAvg.
Debt to Total Capital49.46
%108.11
%13.69
% 13%130.82
% 63.05%Compared with theIndustry Good Bad Good Good Bad
Debt to equity Ratio97.88
%
-1332.91
%31.82
% 29%163.27
% -202.26%Compared with the
Industry Good Bad Good Good Good
Times Interest Earned
- 0.50x
- 1.29 21.00x 455.82%Compared with theIndustry Bad Bad Bad Bad GoodCFO to Debt Ratio 0.17x 0.06x 1.30x -0.19 0.04x 27.67%Compared with theIndustry Bad Bad Good Bad Bad
51

7/30/2019 Fin-408 Final Term Paper
http://slidepdf.com/reader/full/fin-408-final-term-paper 52/59
Monno Febrics: Compared to the industry average it uses not too much debt moreover its times interest earned is not good. its CFO to debt ratio is poor. So overall itbecame a very risky firm on this industry.
Dandy dyeing: Its debt management is very poor. Its times interest earned is bad.everything is poor so its the most risky in this yearHR textile: it debt for this year is good also time interest earned is nil. so it is a lessrisky firm.Saiham textile: This firm is using very low portion of debt in this year, but it comparedto the industry it has not sufficient earnigs to pay its interest and its CFO to debt ratiois also good compared to the industry. So it can be said that the firm is able to borrowfund but not using it. That’s not a very good news for the investors.Prime textile: This firm is using very high debt in this year, but it compared to theindustry it has sufficient earnings to pay its interest and its CFO to debt ratio is badcompared to the industry.
Protitability Analysis
Name of the Ratio Monno DandyHR
TextileSaiham Prime
IndustryAvg.
Gross Margin23.70
% 31.72% 13.11%17.91
%10.22
% 19.33%Compared with theIndustry Good Good Bad Bad BadOparating Margin 5.47% 5.77% 2.95% - 2.10% 4.07%
Compared with theIndustry Good Good Bad - BadMargin BIT 5.48% 5.77% 3.54% - 2.10% 4.22%Compared with theIndustry Good Good Bad - BadPretax Margin 5.22% -5.68% 2.86% 4% 2.00% 1.63%Compared with theIndustry Good Bad Good Good GoodProfit Margin 5.22% -5.68% 2.51% 3% 2.00% 1.45%Compared with theIndustry Good Bad Good Good GoodROA 2.18% 4.18% 2.65% 2% 1.16% 2.39%Compared with theIndustry Bad Good Good Bad BadReturn on Capital 2.46% 5.85% 9.60% 5% 2.07% 4.90%Compared with theIndustry Bad Good Good Bad Bad
ROE 9.43%105.39
% 6.79% 3% 2.47% 25.49%Compared with the Bad Good Bad Bad Bad
52

7/30/2019 Fin-408 Final Term Paper
http://slidepdf.com/reader/full/fin-408-final-term-paper 53/59
Industry
Return on Common Equity 6.22%-
18.59% 8.49% 7% 7.00% 2.11%Compared with theIndustry Good Bad Good Good Good
Monno febrics: Compared to the industry its margin ratios are good but it is notdoing well in managing its assets, capital and equity.Dandy dyeing: On an average the profitability of this company is bad.HR textile: Its profit margin is good, and also i doing well in managing its assets,capita and lequity.Saiham textile: it’s all profitability ratios are good compared with the industryaverage.but it is not doing well in managing its assets, capital and equity.Prime textile: the company is struggling with its management of production activity(related to cost of goods sold) but apart from that it’s profitability condition is goodcompared to the industry average.
Leverage
Operating Leverage Monno Dandy HRSaiham Prime
IndustryAvg.
Operating Leverage Effect 4.33 5.50 4.45x 4.48 4.86 4.72Compared with theIndustry Good Bad Good Good BadFin Leverage Effect 1.05 -1.01 1.18x 1.25 1.05 0.70Compared with theIndustry Bad Good Bad Bad Bad
Total Leverage Effect 4.54 -5.58 5.23x 5.61 5.10 2.98
Compared with theIndustry Bad Good Bad Bad Bad
Monno febrics: it has a good OLE, but its too high FLE and TLE made it as a riskyfirm in the industry.Dandy dyeing: : it has a bad OLE, but its too low FLE and TLE made it as a less riskyfirm in the industry.HR textile: it has a good OLE, but its too high FLE and TLE made it as a risky firm inthe industry.Saiham textile:I it has a good OLE, but its too high FLE and TLE made it as a risky
firm in the industry.Prime textile: its overall leverage scenario is poor campared with the industryaverage.
53
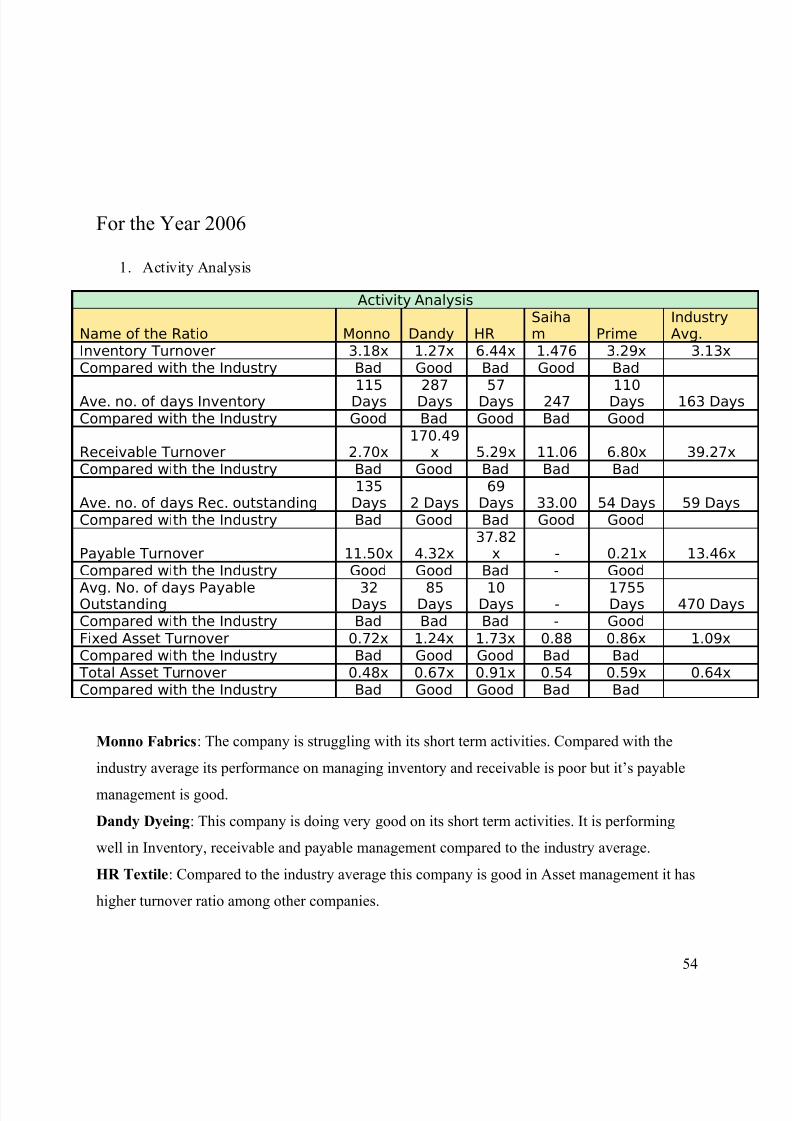
7/30/2019 Fin-408 Final Term Paper
http://slidepdf.com/reader/full/fin-408-final-term-paper 54/59
For the Year 2006
1. Activity Analysis
Activity Analysis
Name of the Ratio Monno Dandy HRSaiham Prime
IndustryAvg.
Inventory Turnover 3.18x 1.27x 6.44x 1.476 3.29x 3.13xCompared with the Industry Bad Good Bad Good Bad
Ave. no. of days Inventory 115Days 287Days 57Days 247 110Days 163 DaysCompared with the Industry Good Bad Good Bad Good
Receivable Turnover 2.70x170.49
x 5.29x 11.06 6.80x 39.27xCompared with the Industry Bad Good Bad Bad Bad
Ave. no. of days Rec. outstanding135Days 2 Days
69Days 33.00 54 Days 59 Days
Compared with the Industry Bad Good Bad Good Good
Payable Turnover 11.50x 4.32x37.82
x - 0.21x 13.46xCompared with the Industry Good Good Bad - Good
Avg. No. of days PayableOutstanding
32Days
85Days
10Days -
1755Days 470 Days
Compared with the Industry Bad Bad Bad - Good
Fixed Asset Turnover 0.72x 1.24x 1.73x 0.88 0.86x 1.09xCompared with the Industry Bad Good Good Bad Bad
Total Asset Turnover 0.48x 0.67x 0.91x 0.54 0.59x 0.64xCompared with the Industry Bad Good Good Bad Bad
Monno Fabrics: The company is struggling with its short term activities. Compared with the
industry average its performance on managing inventory and receivable is poor but it’s payable
management is good.
Dandy Dyeing: This company is doing very good on its short term activities. It is performing
well in Inventory, receivable and payable management compared to the industry average.
HR Textile: Compared to the industry average this company is good in Asset management it has
higher turnover ratio among other companies.
54

7/30/2019 Fin-408 Final Term Paper
http://slidepdf.com/reader/full/fin-408-final-term-paper 55/59
Saiham Textile: This company’s efficiency on short term activities is very low compared to the
industry. Compared to the industry average it is poorly performing on its receivable and payable
management, though its inventory turnover is poor
Prime Textile: Compared to the industry average its performance in managing inventory,
receivables and payables is good. So it can be said that the company is efficient in its short term
activities compared to the other companies in the industry.
Liquidity Analysis
Monno Fabrics: The liquidity ratios of this company is poorly performing compared to industry
average.
Dandy Dyeing: Its liquidity position is good compared to the industry average.
HR Textile: Its liquidity position is also not good in case of current ratio. But it’s other liquidity
ratios are good compared to the industry average.
Saiham Textile: It has poorly performing current and quick ratio but its cash ratio is higher than
the industry average. So we can say its liquidity position is quite fair but it may face problem in
converting non-cash current assets in cash in the time of necessity.
Prime Textile: It has bad current and cash ratio but its quick ratio is higher than the industry
average. So we can say its liquidity position is quite fair but it may face problem in converting
non-cash current assets in cash in the time of necessity.
Liquidity Analysis
Name of the Ratio Monno Dandy HR Saiham Prime Industry Avg.Current Ratio 1.08x 1.68x 0.98x 1.12 1.10x 1.19xCompared with the Industry Bad Good Bad Bad BadQuick Ratio 0.65x 0.07x 0.59x 0.37 0.52x 0.44xCompared with the Industry Good Bad Good Bad GoodCash Ratio 0.02x 0.06x 0.04x 0.05 0.02x 0.04xCompared with the Industry Bad Good Good Good Bad
55

7/30/2019 Fin-408 Final Term Paper
http://slidepdf.com/reader/full/fin-408-final-term-paper 56/59
Debt Solvency Ratio
Debt Solvency Ratio
Name of the Ratio
MonnoFabrics
DandyDyeing
HR Textile
Saiham Textile
Prime Textile
IndustryAvg.
Debt to Total Capital47.04
% 110.26%25.36
% 4% 114.65% 60.21%Compared with the
Industry Good Bad Good Good Bad
Debt to equity Ratio88.82
%
-1074.70
%79.26
% 6% 159.05%-
148.27%Compared with theIndustry Good Bad Good Good Good
Times Interest Earned
- 0.10x
- 1.29 20.99x 4.48xCompared with theIndustry - Bad - Bad GoodCFO to Debt Ratio 0.23x 0.16x 0.10x 5.27 0.08x 116.97%Compared with the
Industry Bad Bad Bad Good Bad
Monno Fabrics: Compared to the industry average it accepted level of debt more over it does
not have times interest earned. Its CFO to debt ratio is poor. So overall it became a less risky
firm on this industry.
Dandy Dyeing: Its debt management is very poor.
HR Textile The firm is using liberal debt compare to the industry and it debt to equity ratio is
better. It does not have TIE ratio and CFO ratio performing poorly.
Saiham Textile: The firm is using a very little number of debt compare to the industry and it
debt to equity ratio is better. Though shareholder’s are losing some extra gain as the debt amount
is small. TIE ratio performing poorly and CFO ratio is good.
56

7/30/2019 Fin-408 Final Term Paper
http://slidepdf.com/reader/full/fin-408-final-term-paper 57/59
Prime Textile: This firm is using very high debt in this year, but it compared to the industry it
has sufficient earnings to pay its interest cost and its CFO to debt ratio is not good compared to
the industry.
Profitability Analysis
Protitability Analysis
Name of the RatioMonnoFabrics
DandyDyeing
HR Textile
Saiham Textile
Prime Textile
IndustryAvg.
Gross Margin 22.04% 23.98%14.16
% 22% 9.62% 18.36%Compared with theIndustry Good Good Bad Good BadOparating Margin 4.82% 1.28% 2.85% - 3.00% 2.99%Compared with theIndustry Good Bad Bad - GoodMargin BIT 4.88% 1.28% 2.55% - 3.00% 2.93%Compared with theIndustry Good Bad Bad - GoodPretax Margin 4.65% -11.44% 2.76% 5% 2.85% 0.68%
Compared with theIndustry Good Bad Good Good GoodProfit Margin 4.65% -11.44% 2.34% 4% 2.71% 0.43%Compared with theIndustry Good Bad Good Good GoodROA 2.20% 0.82% 2.41% 2% 1.78% 1.89%Compared with theIndustry Good Bad Good Good BadReturn on Capital 2.51% 1.17% 8.17% 6% 2.94% 4.11%Compared with theIndustry Bad Bad Good Good BadROE 9.23% 113.72% 7.79% 4% 3.89% 27.66%
Compared with theIndustry Bad Good Bad Bad BadReturn on CommonEquity 6.09% -32.29% 9.59% 8% 10.61% 0.42%Compared with theIndustry Good Bad Good Good Good
57

7/30/2019 Fin-408 Final Term Paper
http://slidepdf.com/reader/full/fin-408-final-term-paper 58/59
Monno Fabrics: Compared to the industry its margin ratios are good but it is doing bad in
managing its capital.
Dandy Dyeing: On an average the profitability of this company is bad. In fact it is good in terms
of gross margin and ROE compare to industry.
HR Textile: The company is in a good position in case of pretax margin, profit margin, ROA
and ROTC.
Saiham Textile: except the ROE it’s all other profitability ratios are good compared with the
industry average.
Prime Textile: the company is struggling with its management of production activity (related to
cost of goods sold) but apart from that it’s profitability condition is very good compared to the
industry average.
Leverage
Leverage
Operating LeverageMonnoFabrics
DandyDyeing
HR Textile
Saiham Textile
Prime Textile
IndustryAvg.
Operating LeverageEffect 4.57 18.70 4.97x 4.42 3.21 7.17Compared with theIndustry Good Good Bad Bad Bad
Fin Leverage Effect 1.04 -0.11 1.22x 1.29 1.11 0.91Compared with theIndustry Bad Bad Good Good Good
Total LeverageEffect 4.74 -2.10 6.04x 5.68 3.55 3.58Compared with theIndustry Bad Good Bad Bad Good
Monno Fabrics: It has a good OLE, but it’s too high FLE and TLE made it as a risky firm in the
industry.
Dandy Dyeing: it has efficiency in managing variable costs, but it’s poor FLE and TLE allows it
in a bad position in the industry.
HR Textile: this year it is struggling with losses, and due to its poor leverage ratios it will have
to increase its sale at a huge level.
58

7/30/2019 Fin-408 Final Term Paper
http://slidepdf.com/reader/full/fin-408-final-term-paper 59/59
Saiham Textile: it is managing its financial fixed cost efficiently compared with the industry,
but its too high leverage ratios made it very risky.
Prime Textile: Its overall leverage scenario is good campared with the industry average.
Recommendation
The analysis was based on the annual report provided by the firm. If an individual want to make
an investment decision he or she should go through the ratio analysis as well as other factor tomake a sound decision as ratio provide risk and return relation ship. The company should also
disclose some additional information for the purpose of analysis.
Conclusion
The term paper provides an overview of ratios most commonly used in the analysis of financialstatements. These ratio, classified as activity, liquidity, solvency and profitability indicators are
designed to measure different aspect of a firm’s operating, investment and financing activities.
Ratios are used to standardize financial statements across firms and over time, facilitating
comparative analysis.