Fin-201 Beximco Pharma
42
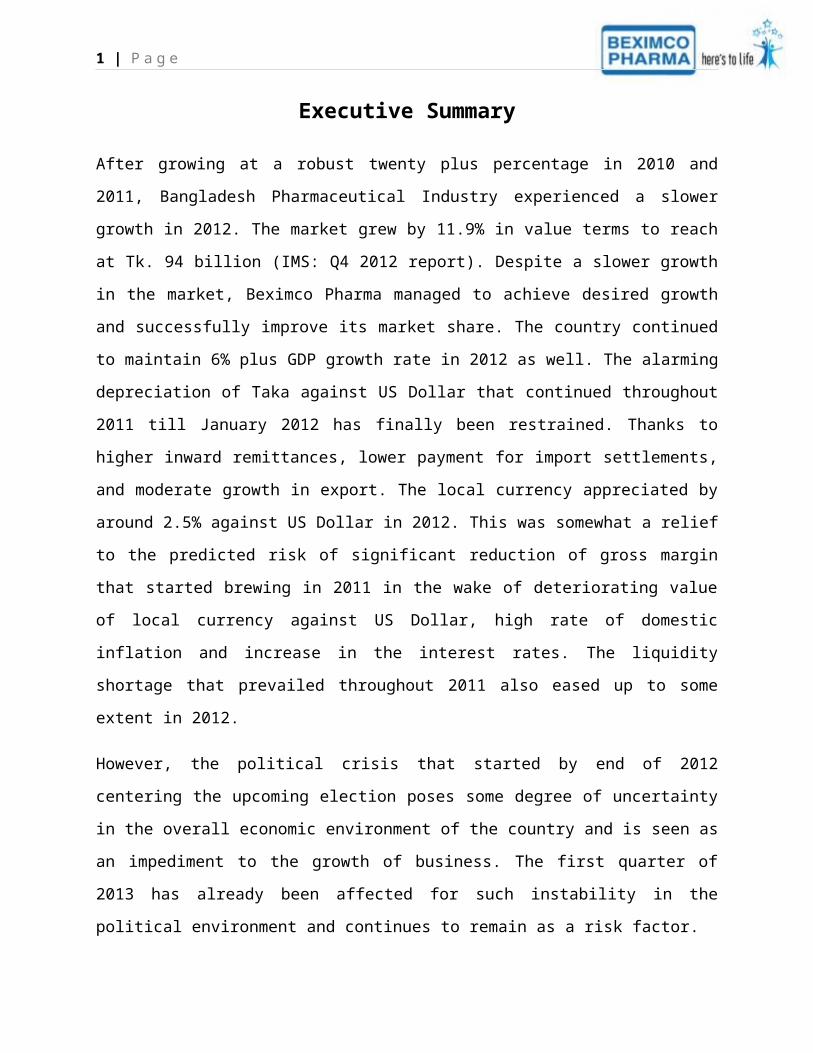
1 | Page Executive Summary After growing at a robust twenty plus percentage in 2010 and 2011, Bangladesh Pharmaceutical Industry experienced a slower growth in 2012. The market grew by 11.9% in value terms to reach at Tk. 94 billion (IMS: Q4 2012 report). Despite a slower growth in the market, Beximco Pharma managed to achieve desired growth and successfully improve its market share. The country continued to maintain 6% plus GDP growth rate in 2012 as well. The alarming depreciation of Taka against US Dollar that continued throughout 2011 till January 2012 has finally been restrained. Thanks to higher inward remittances, lower payment for import settlements, and moderate growth in export. The local currency appreciated by around 2.5% against US Dollar in 2012. This was somewhat a relief to the predicted risk of significant reduction of gross margin that started brewing in 2011 in the wake of deteriorating value of local currency against US Dollar, high rate of domestic inflation and increase in the interest rates. The liquidity shortage that prevailed throughout 2011 also eased up to some extent in 2012. However, the political crisis that started by end of 2012 centering the upcoming election poses some degree of uncertainty in the overall economic environment of the country and is seen as an impediment to the growth of business. The first quarter of 2013 has already been affected for such instability in the political environment and continues to remain as a risk factor.
-
Upload
saiful-hasan -
Category
Documents
-
view
44 -
download
0
description
finance
Transcript of Fin-201 Beximco Pharma
1 | P a g e
Executive Summary
After growing at a robust twenty plus percentage in 2010 and 2011, Bangladesh Pharmaceutical
Industry experienced a slower growth in 2012. The market grew by 11.9% in value terms to
reach at Tk. 94 billion (IMS: Q4 2012 report). Despite a slower growth in the market, Beximco
Pharma managed to achieve desired growth and successfully improve its market share. The
country continued to maintain 6% plus GDP growth rate in 2012 as well. The alarming
depreciation of Taka against US Dollar that continued throughout 2011 till January 2012 has
finally been restrained. Thanks to higher inward remittances, lower payment for import
settlements, and moderate growth in export. The local currency appreciated by around 2.5%
against US Dollar in 2012. This was somewhat a relief to the predicted risk of significant
reduction of gross margin that started brewing in 2011 in the wake of deteriorating value of local
currency against US Dollar, high rate of domestic inflation and increase in the interest rates. The
liquidity shortage that prevailed throughout 2011 also eased up to some extent in 2012.
However, the political crisis that started by end of 2012 centering the upcoming election poses
some degree of uncertainty in the overall economic environment of the country and is seen as an
impediment to the growth of business. The first quarter of 2013 has already been affected for
such instability in the political environment and continues to remain as a risk factor.
2 | P a g e
Introduction
Origin of the report
East West University promotes meaningfully blends of eastern culture and western thoughts and
innovations. To do this EWU provides many subjects like BUS, MKT and FIN etc. “Managerial
finance” FIN-201 is one of the courses for a student doing in BBA. Precisely it teaches how can
we analyze a financial statement and draw a recommendation for improve it.
To practically experience the implementation of all of those issues we have learned through the
course FIN-201 that is conduct by Farzana Akther, our respected course teacher of “Managerial
finance” has given us this assignment on “BEXIMCO Pharmaceutical Ltd” and manufacturing
company’s financial ratio analysis.
Background of the study
The report is done as a part of the research of the course FIN-201.The report focuses on
BEXIMCO Pharmaceutical and manufacturing company’s financial ratio analysis. The research
paper is prepared for Farzana Akther, Lecturer of business Administration Dept. at East West
University. She authorized the task of writing this report to a group of five members. This
research is prepared during the semester Summer- 2013.
A finance student must know about the analysis of a financial statement. As a finance student we
try our best to analyze the financial statement of BEXIMCO Pharmaceutical.
Objective of the study
The main objective of this assignment is to practice the real life financial statements analysis. It
will help us to know how we can analyze a financial statement and how we can recommend for
improvement and so on.
3 | P a g e
Methodology:
At first we got the report design and structure from our academic supervisor and moved for the
next steps.
To prepare this report we had to collect data from both primary and secondary sources-
Primary Data:
Primarily we collected data from annual report of the company. We also collect the information
by Discussing with our group members and also from our textbook.
Secondary Data:
We also collect data from secondary source. As
Different Journals
Through web searching
Annual report
4 | P a g e
History of the Beximco Pharmaceutical Ltd
Beximco Pharmaceuticals Ltd. is a leading edge pharmaceutical company based in Dhaka,
Bangladesh and is acclaimed for its outstanding product quality, world-class manufacturing
facilities, product development capabilities and outstanding professional services. Beximco
Pharma is the pioneer in pharmaceutical export from Bangladesh and has received National
Export Trophy (Gold), the highest national accolade for export, for record three times.
Year of Establishment: 1976
Commercial Production: 1980
Status: Public Limited Company
Business Lines: Manufacturing and marketing of Pharmaceutical Finished Formulation
Products, Large Volume Parenterals, Small Volume Parenterals, Ophthalmic Preparations,
Nebulizer Solutions and Active Pharmaceutical Ingredients (APIs)
Overseas Offices & Associates: Australia, Bhutan, Cambodia, Chile, Ghana, Hong Kong,
Indonesia, Jordan, Kenya, Kuwait, Malaysia, Myanmar, Nepal, Pakistan, Philippines, Saudi
Arabia, Singapore, Sri Lanka, Vietnam and Yemen
Authorized Capital (Taka): 2,000 million
Paid-up Capital (Taka): 1,259.57 million
Number of Shareholders: Around 66,000
Stock Exchange Listings: Dhaka Stock Exchange, Chittagong Stock Exchange and AIM of
London Stock Exchange
Number of Employees: 2,310
Mission:
BEXIMCO Pharmaceutical are committed to enhancing human health and well being by
providing contemporary and affordable medicines, manufactured in full compliance with global
5 | P a g e
quality standards. They continually strive to improve their core capabilities to address the unmet
medical needs of the patients and to deliver outstanding results for our shareholders.
Vision:
BEXIMCO Pharmaceutical will be one of the most trusted, admired and successful
pharmaceutical companies in the region with a focus on strengthening research and development
capabilities, creating partnerships and building presence across the globe.

6 | P a g e
Ratio analysis
Liquidity Ratios of BEXIMCO Pharmaceutical Compare to IBN Sina Pharma. Ltd. (2008-
2012):
Current ratio:
Current Ratio= Current AssetsCurrent Liabilities
BEXIMCO Pharmaceutical
Liquidity Ratios 2008 2009 2010 2011 2012
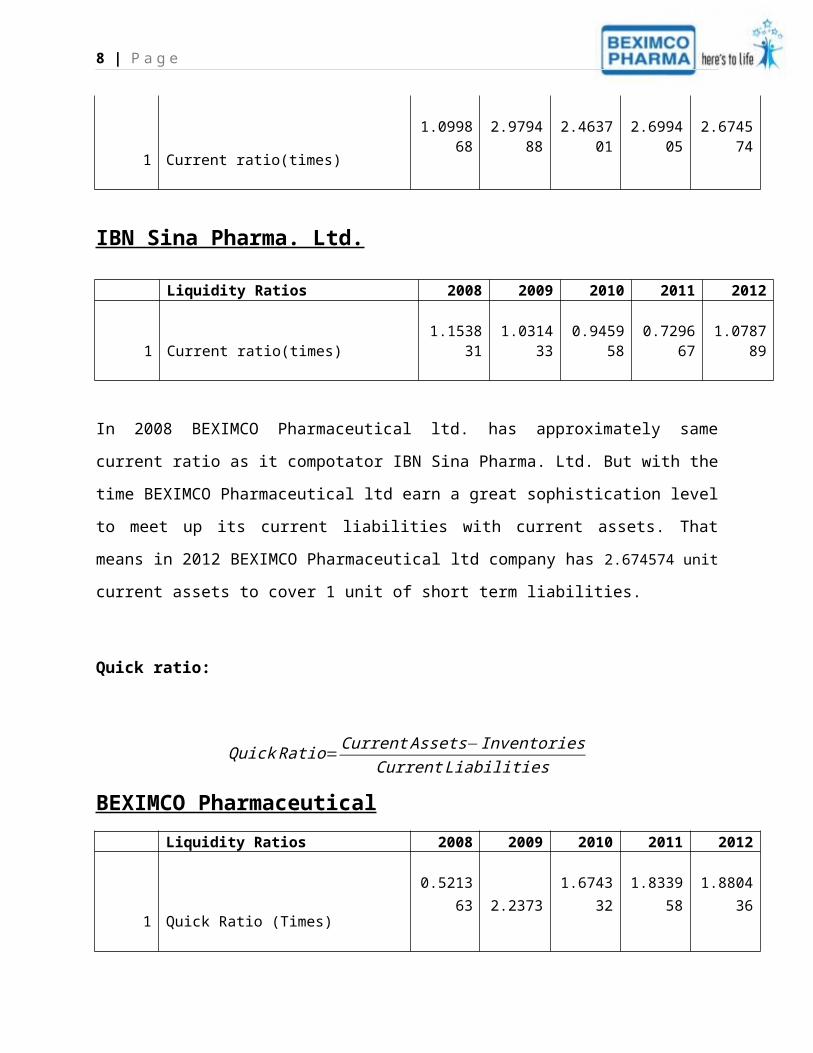
1 Current ratio(times)1.099868 2.979488 2.463701 2.699405 2.674574
IBN Sina Pharma. Ltd.
Liquidity Ratios 2008 2009 2010 2011 2012
1 Current ratio(times) 1.153831 1.031433 0.945958 0.729667 1.078789
In 2008 BEXIMCO Pharmaceutical ltd. has approximately same current ratio as it compotator
IBN Sina Pharma. Ltd. But with the time BEXIMCO Pharmaceutical ltd earn a great
sophistication level to meet up its current liabilities with current assets. That means in 2012
BEXIMCO Pharmaceutical ltd company has 2.674574 unit current assets to cover 1 unit of short
term liabilities.
Quick ratio:
Quick Ratio=Current Assets−InventoriesCurrent Liabilities
7 | P a g e
BEXIMCO Pharmaceutical
Liquidity Ratios 2008 2009 2010 2011 2012
1 Quick Ratio (Times)0.521363 2.2373 1.674332 1.833958 1.880436
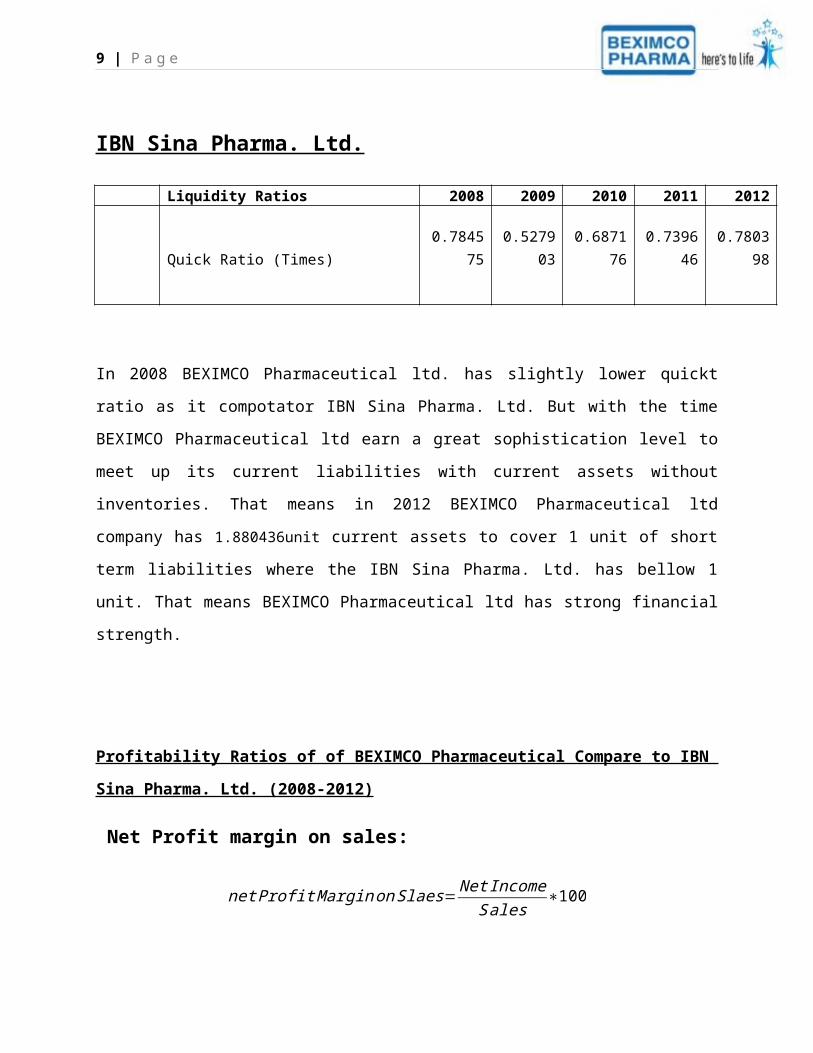
IBN Sina Pharma. Ltd.
Liquidity Ratios 2008 2009 2010 2011 2012
Quick Ratio (Times) 0.784575 0.527903 0.687176 0.739646 0.780398
In 2008 BEXIMCO Pharmaceutical ltd. has slightly lower quickt ratio as it compotator IBN Sina
Pharma. Ltd. But with the time BEXIMCO Pharmaceutical ltd earn a great sophistication level to
meet up its current liabilities with current assets without inventories. That means in 2012
BEXIMCO Pharmaceutical ltd company has 1.880436unit current assets to cover 1 unit of short
term liabilities where the IBN Sina Pharma. Ltd. has bellow 1 unit. That means BEXIMCO
Pharmaceutical ltd has strong financial strength.
Profitability Ratios of of BEXIMCO Pharmaceutical Compare to IBN Sina Pharma. Ltd.
(2008-2012)
Net Profit margin on sales:
net Profit Marginon Slaes= Net IncomeSales
∗100
8 | P a g e
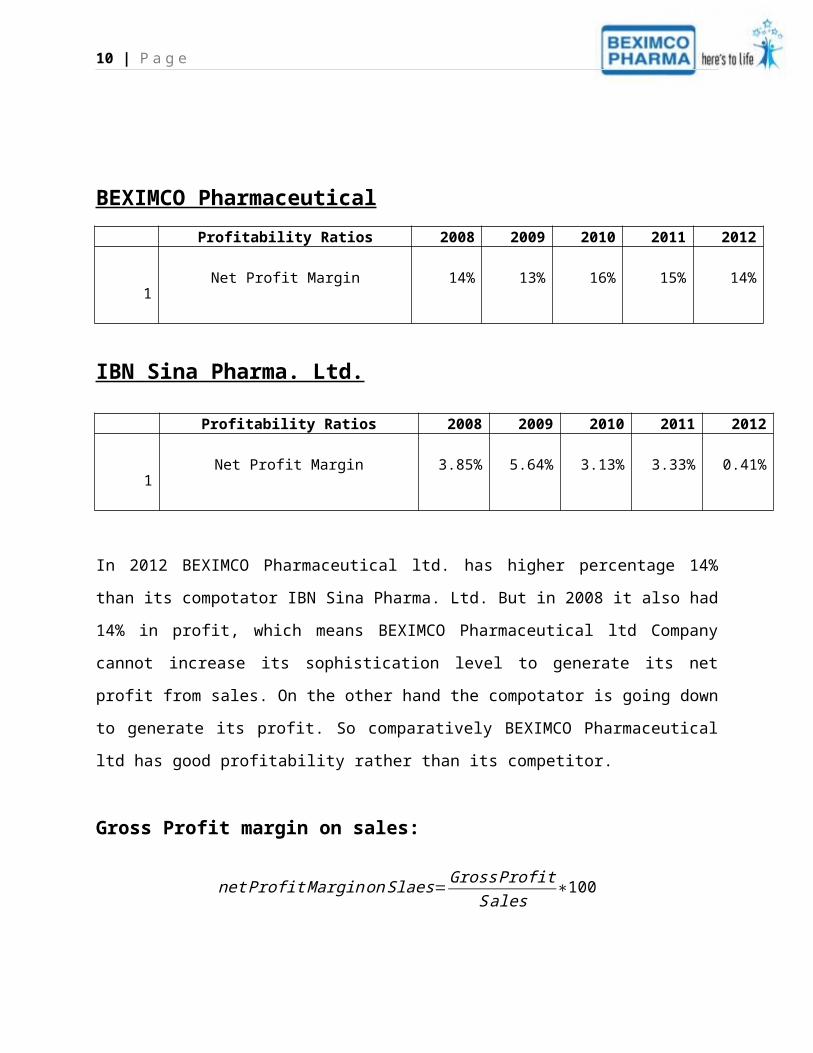
BEXIMCO Pharmaceutical
Profitability Ratios 2008 2009 2010 2011 2012
1Net Profit Margin 14% 13% 16% 15% 14%
IBN Sina Pharma. Ltd.
Profitability Ratios 2008 2009 2010 2011 2012
1Net Profit Margin 3.85% 5.64% 3.13% 3.33% 0.41%
In 2012 BEXIMCO Pharmaceutical ltd. has higher percentage 14% than its compotator IBN Sina
Pharma. Ltd. But in 2008 it also had 14% in profit, which means BEXIMCO Pharmaceutical ltd
Company cannot increase its sophistication level to generate its net profit from sales. On the
other hand the compotator is going down to generate its profit. So comparatively BEXIMCO
Pharmaceutical ltd has good profitability rather than its competitor.
Gross Profit margin on sales:
net Profit Marginon Slaes=GrossProfitSales
∗100
BEXIMCO Pharmaceutical
Profitability Ratios 2008 2009 2010 2011 20121
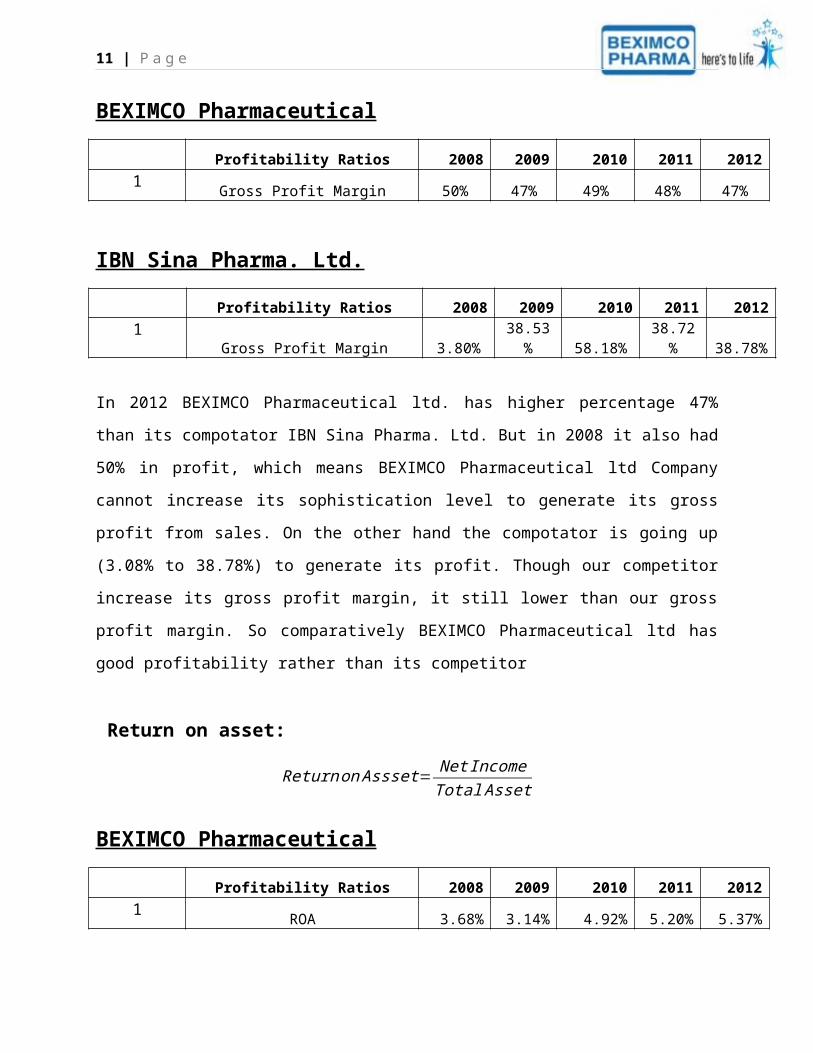
Gross Profit Margin 50% 47% 49% 48% 47%
IBN Sina Pharma. Ltd.
Profitability Ratios 2008 2009 2010 2011 20121 Gross Profit Margin 3.80% 38.53% 58.18% 38.72% 38.78%
9 | P a g e
In 2012 BEXIMCO Pharmaceutical ltd. has higher percentage 47% than its compotator IBN Sina
Pharma. Ltd. But in 2008 it also had 50% in profit, which means BEXIMCO Pharmaceutical ltd
Company cannot increase its sophistication level to generate its gross profit from sales. On the
other hand the compotator is going up (3.08% to 38.78%) to generate its profit. Though our
competitor increase its gross profit margin, it still lower than our gross profit margin. So
comparatively BEXIMCO Pharmaceutical ltd has good profitability rather than its competitor
Return on asset:
Returnon Assset= Net IncomeTotal Asset
BEXIMCO Pharmaceutical
Profitability Ratios 2008 2009 2010 2011 20121
ROA 3.68% 3.14% 4.92% 5.20% 5.37%
IBN Sina Pharma. Ltd.
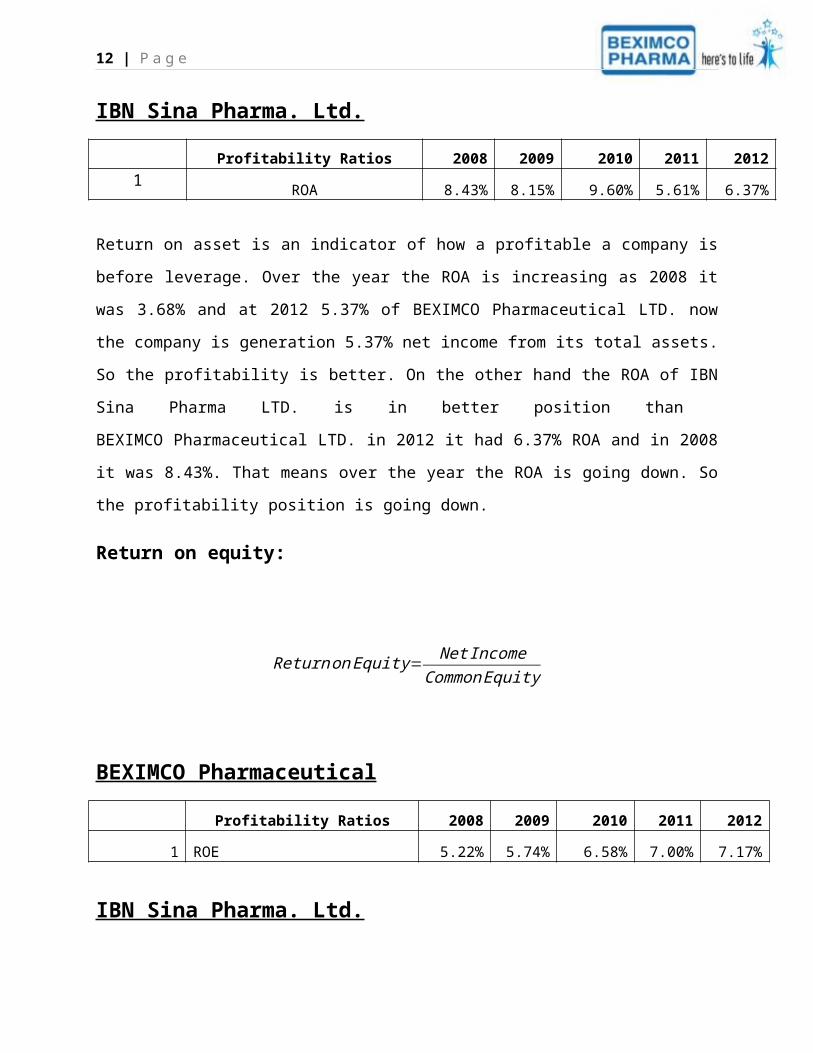
Profitability Ratios 2008 2009 2010 2011 20121 ROA 8.43% 8.15% 9.60% 5.61% 6.37%
Return on asset is an indicator of how a profitable a company is before leverage. Over the year
the ROA is increasing as 2008 it was 3.68% and at 2012 5.37% of BEXIMCO Pharmaceutical
LTD. now the company is generation 5.37% net income from its total assets. So the profitability
is better. On the other hand the ROA of IBN Sina Pharma LTD. is in better position than
BEXIMCO Pharmaceutical LTD. in 2012 it had 6.37% ROA and in 2008 it was 8.43%. That
means over the year the ROA is going down. So the profitability position is going down.
Return on equity:
Returnon Equity= Net IncomeCommonEquity
10 | P a g e
BEXIMCO Pharmaceutical
Profitability Ratios 2008 2009 2010 2011 2012
1 ROE 5.22% 5.74% 6.58% 7.00% 7.17%
IBN Sina Pharma. Ltd.
Profitability Ratios 2008 2009 2010 2011 2012
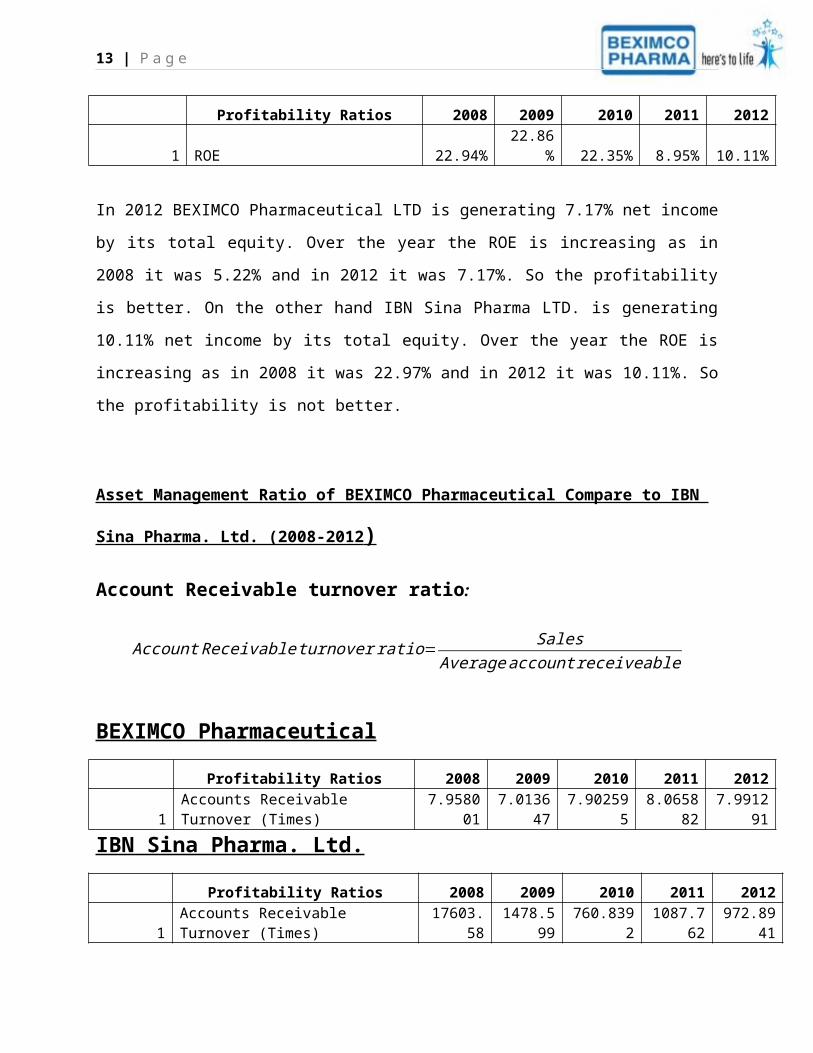
1 ROE 22.94% 22.86% 22.35% 8.95% 10.11%
In 2012 BEXIMCO Pharmaceutical LTD is generating 7.17% net income by its total equity.
Over the year the ROE is increasing as in 2008 it was 5.22% and in 2012 it was 7.17%. So the
profitability is better. On the other hand IBN Sina Pharma LTD. is generating 10.11% net
income by its total equity. Over the year the ROE is increasing as in 2008 it was 22.97% and in
2012 it was 10.11%. So the profitability is not better.
Asset Management Ratio of BEXIMCO Pharmaceutical Compare to IBN Sina Pharma.
Ltd. (2008-2012 )
Account Receivable turnover ratio:
Account Receivable turnover ratio= SalesAverage account receiveable
BEXIMCO Pharmaceutical
Profitability Ratios 2008 2009 2010 2011 2012
1 Accounts Receivable Turnover (Times) 7.958001 7.013647 7.902595 8.065882 7.991291
IBN Sina Pharma. Ltd.
Profitability Ratios 2008 2009 2010 2011 2012
1 Accounts Receivable Turnover (Times) 17603.58 1478.599 760.8392 1087.762 972.8941
11 | P a g e
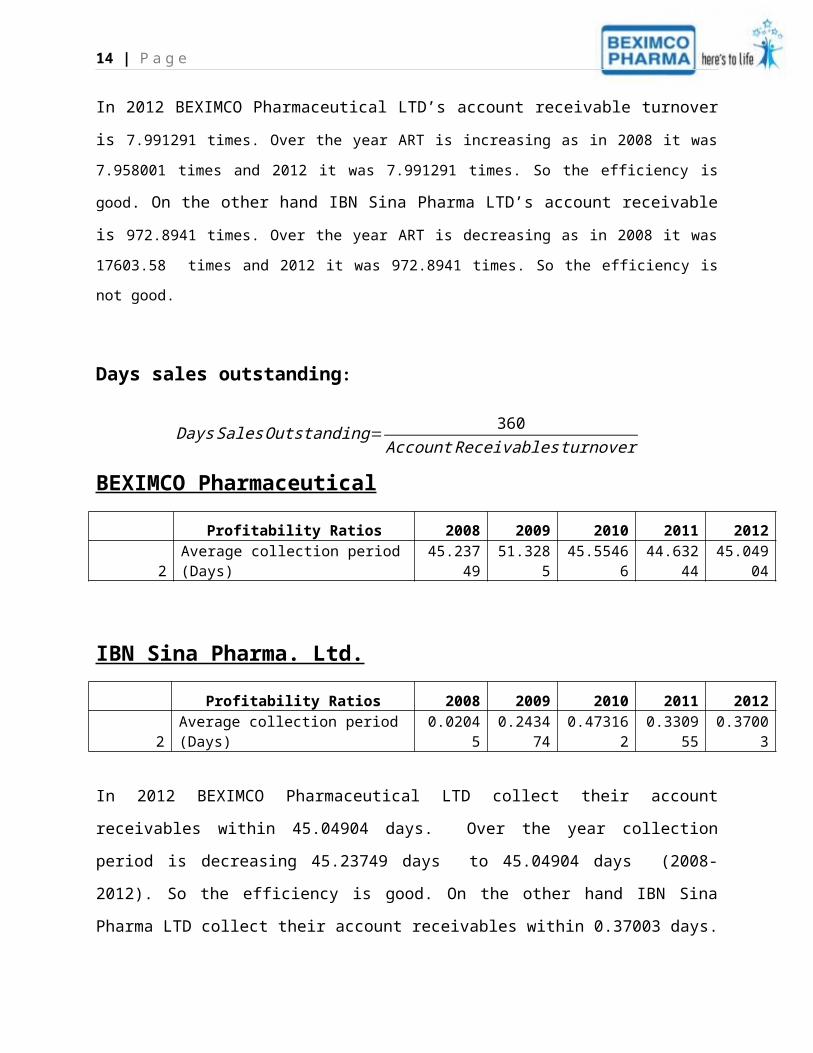
In 2012 BEXIMCO Pharmaceutical LTD’s account receivable turnover is 7.991291 times. Over
the year ART is increasing as in 2008 it was 7.958001 times and 2012 it was 7.991291 times. So the
efficiency is good. On the other hand IBN Sina Pharma LTD’s account receivable is 972.8941
times. Over the year ART is decreasing as in 2008 it was 17603.58 times and 2012 it was 972.8941
times. So the efficiency is not good.
Days sales outstanding:
DaysSalesOutstanding= 360Account Receivables turnover
BEXIMCO Pharmaceutical
Profitability Ratios 2008 2009 2010 2011 2012
2 Average collection period (Days) 45.23749 51.3285 45.55466 44.63244 45.04904
IBN Sina Pharma. Ltd.
Profitability Ratios 2008 2009 2010 2011 20122 Average collection period (Days) 0.02045 0.243474 0.473162 0.330955 0.37003
In 2012 BEXIMCO Pharmaceutical LTD collect their account receivables within 45.04904 days.
Over the year collection period is decreasing 45.23749 days to 45.04904 days (2008-2012). So
the efficiency is good. On the other hand IBN Sina Pharma LTD collect their account receivables
within 0.37003 days. Over the year collection period is increasing 0.02045 to 0.37003 (2008-
2012). So the efficiency is not good.
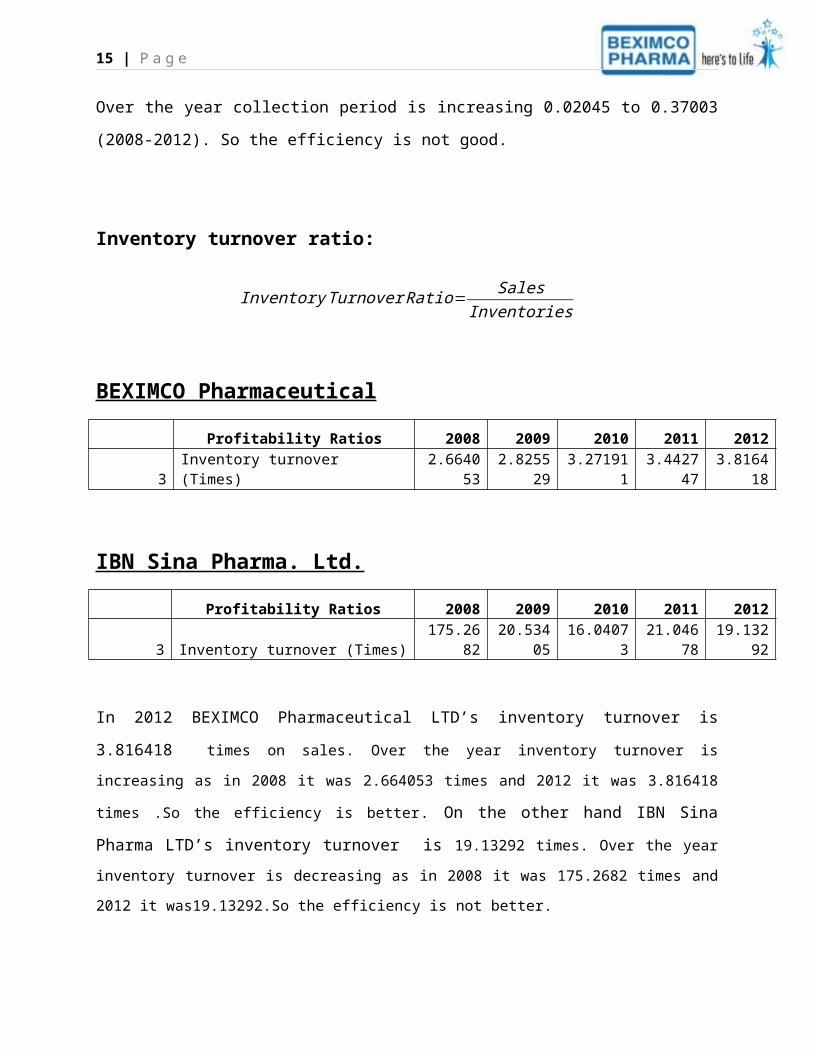
Inventory turnover ratio:
Inventory Turnover Ratio= SalesInventories
12 | P a g e
BEXIMCO Pharmaceutical
Profitability Ratios 2008 2009 2010 2011 2012
3 Inventory turnover (Times) 2.664053 2.825529 3.271911 3.442747 3.816418
IBN Sina Pharma. Ltd.
Profitability Ratios 2008 2009 2010 2011 20123 Inventory turnover (Times) 175.2682 20.53405 16.04073 21.04678 19.13292
In 2012 BEXIMCO Pharmaceutical LTD’s inventory turnover is 3.816418 times on sales. Over
the year inventory turnover is increasing as in 2008 it was 2.664053 times and 2012 it was 3.816418
times .So the efficiency is better. On the other hand IBN Sina Pharma LTD’s inventory turnover is
19.13292 times. Over the year inventory turnover is decreasing as in 2008 it was 175.2682 times and
2012 it was19.13292.So the efficiency is not better.
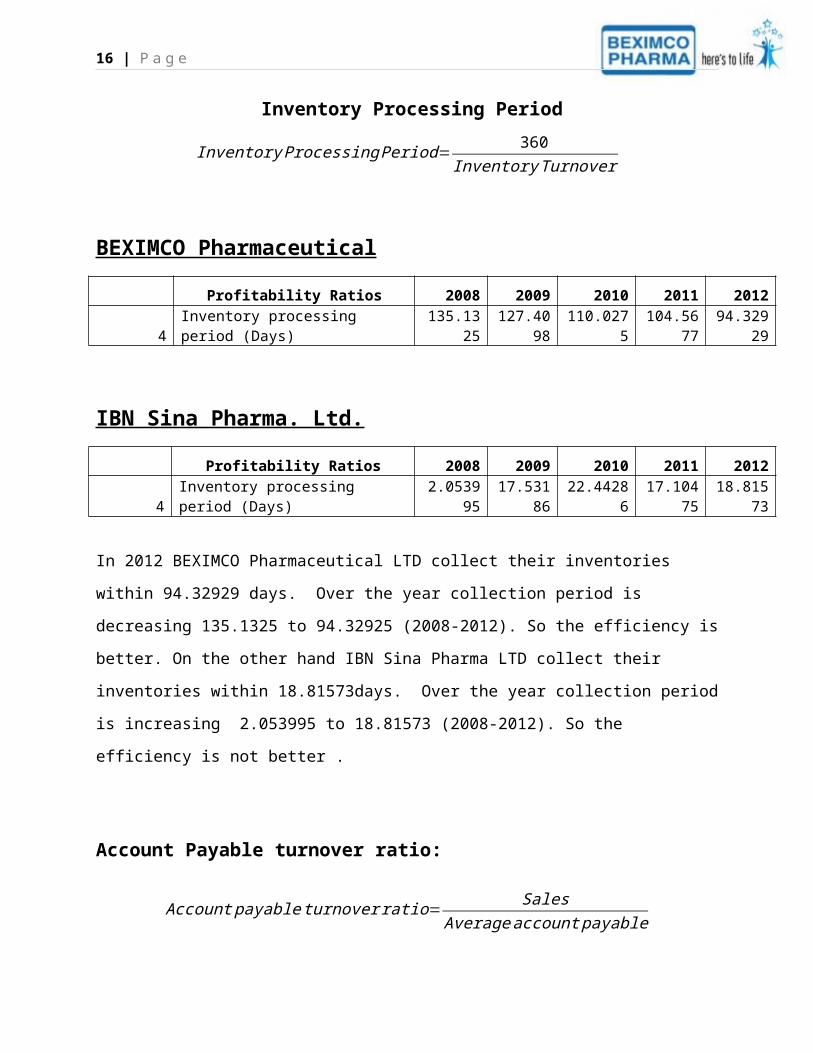
Inventory Processing Period
Inventory Processing Period= 360Inventory Turnover
BEXIMCO Pharmaceutical
Profitability Ratios 2008 2009 2010 2011 2012
4 Inventory processing period (Days) 135.1325 127.4098 110.0275 104.5677 94.32929
IBN Sina Pharma. Ltd.
Profitability Ratios 2008 2009 2010 2011 20124 Inventory processing period (Days) 2.053995 17.53186 22.44286 17.10475 18.81573
In 2012 BEXIMCO Pharmaceutical LTD collect their inventories within 94.32929 days. Over
the year collection period is decreasing 135.1325 to 94.32925 (2008-2012). So the efficiency is
13 | P a g e
better. On the other hand IBN Sina Pharma LTD collect their inventories within 18.81573days.
Over the year collection period is increasing 2.053995 to 18.81573 (2008-2012). So the
efficiency is not better .
Account Payable turnover ratio:
Account payableturnover ratio= SalesAverage account payable
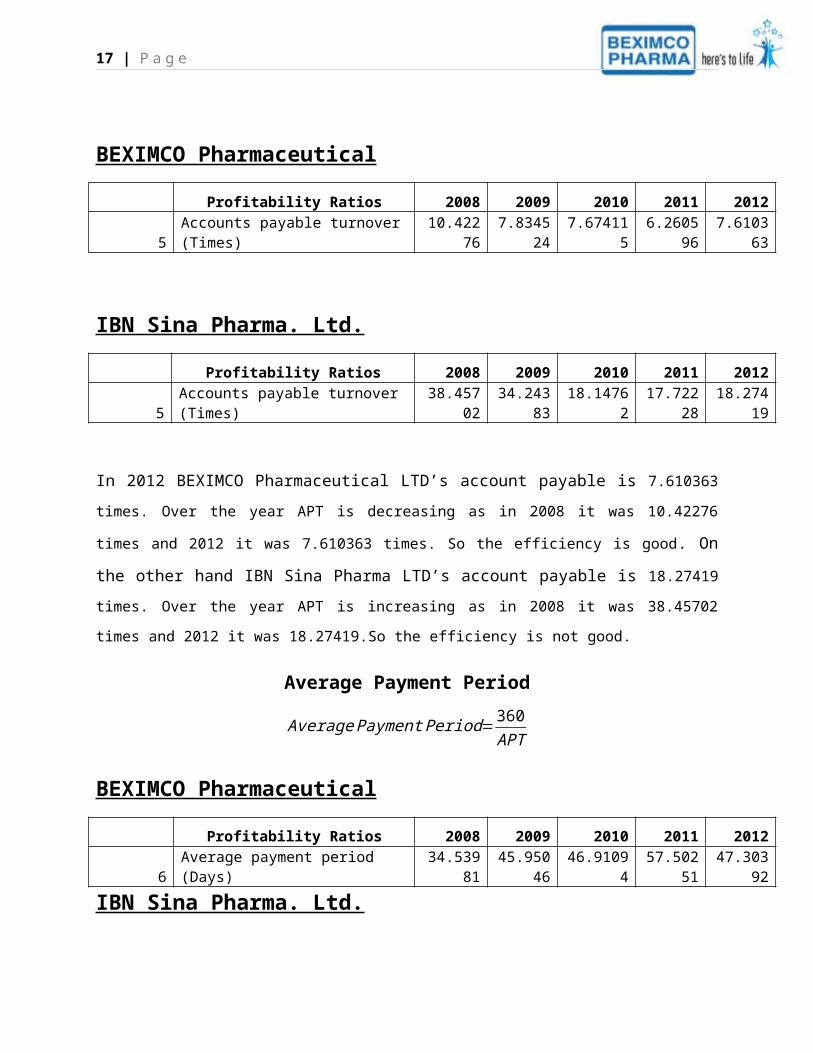
BEXIMCO Pharmaceutical
Profitability Ratios 2008 2009 2010 2011 2012
5 Accounts payable turnover (Times) 10.42276 7.834524 7.674115 6.260596 7.610363
IBN Sina Pharma. Ltd.
Profitability Ratios 2008 2009 2010 2011 20125 Accounts payable turnover (Times) 38.45702 34.24383 18.14762 17.72228 18.27419
In 2012 BEXIMCO Pharmaceutical LTD’s account payable is 7.610363 times. Over the year APT is
decreasing as in 2008 it was 10.42276 times and 2012 it was 7.610363 times. So the efficiency is good.
On the other hand IBN Sina Pharma LTD’s account payable is 18.27419 times. Over the year APT
is increasing as in 2008 it was 38.45702 times and 2012 it was 18.27419.So the efficiency is not good.
Average Payment Period
Average Payment Period= 360APT
BEXIMCO Pharmaceutical
Profitability Ratios 2008 2009 2010 2011 2012
6 Average payment period (Days) 34.53981 45.95046 46.91094 57.50251 47.30392
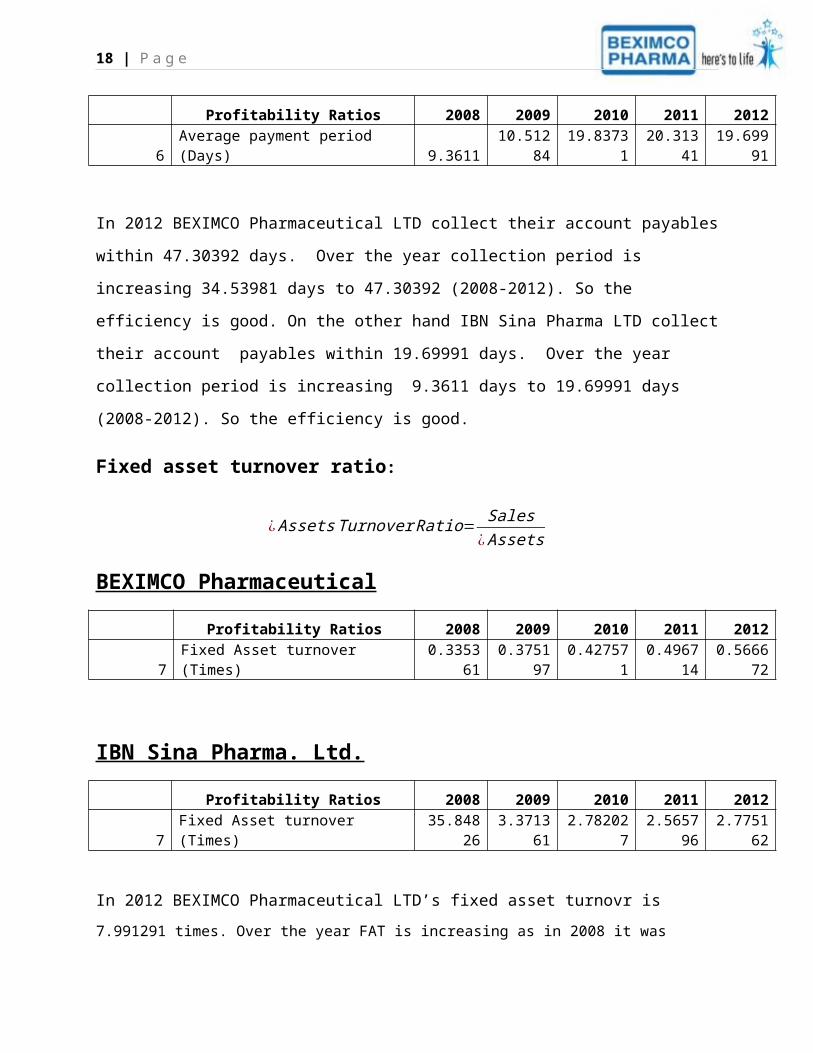
IBN Sina Pharma. Ltd.
14 | P a g e
Profitability Ratios 2008 2009 2010 2011 20126 Average payment period (Days) 9.3611 10.51284 19.83731 20.31341 19.69991
In 2012 BEXIMCO Pharmaceutical LTD collect their account payables within 47.30392 days.
Over the year collection period is increasing 34.53981 days to 47.30392 (2008-2012). So the
efficiency is good. On the other hand IBN Sina Pharma LTD collect their account payables
within 19.69991 days. Over the year collection period is increasing 9.3611 days to 19.69991
days (2008-2012). So the efficiency is good.
Fixed asset turnover ratio:
¿ AssetsTurnover Ratio= Sales¿Assets
BEXIMCO Pharmaceutical
Profitability Ratios 2008 2009 2010 2011 2012
7 Fixed Asset turnover (Times) 0.335361 0.375197 0.427571 0.496714 0.566672
IBN Sina Pharma. Ltd.
Profitability Ratios 2008 2009 2010 2011 20127 Fixed Asset turnover (Times) 35.84826 3.371361 2.782027 2.565796 2.775162
In 2012 BEXIMCO Pharmaceutical LTD’s fixed asset turnovr is 7.991291 times. Over the year
FAT is increasing as in 2008 it was 0.335361 times and 2012 it was 0.566672 times. So the efficiency is
good. On the other hand IBN Sina Pharma LTD’s FAT is 2.775162 times. Over the year FAT is
decreasing as in 2008 it was 35.84826 times and 2012 it was 2.775162 times. So the efficiency is not
good.
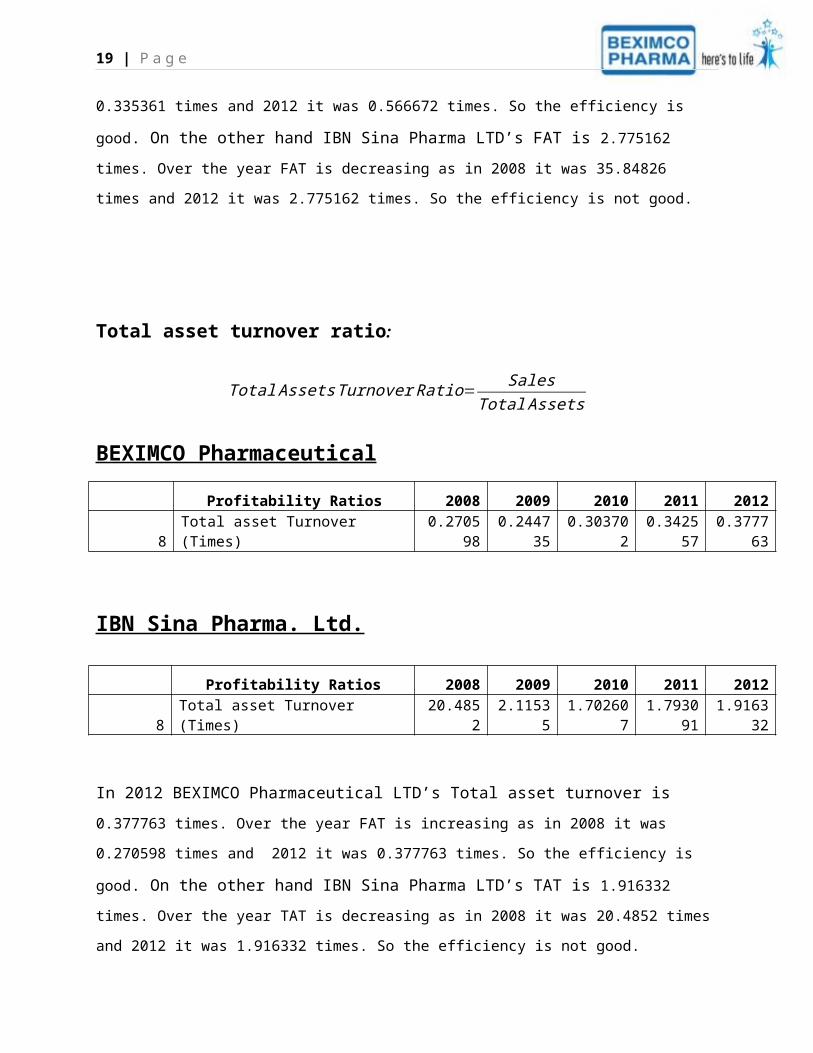
Total asset turnover ratio:
15 | P a g e
Total AssetsTurnover Ratio= SalesTotal Assets
BEXIMCO Pharmaceutical
Profitability Ratios 2008 2009 2010 2011 2012
8 Total asset Turnover (Times) 0.270598 0.244735 0.303702 0.342557 0.377763
IBN Sina Pharma. Ltd.
Profitability Ratios 2008 2009 2010 2011 20128 Total asset Turnover (Times) 20.4852 2.11535 1.702607 1.793091 1.916332
In 2012 BEXIMCO Pharmaceutical LTD’s Total asset turnover is 0.377763 times. Over the year
FAT is increasing as in 2008 it was 0.270598 times and 2012 it was 0.377763 times. So the efficiency is
good. On the other hand IBN Sina Pharma LTD’s TAT is 1.916332 times. Over the year TAT is
decreasing as in 2008 it was 20.4852 times and 2012 it was 1.916332 times. So the efficiency is not good.
Debt Management ratio of BEXIMCO Pharmaceutical Compare to IBN Sina Pharma. Ltd.
(2008-2012)
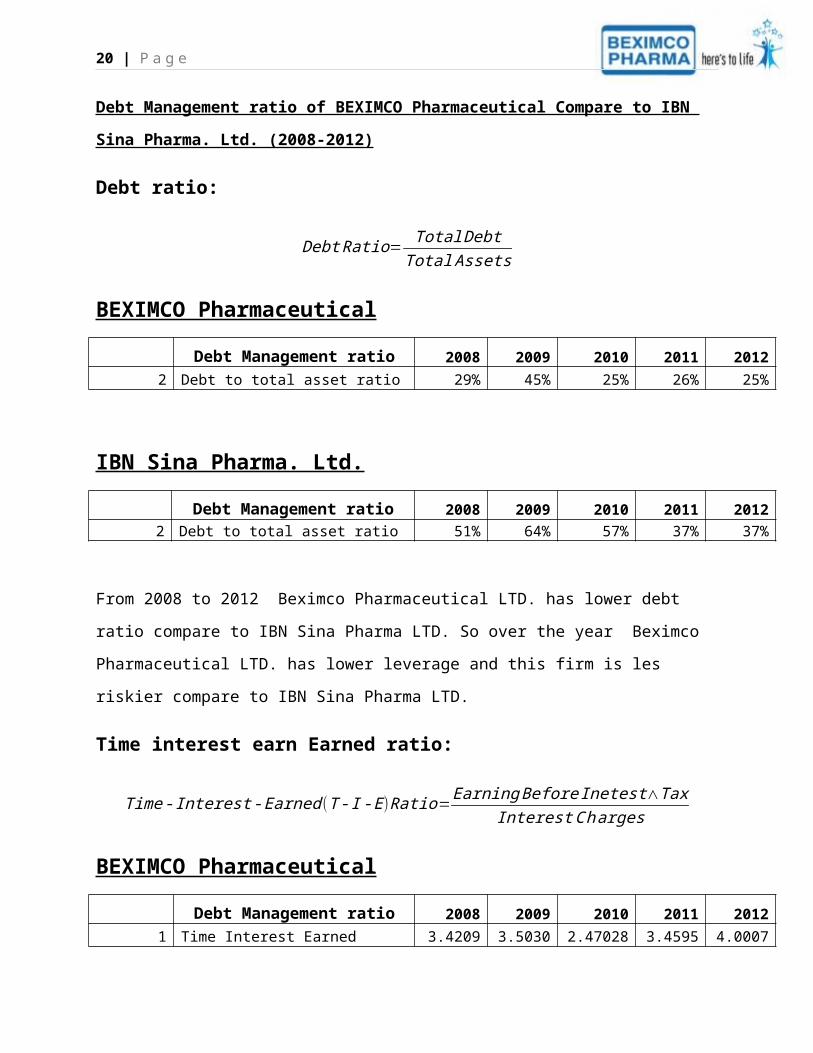
Debt ratio:
Debt Ratio= Total DebtTotal Assets
BEXIMCO Pharmaceutical
Debt Management ratio 2008 2009 2010 2011 2012
2 Debt to total asset ratio 29% 45% 25% 26% 25%
IBN Sina Pharma. Ltd.
Debt Management ratio 2008 2009 2010 2011 20122 Debt to total asset ratio 51% 64% 57% 37% 37%
16 | P a g e
From 2008 to 2012 Beximco Pharmaceutical LTD. has lower debt ratio compare to IBN Sina
Pharma LTD. So over the year Beximco Pharmaceutical LTD. has lower leverage and this firm
is les riskier compare to IBN Sina Pharma LTD.
Time interest earn Earned ratio:
Time‐ Interest ‐ Earned (T ‐ I ‐ E)Ratio=Earning Before Inetest∧TaxInterest Charges
BEXIMCO Pharmaceutical
Debt Management ratio 2008 2009 2010 2011 2012
1 Time Interest Earned Ratio (TIME) 3.420913 3.503029 2.470286 3.459522 4.000712
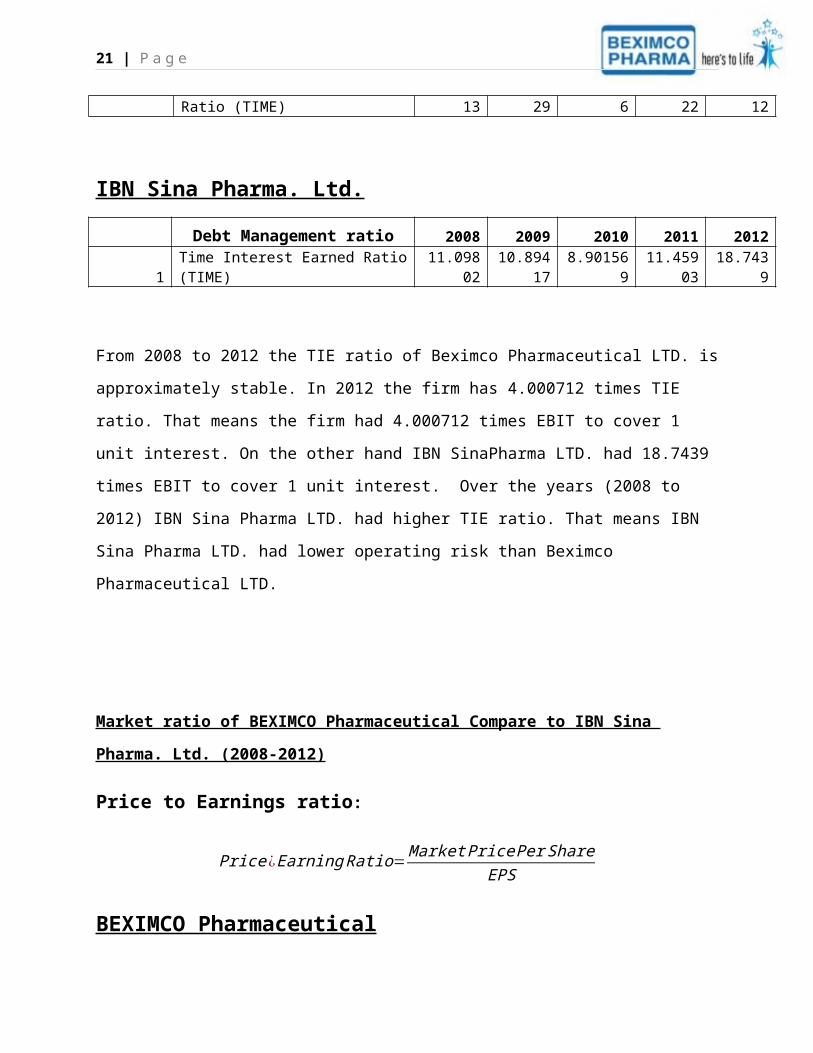
IBN Sina Pharma. Ltd.
Debt Management ratio 2008 2009 2010 2011 20121 Time Interest Earned Ratio (TIME) 11.09802 10.89417 8.901569 11.45903 18.7439
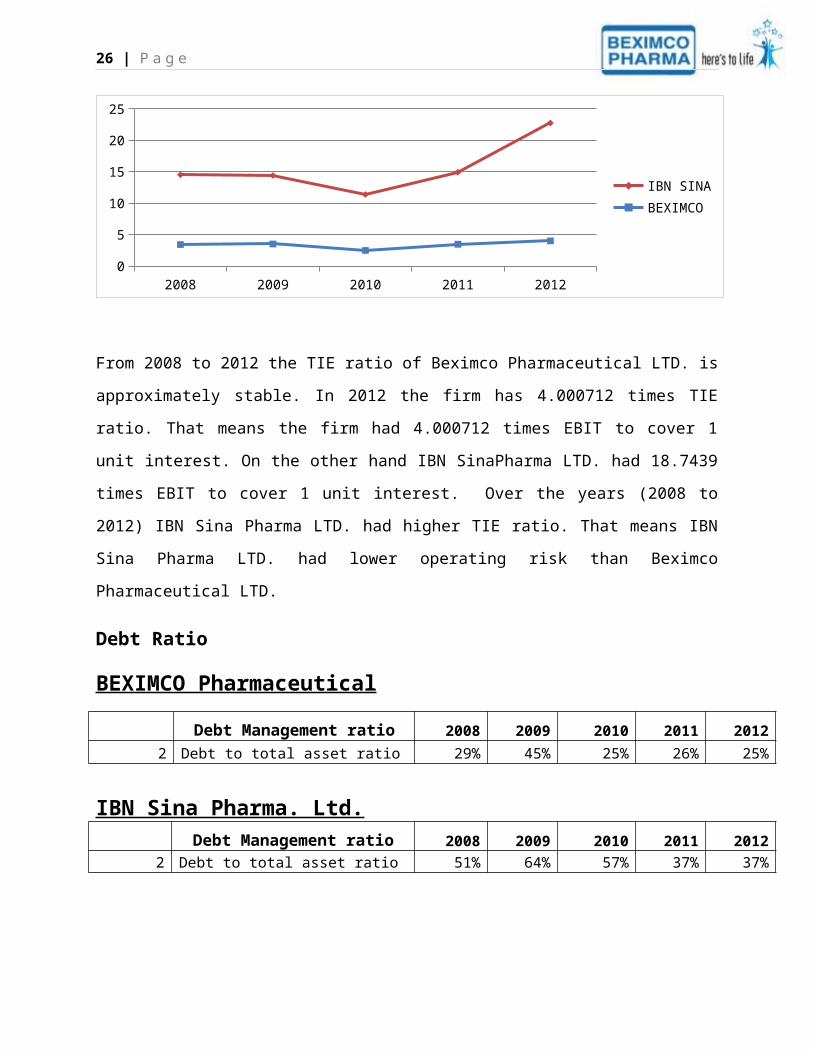
From 2008 to 2012 the TIE ratio of Beximco Pharmaceutical LTD. is approximately stable. In
2012 the firm has 4.000712 times TIE ratio. That means the firm had 4.000712 times EBIT to
cover 1 unit interest. On the other hand IBN SinaPharma LTD. had 18.7439 times EBIT to cover
1 unit interest. Over the years (2008 to 2012) IBN Sina Pharma LTD. had higher TIE ratio. That
means IBN Sina Pharma LTD. had lower operating risk than Beximco Pharmaceutical LTD.
Market ratio of BEXIMCO Pharmaceutical Compare to IBN Sina Pharma. Ltd. (2008-
2012)
Price to Earnings ratio:
17 | P a g e
Price ¿ Earning Ratio= Market Price Per ShareEPS
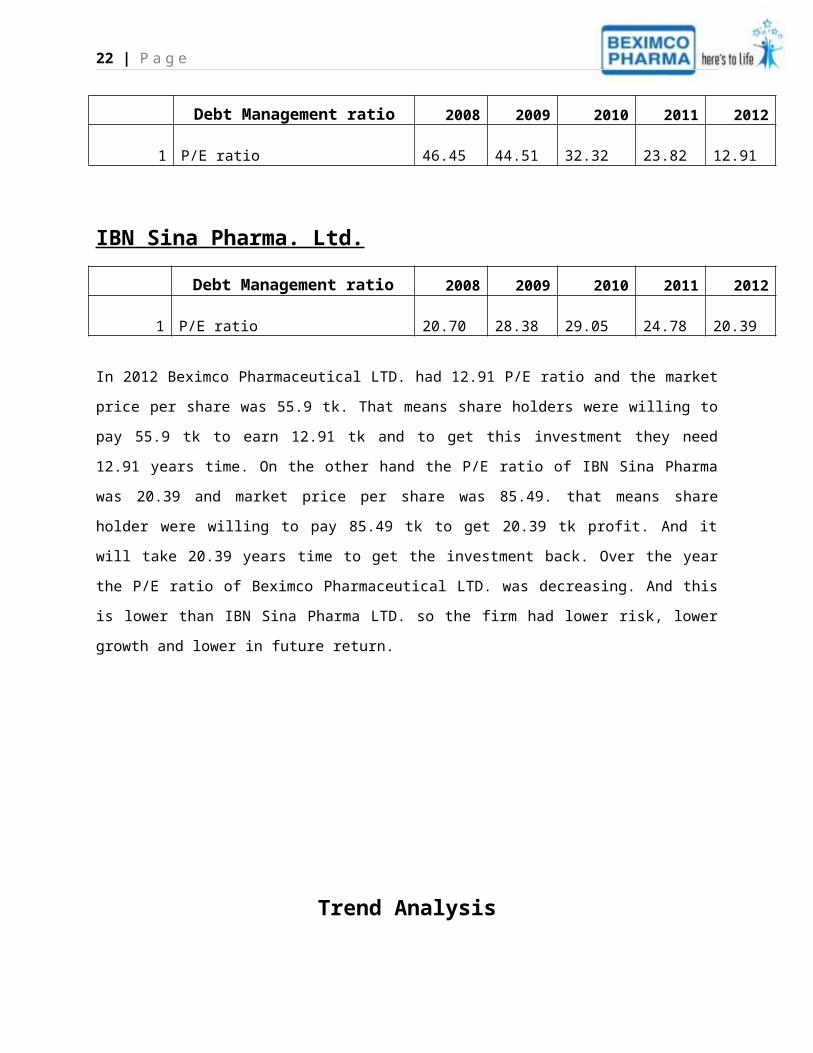
BEXIMCO Pharmaceutical
Debt Management ratio 2008 2009 2010 2011 2012
1 P/E ratio 46.45
44.51 32.32
23.82
12.91
IBN Sina Pharma. Ltd.
Debt Management ratio 2008 2009 2010 2011 2012
1 P/E ratio 20.70
28.38 29.05
24.78
20.39
In 2012 Beximco Pharmaceutical LTD. had 12.91 P/E ratio and the market price per share was 55.9 tk.
That means share holders were willing to pay 55.9 tk to earn 12.91 tk and to get this investment they
need 12.91 years time. On the other hand the P/E ratio of IBN Sina Pharma was 20.39 and market price
per share was 85.49. that means share holder were willing to pay 85.49 tk to get 20.39 tk profit. And it
will take 20.39 years time to get the investment back. Over the year the P/E ratio of Beximco
Pharmaceutical LTD. was decreasing. And this is lower than IBN Sina Pharma LTD. so the firm had lower
risk, lower growth and lower in future return.
Trend Analysis
Return on equity:
BEXIMCO Pharmaceutical
18 | P a g e
Profitability Ratios 2008 2009 2010 2011 2012
1 ROE 5.22% 5.74% 6.58% 7.00% 7.17%
IBN Sina Pharma. Ltd.
Profitability Ratios 2008 2009 2010 2011 2012
1 ROE 22.94% 22.86% 22.35% 8.95% 10.11%
2008 2009 2010 2011 20120
0.05
0.1
0.15
0.2
0.25
BEXIMCOIBN SINA
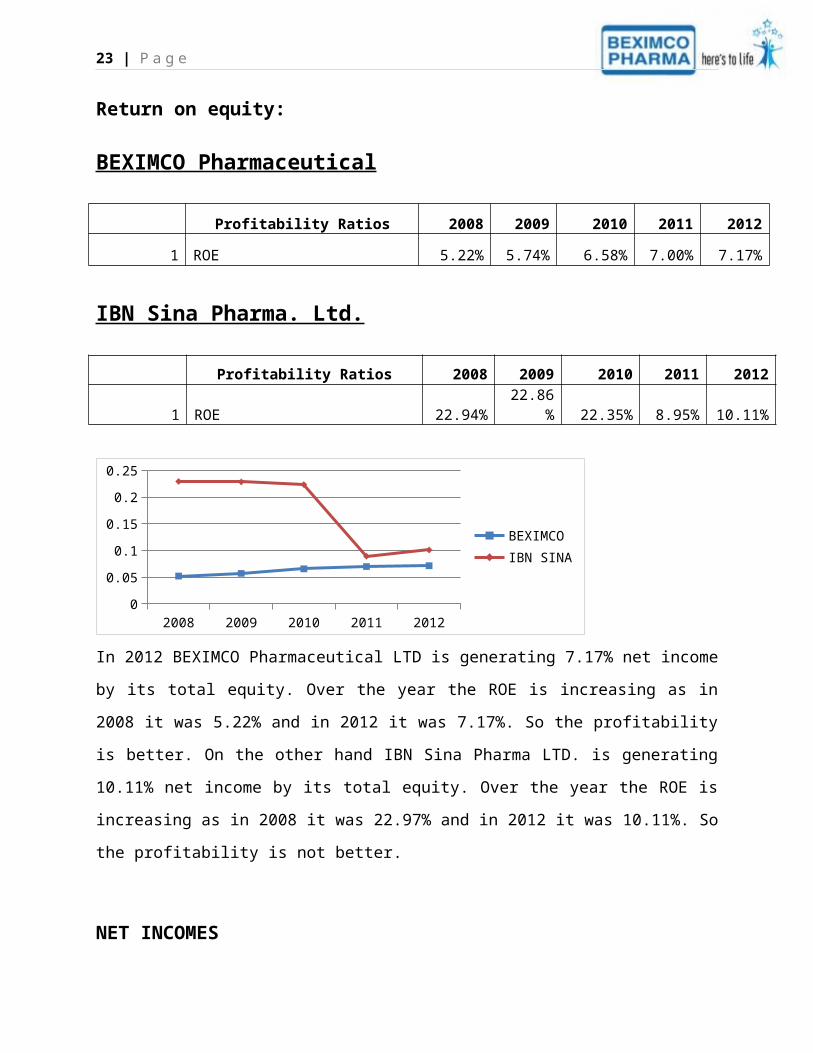
In 2012 BEXIMCO Pharmaceutical LTD is generating 7.17% net income by its total equity.
Over the year the ROE is increasing as in 2008 it was 5.22% and in 2012 it was 7.17%. So the
profitability is better. On the other hand IBN Sina Pharma LTD. is generating 10.11% net
income by its total equity. Over the year the ROE is increasing as in 2008 it was 22.97% and in
2012 it was 10.11%. So the profitability is not better.
NET INCOMES
Time BEXIMCO IBN SINA
2008 545341273 66826417
2009 624740307 54916571
2010 1051648808 60070895
2011 1198525342 49233664
2012 1319389328 43285209
19 | P a g e
2008 2009 2010 2011 20120
200000000
400000000
600000000
800000000
1000000000
1200000000
1400000000
BEXIMCOIBN SINA
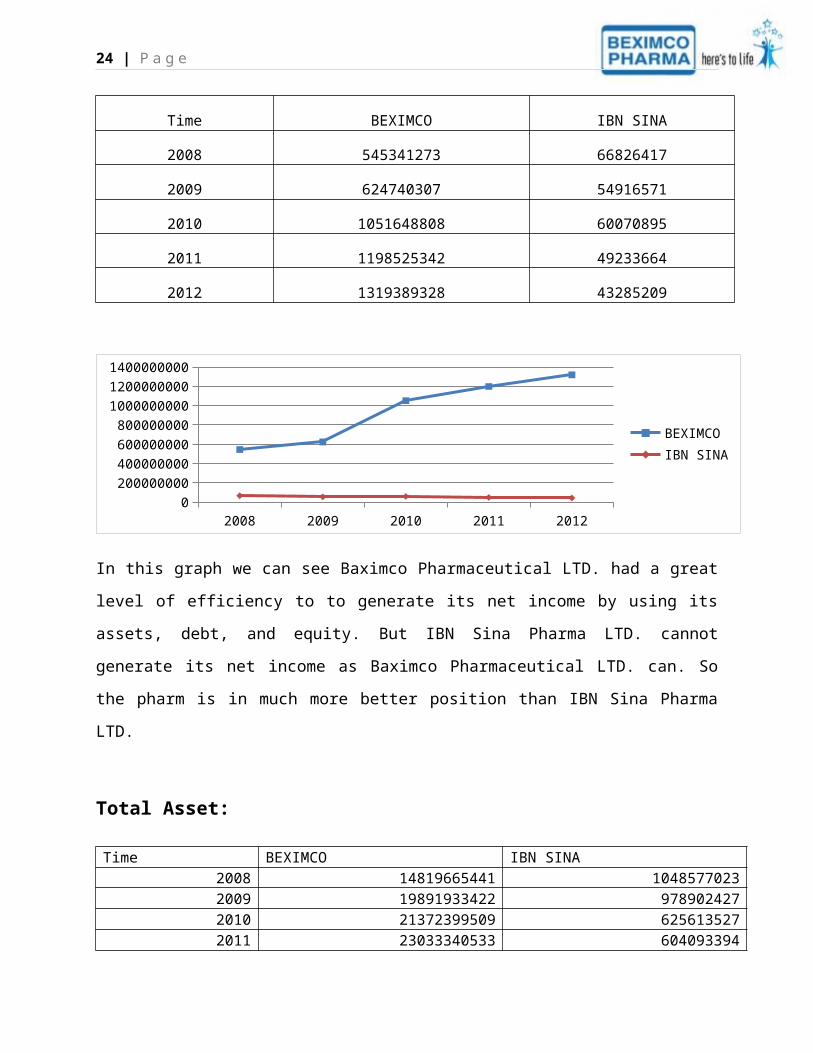
In this graph we can see Baximco Pharmaceutical LTD. had a great level of efficiency to to
generate its net income by using its assets, debt, and equity. But IBN Sina Pharma LTD. cannot
generate its net income as Baximco Pharmaceutical LTD. can. So the pharm is in much more
better position than IBN Sina Pharma LTD.
Total Asset:
Time BEXIMCO IBN SINA2008 14819665441 10485770232009 19891933422 9789024272010 21372399509 6256135272011 23033340533 6040933942012 24589810592 513654097
2008 2009 2010 2011 20120
5000000000
10000000000
15000000000
20000000000
25000000000
30000000000
BEXIMCOIBN SINA
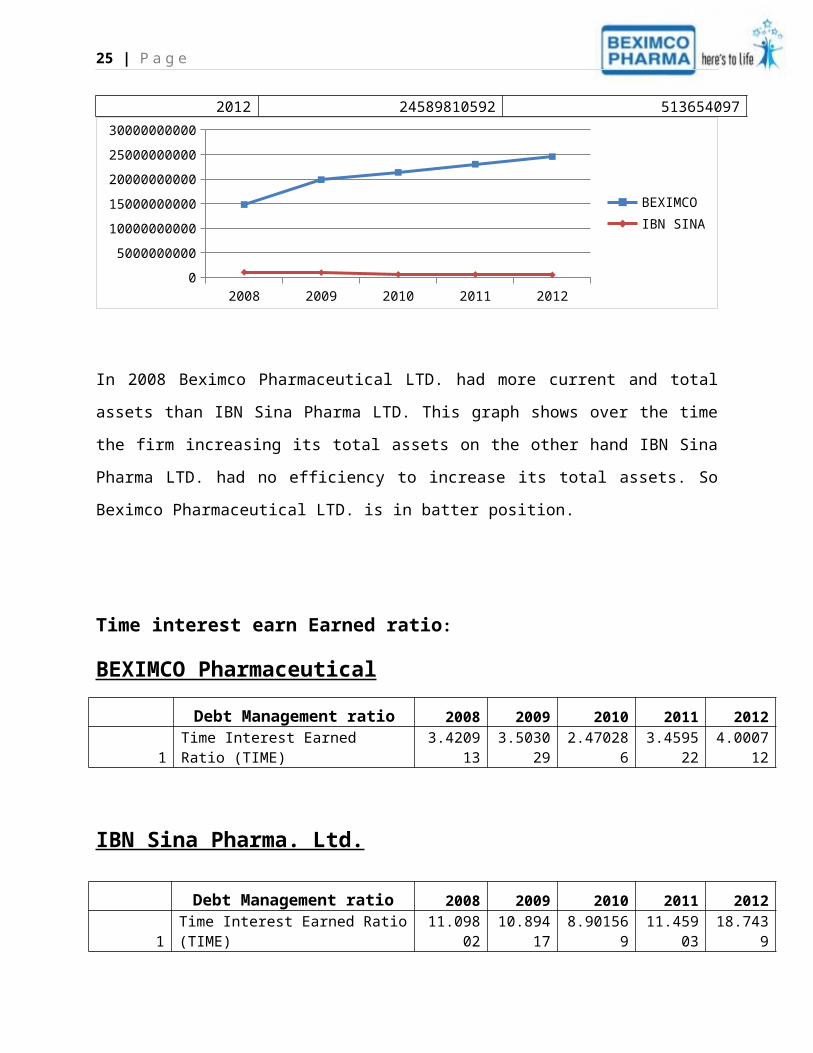
In 2008 Beximco Pharmaceutical LTD. had more current and total assets than IBN Sina Pharma
LTD. This graph shows over the time the firm increasing its total assets on the other hand IBN
20 | P a g e
Sina Pharma LTD. had no efficiency to increase its total assets. So Beximco Pharmaceutical
LTD. is in batter position.
Time interest earn Earned ratio:
BEXIMCO Pharmaceutical
Debt Management ratio 2008 2009 2010 2011 2012
1 Time Interest Earned Ratio (TIME) 3.420913 3.503029 2.470286 3.459522 4.000712
IBN Sina Pharma. Ltd.
Debt Management ratio 2008 2009 2010 2011 20121 Time Interest Earned Ratio (TIME) 11.09802 10.89417 8.901569 11.45903 18.7439
2008 2009 2010 2011 20120
5
10
15
20
25
IBN SINABEXIMCO
From 2008 to 2012 the TIE ratio of Beximco Pharmaceutical LTD. is approximately stable. In
2012 the firm has 4.000712 times TIE ratio. That means the firm had 4.000712 times EBIT to
cover 1 unit interest. On the other hand IBN SinaPharma LTD. had 18.7439 times EBIT to cover
1 unit interest. Over the years (2008 to 2012) IBN Sina Pharma LTD. had higher TIE ratio. That
means IBN Sina Pharma LTD. had lower operating risk than Beximco Pharmaceutical LTD.
Debt Ratio
21 | P a g e
BEXIMCO Pharmaceutical
Debt Management ratio 2008 2009 2010 2011 2012
2 Debt to total asset ratio 29% 45% 25% 26% 25%
IBN Sina Pharma. Ltd.Debt Management ratio 2008 2009 2010 2011 2012
2 Debt to total asset ratio 51% 64% 57% 37% 37%
1 2 3 4 50
0.2
0.4
0.6
0.8
1
1.2
IBN SINABEXIMCO
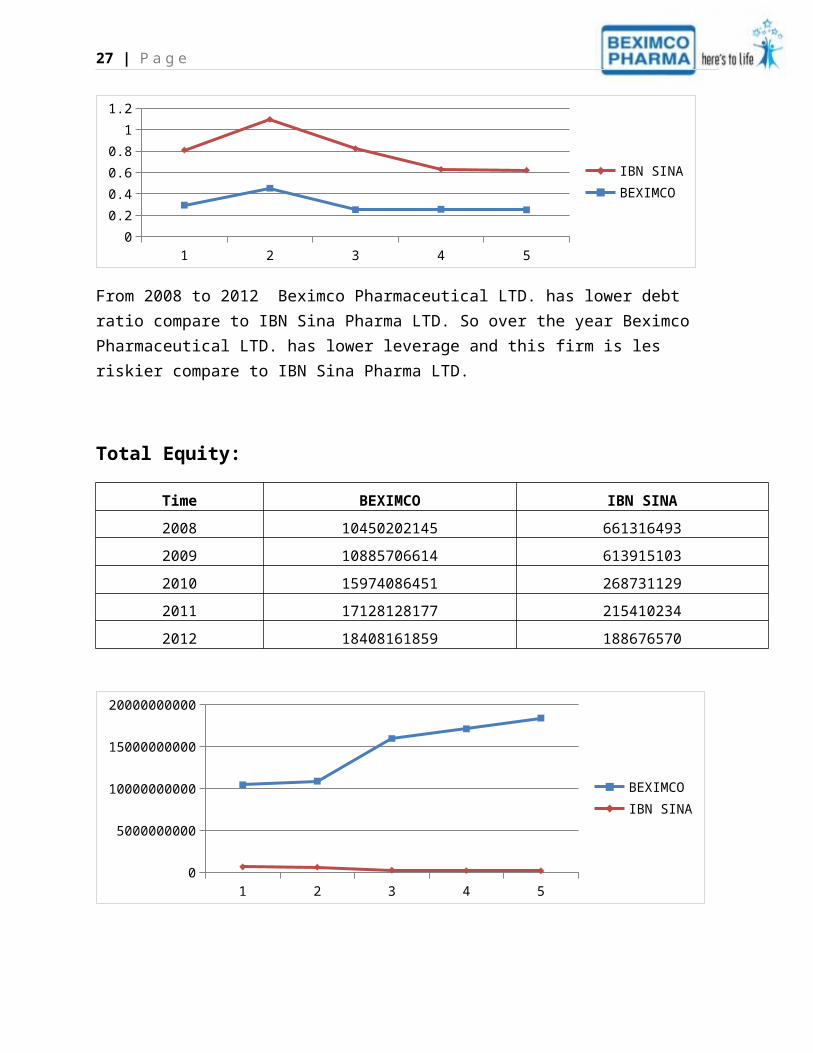
From 2008 to 2012 Beximco Pharmaceutical LTD. has lower debt ratio compare to IBN Sina Pharma LTD. So over the year Beximco Pharmaceutical LTD. has lower leverage and this firm is les riskier compare to IBN Sina Pharma LTD.
Total Equity:
Time BEXIMCO IBN SINA
2008 10450202145 661316493
2009 10885706614 613915103
2010 15974086451 268731129
2011 17128128177 215410234
2012 18408161859 188676570
22 | P a g e
1 2 3 4 50
2000000000400000000060000000008000000000100000000001200000000014000000000160000000001800000000020000000000
BEXIMCOIBN SINA
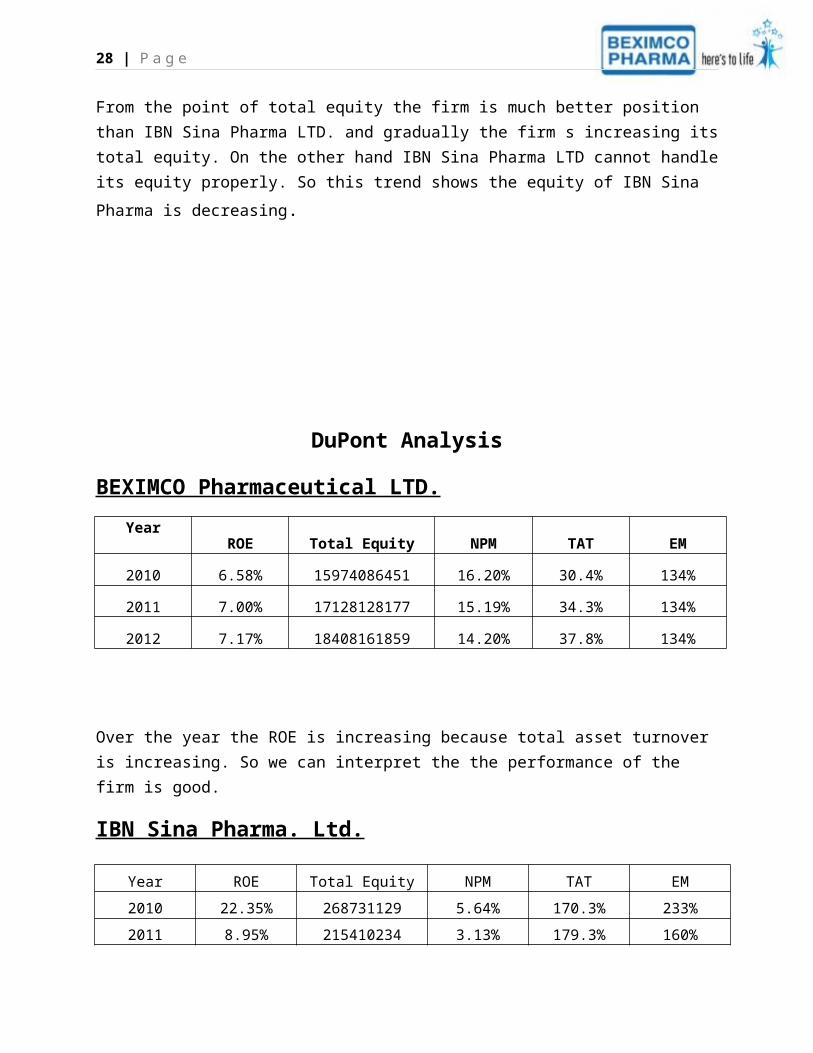
From the point of total equity the firm is much better position than IBN Sina Pharma LTD. and gradually the firm s increasing its total equity. On the other hand IBN Sina Pharma LTD cannot
handle its equity properly. So this trend shows the equity of IBN Sina Pharma is decreasing.
DuPont Analysis
BEXIMCO Pharmaceutical LTD.
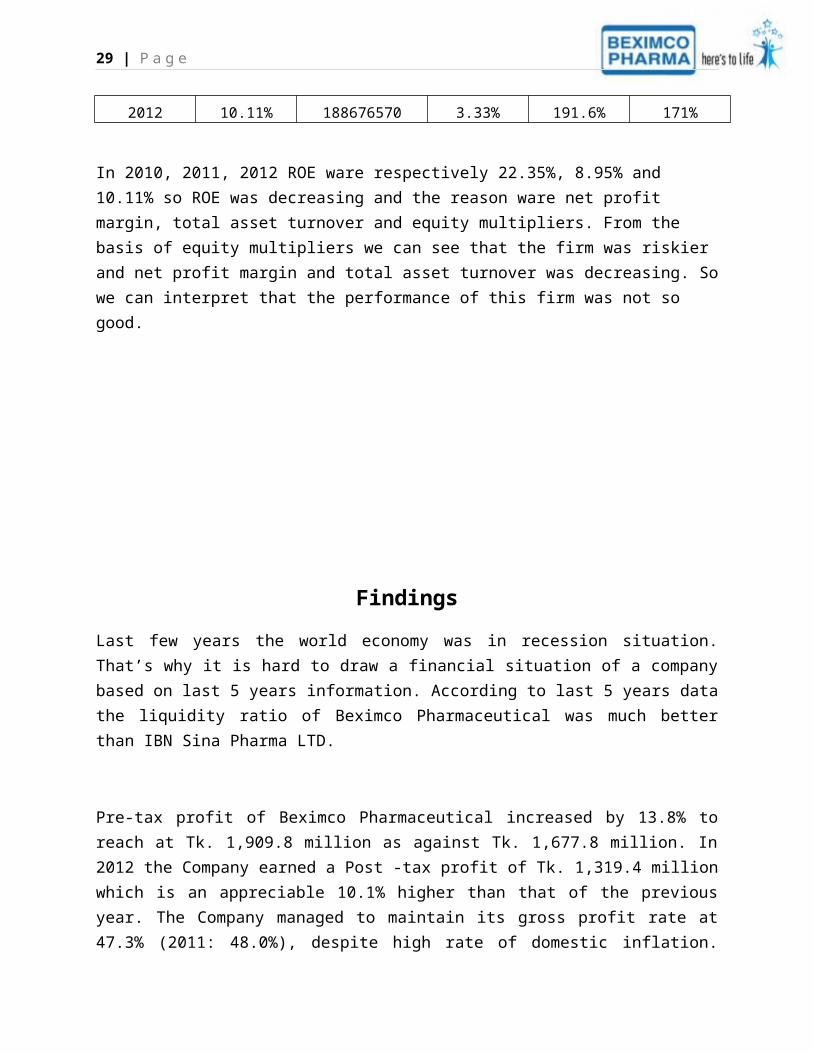
YearROE Total Equity NPM TAT EM
2010 6.58% 15974086451 16.20% 30.4% 134%
2011 7.00% 17128128177 15.19% 34.3% 134%
2012 7.17% 18408161859 14.20% 37.8% 134%
Over the year the ROE is increasing because total asset turnover is increasing. So we can interpret the the performance of the firm is good.
23 | P a g e
IBN Sina Pharma. Ltd.
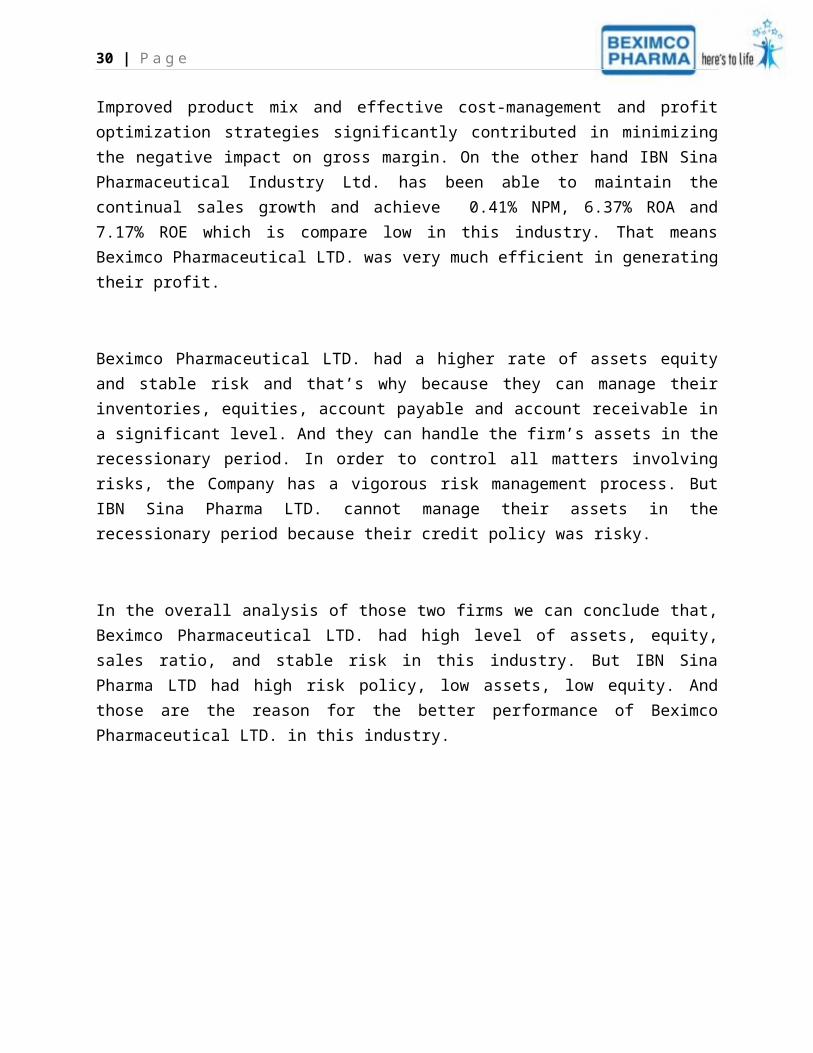
Year ROE Total Equity NPM TAT EM
2010 22.35% 268731129 5.64% 170.3% 233%
2011 8.95% 215410234 3.13% 179.3% 160%
2012 10.11% 188676570 3.33% 191.6% 171%
In 2010, 2011, 2012 ROE ware respectively 22.35%, 8.95% and 10.11% so ROE was decreasing and the reason ware net profit margin, total asset turnover and equity multipliers. From the basis of equity multipliers we can see that the firm was riskier and net profit margin and total asset turnover was decreasing. So we can interpret that the performance of this firm was not so good.
Findings
Last few years the world economy was in recession situation. That’s why it is hard to draw a financial situation of a company based on last 5 years information. According to last 5 years data the liquidity ratio of Beximco Pharmaceutical was much better than IBN Sina Pharma LTD.
Pre-tax profit of Beximco Pharmaceutical increased by 13.8% to reach at Tk. 1,909.8 million as against Tk. 1,677.8 million. In 2012 the Company earned a Post -tax profit of Tk. 1,319.4 million which is an appreciable 10.1% higher than that of the previous year. The Company managed to maintain its gross profit rate at 47.3% (2011: 48.0%), despite high rate of domestic inflation. Improved product mix and effective cost-management and profit optimization strategies significantly contributed in minimizing the negative impact on gross margin. On the other hand IBN Sina Pharmaceutical Industry Ltd. has been able to maintain the continual sales growth and achieve 0.41% NPM, 6.37% ROA and 7.17% ROE which is compare low in this industry. That means Beximco Pharmaceutical LTD. was very much efficient in generating their profit.
24 | P a g e
Beximco Pharmaceutical LTD. had a higher rate of assets equity and stable risk and that’s why because they can manage their inventories, equities, account payable and account receivable in a significant level. And they can handle the firm’s assets in the recessionary period. In order to control all matters involving risks, the Company has a vigorous risk management process. But IBN Sina Pharma LTD. cannot manage their assets in the recessionary period because their credit policy was risky.
In the overall analysis of those two firms we can conclude that, Beximco Pharmaceutical LTD. had high level of assets, equity, sales ratio, and stable risk in this industry. But IBN Sina Pharma LTD had high risk policy, low assets, low equity. And those are the reason for the better performance of Beximco Pharmaceutical LTD. in this industry.
Bibliography
1. leading edge pharmaceutical company, based in Dhaka, Bangladesh.
2013.leading edge pharmaceutical company, based in Dhaka, Bangladesh.
[ONLINE] Available at: http://www.beximco-pharma.com/. [Accessed 21 July
2013].
2. THE IBN SINA. 2013. THE IBN SINA. [ONLINE] Available
at:http://www.ibnsinapharma.com/. [Accessed 23 July 2013].
3. BEXIMCO PHARMACEUTICALS LIMITED 2008 to 2012. Annual Report 2008 to
2012. Bangladesh:BEXIMCO PHARMACEUTICALS LIMITED
25 | P a g e
4. The IBN SINA Pharmaceutical LTD. 2008 to 2012. Annual Report 2008 to
2012. Bangladesh:The IBN SINA Pharmaceutical LTD. .
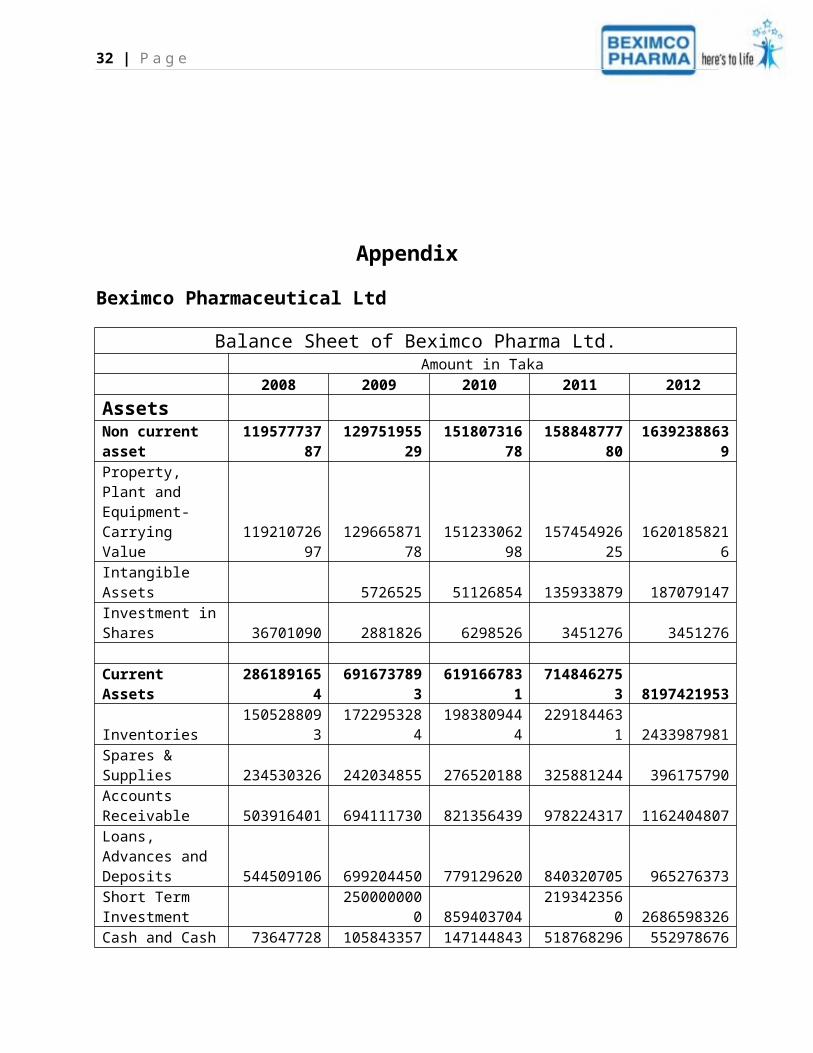
Appendix
Beximco Pharmaceutical Ltd
Balance Sheet of Beximco Pharma Ltd. Amount in Taka
2008 2009 2010 2011 2012
Assets Non current asset 11957773787 12975195529 15180731678 15884877780 16392388639 Property, Plant and Equipment- Carrying Value 11921072697 12966587178 15123306298 15745492625 16201858216 Intangible Assets 5726525 51126854 135933879 187079147 Investment in Shares 36701090 2881826 6298526 3451276 3451276 Current Assets 2861891654 6916737893 6191667831 7148462753 8197421953
26 | P a g e
Inventories 1505288093 1722953284 1983809444 2291844631 2433987981 Spares & Supplies 234530326 242034855 276520188 325881244 396175790 Accounts Receivable 503916401 694111730 821356439 978224317 1162404807 Loans, Advances and Deposits 544509106 699204450 779129620 840320705 965276373 Short Term Investment 2500000000 859403704 2193423560 2686598326 Cash and Cash Equivalents 73647728 1058433574 1471448436 518768296 552978676
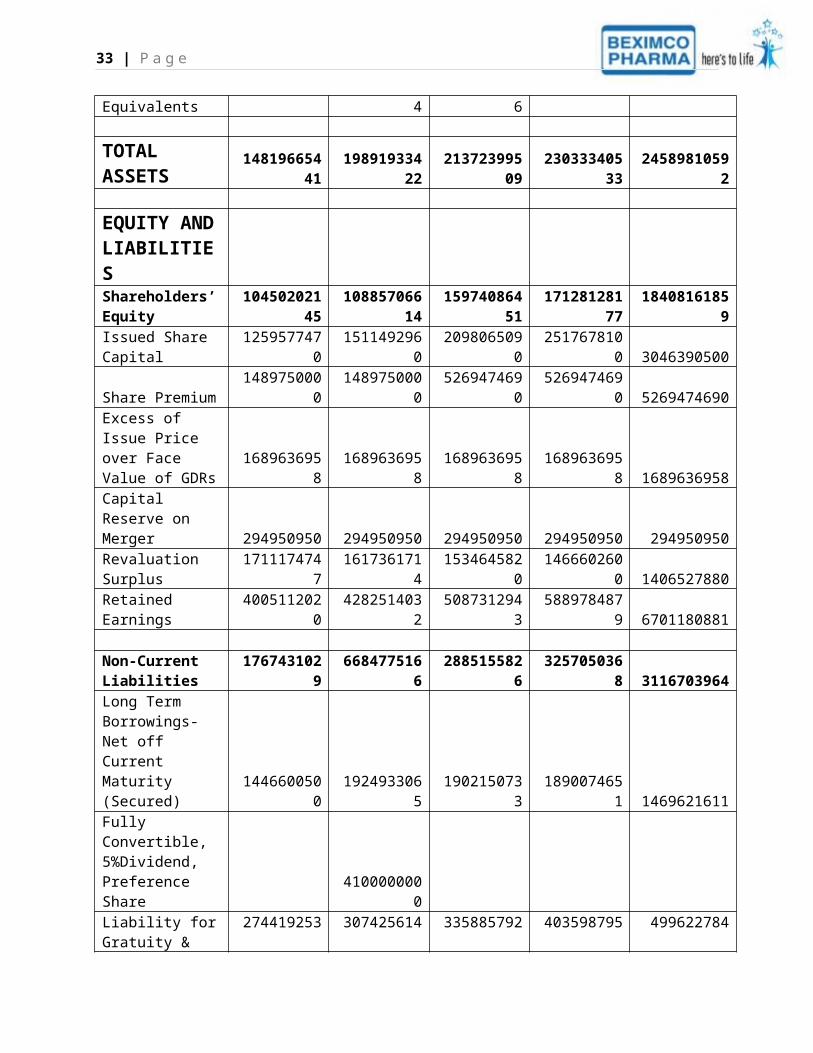
TOTAL ASSETS 14819665441 19891933422 21372399509 23033340533 24589810592
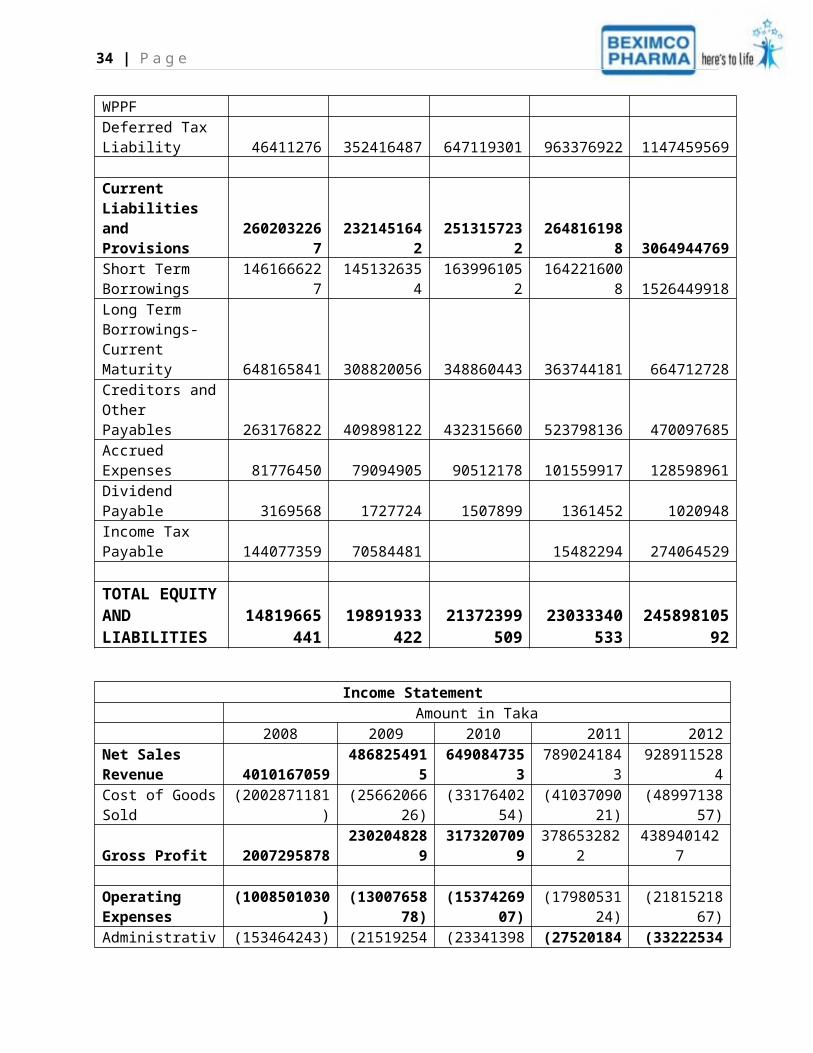
EQUITY AND LIABILITIES Shareholders’ Equity 10450202145 10885706614 15974086451 17128128177 18408161859 Issued Share Capital 1259577470 1511492960 2098065090 2517678100 3046390500 Share Premium 1489750000 1489750000 5269474690 5269474690 5269474690 Excess of Issue Price over Face Value of GDRs 1689636958 1689636958 1689636958 1689636958 1689636958 Capital Reserve on Merger 294950950 294950950 294950950 294950950 294950950 Revaluation Surplus 1711174747 1617361714 1534645820 1466602600 1406527880 Retained Earnings 4005112020 4282514032 5087312943 5889784879 6701180881 Non-Current Liabilities 1767431029 6684775166 2885155826 3257050368 3116703964 Long Term Borrowings-Net off Current Maturity (Secured) 1446600500 1924933065 1902150733 1890074651 1469621611 Fully Convertible, 5%Dividend, Preference Share 4100000000 Liability for Gratuity & WPPF 274419253 307425614 335885792 403598795 499622784 Deferred Tax Liability 46411276 352416487 647119301 963376922 1147459569 Current Liabilities and Provisions 2602032267 2321451642 2513157232 2648161988 3064944769 Short Term 1461666227 1451326354 1639961052 1642216008 1526449918
27 | P a g e
BorrowingsLong Term Borrowings-Current Maturity 648165841 308820056 348860443 363744181 664712728 Creditors and Other Payables 263176822 409898122 432315660 523798136 470097685 Accrued Expenses 81776450 79094905 90512178 101559917 128598961 Dividend Payable 3169568 1727724 1507899 1361452 1020948 Income Tax Payable 144077359 70584481 15482294 274064529 TOTAL EQUITY AND LIABILITIES
14819665441
19891933422
21372399509
23033340533 24589810592
Income Statement Amount in Taka
2008 2009 2010 2011 2012 Net Sales Revenue 4010167059 4868254915 6490847353 7890241843 9289115284
Cost of Goods Sold (2002871181) (2566206626)(3317640254
)(4103709021
) (4899713857)Gross Profit 2007295878 2302048289 3173207099 3786532822 4389401427 Operating Expenses (1008501030)
(1300765878)
(1537426907)
(1798053124) (2181521867)
Administrative Expenses (153464243) (215192547) (233413980) (275201846) (332225347)Selling, Marketing and Distribution Expenses (855036787) (1085573331)
(1304012927)
(1522851278) (1849296520)
Profit from Operations 998794848 1001282411 1635780192 1988479698 2207879560 Other Income 686510 198986379 456011134 340907774 442847713 Finance Cost (249654298) (289427992) (662182384) (567645757) (645406575)Profit before Contribution to W P P & Welfare Funds 749827060 910840798 1429608942 1761741715 2005320698 Contribution to W P P & Welfare Funds (35706050) (43373371) (68076616) (83892463) (95491462) Profit Before Tax 714121010 867467427 1361532326 1677849252 1909829236
28 | P a g e
Income Tax Expenses (168779737) (242727120) (309883518) (479323910) (590439908)Current Tax (173720430) (71085835) (207549905) (445712907)Deferred Tax 4940693 (242727120) (238797683) (271774005) (144727001)Profit after Tax for the Year 545341273 624740307 1051648808 1198525342 1319389328 Other Comprehensive Income Total Comprehensive Income for the Year 545341273 624740307 1051648808 1198525342 1319389328 Earnings Per Share (EPS) / Adjusted EPS 3.61 3.50 4.18 3.93 4.33 Number of Shares used to compute EPS 151149296 151149296 203420202 304639050 304639050 Market Price per Share 167.70 155.80 135.10 93.60 55.90
Ratio of Beximco Pharmaceutical LTD.
Liquidity Ratios 2008 2009 2010 2011 2012
1 Current ratio(times)1.09986
82.97948
82.46370
12.69940
52.67457
4
2 Quick Ratio (Times)0.52136
3 2.23731.67433
21.83395
81.88043
6
Profit Ratios 2008 2009 2010 2011 2012
1 ROE 5.22% 5.74% 6.58% 7.00% 7.17%
29 | P a g e
2 ROA 3.68% 3.14% 4.92% 5.20% 5.37%
3 Gross Profit Margin 50.06% 47.29% 48.89% 47.99% 47.25%
4 Net Profit Margin 13.60% 12.83% 16.20% 15.19% 14.20%
Efficiency Ratios 2008 2009 2010 2011 2012
1Accounts Receivable Turnover (Times)
7.958001
7.013647
7.902595
8.065882
7.991291
2 Average collection period (Days)45.2374
9 51.328545.5546
644.6324
445.0490
4
3 Accounts payable turnover (Times)10.4227
67.83452
47.67411
56.26059
67.61036
3
4 Average payment period (Days)34.5398
145.9504
646.9109
457.5025
147.3039
2
5 Inventory turnover (Times)2.66405
32.82552
93.27191
13.44274
73.81641
8
6 Inventory processing period (Days)135.132
5127.409
8110.027
5104.567
794.3292
9
7 Fixed Asset turnover (Times)0.33536
10.37519
70.42757
10.49671
40.56667
2
8 Total asset Turnover (Times)0.27059
80.24473
50.30370
20.34255
70.37776
3
Debt Management Ratio 2008 2009 2010 2011 2012
1 Time Interest Earned Ratio (TIME)3.42091
33.50302
92.47028
63.45952
24.00071
2
2 Debt to total asset ratio 29% 45% 25% 26% 25%
Market Ratios 2008 2009 2010 2011 2012
1 P/E ratio 46.45
44.51
32.32
23.82
12.91
30 | P a g e
IBN Sina Pharma LTD.
Balance Sheet(IBN Sina Pharma. Ltd.) Amount in taka 2012 2011 2010 2009 2008ASSETS
Non-Current Assets : 724,073,62768410000
938287694
537903652
729352351
8
Property,Planatn d Equipment 372,063,18432916340
433021438
633284613
625791322
8Investmenitn MarketableS ecurities(FairV alue) 347245066
353710093 52642690 44734790 35610290
Deferred Tax Asset 4765377 1226512 19872 1455601
Current Assets : 32450339629480241
824273657
922505686
722013057
9Inventories 105024268 83398069 66404326 62231701 60035472Sundry Debtors 2065406 1613644 1399999 864243 597737
Advances, Deposits & Prepayments 11023485610889741
4 95826901 85469907 78397028
Cash & Cash Equivalents 10717886610089329
1 79105353 76491016 81100322
TOTAL ASSETS1,048,577,02
397890242
762561352
760409339
451365409
7 SHAREHOLDERSE' QUITYA ND LIABILITIES:
Shareholders' Equity 66131649361391510
326873112
921541023
418867657
0
Share Capital 16200000012960000
010800000
0 90000000 90000000Tax Holiday Reserve 4392110 4392110 4392110 4392110 4392110Gaino n MarketableS ecurities(U nrealized) 329744761
336209788
RetainedE arnings 16517962214371320
515633901
912101812
4 94284460
Non-Current Liabilities : 106020558 7916890110027833
6 80245507 60324124LongT ermF inance-Neot ff currentm 27550613 14613771 48733411 39937517 27826722
31 | P a g e
aturity
DeferredL iability 7846994564555113
0 51544925 40307990 31542490DeferredL Tax iability 954912
Current Liabilities : 28123997228581842
325660406
230843765
320405340
3
Short Term Finance 22083628 41174320 5539085918660886
216959173
9
Long Term Finance-current maturity 23458900 2159808610694213
7 19776124 6892620Deoosits 17624872 17255417 11490417 8478381 8041381Creditors 54908751 56005021 51462325 19209329 14232048Accrued Exoenses 67313140 60693123 54302216 22937534 16976210Other Finance 39463320 38644820 36941204 25811246 26223324Income Tax Liabilitv 56387361 50447636 30074904 25616177 22696081 TOTALS HAREHOLDERSE' QUITYA ND LIABILITIES 1048577023
978902427
625613527
604093394
513654097
Income Statement of IBN SINA Pharma. Ltd. 2012 2011 2010 2009 2008
SALES200942129
7175526081
5106517408
6127786884
6 1.0522E+10
Less : Cost of goods sold123009315
6107562050
8 985455871 785469076 652854439GROSS PROFIT 779328141 679640307 619718215 492399770 399454282
Less: Operatinge xpenses691,743,27
2 600677497 541294206 436859745 346729133OPERATINGP ROFIT 87584869 78962810 78424009 55540025 52725149Less: Financiacl Charges 4672712 6890878 8810133 5098143 4750860
Add : Other income8,745,677.0
0 654189 16315157 13736889 8907577Less : Workers' P.P. fund & welfare fund 4364659 4534458 4091859 3056132 2708660PROFIT BEFORE TAX 87,293,175 74082663 81837174 61122639 54173206Less: Incomet ax exoenses: Current Tax 24005623 20372732 20330550 14299488 13224807Deferred Tax -3538865 -1206640 1435729 -2410513 -2336810NET PROFIT AFTER TAX 66826417 54916571 60070895 49233664 43285209OtherC omprehensivlen come: -6465027 -30506514
32 | P a g e
Gaino n MarketableS ecurities(U nrealized) 60361390 24410057 Earnings Per Share (EPS) 4.13 5.46 4.64 45.59 48.09
Market Price Per Share 85.49
154.95
134.79
1,129.72 980.56
Income Statement of IBN SINA Pharma. Ltd. 2012 2011 2010 2009 2008
SALES 2009421297175526081
5106517408
6127786884
6 10522308721
Less : Cost of goods sold 1230093156107562050
8 985455871 785469076 652854439GROSS PROFIT 779328141 679640307 619718215 492399770 399454282Less: Operatinge xpenses 691,743,272 600677497 541294206 436859745 346729133OPERATINGP ROFIT 87584869 78962810 78424009 55540025 52725149Less: Financiacl Charges 4672712 6890878 8810133 5098143 4750860Add : Other income 8,745,677.00 654189 16315157 13736889 8907577Less : Workers' P.P. fund & welfare fund 4364659 4534458 4091859 3056132 2708660PROFIT BEFORE TAX 87,293,175 74082663 81837174 61122639 54173206Less: Incomet ax exoenses: Current Tax 24005623 20372732 20330550 14299488 13224807Deferred Tax -3538865 -1206640 1435729 -2410513 -2336810NET PROFIT AFTER TAX 66826417 54916571 60070895 49233664 43285209OtherC omprehensivlen come: -6465027 -30506514 Gaino n MarketableS ecurities(U nrealized) 60361390 24410057 Earnings Per Share (EPS) 4.13 5.46 4.64 45.59 48.09
Market Price Per Share 85.49 154.95
134.79
1,129.72 980.56
Ratio Analysis: Liquidity Ratios 2008 2009 2010 2011 2012
1 Current ratio(times)1.07878
90.72966
70.94595
81.03143
31.15383
1
33 | P a g e
2 Quick Ratio (Times)0.78457
50.52790
30.68717
60.73964
60.78039
8
Profit Ratios 2008 2009 2010 2011 2012 1 ROE 22.94% 22.86% 22.35% 8.95% 10.11% 2 ROA 8.43% 8.15% 9.60% 5.61% 6.37% 3 Gross Profit Margin 3.80% 38.53% 58.18% 38.72% 38.78% 4 Net Profit Margin 0.41% 3.85% 5.64% 3.13% 3.33%
Efficiency Ratios 2008 2009 2010 2011 2012
1Accounts Receivable Turnover (Times)
17603.58
1478.599
760.8392
1087.762
972.8941
2 Average collection period (Days) 0.020450.24347
40.47316
20.33095
5 0.37003
3Accounts payable turnover (Times)
38.45702
34.24383
18.14762
17.72228
18.27419
4 Average payment period (Days) 9.361110.5128
419.8373
120.3134
119.6999
1
5 Inventory turnover (Times)175.268
220.5340
516.0407
321.0467
819.1329
2
6Inventory processing period (Days)
2.053995
17.53186
22.44286
17.10475
18.81573
7 Fixed Asset turnover (Times)35.8482
63.37136
12.78202
72.56579
62.77516
2
8 Total asset Turnover (Times) 20.4852 2.115351.70260
71.79309
11.91633
2 Debt Management Ratio 2008 2009 2010 2011 2012
1 Time Interest Earned Ratio (TIME)11.0980
210.8941
78.90156
911.4590
3 18.7439
34 | P a g e
2 Debt to total asset ratio 51% 64% 57% 37% 37%
Market Ratios 2008 2009 2010 2011 2012
1 P/E ratio 20.70
28.38
29.05
24.78
20.39