Filtered Containment Venting Systems - Nuclear...
129
Filtered Containment Venting Systems Bob Fretz, Senior Project Manager Japan Lessons Learned Project Directorate Office of Nuclear Reactor Regulation Advisory Committee on Reactor Safeguards Fukushima Subcommittee October 3, 2012
Transcript of Filtered Containment Venting Systems - Nuclear...

Filtered Containment Venting Systems
Bob Fretz, Senior Project Manager Japan Lessons Learned Project Directorate
Office of Nuclear Reactor Regulation
Advisory Committee on Reactor Safeguards Fukushima Subcommittee
October 3, 2012

Purpose
• To present the staff’s preliminary regulatory analysis of the need for filtered venting systems in BWR Mark I and Mark II containments
2

Proposed Schedule
• 8:40 – 9:00 Introduction • 9:00 – 9:45 Design and Regulatory History, and
Foreign Experience • 9:45 – 10:30 FCVS in Severe Accident
Management • 10:30 – 11:00 MELCOR Analysis • 11:00 – 12:30 MACCS2 Analysis • 12:30 – 1:30 Break • 1:30 – 2:30 Risk Evaluation • 2:30 – 3:30 Regulatory Analysis • 3:30 – 4:30 Qualitative Arguments • 4:30 – 5:00 Next Steps
3

Discussion Outline
• Project Plan
• SECY Paper 1. Design and Regulatory History
2. Foreign Experience
3. Analysis of FCVS in Severe Accident Management
4. Technical Analyses (MELCOR/MACCS/PRA)
5. Stakeholder Interactions
6. Evaluation of Options
• Next Steps
4

Project Plan - Highlights
• November 30 SECY Paper to Commission
• November 20 SECY Paper to EDO
• November 1 ACRS Full Committee
• October 31 ACRS Subcommittee
• October 30 Draft Rev. 2 CP to SC
• October 16 Draft Rev. 1 CP to SC
• October 4 Public Meeting
• October 3 ACRS Subcommittee
5

SECY Paper Approach
• Purpose of Paper “The purpose of this paper is to provide the U.S. Nuclear
Regulatory Commission (NRC) with information and recommendations from the NRC staff regarding the imposition of new requirements related to containment venting systems for boiling water reactors (BWRs) with Mark I and Mark II containments.”
• Options 1. No Change 2. Severe Accident Capable Vent 3. Filtered Vent 4. Performance-Based Approach
6

SECY Paper Outline
• SECY Paper with Summaries of Enclosures, Options, and Recommendations – Enclosures
1. Design and Regulatory History
2. Foreign Experience
3. Analysis of FCVS in Severe Accident Management
4. Technical Analyses (MELCOR/MACCS/PRA)
5. Stakeholder Interactions
6. Evaluation of Options
7

Current Status
• Technical and policy assessments and evaluations ongoing
• Preliminary results being shared, subject to change
• Continuing to engage Steering Committee on path forward
• Staff recommendations will be made when technical evaluations and policy assessments are complete
8

Design and Regulatory History, and Foreign Experience
Bob Dennig Office of Nuclear Reactor Regulation Containment and Ventilation Branch
9

Design and Regulatory History
• Mark I Containments – WASH-1400 & NUREG-1150 found that Mark I
containments could be severely challenged if a severe accident occurred
– Relatively small volume Gas and steam buildup affect pressure more
dramatically
– BWR cores have ~3 times the quantity of zirconium as PWRs Potential for hydrogen gas and containment
pressurization
10

Design and Regulatory History
• Mark I Containments – Containment Performance Improvement Program Determine what actions, if any, should be taken to
reduce the vulnerability to severe accidents Staff recommended
– Improve hardened vent – Improve RPV depressurization system – Provide alternate water supply to RPV and drywell sprays – Improve emergency procedures and training
Commission approved hardened vent Other recommendations evaluated as part of IPE
program
11

Design and Regulatory History
• Mark II Containments – Similar to Mark I, the most challenging severe accident
sequences are station blackout and anticipated transients without scram
– Risk profile dominated by early failure with a release that bypasses the suppression pool
– Hardened venting was considered not beneficial because of unacceptable offsite consequences without an external filter like MVSS
– Staff did not recommend generic backfit of hardened vent, but recommended a comprehensive evaluation as part of the IPE program
12

Design and Regulatory History
• Filtered Containment Vents – TMI Action Item – 10 CFR 50.34(f) “provide one or more
dedicated containment penetrations, equivalent in size to a single 3-foot diameter opening, in order not to preclude future installation of systems to prevent containment failure, such as a filtered vented containment system”
– Shoreham supplemental containment venting system – During the CPIP, possibility of filters for Mark I and Mark
II containment vents was raised, but not pursued – Significant advancements in containment venting filter
technology have occurred over the past 25 years
13

Design and Regulatory History
• What we have today…Order EA-12-050 requires – Reliable hardened vent capable of performing
during a prolonged SBO (designed for use prior to the onset of core damage)
– Severe accident conditions not considered
– Designed to minimize operator actions
– Discharges effluent to a release point above main plant structures
14

Foreign Experience
• Staff visited Sweden, Switzerland, and Canada • Commission Paper will summarize FCVS
regulatory and technical bases, and status of FCVS in other countries
• Insights from visits and public meetings consistent with previous findings – 1988 CSNI Report 156, Specialists’ Meeting on
Filtered Containment Venting Systems • Together, FCVS and containment flooding scrub
fission products from core debris and remove decay heat
15

Foreign Experience
• Government decree and/or regulator’s order after TMI, Chernobyl, or Fukushima – Some plants installed or committed to install FCVS
prior to requirement (e.g., Germany and Japan) – Regulator and industry develop guidance following
regulatory decision (e.g., Sweden) – Some countries have periodic backfit reviews Actual accidents more influential to decision (e.g.,
Switzerland)
– Severe accidents were not part of the design basis when the decision was made
16

Foreign Experience
• Technical Bases Summary – Manage severe accident overpressure challenges
– Defense-in-depth to address uncertainties associated with severe accidents
– Significantly reduce offsite release and land contamination
• After Barsebäck filter was installed, subsequent filter costs considered low to modest
17

Foreign Experience
• Quantitative Bases Summary – Sweden land contamination goal
– Require a Level 3 PSA Level 1 frequencies low but not sufficient
After the decision, ensure equipment performance is acceptable generically and on plant-specific basis
– Acceptable not judged quantitatively – “significantly reduce”, “almost eliminate”, etc.
– Factored into emergency planning
18

Status of FCVS Internationally
Country
Boiling Water Reactors (BWR) by Containment Types
PWR PWR/ VVER PHWR
PHWR/ Candu
LWGR RBMK/
EGP GE
Mark I GE
Mark II ABB
Mark II GE
Mark III Other ABWR Belgium 7
Bulgaria 2
Canada 18
China 13 2
Czech Republic 6
Finland 2 2
France 58
Germany 2 11
Hungary 4
India 2 16
Japan 8 7 3 4 3 24
South Korea (ROK) 19 4
Mexico 2
Netherlands 1
Romania 1 1
Russia 17 15
Slovakia 4
Slovenia 1
South Africa 2
Spain 1 1 6
Sweden 4 3 3
Switzerland 1 1 3
Taiwan 2 2 2
Ukraine 15
United Kingdom 1
# FCVS installed and operational, or Committed to installing FCVS
# Considering installing FCVS
# No FCVS; has not committed to installing FCVS
# FCVS Status Unknown
19

Foreign Experience
FCVS Status GE
Mark I GE
Mark II ABB
Mark II GE
Mark III Other ABWR Totals
FCVS Operational 1 0 6 1 5 0 13 30%
Committed 6 7 0 5 4 3 25 57%
Considering 1 0 0 1 0 0 2 5%
No FCVS 2 2 0 0 0 0 4 9%
Non-U.S. Totals 10 9 6 7 9 3 44
FCVS Status at Non-U.S. BWR Facilities
20

FCVS in Severe Accident Management
Jerry Bettle Office of Nuclear Reactor Regulation Containment and Ventilation Branch
21

FCVS in Severe Accident Management
• Reviewed spectrum of plant procedures • EOPs and SAMGs describe multiple containment
vent pathways • EDMGs provide portable pumps for RPV/DW
injection • Existing guidance provides for containment
venting and injecting water to the reactor cavity • EOPs focus on preventing core damage • Decision to vent may be complicated with an
unfiltered vent
22

FCVS in Severe Accident Management
• DW Sprays for Decontamination – Spray headers designed for DBA purposes
(pressure control and heat removal) with flow rates of 1,000’s GPM (provide estimated DFs around 10)
– Portable pumps with flow rates in low 100’s GPM result in spray nozzle dribble and DFs much less than full flow DFs Good for cavity flooding
Not as effective for decontamination
23

FCVS in Severe Accident Management
• Suppression Pool for Decontamination – SRV discharge via T-quencher in bottom of
subcooled suppression pool provides an aerosol DF of 100 to 300
– Downcomer pipes which discharge higher in the suppression pool at or near saturation temperatures provide DFs of 10 or less
24
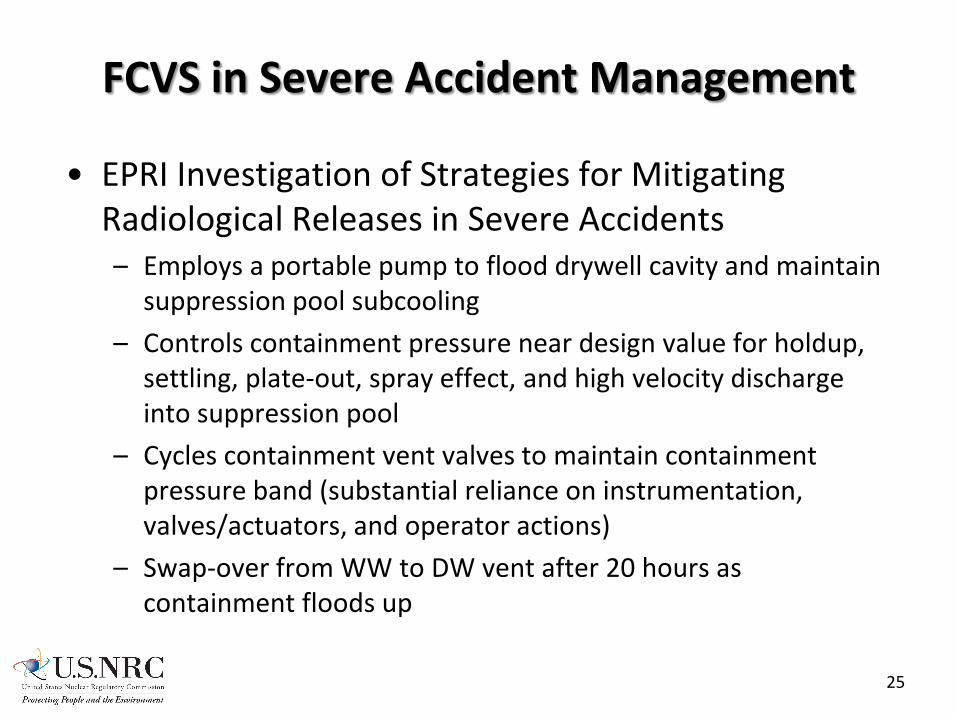
FCVS in Severe Accident Management
• EPRI Investigation of Strategies for Mitigating Radiological Releases in Severe Accidents – Employs a portable pump to flood drywell cavity and maintain
suppression pool subcooling
– Controls containment pressure near design value for holdup, settling, plate-out, spray effect, and high velocity discharge into suppression pool
– Cycles containment vent valves to maintain containment pressure band (substantial reliance on instrumentation, valves/actuators, and operator actions)
– Swap-over from WW to DW vent after 20 hours as containment floods up
25

FCVS in Severe Accident Management
• Staff preliminary assessment of EPRI investigation – Did not address potential increase in penetration
leakage due to increased heat, radiation, and pressure
– Did not address operation of valve, including instrumentation, procedures and human performance
– Did not address water vapor condensation in vent line and potential for hydrogen buildup
26

Options Identified by Staff
• No Change (Option 1)
• Severe Accident Capable Vent (Option 2)
• Filtered Vent (Option 3)
• Performance-Based Approach (Option 4)
27

Option 2 - Severe Accident Capable Vent
• Upgraded reliable hardened vent for severe accident conditions and service
– Higher temperatures and pressure
– Hydrogen considerations in the vent line (inerting considerations)
– Severe accident capable vent valves
– Shielding for operator actions and personnel access to reactor building and/or remote manual operation of vent valves
28
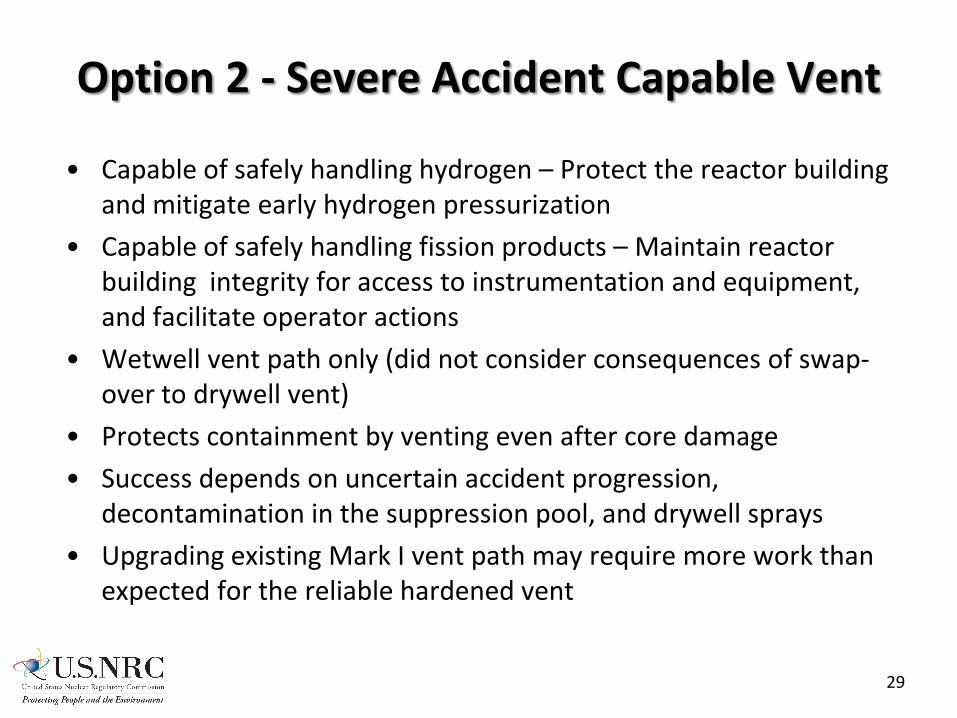
Option 2 - Severe Accident Capable Vent
• Capable of safely handling hydrogen – Protect the reactor building and mitigate early hydrogen pressurization
• Capable of safely handling fission products – Maintain reactor building integrity for access to instrumentation and equipment, and facilitate operator actions
• Wetwell vent path only (did not consider consequences of swap-over to drywell vent)
• Protects containment by venting even after core damage
• Success depends on uncertain accident progression, decontamination in the suppression pool, and drywell sprays
• Upgrading existing Mark I vent path may require more work than expected for the reliable hardened vent
29

Option 3 - Filtered Vent
• Significant enhancement in severe accident containment performance – Benefits of Option 2 plus defense in depth
enhancements
• No identified technical or safety problems
• Venting with a filter results in a much smaller release compared to without a filter
• Proven, feasible option that has been implemented in several countries
30
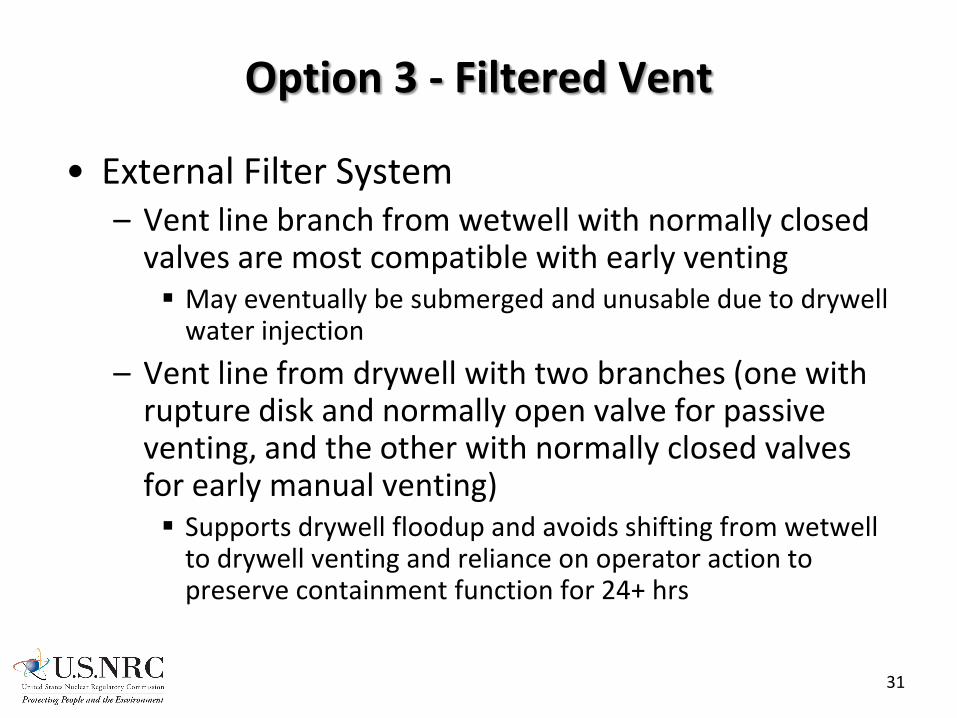
Option 3 - Filtered Vent
• External Filter System – Vent line branch from wetwell with normally closed
valves are most compatible with early venting May eventually be submerged and unusable due to drywell
water injection
– Vent line from drywell with two branches (one with rupture disk and normally open valve for passive venting, and the other with normally closed valves for early manual venting) Supports drywell floodup and avoids shifting from wetwell
to drywell venting and reliance on operator action to preserve containment function for 24+ hrs
31

Option 3 - Filtered Vent
• External Filter System – Staff would develop a technical basis to require a
minimum DF or other performance requirement e.g., DF > 1,000 aerosols (including submicron),
e.g., DF > 100 elemental Iodine
– Engage stakeholders to develop appropriate performance criteria
– May require active and passive features for prolonged SBO under severe accident conditions
32

Option 3 - Filtered Vent
• External Wet Filter System
33

Option 4 - Performance Based
• Potential approaches
– Each plant meets a defined DF for a defined source term
– Each plant meets criteria defined for combination of event frequencies and DF
– Each plant performs a site-specific cost/benefit analysis
• Could potentially address forthcoming industry “filtering strategy” proposal (anticipating industry submittal)
34

Technical Analysis of Options 1, 2, & 3
• NRR identified a number of accident sequences (i.e., cases) to be evaluated by RES in support of conducting a Regulatory Analysis – Base cases were intended to be representative of options
considered – Sensitivity cases also evaluated
• MELCOR calculations – Calculations informed by SOARCA and Fukushima – Various prevention and mitigation actions
• MACCS calculations – Venting with and without filter
• Event sequences and probabilities • Consequence and frequency estimates
35

MELCOR Analysis
Sudhamay Basu and Allen Notafrancesco Office of Nuclear Regulatory Research
Fuel and Source Term Code Development Branch
36

Insights on BWR Mark I Response
• SOARCA Peach Bottom Analysis – Base case SBO sequences with no sprays or venting – Primary containment vessel failure modes
DW liner shell melt-thru and over-pressure – Reactor building accident response
Blow-out panels open, local H2 combustion, and roof failure
• Fukushima – Long term SBO with protracted RCIC operation – Primary containment vessel failure modes
Over-pressurization with leakage thru drywell head and containment penetrations?
– Reactor building accident response Significant combustion events
37

Filtered Vent MELCOR Analysis
• Based on SOARCA MELCOR modeling • Accident sequences
– Informed by SOARCA and Fukushima – Long-term SBO (base case 16 hr RCIC)
• Mitigation actions – B.5.b and/or FLEX provide core spray or drywell
spray (300 gpm) – Containment venting
• Sensitivity analysis – Spray flow rate and timing, wetwell versus drywell
venting, and RCIC duration
38
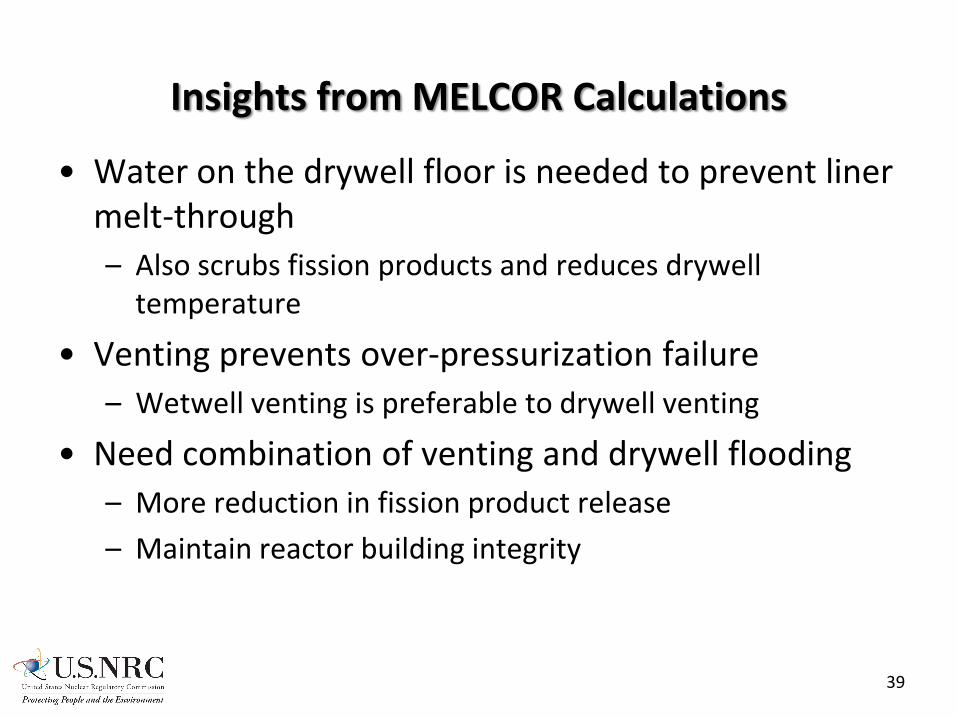
Insights from MELCOR Calculations
• Water on the drywell floor is needed to prevent liner melt-through – Also scrubs fission products and reduces drywell
temperature
• Venting prevents over-pressurization failure – Wetwell venting is preferable to drywell venting
• Need combination of venting and drywell flooding – More reduction in fission product release
– Maintain reactor building integrity
39

MELCOR BWR Nodalization
Reactor Building Nodalization Containment Nodalization
CV412(Refueling Bay)
CV411
CV409(195' SE
Quadrant)CV407
(195' NEQuadrant)
CV405(165' South Half)
CV404(165' North Half)
CV403(135' South Half)
CV402(135' North Half)
FL407(open hatch)
FL423
FL902(DW liner shear)
FL422(open hatch)
CV401 (Torus Rm)
FL425 (blowout panels)
CV90
3(E
nviro
nmen
t)
CV401
FL414(open hatch)
FL017(DW nom leakage)
FL401 (open floor grating)FL402 (open grating)
FL404 (E)
FL408 (E)
FL409 (W)
CV410(195' SW
Quadrant)
FL416 FL417
Dryer - Separator Storage Pitdivides the SE/SW Quadrants
CV408(195' NWQuadrant)
FL415
Spent Fuel Pool Volumeincluded in CV412
which dividesNE/NW Quadrants of 195'
FL403 (W)
Section A-A
CV570(Equip Access
Airlock)
FL445FL446
N
A
A
B
B
El. 91' 6"
El. 135'
El. 165'
El. 195'
El. 234'
CV90
1(E
nviro
nmen
t)
FL424 (nom. leakage)
FL421 (roof failure)
FL90
3
40
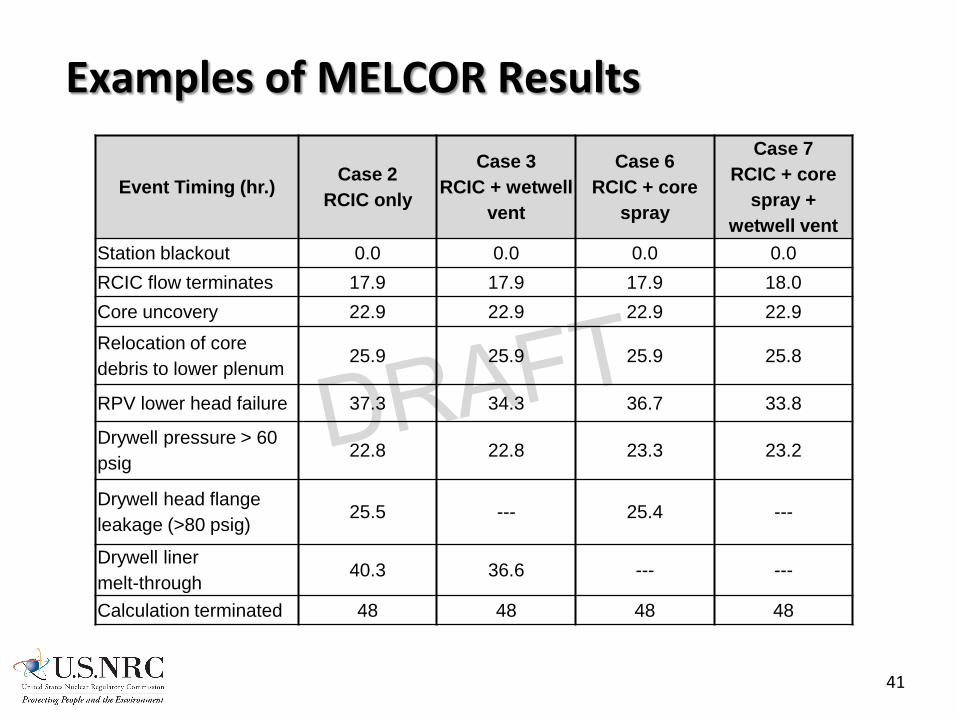
Examples of MELCOR Results
41
Event Timing (hr.) Case 2 RCIC only
Case 3 RCIC + wetwell
vent
Case 6 RCIC + core
spray
Case 7 RCIC + core
spray + wetwell vent
Station blackout 0.0 0.0 0.0 0.0 RCIC flow terminates 17.9 17.9 17.9 18.0 Core uncovery 22.9 22.9 22.9 22.9
Relocation of core debris to lower plenum
25.9 25.9 25.9 25.8
RPV lower head failure 37.3 34.3 36.7 33.8
Drywell pressure > 60 psig
22.8 22.8 23.3 23.2
Drywell head flange leakage (>80 psig)
25.5 --- 25.4 ---
Drywell liner melt-through
40.3 36.6 --- ---
Calculation terminated 48 48 48 48
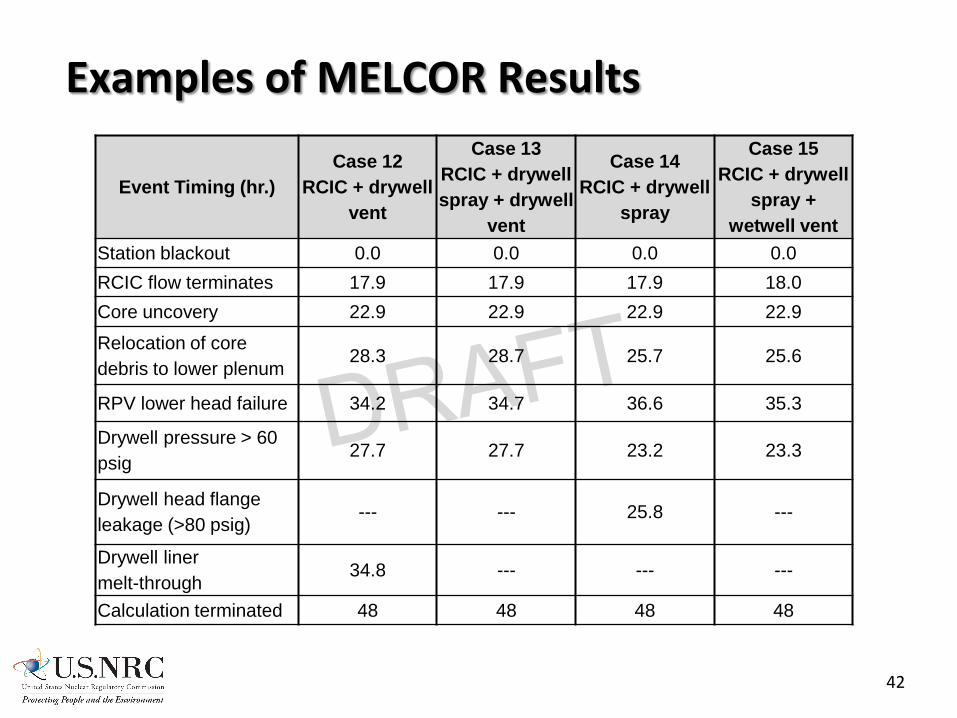
Examples of MELCOR Results
42
Event Timing (hr.) Case 12
RCIC + drywell vent
Case 13 RCIC + drywell spray + drywell
vent
Case 14 RCIC + drywell
spray
Case 15 RCIC + drywell
spray + wetwell vent
Station blackout 0.0 0.0 0.0 0.0 RCIC flow terminates 17.9 17.9 17.9 18.0 Core uncovery 22.9 22.9 22.9 22.9
Relocation of core debris to lower plenum
28.3 28.7 25.7 25.6
RPV lower head failure 34.2 34.7 36.6 35.3
Drywell pressure > 60 psig
27.7 27.7 23.2 23.3
Drywell head flange leakage (>80 psig)
--- --- 25.8 ---
Drywell liner melt-through
34.8 --- --- ---
Calculation terminated 48 48 48 48

Examples of MELCOR Results
43
Selected MELCOR Results
Case 2 RCIC only
Case 3 RCIC + vent
Case 6 RCIC + core
spray
Case 7 RCIC + core spray + vent
Debris mass ejected (1000 kg)
286 270 255 302
In-vessel hydrogen generated (kg-mole)
525 600 500 600
Ex-vessel hydrogen generated (kg-mole)
461 708 276 333
Other non-condensable generated (kg-mole)
541 845 323 390
Cesium release fraction at 48 hrs.
1.32E-02 4.59E-03 3.76E-03 3.40E-03
Iodine release fraction at 48 hrs.
2.00E-02 2.81E-02 1.70E-02 2.37E-02

Examples of MELCOR Results
44
Selected MELCOR Results
Case 12 RCIC + drywell
vent
Case 13 RCIC + drywell spray + drywell
vent
Case 14 RCIC + drywell
spray
Case 15 RCIC + drywell spray + wetwell
vent Debris mass ejected (1000 kg)
345 351 267 257
In-vessel hydrogen generated (kg-mole)
714 793 614 650
Ex-vessel hydrogen generated (kg-mole)
774 410 327 276
Other non-condensable generated (kg-mole)
922 485 383 270
Cesium release fraction at 48 hrs.
1.93E-01 1.86E-01 1.12E-03 3.01E-03
Iodine release fraction at 48 hrs.
4.90E-01 4.84E-01 5.41E-03 1.86E-02


48
MACCS2 Analyses Supporting Filtered Containment Venting Systems
Commission Paper
Tina Ghosh
Office of Nuclear Regulatory Research
Nathan Bixler
Sandia National Laboratories
49

Outline
• Overview of MACCS2 – MACCS2 Modules ATMOS: Atmospheric Modeling EARLY: Emergency Phase Modeling CHRONC: Long Term Phase Modeling
– MACCS2 Uses – References
• MACCS2 analysis for filtered containment venting systems – Scope of analysis – Inputs – Results of calculations, venting with and without filter
50
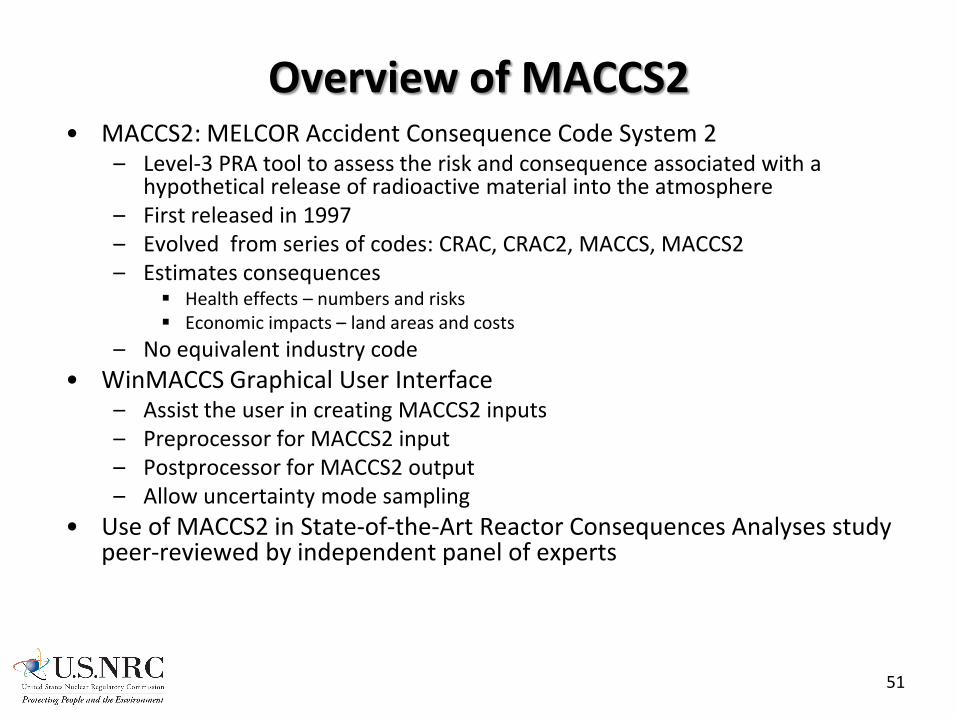
Overview of MACCS2 • MACCS2: MELCOR Accident Consequence Code System 2
– Level-3 PRA tool to assess the risk and consequence associated with a hypothetical release of radioactive material into the atmosphere
– First released in 1997 – Evolved from series of codes: CRAC, CRAC2, MACCS, MACCS2 – Estimates consequences
Health effects – numbers and risks Economic impacts – land areas and costs
– No equivalent industry code • WinMACCS Graphical User Interface
– Assist the user in creating MACCS2 inputs – Preprocessor for MACCS2 input – Postprocessor for MACCS2 output – Allow uncertainty mode sampling
• Use of MACCS2 in State-of-the-Art Reactor Consequences Analyses study peer-reviewed by independent panel of experts
51

52
Pathways to Receptors from Atmospheric Release
MACCS2 models the radioactive transport through the atmosphere (e.g. plume rise, dispersion, dry and wet deposition)
MACCS2 estimates the health effects from: inhalation, cloudshine, groundshine, skin deposition, and ingestion (e.g. water, milk, meat, crops)

MACCS2 Modules
• ATMOS – Not associated with a phase – Atmospheric transport and deposition
• EARLY (1 day to 1 week) – Emergency-phase – Prompt and latent health effects – Effects of sheltering, evacuation, and relocation
• CHRONC – Intermediate phase (0 to 1 year) – Long-term phase (0 to 317 years; 30-50 years typical) – Latent health effects – Effects of decontamination, interdiction, and condemnation
53

ATMOS Module
Atmospheric Transport and Dispersion (ATD) Estimates • Dispersion based on Gaussian plume segment model
– Provisions for meander and surface roughness effects – Phenomena not treated in detail in this model: irregular terrain,
spatial variations in wind field, temporal variations in wind direction – A study (NUREG/CR-6853) comparing the MACCS2 ATD model with
two Gaussian puff codes and a Lagrangian particle tracking code showed that the MACCS2 mean results (over weather) were within a factor of 2 for arc-averages and a factor of 3 at a specific grid location out to 100 miles from the point of release.
• Multiple Plume Segments (up to 200) • Plume rise from initial release height • Effects of building wake on initial plume size • Dry and wet deposition • Radioactive decay and ingrowth (150 radionuclides, 6 generations)
54

ATMOS Module (continued)
• MELCOR source term is input via MELMACCS • Meteorological data required
– Wind speed and direction – Pasquill stability category – Precipitation rate – Seasonal AM and PM mixing-layer height
• User selectable meteorology sampling options – Single weather sequence – Multiple weather sequences
Statistical sampling to represent uncertain conditions at the time of a hypothetical accident
• Outputs – Dispersion parameters, χ/Q, fraction remaining in plume – Air and ground concentrations
55

EARLY Module
• Emergency-phase consequences – Acute and lifetime doses for following dose pathways
Inhalation (direct and resuspension), Cloudshine Groundshine Skin deposition
– Associated health effects Early injuries/fatalities from acute doses Latent health effects from lifetime committed doses
• Doses are subject to effects of – Sheltering – Evacuation
Speed can vary by phase, location, precipitation – Relocation criteria for individuals
Based on projected dose
• Outputs – Doses, health effects, land contamination areas
56

CHRONC Module
• Intermediate Phase (optional, 0 to 1 year) – Dose pathways
Groundshine Resuspension inhalation
– Continued relocation is only protective action
• Long-Term Phase (up to 317 years, 30 to 50 typical) – Dose pathways
Groundshine Resuspension inhalation Ingestion
– Protective actions Based on habitability and farmability Actions include
– Decontamination – Interdiction – Condemnation
57
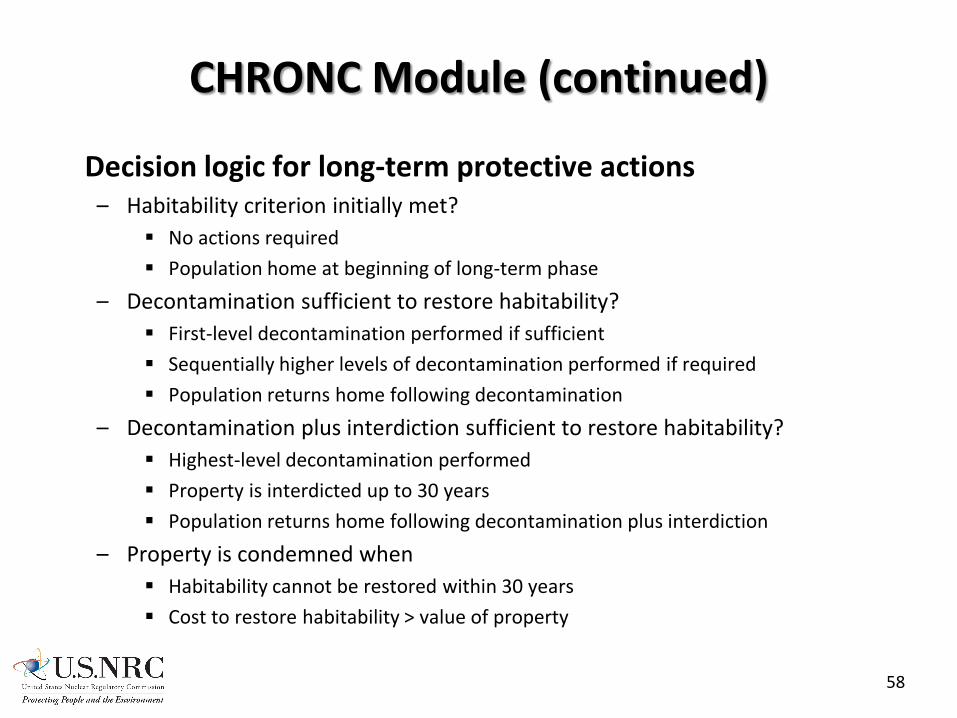
CHRONC Module (continued)
Decision logic for long-term protective actions – Habitability criterion initially met?
No actions required
Population home at beginning of long-term phase
– Decontamination sufficient to restore habitability? First-level decontamination performed if sufficient
Sequentially higher levels of decontamination performed if required
Population returns home following decontamination
– Decontamination plus interdiction sufficient to restore habitability? Highest-level decontamination performed
Property is interdicted up to 30 years
Population returns home following decontamination plus interdiction
– Property is condemned when Habitability cannot be restored within 30 years
Cost to restore habitability > value of property
58

CHRONC Module (continued)
• Economic costs – Per diem and lost income for evacuation/relocation – Moving expense lost income for interdicted property – Decontamination labor and materials – Loss of use of property – Condemned property – Contaminated crops and dairy
• Output – Doses by pathway and organ – Latent health effects – Economic costs
59

MACCS2 Uses • PRAs and other severe accident studies (e.g., SOARCA)
– Risks from operating a facility – Relative importance of the risk contributors – Insights on potential safety improvements
• NRC Regulatory Analyses • NEPA Studies (National Environmental Policy Act) such as: License
extension and new reactor applications – Environmental Impact Statements (EISs)
the results of the calculations are typically used to compare the accident risks posed by various alternatives
– Severe Accident Mitigation Alternatives (SAMAs) and Design Alternative (SAMDAs) analyses required for license renewal and for new licenses
• DOE Applications: Authorization basis analyses performed for DBAs – the analyst is interested in conservatively calculated, bounding dose
estimates for well-defined DBA and beyond-DBA accident scenarios. The results of this analysis are used to determine if the safety basis of the facility is adequate for operation (DOE 1989, 1992b)
• MACCS2 has an international usership (US plus over 10 other countries)
60
References
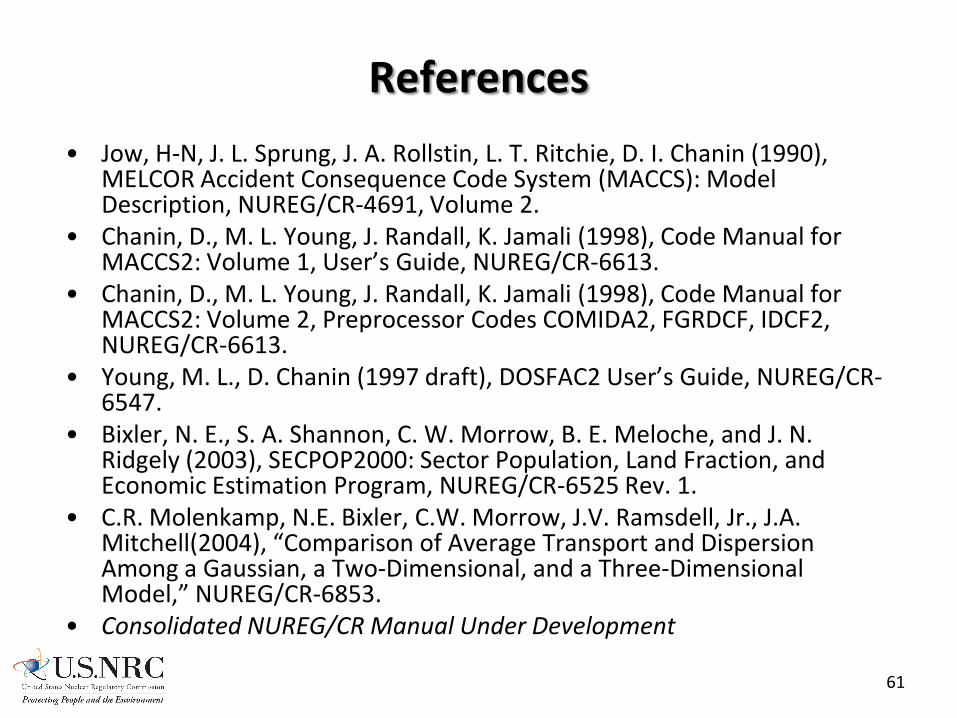
• Jow, H-N, J. L. Sprung, J. A. Rollstin, L. T. Ritchie, D. I. Chanin (1990), MELCOR Accident Consequence Code System (MACCS): Model Description, NUREG/CR-4691, Volume 2.
• Chanin, D., M. L. Young, J. Randall, K. Jamali (1998), Code Manual for MACCS2: Volume 1, User’s Guide, NUREG/CR-6613.
• Chanin, D., M. L. Young, J. Randall, K. Jamali (1998), Code Manual for MACCS2: Volume 2, Preprocessor Codes COMIDA2, FGRDCF, IDCF2, NUREG/CR-6613.
• Young, M. L., D. Chanin (1997 draft), DOSFAC2 User’s Guide, NUREG/CR-6547.
• Bixler, N. E., S. A. Shannon, C. W. Morrow, B. E. Meloche, and J. N. Ridgely (2003), SECPOP2000: Sector Population, Land Fraction, and Economic Estimation Program, NUREG/CR-6525 Rev. 1.
• C.R. Molenkamp, N.E. Bixler, C.W. Morrow, J.V. Ramsdell, Jr., J.A. Mitchell(2004), “Comparison of Average Transport and Dispersion Among a Gaussian, a Two-Dimensional, and a Three-Dimensional Model,” NUREG/CR-6853.
• Consolidated NUREG/CR Manual Under Development
61

Scope of Analysis for Filtered Vents
MACCS2 used to calculate: • Offsite population doses
– Includes doses to public as well as off-site decontamination workers
• Individual latent cancer fatality risk and prompt fatality risk
• Land contamination – For different thresholds of Cs-137 concentration in
soil (Ci/km2) • Economic cost • For 50-mile radius around plant
62

Inputs
• Work is based on the SOARCA project, which is documented in NUREG-1935 and NUREG/CR-7110 Volume 1
• Started with SOARCA inputs for Peach Bottom Atomic Power Station pilot plant (with exception of source term, and ingestion pathway modeled)
• Habitability (return) criterion used is 500 mrem/year, per Pennsylvania State guideline
• Statistical sampling of weather sequences used to represent uncertain conditions at the time of a hypothetical accident (~1,000 weather trials)
• Linear-no-threshold dose response model
63

Inputs – Six Emergency Phase Cohorts
• Cohort 1: 0 to 10 Public
• Cohort 2: 10 to 20 Shadow
• Cohort 3: 0 to 10 Schools and 0 to 10 Shadow
• Cohort 4: 0 to 10 Special Facilities
• Cohort 5: 0 to 10 Tail
• Cohort 6: Non-Evacuating Public (assumed to be 0.5%)
64

Inputs – Decontamination Factor of Filters
• Neither MELCOR nor MACCS2 models mechanistically the decontamination effect of an external filter
• A prescribed decontamination factor (DF) value is assigned for an external filter
• This DF is applied to only a portion of the total fractional release - the portion which is released through a flow path connected to venting
• For the MACCS2 input, the MELCOR source term from the relevant flow path was reduced by the DF
65

MACCS2 Results Per Event
Event Base case
Case 2
Base case with WW venting
Case 3 Unfiltered Filtered DF = 10
Base case with core spray
Case 6
Base case with WW venting and core
spray Case 7
Unfiltered Filtered DF = 10
Population dose 50 mile radius per event (rem)
510,000 400,000 180,000 310,000 240,000
37,000
Population weighted latent cancer fatality (LCF) risk 50 mile radius per event
4.8E-05 3.3E-05 1.3E-05 2.5E-05 1.6E-05
2.2E-06
Contaminated area (km2) with level exceeding 15 µCi/m2 per event
280 54 8 72 34
0.4
Total economic cost 50 mile radius per event ($M)
1,900 1,700 270 850 480
18
66

67
Event
Base case with drywell venting
Case 12
Unfiltered Filtered 1 DF=1,000 Filtered 2 DF=5,000
Base case with
DW venting and DW spray
Case 13
Unfiltered Filtered
DF=1,000
Base case with drywell
spray Case 14
Base case with WW venting & drywell spray
Case 15 Unfiltered Filtered DF = 10
Population dose 50 mile radius per event (rem) 3,800,000 230,000 210,000
3,900,000 60,000 86,000 280,000
43,000
Population weighted latent cancer fatality (LCF) risk 50 mile radius per event
3.2E-04 1.6E-05 1.4E-05
3.3E-04 3.7E-06 6.4E-06 2.1E-05
2.7E-06
Contaminated area (km2) with level exceeding 15 µCi/m2 per event
9,200 28 25
8,800 2 10 28
0.3
Total economic cost 50 mile radius per event ($M)
33,000 390 370
33,000 38 116 590
20
MACCS2 Results Per Event (continued)

Insights from MACCS2 Calculations
• The health effect of interest is latent cancer fatality risk, which is controlled in part by the habitability (return) criterion – Essentially no prompt fatality risk
• In terms of long-term radiation, the most important isotope is Cs-137, and most of the doses are from ground shine
• There is a non-linear relationship between decontamination factor and both land contamination area and health effects
68

Severe Accident Containment Vent Risk Evaluation
Marty Stutzke
Office of Nuclear Regulatory Research
69

Outline
• Purpose
• Conditional Containment Failure Probability
• Insights from Severe Accident Mitigation Alternatives (SAMA) Analyses
• Technical Approach
• Results
• Uncertainties
70
Purpose
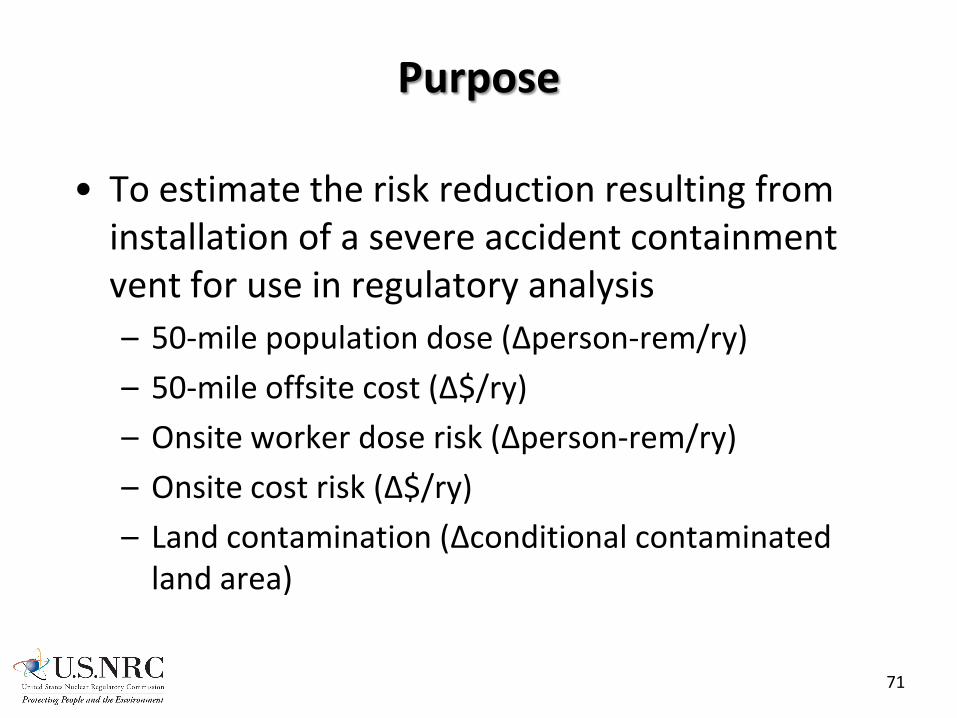
• To estimate the risk reduction resulting from installation of a severe accident containment vent for use in regulatory analysis – 50-mile population dose (Δperson-rem/ry)
– 50-mile offsite cost (Δ$/ry)
– Onsite worker dose risk (Δperson-rem/ry)
– Onsite cost risk (Δ$/ry)
– Land contamination (Δconditional contaminated land area)
71
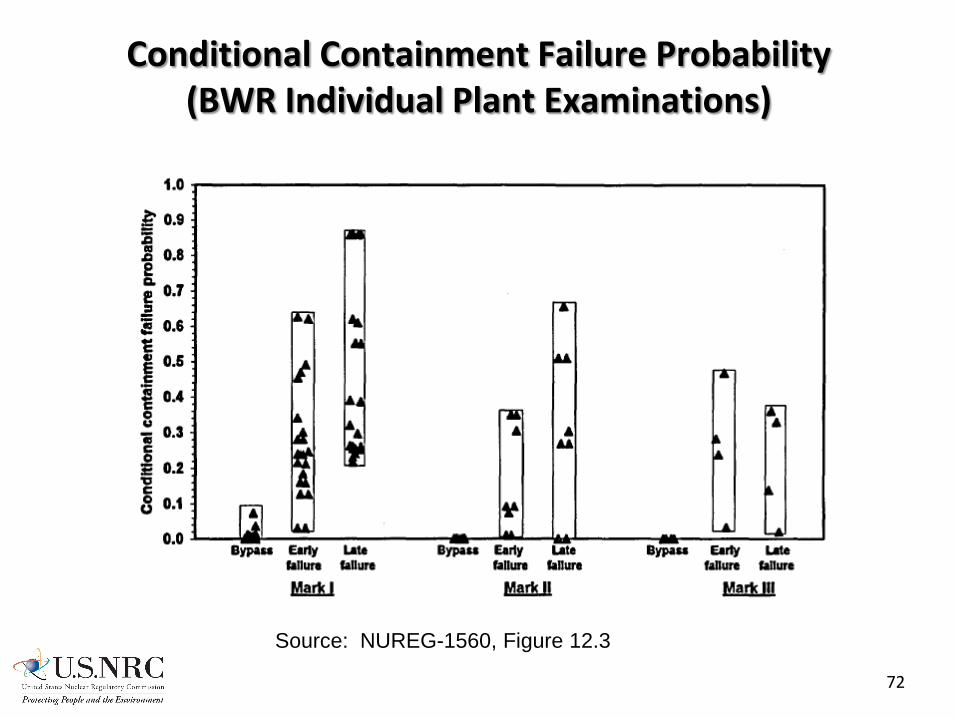
Conditional Containment Failure Probability (BWR Individual Plant Examinations)
Source: NUREG-1560, Figure 12.3
72

Conditional Containment Failure Probability (PWR Individual Plant Examinations)
Source: NUREG-1560, Table 12.17
73

Conditional Containment Failure Probability (ILRT Extension License Amendments)
Plant Type ILRT Interval Accident
Phenomena Bypass
(ISLOCA) Isolation Failures
Total CCFP
Cooper Mark I 3 in 10y 1 in 10y 1 in 15y
94.6% 94.6% 94.6%
0.0% 0.0% 0.0%
1.0% 1.0% 1.0%
95.6% 95.6% 95.6%
Nine Mile Point 1 Mark I 3 in 10y 1 in 10y 1 in 15y
62.4% 62.4% 62.4%
2.7% 2.7% 2.7%
9.7% 9.7% 9.8%
74.8% 74.9% 74.9%
Peach Bottom Mark I 3 in 10y 1 in 10y 1 in 15y
61.1% 61.1% 61.1%
2.4% 2.4% 2.4%
2.7% 3.4% 4.0%
66.2% 67.0% 67.5%
Pilgrim Mark I 3 in 10y 1 in 10y 1 in 15y
97.7% 97.7% 97.7%
0.6% 0.6% 0.6%
0.0% 0.1% 0.1%
98.3% 98.3% 98.4%
Vermont Yankee Mark I 1 in 10y 1 in 15y
86.8% 86.8%
1.1% 1.1%
0.1% 0.2%
88.0% 88.1%
LaSalle Mark II 3 in 10y 1 in 10y 1 in 15y
82.9% 82.9% 82.9%
2.4% 2.4% 2.4%
0.4% 0.6% 0.8%
85.7% 85.9% 86.1%
Limerick Mark II 3 in 10y 1 in 10y 1 in 15y
62.4% 62.4% 62.4%
1.3% 1.3% 1.3%
0.7% 1.5% 2.0%
64.4% 65.2% 65.7%
74

Consideration of Filtered Containment Vents in SAMA Analyses
(As of February 2012)
Plant Type
Filtered Containment
Vent Not Considered
FCV Considered (Screening Analysis)
FCV Considered
(Detailed Analysis)
License Renewal
Granted, but Limited SAMA
License Renewal
Application Not Submitted Total
BWR Mark I 5 11 5 1 1 23
BWR Mark II 1 3 2 2 8
BWR Mark III 1 3 4
PWR large dry containment
22 10 14 9 55
PWR subatmospheric containment
5 5
PWR ice condenser
2 4 3 9
Total 28 26 29 3 18 104
Screening Analysis: cost of implementation > plant-specific maximum possible monetized averted risk
75

Detailed SAMA Analyses of Filtered Containment Venting
Plant Offsite Dose Reduction
Estimated Benefit Notes
FitzPatrick 3.73% $4,090 Successful torus venting accident progression source terms were reduced by a factor of 2 to reflect the additional filtered capability
Pilgrim 0.00% $0 Successful torus venting accident progression source terms were reduced by a factor of 2 to reflect the additional filtered capability
Vermont Yankee
0.11% $200 Successful torus venting sequences were binned into the Low-Low release category to conservatively assess the benefit of this SAMA
Not clear if post-core-damage venting to prevent containment overpressurization failure was considered in these analyses
76

Core Damage Frequency
Source CDF (/ry) NUREG-1150 Peach Bottom (includes internal events, fires, and seismic events based on the LLNL hazard curves)
1E-4
SPAR Internal and External Event Models (BWR Mark I Plants) Duane Arnold Monticello Peach Bottom
1E-5 2E-5 2E-5
SAMA Analyses (Five BWR Mark I and Mark II plants with internal and external event PRAs)
2E-5 to 6E-5
Global Statistical Value 3E-4
77

Economic Consequences
Source cost/event Regulatory analysis handbook (NUREG/BR-0184, Table 5.6, Peach Bottom, 1990 dollars)
$3B*
SAMA Analyses Peach Bottom Minimum for BWR Mark I and Mark II plants (Hatch) Maximum for BWR Mark I and Mark II plants (Hope Creek)
$10B* $0.6B* $30B*
Estimated Fukushima offsite costs (3 Units) (Japan Center for Economic Research, June 2011, includes land condemnation for 20 km and compensation for 10 years)
$62B
Deepwater Horizon oil spill $23B
*Frequency-weighted average of the point estimates for internal events
78

Designing a Technical Approach
• Focus on BWR Mark I plants • Risk modeling
– No change in CDF – Need to use simplified Level 2/3 PRA
Not feasible to develop complete Level 3 PRA SOARCA MELCOR and MACCS2 for Peach Bottom
• Eight candidate plant modifications – Vent actuation: manual or passive – Vent location: wetwell or drywell – Filter: no or yes
• Consideration of post-core-damage core spray or drywell spray to prevent liner melt-through
Affects frequency estimation
Affects consequence estimation
79

Assumptions and Groundrules
• Use existing regulatory analysis guidance – Risk evaluation developed on a “per-reactor” basis – Multi-unit accidents not addressed – Spent fuel pool accidents not addressed
• Release sequence consequences are reasonably approximated by determining the consequences of SBO sequences
• Battery life is 16 hours • Filter decontamination factor of 10 • No credit for recovering offsite power if core-damage was caused
by an external hazard (e.g., seismic, high winds) • If a sequence involves failure to open the vent or containment
bypass (e.g., ISLOCA), then use of a portable pump (B.5.b/FLEX) for core spray or drywell spray following core damage is precluded due to a harsh work environment (high dose rates, high temperatures, etc.)
80

Release Event Tree
CD Hazard Sequence Type Vent OSP
Recovery Portable
Pump 1 2 3 4 5 6 7 8 9
10 11 12 13 14 15 16
Vented
OP + LMT
OP
LMT
OP + LMT
OP + LMT
OP + LMT OP + LMT
OP + LMT
Vented
Vented
Vented Vented
LMT
LMT
LMT
Seq Status
internal
external
other
SBO
bypass
fast
other
bypass
yes
no
81

Release Sequence Quantification Data Sources
Parameter Value Basis
Core-damage frequency 2E-5/ry SPAR models
Fraction of total CDF due to external hazards
0.8 SPAR-EE models
Breakdown of sequence types for internal hazards
Other (not SBO, bypass, or fast)
0.83 SPAR models
SBO 0.12
Bypass (ISLOCAs)
0.05
Fast (MLOCAs,
LLOCAs, ATWS)
0.01
Breakdown of sequence types for external hazards
Other (not bypass) 0.95 Engineering judgment
Bypass 0.05
82

Release Sequence Quantification Data Sources
Parameter Value Basis
Probability that severe accident vent fails to open
Mod 0 1 Current situation (base case)
Mods 1,3,5,7 – other or SBO 0.3 SPAR-H (manual vent, longer available time)
Mods 1,3,5,7 - fast 0.5 SPAR-H (manual vent, shorter available time)
Mods 2,4,6,8 0.001 Engineering judgment (passive vent)
Conditional probability that offsite power is not recovered by the time of lower head failure given not recovered at the time of core damage (internal hazards)
0.38 NUREG/CR-6890
Probability that portable pump for core spray or drywell spray fails
0.3 SPAR-H; consistent with B.5.b study done by INL
83
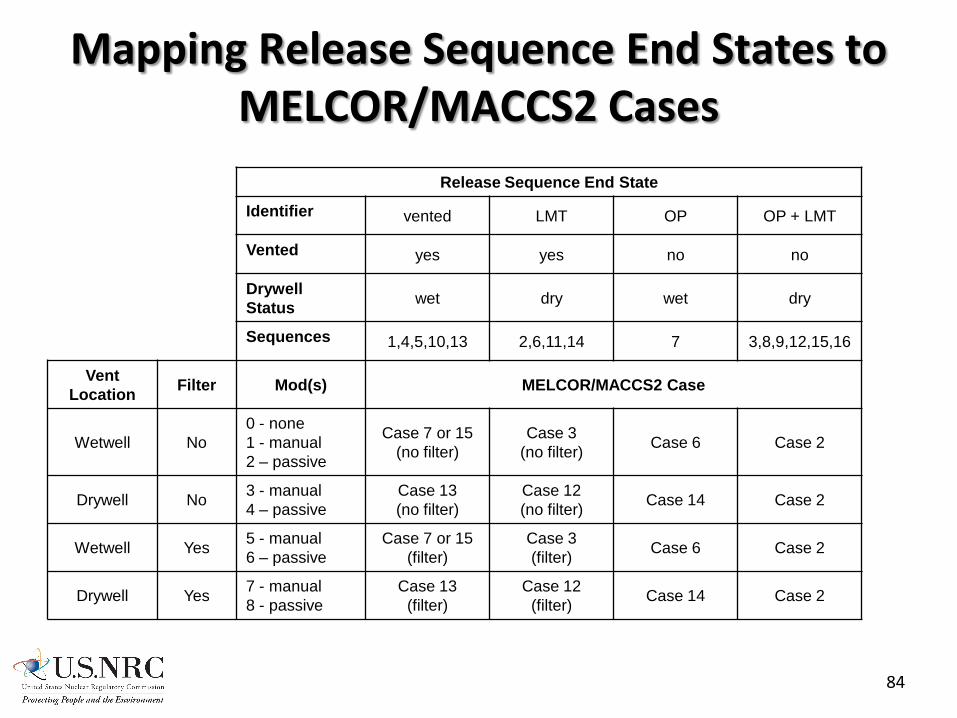
Mapping Release Sequence End States to MELCOR/MACCS2 Cases
Release Sequence End State
Identifier vented LMT OP OP + LMT
Vented yes yes no no
Drywell Status wet dry wet dry
Sequences 1,4,5,10,13 2,6,11,14 7 3,8,9,12,15,16
Vent Location Filter Mod(s) MELCOR/MACCS2 Case
Wetwell No 0 - none 1 - manual 2 – passive
Case 7 or 15 (no filter)
Case 3 (no filter) Case 6 Case 2
Drywell No 3 - manual 4 – passive
Case 13 (no filter)
Case 12 (no filter) Case 14 Case 2
Wetwell Yes 5 - manual 6 – passive
Case 7 or 15 (filter)
Case 3 (filter) Case 6 Case 2
Drywell Yes 7 - manual 8 - passive
Case 13 (filter)
Case 12 (filter) Case 14 Case 2
84

Accident Sequence Frequency Contributions
Containment Failure Mode
Manual Vent Mods 1, 3, 5, 7
Passive Vent Mods 2, 4, 6, 8
Overpressurization (OP) 0.4% 0.0% Liner Melt-Through (LMT) 19.6% 28.0% Overpressurization and Liner Melt-Through (OP + LMT)
33.1% 5.1%
Total 53.2% 33.1%
85

Mod 1 Mod 2 Mod 3 Mod 4 Mod 5 Mod 6 Mod 7 Mod 8 Manual Passive Manual Passive Manual Passive Manual Passive
Wetwell Drywell Wetwell Drywell Unfiltered Filtered
Reduction in Population Dose Risk (Δperson-rem/reactor-year)
86

Mod 1 Mod 2 Mod 3 Mod 4 Mod 5 Mod 6 Mod 7 Mod 8 Manual Passive Manual Passive Manual Passive Manual Passive
Wetwell Drywell Wetwell Drywell Unfiltered Filtered
Reduction in Offsite Cost Risk (Δ$/reactor-year)
87

Mod 1 Mod 2 Mod 3 Mod 4 Mod 5 Mod 6 Mod 7 Mod 8 Manual Passive Manual Passive Manual Passive Manual Passive
Wetwell Drywell Wetwell Drywell Unfiltered Filtered
Reduction in Worker Dose Risk (Δperson-rem/reactor-year)
88

Mod 1 Mod 2 Mod 3 Mod 4 Mod 5 Mod 6 Mod 7 Mod 8 Manual Passive Manual Passive Manual Passive Manual Passive
Wetwell Drywell Wetwell Drywell Unfiltered Filtered
Reduction in Onsite Cost Risk (Δ$/reactor-year)
89

Mod 1 Mod 2 Mod 3 Mod 4 Mod 5 Mod 6 Mod 7 Mod 8 Manual Passive Manual Passive Manual Passive Manual Passive
Wetwell Drywell Wetwell Drywell Unfiltered Filtered
Reduction in Conditional Contaminated Land Area (Δsquare kilometers)
90

Uncertainty Analysis
• Approximate Monte Carlo analysis performed to gain an appreciation of the uncertainties involved – Sequence frequencies
– Sequence consequences
91

Uncertainty Parameters
Parameter Mean Parameters
Core-damage frequency 2E-5/ry Log-normal; EF = 10
Fraction of total CDF due to external hazards
0.8 Beta; α = 0.5, β = 0.125
Breakdown of sequence types for internal hazards
Other (not SBO, bypass, or fast)
0.83 Dirichlet α1 = 41 α2 = 6 α3 = 2.5 α4 = 0.5
SBO 0.12
Bypass (ISLOCAs)
0.05
Fast (MLOCAs,
LLOCAs, ATWS)
0.01
Breakdown of sequence types for external hazards
Other (not bypass) 0.95 Beta; α = 0.5, β = 9.5
Bypass 0.05
92

Uncertainty Parameters
Parameter Mean Parameters
Probability that severe accident vent fails to open
Mod 0 1 Not uncertain
Mods 1,3,5,7 – other or SBO 0.3 Beta; α = 0.5, β = 1.167
Mods 1,3,5,7 - fast 0.5 Beta; α = 0.5, β = 0.5
Mods 2,4,6,8 0.001 Beta; α = 0.5, β = 499.5
Conditional probability that offsite power is not recovered by the time of lower head failure given not recovered at the time of core damage (internal hazards)
0.38 Beta; α = 0.5, β = 0.816
Probability that portable pump for core spray or drywell spray fails
0.3 Beta; α = 0.5, β = 1.167
Consequences Per MELCOR/MACCS2 results and regulatory analysis assumptions
Log-normal; EF = 10 (correlated)
93

Uncertainty in Population Dose Risk Reduction
94

Uncertainty in Offsite Cost Risk Reduction
95

Uncertainty in Onsite Worker Dose Risk Reduction
96

Uncertainty in Onsite Cost Risk Reduction
97

Uncertainty in Conditional Contaminated Land Area
98
Regulatory Analysis and Backfitting
Aaron Szabo Office of Nuclear Reactor Regulation
Rulemaking Branch
99

Outline
• Regulatory Decision-Making Process • Methodology for Regulatory Analysis
– Task-specific information – Steps for a Regulatory Analysis
• Backfitting – Adequate Protection – Cost-Justified Substantial Safety Enhancement
• Filtered Vents Regulatory Analysis – Assumptions and Sensitivities – Quantitative Analysis
Current Framework Sensitivity Analysis
– Qualified Attributes • Summary
100

Regulatory Decision-Making Process
• Regulatory Analysis looks at all the costs and all the benefits of the regulatory action to inform decision-makers – Quantified and qualified
– Identify uncertainties with the analysis
• Backfitting determines if we can impose a requirement on licensees (10 CFR 50.109)
101

Methodology for Regulatory Analysis
• 4 Options – 1: No Change (Re-affirm EA-12-050) – 2: Severe Accident Capable Vent – 3: Filtered Vent – 4: Performance-Based Approach
• All attributes dispositioned using current framework – NUREG/BR-0058, NUREG/BR-0184, NUREG-1409 – Any deviations are identified and provided as a
sensitivity analysis
102

Methodology for Regulatory Analysis
• Steps to perform a Regulatory Analysis – Identify legitimate alternatives and options – Determine if the action is a backfit – Evaluate attributes Public Health (Accident) • Occupational Health (Accident) Offsite Property • Onsite Property Industry Implementation • Industry Operation NRC Implementation • NRC Operation Regulatory Efficiency
– Develop recommendations
103

How Information is Provided
• Recommendations are provided using the “best [point] estimate” calculations
• Benefits and costs are determined by multiplying the probability of the event by the change in consequences – (e.g. Probability of event times (Alt. 1
consequence – Alt. 2 consequence))
• Sensitivity analyses are provided for decision-makers
104

Backfitting
• Adequate Protection – Severe Accident Capable Vent
– Filtered Vent
– Performance-Based Approach
105

Backfitting - Cost-Justified Substantial Safety Enhancement
• 2 Part Analysis – Substantial Safety Enhancement – Cost-justified
• SRM-SECY-93-086, “Backfit Considerations” – The safety enhancement criterion should be
administered with the degree of flexibility the Commission originally intended
– The standard is not intended to be interpreted in a manner that would result in disapprovals of worthwhile safety or security improvements having costs that are justified in view of the increased protection that would be provided
– Allows for both quantitative and qualitative arguments
106
Backfitting - Cost-Justified Substantial Safety Enhancement
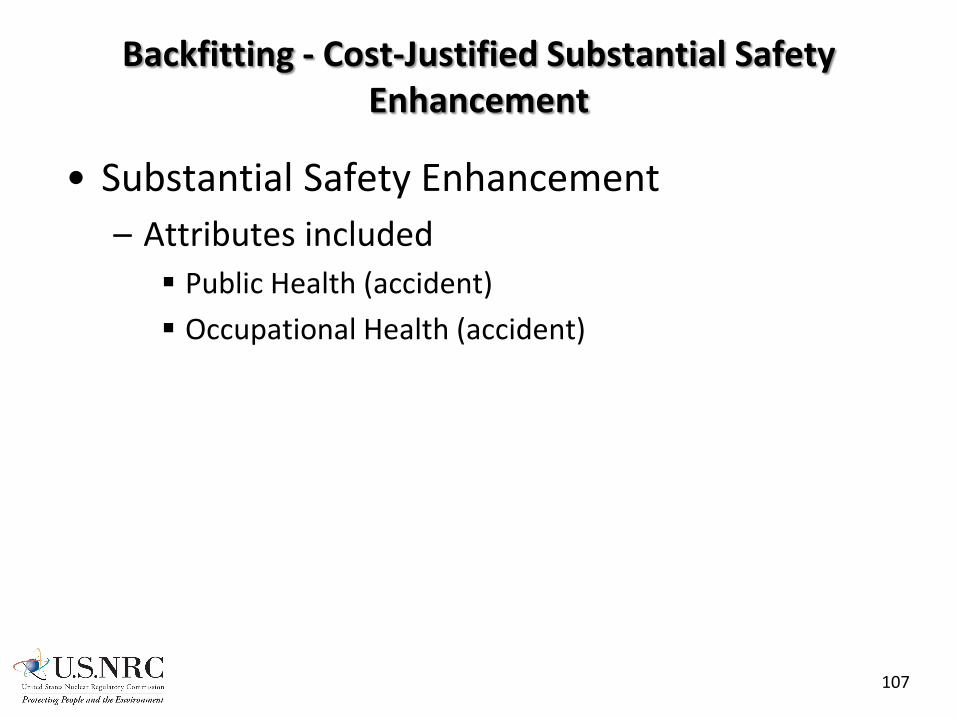
• Substantial Safety Enhancement – Attributes included Public Health (accident)
Occupational Health (accident)
107
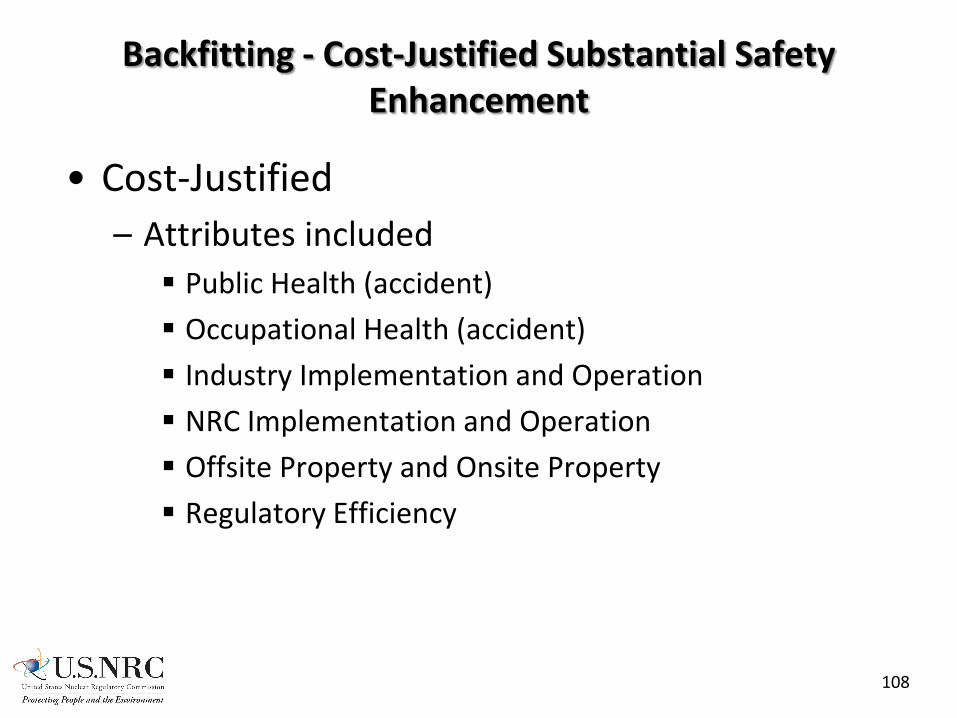
Backfitting - Cost-Justified Substantial Safety Enhancement
• Cost-Justified – Attributes included Public Health (accident)
Occupational Health (accident)
Industry Implementation and Operation
NRC Implementation and Operation
Offsite Property and Onsite Property
Regulatory Efficiency
108

Analysis Assumptions (NUREG/BR-0184)
• Onsite Property – Option 1 = Upper bound ($2B (1993) or $3.2B (2012))
– Option 2 = Middle ($1.5B (1993) or $2.4B (2012))
– Option 3 = TMI ($750M (1981) or $1.9B (2012))
• Occupational Workers (during accident) – Does not include decontamination and cleanup
– Assumes at least 1,000 workers (small dose)
– Option 1 = Upper bound (14,000 person-rem)
– Option 2 = Middle (3,300 person-rem)
– Option 3 = TMI (1,000 person-rem)
109

Sensitivity Analysis Parameter Current Framework Sensitivity Analysis
Dollar per person-rem $2,000 (NUREG-1530)
$4,000 (EPA and ICRP No. 103)
Discount Rate 3% and 7% (OMB Circular A-4)
Undiscounted (Current Market)
Initial Event Probability
2E-05 PRA based
(SPAR Model)
3E-04 Global Statistical Value (Accidents/Operation)
Monte Carlo PRA Point Estimate 5th Percentile and 95th Percentile
Replacement Energy Costs
$15.4 million/year (NUREG/BR-0184)
$56.3 million/year to $716,000/year
(Updated, regional based with high and low values)
Other unit(s) at site shutdown
All Mark I and Mark II reactors shutdown (30 units)
110
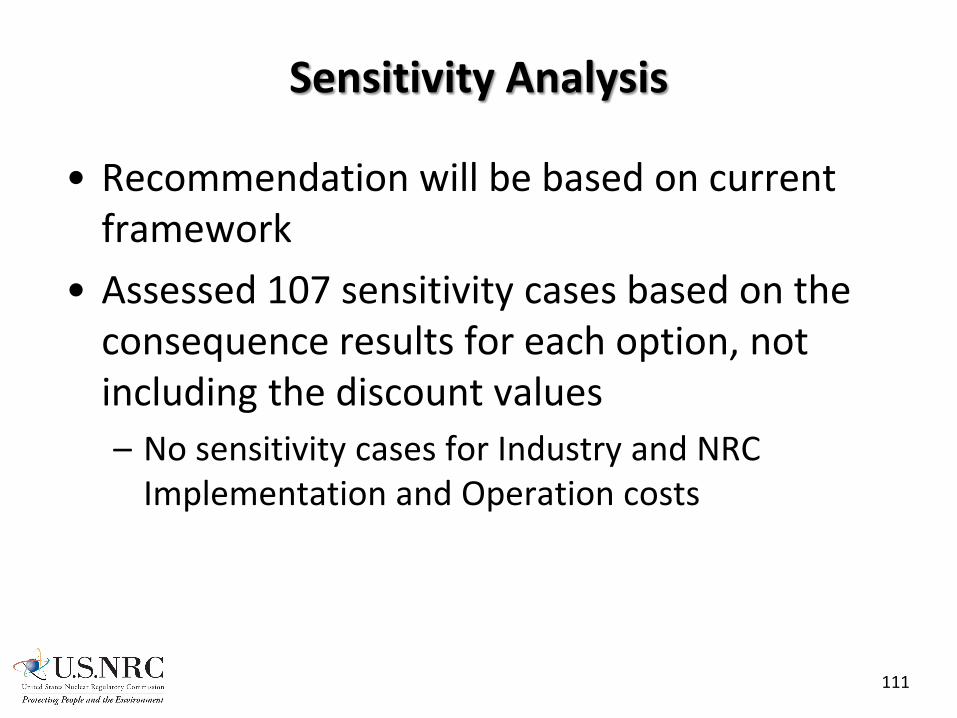
Sensitivity Analysis
• Recommendation will be based on current framework
• Assessed 107 sensitivity cases based on the consequence results for each option, not including the discount values – No sensitivity cases for Industry and NRC
Implementation and Operation costs
111

Quantitative Analysis – Option 2, SACV (Current Framework)
• Estimated Costs – Industry Costs: $60M
– NRC Costs: $8M to $12M
– Total Costs: $68M to $72M
112

Quantitative Analysis – Option 2, SACV (Current Framework)
• Estimated Benefits (range based on discount factors) – Public Health: 112 person-rem averted
$4M to $5.7M – Occupational Health: 5 person-rem averted
$100,000 to $200,000 – Offsite Property (Cost Offset)
$8M to $11M – Onsite Property (Cost Offset)
$4.4M to $7.5M – Total Benefit
$16.5M to $24.4M
• Net Value – ($55.5M) to ($43.6M)
113

Quantitative Analysis – Option 3, Filtered Vent (Current Framework)
• Estimated Costs – Industry Costs: $465M (based on $15M per unit)
– NRC Costs: $8M to $12M
– Total Costs: $473M to $477M
114
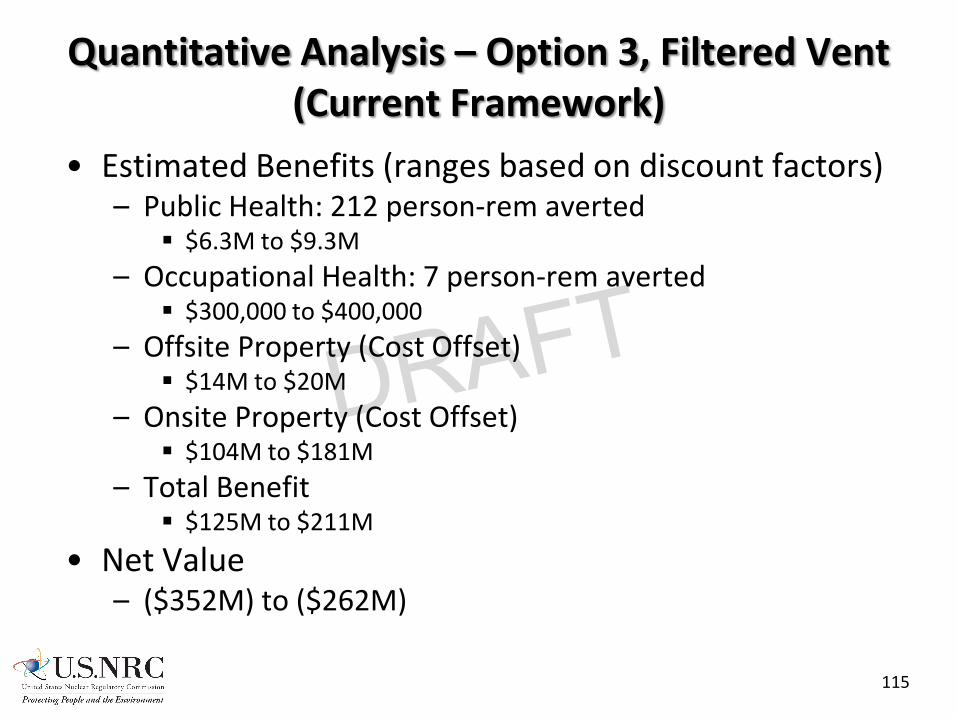
Quantitative Analysis – Option 3, Filtered Vent (Current Framework)
• Estimated Benefits (ranges based on discount factors) – Public Health: 212 person-rem averted
$6.3M to $9.3M – Occupational Health: 7 person-rem averted
$300,000 to $400,000 – Offsite Property (Cost Offset)
$14M to $20M – Onsite Property (Cost Offset)
$104M to $181M – Total Benefit
$125M to $211M
• Net Value – ($352M) to ($262M)
115
Quantitative Analysis – Option 4, Performance-Based
(Current Framework)
• No quantified costs or benefits
• Discussion provided qualitatively
• Amenable to site-specific approaches
116

Qualitative Arguments
• Will be included in the Regulatory Analysis
• Historically, they have considered safety goal policy qualitative goals, defense-in-depth, uncertainties, consistency with standards (regulatory efficiency), etc.
117

Summary
• Option 2 (SACV) and Option 3 (filtered vent) do not appear to be cost-beneficial quantitatively in the current framework – Sensitivity analysis may provide cases that are
cost-beneficial
– May require qualitative arguments for “substantial safety enhancement”
118

Qualitative Arguments for Filtered Vents (Option 3)
Tim Collins Office of Nuclear Reactor Regulation
Division of Safety Systems
119

Qualitative Arguments
• Defense-in-Depth
• Severe Accident Management Decision Making – Operator Response
– Hydrogen Control
• Consequence Uncertainties
• International Practice
120

Enhances Defense-in-Depth
• Containment is an essential element of DID – Protects against uncertainties in prevention of
severe accidents and potential consequences of a large release
• Filtering compensates for the loss of the containment barrier due to venting
• Filtering improves confidence to depressurize containment to address other severe accident challenges
121
Enhances Defense-in-Depth
• Filtering extends time for emergency planning implementation – Adds margin for uncertainty in weather, public
response, collateral damage, communications, etc.
122
Severe Accident Management Decision Making
• Improves operator confidence in a “clean” release for hydrogen control – Allows early operator intervention to vent
hydrogen and control containment pressure
– Sustained lower pressure reduces leakage of hydrogen thru penetration seals
– Decreased leakage reduces threat from hydrogen explosion to reactor building, spent fuel pool, and emergency responders
123

Severe Accident Management Decision Making
• Facilitates arrest of in-vessel melt progression and ex-vessel challenge to drywell liner – Allows early operator intervention to control
pressure Sustained lower pressure facilitates injection from low
pressure water sources – Increases chances of early melt arrest and protection of liner
Sustained lower pressure reduces leakage of fission products thru penetration seals
– Facilitates operator access to reactor building for recovery
Facilitates use of all onsite resources
124

Severe Accident Management Decision Making
• Operator confidence in “clean” release facilitates use of vent as a mitigation tool – Supports use of drywell and/or wetwell as vent
inlet Alleviates concerns with wetwell floodup strategy
– Supports passive actuation Minimal consequences of inadvertent actuation
125

Consequence Uncertainties
• Improves protection against uncertainties associated with potential land contamination – Fission product release fractions
– Weather patterns
– Farm products/food chain impacts
– Hydrology
– Economic impacts
126

Consequence Uncertainties
• Reduces potential for significant social repercussions – Public anxiety
– Impact on energy supply chain
127
International Practices
• Consistent with recommendation from Extraordinary Meeting of Members of Convention on Nuclear Safety to upgrade “measures to ensure containment integrity, and filtration strategies and hydrogen management for the containment”
• Consistent with decisions of most European countries, Canada, Taiwan, and Japan
128

Next Steps
• Continue staff assessment and develop recommendations
• Engage Steering Committee
• Present conclusions and recommendations to ACRS on October 31 and November 1
129