
FilsEvlER - University at Buffalo
38
FilsEvlER Journal of Financial Economics 4.5 (1997) 97 134 Do institutions receive comparable execution in the NYSE and Nasdaq markets? A transaction study of block trades Michele LaPlante”, Chris J. Muscaretia**b Received August 1995: tinjl version received May 1996 The trading structure differences between the !4YSE and the Nasdaq market could produce different levels of trading liquidity. Several studies have attempted to measure these differences by comparing bid-ask spreads. This paper uses an alternative approach to compare liquidity. We analyze three issues: (I) the frc+encies of the sizes and types of block trades found in the two markets, (2) the immediate price effects of the block transactions, and (3) the temporary and permanent price effects of the blocks. We find evidence that the NYSE sys:em provides more liquidity for block transactions. Kqwords: Nasdaq. NYSE. Block transactions. Market structue JEL c.lu.s.s$cution: G 14; D23; L22 *Corresponding author. We thank Robert Rartalio. Jcx B&7, Hank Ressimbindw. Ananth Madhavan. I vrn Mclnish. Harold Mulhcrin. JelT Netter. Paul Schultz. Paul Segum. Duane Seppi. Dennis Shwhun. George Sotianos, Michael Vetsuypens. Rob Wood. an anonymous rckrec add seminar partcipants at tlniverscty of Mrsmi. Santa Clara Univcnity. Penn State. University of Georgra. Virginia Tech. the IW5 European Finance Association Meetings. the 1995 Asran-Pacific Finance Association Meet- ings. the I995 Financial Management Association Meetings. 2nd the 1995 Southern Fmance Associarion Meetings for helpful comments. 0304-405X 97 Sl7.00 r‘ 1997 Elsevier Science S.A. All right; wervcd PII SO;‘-:-405Xt96t00891-4
Transcript of FilsEvlER - University at Buffalo

FilsEvlER Journal of Financial Economics 4.5 (1997) 97 134
Do institutions receive comparable execution in the NYSE and Nasdaq markets?
A transaction study of block trades Michele LaPlante”, Chris J. Muscaretia**b
Received August 1995: tinjl version received May 1996
The trading structure differences between the !4YSE and the Nasdaq market could produce different levels of trading liquidity. Several studies have attempted to measure these differences by comparing bid-ask spreads. This paper uses an alternative approach to compare liquidity. We analyze three issues: (I) the frc+encies of the sizes and types of block trades found in the two markets, (2) the immediate price effects of the block transactions, and (3) the temporary and permanent price effects of the blocks. We find evidence that the NYSE sys:em provides more liquidity for block transactions.
Kqwords: Nasdaq. NYSE. Block transactions. Market structue
JEL c.lu.s.s$cution: G 14; D23; L22
*Corresponding author.
We thank Robert Rartalio. Jcx B&7, Hank Ressimbindw. Ananth Madhavan. I vrn Mclnish. Harold Mulhcrin. JelT Netter. Paul Schultz. Paul Segum. Duane Seppi. Dennis Shwhun. George Sotianos, Michael Vetsuypens. Rob Wood. an anonymous rckrec add seminar partcipants at tlniverscty of Mrsmi. Santa Clara Univcnity. Penn State. University of Georgra. Virginia Tech. the IW5 European Finance Association Meetings. the 1995 Asran-Pacific Finance Association Meet- ings. the I995 Financial Management Association Meetings. 2nd the 1995 Southern Fmance Associarion Meetings for helpful comments.
0304-405X 97 Sl7.00 r‘ 1997 Elsevier Science S.A. All right; wervcd PII SO;‘-:-405Xt96t00891-4

1. Introduction
The different trading structures of the NYSE. which uses a centralized public limit order book and assigns each stock to a single specialist. and the Nasdaq market, which allows many dealers to compete for order flow in each stock, could result in varying levels of market liquidity. It is often thought that the benefits of liquidity accrue mostly to traders of large volumes, typically institu- tional traders, rather than to small retail traders. The purpose of this paper is to SI:I*I~ whether the two principal tradQ?g I’ ,rkets provide Gmilar liquidity when l~~~;~~tci~~~g o~uck traocs of 1u.uo0 or more shares.
Whether institutions receive comparable execution on Nasdaq and the NYSE for their block trades has become increasmgly important. Institutional trading and institutional ownership levels in public firms have increased over the past several years (Kothare and Laux. 1995; Schwartz and Shapiro. 1992). Addition- ally, the NYSE has begun actively courting institutional investors in an effort to obtain new listings (Wall Srreer Journal. I l/1/95). While many Nasdaq-traded firms eventually choose to list on the NYSE. other exchange-eligible firms, including Apple Computers, Intel, and Microsoft. remain on Nasdaq.
Even though block brokers are available to negotiate the placement of large trades in both NYSE and Nasdaq-traded stocks. the two market structures could affect the price impact of the block trades differently.’ The National Association of Securities Dealers (NASD) offers several reasons why the Nasdaq market can provide high levels of liquidity for block trades (Groth and Dubofsky, 1987). First, the competitive nature of the multidealer system should force spreads to be narrower than those quoted by a ‘monopolist’ specialist. Second. dealers offer larger minimum depths so that even if the spread is larger it is good for many more shares than if offered by a specialist. Third, dealers can more readily make a market since they can diversify their positions and spread risk among themselves. Fourth, each dealer competes for and generates informa- tion, in contrast to a specialist who must act alone and is restricted by NYSE Rule 98. Finally. a specialist who adjusts inventory will affect the quoted price whereas Nasdaq offers a computerized system for dealers to contact each other when adjusting inventories so that prices are maintained.
On the other hand, Cochrane (1993) lists several reasons why the NYSE should olTs& superior liquidity. First, there is investor-supplied liquidity from rhe
‘It is noteworthy that despite the dilTercnces in trading mechanisms. block activity is roughly simdar across the two markets. During I990 1993, ratios of block volume to total volume for the NYSE(Nasdaq-NMS)were49.6%(42.7%).49.6%(40.2%k 50.7%(44.5%j.and 53.7%(48b%kand the number of block trades per day averaged 3,333 (2.241). 3.878 (2.81 I), 4,468 (3.884). and 5.841 (5.745). See the NYSE Fact Book 1991 1993 and the I991 1994 Nasdaq Fact Book 81 Company Directory.

limit order book. In contrast. Nasdaq does not have a formal process to expose. public limit orders and discourages them in many ways. Not until July 1994 did the NASD adopt a proposal to ban dealers from trading ahead of customer limit orders. However. the practice is still allowed if dealers ‘pass-off’ the limit orders to another dealer. The NYSE banned such practices several years ago (Wall Street Journal, 6/33/94). Second, Cochrane cites evidence of better prices and lower execution costs, again because of the limit orders which represent commit- ments to future prices. Third, designated market makers are committed to taking offsetting position< since each stock is assigned to a single specialist. Fourth, there is strong adherence to last-sale reporting as required by the SEC’s 90-second rule and. hence. ht=h levels of transparency. Finally, there is not only the opportunity to seek counterparties OK the floor in the ‘upstairs market’ before bringing a large trade t3 the floor, but these trades are then offered potential price improvement thrcugh exposure to floor traders and limit orders before final execution.’
Prior research provides no conctrsive answer as to which trading location offers greater liquidity. The pioneering work of Demsetz (1968) spawned the debate over which type of trading system provides liquidity at lower cost. He compares the advantages from economic< of scale in centralized trading activity to the disadvantages from a lack of competitive market making. Ho and Stall (1983) and Ho and Macris (1985) show that the multidealer market could offer more depth as trading volume increases. although at the cost of wider spreads.-’ Reinganum (1990) conducts an empirical investigation of liquidity premiums and concludes that neither the NYSE nor Nasdaq dominates in providing liquidity but that the Nasdaq system may provide greater liquidity than the NYSE for smaller firms. However, he finds no such advantage for larger firms, and his work cannot explain why Apple and others remain on Nasdaq. More recently. Keim and Madhavan (1995a. 1995b) use proprietary trading information for 21 institutions and find that transaction costs are higher in the Nasdaq marke! for all but the largest firms. WTerences in trading
’ Kcim and Madhavan (1996) and Madhavan and Cheng (1996) find a thr&old trade size above whuh negotiated block trades cause smaller price impacts than cquivalentlv sized blocks that originate on the floor. However. they find that a majority of block trades on the NYSE strll origtnate on the floor rather than in the upstairs market. This is supporttxl by Hasbrc.uck. Sofi.tnos, and Sosebee(1993) who report that on Jan. I 2. 1993.73% oftotal NYSE block volume originated on the floor of the exchange. Ninety percent of trades bctwccn 10.000 25.((K) shams. 6X% cl trades between 25.000 ltXUWO shares, and 43% of trades over IOO.o(K) shares originated in the dou .rstairs market. Also. MadhavanandChcng(l996)ti;rd for twomonths(Dec. 199.1 and Jan. 1994)that 8Je.b of NYSE
block volume originated on the tloor and 72 5, nT blocks for more than W(w)0 &rt!! originatd in
the downstairs market.
‘Other papers that model the influence o(altemative trading mechanisms on prim include Easley and O’Hara (1987). Burdett and O’Hara (1987). Scppi (1990). Kyle (1985). Admati and Pflciderer (1988). Grossman (1992). and Madhavan (1992).
loo M. LuPhntr. C.J. Musc~urcNu !Jnumol of Finunciol Economicc 45 (I9971 97 134
mechanismsgained national attention due to the wide publicity surrounding the research of Christie and Schultz (1994) and Christie et al. (1994) who find that Nasdaq market makers refrain from using odd-eighth quotes for many of the actively traded Nasdaq securities, raising the ques!ion of whether Nasdaq dealers implicitly collude to maintain wide spreads.
This paper adds to the debate over market structure and liquidity in a unique way by investigating which trading location offers greater liquidity for block trades. While much research has been conducted on block trades, nearly all of the studies have focused on Hocks traded on the NYSE.4 We focus our attention 1111 ~0.w !irms tha. >hoL ..! be especially interested in the effects of market structure on block trades, i.e., firms whose shares are often traded in blocks and can switch trading mechanisms if they so choose. Perhaps. as Amihud and Mendelson (1988) suggest, these highly liquid stocks on Nasdaq would realize little gain in liquidity from listing on the organized exchanges Large Nasdaq firms eligible to list are not remaining in the over-the-counter market because of prohibitively high listing costs; Sanger and McConnell (1986) find that the present value of initial and continual listing fees is 0.29% of equity for the average stock.
Although spreads are commonly used to measure liquidity, investors (parti- cularly institutional investors) could be concerned with other measures of trading costs, such as obtaining the best price for the transactions. Schwartz and Shapiro (1992) argue that institutions would rather have an accurate price that reflects the true value of the firm than a narrow spread, because mistiming or mispricing can hurt their returns more than paying the bid-ask spread.
Typically, spreads have been interpreted as reflecting the costs of market making and transacting (Huang and Stall. 1996). However, recent work by Demsetz (1995) shows that while Nasdaq spreads reflect the cost of market making to dealers, NYSE spreads do not. NYSE spreads are most often set by the limit order book which is driven by public interest so that NYSE spreads do not represent transaction and market-making costs for specialists. Furthermore, Nasdaq quotes often do not reflect the cost of trading for institutional traders. Preferencing agreements create no incentives for dealers to post competitive quotes since large order flows will automatically go to them. Keim and Mad- havan (199Sb) and Chan and Lakonishok (1995) provide evidence that posted quotes do not reflect the cost of trading with institutions due to their bargaining power, different investment styles, and trader reputations. Lastly, Madhavan
‘The reaction of bid ask spreads to block trades has been studied by Glosten and Harris (1988). Hasbrouck (1988.1991), Stall (19891. and George et al. (1991). Other papers have studied the impact ol block trades on transaction priczs. inclurling Schoks (1972). Kraus and Stall (1972). Dann et al. (1977). Mikkelwn and Partch (1985). Holthausen et &I. (1987.1990). Ball and Finn (1989). Madhavan and Smidt (Wl).Chan and Lakonishok(l993). Choeet al.(l992.l994).and Madhavan andCheng (19%
(1995) shows that the midquote is not the expected value for an asset when there is serial correlation in order flows. This suggests that the midquote may not reflect the ‘true price’. In this study, we use changes in transaction prices instead of changes in spreads as an alternative measure of liquidity. We recognize that this method fail: to measure the influence of preferencing arrangements and &dollar payments, but such proprietary information is difficult to obtain.
This paper investigates the block trades of the ten largest Nasdaq firms (based on 1990 year-end equity capitalization) eligible to list on the NYSE during 1988- 1990. Various criteria are used to create seven samples of ten NY SE firms matched to the ten Nasdaq firms. We analyze three issues: (1) the frequencies of the sizes and types of block trades found in the two markets, (2) the immediate price effects of the block transactions, and (3) the temporary and pennanent price effects of the blocks. Wc find that the overall price impact of block trading is smaller for the NYSE-tra&led issues than the Nasdaq-traded issues: this finding is robust for all matched samples. The findings are similar for several alternative measures of block impact. Expanded samples and alternative methodologies provide addttional supportive evidence.
This paper is organized as follows. Section 2 presents the data and explains the matching procedures. The results for various measures of price impact and permanent and temporary price etfects are provided in Section 3. which is followed by conclusions and a discussion in Section 4.
2 Data ami methodology
We study and compare the price impact of btxk trades on the NYSE and in the Nasdaq market during 1990 to contrast the liquidity otTered by the two trading structures to large trades. Table 1 presents NYSE listing requirements as found in the NYSE Fact Book. issues 1989--1991. We use COMPUSTATfiles to find Nasdaq firms that met these listing requirements from 1988- 1990, yet remained on Nasdaq through 1992. These criteria reduce the noise in our sample since they eliminate companies that qualified to list on the NYSE but either did not have time to move or moved immediately after our sample period. We exclude any firms that delisted from the NYSE to Nasdaq from 19861990. A total of 186 firms were eligible to list for three consecutive years. tut eight firms had data inconsistencies and 1 I more were not straight common stock issues.
We then focus on the ten largest remaini.tg Nasdaq firms ( lased on 1990 year-end market values) to allow comparisons of highly liquid firms under two different market structures. While Nasdaq-NMS firms have an average of 11 dealers assigned to their stocks, these ten firms each have over 26 deafers making markets in their stocks (1991 Nadaq Fact Book). The large number of dealers should, in theory, result in a highly hquid market for these securities.
Table I Listing requirements for the New Yorh Stock Exchange for the yc;\rc i9XX IWO as given in the .VYSE Focr Book for each year (dollars in millions)
Pre-tax income: current year & previous 2 years OR ~“:rBenl !“. & hl 3 years aggregate
Net tangible assets Market value equity Publicly held shares Round-lot holders OR Total Shareholders & Avg. monthly trading vol. (most reant 6 months)
2.5 s1.0
s4q s4.5 56.5 S6.5
SIR.0 Sl6.0 SIX.0 Sl6.0 I. I million I .O million 2sKm 2.ooo
2.200
lOO.000 shares
52.5 22.0
2.200
IO&O@ shares
We use the Center for R-arch in Security Prices(CRSP) 1990 files to identify all common stock issues on the NYSE for a population of firms from which to draw matches. We exclude closed-end mutual funds, unit and management investment trusts, firms with fewer than 252 block trades for the year, and (to reduce the impact of price discreteness) stocks selling under $10. We calculate average daily trading volumes and year-end market values for the ten Nasdaq firms and the remaining 500 eligible NYSE stocks. The Institute for the Study of’ Security Prices (ISSM) 1990 tapes provide all trade volumes and prices time- stamped between 930 a.m. and 4AXl p.m. We eliminate opening trades on the NYSE (due to its batch procedure for setting prices at the beginning of the day) and trades flagged 0, G, or 2 (delayed/reopening trades, aggregated trades. and reported out-of-sequence trades).’ Finally, we distinguish between block trdda transacted at prices higher (lower) than the previous transaction, which we label as upticks (downticks), and block trades that had no change in price from the previous trade, labeled as zeroticks.
‘We atlempted IO control for those trades which occurred through Instinct. a private brokerage !irt~~ that allows traders IO place anonymous orders for possible matching by other Interested I&Hs. Approximately 1% of all Nasdaq volume. and less of NYSE’s, occurs with f&net. The ISSM database is known fbr its inconsistency in labeling such trades, and only IWO trades were Aa& as occurring there. Talks with Instinct rcpresenratives. however. reveal that very few trades placed with them are done for over 10,000 shares.
As reported by Atkins and Dyl (1993) and Gould and Kieidon (l994), any comparison of trading volumes between Nasdaq and an organized exchange must take rota account the dealer effect on reported volume in the over-the- counter market. Suggestions for percentages by which to reduce reported Nasdaq volume vary from 50% to 65%. We mitigate this problem in our matching procedures described below.
Our objective is to isolate the impact of market structure on liquidity. To do so, we need to control for nonmarket determinants of liquidity, such as firm size and flow of information. Prior research suggests that market value and trading volume are proxies for these determinants (see Amihud and Mendelson. 1986;
Grossman and Miller. :988; Baker and Edelman, 1990; Reinganum. 1990, for work in this area). We must also control for any effects caused by the difference in volume reporting procedures. Since there is no single dimension of matching that obviously dominates all others, we create seven matched samples with ten NYSE firms in each sample. These firms are picked without replacement and matched to a particular Nasdaq firm according to one of the following criteria: (1) 1990 year-end market value oiequity, (2) annual total trading volume using one-half the Nasdaq annual total trading volume, (3) the minimum combined difierence of one-half the annual Nasdaq trading volume and the 1990 yearend market value of equity, (4) 1990 year-end ratio of market value of equity to book value of equity, (5) annual number of block trades, (6) annual number of block trades using one-half the annual number of Nasdaq block trades, and (7) annual block trading volume using one-half the Nlsdaq annual block trading volume.6
Table 2 lists the firms in each sample and. in parentheses the percentage difference in the primary matching variable between each pair. Of the 70 matches, almost 70% (49) are matched to within 1% of ihe Nasdaq variable. There are 59 matches within 5% and 64 are within 10%. Only two matches exceed differences of 20%. The sample created by matching to the annual number of block trades contains three of the four highest percentage ditfetences. No NYSE common stocks had more than 82% of the annual number of block trades reported for Nasdaq-traded Intel, Apple. or MCI. Since this may be due to the inflated volume figures reported by Nasdaq. we create the sample matched to one-half the Nasdaq firms’ annual number of block trades.
Mean and median values of descriptive variables are shown in Table 3. The mean market values of the NYSE firms matched according to one-half
“We originally created a match based on \hrce-dlglt SIC codes and market value in an attempt lo control for potential di&rences in the degree of asymmetric information. A more comprehensive measure of this and firm-specilic growth opportunities is the ratio of market ralue of equity to book value of equity. We thank Hersh Shefrin and Meir Statman for this suggestion. WC also created a match based on the ratio of annual block volume to total volume. but because five of the ten matches exceeded dilTerences of 30%. we dropped this sampie.

Table
2
NYSE
firm
s wh
ich
comp
ose
seve
n sa
mples
ma
tched
to
the
ten
large
st Na
sdaq
firm
s eli
gible
to lis
t on
the
NY
SE
durin
19
8X-
1990
All
samp
les
are
base
d on
19
90
data.
Th
e pe
rcenta
ge
differ
ence
in
the
prim
ary
match
ing
vana
hle
betw
een
each
Na
sdaq
pa
renth
eses
. --
_.__
__._
_ -_
__.
--- _..
_ --
-.___
.--.
--- .-..
-
Marke
t va
lue
& 1
Trad
ing
f Tr
ading
Ma
rket
value
’ Nu
mber
of
Nasd
aq
Marke
t va
lue’
volum
e’ vo
lume’
Book
va
lue’
bluck
tra
des’
_-_---
-.-
--- .-.
_ --.
._---.
- __
.. -
Micro
soft
Corp
. Sc
ars
Roeb
uck
NCNB
Co
rp.
South
ern
Co.
Merck
Co
Co
ca-C
ola
co.
(1.07
) (0
.15)
(X.49
. I.7
41
( -
2.89
1 ( -
0.2
9)
Inte
l Co
rp.
Hewl
ett
Pack
ard
Peps
ico
Texa
s Ut
ilities
W
estin
ghou
se
Elec
. AT
&T
10.5
4 (
- 1.9
2)
( --
8.88,
- 6.1
3)
( -
0.47)
(
.- 29
.41)
Apple
Co
mpute
r Am
erica
n El
ectric
Po
wer
(0.3
I)
MCI
Comm
. Un
ited
Telec
omm
( -
0.22
1
Food
Lio
n,
Inc.
Wisc
onsin
En
ergy
(
- 0.1
0)
Sun
Merri
ll Ly
nch
Micro
syste
ms
(0.25
)
GTE
Corp
. (0
.31)
Comp
aq
Comp
uter
Free
port
t -
1.38.
- 6.0
1)
McMo
han
( -
0.56)
Citic
orp
( --
19.9
11
Gene
ral
Motor
s Un
ited
Telec
omm
Flowe
rs Ind
ustrie
s Pu
ilip
Morri
s Co
. (0
.67)
( -
23.90
. -
0.22,
(0.47
) (
- 18
.86)
Ediso
n Br
other
s Kn
ight-R
idder
(
- 0.5
X)
(5.18
. 5.2
8)
Sara
Le
e Co
rp.
mm
Motor
ola
( -
1.36)
Un
ion
Carb
ide
Boein
g Co
. (
- 12
.28.
-- 1.8
7)
10.00
)
Time
W
arner
(0.00
)
Fede
ral
Nat.1
Mo
rtg.
Asso
c. ( -
6.1
7)
rm
:nrd
its m
atche
d tir
m IS
sho
wn
in
I Nu
mber
of
block
tra
des’
! Bl
ock
volum
r* _-
. ._-
---.-.-
-. __
.
Koch
well
Int’l
CMS
Ener
gy
n.48)
(
- 0.9
9)
Bocii
tg
Boein
g I
- 1.4
5)
(3.33
)
Brist
ol Me
yers
GTE
Carp
Sq
uibb
(0.18
) (
- 0.0
3)
Imer
ican
Fede
ral
Xat’l
Expre
ss
Mortg
age
Asso
c (
- 2.4
1)
( -
0.50)
Nice
r Am
erica
n St
ores
mm
(0
.11)
Chas
e Ma
nhat
tan
to.51
1
DuPo
nt
de
Nemo
urs
E.1
( -
0.47)

SAFE
CO
Corp
. Ge
rber
Prod
ucts
DPL
Holdi
ng
Clor
ox
Co.
Willi
ams
Cos.
Mario
n Me
rrill
Rite
Ai
d Co
rp.
(0.11
1 co
. (2
.36.
- 2.1
4)
NJ.00
) DO
W
(0.11
) I -
0.0
3)
(0.21
)
Nord
strom
Inc
. Co
ca-C
ola
Ctcu
it Ci
tv Ni
agrd
Mo
hawk
US
X Co
rp.
Hallib
urto
n Co
. ITT
Co
rp.
Enter
prise
s St
ores
Po
wer
( -
0.46)
I
- 0.0
4)
( -
0.07)
( -
0.0
7)
( -
0.01)
( -
- ‘.Y
’ -
1.68)
-
-.
Core
State
s Fin
. Ea
ton
Corp
. Cy
press
Su
per
Value
St
ores
Te
ktron
ix Inc
. Te
xas
Utihl
ies
<‘ray
Re
xarch
(0
.37)
Semi
cond
uctor
(
- 2.9
11.2.
57)
(0.w
to.
121
(0.42
) I -
0.
321
costc
o Av
on
Prod
ucts
Digit
al Co
mm.
Lubr
izol
Corp
. Na
lco
Chem
ical
McDe
rmott
In
t’l W
illiam
s Co
s. W
holes
ale
( --
0.02)
(0
.16)
(3.06
. -
XX)
( -
0.47)
(0
.X)
( -
0.51
1
Ecola
b Inc
. (0
.35)
Fund
Am
enca
n C-
OS.
(-Ott,
fextro
n Inc
. of
Delaw
are
mY)
Capit
al Ho
lding
(
-- 0.3
4)
’ Matc
hed
on
year
-end
ma
rket
value
s of
equit
y b M
atche
d on
an
nual
tradin
g vo
lume
using
on
e-ha
lf Na
sdaq
vo
lume.
‘Matc
hed
on
minim
izing
the
Join
t dif
leren
cc
in on
e-ha
lf an
nual
Nasd
aq
tradin
g vo
lume
and
year
-end
ma
rket
value
of
equit
y. *M
atche
d on
clo
sest
ratio
of
year
-end
ma
rket
value
of
equit
y IO
boo
k va
lue
of cq
uitv.
e Matc
hed
on
the
annu
al nu
mber
(II
block
tr;
tdes
of Na
sdaq
firm
s. ’ M
atche
d on
on
e-ha
lf the
an
nual
numb
er
ol blo
ck
trade
s of
Nasd
aq
Iirms
* Fldt
ched
on
on
e-ha
lf the
an
nual
block
vo
lume
of N:
tulaq
tirm
s.
a
Table
3
Mean
(m
edian
) sa
mple
value
s of
selec
ted
desc
ripttv
e va
riable
s for
the
ten
lar
gest
Nasd
aq
firms
eligib
le to
list
on
the
NY <
;E d
&wing
19
88-1
~0
and
seve
n 2
samp
les
of ma
tched
NY
SE
firms
(See
Tab
le 2
for
a de
scrip
tion
of ma
tching
me
thods
) 2 a 0
_.._.
__---
--._
--.-..-
--_
-.--__
.__
_-..-_
-.----
--.
-. -~_
.--.--
-
._
Marke
t va
lue
$
f Tr
ading
&
3 Tr
ading
5
Marke
t va
lue
Numb
er
I j
Numb
erof
j Bl
ock
5 Na
sdaq
Ma
rket
value
’ vo
lume
volum
e Bo
ok
value
blo
ck
trade
s blo
ck
trade
s vo
lume
‘- : -
----.-.
-- --.
-.. ..-
--.----
.-.-
- -- -
--.--.
... . .
. .
- .-
.-__._
_. __
_ 5
Marke
t va
lue
{in
8 mi
llions
)
Shar
e pr
ice
(8)
Daily
tra
ding
volum
e (0
0’S)
Bloc
k vo
lume)
To
tal
volum
e (U
/O)
Numb
er
of blo
ck
trade
s
Daily
blo
ck
volum
e (O
W
Numb
er
of al
l tra
des
3.78
9 (2
.105)
34
(32) 8.
728
(6.28
6)
41.6
2 W
UO)
s.515
(2
.987)
4.15
4 (1
.831)
107.
795
(116
.180)
3.x04
(2
.106)
30
(29) 3.
1’2
(2,49
9)
48.3
9 (5
0.28)
I .66
5 (1
.136)
1.56
9 t 1
.268)
43.6
02
(38.8
1 I)
7.29
2 ( I
.829
)
27
(24) 4.34
7 (3
.14Ol
48.6
4 (4
8.45)
2.31
4 (1
.895)
2.00
8 t I
.7861
67.0
07
(38.0
76)
3.72
7 (2
.141)
32
(32) 3.
970
(3.27
6)
SO.16
(5
0.31)
1.80
7 t 1
.338)
2.18
3 t 1
,394)
52.8
62
(48.4
27)
7,97
5 (4
.674)
39
(33) 4.
038
(3.26
6)
44.4
8 (4
4.99)
2.02
5 (1
.649)
1.73
7 (1
.421)
66.2
74
(53.1
671
IZ.?2
X t7.
u.w
40
(36) 9.03
5 (7
.737)
so.47
(5
2.56)
4.64
7 (2
.991
I
4.88
8 (4
.307)
121.
844
(89.5
68)
7.89
5 (?
.656)
36
(331
5.17
7 (2
.839)
47.8
5 (4
4.74)
2.73
2 (1
.48’
3 2.6
3 I
(1.17
5)
70.9
I 8
(43.5
81
J
7.84
1 P
(2.27
8)
2. 4 29
3
(26)
i 5 4.
420
s. (1
.482)
;
47.2
7 ‘n 2
(46.3
7)
F
2.50
2 2
(940
) I=
2.08
7 s
1’)08
)
60.4
81
(21.1
61)

Numb
er
block
tra
des
5.10
3.82
3.45
3.42
Numb
er
all
trade
s t%
t (2
.57)
(2.Y
3)
(4.98
) (2
.93)
Relat
ive
trade
siz
e (O
/b)*
16.8-
b 23
.52
21.2
0 31
.82
(18.6
9)
t I7.4
(1)
t 10.9
Y)
(17.7
5)
Shar
es
outst
andin
g I 1
7.96
7 14
0.12
6 24
7.34
7 12
9.45
8 @
OO
kl (1
07.O
YO)
( 108
.297)
(8
5.607
) (1
05.6R
4)
tnsti
tutio
nal
owne
rship
48 8
H 47
.8O
54.3
4 54
.91
WI
(56.1
0)
(46.4
9)
152.4
6)
I58.94
)
Numb
er
of ins
titutio
ns
210
237
274
23H
(I731
(2
lOl
(175
) (IY
8)
Offic
er &
direc
tor
15.0
6 IO
.?7
4.90
6.72
owne
rship
(%I
(4.98
) (IL
SY)
(3.55
) (0
.45)
------
-.--.
.---...
--.--
. . ._.
. __
..__..
-_--
._ .__
_._
- __.
__ -_-
_ .- .
_.___
..
*Rela
tive
trade
siz
e :=
Aver
age
block
tra
de
airc
Avcra
ge
nonb
lock
trade
sir
e.
3.06
(3.10
)
26.4
6 (2
4.63)
179,
414
(144
.867)
54.5
3 (5
2.55)
302
(267
) 3.36
(2.21
)
3.81
(3.34
)
25.6
6 tl3
.40)
394.
574
(257
.93
I )
53.7
5 ( 5
6.94)
3x1
(377
) 2.7x
W.77
) -
_ --
. ..-
3.85
(3.42
)
22.1
5 (I
5.05)
195.
695
(124
.817)
57.4
0 (5
7.91)
305
(223
3.06
(1.03
)
4.14
t4.44
)
17.8
6 (1
2.26)
22 I
.220
(83.0
45)
60 4
0 ijY
.76)
283
(201
) 3.91
(0.79
)

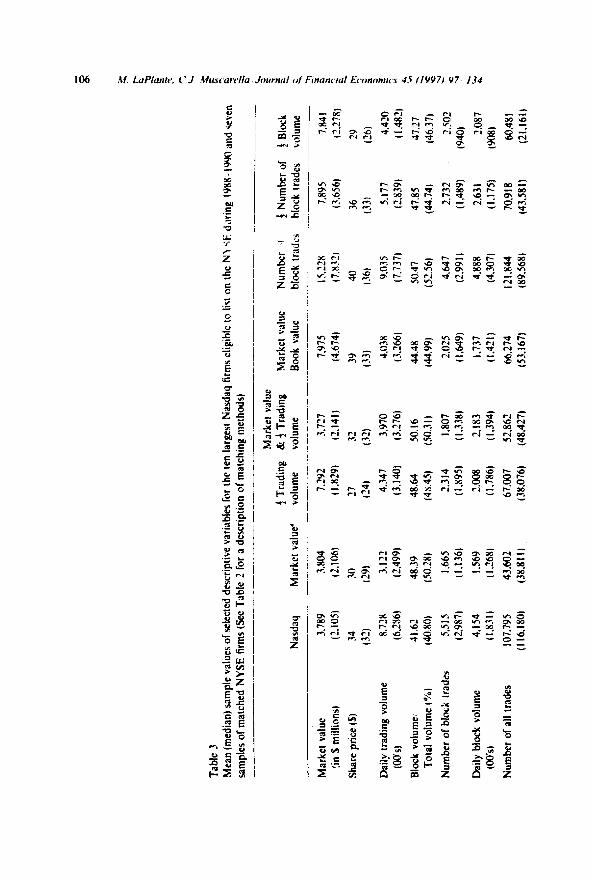
Nasdaq trading volume, market value-to-book value, one-half number of block trades, and one-half annual block volume are twice that of the mean Nasdaq market value, and NYSE firms matched to the average annual number of Nasdaq block trades are nearly five times larger in market value. This is consistent with the notion that reported Nasdaq volume is inflated by at least 500,/o. Average share prices are very equivalent, however. indicating that for a given block trade site, dollar-volume traded is also equivalent. The mean and median ratios of block volume to total volume are roughly the same across all s;liqde\. .,wragirs- -IO? II ?"1. Tr-<c .,rdgnltudcs suggest that block trade execution should be a concern to both firms and traders. Interestingly. even though on average the Nasdaq sample has two to three times more block trades per year (5.515) than the NYSE samples. the mean number of block trades relative to all trades is 5.10% for the Nasdaq sample. This is only slightly higher than the 3%-4% proportion of block trades found on the NYSE. In addition, while the average Nasdaq block trade is almost 17 times greater than the average nonblock trade, the average NYSE block trade is 18 to 32 times greater. Thus, Nasdaq has higher block volume and more frequent block trading, but the average Nasdaq block trade size relative to nonblock trade size is smaller than that for the NYSE.
We collect several ownership statistics from Compact Disclosure. The Nasdaq sample has on average fewer shares outstanding, but the level of institutional ownership and the number of institutional shareholders are roughly equivalent to that of the NYSE samples. We find consider- able overlap of institutions holding shares of both our Nasdaq and NYSE firms. On average, 77% of the institutions that have investments in our sample of ten Nasdaq firms also invest in the NYSE sample firms. Thus, any differences in the impact of block trades are unlikely to be the result of differences in institutional ownership. Finally. the mean percentage ownership of officers and directors is highest for the Nasdaq sample (I 5.06%). This is the result of high inside ownership for Microsoft (59%) and Costco Wholesale (40%).
3. Re&ts
3.1. Block trades compared to preuious trades
We begin our analysis by comparing the price of the block transaction to the price of the previous transaction for that stock. We then expand the analysis to check for potential information leakage by comparing the block price to trans- action prices occurring up to one hour prior to the block transaction. Finally, we use an alternative sample and methodology to provide additional evidence on the price impact of block transactions.
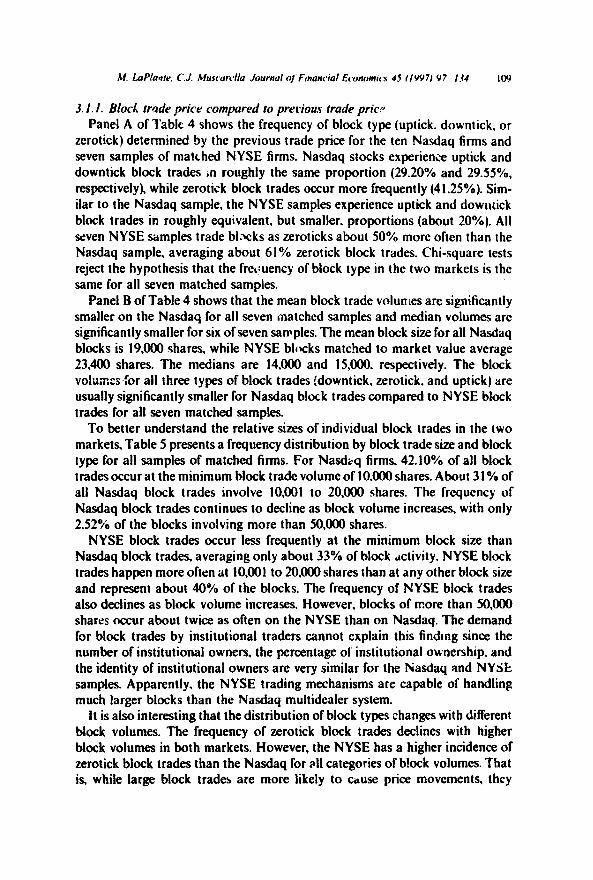
3.1.1. Bloch trade price compared to previous trade pric” Panel A of Table 4 shows the frequency of block type (uptick. downtick, or
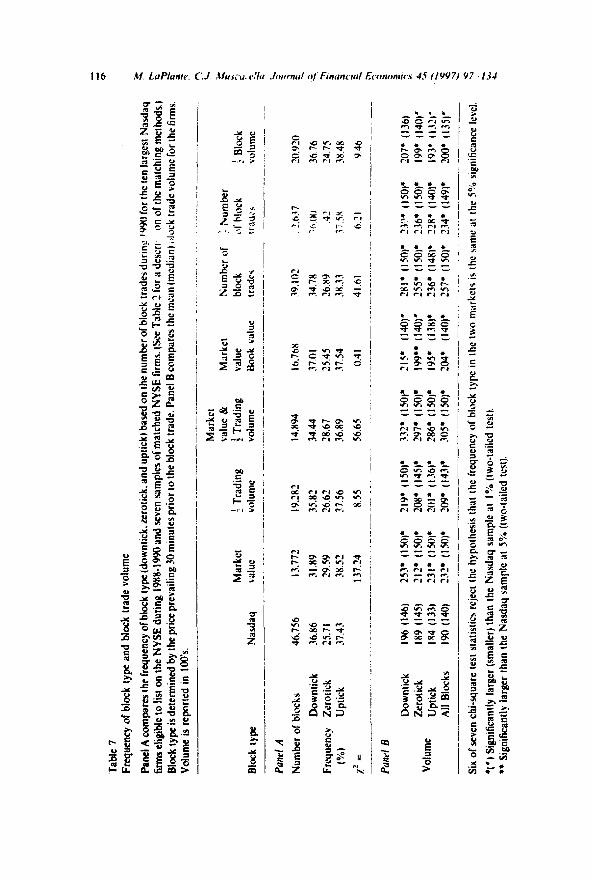
zerotick) determined by the previous trade price for the ten Nasdaq firms and seven samples of matched NYSE firms. Nasdaq stocks experience uptick and downtick block trades ;n roughly the same proportion (29.20% and 29.55%, respectively), while zerotick block trades occur more frequently (41.25%). Sim- ilar to the Nasdaq sample, the NYSE samples experience uptick and dowutick block trades in roughly equivalent, but smaller. proportions (about 20%). All seven NYSE samples trade bhocks as zeroticks about 50% more often than the Nasdaq sample. averaging about 61% zerotick block trades. Chi-square tests reject the hypothesis that the freL:uency of block type in the two markets is the same for all seven matched samples.
Panel B of Table 4 shows that the mean block trade volun~es are significantly smaller on the Nasdaq for all seven matched samples and median volumes are significantly smaller for six of seven samples. The mean block size for all Nasdaq blocks is 19,000 shares, while NYSE blocks matched to market value average 23,400 shares. The medians are 14,000 and 15,000. respectively. The block voiumcs-for all three types of block trades !downtick. zerotick. and uptick) are usually significantly smaller for Nasdaq block trades compared to NYSE block trades for all seven matched samples.
To better understand the relative sizes of individual block trades in the two markets, Table 5 presents a frequency distribution by block trade size and block type for all samples of matched firms. For Nasdkq firms, 42.10% of all block trades occur at the minimum block trade volume of lO.ooO shares. About 3 1% of all Nasdaq block trades involve 10,OOl to 20,ooO shares. The frequency of Nasdaq block trades continues to decline as block volume increases, with only 2.52% of the blocks involving more than 50,000 shares.
NYSE block trades occur less frequently at the minimum block size than Nasdaq block trades, averaging only about 33% of block dctivity. NYSE block trades happen more often at 10,001 to 20.000 shares than at any other block size and represent about 40% of the blocks. The frequency of NYSE block trades also declines as block volume increases. However, blocks of more than 50,000 shares occur about twice as often on the NYSE than on Nasdaq. The demand for block trades by institutional traders cannot explain this findmg since the number of institutional owners, the percentage of institutional ownership, and the identity of institutional owners are very similar for the biasdaq and NYdt samples. Apparently. the NYSE trading mechanisms are capable of handling much larger blocks than the Na.sdaq multidealer system.
It is also interesting that the distribution of block types changes with different block volumes. The frequency of zerotick block trades declines with higher block volumes in both markets. However, the NYSE has a higher incidence of zerotick block trades than the Nasdaq for all categories of block volumes. That is, while large block trades ate more likely to cause price movements, they
Table
4
Freq
uenc
y of
block
s an
d blo
ck
trade
vo
lume
Pane
) A
comp
ares
the
fre
qurnc
y of
block
typ
e ba
sed
on
the
numb
er
of
block
tra
des
durin
g 19
90
for
the
ten
large
st Na
~.a.)
firms
eligib
le to
list
on
the
NYSE
du
ring
1988
19
90 a
nd
seve
n sa
mpks
of
match
ed
NYSE
firm
s. (S
ee
Table
2
for
a de
scrip
tion
ofthe
ma
tching
me
thI
sis.l
Bloc
k typ
e is
dete
rmine
d by
the
pr
ice
of the
tra
de
prior
IO
the
blo
ck
trade
. Pa
nel
B co
mpar
es
the
mean
(m
edian
) blo
ck
trade
vo
lume
for
the
firms
Volum
e is
repo
rted
in I(w
)‘s.
__---
. ~~
-
-_-.
- .-.
.
Marke
t va
lue
& Ma
rket
Numb
er
of 4
Numb
er
Mxrke
t !
Trad
ing
i Tr
ading
va
lue,
block
of
h’clck
4
Bloc
k Bl
ock
type
Nasd
aq
value
vo
lume
volum
e Bo
ok
value
tra
des
triu’
\ vo
lume
------
--.-
----
------
.------
-- -.
-_-
._.__
_-__
Paw/
A
Numb
er
of blo
cks
Down
tick
Freq
uenc
y Ze
rorick
to4
Up
ttck
$ =
55.1
50
29.2
0 41
.25
2Y.J.
(
I S.?
Y5
Il.62
61
.83
20.5
5
2.10
950
22.
I24
17.2
0 I Y
.22
I 45
.061
20.5
I 19
.14
22.8
4 19
.34
60.1
I 5X
.71
s7.50
63
.41
19.3
8 22
.15
19.6
6 17
.25
2443
.90
1637
.70
1.56
051
4.Y2
2.20
24.0
57
21.4
0 60
.13
I X.4
X
2.441
.20
Pane
l B
Down
tick
Volum
e Ze
rotxk
Up
tick
All
block
s
205
(150
) 27
9. (I
50).
240’
(150
). 41
0. (1
58).
$42.
(I 5O
P 33
10
(150
). 17
9 (1
25)
217,
(145
). 19
3’ (1
32).
248.
(ISO)
* 18
6. (1
30)+
21
5. (1
40)’
IW
(150
) 24
7’ (I
50)’
222;
(!48)
’ 34
9. ( l5
0P
206’
(147
)’ 29
4. (1
50)’
I90
(140
) 23
4. (I
50)’
2(,8*
(M
O)*
301’
(150
)’ 20
3’ (1
39).
251.
(147
).
‘76’
t 150
)’ 22
8; (IM
)**
205’
(I 39
). 18
1 (1
25)+
+ 2S
h*
( I50)
8 21
4’ (1
47)’
229’
(146
)’ 19
7’ (1
32)’
.~--
----
..-
...-
-.--
----
-._
----
--
--.
----
__-_
-. __
All
chi-s
quar
e tes
t rta
t:+uc
s re
ject
the h
ypoth
esis
that
the f
requ
ency
ol
block
typ
e in
the t
wo
marke
ts is
the
same
at
the
lo’ I”
signif
icanc
e lev
el fo
r al
l se
ven
samp
les.
*(‘)
Sign
ilican
tly
large
r (sm
aller
) tha
n the
Na
sdaq
sa
mple
at lob
(tw
o-tai
led
test).
*I(**)
Si
gnific
antly
lar
ger
(small
er)
than
the
Nasd
aq
samp
le at
5%
(two-
tailed
tes
t)

Table
5
Volum
e fre
quen
cy
distri
butio
ns
ol blo
ck
trade
s du
ring
199O
(in
perce
nttfor
the
ten
lar
gest
Nasd
aq
firms
eligib
le to
list
on t
he N
YSE
durin
g 19
88--1
990
and
seve
n sa
mples
of
match
ed
NYSE
firm
s. (se
e Ta
ble
2 for
a
desc
riptio
n of
the
match
ing
metho
ds);
block
typ
e is
dete
rmine
d by
the
pric
e of
the
trade
pr
ior
to the
blo
ck
trade
--
Marke
t va
lue
j Tr
ading
%
4 Tr
ading
Ma
rket
value
Nu
mber
of
f Nu
mber
of
f Bl
ock
Nasd
aq
Marke
t va
lue
volum
e vo
lume
‘Boo
k va
lue
block
tra
des
block
tra
des
volum
e --
___--
--.
-_-..-
._._ -_
---_--
..---
---__
_
-_-__
-...-.-
-...-__
---.-
..-_---
-- -.
Freq
uenc
y wi
thin
Volum
e Bl
ock
type
volum
e -_-
---
_---~
- .--
_
10.0
00
Down
tick
Zerot
ick
Upttc
k AL
L
10.0
01
-20.0
00
Down
tick
Zernt
ick
Uptic
k AL
L
20 &
)I -3
0.000
Do
u-vtic
k Ze
rotick
Lp
tick
ALL
30.0
01
50.0
00
Down
tick
Zero
t ick
Up
tick
ALL
> 5o
.ooo
Do
wntic
k Ze
rotick
L’p
tick
ALL
27.0
7 43
.x9
29.0
4 42
.10
2X.6
3 41
.42
29.9:
30
.78
Jl.SX
.X
.20
30.2
2 Il.5
5
34.5
2 35
.30
10.
I x
7.03
40.2
0 31
4x
x31 2.5
2
Freq
uenc
y Fr
eque
ncy
with
in wi
thin
volum
e vo
lume
15.5
7 64
.25
?O.IH
31
.x9
17.1
X 62
.19
IY.6
2 3Y
U6
19.3
8 59
.65
‘0.98
14
.71
--
17.4
4 63
.96
I x.60
33
.81
20.
I 7
61.5
4 I X
.29
40.
IO
?MO
55.3
0 24
.11
X.69
24.S
I 52
.2’)
$3 ‘
0 e.
.w
4.n4
226H
59
2:
I n.05
I3
.Yh
26.7
6 53
.1x
?0.0
6 7.
Y6
29.2
4 47
.50
23.2
6 4.1
6
Freq
uenc
y wi
thin
volum
e ~--
Il.25
60.8
9 2
I .86
30
.53
17.9
0 61
.11
20.9
9 3R
.40
19.8
3 57
.59
22.5
9 15
.39
21.2
6 53
.61
25.1
3 8.
X8
30.4
5 44
.38
25.1
7 6.7
3
Freq
uenc
y Fr
eque
ncy
wtth
in wi
thin
volum
e vo
lume
_- _ .
.---__
-- --
--
20
.48
17.1
1 17
.95
IS.4
5 60
.40
66.2
6 63
.H9
63.9
0 lY
.II
1 ti.6
3 18
.16
17.6
4 34
.19
33.7
9 32
.21
37.0
3
22.6s
58
.39
18.9
3 40
.70
23.1
6 55
.67
21.1
7 13
.57
27.5
2 49
.w7
22.6
1 7.
85
19.11
) 64
.78
16.1
2 3Y
.22
19.8
2 62
.10
18.0
8 14
.07
20.6
5 21
.36
61.8
1 61
.00
17.5
4 17
.65
40.6
2 39
.07
;11.
-18
56.7
5 20
.7H
7.99
21.9
3 23
.35
60.2
7 56
.32
17.H
I 20
.33
! 4.32
12
.9x
25.7
’ 27
.90
54.8
4 50
.40
19.4
4 21
.70
8.35
7.25
35.4
4 43
.74
20.H
2 3.7
0
30.1
3 47
.54
22.3
2 4.9
3
33.0
8 44
.56
7’) 1
6 ..-
._ 4.50
31.7
8 45
40
22.H
l 3.6
7
Freq
uenc
y Fr
eque
ncy
with
in wi
thtn
vo
lume
volum
e
112 M. LaPlanrc, C.J. M~~s~~arulla,‘Jorrmrrl of Financial Economics 45 (IVY?) 97 I34
are less likely to have price impacts on the NYSE than on the Nasdaq. For example, zerotick Jlock trades are more common on the NYSE for 30,001 to 50,000 share trades (about 54%) than they are for Nasdaq trades (35.30%). Even for the largest block trades on the NYSE, zerotick trades are more likely than either downtick or uptick trades in all seven samples. Chi-square tests reveal that the frequency of block type is statistically different across markets for each volume category in all seven samples. Lastly, uptick and downtick block types are about equally likely for smaller block volumes in both markets. As the size of tl,c* block iTcreases. do\t,ntickF bec.\mc .norc frequent than upticks in both m;rkets.
The raw data in Tables 4 and 5 suggest that there are differences in the nature of block trading between the two markets. The types and sizes of block trades are statistically different. Block trading on the NYSE involves more shares with fewer instances of price changes. To learn more about the impact of block trading on Nasdaq and the NYSE, we conduct statistical tests on the returns for all blocks as well as for the different types of blocks. Results are presented in panel A of Table 6. We measure the return on block trades as the percentage change in stock price from the previous trade to the block trade. Although Porter and Weaver (1995) find evidence that Nasdaq dealers fail to comply with the SEC’s 90-second rule for reporting trades more often than do the specialists of organized exchanges, this finding should introduce no systematic bias to our llMX3SUreS.
We find that block trades are absorbed with less price movement on the NYSE compared to Nasdaq. Downtick block trades for the Nasdaq firms have a mean return of - 0.55%. Six of the NYSE samples have significantly smaller price impacts, ranging from - 0.39% to - 0.48%. For uptick block trades, the Nasdaq firms have a mean return of 0.53%. All seven NYSE samples have significantly smaller returns.
We calculate the price effect for all types of block trades by averaging the unsigned returns for all trades. This measures the overall impact of block trades on pice movements and reflects the frequency of zerotick blocks. The smaller the absolute return for a firm, the smaller is the overall price movement due to block trading for that firm. Nasdaq blocks have an average absolute price impact of 0.32%. The average absolute price impacts for the seven NYSE samples are all statistically smaller at the 1% level of significance and average 0.18%. The tests for differences in median returns have similar results. In economic terms, this difference results in a potential cost to Nasdaq block traders of approximately $4.7 million per year per firm or a perpetuity value of S1.57 billion for all ten Nasdaq firms using a 3% real discount rate.
To investigate the impact of different block trade sizes, panel B of Table 6 presents mean returns by block type across volume categories. For all but the largest volume category (over 50,000 shares), the NYSE samples have signifi- cantly smaller price movements for both uptick and downtick trades and
M LaPlanre. C.J. Muscarella ‘Joumul of Financid Econonh JS 11997) Y7 I34 113
statistically AmaIler absolute price changes. (Similar results were found for trades of exactly 1520.25, 30, 3540. and 45 thousand shares.)
For blocks of over 50,000 shares, the results are mixed. This could be explained by the fact that the NYSE blocks in this size category are much larger and mote frequent compared to the Nasdaq blocks. For the Nasdaq sample, only about 0.09% of all block trades involve more than 200,tMO shares versus the NYSE samples, which are about eight times as likely to have blocks of this size. Given the absence of very large block trades on Nasdaq, any conclusions from the results of the comparisons of the mean returns of our samples for the largest size category are unwarranted.
One possible explanation for the large incidence of zerotick block trades found on the NYSE can be that blocks are brokenup on the NYSE but not on Nasdaq. To check this possibttity, we eliminate any blcck trade that has a block trade preceding it within I5 seconds. We repeat all calculations and find results that are qualitatively similar to those in Tables 4 through 6.
3.1.2. Block trade price compared to IS-. 30-, and &I-minute prior trade price Another potential explanation fo; the higher frequency of zerotick block
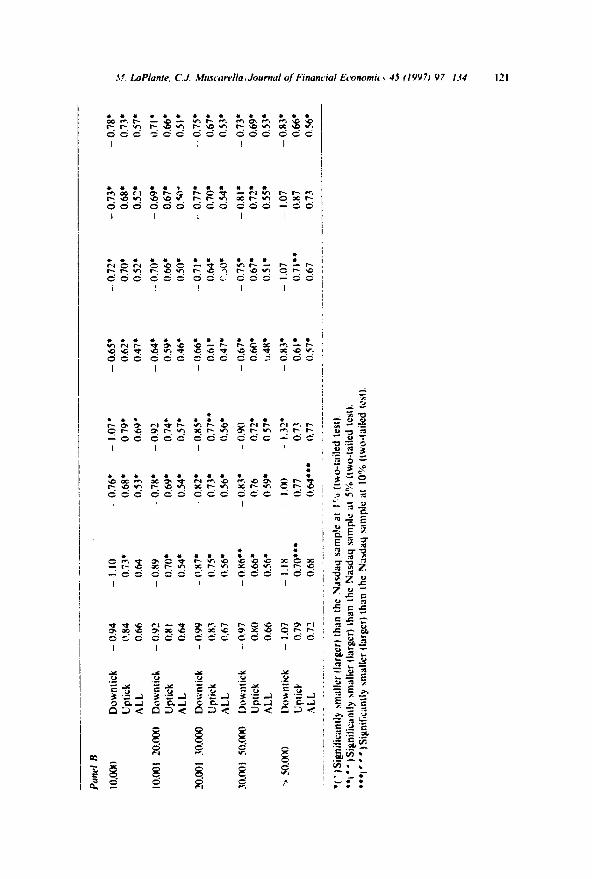
trades on the NYSE is that information leakage regarding a block trade being shopped in the upstairs market could cause stock prices to move before the block trade is executed. Since both markets have access to block brokers, this could happen with Nasdaq stocks, too. We attempt to control for information leakage by repeating our comparisons between the two markets using transac- tion prices prevailing 15 minutes, 30 minutes, and 60 minutes before each block trade as benchmarks. The results are qualitatively similar, we present the results for only the 30-minute interval.
Table 7 shows the revised frequencies of block type by volume category based on the trade occurring at least 30 minutes prior to the block trsde. Blocks that trade during the first 30 minutes of the day are eliminated. Panel A shows that based on prices prevailing 30 minutesearlier, block trades in both markets occur as downticks and upticks more often than as zeroticks (roughly 35%. 38%. and 27%, respectively). Five of the seven NYSE samples continue to have higher frequencies of zeroticks than the Nasdaq firms. Overall, the frequencies ditfer from those based on the prior trade, with the number of zerotick blocks dropping dramatically. This supports the notion that there can be market reaction to an upcoming block trade many minutes before it occurs. Panel B of Table 7 reports mean block trade volumes that are still significantly smaller on Nasdaq for all seven samples and median volumes that are signi;icantly smaller for five of seven matched sampies.
Table 8 reproduces volume frequency distributions according to trade size and block type determined by prices prevailing 30 minutes before the blocks. As found earlier, blocks trade most often as IO,000 shares on Nasdaq and as lO,OOl-20,000 shares on the NYSE. The frequency of blocks over 50,000 shares

Table
6
Retur
ns
acros
s blo
ck
type
and
volum
e ca
tcgori
cs
Pane
l A
show
s me
an
(med
ian)
return
s ac
ross
block
typ
e fo
r blo
ck
trade
s du
ring
1990
for
the
ten
lar
gest
Nasd
aq
firms
cligr
.‘e
to
lrst
on t
he
NYSE
du
rmg
)98$
l99
Oand
se
ven
samp
les
of ma
tched
NY
SE
firms.
(See
Tab
le 2
for
a de
scrip
tion
ofthe
ma
tching
me
thods
.) Pa
nel
B sh
ow
x mea
n ret
urns
for
block
typ
e ac
ross
volum
e ca
tegor
ies.
Retur
ns
are
meas
ured
as
the
per
crnlag
e ch
ange
in
stock
pr
ice
from
the
prev
ious
trade
IO
the
hl&
j, ’
trade
. Th
e AL
L ret
urns
arc
calcu
lated
as
the
av
erag
e of
the
unsig
ned
return
s for
al
l tra
des
and
thus
refle
cts
the f
requ
ency
of
zerot
ick
block
s. Bl
ock
ry)x
s de
term
ined
by
the
pric
e of
the
trade
pr
ior
to the
blo
ck
trade
. __
-___
--_
- ._.
.
_ .-
-.--
..-
Marke
t va
lue
& j
Trad
ing
volum
e Vo
lume
Pmel
.4
Bloc
k typ
e I’a
sdaq
All
volum
es
Down
lick
- 0.5
5 f
- 0.4
5)
Uptic
k 0.5
3 (0
.45)
ALL
0.32
(0.31
)
j Tr
ading
hia
rket
value
vo
lume ..-
- .-.
- 0.4
6, --
n.4u
* -
0.55
( -
0.4-w
I
- 0.4
2)’
( -
0.48)
’
0.46.
0.43
4 0.4
9+
IO.JZ
)* (O
N)*
(0.46
)’
OIlI*
0.1
8. 0.
21*
fO.O
O)*
(0.00
)’ (o
.oo)*
Marke
t va
lue
Numb
er
of j
Numb
er
d j
Bloc
k Bo
ok
value
blo
ck
trade
s blo
ck
trade
s vo
lume
- 0.3
9. f
- 0.3
5).
0.37
9 (0
.36)*
0.16.
(0.00
)’
- 0.4
5. (
-- 0.
34p
0.40
’ (O
N)*
0.16.
(o.oo
)*
- 0.
47’
( -
0.40)
.
0.43.
wol*
0.18.
(0.O
f.V
- 0.
39’
f -
0.35)
.
0.39.
(0.36
)’
O.l6*
fo.
oo)*

I I I ,
‘Tab
le 7
Freq
uenc
y of
block
typ
e an
d blo
ck
trade
vo
lume
Pane
l A
comp
ares
the
frqu
ency
of
block
typ
e (d
ownti
ck.
zerot
ick.
and
uptic
k) ba
sed
on t
he n
umhe
r of
block
tra
des
durtn
g !Y
Ytl
for
the t
en l
arge
st Na
sdaq
firms
e\&M
e to
list
on
the
NYSE
du
ring
1988
-199
0 an
d se
ven
samp
les
of ma
tched
NY
SE
firms.
(See
Tab
le ?
for
a de
scrl
on o
f the
matc
hing
metho
ds.)
Bloc
k typ
e is
dete
rmine
d by
the
pric
e pr
evail
ing
30 m
inutes
pr
ior
to the
blo
ck
trade
. Pa
nel
B co
mpar
es
the m
ean
(med
ian)
,jlock
tra
de
volum
e for
the
firm
s. Vo
lume-
is re
porte
d in
100’s
. -~-
- -
..--
..-
Bloc
k typ
e Na
sdaq
Ma
rket
i Tr
ading
va
lue
volum
e
---._-
----
------
.-
.-.
.-_-
-._
.--.
_-__
_.
Marke
t va
lue
& Ma
rket
Numb
er
of 1
&umb
er
i Tr
ading
va
lue
block
d-
block
;
Bloc
k vo
lume
Book
va
lue
trade
s 1r
ad2c
vo
lume
-_-_
--- .._
_ --.
._ -..-
--
--...-.
-
-.---
.__-_
..-
. ._.
.. _._
Pane
l A
Numb
er
of blo
cks
46.7
56
13.7
7’ 19
,282
Down
tick
36.8
6 31
.89
35.8
2 Fr
eque
ncy
Zerot
ick
25.7
1 ?9
.5Y
26.6
2 (%
I Up
tick
37.4
3 3x
.52
31.5
6
%?
= 13
7.24
x.5
5 __
__._
____
_..
__.
..-
.._...
--.
----
-....
. .--
----
--
Pant
1 B
14.H
94
16.7
68
19.
IO?
2.6.17
20
.9 2
0
34.4
4 37
.01
34.7
8 :h
M
I 36
.76
28.6
7 25
.45
26.8
9 .42
‘4.
75
36.8
9 37
.54
38.3
3 37
.5x
38.4
8
56.6
5 0.4
I 41
.61
6.21
Y.46
Down
tick
196
(146
) 25
3. (1
50)*
219.
(150
). 33
2. ( I
SO)
* 21
5, (1
40)’
181’
(150
). 23
”. (1
50)’
207'
(136
)
Volum
e Ze
rotick
I89
(I4
51
212’
(150
1’ 20
8. (1
45).
297.
(ISO)
* 1Y
9**
1140
) ‘55
. (IS
O)*
236.
(150
)’ 19
9’ (1
40)’
Uptic
k 14
4 (1
33)
2310
(1
501.
201
l ( 1
361’
X6*
(150
). 19
5. (13
x)*
236,
(I48)
* 22
U*
(l40)
* 19
3' (IL
?) Al
l Blo
cks
I90
(140
) 23
.2,
(150
)* x9
* (1
43).
305.
(150
)2
ml*
(140
). 25
7*
(Isol*
2.3
4, (1
49).
2cw
((35)'
__
_-
_.
.--.-.
___
----
--
.----_
--
----
.--
-.._.
..-
. _
Six
of se
ven
cm-sq
uare
test
statis
tics
rejec
t the
hy
pothe
sis
that
the
irequ
ency
of
block
typ
e in
the
two
marke
ts is
the
same
at
the
5%
signit
icanc
e lev
d.
*(*)
Sign
ifican
tly
large
r (sm
aller
) tha
n the
Na
sdaq
sa
mple
at I%
(tw
o-tai
led
test).
l *
Sign
ifican
tly
large
r tha
n the
Na
sdaq
sa
mple
at 5%
(tw
o-tai
led
test).

Table
8
Volum
e fre
quen
cy
distri
butio
ns
in pe
rcent
for
block
tra
des
durin
g 19
90 f
or
the t
en
large
st NJ
sdaq
lir
mseli
gible
IO l
ist o
n the
NY
SE
durin
g 19
88.
19W
and
seve
n sa
mples
of
match
ed
NYSE
firm
s (se
e Ta
ble
2 for
a
desc
riptio
n of
the m
atchin
g me
thods
): blo
ck
rype
is de
term
ined
by
the p
rice
prev
ailing
30
minu
tes
prior
to
the
block
tra
de
--
_ .__
._ .-
_-
.__.
- ._
__.-.
__
_-._
----
---
..___
-
.-----
_-
---__
-_-._
_---
Marke
t va
lue
] Tr
ading
&
i Tr
ading
Ma
rket
value
Nu
mber
of
i Nu
mber
of
f Bl
ock
Ndilq
Ma
rket
value
vo
lume
volum
e ,B
ook
value
blo
ck
trade
s blo
ck
trade
.
volum
e ---
-..-.-_
__
.._.
-.- __
.. -_
- .-
. ._
- _-.
-.. _..
._ _
- ._-
_- __
__~
-. __
---
--___
_-.
- ._^
.
Freq
uenc
y Fr
eque
ncy
Freq
uenc
y Fr
eque
ncy
Frcq
ucnc
y Fr
eque
ncy
Trcq
uenc
y Fr
eque
ncy
with
in wi
thin
with
in wi
thin
with
in wi
thin
with
in wi
thin
Volum
e Bl
ock
type
volun
~c
volum
e vo
lume
volum
e vo
lume
vohr
-..c
volum
e vo
lume
-..--
. . .
..-
_ .
.-.---
.---.
. . . .
.----.
...-
.----.
. --
----
-.-
--...-
----.-
-._..
-. 10
.000
Do
wmick
36
.25
30.9
7 33
.33
35.0
7 35
.YY
33.5
2 34
.34
35.9
5 Zc
rotick
25
.27
28.2
3 26
.33
25.2
5 25
.0:
26.5’
) 25
.48
23.7
6 Up
tick
384W
40
.80
40.3
4 39
.68
3KY6
39
.YO
40.1
7 40
.2Y
ALL
41 8
3 31
.18
32.9
5 29
.XH
33.4
9 33
.22
31.4
3 36
.17
10.0
01
20.0
00
Down
tick
Zcrol
ick
Upnc
k AL
L
20.0
01
30.0
00
Dowm
ick
Zerot
ick
Uptic
k AL
L
36.2
0 3l.
Yl
36.8
6 3’.
9l 37
.32
35.1
7 36
.32
37.3
6 26
05
31.2
6 26
.46
30.6
2 25
.81
27.2
4 27
.01
25.2
5 37
.75
36.8
3 36
.7s
35.4
7 36
.87
37.6
0 36
.67
37.3
9 31
.01
40.4
4 JiM
S 38
59
41.0
4 3Y
.32
40.9
2 33
.55
37.0
5 30
.22
35.2
6 32
.25
26.3
7 70
.12
27.9
’ 31
.00
36.5
8 39
.66
fhK
36.7
5 17
SR
I4.7H
14
.27
I6 t-4
34.9
I 26
.31
38.7
8 I.1
87
33.9
1 35
.73
35.1
1 X1
& 26
.07
25.2
6 39
.38
38.2
0 39
64
14.2
1 14
.49
13.1
0
3O.O
OI
5O.W
O Do
wntic
k 1
I .03
34.6
1 JO
.13
33.4
8 3Y
.7Y
35.6
0 37
.84
3u.2
3 Zz
C.bic
k 25
.53
26.3
6 25
.h?
28.9
2 25
.17
28.2
4 27
81
25.5
3 lip
tick
33.4
4 3Y
.03
14.2
5 37
.59
35.0
4 36
.16
34.3
4 36
.23
ALL
6.Y5
87
I
8.12
li.YX
7.
Y I
X.13
85
9 7.4
1
2 50
.01w)
Do
wntic
k 42
.37
37.7
8 38
7Y
40.Y
5 44
.66
4 1.07
41
.93
41.2
4 Ze
rotick
24
.49
28.5
0 27
.96
26.9
5 22
.4Y
26.1
0 26
.09
25.7
6 Up
tick
33.1
4 33
.63
23.2
5 32
.10
32.8
5 32
x3
31.9x
32
.99
ALL
2.52
4.90
4.21.
6.‘)0
3.6
9 5.1
3 4.5
7 3.
7i
: 8 Y F 2 4 5 ..-
-.---_
..^
.__
-.-._
-_--.
-_._
_

increases slightly in the NYSE samples compared to Table 5. suggesting that very large blocks on the NYSE occur less frequently in the first half-hour of trading. Again. the frequency of zeroticks in the largest size category is higher for the NYSE samples than for the Nasdaq firms.
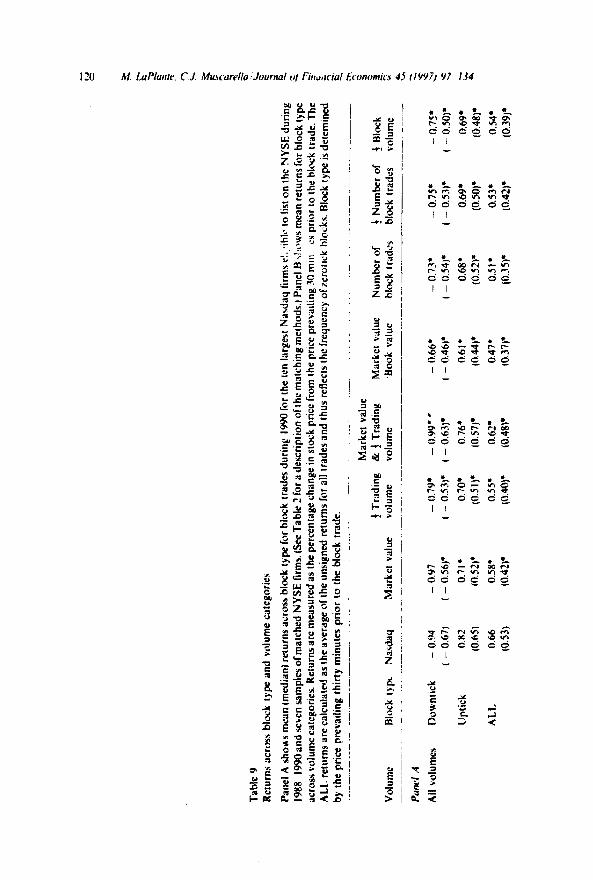
Table 9 presents returns based on the percentage change in stock price from the price prevailing 30 minutes prior to the block trade for the different block types and volume categories. While returns are always larger than the corres- ponding returns in Table 6, the results are consistent with Table 6. Panel A shows that all seven NYSE samples h:bvc : ‘-niticantly smaller block trade +ce ‘rt)ir<*k ‘*orl:i,;:rLd t<) :..&a, ,.OLJ~~Y 0.54 ‘XI versus 0.66%. respectively). Panel B shows return patterns across block types by volume categories that are similar to panel B of Table 6. While there is evidence in both markets of price movements occurring many minutes before a block trade, the NYSE still absorbs block trades with less price movement than Nasdaq.
3.1.3. Expanded sample This study compares levels of liquidity offered to large firms in the
Nasdaq market and the NYSE by focusing on block trade execution for the ten largest and most actively traded firms on Nasdaq. We do not attempt to draw conclusions regarding the general liquidity in the Nasdaq market versus the NYSE. However, as a check on our restricted sample size, we now expand the sample to include all Nasdaq firms that qualified to list during 1988- 1990 and use a sample of NYSE firms matched on market value as a comparison. The original sample contained 167 firms. We drop I8 with prices less than $10 and six more because of data discrepancies. The final sample contains 143 firms which are matched to NYSE firms by closest 1990 year-end market values. Table locontains the results of the comparisons. Panel A shows that the average number of block trades is similar (658 for the Nasdaq sample and 748 for NYSE), but again the mean number of shares traded in a block is smaller for the Nasdaq firms (18,700 shares versus 22.800 shares). It is interesting to note that the pattern of block type frequency is very similar to those found in the smaller sample. For example, the incidence of zeroticks is still higher on the NYSE. 58.52% versus 37.52%. Panel B shows the mean absolute price impacts based on the previous trade and the prices prevailing 15. 30, and 60 minutes earlier. Again, the results with the expanded sample are consistent with the smaller sample in that the price impacts of NYSE blocks are significantly smaller across all size categories for all benchmarks. We conclude that Nasdaq firms eligible to list on the NYSE could have smaller block price impacts if their shares were traded on the NYSE.
3.1.4. Regression analysis To further check our findings we use an alternative methodology and conduct
a pooled regression analysis for the ten Nasdaq firms and seven matched
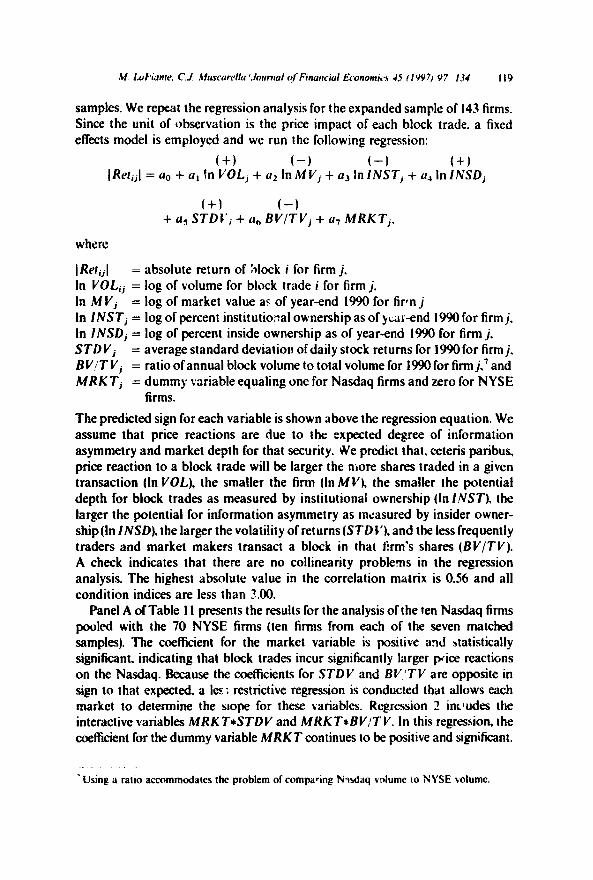
samples. We repeat the regression analysis for the expanded sample of 143 firms. Since the unit of observation is the price impact of each block trade. a fixed effects model is employed and we run the following regression:
(+I l-1 (-1 (+I IRetijl = 00 + ~1 In VOLj + ~2 In MI’, + ~73 In 1NSTj + u4 In INSDj
(+I f-1 + ~5 STDk’i + Uh BV/TVj + UT MRKTj.
where
IRefijI = absolute return of %ck i for firm j. In VOLij = log of volume for block trade i for firm j. In MVj = log of market value as of year-end 1990 for firIn j In 1NSTj = log of percent institutional ownership as of yc,u-end 1990 for firm j. In 1NSDj = log of percent inside ownership as of year-end 1990 for firm j. STDVj = average standard deviation of daiiy stock returns for 1990 for firm j, BV!T Vj = ratio of annual block volume to total volume for 1990 for firm j,’ and MRK Tj = dummy variable equaling one for Nasdaq firms and zero for NYSE
fiflllS.
The predicted sign for each variable is shown above the regression equation. We assume that price reactions are due to the expected degree of information asymmetry and market depth for that security. we predict that, ceteris paribus, price reaction to a block trade will be larger the more shares traded in a given transaction (In VOL), the smaller the firm (In MI’), the smaller the potential depth for block trades as measured by institutional ownership (In INST), the larger the potential for information asymmetry as measured by insider owner- ship(In INSD), the larger the volatility of retums(STDC’), and the less frequently traders and market makers transact a block in that f!rm’s shares (BY/TV). A check indicates that there are no collinearity problems in the regression analysis. The highest absolute value in the correlation matrix is 0.56 and all condition indices are less than ?.oO.
Panel A of Table I I presents the results for the analysis of the ten Nasdaq firms pooled with the 70 NYSE firms (ten firms from each of the seven matched samples). The coefficient for the market variable is positive and statistically significant. indicating that block trades incur significantly larger p&e reactions on the Nasdaq. Because the coefficients for STDV and BV,‘TV are opposite in sign to that expected a ler; restrictive regression is conducted that allows each market to determine the slope for these variables. Regression 2 includes the interactive variables MRKT+STDV and MRKT*BVITV. In this regression, the coefficient for the dummy variable MRKT continues to be positive and significant.
- Using a ratio accommodates rhe problem of comparing Ndaq vnlume io NYSE volume.
A?. LoPkme. C.J. Mu.wcwc&~ I Journd ol’Financiu/ Ecwnomk * 45 II VV71 V7 124 121


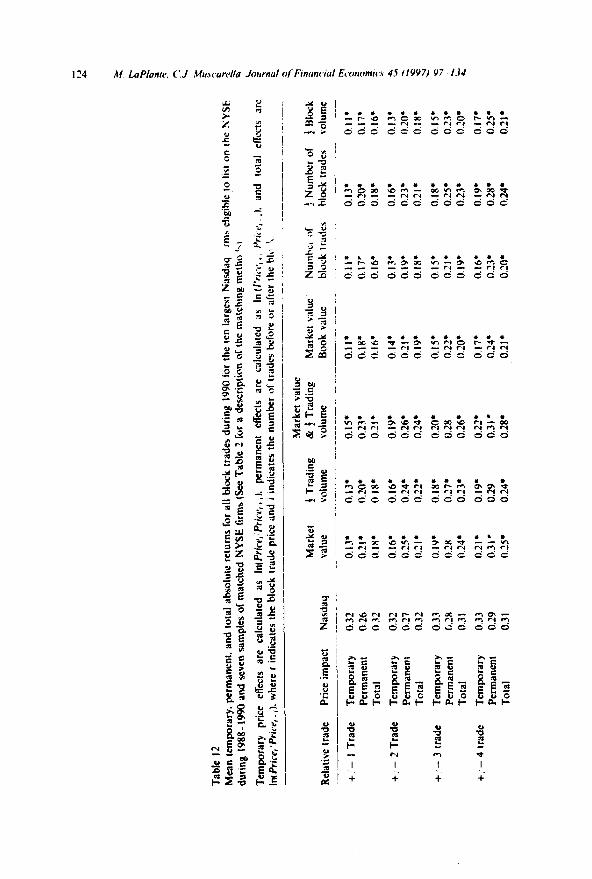
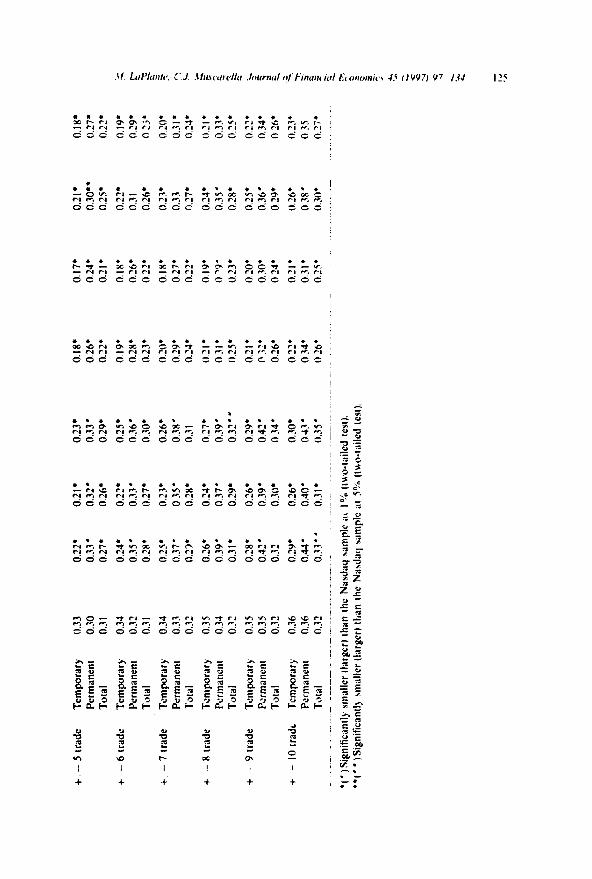
Panel B of Table I I presents the results for the same regression analysis performed on the expanded sample of 143 Nasdaq firms matched by market value of equity to NYSE firms. The regression results are quite similar to those found in the pooled sample, with the cocfhcient on the market variable being positive and significant. Overall, the regression results are consistent with the previous findings that block transactions cause larger price movements on Nasdaq than on the NYSE.
3.2. Temporag and permunent price etk~v
It is possible that institutional traders are not concerned about evidence that blocks trade with larger price impacts on Nasdaq. Large reactions to large trade volumes may be appropriate if the market is incorporating new information. Kraus and Stall (1972) and Holthausen et al. ( 1987, 1990) develop methodolo- gies that partition the impact of a block into the portion due to information being impounded in the price (the permanent effect) and the portion due to illiquidity in the market (the temporary effect). To determine whether institu- tional traders are making appropriate price concessions relative to other traders or are simply having to pay more because the market has lower liquidity and cannot absorb the large trades, we calculate temporary and permanent price effects for the blocks in the two markets. The larger the temporary effect, the higher the premium the trader paid to trade in that market. While the temporary effect is our main concern for this study. for completeness we also present the permanent e&t, which indicates whether information was incorporated into the price, as well as the total effect.
Temporary price effects are calculated as In( PriceJPrice, + i). permanent elTects are calculated as In(Price, +JPrice, _ i)q and total effects are In(Price,/Price, -i). where r indicates the block trade price and i indicates the number of trades before or after the block. Table 12 presents the mean absolute return for each of the price effects calculated out to ten trades on either side of the blocks. Temporary price effects for up to ten trades after a block across all seven matched samples are statistically smaller on the NYSE at a 1% level of significance. Specifically, for up to ten trades and across 70 ditierent matched firms, institutional traders experience smaller price reactions to their trades on the NYSE than on Nasdaq. These findings support those of Keim and Madhavan (1996). who study block trades for much smaller firms. Total price impacts are significantly smaller for all trades and samples except trades +/- 10 for the market value sample and trades + / - 8.9.10 for the sample
based on the ratio of market value to book value. Temporary, permanent, and total price effects are also calculated according to
the various size categories used earlier. Results for trades +/- 1.2.3.4 are presented in Table 13. Results for the remaining six trades are qualitatively similar. Temporary effects out to trade +/- 4 across all seven matched
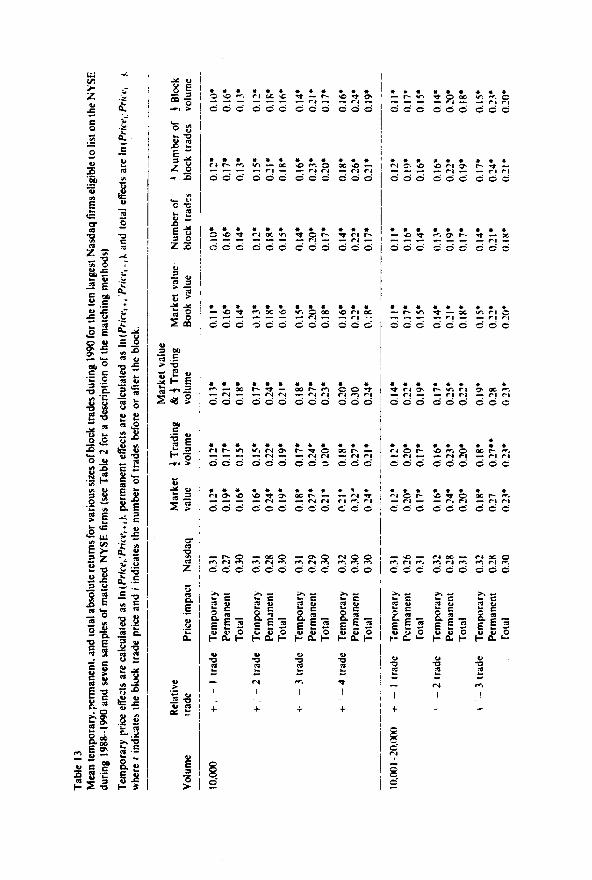
+ +
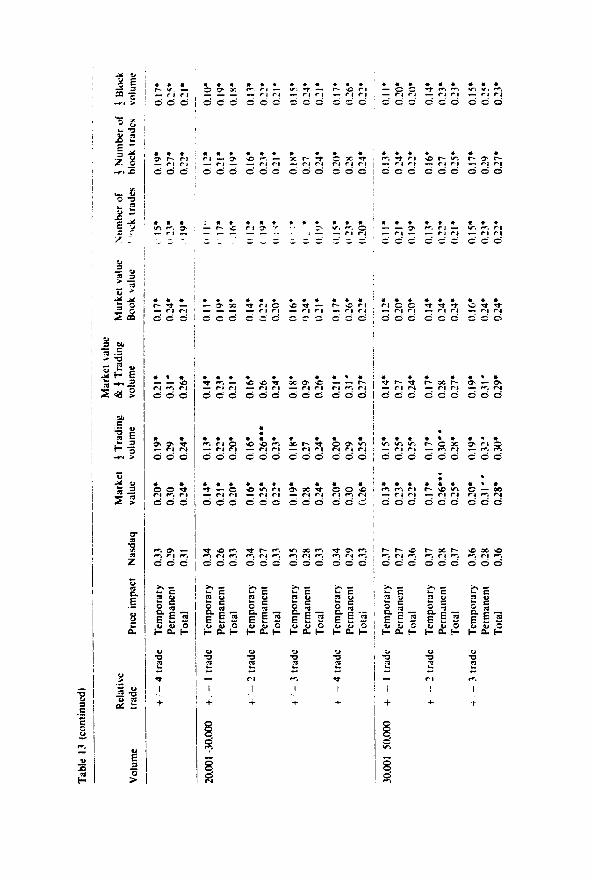

+:
- 4
trade
Te
mpo
rary
0.
38
0.21
. Pe
t m
ancn
t 02
8 03
14’
Tota
l 0.
3b
0.29
.
-.--.-
_
-_.-
.-----
_^
.-__-
- _.
___
-_
> 5o
.ooo
+
- I
trade
Te
mpo
rary
Pe
rman
ent
Tota
l
+ -
2 tra
de
Tem
pora
ry
Perm
anen
t
To1a
l
+ -
3 tra
de
Tem
pora
ry
Perm
anen
t To
kll
+ -
4 lra
de
Tem
pora
ry
Perm
anen
t To
tal
OJY
0.1x
* 0.
2x
O.‘Y
O
.SY
0.2H
0.40
0.
2 I *
0.26
0.
32’
0.38
0.
34,
03’)
0.22
*
0.20
03
4 0.
38
cr.3
4**
03X
0.23
* 0.
2x
WH
l
0.3n
0.
35’
0.22
. 0.
21.
0.35
’ 0.
32’
0.31
, 0.
2Y’
O.Il
P 0.
37
0.31
”’ 03
X”’
0.33
. 0.
45’
0.20
0.
43
0.34
’ 0.
35’
0.37
0.
50 ’
0.23
* 0.
41
0.37
’ 03
3’
0.4
I 0.
51’
0.‘4
’ c 0.
42
0.3X
’ o.
s5*
O.S
Y MI
l
l t l
ISig
nific
antly
sm
alle
r (la
rger
) th
an
rhe
Nasd
aq
sam
ple
;II
11;
(two-
tatic
d .ch
t).
**I”)
Sign
ifica
nll~
rm
allcr
Ila
lgcr)
than
th
e Nu
sdaq
sa
mpl
e JI
5%
(I\
\,*-la
ilcd
lest).
**
*t ”
‘)Sig
nifii
antly
<m
alle
r (la
rger
) th
an
the
Nasd
aq
sam
pls
:II
IO?;
, (tw
o-ta
iled
lest).
- -_
-. __
0.17
. 0.
16.
0.19
. 0.
179
0.27
*‘*
0.25
* 0.
31
l 0.
27
0.24
’ O.
‘S+
0.27
, 0.
24’
0.21
’ 0.
27’
0.28
0.
31”
n.ss
* n.
ss*
0.22
’ 0.3
I
l
032’
0.2Y
0.w
0.3x
0.26
+*
UP
0.33’
l 0.
29
O.S
Y 0.
40
O.‘b
*’ - 0.
31+
0.34
’ 0.
31
l l
0.4
I 0.
41
l *
_. _
-
--....
--.
.---
0.31
**
0.36
’
0.46
”’
0.7
’ il.
38
l
0.49
’
0.35
0.
37’
0.4u
-
0.35
0.
38’
0.31
=
_--.
- _.
-.-. 0.
17’
0.26
0.31
+*
0.22
’ 0.
27
0.34
0.22
’ 0.
29
0.35
0.Y 0.23
’ 0.
36
samples for blocks ranging in size from lO.OOO--50.000 shares are significantly smaller on the NYSE. Nearly all temporary effects for trades over 50.000 shares continue to be significantly smaller on the NYSE. Only two samples have temporary price impacts for these block sizes that are not significantly smaller than similar Nasdaq-traded blocks. Repeating the tests in Tables 12 and I3 for the expanded market value sample of 143 firms shows that for all trades and all sizes, the NYSE sample has significantly smaller temporary and total effects. For practically all sizes of blocks then. the lVYSE has smaller temporary price impacts and thus greater liquidit! f lr I;* ;e trades.
4. Summary rrtd concksions
We compare the price impact of block trades on the NYSE and the Nasdaq market to contrast the liquidity of the two trading structures. We study a sample of Nasdaq-traded issues that meet NYSE listing criteria during 1988-1990. Firms with a relatively high percentage of their shares traded in blocks and eligible to change trading mechanisms may bc concerned about the effects of diRerent trading structures on block trades, given that the number and volume of block trades and the percentage and type of institutional ownership are similar in the two markets.
Our paper extends prior research on block trades that focuses on large trades in the organized exchanges. Only very recently have studies begun to include blocks transacted in the Nasdaq market. and those papers investigate issues other than the relative impact of block trades for firms ofequivalent size and risk trading in the different markets. We focus on the ten largest Nasdaq firms eligible for exchange listing and compare the nature of their block trades with NYSE firms matched to various size and trading volume criteria. This approach allows us to focus on the relative abilities of the diRerent trading systems to handle large transactions.
Nasdaq argues that the multidealer system provides mo:e depth and hence more liquidity, while the NYSE stresses the importance of potential price improvement because of exposure to other floor traders and limit orders. Based on the change in price from the previous trade, we find that blocks on Nasclaq result in uptick and downtick trades in the same proprticn (29%) and that zerotick trades occur about 41% of the time. !n contrast. nearly 61% of the blocks on the NYSE trade with a zerotick. which is significantly more frequent than zerotick block trades on Nasdaq. The average volume for NYSE block trades is significantly larger than for Nasdaq block trades: Nasdaq blocks transact frequently at the minimum block size of ~O,OCKJ shares while NYSE blocks are more likely to be in the range of IO.001 to 2O.ooO shares. NYSE blocks are also twice as likely as Nasdaq blocks to trade in volumes above 50.000 shares.
We tirst measure the impact of block trades as the relative change in stock price from the previous trade to the block trade. The mean and median returns for uptick and downtick block trades are smaller on the NYSE than on Nasdaq. These findings a-e robust for all seven matched samples. The absolutL. return of all block trades irt the Nasdaq sample (including the zcrotick blocks) is statist- ically larger than the absolute returns for all seven matched samples of NYSE firms. There is a significant difference in the average price change due to block trading in the two markets of 0.14% (0.32% versus 0.18%). This difference results in a potential present value of extra costs to block traders of approxim- ately Sl57 million per Nasdaq firm.
We also measure the retsuns of block trades based upon the prices of trades occurring 15. 30. and 60 minutes prior to the block !rade. The returns are consistently greater than returns based upon the earlier trade and could indicate that information regarding the’,lock trade leaks to the market prior to the block trade execution. In all seven matched samples. the NYSE continues to show significantly lower block price impacts than Nasdaq.
An expanded sample of 143 tirms matched on market value provides similar results based on trades immediately prior to the block trade as well as on trades occurring IS, 30. and 60 minutes prior to the block trade. A regression analysis also reveals the same pattern of higher price impacts for blocks traded on Nasdaq.
To determine whether the price reactions are experienced solely by block traders and whether they are due to the market’s lack of liquidity or to information being incorporated by other traders. we calculate temporary price effects for up to ten trades after the blocks. Across a11 seven samples and for nearly all sizes of blocks. traders on the NYSE pay smaller premiums to trade blocks.
Despite the consistent results. there are limitations to the empirical methodo- logy used throughout the paper. Ideally. WC would like to have information on total execution costs. Unfortunately. without proprietary data. we cannot dir- ectly measure the costs faced by institutions in different markets. For example. we are unable to measure commission costs. Some institutions pay commissions on NYSE trades but not on Nasdaq trades. In addition. soft-dollar payments and preferencing arrangements may also affect institutions’costs as discus& in Madhavan (1996). Another limitation to our methodology is our inability to identify interuealer trades on Nasdaq. Our analysis would be more precise if we could eliminate these transactions. However, this limitation may strengthen the results since interdealer trades are likely to h at a zerotick.
Subject to the above limitations.our conclusion is that the NYSE system with its centralized public limit order book and procedures to handle large trades offers block traders superior execution due to the significantly larger average block size. the significantly larger proportion of rerotick block trades. and the significantly smaller temporary price etTects The NYSE system also exhibits

132 M. LaPlank~. C.J. Uu.s~urc~llcr f Journal of Furuncial Economics 45 llYY7) 97 134
smaller price impacts for uptick and downtick trades of comparable size. Very large block trades (greater than 200.000 shares) rarely occur on Nasdaq. This is unlikely to be the result ofdifferences in thedemand for large block transactions, since institutional investors are about equally active in our sample of large Nasdaq firms and matched NYSE firms. We conclude that the Nasdaq multi- dealer system does not execute large institutional transactions as effectively as the NYSE system.
Ket’ereaces
Admati. A.. Ptkiderer. P.. 19HH. A theory of intraday patterns: volume and price variability. Review of Financiat Studies. 3 40.
Amihud. Y.. Mendclson, H.. 19x6. Asset pricing and the bid -ask spread. Journal of Financial Economia i 7. 223- 249.
Amihud. Y, Mend&on, H.. 1988. Liquidity and asset prices: financial management implications. Financrai Management 17. 5 I5
Atkins. A., DyL E., 1993. Market structure and reported trading volume: Nasdaq versus the NYSE. Working paper. University of Arizona. Tuscan, AZ.
Baker. H.K.. Edelman. R.B.. 1990. OTC market switching and stock returns: some empiricai evidence Journal of Financial Research 4. 325 338.
Ball. R.. Fii F.. 1989. Theetkct of block transactions on share prices: Australian evidence. Journal of Banking and Finance 13,397 420.
Burdett, K.. O’Hara. M.. 1987. Building Mocks: an introduction to block trading. Journal of Banking and Finance It. 193.-212.
Chart. L.K.C, Lakonishok, J.. 1993. Institutional trades and intraday stock price behavior. Journal of Financial Economics 33. 173 200.
Chan. L.K.C.. Lakonishok. J.. 1995. The hehavior of stock prices around institutional trades. Journal of Finance 50, I147 1174.
Choe. H., Mclnish. T.. Wood. R., 1992. Market microstructure effects on the measurement of the impact of Mock trades. Working paper. Pennsylvania Sta!e University. University Park, PA.
Choe. H., Mclnish. T.. Wood, R.. 1994. Block vs. nonblock trading patterns. Working paper, Pennsylvania State University. University Park. PA.
Christie. W.G., Harris. J.. Schultz. P.H.. 1994. Why did Nasdaq market makers stop avoiding odd- eighth quotes? Journal of Finance 49. lg41 1860.
Christie, W.G.. Schultr P.H.. 1994. Why do Nasdaq market makers avoid odd-eighth quotes? Journal of Finance 49. 1813-1840.
Cochtane. J.L., 1993. The changing structure of markets The NYSE. In: Sherrerd. K.F. (Ed.). Execution Techniques True Trading Costs. and the Microstructure of Markets. Association of Investment Management and Research. Charlottesville, VA.
Dann. L.Y.. Mayers. D.. Raab, R.. 1977. Trading rules large blocks and the speed of price adjustments. Journal of Financial Economics 4. 3 22.
Demsew H.. l%g. Do competition and monopolistic competition differ. Journal of Political Economy 76. 146 148.
Demsetr, H 1995. A non-conclusive explanation for the pattern of spreads on the Nasdaq. Work@ paper. UCLA. Los Angeles. CA.
Easley, D.. O’Hara. M.. 1987. Price. trade size. and information in securities markets. Journal of Financial Economics 19.69 90.
hi. LuPlanre. C.J. Alu.u~arulla~Journal o\‘Fmancial Et~ononlics 45 (lYY71 Y 7 I.(4 133
George. T.. Kaul. G.. Nimalendran. M.. 1991. Estimation of the bid ask spread and its components: a new appoach. Review of Financial Studies 4, 623-656.
Glosten. L.. HarFIs. L., 1988. Estimating thecomponentsof the bid ask spread. Journal of Financial Economics 4. 3-22.
Gould. J.F.. Kkiaon. A.W.. 1994. Market maker activity on Nasdaq: implications for trading volume. Stanforti Journal of Law. Business & Finance I. l--17.
Grossman, SJ, 1992. The informational role of upstairs and downstairs markets. Journal of Business 65.509 529.
Grossman, SJ., Miller. M H.. 1988. Liquidity and market structure. Journal of Finance43 617 633. Groth. J.. Dubofsky, D., 19x7. The liquidity factor. In: The Nasdaq Handbook: The Stock Market of
Tomorrow Today. Prc?-uts Publishing. Chicago. IL.
Hasbrouck. J.. 1988. Trades. quotes. inventories and information. Journal of Financial Economics 22. 229 -252.
Hasbrouck. J.. 1991. Measuring the information content of stock !.ades. Journal of Finance 46. 178-208.
Hasbrouck. J., Sofianos. G., Sosebc-. D.. 1993. New York %a‘:: Exchange systems and trading procedures. Working paper #9ktl. NYSE. New York. NY.
Ho. T.. Macris. R.G.. 1985. Dealer market structure and performance. In: Amihud. Y.. Ho. T.. Schwartz. R. tEds.k Market Making .md the Changing Structure of the Securities Industrtes. Lexington Books Lexington. MA.
Ho. T.. Stall. H.R.. 1983. The dynamics of dealer markets under competition. Journal of Finance 3X. 1053.-1074.
Hdthausen. R.W, Leftwich. R.W.. Mayers D.. 1987. The e&et of large block transactions on security prices: a cross-sectional analysis. Journal of Financial Economics 19. 237 268.
Hdthausen. R.W.. Leftwich R.W.. Mayers. D.. 1990. Large-block transactions. the speed of response.. and temporary and permanent stoch-prke e&c&. Journal of Financial Economics 26. 71-95.
Huang. R.D.. St&l. H.R.. 1996. Dealer versus auction markets a paired comparison of executron costs on Nasdaq and the NYSE. Journal of Financial Economics 41. 31.7 357.
Keim. D.B.. Madhavan. A.. 1995a. Anatomy of the tra~lmp process: empirical evidence on the behavior of institutional traders. Journal of Financial Economics 37. 37 I 398.
Keim. D.B.. Madhavan. A.. 199Sb. Transaction costs and mvestment performance: an analysis of institutional equity trades. Working paper. University oiSnrthern California. Los Angles CA.
Keim. D.B.. Madhavan. A.. 1996. The upstairs market for large-block transactions: analysis and measurement of price e&cts. Review of Financial Studic forthcoming.
Kothare. M.. Laux. P.. 1995 Trading costs and the trading systems lo1 Nardaq stocks. Financial
Analysts Journal 51. 42 53. Kraus, A.. Stall. H.R.. 1972. Price Impact of blcck trading on the NYSE. Journal of Fmancc 27.
56% 588. Kyk, A., 1985. Continuous aucttons and insider trading. Econometrica 53. 1315 1335. Madhavan. A.. 1992. Trading mechanisms in securities markets. Journal of Finance 47. 607 641.
Madhavan. A. 1995. Consolidation. fragmentation and the diczlosure of trading information. Review of Financial Studies X. 579.-603.
Madhavan. A.. 1996. An over\ iew of the empirical evtdence on the cost ofinstituttonal equity trades. Working paper. University of Southern California. ios Angeles. CA.
Madhavan. A, Cheng. M.. 1996. In search of liquidity: block trades in the upstarrs and downstairs markets. Working paper. University of Southern California. Los Angeles. CA
Madhavan. A. Smidt. S.. 1991. A Bayesian model 01 mtmday specialist pricing. Journal of Financial Economics .30,99 134.
Mikkelson. W.. Partch. M , 1985. Stock price eRccts and costs of secondary distribution\. Journal of Financial Economics 14. I65 194.

No&q Fact Book & Company Directory. I9YI 1994. N;ttional Assoctation of Securittcs Dealers, Wddlington. DC.
Neu York Stuck Exchange kact Book. l9XY 1993. NYSE. New York. N\. Porter. D.. Weaver. D.. IVY5 Do Nasdaq market makers ‘pdmt the tape’! Working paper. Mar-
qusttc IJni\crsity. Milwaukee. WI. Rcingsnum. M.R.. 1990. Market structure and asset pticing. Journal of Financial Economics 28.
127-147. Stinger, G.C., McConnell. J.J.. 1986. Stock exchange listings. firm value. and security market
efficiency: The impact of Na&u. lournal n!’ Fin;m,lal and Quantitative Analysis ?I, I 3. %holc\. M.S.. 1971. The tnarket for securitic\’ wh \* ;‘l-tion versu> price-prLvurc and the etlects of
,I I- Ifi,:.> 0,) ,I “;:,i’p: ,~ II. ‘1 cd ',lhlllr..~ 43. I I’) 21 I Schwartr. H.. Shapiro. J.. 1992. The challenge of m~tltutiortali~ation fcv the equ~t\ markets. In:
Saunders. A. (Ed.). Recent Developments m Fintince New York 1:nivcrsrty Salomcn Center. New York. NY.
Seppi. D.. 1990. Equilibrium block trading ;II~ asymmetric information. Journal of Finance 45. 73 94.
Stoll. H.. IY89. Inferring the components of the bid ask spread. theory ;InJ cmplricd tebts. Journal of Finance 44. I I5 124.