Fillet quality of Atlantic salmon - CORE · Fillet quality of Atlantic salmon (Salmo salar L.)....
52
Transcript of Fillet quality of Atlantic salmon - CORE · Fillet quality of Atlantic salmon (Salmo salar L.)....

Fillet quality of Atlantic salmon (Salmo salar L.).
Relevance of dietary amino acid supplementation
and acclimation temperature before slaughter.
Master Thesis in
Feed Manufacturing Technology
(30 credits)
by
Yangyang Gong
Dept. of Animal and Aquacultural Sciences
Norwegian University of Life Sciences
Ås, Norway
May, 2011

I
ACKNOWLEDGEMENTS
Foremost, I would like to express my deep and sincere gratitude to my supervisor, Dr.
Scient.Turid Mørkøre, for the continuous support of my master thesis, for her patience,
motivation, enthusiasm, and immense knowledge. Her understanding, encouraging
and personal guidance have provided a good basis for the present thesis. I could not
have imagined having a better supervisor and mentor for my master thesis.
During this work I have collaborated with many colleagues and staff for whom I have
great regard. I also wish to express my warmest thanks to all those who have helped
me with my work in the Department of Animal and Aquacultural Sciences at the
University of Life Sciences, at Averøy, Nofima Marine seawater research station, at
the northwest coast of Norway, with special thanks to Thomas Larsson and Inger Ø.
Kristiansen for their excellent technical assistance. Dr. Diane Bahuaud is warmly
thanked for her help with analysing of the cathepsins.
I would like to thank my family, for giving birth to me and supporting me spiritually
throughout my life. My special gratitude is due to my girlfriend for her loving
support.
The financial support of the The Fishery and Aquaculture Industry Research Fund is
gratefully acknowledged.

II
SUMMARY
The aim of the present study was to investigate the impact of dietary composition and
acclimation temperature before slaughter on fillet quality development of farmed
Atlantic salmon (Salmo salar L.). The fish were fed a commercial extruded diets or
the same diet supplemented with arginine or glutamate for one year before they were
harvested in May 2010 (average body weight was 3 kg). The fish were transferred
from net pens in seawater (8℃) to small tanks on land with different seawater
temperature (2, 8, 16℃) for 210 minutes before they were killed with a blow to the
head. The rate of fillet contraction was analyzed during the first 24 hours after
slaughtering, and fillet gaping, colour, fillet texture, muscle pH, cathepsins and ATP
degradation products were analyzed at regular intervals during 12 days ice storage.
Acclimation temperatures had an overall significant effect on the fillet contraction
from 3-12 hours storage with the highest contraction for the salmon acclimated at
16℃. The salmon fed the arginine diet had the significantly lowest contraction rate
when the fish were kept at 8℃ before slaughtering, but no significant effect of dietary
treatment were observed for salmon kept at 2 or 16℃. Neither acclimation
temperatures nor the dietary treatment had any significant effect on the gaping and
colour score. Within the 2℃ and 16℃ temperature treatment, a significantly firmer
texture (higher Fb) was observed for the glutamate diet. 16℃ acclimation temperature
resulted in a significantly lower pH both at 3 and 24 hours of storage, but not after 5
and 12 days of storage. The pH of the glutamate group acclimated to 2℃ had the
highest muscle pH three and 24 hours post-mortem, and the reduction rate of the pH
was slower for the arginine group kept at 8℃ before slaughter as compared with the
control group. Acclimation temperatures had an overall significant effect at 24 hours
storage for the activity of cathepsin B (lowest at 2℃), and there was also found a
significant effect at 0 hour for total activity of cathepsin B+L (highest at 8℃). The
cathepsin B activity was lowest at 0 hour for salmon fed the arginine or glutamate diet
at 2℃ acclimation temperature; whereas an inverse relationship was observed
between the acclimation temperature and the cathepsin L activity at 24 hours for the
salmon fed the arginine diet. High acclimation temperature accelerated ATP
degradation after slaughtering, but the content of hypoxanthine (Hx) was lowest for
salmon acclimated to 16℃ and highest for salmon acclimated to 2℃ after one week
storage. It is concluded that the dietary supplementation of arginine and glutamate had
positive effects on fillet contraction and texture, respectively. High acclimation
temperature reduced the accumulation of hypoxanthine during storage, indicating
prolonged freshness.
Keywords: Fish quality, Acclimation temperature, Amino acids, Rigor mortis, Gaping,
Colour, pH, Texture, Cathepsins, ATP breakdown products.

III
TABLE OF CONTENTS
ACKNOWLEDGEMENTS ........................................................................................... I
SUMMARY .................................................................................................................. II
TABLE OF CONTENTS ............................................................................................. III
LIST OF FIGURES ...................................................................................................... V
LIST OF TABLES ..................................................................................................... VII
1. INTRODUCTION .................................................................................................. 1
2. THEORETICAL BACKGROUND ....................................................................... 2
2.1 Fish quality ......................................................................................................... 2
2.2 Arginine and Glutamate ....................................................................................... 2
2.3 Live-chilling and pre-slaughter stress .................................................................. 5
3. MATERIALS AND METHODS ........................................................................... 7
3.1 Fish and facilities ................................................................................................. 7
3.2 Diets and feeding regimes .................................................................................... 7
3.3 Handling and Slaughtering ................................................................................... 8
3.4 Rigor development (right fillet side) .................................................................... 8
3.5 Fillet colour, texture and gaping (left fillet side) ................................................. 8
3.6 Muscle pH ............................................................................................................ 9
3.7 Cathepsins ............................................................................................................ 9
3.8 ATP breakdown products ................................................................................... 10
3.9 Statistical Analysis ............................................................................................. 10
4. RESULTS ............................................................................................................. 11
4.1 Body measurements ........................................................................................... 11
4.2 Selected free amino acids and metabolites ......................................................... 12
4.3 Fillet contraction ................................................................................................ 12
4.4 Gaping score ....................................................................................................... 16
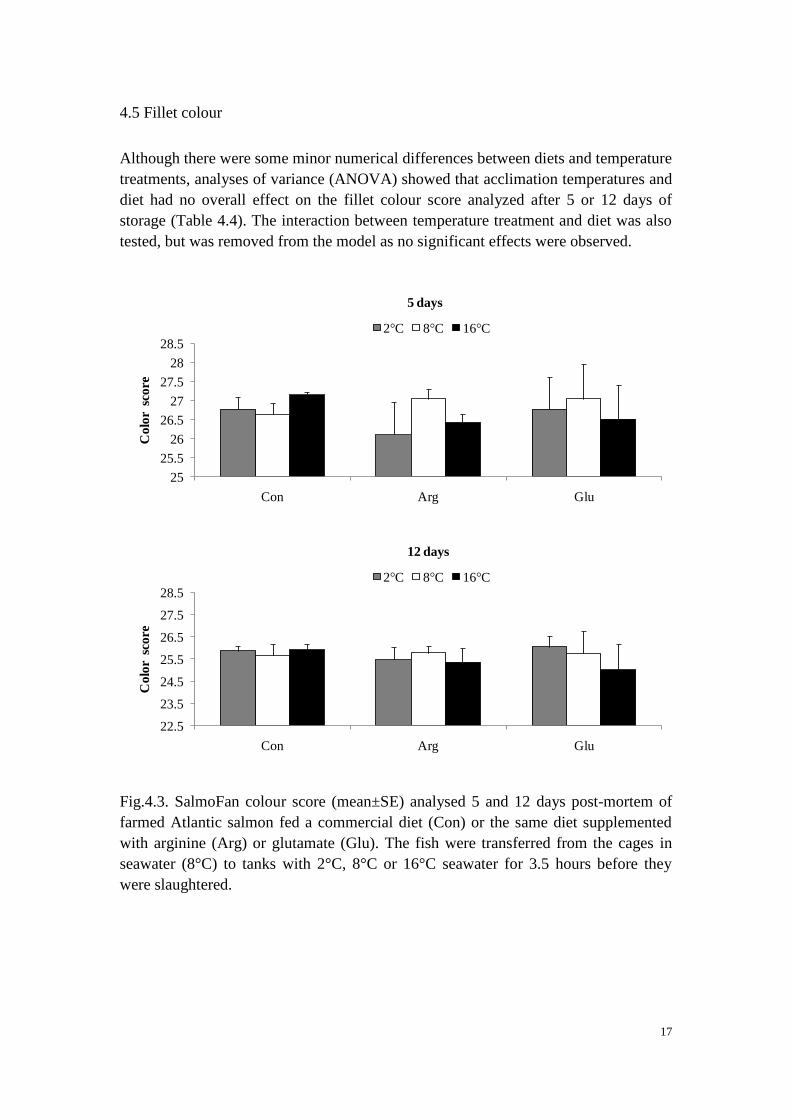
4.5 Fillet colour ........................................................................................................ 17
4.6 Texture analysis.................................................................................................. 18
4.7 Muscle pH .......................................................................................................... 19

IV
4.8 Cathepsins analysis ............................................................................................ 23
4.9 ATP breakdown products ................................................................................... 26
5. DISCUSSION ....................................................................................................... 30
5.1 Growth performance .......................................................................................... 30
5.2 Composition of fillets ........................................................................................ 30
5.3 Fillet contraction ................................................................................................ 30
5.4 Fillet gaping ....................................................................................................... 31
5.5 Fillet colour and pigmentation ........................................................................... 31
5.6 Texture analysis ................................................................................................. 32
5.7 Muscle pH .......................................................................................................... 32
5.8 Cathepsins activity ............................................................................................. 33
5.9 ATP breakdown products .................................................................................. 33
6 CONCLUSION .................................................................................................... 33
7. REFERENCES ..................................................................................................... 36

V
LIST OF FIGURES
Fig.2.1. Chemical structure of arginine.. ....................................................................... 3
Fig.2.2. Metabolism of the versatile arginine. Products with important roles in muscle
growth are in boxes. ....................................................................................................... 4
Fig.2.3. Chemical structure of glutamate. ...................................................................... 4
Fig.2.4. Metabolic fates of dietary glutamate in the intestine. ....................................... 5
Fig.2.5. Commercial slaughter line involving live-chilling. .......................................... 6
Fig.4.1. Development in rigor contraction (% of initial fillet length) during 24 hours
storage of farmed Atlantic salmon fed a commercial diet (Con) or the same diet
supplemented with arginine (Arg) or glutamate (Glu). The fish were transferred from
the cages in seawater (8°C) to tanks with seawater of 2°C (A), 8°C (B) or 16°C (C)
for 3.5 hours before they were slaughtered. Different letters denote significant
differences (p<0.05) between dietary treatments within temperature treatment. ........ 14
Fig.4.2. Gaping scores (0-5) during cold storage of fillets of farmed Atlantic salmon
fed a commercial diet (Con) or the same diet supplemented with arginine (Arg) or
glutamate (Glu). The fish were transferred from the cages in seawater (8°C) to tanks
with seawater of 2°C, 8°C or 16°C for 3.5 hours before they were slaughtered. ........ 16
Fig.4.3. SalmoFan colour score (mean±SE) analysed 5 and 12 days post-mortem of
farmed Atlantic salmon fed a commercial diet (Con) or the same diet supplemented
with arginine (Arg) or glutamate (Glu). The fish were transferred from the cages in
seawater (8°C) to tanks with 2°C, 8°C or 16°C seawater for 3.5 hours before they
were slaughtered. ......................................................................................................... 17
Fig.4.4. Fillet firmness measured as breaking force (N) 5 and 12 days post-mortem of
farmed Atlantic salmon fed a commercial diet (Con) or the same diet supplemented
with arginine (Arg) or glutamate (Glu). The fish were transferred from the cages in
seawater (8°C) to tanks with 2°C, 8°C or 16°C seawater for 3.5 hours before they
were slaughtered. Different letters denote significant differences (p<0.05) between
dietary treatments within temperature treatment. ........................................................ 18
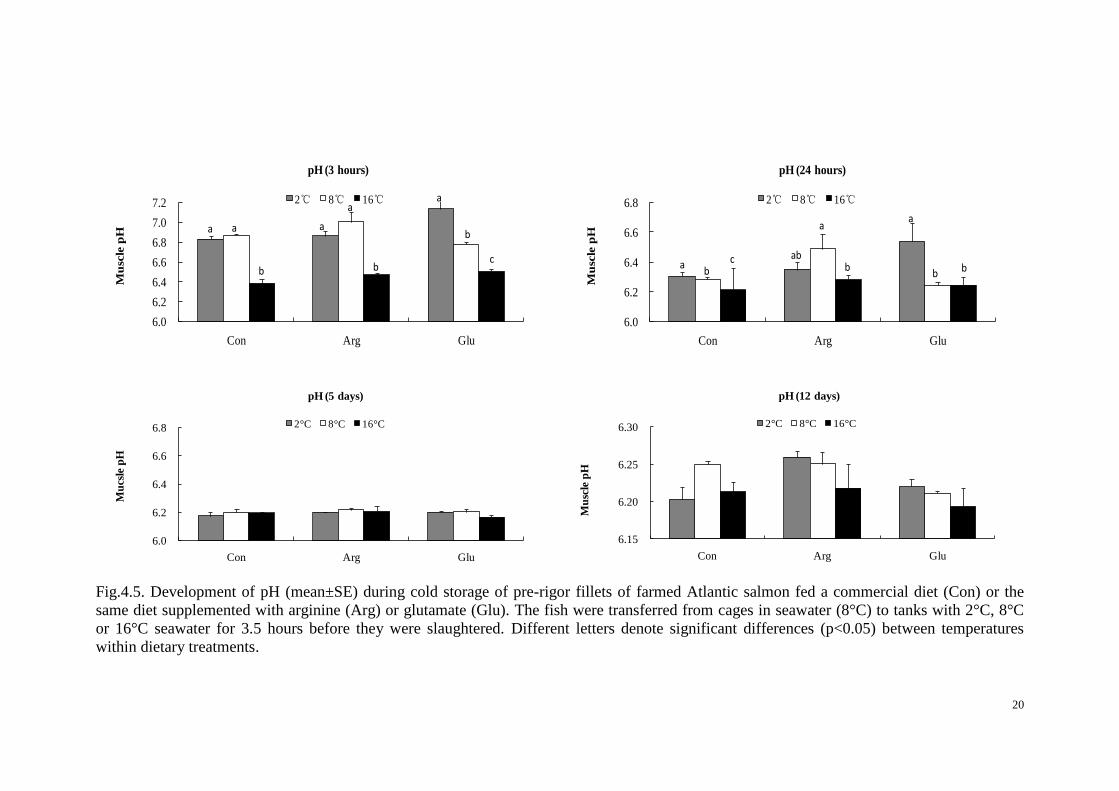
Fig.4.5. Development of pH (mean±SE) during cold storage of pre-rigor fillets of
farmed Atlantic salmon fed a commercial diet (Con) or the same diet supplemented
with arginine (Arg) or glutamate (Glu). The fish were transferred from cages in
seawater (8°C) to tanks with 2°C, 8°C or 16°C seawater for 3.5 hours before they
were slaughtered. Different letters denote significant differences (p<0.05) between
temperatures within dietary treatments. ....................................................................... 20
VI
Fig.4.6 Activity of cathepsin B, L and B+L (mean ± SE) 1h and 24hpost-mortem in
muscle of farmed Atlantic salmon fed a commercial diet (Con) or the same diet
supplemented with arginine (Arg) or glutamate (Glu). The fish were transferred from
cages in seawater (8°C) to tanks with 2°C, 8°C or 16°C seawater for 3.5 hours before
they were slaughtered. Different letters denote significant differences (p<0.05)
between temperature within diet. ................................................................................. 25
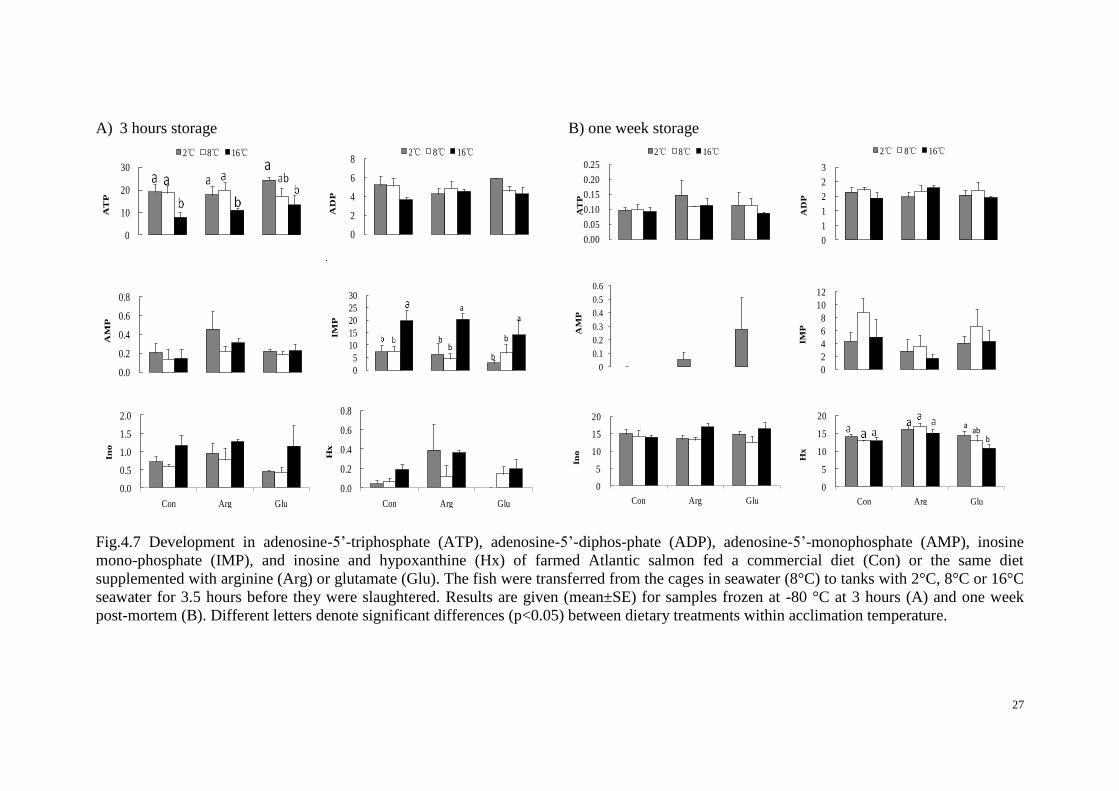
Fig.4.7 Development in adenosine-5’-triphosphate (ATP), adenosine-5’-diphos-phate
(ADP), adenosine-5’-monophosphate (AMP), inosine mono-phosphate (IMP), and
inosine and hypoxanthine (Hx) of farmed Atlantic salmon fed a commercial diet (Con)
or the same diet supplemented with arginine (Arg) or glutamate (Glu). The fish were
transferred from the cages in seawater (8°C) to tanks with 2°C, 8°C or 16°C seawater
for 3.5 hours before they were slaughtered. Results are given (mean±SE) for samples
frozen at -80 °C at 3 hours (A) and one week post-mortem (B). Different letters
denote significant differences (p<0.05) between dietary treatments within acclimation
temperature. ................................................................................................................. 27
VII
LIST OF TABLES
Table 3.1. Feed formulation and chemical composition. ............................................... 7
Table 3.2. An overview of the whole experimental design ........................................... 8
Table 4.1. Biometric parameters, pigment content and fat content in skeletal muscle of
farmed Atlantic salmon fed a commercial diet (Con) or the same diet supplemented
with arginine (Arg) or glutamate (Glu). ....................................................................... 11
Table 4.2.Content of selected free amino acids and metabolites in muscle of farmed
Atlantic salmon fed a commercial diet (Con) or the same diet supplemented with
arginine (Arg) or glutamate (Glu). ............................................................................... 12
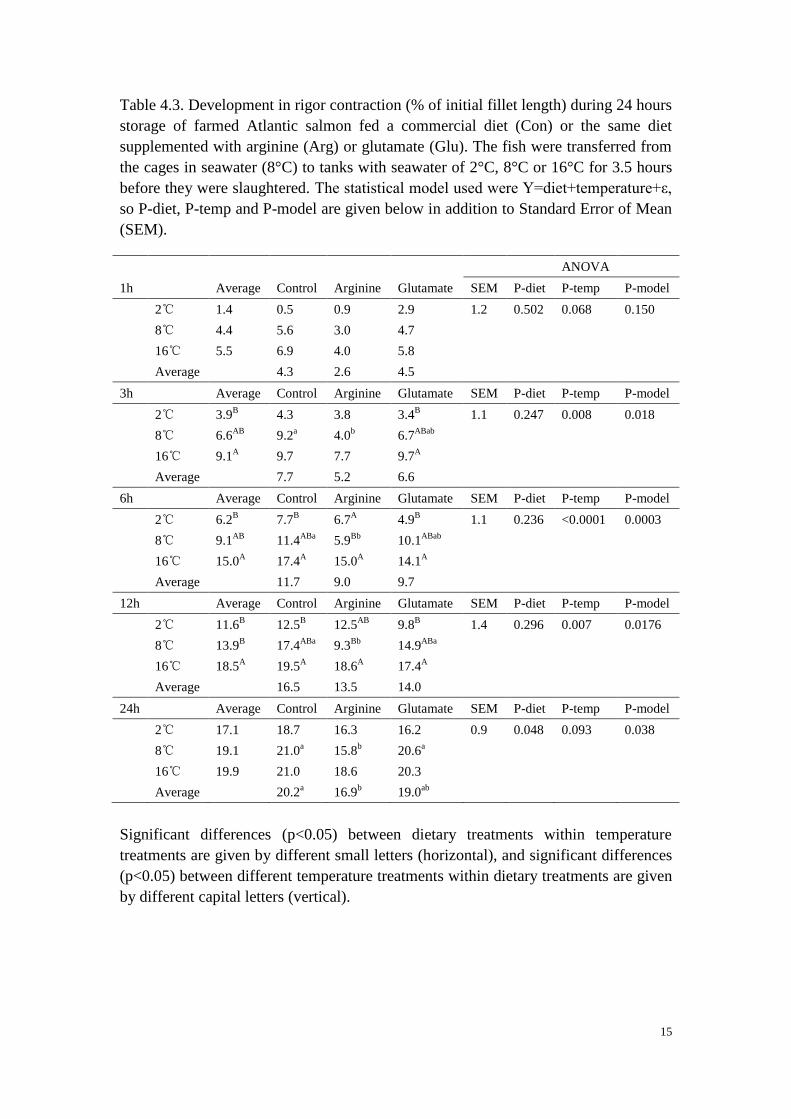
Table 4.3. Development in rigor contraction (% of initial fillet length) during 24 hours
storage of farmed Atlantic salmon fed a commercial diet (Con) or the same diet
supplemented with arginine (Arg) or glutamate (Glu). The fish were transferred from
the cages in seawater (8°C) to tanks with seawater of 2°C, 8°C or 16°C for 3.5 hours
before they were slaughtered. The statistical model used were Y=diet+temperature+ε,
so P-diet, P-temp and P-model are given below in addition to Standard Error of Mean
(SEM). .......................................................................................................................... 15
Table 4.4. Fillet gaping analysed 24 hours and 5 days post-mortem, and colour and
texture, analysed 5 and 12 days post-mortem of farmed Atlantic salmon fed a
commercial diet (Con) or the same diet supplemented with arginine (Arg) or
glutamate (Glu). The fish were transferred from cages in seawater (8°C) to tanks with
either 2°C, 8°C or 16°C seawater for 3.5 hours before harvesting. Results from
ANOVA (model Y=diet+temperature+ε) are presented as P-values for each parameter
and for the total model. SEM referres to Standard Error of Mean. ............................. 21
Table 4.5. pH analysed after 3 and 24 hours, 5 and 12 days post-mortem of farmed
Atlantic salmon fed a commercial diet (Con) or the same diet supplemented with
arginine (Arg) or glutamate (Glu). The fish were transferred from the cages in
seawater (8°C) to tanks with either 2°C, 8°C or 16°C seawater for 3.5 hours before
harvesting. Results from ANOVA (model Y=diet+temperature+ε) are presented as
P-values for each parameter and for the total model. SEM referres to Standard Error
of Mean. ....................................................................................................................... 22
Table 4.6 Development of activity of cathepsin B, L and B+L during 24 hours storage
of farmed Atlantic salmon fed a commercial diet (Con) or the same diet supplemented
with arginine (Arg) or glutamate (Glu). The fish were transferred from cages in
seawater (8°C) to tanks with either 2°C, 8°C or 16°C seawater for 3.5 hours before
VIII
harvesting. Results from ANOVA (model Y=diet+temperature+ε) are presented as
P-values for each parameter and for the total model. .................................................. 25
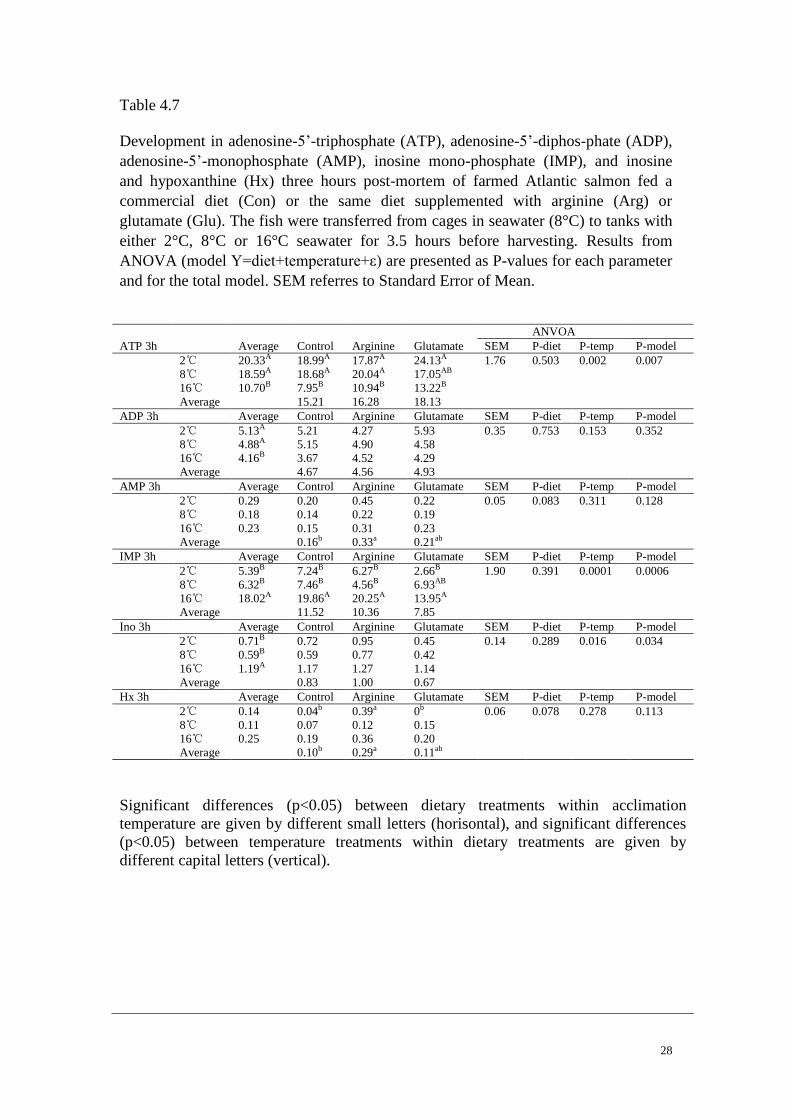
Table 4.7 ...................................................................................................................... 28
Development in adenosine-5’-triphosphate (ATP), adenosine-5’-diphos-phate (ADP),
adenosine-5’-monophosphate (AMP), inosine mono-phosphate (IMP), and inosine
and hypoxanthine (Hx) three hours post-mortem of farmed Atlantic salmon fed a
commercial diet (Con) or the same diet supplemented with arginine (Arg) or
glutamate (Glu). The fish were transferred from cages in seawater (8°C) to tanks with
either 2°C, 8°C or 16°C seawater for 3.5 hours before harvesting. Results from
ANOVA (model Y=diet+temperature+ε) are presented as P-values for each parameter
and for the total model. SEM referres to Standard Error of Mean. ............................. 28
Table 4.8 ...................................................................................................................... 29
Development in adenosine-5’-triphosphate (ATP), adenosine-5’-diphos-phate (ADP),
adenosine-5’-monophosphate (AMP), inosine mono-phosphate (IMP), and inosine
and hypoxanthine (Hx) one week post-mortem of farmed Atlantic salmon fed a
commercial diet (Con) or the same diet supplemented with arginine (Arg) or
glutamate (Glu). The fish were transferred from cages in seawater (8°C) to tanks with
either 2°C, 8°C or 16°C seawater for 3.5 hours before harvesting. Results from
ANOVA (model Y=diet+temperature+ε) are presented as P-values for each parameter
and for the total model. SEM referres to Standard Error of Mean. ............................. 29

1
1. INTRODUCTION
Aquaculture is the fastest growing animal food producing sector in the world, with a
per capita supply from aquaculture increasing from 0.7 kg in 1970 to 7.8 kg in 2008.
It is documented that aquaculture accounted for 46 percent of total food fish supply in
2008 (FAO, 2010).
Atlantic salmon is the dominating specie farmed in Norway. Production in 2009 was
reported to increase to 8.6 million tons, compared to a production of below 1.5
million tons in the year of 1990 (Statistics Norway, 2010). Among this, 6.9 million
tons were exported from Norway to 96 countries with a value of 23.7 billion in 2009
(Statistics Norway, 2010). Gutted salmon was the largest export product. However,
export of salmon fillets has increased year by year, for example, in 2009, export of
Norwegian Salmon fillets increased to NOK 4.5 billion, and this means that the share
increased from 13.7% in 2008 to 19% in 2009. The industry may face new challenges
if the fillets will take over the export of gutted salmon, for example soft texture, fillet
gaping and deviating appearance are the main problems when it comes to fillets.
Fillet quality can be affected by several factors, such as breeding, diet, slaughter
procedure, storage etc. To improve the meat quality of salmon, several dietary
supplementations are usually added in the normal feeds. Some amino acids and their
metabolites were reported to be crucial for maintenance, growth, feed intake, nutrient
utilization, immunity, behavior, reproduction, as well as resistance to environmental
stressors and pathogenic organisms in various fishes (Chen et al., 1992; Li et al., 2009;
Lin and Xiao, 2006). However, no information is available on the effect on fish
quality by supplementing arginine and glutamate in diets for slaughter sized Atlantic
salmon.
Nowadays, live salmon are usually transferred to a chilling tank in 1℃ refrigerated
seawater prior to anaesthesia. Chilling prior to slaughter will produce a beneficial low
muscle temperature and remove substantial thermal energy. The low temperature at
slaughter has positive effect on rigor development and is reported to be delay time to
onset of rigor (Lowe et al., 1993; Skjervold et al., 2001a). However, no previous
studies have reported the effect on rigor development and subsequent fillet quality of
salmon kept at temperature above their rearing temperature and the interaction
between dietary composition and acclimation temperature.
The aim of the present study was to investigate the impact of dietary composition and
acclimation temperature before slaughter on fillet quality development of farmed
Atlantic salmon (Salmo salar L.). Arginine and glutamate were separately added to a
standard extruded diet to a level above normal requirements. The fish were transferred
from net pens in seawater to small tanks on land at different temperature (2, 8, 16℃)
for 210 minutes before slaughtering. Fillet contraction, gaping, colour, fillet texture,
muscle pH, cathepsins and ATP degradation products were analyzed at regular
intervals during cold storage, up to 12 days.
2
2. THEORETICAL BACKGROUND
The chapter consists of three main sections. The first section gives a general
introduction and discussion of fish quality. The second section focuses mainly on the
amino acids: arginine and glutamate, whereas the third section includes live-chilling
and pre-slaughter stress.
2.1 Fish quality
According to the standard ISO 8402:1994, quality is defined as ―the totality of
features and characteristics of a product or service that bear on its ability to satisfy
stated or implied needs‖. A similar definition was also given by a book on the
knowledge status of Norwegian aquaculture research: ―supply of a product according
to the demand and specifications of the customer‖ (Thomassen et al., 2007).
The term quality in fish is frequently categorized into five subcategories: sensory
quality, nutritional quality, hygienic quality, technological quality, and ethical quality.
Main quality parameters for raw salmon are slaughter and filleting yield, fillet fat
content, colour, texture, and gaping. Several methods are used to determine the
quality of fish. These can be classified into sensory (Borderias et al., 2007;
Sveinsdottir et al., 2003), instrumental (Casas et al., 2006; Macagnano et al., 2005)
and chemical methods (Kent et al., 2004; Rodríguez-Jérez et al., 2000).
Fillet texture is one of the most important quality parameters in fish. It is a sensory
characteristic for the consumer and also an important attribute for the mechanical
processing of fillets. Consumers generally prefer firm and elastic fish fillets. Hence, in
contrast to mammalian meat where tenderization is a main focus, soft flesh is a
challenge with fish meat because of the low content of connective tissue in the muscle
(Hall, 1997).
Atlantic salmon fillet quality can be influenced by numerous factors and is affected
throughout the entire value chain. These include breeding (Gjedrem, 1997), genetics
(Gjøen, 1997; Gjedrem and Skjervold, 1978), feed composition (Aksnes, 1995; Einen,
1999; Hillestad and Johnsen, 1994; Øverland et al., 2009; Refstie, 1998), feeding
regime (Sveier, 1998; Young et al., 2005), seasonal variations (Mørkøre, 2001),
transportation, handling and pre-slaughter stress (Erikson et al., 1997a; Sigholt et al.,
1997), storage time and temperature post-mortem (Erikson et al., 1997a; Sigholt et al.,
1997; Skjervold et al., 2001a), processing (Kong et al., 2007), and cooking (Yagiza et
al., 2009).
2.2 Arginine and Glutamate
3
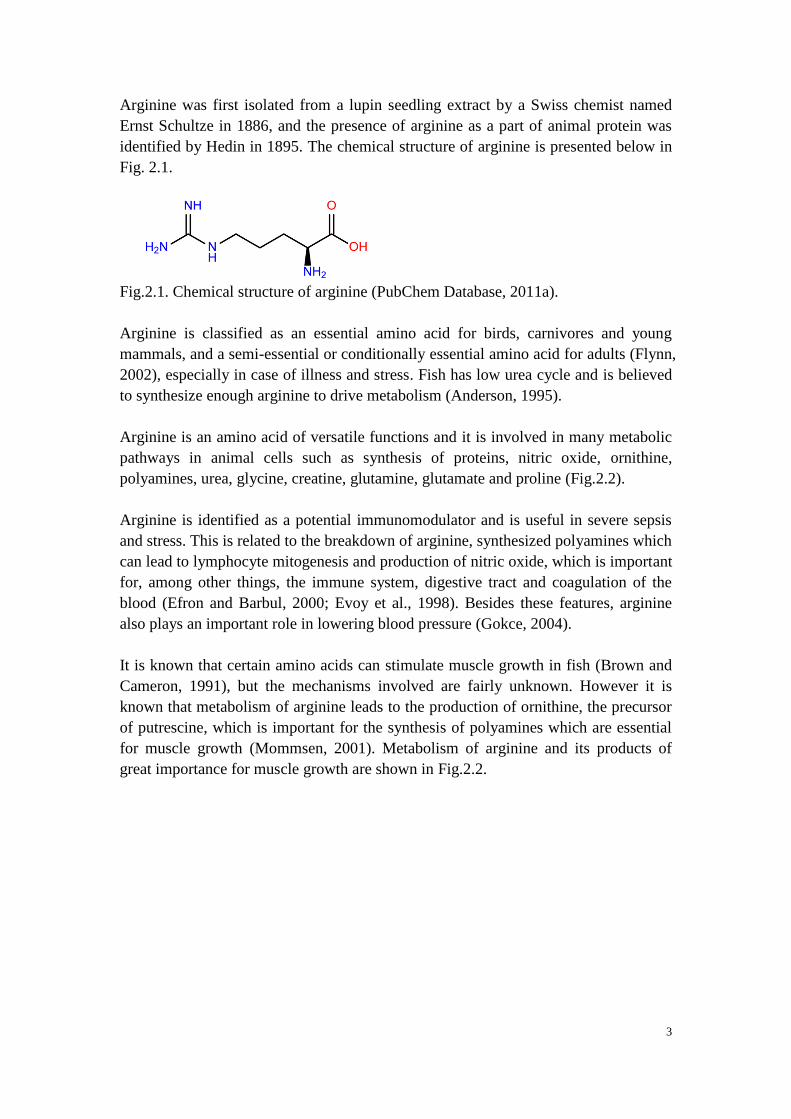
Arginine was first isolated from a lupin seedling extract by a Swiss chemist named
Ernst Schultze in 1886, and the presence of arginine as a part of animal protein was
identified by Hedin in 1895. The chemical structure of arginine is presented below in
Fig. 2.1.
Fig.2.1. Chemical structure of arginine (PubChem Database, 2011a).
Arginine is classified as an essential amino acid for birds, carnivores and young
mammals, and a semi-essential or conditionally essential amino acid for adults (Flynn,
2002), especially in case of illness and stress. Fish has low urea cycle and is believed
to synthesize enough arginine to drive metabolism (Anderson, 1995).
Arginine is an amino acid of versatile functions and it is involved in many metabolic
pathways in animal cells such as synthesis of proteins, nitric oxide, ornithine,
polyamines, urea, glycine, creatine, glutamine, glutamate and proline (Fig.2.2).
Arginine is identified as a potential immunomodulator and is useful in severe sepsis
and stress. This is related to the breakdown of arginine, synthesized polyamines which
can lead to lymphocyte mitogenesis and production of nitric oxide, which is important
for, among other things, the immune system, digestive tract and coagulation of the
blood (Efron and Barbul, 2000; Evoy et al., 1998). Besides these features, arginine
also plays an important role in lowering blood pressure (Gokce, 2004).
It is known that certain amino acids can stimulate muscle growth in fish (Brown and
Cameron, 1991), but the mechanisms involved are fairly unknown. However it is
known that metabolism of arginine leads to the production of ornithine, the precursor
of putrescine, which is important for the synthesis of polyamines which are essential
for muscle growth (Mommsen, 2001). Metabolism of arginine and its products of
great importance for muscle growth are shown in Fig.2.2.

4
Fig.2.2. Metabolism of the versatile arginine. Products with important roles in muscle
growth are in boxes (Mommsen, 2001).
Glutamate
Glutamate was discovered and identified by the German chemist Karl Heinrich
Leopold Ritthausen in 1866, by the hydrolysis of gluten from wheat. The chemical
structure of glutamate is presented in Fig.2.3.
Fig.2.3. Chemical structure of glutamate (PubChem Database, 2011b).

5
Glutamate is considered as a non-essential amino acid, meaning that the body can
synthesize sufficient quantities from other sources. Like other amino acids, glutamate
is absorbed and metabolized in the small intestine (Burrin and Stoll, 2009). Glutamate
is converted first to alanine in the intestine, then to glucose and eventually to lactate in
the liver. Glutamate is an important bridge between the urea cycle and the Krebs cycle
in mammals (Wu, 2009), and it is also the precursor for several other amino acids
including alanine, aspartate, ornithine, arginine, proline and biologically active
molecules such as glutathione (Fig. 2.4). Of amino acids formed from glutamate,
proline is important in the synthesis of collagen and connective tissue (Tapiero et al.,
2002).
Glutamate also has a number of important functions in living cells. The dominant role
of glutamate is as an oxidative fuel in the intestinal mucosa and is responsible for
maintenance and protection of the mucus layer (Blachier et al., 2009; Blachier et al.,
1995; Burrin and Stoll, 2009). Glutamate is also related to the function of the central
nervous system as a key neurotransmitter (Meldrum, 2000; Nedergaard et al., 2002).
Relatively few studies have been done about glutamate and its effects in fish, but
glutamate has been shown to affect steroidogenesis in rainbow trout (Leatherland et
al., 2004; Leatherland et al., 2005). In addition, glutamate is essential for control of
ammonia in plasma and tissues of fish - glutamine is formed from glutamate and
ammonia by an increase in ammonia, for example, brain tissue (Vedel et al., 1998;
Wicks and Randall, 2002). Furthermore, studies have shown that glutamate is
involved in contraction and depolarisation in crustacean muscle (Colton, 1975;
Robbins, 1959).
Fig.2.4. Metabolic fates of dietary glutamate in the intestine (Burrin and Stoll, 2009).
2.3 Live-chilling and pre-slaughter stress
The rearing temperature has large effects on the metabolic rates in the living fish
(Brett, 1971; Guderley, 2004), the enzyme activity (Matschak et al., 1998) and also

6
the fluidity of biological membranes (Hazel, 1995; McElhaney, 1976; Wodtke, 1981).
Furthermore, the storage temperature is accepted as being the major factor influencing
the rate of post-mortem deterioration and shelf life of fish products (Erikson et al.,
1997a; Himelbloom et al., 1994; Kiessling et al., 2006; Stien et al., 2005).
In Norwegian aquaculture, live salmon are often transferred to a chilling tank with
refrigerated seawater of approximately 1℃ for 40-60 minutes prior to anaesthesia
(Fig. 2.5). The chilled temperature effect will to some extent depend on the rearing
temperature (∆℃), but in general the refrigerated seawater temperature results in less
vigorous body movements and also removal of substantial thermal energy from the
fish body (Crapo and Elliot, 1987; Skjervold et al., 2001a).
Stress might be defined as a biochemical and physiological process associated with
maintaining homeostasis. A stress response will normally consist of a primary release
of several hormones into the bloodstream (Einarsdóttir and Nilssen, 1996; Rotllant
and Tort, 1997). Furthermore, a wide range of secondary changes will be evoked in
behavior, metabolism, respiration, osmotic regulation, the immune system, and in
other elements of the endocrine system (Einarsdóttir and Nilssen, 1996).
Handling, transportation and crowding before slaughter of farmed salmon is known to
be a significant stressor affecting blood plasma levels of for example cortisol, glucose,
lactate, and osmolality (Einarsdóttir and Nilssen, 1996).
The effects of pre-slaughter stress on meat properties are mainly depending on the
extent to which muscle metabolites are depleted before death. The majority of salmon
flesh is white muscle, adapted to anaerobic metabolism. The effect of anaerobic
metabolism is a depletion of glycogen reserves and an accumulation of lactic acid
with a corresponding pH reduction. Low muscle pH is known to have several negative
effects on fillet quality characteristics such as texture and water holding capacity
(Hufflonergan and Lonergan, 2005; Kramer and Peters, 2007).
Progression of rigor mortis in fish meat is used as an indicator of pre-mortem stress.
The pre-slaughter stress due to for example crowding results in earlier onset and a
stronger maximum rigor contraction (Skjervold, 1999).
Fig.2.5. Commercial slaughter line involving live-chilling (Skjervold et al., 2002).

7
3. MATERIALS AND METHODS
3.1 Fish and facilities
The fish used in this experiment were Atlantic salmon (Salmo salar L.), obtained
from Salmar ASA. The feeding trial was done at Nofima Marine seawater research
station at Averøy at the northwest coast of Norway. All fish with initial weight of 105
g were randomly distributed to 9 net-pens (triplicate cages each with 500 fish) of 125
m3 each in May 2009.
3.2 Diets and feeding regimes
The dietary treatments consisted of a control diet and two experimental diets
supplemented with 1.5% arginine (Fenchem Biotech Ltd., Nanjing, China) or 1.5%
L-glutamate (Meihua Holding Group Co, Ltd., Hebei, China) separately. The
formulation and composition of diets are given in table 3.1. The commercial extruded
dry feed was produced at Skretting (Stavanger, Norway). The three diets were fed to
triplicate cages of fish during the period from May 2009 to May 2010 when the fish
were harvested for this experiment. The fish were fed in excess of recorded feed
intake four times per day (uneaten feed pellets were collected and weighed).
Table 3.1. Feed formulation and chemical composition.
Diet
Formulation,%
Fish meal (Superprime) 37
Hi Pro Soy (48%) 3.5
Soy protein concentrate ( Imcopa SPC) 10
Sunflower expeller 1.6
Beans 17
Standard fish oil 15.5
Rapeseed Oil 14
Vitamin and mineral premix 0.32
Chemical composition,%
Dry matter,% 92.9
Fat,% 35.1
Protein,% 35.3
Starch,% 7.6
Ash,% 5.4
Indigestible carbohydrate,% 9.5
Astaxanthin, mg / kg 40
Energy content, MJ 25.1

8
3.3 Handling and Slaughtering
Three fish from each net-pen were tagged and transferred to three 1000L tanks for
further treatment. The tanks were variable in temperature (2, 8, 16℃) and each tank
had 9 fish from three diets (three fish per net pen). The salmon were kept for 210
minutes in the tanks before slaughtering. The oxygen level (9 mg/L) and temperature
were monitored at a constant level.
The fish were killed by a sharp blow to the head. Thereafter the fish were gill cut and
bled in seawater for 20 minutes prior to being gutted and filleted. Fillets were kept on
ice for further analysis. An overview of the whole experimental design is given in
table 3.2.
Table 3.2. An overview of the whole experimental design
Diet
n Control Glutamate Arginine 0 day 5 days 12 days
Tem
p.
2℃ 9 3 3 3 →→ Rigor
contraction
Analysis Analysis
8℃ 9 3 3 3 →→
16℃ 9 3 3 3 →→
Number of fish 27 9 9 9
3.4 Rigor development (right fillet side)
Rigor development was recorded on 27 right side pre-rigor fillets during 24 hours.
Fillets were placed on smooth plastic trays (to allow free contraction) and kept on ice
in Styrofoam boxes in a cold room (5℃). The rigor contraction rate was evaluated by
measuring the change in fillet length (cm).
3.5 Fillet colour, texture and gaping (left fillet side)
The area above the lateral line was photographed by a digital camera (Dolphin F145C,
Allied Vision Technologies, Stadtroda, Germany) in a box with standard illumination.
The camera was placed on the top of the box and operated through a computer. Each
pixel within the image was represented by RGB signals from red (R), green (G) and
blue (B) channels of the camera with the RGB signals recording values between 0
(dark) and 255 (light). Results were transcribed to correspond to visual colour score
(Roche Salmo Colour Fan TM), pigment content and fillet fat content, as described by
Folkestad (Folkestad et al., 2008).
9
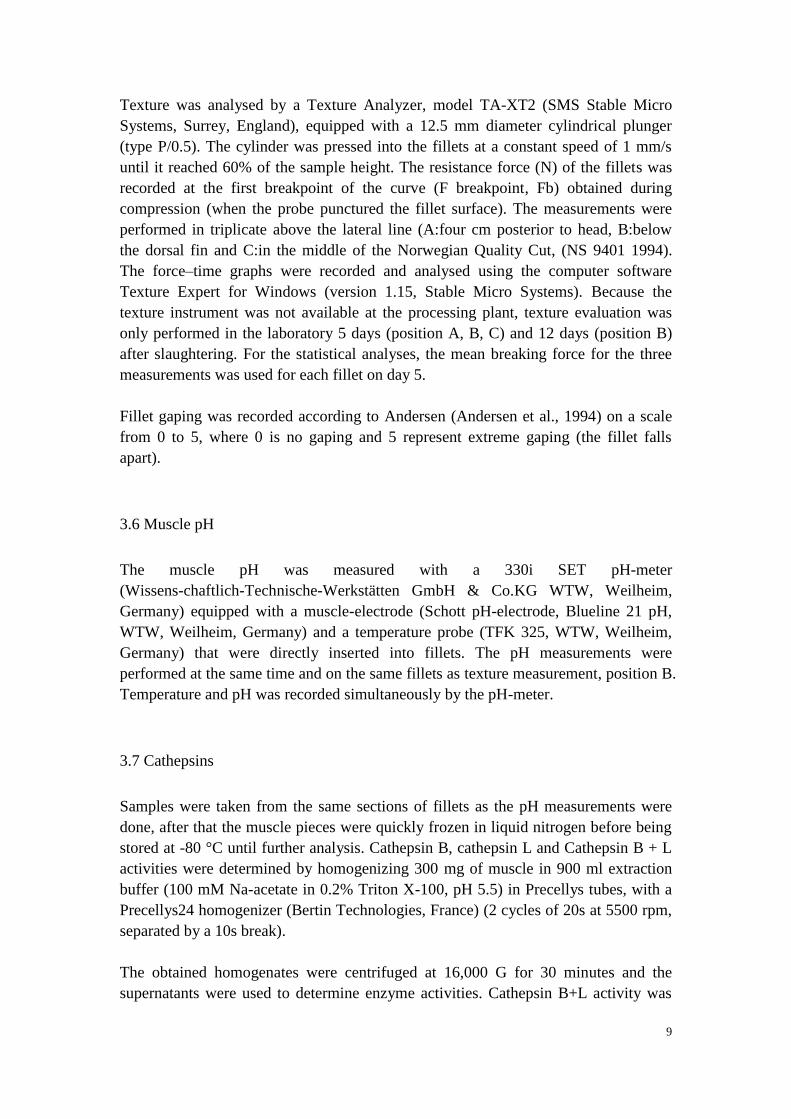
Texture was analysed by a Texture Analyzer, model TA-XT2 (SMS Stable Micro
Systems, Surrey, England), equipped with a 12.5 mm diameter cylindrical plunger
(type P/0.5). The cylinder was pressed into the fillets at a constant speed of 1 mm/s
until it reached 60% of the sample height. The resistance force (N) of the fillets was
recorded at the first breakpoint of the curve (F breakpoint, Fb) obtained during
compression (when the probe punctured the fillet surface). The measurements were
performed in triplicate above the lateral line (A:four cm posterior to head, B:below
the dorsal fin and C:in the middle of the Norwegian Quality Cut, (NS 9401 1994).
The force–time graphs were recorded and analysed using the computer software
Texture Expert for Windows (version 1.15, Stable Micro Systems). Because the
texture instrument was not available at the processing plant, texture evaluation was
only performed in the laboratory 5 days (position A, B, C) and 12 days (position B)
after slaughtering. For the statistical analyses, the mean breaking force for the three
measurements was used for each fillet on day 5.
Fillet gaping was recorded according to Andersen (Andersen et al., 1994) on a scale
from 0 to 5, where 0 is no gaping and 5 represent extreme gaping (the fillet falls
apart).
3.6 Muscle pH
The muscle pH was measured with a 330i SET pH-meter
(Wissens-chaftlich-Technische-Werkstätten GmbH & Co.KG WTW, Weilheim,
Germany) equipped with a muscle-electrode (Schott pH-electrode, Blueline 21 pH,
WTW, Weilheim, Germany) and a temperature probe (TFK 325, WTW, Weilheim,
Germany) that were directly inserted into fillets. The pH measurements were
performed at the same time and on the same fillets as texture measurement, position B.
Temperature and pH was recorded simultaneously by the pH-meter.
3.7 Cathepsins
Samples were taken from the same sections of fillets as the pH measurements were
done, after that the muscle pieces were quickly frozen in liquid nitrogen before being
stored at -80 °C until further analysis. Cathepsin B, cathepsin L and Cathepsin B + L
activities were determined by homogenizing 300 mg of muscle in 900 ml extraction
buffer (100 mM Na-acetate in 0.2% Triton X-100, pH 5.5) in Precellys tubes, with a
Precellys24 homogenizer (Bertin Technologies, France) (2 cycles of 20s at 5500 rpm,
separated by a 10s break).
The obtained homogenates were centrifuged at 16,000 G for 30 minutes and the
supernatants were used to determine enzyme activities. Cathepsin B+L activity was
10
measured fluorimetrically, according to the method of Kirschke (Kirschke et al.,
1983).N-CBZ-Lphenylalanyl-L-arginine-7-amido-4-methylcoumarin(Z-Phe-Arg-Nme
c) was used as a substrate for cathepsin B+L and
N-CBZ-L-arginyl-L-arginine-7-amido-4-methylcoumarin (Z-Arg-Arg-Nmec) for
cathepsin B. Cathepsin L activity was obtained subtracting the result of cathepsin B
activity from the result of cathepsin B + L activity. In all cases, the assays were run in
triplicates for all cathepsin measurements.
3.8 ATP breakdown products
Muscle sections were sampled and frozen at -80℃ until further analyses of
adenosine-5-triphosphate(ATP),adenosine-5-diphos-phate(ADP),adenosine-5-monoph
osphate (AMP), inosine mono-phosphate (IMP), and inosine and hypoxanthine (Hx)
were conducted. The samples (0.200±0.005 g) were extracted by mixing freeze-dried
tissue in ice-cold 8% HClO4 (2.5ml) for 30 minutes before centrifugation. Tubes were
centrifuged for 10 minutes at 4000 rpm and 10°C. The supernatant were then
transferred to 2 ml micro tube and centrifuged in eppendorf centrifuge at 14 000 rpm
and 10°C. The supernatant (1ml) was added with 3M K2CO3 (0.3ml) for neutralization,
centrifuged for 10 minutes, and finally filtrated (0.45µm filter) through syringe filter.
ATP and degradation products were analysed by HPLC in a Waters Alliance liquid
chromatograph system (2695) equipped with a photodiode array detector (2996). The
analysis were performed on a silica column xTerraTM
MS C18,5 4.6 mm×250 mm)
with guard column XTerra MC18,5 3.9 mm×20 mm. The injection volume was 10µl.
The mobile phase used for the separation of nucleotides consisted of two eluents. A:
acetonitrile and B: 50 mm phosphate buffer with 10 mm CH3 (CH2)3]4 NBr (pH 7.0)
as a gradient. The flow rate and temperature were 1.5 ml min/l and 30℃, respectively.
3.9 Statistical Analysis
Data were analysed by ANOVA using the SAS program (Version 9.2; SAS Institute
Inc., Cary, USA). The alpha level was set to 5% (P < 0.05).

11
4. RESULTS
The results are presented for the following parameters: body measurements, free
amino acids and metabolites in skeletal muscle, fillet contraction, gaping score, colour,
texture, muscle pH, cathepsins activity and also ATP breakdown products. Results for
the contraction rate and fillet quality parameters are in general presented first with
regard to the overall effect of diet and temperature, and thereafter with regard to the
effect of temperature and diet separately.
4.1 Body measurements
The average final body weight of the Atlantic salmon was 3.03 kg, 3.07 kg and 3.03
kg for the control, arginine and glutamate group, respectively. The liver comprised
0.88-0.99% of the body weight. The average pigment content was 7 mg/kg and the
fillet fat content was 17-17.1% on average. The slaughter parameters showed no
significant variation between the dietary groups (Table 4.1).
Table 4.1. Biometric parameters, pigment content and fat content in skeletal muscle of
farmed Atlantic salmon fed a commercial diet (Con) or the same diet supplemented
with arginine (Arg) or glutamate (Glu).
ANOVA
Sampling Con Arg Glu SEM P-value
Body weight, kg 3.03 3.07 3.03 0.08 0.889
Gutted body weight, kg 2.67 2.70 2.66 0.07 0.898
Body length, cm 60.3 60.6 59.8 0.66 0.698
Condition factor 1 1.22 1.22 1.24 0.05 0.748
Fillet weight, kg 0.95 0.94 0.93 0.03 0.466
Fillet length, cm 35.2 34.3 34.3 0.50 0.883
Liver index 2 0.99
a 0.88
b 0.91
b 0.03 0.014
Pigment content, mg/kg 7.0 7.0 7.0 0.30 0.982
Fat content, % 17.1 17.1 17.0 0.30 0.851
Results are shown as mean per 3 net pens (n=10 per net pen). SEM refers to Standard
Error of Mean.
1 Condition factor = 100 × gutted body weight (g) × body length (cm)
-3
2 Liver index = 100 × liver weight (g) × whole body weight (g)
-1

12
4.2 Selected free amino acids and metabolites
The arginine and urea content were significantly highest in the muscle of the Atlantic
salmon fed with the diet supplemented with arginine. Glutamate, glutamine and
taurine showed no significant differences between the dietary treatments.
Table 4.2.Content of selected free amino acids and metabolites in muscle of farmed
Atlantic salmon fed a commercial diet (Con) or the same diet supplemented with
arginine (Arg) or glutamate (Glu).
ANOVA
Sampling Con Arg Glu SEM P-value
Arginine 14.3b
23.4a
11.2b
2.97 0.016
Glutamate 91.3 92.2 93.7 2.87 0.840
Glutamine 45.5 46.6 38.1 3.59 0.202
Taurin 80.8 68.2 74.4 4.87 0.203
Urea 50.9b
67.0a
48.5b
3.54 0.001
Results are shown as mean values for each diet from triplicate net pens, 10 salmon
from each net pen. SEM referres to Standard Error of Mean.
Different letters denote significant differences (p<0.05) between different dietary
treatments.
4.3 Fillet contraction
Analyses of variance (ANOVA) of the overall effect of diet and temperature on the
fillet contraction rate (% of initial fillet length) showed that acclimation temperatures
had a significant effect on the fillet contraction from 3-12 hours storage, whereas the
dietary treatment had a significant effect on the fillet contraction at 24 hours storage
(Table 4.3). The acclimation temperature also tended to influence the contraction at
one hour storage (P=0.068) and at 24 hour storage (P=0.093). The interaction between
temperature treatment prior to slaughtering and dietary treatment was also tested, but
was removed from the model as no significant effects were observed.
Temperature
A contraction of 5-6% was reached after 1 hour of storage for salmon kept at 16℃
before slaughter, whereas the same contraction was reached after 3 and 6 hours for the
salmon kept at 8℃ and 2℃ acclimation temperature, respectively. At 6 hours of
storage time, the contraction of the 16℃ group averaged 15% which was 1.7 times
higher than the 8℃ group (9.1% contraction) and 2.4 times higher compared with the
2℃ group (6.2% contraction). The maximum contraction at 24 hours of storage was
17.1, 19.1 and 19.9% for the 2℃, 8℃ and 16℃ group, respectively.

13
Diet
Significant effect of diet was observed only for fillets from salmon kept at acclimation
temperature of 8 ℃. The salmon fed the arginine diets had significantly lowest
contraction at 3, 6, 12 and 24 hours of storage, which was 5.2, 9.0, 13.5, 16.9%,
respectively (Fig. 4.1).

14
Fig.4.1. Development in rigor contraction (% of initial fillet length) during 24 hours storage of farmed Atlantic salmon fed a commercial
diet (Con) or the same diet supplemented with arginine (Arg) or glutamate (Glu). The fish were transferred from the cages in seawater
(8°C) to tanks with seawater of 2°C (A), 8°C (B) or 16°C (C) for 3.5 hours before they were slaughtered. Different letters denote
significant differences (p<0.05) between dietary treatments within temperature treatment.
0
5
10
15
20
25
1h 3h 6h 12h 24h
Fil
let
con
tracti
on
(%
)
Time post-mortem
Rigor 2 ℃
Con
Arg
Glu
0
5
10
15
20
25
1h 3h 6h 12h 24h
Fil
let
con
tracti
on
(%
)
Time post-mortem
Rigor 8 ℃
Con
Arg
Glu
a
ab
b
a
ab
b
a
a
b
a
a
b
0
5
10
15
20
25
1h 3h 6h 12h 24h
Fil
let
con
tracti
on
(%
)
Time post-mortem
Rigor 16 ℃
Con
Arg
Glu
15
Table 4.3. Development in rigor contraction (% of initial fillet length) during 24 hours
storage of farmed Atlantic salmon fed a commercial diet (Con) or the same diet
supplemented with arginine (Arg) or glutamate (Glu). The fish were transferred from
the cages in seawater (8°C) to tanks with seawater of 2°C, 8°C or 16°C for 3.5 hours
before they were slaughtered. The statistical model used were Y=diet+temperature+ε,
so P-diet, P-temp and P-model are given below in addition to Standard Error of Mean
(SEM).
ANOVA
1h Average Control Arginine Glutamate SEM P-diet P-temp P-model
2℃ 1.4 0.5 0.9 2.9 1.2 0.502 0.068 0.150
8℃ 4.4 5.6
3.0 4.7
16℃ 5.5 6.9 4.0 5.8
Average 4.3 2.6 4.5
3h Average Control Arginine Glutamate SEM P-diet P-temp P-model
2℃ 3.9B
4.3 3.8 3.4B
1.1 0.247 0.008 0.018
8℃ 6.6AB
9.2a
4.0b
6.7ABab
16℃ 9.1A
9.7 7.7 9.7A
Average 7.7 5.2 6.6
6h Average Control Arginine Glutamate SEM P-diet P-temp P-model
2℃ 6.2B
7.7B
6.7A
4.9B
1.1 0.236 <0.0001 0.0003
8℃ 9.1AB
11.4ABa
5.9Bb
10.1ABab
16℃ 15.0A
17.4A
15.0A
14.1A
Average 11.7 9.0 9.7
12h Average Control Arginine Glutamate SEM P-diet P-temp P-model
2℃ 11.6B
12.5B
12.5AB
9.8B
1.4 0.296 0.007 0.0176
8℃ 13.9B
17.4ABa
9.3Bb
14.9ABa
16℃ 18.5A
19.5A
18.6A
17.4A
Average 16.5 13.5 14.0
24h Average Control Arginine Glutamate SEM P-diet P-temp P-model
2℃ 17.1 18.7 16.3 16.2 0.9 0.048 0.093 0.038
8℃ 19.1 21.0a
15.8b
20.6a
16℃ 19.9 21.0 18.6 20.3
Average 20.2a
16.9b
19.0ab
Significant differences (p<0.05) between dietary treatments within temperature
treatments are given by different small letters (horizontal), and significant differences
(p<0.05) between different temperature treatments within dietary treatments are given
by different capital letters (vertical).
16
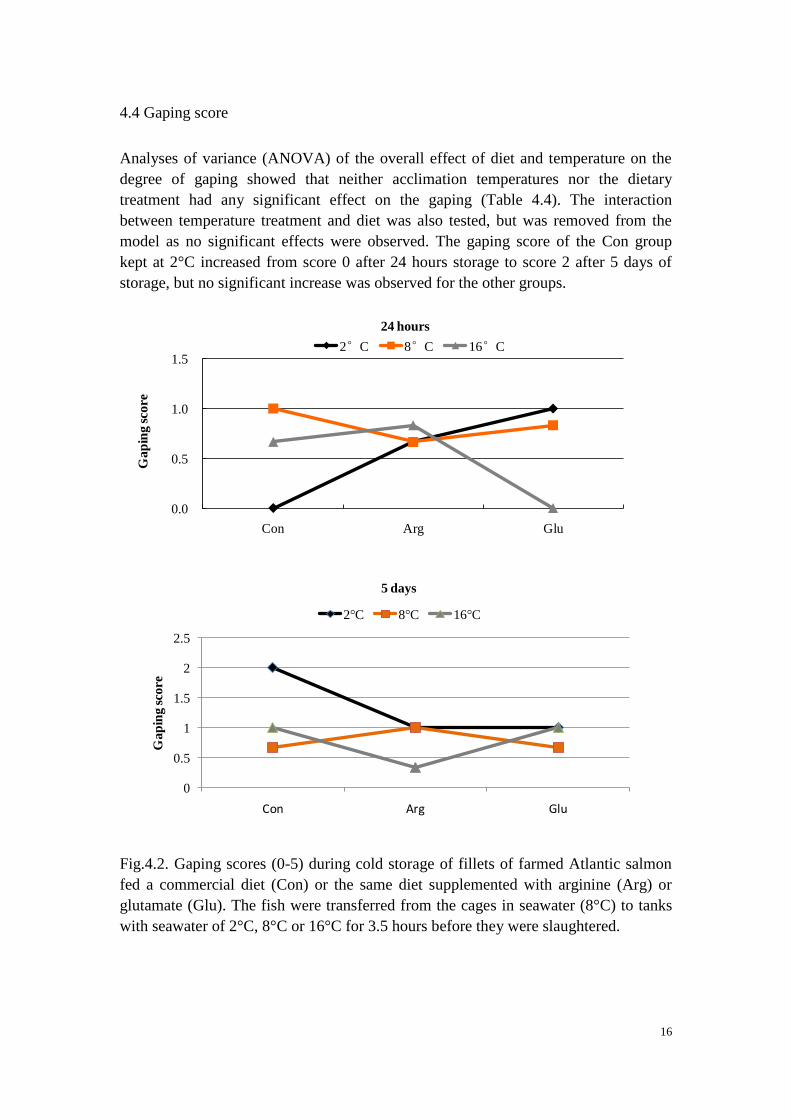
4.4 Gaping score
Analyses of variance (ANOVA) of the overall effect of diet and temperature on the
degree of gaping showed that neither acclimation temperatures nor the dietary
treatment had any significant effect on the gaping (Table 4.4). The interaction
between temperature treatment and diet was also tested, but was removed from the
model as no significant effects were observed. The gaping score of the Con group
kept at 2°C increased from score 0 after 24 hours storage to score 2 after 5 days of
storage, but no significant increase was observed for the other groups.
Fig.4.2. Gaping scores (0-5) during cold storage of fillets of farmed Atlantic salmon
fed a commercial diet (Con) or the same diet supplemented with arginine (Arg) or
glutamate (Glu). The fish were transferred from the cages in seawater (8°C) to tanks
with seawater of 2°C, 8°C or 16°C for 3.5 hours before they were slaughtered.
0.0
0.5
1.0
1.5
Con Arg Glu
Gap
ing s
core
24 hours
2°C 8°C 16°C
0
0.5
1
1.5
2
2.5
Con Arg Glu
Gap
ing s
core
5 days
2 C 8 C 16 C
17
4.5 Fillet colour
Although there were some minor numerical differences between diets and temperature
treatments, analyses of variance (ANOVA) showed that acclimation temperatures and
diet had no overall effect on the fillet colour score analyzed after 5 or 12 days of
storage (Table 4.4). The interaction between temperature treatment and diet was also
tested, but was removed from the model as no significant effects were observed.
Fig.4.3. SalmoFan colour score (mean±SE) analysed 5 and 12 days post-mortem of
farmed Atlantic salmon fed a commercial diet (Con) or the same diet supplemented
with arginine (Arg) or glutamate (Glu). The fish were transferred from the cages in
seawater (8°C) to tanks with 2°C, 8°C or 16°C seawater for 3.5 hours before they
were slaughtered.
25
25.5
26
26.5
27
27.5
28
28.5
Con Arg Glu
Colo
r s
core
5 days
2 C 8 C 16 C
22.5
23.5
24.5
25.5
26.5
27.5
28.5
Con Arg Glu
Colo
r s
core
12 days
2 C 8 C 16 C

18
4.6 Texture analysis
During the whole storage period, the numerically highest break force was observed at
2℃ for the Glu diet. Break force during storage from 5 to 12 days did not change
significantly for any of diets or temperature treatments.
Analyses of variance (ANOVA) of the overall effect of diet and temperature on the
texture showed that neither acclimation temperatures nor dietary treatment had a
significant effect on the texture (Table 4.4). However, within the 2℃ and 16℃
temperature treatment, a significantly firmer texture (higher Fb) was observed for the
Glu diet. For the salmon kept at 8℃, no significant differences were observed
between the dietary groups. The interaction between temperature treatment and diet
was also tested, but was removed from the model as no significant effects were
observed.
Fig.4.4. Fillet firmness measured as breaking force (N) 5 and 12 days post-mortem of
farmed Atlantic salmon fed a commercial diet (Con) or the same diet supplemented
with arginine (Arg) or glutamate (Glu). The fish were transferred from the cages in
seawater (8°C) to tanks with 2°C, 8°C or 16°C seawater for 3.5 hours before they
were slaughtered. Different letters denote significant differences (p<0.05) between
dietary treatments within temperature treatment.
0
2
4
6
8
10
12
Con Arg Glu
Forc
e at
bre
ak
poin
t (N
)
5 days
2 C 8 C 16 C
aa a
b
aab
ba
ab
0
2
4
6
8
10
12
14
16
Con Arg Glu
Forc
e at
bre
ak
poin
t (N
)
12 days
2 C 8 C 16 C
b
a
a aa
a
a
aa

19
4.7 Muscle pH
The ultimate muscle pH reflects the glycogen stores of the muscle; i.e. reduction of
pH is caused by formation of lactate from breakdown of muscle glycogen. The muscle
pH decreased after 5 days of storage period for all dietary fish groups; but an increase
was observed for the Arg group at 2℃ and 8℃ acclimation temperature after 12 days
of storage.
Analyses of variance (ANOVA) of the overall effect of diet and temperature on the
pH showed that acclimation temperature had a significant effect on the pH both at 3
and 24 hours storage, but not 5 days and 12 days post mortem. The dietary treatment
had no overall significant effect on pH (Table 4.4), although there was a tendency as
the P-value was 0.058 at 12 days storage. The interaction between temperature
treatment and diet was also tested, but was removed from the model as no significant
effects were observed.
Temperature
An average pH of 6.4 was reached after 3h storage for salmon kept at 16℃ before
slaughter, whereas the same pH was reached after 24h for the salmon kept at 2℃ and
8℃ acclimation temperature, respectively. At 3h storage time, the pH of the 16℃
group averaged 7.0 which was similar compared with the 8℃ group (pH 6.9) and 1.1
times higher compared with the 2℃ group (pH 6.2). The minimum pH at 24 hours
storage was 6.4, 6.3 and 6.2 for the 2℃, 8℃ and 16℃ group, respectively.
Diet
No overall significant effect was observed between dietary treatments, but within the
2℃ acclimation temperature treatment a significantly highest pH was observed at 3
and 24 hours of storage for the Glu group. Also the rate of pH reduction during the
first 24 hours post-mortem was slower for the Arg and Glu groups compared with the
Con group.
20
Fig.4.5. Development of pH (mean±SE) during cold storage of pre-rigor fillets of farmed Atlantic salmon fed a commercial diet (Con) or the
same diet supplemented with arginine (Arg) or glutamate (Glu). The fish were transferred from cages in seawater (8°C) to tanks with 2°C, 8°C
or 16°C seawater for 3.5 hours before they were slaughtered. Different letters denote significant differences (p<0.05) between temperatures
within dietary treatments.
6.0
6.2
6.4
6.6
6.8
7.0
7.2
Con Arg Glu
Mu
scle
pH
pH (3 hours)
2℃ 8℃ 16℃
aa
b
a
a
b
a
b
c
6.0
6.2
6.4
6.6
6.8
Con Arg Glu
Mu
scle
pH
pH (24 hours)
2℃ 8℃ 16℃
ab
c
a
abb
a
b b
6.0
6.2
6.4
6.6
6.8
Con Arg Glu
Mu
csle
pH
pH (5 days)
2°C 8°C 16°C
6.15
6.20
6.25
6.30
Con Arg Glu
Mu
scle
pH
pH (12 days)
2°C 8°C 16°C

21
Table 4.4. Fillet gaping analysed 24 hours and 5 days post-mortem, and colour and
texture, analysed 5 and 12 days post-mortem of farmed Atlantic salmon fed a
commercial diet (Con) or the same diet supplemented with arginine (Arg) or
glutamate (Glu). The fish were transferred from cages in seawater (8°C) to tanks with
either 2°C, 8°C or 16°C seawater for 3.5 hours before harvesting. Results from
ANOVA (model Y=diet+temperature+ε) are presented as P-values for each parameter
and for the total model. SEM referres to Standard Error of Mean.
ANOVA
Gaping24h Average Control Arginine Glutamate SEM P-diet P-temp P-model
2℃ 0.6 0 0.7 2.91 0.4 0.944 0.776 0.958
8℃ 0.8 1 0.7 4.73
16℃ 0.5 0.7 0 5.79
Average 0.6 0.7 0.6
Gaping5d Average Control Arginine Glutamate SEM P-diet P-temp P-model
2℃ 1.3 1 2 1 0.3 0.567 0.343 0.507
8℃ 0.8 1 0.7 0.7
16℃ 0.8 0.3 1 1
Average 0.8 1.2 0.9
Colour5d Average Control Arginine Glutamate SEM P-diet P-temp P-model
2℃ 26.6 26.1 26.8 26.8 0.3 0.765 0.743 0.884
8℃ 26.9 27.1 26.6 27.1
16℃ 26.7 26.4 27.2 26.5
Average 26.5 26.9 26.8
Colour12d Average Control Arginine Glutamate SEM P-diet P-temp P-model
2℃ 25.8 25.5 25.9 26.1 0.3 0.212 0.932 0.498
8℃ 25.7 25.8 25.7 25.8
16℃ 25.4 25.4 25.9 25.0
Average 25.5 25.8 25.6
Fb5d Average Control Arginine Glutamate SEM P-diet P-temp P-model
2℃ 9.3 8.9b 8.2b 10.7a 0.4 0.854 0.718 0.908
8℃ 9.4 9.9 9.9 8.6
16℃ 9.3 9.6ab 8.4b 9.9a
Average 9.5 8.8 9.7
Fb12d Average Control Arginine Glutamate SEM P-diet P-temp P-model
2℃ 10.2 9.1b 9.4b 12.2a 0.6 0.216 0.556 0.371
8℃ 11.1 12.4 11.1 9.9
16℃ 10.4 10.2b 8.9b 12.0a
Average 10.6 9.8 11.4
Significant differences (p<0.05) between dietary treatments within temperature
treatments are given by different small letters (horizontal).

22
Table 4.5. pH analysed after 3 and 24 hours, 5 and 12 days post-mortem of farmed
Atlantic salmon fed a commercial diet (Con) or the same diet supplemented with
arginine (Arg) or glutamate (Glu). The fish were transferred from the cages in
seawater (8°C) to tanks with either 2°C, 8°C or 16°C seawater for 3.5 hours before
harvesting. Results from ANOVA (model Y=diet+temperature+ε) are presented as
P-values for each parameter and for the total model. SEM referres to Standard Error
of Mean.
ANOVA
pH 3h Average Control Arginine Glutamate SEM P-diet P-temp P-model
2℃ 7.0A 6.8 6.9 7.1 0.1 0.562 0.0002 0.0012
8℃ 6.9A 6.9 7.0 6.8
16℃ 6.4B 6.4 6.5 6.5
Average 6.7 6.8 6.8
pH 24h Average Control Arginine Glutamate SEM P-diet P-temp P-model
2℃ 6.4A 6.3 6.3 6.5 0.04 0.195 0.055 0.070
8℃ 6.3AB 6.3 6.5 6.2
16℃ 6.2B 6.2 6.3 6.2
Average 6.3 6.4 6.3
pH 5d Average Control Arginine Glutamate SEM P-diet P-temp P-model
2℃ 6.2 6.2 6.2 6.2 0.01 0.450 0.424 0.503
8℃ 6.2 6.2 6.2 6.2
16℃ 6.2 6.2 6.2 6.2
Average 6.2 6.2 6.2
pH 12d Average Control Arginine Glutamate SEM P-diet P-temp P-model
2℃ 6.2 6.2 6.3 6.2 0.01 0.058 0.123 0.052
8℃ 6.2 6.3 6.3 6.2
16℃ 6.2 6.2 6.2 6.2
Average 6.2 6.2 6.2
Significant differences (p<0.05) between acclimation temperature within dietary
treatments are given by different capital letters (vertical).

23
4.8 Cathepsins analysis
Analyses of variance (ANOVA) of the overall effect of diet and temperature on the
activity of cathepsin B showed that acclimation temperatures had a significant effect
at 24 hours of storage, and there was also found a significant effect at 0 hour for total
activity of cathepsin B+L. The dietary treatment had a significant effect on the
activity of cathepsin L at 0 hour (Table 4.3).
Temperature
The average activity of cathepsin B at 0 hour was similar for the 2℃, 8℃ and 16℃
group, so was cathepsin L, while an average activity of cathepsin B+L of 2.4 mU/g
were reached for salmon kept at 8℃, which was 0.20 mU/g higher than salmon kept
at 2℃ and 16℃.
At 24 hours of storage time, the average activity of cathepsin B of the 2℃ group
averaged 0.72 mU/g and cathepsin L of the 2℃ group averaged 1.60 mU/g, were
both higher than the 8℃ group and the 16℃ group. The total activity of cathepsin B
and L at 24 hours of storage was 2.32, 2.46 and 2.37 mU/g for the 2℃, 8℃ and 16℃
group, respectively.
Diet
Significant effect of diet was observed for salmon kept at acclimation temperature of
2℃ and 16℃ for cathepsin L at 0 hour. The salmon fed the arginine diet had
significantly lowest activity of cathepsin L at 0 hour, which was a 0.12-0.15 mU/g
unit lower compared with the salmon fed the control or glutamate diet.

24
0.0
0.2
0.4
0.6
0.8
1.0
1.2
Con Arg Glu
Cath
epsi
n B
act
ivit
y (
mU
/g
mu
scle
)
Cathepsin B activity 0h post-mortem
2°C 8°C 16°C
0.0
0.2
0.4
0.6
0.8
1.0
1.2
Con Arg Glu
Cath
epsi
n B
act
ivit
y (
mU
/g
mu
scle
)
Cathepsin B activity 24h post-mortem
2°C 8°C 16°C
a aa a
b
a
b
a
a
0.0
0.4
0.8
1.2
1.6
2.0
Con Arg Glu
Cat
hep
sin
L a
ctiv
ity
(mU
/g
mu
scle
)
Cathepsin L activity 0h post-mortem
2°C 8°C 16°C
0.0
0.4
0.8
1.2
1.6
2.0
Con Arg GluCat
hep
sin
L a
ctiv
ity
(mU
/g
mu
scle
)
Cathepsin L activity 24h post-mortem
2°C 8°C 16°C
a aa ab
a
b
aa
a
0.0
0.5
1.0
1.5
2.0
2.5
3.0
Con Arg Glu
Cath
epsi
n B
+L
act
ivit
y (
mU
/g
mu
scle
)
Cathepsin B+L activity 0h post-mortem
2°C 8°C 16°C
a aa
b
a
ba a a
0.0
0.5
1.0
1.5
2.0
2.5
3.0
Con Arg Glu
Cath
epsi
n B
+L
act
ivit
y (
mU
/g
mu
scle
)
Cathepsin B+L activity 24h post-mortem
2°C 8°C 16°C
aa
aa a
a ba
a

25
Fig.4.6 Activity of cathepsin B, L and B+L (mean ± SE) 1h and 24hpost-mortem in
muscle of farmed Atlantic salmon fed a commercial diet (Con) or the same diet
supplemented with arginine (Arg) or glutamate (Glu). The fish were transferred from
cages in seawater (8°C) to tanks with 2°C, 8°C or 16°C seawater for 3.5 hours before
they were slaughtered. Different letters denote significant differences (p<0.05)
between temperature within diet.
Table 4.6 Development of activity of cathepsin B, L and B+L during 24 hours storage
of farmed Atlantic salmon fed a commercial diet (Con) or the same diet supplemented
with arginine (Arg) or glutamate (Glu). The fish were transferred from cages in
seawater (8°C) to tanks with either 2°C, 8°C or 16°C seawater for 3.5 hours before
harvesting. Results from ANOVA (model Y=diet+temperature+ε) are presented as
P-values for each parameter and for the total model.
ANOVA
Cathepsin B
0h
Average Control Arginine Glutamate SEM P-diet P-temp P-model
2℃ 0.72 0.84 0.67 0.65 0.04 0.460 0.645 0.626
8℃ 0.77 0.79 0.85 0.71
16℃ 0.74 0.72 0.67 0.79
Average 0.78 0.73 0.72
Cathepsin L
0h
Average Control Arginine Glutamate SEM P-diet P-temp P-model
2℃ 1.48 1.52a 1.36b 1.55b 0.03 0.001 0.441 0.031
8℃ 1.54 1.56 1.47 1.58
16℃ 1.49 1.51a 1.40b 1.57a
Average 1.53a 1.41b 1.57a
Cathepsin B
24h
Average Control Arginine Glutamate SEM P-diet P-temp P-model
2℃ 0.72B 0.85 0.69B 0.67B 0.05 0.761 0.004 0.021
8℃ 0.91A 0.81 0.96A 0.96A
16℃ 0.95A 0.88 0.95A 1.03A
Average 0.84 0.86 0.88
Cathepsin L
24h
Average Control Arginine Glutamate SEM P-diet P-temp P-model
2℃ 1.60A 1.57 1.76A 1.54 0.05 0.327 0.111 0.150
8℃ 1.57AB 1.55 1.48AB 1.69
16℃ 1.44B 1.48 1.28B 1.57
Average 1.53 1.48 1.60
Cathepsin
B+L 0h
Average Control Arginine Glutamate SEM P-diet P-temp P-model
2℃ 2.21B 2.34 2.03B 2.24 0.06 0.131 0.038 0.049
8℃ 2.41A 2.50 2.47A 2.29
16℃ 2.20B 2.23 2.01B 2.36
Average 2.36 2.18 2.29
Cathepsin
B+L 24h
Average Control Arginine Glutamate SEM P-diet P-temp P-model
2℃ 2.32 2.35 2.45 2.21 0.07 0.456 0.392 0.477
8℃ 2.46 2.45 2.39 2.54
16℃ 2.37 2.35 2.17 2.60
Average 2.38 2.31 2.45
Significant differences (p<0.05) between dietary treatments within temperature
treatments are given by different small letters (horizontal), and significant differences
(p<0.05) between temperature treatments within dietary treatments are given by
different capital letters (vertical).

26
4.9 ATP breakdown products
Analyses of variance (ANOVA) of the overall effect of diet and temperature on the
content of ATP breakdown products showed that acclimation temperatures had a
significant effect on the content of ATP, IMP and Ino after 3 hours storage. There was
a significant temperature effect on the content of Hx after one week storage, whereas
the dietary treatment only had a significant effect on the content of Hx after 1 week
storage (Table 4.6). The effect of temperature on the content of Ino corresponded with
a P-value of 0.096 after 1 week storage. The effect of diet on the content of AMP, Hx
corresponded with a P-value of 0.083 and 0.078 after 3 hours of storage, respectively.
Temperature
After 3h post-mortem, the average activity of IMP of the 16℃ group averaged 18.02
µm/g, which was 3.3 times higher than the 2℃ group (5.39 µm/g) and 2.9 times
higher compared with the 8℃ group (6.32 µm/g). The activity of Hx one week
post-mortem was 14.8, 14.2 and 12.9µm/g for the 2℃, 8℃ and 16℃ group,
respectively.
Diet
Significant effect of diet was observed only for fillets from salmon kept at acclimation
temperature of 8℃ , and only for Hx. The salmon fed the arginine diets had
significantly highest activity of Hx one week post-mortem.
27
A) 3 hours storage B) one week storage
Fig.4.7 Development in adenosine-5’-triphosphate (ATP), adenosine-5’-diphos-phate (ADP), adenosine-5’-monophosphate (AMP), inosine
mono-phosphate (IMP), and inosine and hypoxanthine (Hx) of farmed Atlantic salmon fed a commercial diet (Con) or the same diet
supplemented with arginine (Arg) or glutamate (Glu). The fish were transferred from the cages in seawater (8°C) to tanks with 2°C, 8°C or 16°C
seawater for 3.5 hours before they were slaughtered. Results are given (mean±SE) for samples frozen at -80 °C at 3 hours (A) and one week
post-mortem (B). Different letters denote significant differences (p<0.05) between dietary treatments within acclimation temperature.
0.0
0.2
0.4
0.6
0.8
Con Arg Glu
Hx
0.0
0.5
1.0
1.5
2.0
Con Arg Glu
In
o
0
5
10
15
20
25
30
IM
P a
b
a
bb b
0.0
0.2
0.4
0.6
0.8
AM
P
0
2
4
6
8
AD
P
2℃ 8℃ 16℃
0
10
20
30
AT
P
2℃ 8℃ 16℃
0
5
10
15
20
Con Arg Glu
Hx
aab
b
0
5
10
15
20
Con Arg Glu
Ino
0
2
4
6
8
10
12
IMP
0
0.1
0.2
0.3
0.4
0.5
0.6
AM
P
0
1
1
2
2
3
AD
P
2℃ 8℃ 16℃
0.00
0.05
0.10
0.15
0.20
0.25
AT
P
2℃ 8℃ 16℃
28
Table 4.7
Development in adenosine-5’-triphosphate (ATP), adenosine-5’-diphos-phate (ADP),
adenosine-5’-monophosphate (AMP), inosine mono-phosphate (IMP), and inosine
and hypoxanthine (Hx) three hours post-mortem of farmed Atlantic salmon fed a
commercial diet (Con) or the same diet supplemented with arginine (Arg) or
glutamate (Glu). The fish were transferred from cages in seawater (8°C) to tanks with
either 2°C, 8°C or 16°C seawater for 3.5 hours before harvesting. Results from
ANOVA (model Y=diet+temperature+ε) are presented as P-values for each parameter
and for the total model. SEM referres to Standard Error of Mean.
ANVOA
ATP 3h Average Control Arginine Glutamate SEM P-diet P-temp P-model
2℃ 20.33A 18.99A 17.87A 24.13A 1.76 0.503 0.002 0.007
8℃ 18.59A 18.68A 20.04A 17.05AB
16℃ 10.70B 7.95B 10.94B 13.22B
Average 15.21 16.28 18.13
ADP 3h Average Control Arginine Glutamate SEM P-diet P-temp P-model
2℃ 5.13A 5.21 4.27 5.93 0.35 0.753 0.153 0.352
8℃ 4.88A 5.15 4.90 4.58
16℃ 4.16B 3.67 4.52 4.29
Average 4.67 4.56 4.93
AMP 3h Average Control Arginine Glutamate SEM P-diet P-temp P-model
2℃ 0.29 0.20 0.45 0.22 0.05 0.083 0.311 0.128
8℃ 0.18 0.14 0.22 0.19
16℃ 0.23 0.15 0.31 0.23
Average 0.16b 0.33a 0.21ab
IMP 3h Average Control Arginine Glutamate SEM P-diet P-temp P-model
2℃ 5.39B 7.24B 6.27B 2.66B 1.90 0.391 0.0001 0.0006
8℃ 6.32B 7.46B 4.56B 6.93AB
16℃ 18.02A 19.86A 20.25A 13.95A
Average 11.52 10.36 7.85
Ino 3h Average Control Arginine Glutamate SEM P-diet P-temp P-model
2℃ 0.71B 0.72 0.95 0.45 0.14 0.289 0.016 0.034
8℃ 0.59B 0.59 0.77 0.42
16℃ 1.19A 1.17 1.27 1.14
Average 0.83 1.00 0.67
Hx 3h Average Control Arginine Glutamate SEM P-diet P-temp P-model
2℃ 0.14 0.04b 0.39a 0b 0.06 0.078 0.278 0.113
8℃ 0.11 0.07 0.12 0.15
16℃ 0.25 0.19 0.36 0.20
Average 0.10b 0.29a 0.11ab
Significant differences (p<0.05) between dietary treatments within acclimation
temperature are given by different small letters (horisontal), and significant differences
(p<0.05) between temperature treatments within dietary treatments are given by
different capital letters (vertical).

29
Table 4.8
Development in adenosine-5’-triphosphate (ATP), adenosine-5’-diphos-phate (ADP),
adenosine-5’-monophosphate (AMP), inosine mono-phosphate (IMP), and inosine and
hypoxanthine (Hx) one week post-mortem of farmed Atlantic salmon fed a commercial
diet (Con) or the same diet supplemented with arginine (Arg) or glutamate (Glu). The
fish were transferred from cages in seawater (8°C) to tanks with either 2°C, 8°C or 16°C
seawater for 3.5 hours before harvesting. Results from ANOVA (model
Y=diet+temperature+ε) are presented as P-values for each parameter and for the total
model. SEM referres to Standard Error of Mean.
ANVOA
ATP 1w Average Control Arginine Glutamate SEM P-diet P-temp P-model
2℃ 0.12 0.10 0.15 0.11 0.01 0.404 0.579 0.567
8℃ 0.11 0.10 0.11 0.11
16℃ 0.10 0.09 0.11 0.08
Average 0.10 0.12 0.10
ADP 1w Average Control Arginine Glutamate SEM P-diet P-temp P-model
2℃ 1.56 1.64 1.48 1.54 0.10 0.826 0.495 0.765
8℃ 1.70 1.72 1.68 1.70
16℃ 1.56 1.45 1.79 1.46
Average 1.60 1.65 1.57
AMP 1w Average Control Arginine Glutamate SEM P-diet P-temp P-model
2℃ 0.11 0 0.05 0.28 0.05 0.339 0.173 0.231
8℃ 0 0 0 0
16℃ 0 0 0 0
Average 0 0.02 0.09
IMP 1w Average Control Arginine Glutamate SEM P-diet P-temp P-model
2℃ 3.72 4.29 2.87 4.01 1.02 0.087 0.128 0.072
8℃ 6.35 8.80 3.58 6.68
16℃ 3.65 4.97 1.69 0
Average 6.02 2.71 4.99
Ino 1w Average Control Arginine Glutamate SEM P-diet P-temp P-model
2℃ 14.45 14.94 13.58 14.82 0.76 0.976 0.096 0.295
8℃ 13.30 14.15 13.22 12.54
16℃ 15.74 13.99 16.91 14.30
Average 14.36 14.57 14.56
Hx 1w Average Control Arginine Glutamate SEM P-diet P-temp P-model
2℃ 14.83A 14.02 16.10 14.37A 0.54 0.0005 0.051 0.0007
8℃ 14.19AB 12.75b 16.99a 12.83Bb
16℃ 12.86A 12.78 14.99 16.33A
Average 13.19b 16.03a 14.51b
Significant differences (p<0.05) between dietary treatments within acclimation
temperature are given by different small letters (horizontal), and significant
differences (p<0.05) between temperature treatments within dietary treatments are
given by different capital letters (vertical).

30
5. DISCUSSION
5.1 Growth performance
The present study showed that feeding a diet supplemented with arginine or glutamate
did not significantly improve the overall growth of Atlantic salmon during the
seawater rearing phase (May 2009-May 2010). In a previous experiment (Oehme et
al., 2010), a combination of arginine and glutamate, with supplementation levels of
1.1% and 0.75% respectively, resulted in a significant increased growth from July to
September 2007 for salmon transferred to seawater (May 2007).
The results therefore suggest that there might be a synergy between arginine and
glutamate, which means they are more successful when they work together than when
they are added separately. The feed formulation and fish size may be other factors
affecting the final results.
5.2 Composition of fillets
The fat content of the salmon in the present study showed no significant differences
between the dietary treatments. However, the liver of the control group was larger of
the salmon fed the control diet, indicating larger lipid accumulation of this organ.
Fatty livers are frequently associated with metabolic disturbances in mammals. On the
other hand, a previous study showed that salmon fed a diet supplemented with a
combination of glutamate and arginine for approximately four months after they were
transferred to seawater had significantly higher fillet fat content than fish fed a control
diet (Oehme et al., 2010).
As expected, the fish that got supplementation of arginine had a higher concentration
of free arginine in the skeletal muscle. None of the other selected amino acids or
metabolites except urea was significantly different between feeding groups. Arginine
can be metabolised to urea by the cytosolic enzyme arginase in the Urea Cycle (Wu
and Morris, 1998). However, the content of free glutamate in the muscle was not
significantly higher in the salmon that were fed the glutamate added diet. Hence, the
supplemented glutamate may have been metabolized in the gut for energy use since
glutamate is known to be a suitable energy substrate (Tapiero et al., 2002).
5.3 Fillet contraction
It is well known that handling stress prior to slaughter can result in poor quality of
fish fillets and lower fillet yield (Basrur et al., 2010; Erikson et al., 1997a; Matos et al.,
2010; Merkin et al., 2010; Sigholt et al., 1997; Skjervold et al., 2001a) . Stress can
also cause considerable physiological responses in fish, for example, the release of
several hormones such as catecholamines and cortisol from the chromaffin and
interrenal cells, respectively (Einarsdóttir and Nilssen, 1996). Elevated plasma levels
of cortisol, glucose, lactate and osmolality are other stress response parameters
(Einarsdóttir and Nilssen, 1996; Rotllant and Tort, 1997; Skjervold et al., 1999), but
in the present study plasma parameters were not determined.

31
The current study showed that the acclimation temperatures before slaughter had a
significant effect on the fillet contraction from 3-12 hours storage, whereas the dietary
treatment had a significant effect on the fillet contraction at 24 hours storage. It was
shown that the onset of rigor mortis (contraction of fillets) for fish kept at higher
temperature (16℃) was faster than the onset for fish kept at lower temperature (2℃).
Since stress during harvest processing may accelerate onset of rigor mortis (Sigholt et
al., 1997), a common procedure is to keep farmed salmon in refrigerated seawater
(approximately 2℃) for 40-60 minutes before slaughtering in order to calm the fish
and hence delay time to onset of rigor mortis (Skjervold et al., 1999). The present
study showed that salmon reared at 8℃ and thereafter acclimated to 2℃ during 3.5
hours before slaughtering had a delayed rigor development. Reasons may be the lower
temperature and activities of muscle at death and after the live-chilling process.
However, no previous studies have reported the effect on rigor development and
subsequent fillet quality of salmon kept at temperature above their rearing temperature.
Keeping the salmon at high acclimation temperature (16℃) may be considered to be a
thermal stressor that causes faster onset of rigor mortis.
In addition to seawater temperature before slaughter, dietary effects were also
observed. The arginine group that was kept at 8℃ before slaughter reached a
significant lower fillet contraction compared to the control group after 24 hours
storage; indicating that arginine or metabolites from arginine influences post-mortem
muscle contraction.
5.4 Fillet gaping
Gaping is considered to be a post-mortem phenomenon (Robb et al., 2000). The cause
of gaping can be described as the interaction between forces pulling the muscle apart,
and the strength of the connective tissue, which produces flaking of the fillet
(Kiessling et al., 2004). Commercially gaping is a problem because it makes the fillets
much more difficult to process. However, neither acclimation temperatures nor the
dietary treatment had any significant effect on the gaping in this experiment. The
gaping score of all fish was indicated a strong muscle structure of the salmon in
general. Gaping is known to vary significantly between seasons. Hence, it is possible
that the effect of acclimate temperature or diet would have been more pronounced if
the fish were slaughtered when their structure was weaker in general.
5.5 Fillet colour and pigmentation
Colour is an important characteristic used to establish the acceptance of various food
products (Barbut, 2004). Consumers purchasing fish in supermarkets have few means
of evaluating the flavor, tenderness, and juiciness of fillets. Therefore, the
red muscle colour of salmonid fishes is an important quality criterion for consumer
acceptance, as they commonly base their selection on visual appearance when
purchasing various meats (Barbut, 2001). Muscle colour in salmonids results from
deposition of dietary carotenoids (Bjerkeng, 2000; Buttle et al., 2001).
Improved fillet colour of salmon kept at 1℃ for 45 minutes before slaughtering was
found by a previous study (Skjervold et al., 2001b). However, the present study
showed that acclimation temperatures and diet had no overall effect on the colour

32
score or content of pigmentation after 5 days or 12 days of storage. These results are
not consistent with previous studies that showed that fillets of fish exposed to
pre-slaughter handling stress became paler compared to fish with normal handling
(Kiessling et al., 2004; Robb et al., 2000). However, the deviating results may be due
to different stressors or the size of fish used in these experiments. Because colouration
is so important for consumer preferences, the effect of thermal stressor before
slaughtering on salmon flesh colour should be further studied.
In line with the present study, (Bjerkeng et al., 1997), found no significant impact of
dietary protein source on flesh colouration of salmon fed a diet using fish meal
compared to full-fat soybean meal.
5.6 Texture analysis
Food texture covers several related physical properties, including resistance to
chewing, tenderness, and juiciness. Soft flesh can cause quality downgrading in the
salmon processing industry and reduced acceptability by consumers. Soft flesh in fish
is believed to be associated with reduced content and reduced strength of the
connective tissue (Hatae et al., 1986; K. Sato and Yoshinaka, 1986; Mørkøre and
Austreng, 2004). Neither acclimation temperatures nor dietary treatment had an
overall significant effect on fillet firmness measured as breaking force. However,
supplementation with glutamate resulted in firmer texture in salmon acclimated to 2℃
or 16℃ at both 5 and 12 days of storage. These results might relate to the effect of
glutamate on muscle fibres synthesis as glutamate is a precursor of proline and
arginine that are involved in the synthesis of collagen and connective tissue (Reeds et
al., 2000). There are a number of various factors responsible for the fillet texture; for
example a low pH level and/or a fast pH reduction rate post-mortem may be
associated with soft texture in salmon (Mørkøre et al., 2008). The muscle pH of the
glutamate group acclimated to 2℃ was higher as compared with the other dietary
groups at 3 and 24 hours storage.
5.7 Muscle pH
Lactate is accumulated during anaerobic glycogen breakdown post mortem and the
reduction of pH is caused by formation of lactate from breakdown of muscle glycogen;
hence lactate and pH in muscle are correlated. The muscle pH decreased during the
storage period for all dietary groups, reaching a final level of approximately 6.2.
However, there was a small increase of pH for the Arg group at 2℃ and 8℃
acclimation temperature after 12 days of storage, indicating initiation of spoilage of
these groups. The reduction rate of the muscle pH affects rigor-related enzyme
activity and therefore not only the delay and onset of rigor but also the proteolytic
activity causing the resolution of rigor (Skjervold et al., 2002). The final pH in muscle
has an important influence on the textural quality of meat, water holding capacity and
colour (Mørkøre, 2006). Soft flesh has been associated with rapid pH decline and
lower final pH through a weakening of the connective tissue, denaturation of proteins
and an increased amount of proteolysis (Mørkøre et al., 2008). Acclimation
temperatures had a significant effect on the pH at early storage time. Results showed a
lower muscle pH post mortem or a higher lactate level in fish kept at higher
temperature before slaughter than fish kept at lower seawater temperatures. These
results are in accordance with some previous studies showing lower ultimate pH in
33
stressed salmon (Mørkøre et al., 2008; Skjervold et al., 2001a). Hence, the results of
pH also indicate that high acclimation temperature caused stress responses in the fish.
No overall dietary effect was observed, but a higher muscle pH during the first 24
hours of storage of the Glu group indicates that added levels of glutamate improved
the ability of the salmon to cope with stress related to slaughter handling or improved
buffer capacity of the muscle.
5.8 Cathepsins activity
Cathepsins belong to a large family of lysosomal cysteine proteases which have been
associated with post mortem degradation of mammalian and fish muscle (Bahuaud et
al., 2008). An increased cathepsin activity indicates breakage of the lysosomal
membrane, releasing degrading enzymes, and i.e. the start of fish muscle proteolysis
(Bahuaud et al., 2009). In salmon, cathepsins B and L are considered to be the
enzymes playing the most important role in post-mortem muscle softening. The level
of cathepsin L activity was dominant when compared to cathepsin B, since the
activity of cathepsin L was almost two times higher than cathepsin B in all groups.
These results were in accordance with previous results reported by Bahuaud et al.
(2009).
There was a significant acclimation temperatures effect on the total activity of
cathepsin B+L immediately after slaughter. In salmonids, cathepsin B and cathepsin L
activity have been associated with the pH level in the muscle. Results from a previous
study indicated that a lower pH in stressed fish could explain a higher activity of
cathepsin B+L in salmon muscle after slaughtering (Rahnama, 2010). However, the
present study was not in accordance with that suggestion. The lowest pH was found in
the muscle of fish kept at 16℃ while the highest activity of cathepsin B+L was found
in fish kept at 8℃ . The results indicate that acclimation temperature before
slaughtering (higher, 16℃ or lower, 2℃) than harvest seawater temperature (8℃)
influences the activity of cathepsin B+L.
5.9 ATP breakdown products
Nucleotide degradation in fish muscle commences at early post mortem and proceeds
throughout storage. Hypoxanthine (Hx) is formed as a by-product from the
degradation of ATP. The accumulation of hypoxanthine has shown potential as an
index of freshness (Beuchat, 1973). Freshness is thought to be the most important
quality parameter. Hx is considered to be a good biomarker for unpleasant flavours in
stored salmon, while IMP contributes to the pleasant, fresh flavors (Mørkøre et al.,
2010b). There was a significant effect of acclimation temperatures and dietary
treatment on the content of Hx after one week storage. The fish kept at 16℃ had a
significantly lower content of Hx after one week storage as compared with the fish
kept at lower temperatures. According to previous results (Mørkøre et al., 2010a), a
significant inverse relationship was found between the rearing temperature in
seawater and the accumulation of Hx in the salmon muscle during storage. Several
experiments have shown that crowding as a stressor can accelerate breakdown of ATP
(Erikson et al., 1997a; Erikson et al., 1997b; Mørkøre et al., 2008), but they are not
consistent with the results from the present study as higher acclimation temperature as
a thermal stressor before slaughtering resulted in lower accumulation of Hx. High
acclimation temperature before slaughter may alter the enzyme activity and possibly

34
cause some temperature adaptation. When placing the fillets on ice post-mortem, the
chilled storage temperature may be more efficient for salmon acclimated to high
temperatures than for fillets of salmon acclimated to lower temperature (△℃ higher
for salmon acclimated to high temperature).

35
6 CONCLUSION
Dietary supplementation of arginine or glutamate had no overall effect on slaughter
parameters in Atlantic salmon, except from the liver size that was smaller as
compared with salmon fed the control diet. A firmer texture of salmon fed the diet
supplemented with glutamate and acclimated to 2℃ or 16℃ is considered as a very
positive result. The results further indicate that the glutamate level in commercial
salmon diets might be too low to obtain a premium texture quality, although the level
might be sufficient for adequate production efficiency. Salmon fed diets supplemented
with arginine had a slower fillet contraction rate compared with the other groups when
they were kept at 8℃ before slaughter. However, the spoilage rate of this group
seemed to be faster, as the hypoxanthine level and pH were highest after one week
storage. Hence, the present results are questioning the established measure of rigor
development as a marker for prolonged freshness of salmon, since high levels of
hypoxanthine and increased pH during prolonged storage indicate reduced sensory
quality and bacterial growth, respectively.
The present study is the first to report the fillet quality of Atlantic salmon acclimated
to pre-slaughter seawater temperature above the rearing temperature. It was shown
that the onset of rigor mortis for fish kept at higher temperature (16℃) was faster than
the onset for fish kept at lower temperature (2℃). Results also showed a lower muscle
pH at early storage time in fish kept at higher seawater temperature before slaughter.
High acclimation temperature accelerated activity of cathepsin B at 24 hours storage.
On the other hand, salmon kept in 16℃ seawater before slaughter had a lower
content of Hx after one week storage, indicating prolonged sensory freshness.
Acclimation temperature and dietary treatment had no significant effect on fillet
gaping or colour score.
Results from the present thesis have contributed with novel knowledge regarding the
impact of dietary treatment of salmon and acclimation temperature before slaughter.
However, further studies are required to obtain a greater depth of understanding of the
underlying mechanisms and the complex basis of factors affecting the salmon quality,
and interaction among the various factors.
36
7. REFERENCES
Aksnes A. (1995) Growth, feed efficiency and slaughter quality of salmon, Salmo
salar L., given feeds with different ratios of carbohydrate and protein.
Aquaculture Nutrition 1:241-248.
Andersen B.U., Steinsholt K., Stroemsnes A.N. (1994) Fillet gaping in farmed
Atlantic salmon (Salmo Salar). Norwegian Journal of Agricultural Sciences.
Anderson P. (1995) 3 Urea Cycle in Fish: Molecular and Mitochondrial Studies
14:57-83.
Bahuaud D., Morkore T., Langsrud O., Sinnes K., Veiseth E., Ofstad R., Thomassen
M.S. (2008) Effects of -1.5 degrees C Super-chilling on quality of Atlantic
salmon (Salmo salar) pre-rigor Fillets: Cathepsin activity, muscle histology,
texture and liquid leakage. Food Chemistry 111:329-339.
Bahuaud D., Ostbye T.K., Torstensen B.E., Rora M.B., Ofstad R., Veiseth E.,
Thomassen M.S., Ruyter B. (2009) Atlantic salmon (Salmo salar) muscle
structure integrity and lysosomal cathepsins B and L influenced by dietary n-6
and n-3 fatty acids. Food Chemistry 114:1421-1432.
Barbut B. (2001) Effect of illumination source on the appearance of fresh meat cuts.
Meat Science 59:187-191.
Barbut S. (2004) Effect of three commercial light sources on acceptability of Salmon,
Snapper and Sea Bass fillets. Aquaculture 236:321-329.
Basrur T.V., Longland R., Wilkinson R.J. (2010) Effects of repeated crowding on the
stress response and growth performance in Atlantic salmon (Salmo salar). Fish
Physiology and Biochemistry 36:445-450.
Beuchat L.R. (1973) Hypoxanthine measurement in assessing freshness of chilled
channel catfish (Ictalurus punctatus). J. Agric. Food Chem 21:453-455.
Bjerkeng B. (2000) Carotenoid pigmentation of salmonid fishes - recent progress.
Bjerkeng B., Refstie S., Fjalestad K.T., Storebakken T., Rodbotten M., Roem A.J.
(1997) Quality parameters of the flesh of Atlantic salmon (Salmo salar) as
affected by dietary fat content and full-fat soybean meal as a partial substitute
for fish meal in the diet. Aquaculture 157:297-309.
Blachier F., Boutry C., Bos C., Tome D. (2009) Metabolism and functions of
L-glutamate in the epithelial cells of the small and large intestines. American
Journal of Clinical Nutrition 90:814S-821S.
Blachier F., Selamnia M., Robert V., Mrabettouil H., Duee P.H. (1995) Metabolism of
L-Arginine through Polyamine and Nitric-Oxide Synthase Pathways in
Proliferative or Differentiated Human Colon-Carcinoma Cells. Biochimica Et
Biophysica Acta-Molecular Cell Research 1268:255-262.
Borderias A.J., Lamua M., Tejada M. (2007) Texture analysis of fish fillets and
minced fish by both sensory and instrumental methods. International Journal
of Food Science & Technology 18:85-95.
Brett J.R. (1971) Energetic Responses of Salmon to Temperature - Study of Some
Thermal Relations in Physiology and Freshwater Ecology of Sockeye Salmon
(Oncorhynchus-Nerka). American Zoologist 11:99-&.
Brown C.R., Cameron J.N. (1991) The Induction of Specific Dynamic Action in
Channel Catfish by Infusion of Essential Amino Acids. Physiological Zoology
64:276-297.
Burrin D.G., Stoll B. (2009) Metabolic fate and function of dietary glutamate in the
gut. American Journal of Clinical Nutrition 90:850s-856s.
37
Buttle L., Crampton V., Williams P. (2001) The effect of feed pigment type on flesh
pigment deposition and colour in farmed Atlantic salmon, Salmo salar L.
Aquaculture Research 32:103-111.
Casas C., Martinez O., Guillen M.D., Pin C., Salmeron J. (2006) Textural properties
of raw Atlantic salmon (Salmo salar) at three points along the fillet,
determined by different methods. Food Control 17:511-515.
Chen H.-Y., Leu Y.-T., Roelants I. (1992) Effective supplementation of arginine in
the diets of juvenile marine shrimp, Penaeus monodon. Aquaculture
108:87-95.
Colton C. (1975) Dual response of lobster muscle fibers to ?-glutamate. Comparative
Biochemistry and Physiology Part C: Comparative Pharmacology 51:275-284.
Crapo C., Elliot E. (1987) Salmon Quality: The Effects of Elevated Refrigerated
Seawater Chilling Temperatures University of Alaska.
Efron D., Barbul A. (2000) Role of arginine in immunonutrition. J Gastroenterol 35
Suppl 12:20-3.
Einarsdóttir I.E., Nilssen K.J. (1996) Stress responses of Atlantic salmon (Salmo salar
L.) elicited by water level reduction in rearing tanks.
Einen O. (1999) Feed ration prior to slaughter—a potential tool for managing product
quality of Atlantic salmon (Salmo salar). pp. 149-169.
Erikson U., Sigholt T., Seland A. (1997a) Handling stress and water quality during
live transportation and slaughter of Atlantic salmon (Salmo salar).
Aquaculture 149:243-252.
Erikson U., Beyer A.R., Sigholt T. (1997b) Muscle high-energy phosphates and stress
affect K-values during ice storage of Atlantic salmon (Salmo salar). Journal of
Food Science 62:43-47.
Evoy D., Lieberman M.D., Fahey T.J., Daly J.M. (1998) Immunonutrition: The role
of arginine. Nutrition 14:611-617.
FAO. (2010) The State Of World Fisheries And Aquaculture.
Flynn N. (2002) The metabolic basis of arginine nutrition and pharmacotherapy.
Biomedecine & Pharmacotherapy 56:427-438.
Folkestad A., Wold J.P., Rorvik K.A., Tschudi J., Haugholt K.H., Kolstad K.,
Morkore T. (2008) Rapid and non-invasive measurements of fat and pigment
concentrations in live and slaughtered Atlantic salmon (Salmo salar L.).
Aquaculture 280:129-135.
Gjøen H. (1997) Past, present, and future of genetic improvement in salmon
aquaculture. Ices Journal of Marine Science 54:1009-1014.
Gjedrem T. (1997) Flesh quality improvement in fish through breeding. Aquaculture
International 5:197-206.
Gjedrem T., Skjervold H. (1978) Improving Salmon and Trout Farm Yields through
Genetics. World Review of Animal Production 14:29-28.
Gokce N. (2004) L-arginine and hypertension. Journal of Nutrition 134:2807s-2811s.
Guderley H. (2004) Metabolic responses to low temperature in fish muscle. Biological
Reviews 79:409-427.
Hall G.M. (1997) Fish Processing Technology.
Hatae K., A. Tobimatsu M., Matsumoto T.a.J.J. (1986) Contribution of the connective
tissues on the texture difference of various fish species Bull. Jpn. Soc. Sci.
Fish. 52:2001-2007.
Hazel J.R. (1995) Thermal Adaptation in Biological Membranes: Is Homeoviscous
Adaptation the Explanation? Annual Review of Physiology 57:19-42.
38
Hillestad M., Johnsen F. (1994) High-energy/low-protein diets for Atlantic salmon:
effects on growth, nutrient retention and slaughter quality. Aquaculture
124:109-116.
Himelbloom B.H., Crapo C., Brown E.K., Babbitt J., Reppond K. (1994) Pink Salmon
(Oncorhynchus Gorbuscha) Quality during Ice and Chilled Seawater Storage.
Journal of Food Quality 17:197-210.
Hufflonergan E., Lonergan S. (2005) Mechanisms of water-holding capacity of meat:
The role of postmortem biochemical and structural changes. Meat Science
71:194-204.
K. Sato R., Yoshinaka M.S.a.Y.S. (1986) Collagen content in the muscle of fishes in
association with their swimming movement and meat texture. Bull. Jpn. Soc.
Sci. Fish. 52:1595-1600.
Kent M., Oehlenschlager J., Mierke-Klemeyer S., Manthey-Karl M., Knochel R.,
Daschner F., Schimmer O. (2004) A new multivariate approach to the problem
of fish quality estimation. Food Chemistry 87:531-535.
Kiessling A., Espe M., Ruohonen K., Morkore T. (2004) Texture, gaping and colour
of fresh and frozen Atlantic salmon flesh as affected by pre-slaughter
iso-eugenol or CO2 anaesthesia. Aquaculture 236:645-657.
Kiessling A., Helgestien L., Torslett O., Suontama J., Slinde E. (2006) Effect of pre-
and post-mortem temperature on rigor in Atlantic salmon muscle as measured
by four different techniques. Aquaculture 259:390-402.
Kirschke H., Wood L., Roisen F.J., Bird, J.W.C. (1983) Activity of lysosomal
cysteine proteinase during differentiation of rat skeletal muscle. Biochemical
Journal 214:871-877
Kong F., Tang J., Rasco B., Crapo C., Smiley S. (2007) Quality changes of salmon
(Oncorhynchus gorbuscha) muscle during thermal processing. Journal of Food
Science 72:S103-11.
Kramer D.E., Peters M.D. (2007) Effect of pH and prefreezing treatment on the
texture of yellowtail rockfish (Sebastes flavidus) as measured by the Ottawa
Texture Measuring System. International Journal of Food Science &
Technology 16:493-504.
Leatherland J.F., Lin L., Renaud R. (2004) Effect of glutamate on basal
steroidogenesis by ovarian follicles of rainbow trout (Oncorhynchus mykiss).
Comp Biochem Physiol B Biochem Mol Biol 138:71-80.
Leatherland J.F., Lin L., Renaud R. (2005) Effect of glutamate and somatostatin-14
on basal and cAMP-stimulated steroidogenesis by rainbow trout
(Oncorhynchus mykiss) ovarian follicles, in vitro. Comp Biochem Physiol B
Biochem Mol Biol 140:647-56.
Li P., Mai K., Trushenski J., Wu G. (2009) New developments in fish amino acid
nutrition: towards functional and environmentally oriented aquafeeds. Amino
Acids 37:43-53.
Lin Y., Xiao Q.Z. (2006) Dietary glutamine supplementation improves structure and
function of intestine of juvenile Jian carp (Cyprinus carpio var. Jian).
Aquaculture 256:389-394.
Lowe T.E., Ryder J.M., Carragher J.F., Wells R.M.G. (1993) Flesh Quality in
Snapper, Pagrcrs auratus, Affected by Capture Stress. Journal of Food Science
58:770-773.
Mørkøre T. (2001) Seasonal variations in growth, feed utilisation and product quality
of farmed Atlantic salmon (Salmo salar) transferred to seawater as 0+smolts or
1+smolts. pp. 145-157.

39
Mørkøre T. (2006) Relevance of dietary oil source for contraction and quality of
pre-rigor filleted Atlantic cod, Gadus morhua.
Mørkøre T., Austreng E. (2004) Temporal changes in texture, gaping, composition
and copper status of Atlantic salmon (Salmo salar, L) fed moist feed or
extruded dry feed.
Mørkøre T., Mazo P.I., Tahirovic V., Einen O. (2008) Impact of starvation and
handling stress on rigor development and quality of Atlantic salmon (Salmon
salar L).
Mørkøre T., Rødbotten M., Vogt G., ra S.O.F., Kristiansen I.Ø., Manseth E.,
Cabaleiro T. (2010a) Relevance of season and nucleotide catabolism on
changes in fillet quality during chilled storage of raw Atlantic salmon (Salmo
salar L.).
Mørkøre T., Rødbotten M., Vogt G., Fjra S.O., Kristiansen I.Ø., Manseth E.,
Cabaleiro T. (2010b) Relevance of season and nucleotide catabolism on
changes in fillet quality during chilled storage of raw Atlantic salmon (Salmo
salar L.).
Macagnano A., Careche M., Herrero A., Paolesse R., Martinelli E., Pennazza G.,
Carmona P., D'Amico A., Di Natale C. (2005) A model to predict fish quality
from instrumental features. Sensors and Actuators B-Chemical 111:293-298.
Matos E., Goncalves A., Nunes M.L., Dinis M.T., Dias J. (2010) Effect of harvesting
stress and slaughter conditions on selected flesh quality criteria of gilthead
seabream (Sparus aurata). Aquaculture 305:66-72.
Matschak T.W., Tyler D.D., Stickland N.C. (1998) Metabolic enzyme activities in
Atlantic salmon (Salmo salar L.) embryos respond more to chronic changes in
oxygen availability than to environmental temperature. Fish Physiology and
Biochemistry 18:115-123.
McElhaney R. (1976) The relationship between environmental temperature, cell
growth and the fluidity and physical state of the membrane lipids in Bacillus
stearothermophilus. Biochimica et Biophysica Acta (BBA) - Nucleic Acids
and Protein Synthesis 443:348-359.
Meldrum B.S. (2000) Glutamate as a neurotransmitter in the brain: Review of
physiology and pathology. Journal of Nutrition 130:1007s-1015s.
Merkin G.V., Roth B., Gjerstad C., Dahl-Paulsen E., Nortvedt R. (2010) Effect of
pre-slaughter procedures on stress responses and some quality parameters in
sea-farmed rainbow trout (Oncorhynchus mykiss). Aquaculture 309:231-235.
Mommsen T.P. (2001) Paradigms of growth in fish. Comparative Biochemistry and
Physiology B-Biochemistry & Molecular Biology 129:207-219.
Nedergaard M., Takano T., Hansen A.J. (2002) Opinion: Beyond the role of
glutamate as a neurotransmitter. Nature Reviews Neuroscience 3:748-755.
NS 9401 (1994) Atlantic Salmon - Reference sampling for quality assessment,
Norwegian Standard Association, Oslo.
Oehme M., Grammes F., Harald T., Zambonino-Infantee J.-L., Refstie S., Thomassen
M.S., Rørvik K.-A., Terjesen a.B.F. (2010) Dietary supplementation of
glutamate and arginine to Atlantic salmon (Salmo salar L.) increases growth
during the first autumn in sea. Aquaculture 310:156-163.
Øverland M., Sørensen M., Storebakken T., Penn M., Krogdahl Å., Skrede A. (2009)
Pea protein concentrate substituting fish meal or soybean meal in diets for
Atlantic salmon (Salmo salar)—Effect on growth performance, nutrient
digestibility, carcass composition, gut health, and physical feed quality.
Aquaculture 288:305-311.

40
PubChem Database n. (2011a) Arginine - Compound Summary.
PubChem Database n. (2011b) Glutamic Acid - Compound Summary.
Rahnama B. (2010) Supplementing a commerical diet for atlantic salmon (salmo salar
L.) with arginine, glutamate or tetradecylthioacetic acid (TTA). Impact on
production efficiency, slaughter parameters and flesh quality.
Reeds P.J., Burrin D.G., Stoll B., Jahoor F. (2000) Intestinal glutamate metabolism. J
Nutr 130:978S-82S.
Refstie S. (1998) Feed consumption and conversion in Atlantic salmon (Salmo salar)
fed diets with fish meal, extracted soybean meal or soybean meal with reduced
content of oligosaccharides, trypsin inhibitors, lectins and soya antigens.
Aquaculture 162:301-312.
Robb D.H.F., Kestin S.C., Warriss P.D. (2000) Muscle activity at slaughter: I.
Changes in flesh colour and gaping in rainbow trout. Aquaculture
182:261-269.
Robbins J. (1959) The excitation and inhibition of crustacean muscle by amino acids.
J Physiol 148:39-50.
Rodríguez-Jérez J.J., Hernández-Herrero M.M., Roig-Sagués A.X. (2000) New
methods to determine fish freshness in research and industry.
Rotllant J., Tort L. (1997) Cortisol and glucose responses after acute stress by net
handling in the sparid red porgy previously subjected to crowding stress.
Journal of Fish Biology 51:21-28.
Sigholt T., Erikson U., Rustad T., Johansen S., Nordtvedt T.S., Seland A. (1997)
Handling stress and storage temperature affect meat quality of farmed-raised
Atlantic salmon (Salmo salar). Journal of Food Science 62:898-905.
Skjervold P. (1999) Rigor in Atlantic salmon as affected by crowding stress prior to
chilling before slaughter. Aquaculture 175:93-101.
Skjervold P.O., Fjaera S.O., Ostby P.B. (1999) Rigor in Atlantic salmon as affected
by crowding stress prior to chilling before slaughter. Aquaculture 175:93-101.
Skjervold P.O., Fjaera S.O., Snipen L. (2002) Predicting live-chilling dynamics of
Atlantic salmon (Salmo salar). Aquaculture 209:185-195.
Skjervold P.O., Fjaera S.O., Ostby P.B., Einen O. (2001a) Live-chilling and crowding
stress before slaughter of Atlantic salmon (Salmo salar). Aquaculture
192:265-280.
Skjervold P.O., Rora A.M.B., Fjaera S.O., Vegusdal A., Vorre A., Einen O. (2001b)
Effects of pre-, in-, or post-rigor filleting of live chilled Atlantic salmon.
Aquaculture 194:315-326.
Statistics Norway. (2010) Statistical Yearbook of Norway.
Stien L.H., Hirmas E., Bjornevik M., Karlsen O., Nortvedt R., Rora A.M.B., Sunde J.,
Kiessling A. (2005) The effects of stress and storage temperature on the colour
and texture of pre-rigor filleted farmed cod (Gadus morhua L.). Aquaculture
Research 36:1197-1206.
Sveier H. (1998) The effect of feeding regime on growth, feed utilisation and weight
dispersion in large Atlantic salmon (Salmo salar) reared in seawater.
Aquaculture 165:333-345.
Sveinsdottir K., Hyldig G., Martinsdottir E., Jorgensen B., Kristbergsson K. (2003)
Quality Index Method (QIM) scheme developed for farmed Atlantic salmon
(Salmo salar). Food Quality and Preference 14:237-245.
Tapiero H., Mathe G., Couvreur P., Tew K.D. (2002) Dossier: Free amino acids in
human health and pathologies - II. Glutamine and glutamate. Biomedicine &
Pharmacotherapy 56:446-457.
41
Thomassen M., Gudding R., Norberg B., Jørgensen L. (2007) Aquaculture Research:
From Cage to Consumption The Research Council of Norway.
Vedel N.E., Korsgaard B., Jensen F.B. (1998) Isolated and combined exposure to
ammonia and nitrite in rainbow trout (Oncorhynchus mykiss): effects on
electrolyte status, blood respiratory properties and brain glutamine/glutamate
concentrations. Aquatic Toxicology 41:325-342.
Wicks B., Randall D. (2002) The effect of sub-lethal ammonia exposure on fed and
unfed rainbow trout: the role of glutamine in regulation of ammonia.
Comparative Biochemistry and Physiology - Part A: Molecular & Integrative
Physiology 132:275-285.
Wodtke E. (1981) Temperature adaptation of biological membranes. The effects of
acclimation temperature on the unsaturation of the main neutral and charged
phospholipids in mitochondrial membranes of the carp (cyprinus carpio L.).
Biochimica et Biophysica Acta (BBA) - Biomembranes 640:698-709.
Wu G. (2009) Amino acids: metabolism, functions, and nutrition. Amino Acids
37:1-17.
Wu G.Y., Morris S.M. (1998) Arginine metabolism: nitric oxide and beyond.
Biochemical Journal 336:1-17.
Yagiza Y., Kristinssona H.G., Balabanc M.O., Welta B.A., Marshallb M.R.a.M.R.
(2009) Effect of high pressure processing and cooking treatment on the quality
of Atlantic salmon. Food Chemistry 116:828-835.
Young A., Morris P., Huntingford F., Sinnott R. (2005) The effects of diet, feeding
regime and catch-up growth on flesh quality attributes of large (1+ sea winter)
Atlantic salmon. Aquaculture 248:59-73.