Filler Engineering for Energy Savings and Improved Paper...
41
Filler Engineering for Energy Savings and Improved Paper Properties Delong Song, Chunxu Dong, Art Ragauskas and Yulin Deng* Delong Song, Chunxu Dong, Art Ragauskas and Yulin Deng* IPST at Georgia Tech IPST at Georgia Tech Georgia institute of Technology Georgia institute of Technology TAPPI Con’09 June, 2009
Transcript of Filler Engineering for Energy Savings and Improved Paper...

Filler Engineering for Energy Savings and Improved Paper Properties
Delong Song, Chunxu Dong, Art Ragauskas and Yulin Deng*Delong Song, Chunxu Dong, Art Ragauskas and Yulin Deng*
IPST at Georgia TechIPST at Georgia Tech
Georgia institute of Technology Georgia institute of Technology
TAPPI Con’09
June, 2009

Advantages of Using Filler in PaperAdvantages of Using Filler in Paper
• Increase filler content in paper will improve paper optical properties (brightness, opacity, printing quality)
• Increase filler content in paper will reduce the papermaking cost– pulp price: $350-600/ton– filler cost (clay or PCC): $130-150/ton
• Increase water drainage rate • Increase solid content of paper web• Substitution of fiber will reduce the carbon footprint

Problems of Using Filler in PaperProblems of Using Filler in Paper•• Reduces the paper strengthReduces the paper strength•• Reduce the bulkReduce the bulk•• Some effects on the wetSome effects on the wet--end operation end operation
–– retentionretention–– sizing reversion (PCC filler)sizing reversion (PCC filler)–– water clarificationwater clarification–– two two sidenesssideness–– dense paperdense paper–– LintingLinting and dustingand dusting
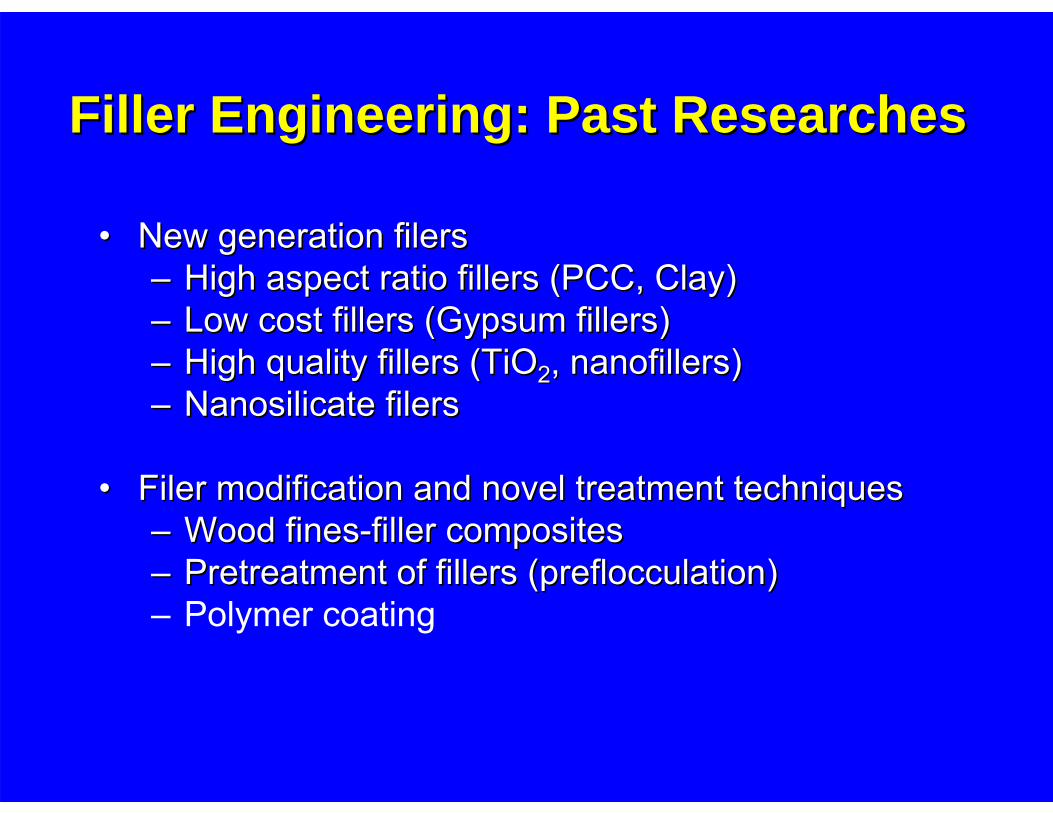
Filler Engineering: Past ResearchesFiller Engineering: Past Researches
•• New generation filersNew generation filers–– High aspect ratio fillers (PCC, Clay)High aspect ratio fillers (PCC, Clay)–– Low cost fillers (Gypsum fillers)Low cost fillers (Gypsum fillers)–– High quality fillers (TiOHigh quality fillers (TiO22, , nanofillersnanofillers) ) –– NanosilicateNanosilicate filersfilers
•• Filer modification and novel treatment techniquesFiler modification and novel treatment techniques–– Wood finesWood fines--filler compositesfiller composites–– Pretreatment of fillers (Pretreatment of fillers (preflocculationpreflocculation))– Polymer coating

Our Approach: Filler Treatment Using Starch
Filler
Starch adsorbed on filler Starch coated on filler aggregate
StarchIn traditional papermaking
Our approachfiber
Coated Filler
fiber
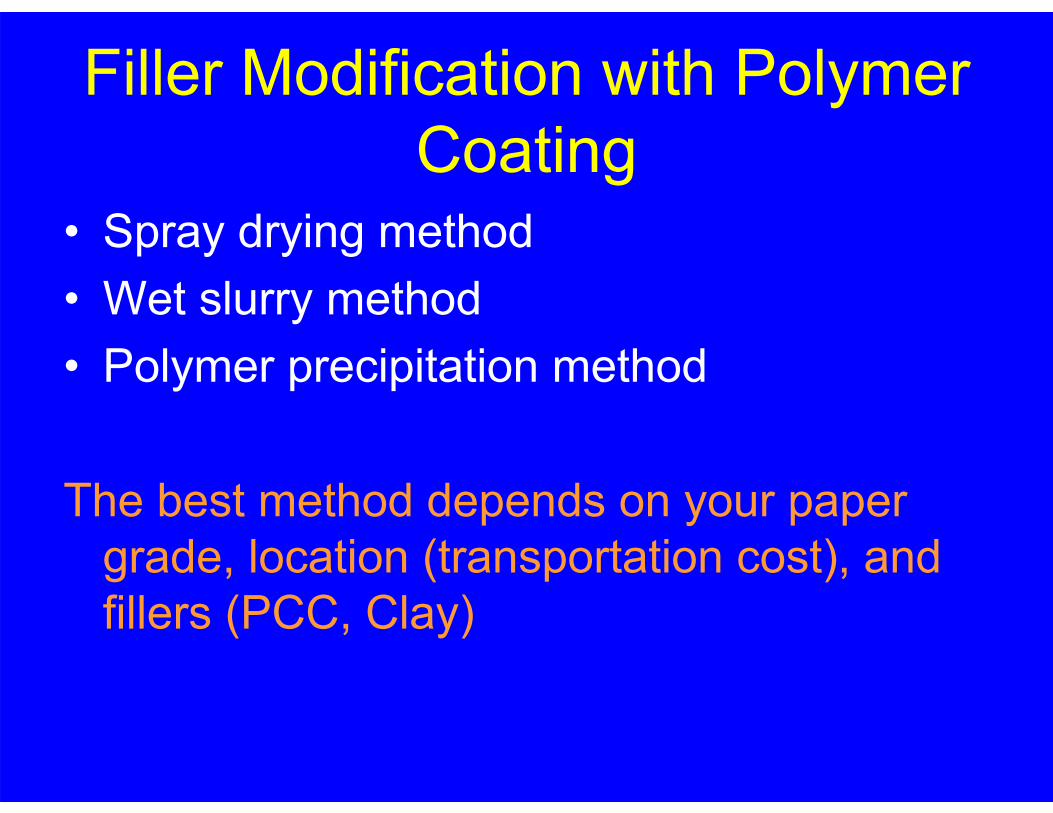
• Spray drying method• Wet slurry method• Polymer precipitation method
The best method depends on your paper grade, location (transportation cost), and fillers (PCC, Clay)
Filler Modification with Polymer Coating

Spray Drying MethodSpray Drying Method
Filler + starch + water
Cook
Filler + dissolved starch + water
Spray Dry
Starch-coated filler
CoatedCoatedFillerFiller
FillerFiller
Starch used is raw starch, which is ~$0.3/Lb, comparing with cationic starch of ~$1.3/lb
Both potato and corn starch can be used
2.5% starch based on clay is enough

One of our engineered fillers: raw starch (corn starch) coated clay: Spray dried method
Modifying the Spraying Dry Method by Adding Crosslinker

Starch Coated Clay for Linerboard Starch Coated Clay for Linerboard ApplicationApplication
• Why do we add filler in linerboard?– Energy saving– Machine running ability improvement – Printing quality– Raw material cost reduction
• Problems– Strength reduction– Filler retention

• Modified Clay – IMERYS (Atlanta, GA)– Modified clay coated with
precooked 2.5% corn starch via spray drying of 40% clay slurry
– Control: conventional clay with 3 lb/ton cationic starch
• Furnish– SW kraft pulp, kappa 105,
Inland– Pulp was beaten to C.S.F.
350 ml• Handsheets
– TAPPI method, 180 g/m2 ,
CPAM retention aid.
Spray – Dried Starch-Coated Clay – Handsheet ResultsTensile Index vs. Filler Content
30
35
40
45
50
55
0 5 10 15 20Filler Content (%)
Tens
ile In
dex
(Nm
/g)
Orig. Clay
2.5Corn
Ring Crush Index vs. Filler Content at Different CPAM Levels
11
12
13
14
15
16
17
0 2 4 6 8 10 12 14
Filler Content (%)
RIn
g C
rush
Inde
x (N
m/g
)
Orig. C lay (0-2 ppm C P A M )
Spray-D ried M o d. C lay, 2 .5C o rn (0-2 ppm C P A M )

R in g C r u s h I n d e x ( G M ) v s . C la y C o n t e n t
8
1 0
1 2
1 4
0 % 5 % 1 0 % 1 5 % 2 0 % 2 5 %
F i l le r C o n t e n t in S h e e t ( % )G
M R
ing
Cru
sh
Inde
x(N
m/g
)U n f i l le d L in e r C o n t r o l ( W i t h o u t S ta r c h ) U n m o d . C la y C o n t r o l w i t h C a t i
M o d i f ie d C la y ( U n m o d i f ie d S t a r c h ) M o d i f ie d C la y ( L o w V is c . S t a r c
M o d i f ie d C la y ( P r o p r ie t a r y P o ly m e r )
T e n s i le I n d e x ( G e o m e t r ic M e a n ) v s . C la y C o n t e n t
3 5
4 5
5 5
6 5
0 % 5 % 1 0 % 1 5 % 2 0 % 2 5 %
F i l le r C o n t e n t in S h e e t ( % )
GM
Ten
sile
Inde
x (N
m/g
)
U n f i l le d L in e r C o n t r o l ( W i t h o u t S t a r c h )U n m o d . C la y C o n t r o l w i t h C a t io n ic S t a r c hM o d i f ie d C la y ( U n m o d i f ie d S t a r c h )M o d i f ie d C la y ( L o w V is c . S t a r c h )M o d i f ie d C la y ( P r o p r ie t a r y P o ly m e r )
Handsheet Properties Using different Starches(Lab Results)

Stiffness reduced only slightly at 10% modified clay content. Over 10% increase in tensile and ring crush with modified vs conventional clay
GM Ring Crush Index vs. Clay Content
7
8
9
10
11
12
13
0 5 10 15 20 25
Clay Content in Sheet (%)
GM
Rin
g C
rush
inde
x (N
m/g
)
Original ClayModified Clay
1.5
2.0
2.5
3.0
3.5
0 5 10 15 20 25
Clay content (%)
Stiff
ness
(mN
m),
GM
Modified clayOriginal clay
HertyHerty TrialTrial

Herty Pilot TrialHerty Pilot Trial
Bulk maintained at 10% modified clay content
1.2
1.3
1.4
1.5
1.6
0 5 10 15 20 25
Clay content (%)
Bul
k (c
m3 /g
)
Modified clayOriginal clay
Effect of Clay on Sheet Dewatering
0
10
20
30
40
50
60
0 10 20 30 40 50 60Sheet Ash Content (%)
Solid
Conte
nt (%
)
Clay, Couch CMod. Clay, Couch CClay, Press CMod. Clay, Press C
Dryness off Couch
Dryness out of Press

Summary of Starch Coated Clay in Linerboard Application
(Spray Dry Method)• Raw Starch can be easily coated on clay surface• 2.5% starch (based on filler) is enough to
achieve highest strength benefit• Adding starch coated filler to linerboard can
reduce papermaking cost• Up to 8% of starch coated filler do not reduce
the strength properties • Adding filler can significantly improve the
drainage rate, solid content and drying rate • Several mill trials using starch coated filler have
been done

Starch-clay Composite by Fatty Acid Complexation
Unmodified corn starch and palmitic acid (or stearic acid sodium salt)
Starch
HCl (below pH 4)
NaOH (pH 11~12)Cooking
Neutralization
Clay Fatty acidStarch
HCl
NaOH (pH 11~12)Cooking
Neutralization
Clay Fatty acid
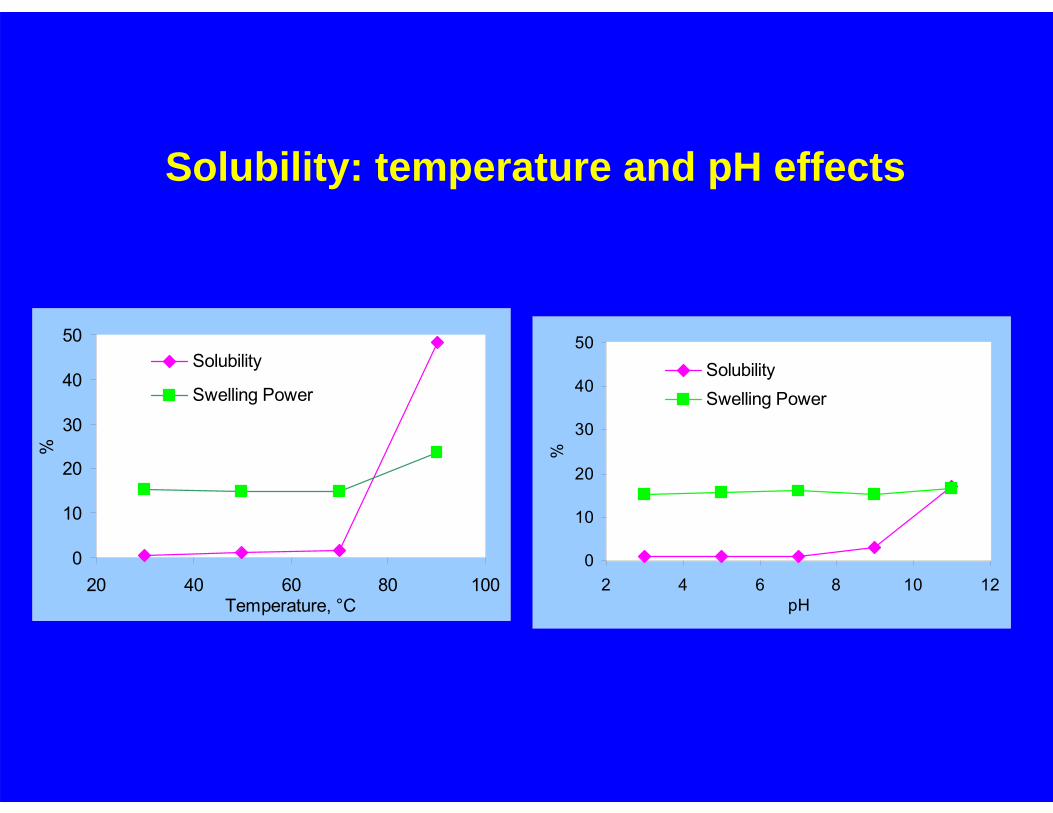
The mechanism of starch-filler composite is due to the formation of starch-fatty acid complex which is water insoluble at low pH
Wet methods

Starch-Clay Composite Aggregates Formation
Cooked raw starchClay slurry (2-25%)
Fatty acid
Low pH < 4
Starch-clay composite suspension
0
10
20
30
40
50
20 40 60 80 100Temperature, °C
%
Solubility
Swelling Power
Solubility: temperature and pH effects
0
10
20
30
40
50
2 4 6 8 10 12pH
%
SolubilitySwelling Power

Application of the technique
• Can be used for modifying both clay and PCC. For PCC, calcium ions can precipitate the starch and no acid is need to bring the pH down
• Can be applied to different paper grades

Physical properties
10
30
50
70
0% 10% 20%
Clay dosage, %
Tens
ile In
dex,
Nm
/g
starch(palmitic 10%) clay 1:1 starch(palmitic 30%) clay 1:1 clayconventional method
0
250
500
750
1000
0% 10% 20%
Clay dosage, %ZD
T, K
Pa
starch(palmitic 10%) clay 1:1 starch(palmitic 30%) clay 1:1 clayconventional method
~120% increase comparing to clay-fiber only
~ 60% increase comparing to cationic starch (conventional method) method
Copy paper

Physical properties (cont.)
0.0
0.2
0.4
0.6
0.8
0% 10% 20% 30%
Composite dosage, %
Burs
t Ind
ex, k
Pa●
m2/
g
starch(palmitic 10%) clay 1:1 starch(palmitic 30%) clay 1:1 clay
0
2
4
6
0% 10% 20% 30%
Composite dosage, %Fo
ldin
g In
dex,
tim
es●m
2/g
starch(palmitic 10%) clay 1:1 starch(palmitic 30%) clay 1:1 clay
Copy paper
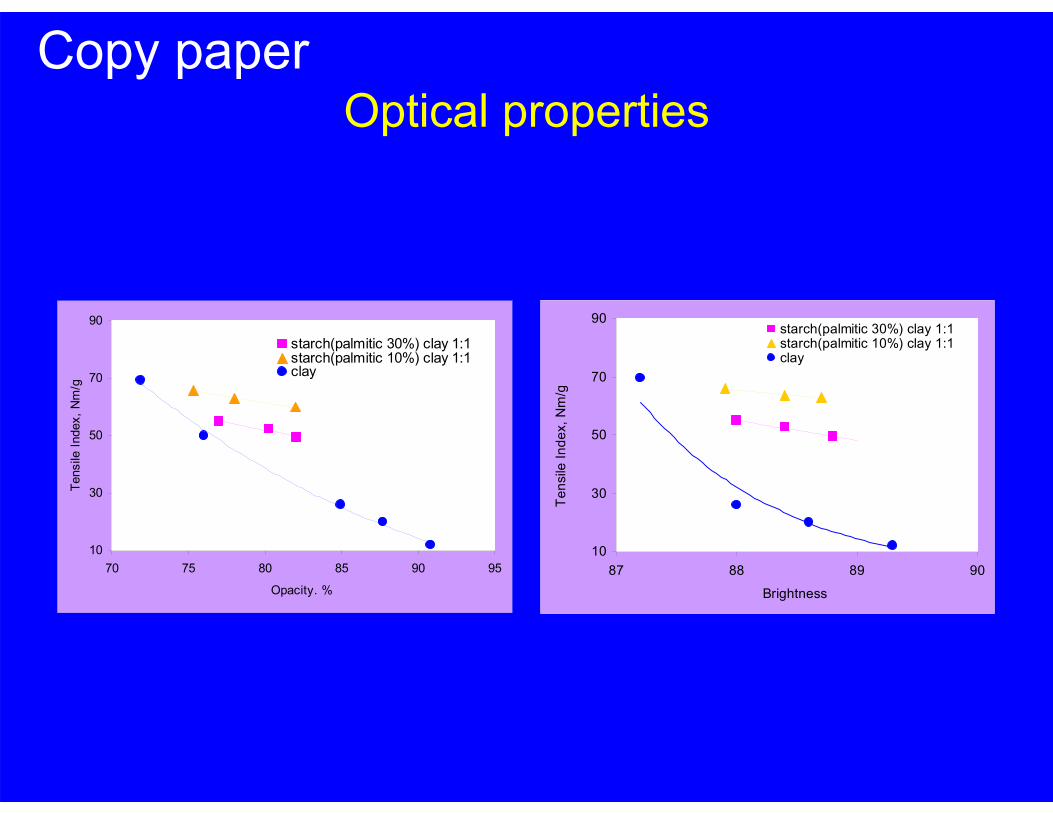
Optical properties
10
30
50
70
90
87 88 89 90
Brightness
Tens
ile In
dex,
Nm
/g
starch(palmitic 30%) clay 1:1 starch(palmitic 10%) clay 1:1 clay
10
30
50
70
90
70 75 80 85 90 95
Opacity. %
Tens
ile In
dex,
Nm
/g
starch(palmitic 30%) clay 1:1 starch(palmitic 10%) clay 1:1 clay
Copy paper

fatty acid
10%
fatty acid
30%
fatty acid
10%
fatty acid
30%
Distribution and Bonding (SEM)Copy paper
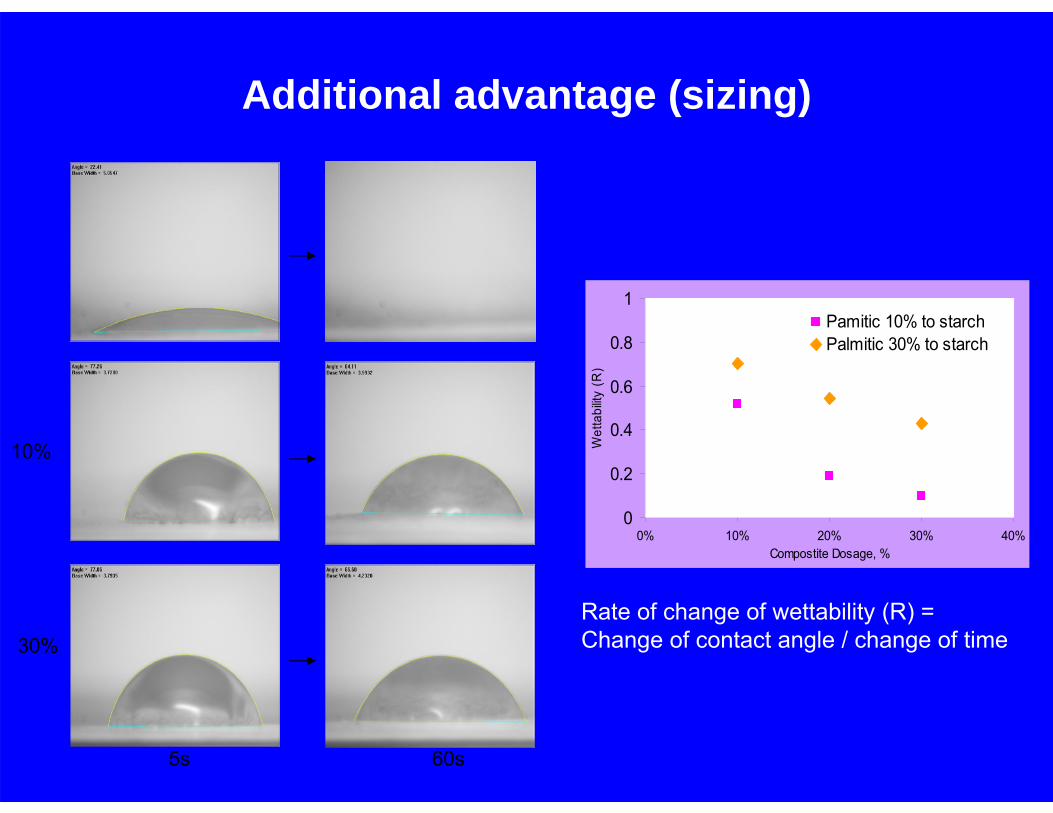
Additional advantage (sizing)
0
0.2
0.4
0.6
0.8
1
0% 10% 20% 30% 40%Compostite Dosage, %
Wet
tabi
lity (R
)
Pamitic 10% to starchPalmitic 30% to starch
Rate of change of wettability (R) = Change of contact angle / change of time
5s 60s
30%
10%

• The pulp with various amounts of clay-starch composites was diluted to 1L of 0.5 wt% respectively.
• Percol-175 was added at 0.1wt% based on solid weight for clay retention.
• Drainage time was measured by a Dynamic drainage analyzer (DDA).
Drainage test
Energy saving and machine runnabilityimprovement by adding fillers

Vacuum vessel (0.2 bar)
Stirrer (800rpm)DDA drainage unit
Drainage is measured as the time from the start of run until air start being sucked though the sheet.

Effect of filler content on the drainage rate
6
6.5
7
7.5
8
8.5
9
9.5
10
0 0.05 0.1 0.15 0.2 0.25 0.3 0.35filler content
time
of d
rain
age/
s
Clay filler; C-PAM retention aid at 2lb/ton; linerboard
Drainage rate was increased (or drainage time decreased) >20% byadding 20% fillers

• Unbleached kraft pulp (60% hardwood and 40% softwood) was refined in a Valley beater to a freeness of 400 CSF.
• Starch modified clay (spray-dry method) was provided by Imerys as the filler.
• Percol-175 (high molecular weight, low charge density polyacrylamideretention aid) was obtained from Ciba specialty Chemicals.
• The filler content was determined by ashing the paper in a muffler oven according to the standard TAPPI method T211.
• After a slightly wet pressing (50psi,5min, no heating), handsheets with a target basis weight of 200g/m2 were prepared and ready for pressing and drying test
Water removal tests (press and drying sections)

Wet pressing test• The testing system used was
the MTS Testing Machine controlled by a MTS 458.20 Micro Console.
• Handsheets were cut to a suitable size for the MTS press. The weights of the samples before and after press (600psi) were both measured immediately. •MTS 458.20 Micro Console.
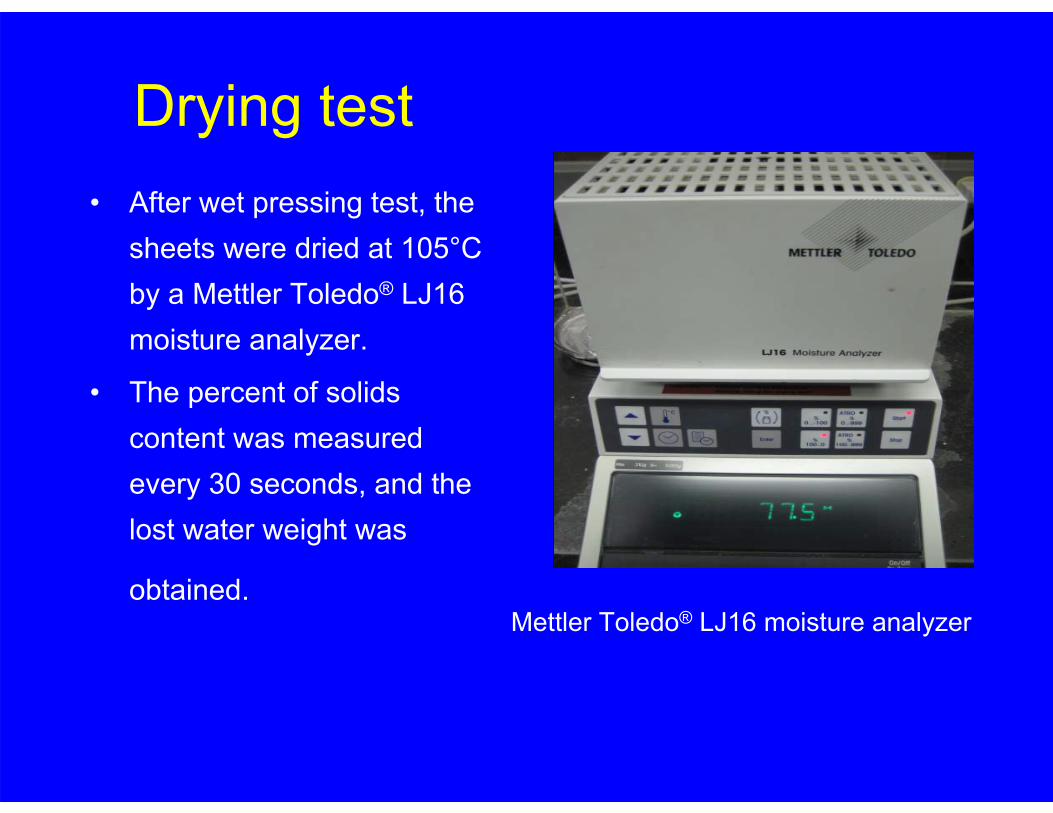
Drying test• After wet pressing test, the
sheets were dried at 105°C by a Mettler Toledo® LJ16 moisture analyzer.
• The percent of solids content was measured every 30 seconds, and the lost water weight was
obtained.Mettler Toledo® LJ16 moisture analyzer

Effect of filler addition on the solid content after press
0.2
0.24
0.28
0.32
0.36
0.4
0 5 10 15 20 25 30
Fille r Content (%)
Solid
Con
tent
aft
er P
ress
ing
(%)
Test-1 and Test-2 were two independent tests with the same pressure
Solid content increased from 30% to 36% under 600 psi pressing
Test-10.20
0.24
0.28
0.32
0.36
0.40
0% 5% 10% 15% 20% 25% 30%filler content, %
Solid
con
tent
afte
r pre
ssin
g (%
)
Test-2
Solid content increased 6 absolute points by adding 23% filler.

Effect of filler addition on the solid content after press
1
1.5
2
2.5
3
0 0.05 0.1 0.15 0.2 0.25 0.3
filler content
wat
er/d
ry w
eigh
t aft
er p
ress
Relative water content (water/dry paper) after press decreased from 2.3 to 1.65 by adding 25% filler, witch corresponding to 26% reduction in the water content
1
1.5
2
2.5
3
0 5 10 15 20 25 30filler content, %
wat
er w
eigh
t /dr
y w
eigh
t afte
r pre
ss
Two figures were generated from two independent tests

Web solid content as a function of press cycles at 600psi
25
30
35
40
45
50
0 1 2 3 4 5 6press cycles
solid
con
tent
, %
0% filler 6% filler11% filler 18% filler23% filler
Solid content increased by 5 weight percents by adding 23% filler.
For every 1% increase in exiting press solids, an approximate 4% increase in machine speed can be projected on a dryer-limited machine. 5% increase in solid content will result in 20% improvement in the machine speed.

20
25
30
35
40
45
0 5 10 15 20 25
filler content, %
solid
con
tent
, %
1150psi610psi
Solid content as a function of filler content
25
30
35
40
45
50
0 5 10 15 20 25filler content, %
solid
con
tent
, %
5 4 32 1
Different pressure (single cycle) Different cycles at 600 psi

Effect of filler addition on the drying rate
The water drying time decreased from 10 minutes to 8 minutes, which saving drying energy by 20%.
Two figures were generated from two independent tests
0
20
40
60
80
100
120
0 2 4 6 8 10 12 14time,min
wat
er re
mov
ed/to
tal w
ater
,%
24%
21%
16%
11%
6%
0%
0
20
40
60
80
100
120
0 2 4 6 8 10 12
time (min)water removed/total w
ater
(%)
0%
4.98%
9.39%
16.41%
21.70%
25.90%
Test-1Test-2
Drying time (8min) with 24% filler Drying time (10min) with 0% filler

Mill Trials
• 5 mill trials have been done by Imerys at different mills (4 at Interstate Paper and 1 at Stora Enso).
• Linerboard and starch coated filler made by spray drying was used

Impact of Traditional Filler in Linerboard
20
21
22
23
24
25
26
27
28
29
30
Control (0) 2.5 5% Filler in board
STF
I (N
m/g
)
4.8% loss from
unfilled9.5% loss from
unfilled
6
6.57
7.58
8.5
99.5
1010.5
11
Control (0) 2.5 5% Filler in board
Rin
g C
rush
(Nm
/g) 7% loss
from unfilled 14% loss
from unfilled
Most suitable for mills making heavy weight linerboard with some strength to give.Probably not applicable across the grade range for any mill.Probably won’t allow incremental production gains (machine speed gains not possible due to strength loss)
- improved drying rates recouped as energy savings, or if machine can refine more will gain back some strength whilst reducing CSF
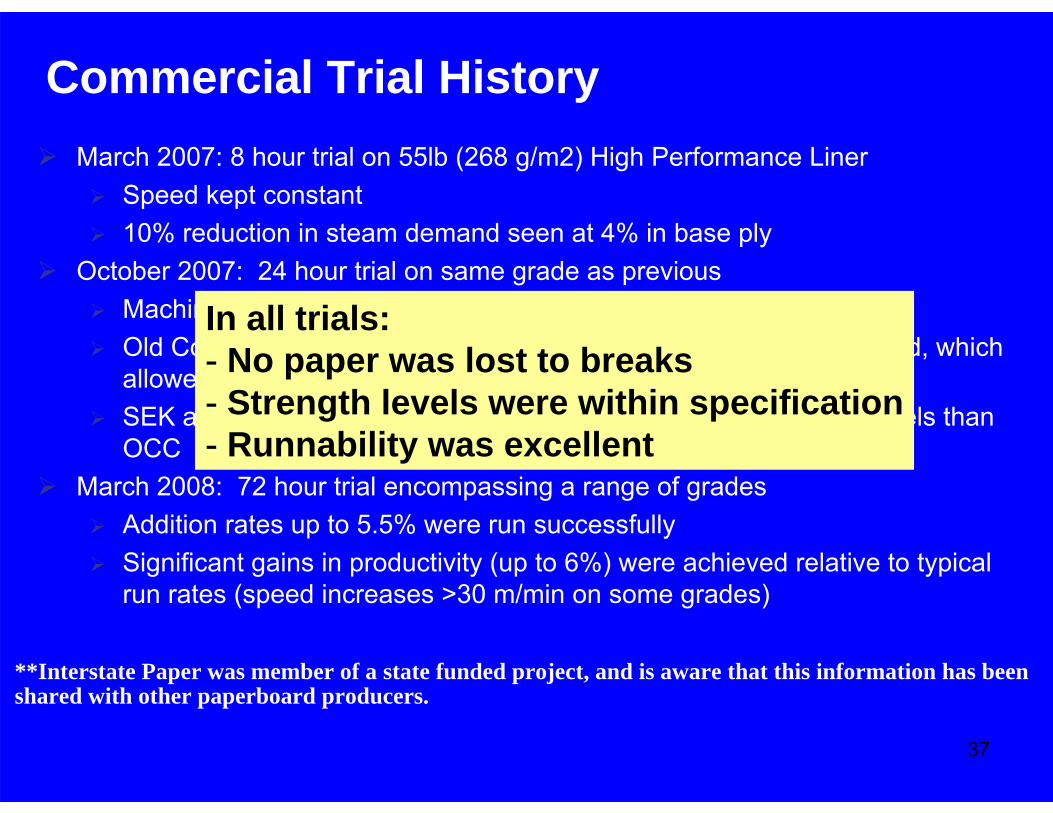
37
Commercial Trial HistoryMarch 2007: 8 hour trial on 55lb (268 g/m2) High Performance Liner
Speed kept constant10% reduction in steam demand seen at 4% in base ply
October 2007: 24 hour trial on same grade as previousMachine speed gains of 10-13 m/min were achievedOld Corrugated Containerboard (OCC/recycled) flow was interrupted, which allowed an unexpected evaluation of OCC versus SEKSEK appeared to have more impact on machine speed at lower levels than OCC
March 2008: 72 hour trial encompassing a range of gradesAddition rates up to 5.5% were run successfullySignificant gains in productivity (up to 6%) were achieved relative to typical run rates (speed increases >30 m/min on some grades)
**Interstate Paper was member of a state funded project, and is aware that this information has beenshared with other paperboard producers.
In all trials:- No paper was lost to breaks- Strength levels were within specification- Runnability was excellent
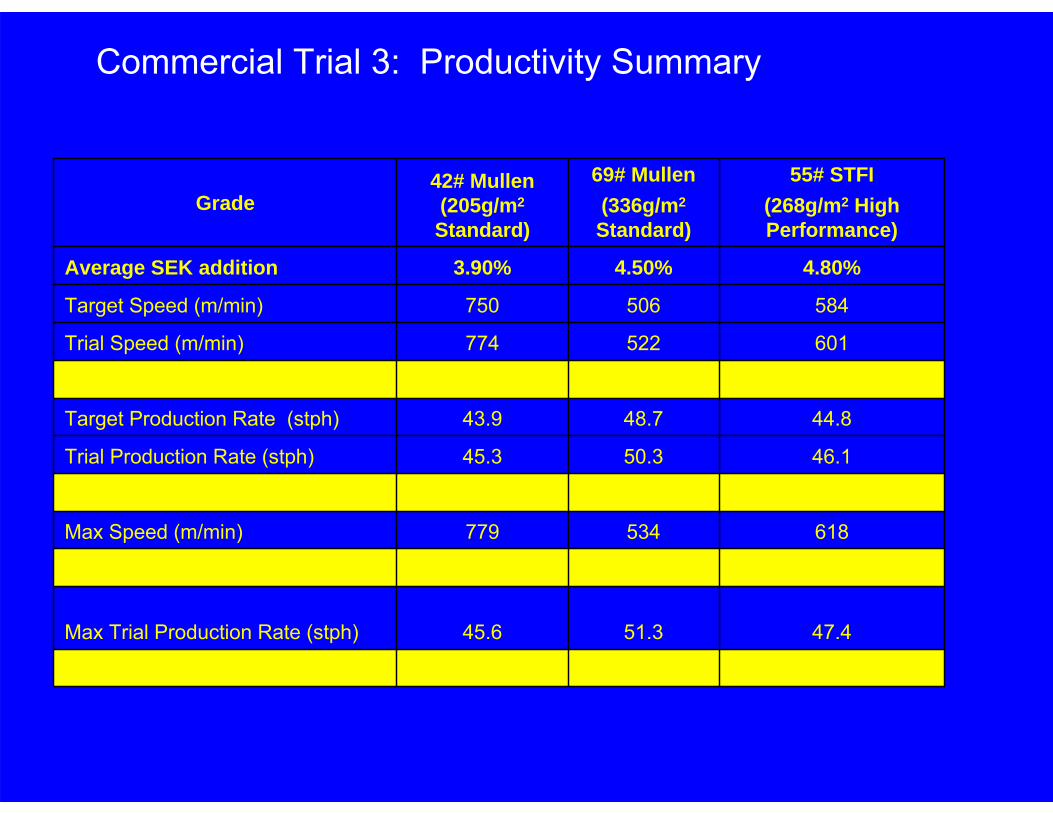
Commercial Trial 3: Productivity Summary
5.8%5.3%3.9%Max Productivity Boost (%)
47.451.345.6Max Trial Production Rate (stph)
342829Max Speed Gain (m/min)
618534779Max Speed (m/min)
2.9%3.3%3.2%Trial Productivity Boost (%)
46.150.345.3Trial Production Rate (stph)
44.848.743.9Target Production Rate (stph)
171624Trial Speed Gain (m/min)
601522774Trial Speed (m/min)
584506750Target Speed (m/min)
4.80%4.50%3.90%Average SEK addition
55# STFI(268g/m2 High Performance)
69# Mullen(336g/m2
Standard)
42# Mullen (205g/m2
Standard)Grade

Commercial Trial 3: Impact on Strength
25
27
29
31
33
35
37
39
0 1 2 3 4 5 6
SEK Flow (% of Primary Ply)
STFI
(lbf
/in)
Target
Minimum
90.0
100.0
110.0
120.0
130.0
140.0
150.0
160.0
0 1 2 3 4 5 6SEK Flow (% of Primary Ply)
Mul
len
42# Mullen 69# Mullen
Target
Target
Minimum
Minimum
No correlation between critical strength tests and SEK dosage rates.

40
Value Proposition for SEK in Linerboard
4 -5% SEK in linerboard results in the following benefits:
• Fiber replacement or extender • Can substitute or extend OCC and Virgin fiber• No statistical impact on strength and slide angle• Faster drainage and drying • Reduced steam demand - 10% • Potential for speed increase - ~ 100 fpm • Production rate increase of up to 3tph on 55lb liner

Overall Conclusions• Adding our starch coated clay to linerboards
– improve water drainage rate– increase machine runnability– increase solid content by 3-5 absolute point– Saving drying energy by >10%
• Starch coated filler does not detrimentally impact linerboard sheet strength up to filler content of 8%
• The starch modified filler can also be used to improve newsprint properties• The starch coated filler shows higher strength properties than adding filler and starch
separately in wet end.• Two modification methods (wet and spray drying) are developed• Our techniques can be used for both PCC and clay• Several mill trials have been done, and the longest trial was last three weeks. The
trail was very success. • Intellectual Property
– A patent of filler modification use starch and starch-fatty acid composite has been filed at US Patent Agent in September 2007
• Publication number: US 2008/0087396 A1