files.eric.ed.gov · · 2014-03-18AUTHOR Byrne, Barbara M. TITLE Testing for Factorially ......
50
DOCUMENT RESUME ED 310 175 TM 014 014 AUTHOR Byrne, Barbara M. TITLE Testing for Factorially Invariant Measuring Instruments: A Reexamination and Application. PUB DATE Aug 88 NOTE 50p.; Paper presented at the Annual Meeting of the American Psychological Association (Atlanta, GA, August 12-16, 1988). PUB TYPE Speeches/Conference Papers (150) -- Reports - Evaluative /Feasibility (142) EDRS PRICE MF01/PCO2 Plus Postage. DESCRIPTORS Academically Gifted; Analysis of Covariance; Analysis of Variance; Elementary Education; *Factor Analysis; Grade 5; Grade 8; Latent Trait Theory; Mathematical Models; *Measurement Techniques; Research Methodology; *Research Problems; Statistical Analysis; Test Reliability; *Test Validity IDENTIFIERS Confirmatory Factor Analysis; *Invariance; *LISREL Computer Program; Perceived Competence Scale For Children ABSTRACT The paper identifies and addresses four methodological weaknesses common to most previous studies that have used LISREL confirmatory factor analysis to test for the factorial validity and invariance of a single measuring instrument. Specifically, the paper demonstrates the steps involved in: (1) conducting sensitivity analyses to determine a statistically best-fitting, yet substantively most meaningftl baseline model; (2) testing for partial measurement invariance; (3) testing for the invariance of factor variances and covariances, given partial measurement invariance; and (4) testing for the invariance of test item and subscale reliabilities. These procedures are illustrated with item response data from the Perceived Competence Scale for Children from 129 normal and 132 gifted students in grade 5 and 113 normal and lli gifted students in grade 8 from two public school systems in Ottawa (Ontario). Seven tables present study data. (Author/SLD) ********* ************* ********** *************************************** * Reproductions supplied by EDRS are the best that can be made * * from the original document. * ************* **** ***** *********** ******** **** ******* **,.******** ***** ***
Transcript of files.eric.ed.gov · · 2014-03-18AUTHOR Byrne, Barbara M. TITLE Testing for Factorially ......

DOCUMENT RESUME
ED 310 175 TM 014 014
AUTHOR Byrne, Barbara M.TITLE Testing for Factorially Invariant Measuring
Instruments: A Reexamination and Application.PUB DATE Aug 88NOTE 50p.; Paper presented at the Annual Meeting of the
American Psychological Association (Atlanta, GA,August 12-16, 1988).
PUB TYPE Speeches/Conference Papers (150) -- Reports -Evaluative /Feasibility (142)
EDRS PRICE MF01/PCO2 Plus Postage.DESCRIPTORS Academically Gifted; Analysis of Covariance; Analysis
of Variance; Elementary Education; *Factor Analysis;Grade 5; Grade 8; Latent Trait Theory; MathematicalModels; *Measurement Techniques; ResearchMethodology; *Research Problems; StatisticalAnalysis; Test Reliability; *Test Validity
IDENTIFIERS Confirmatory Factor Analysis; *Invariance; *LISRELComputer Program; Perceived Competence Scale ForChildren
ABSTRACT
The paper identifies and addresses fourmethodological weaknesses common to most previous studies that haveused LISREL confirmatory factor analysis to test for the factorialvalidity and invariance of a single measuring instrument.Specifically, the paper demonstrates the steps involved in: (1)
conducting sensitivity analyses to determine a statisticallybest-fitting, yet substantively most meaningftl baseline model; (2)testing for partial measurement invariance; (3) testing for theinvariance of factor variances and covariances, given partialmeasurement invariance; and (4) testing for the invariance of testitem and subscale reliabilities. These procedures are illustratedwith item response data from the Perceived Competence Scale forChildren from 129 normal and 132 gifted students in grade 5 and 113normal and lli gifted students in grade 8 from two public schoolsystems in Ottawa (Ontario). Seven tables present study data.(Author/SLD)
********* ************* ********** **************************************** Reproductions supplied by EDRS are the best that can be made *
* from the original document. *
************* **** ***** *********** ******** **** ******* **,.******** ***** ***

iltbPool
CD Testing for Factorial ly Invariant Measuring Ins.;:ruments:p"4
VD A Reexamination and Application
Barbara M. Byrne
University of Ottawa
Paper presented at the American Psychological Association
Annual Meeting, Atlanta, 1988
U.S. DEPARTMENT OF EDUCATIONOffice of Educational Research and Improvement
EDUCATIONAL RESOURCES INFORMATIONCENTER (ERIC)*This document has been reproduced as
eceived from the person or organizationoriginating it
O Minor changes have been made to improvereproduction quality.
Points of view or opinions stated in this docu-ment do not necessarily represent officialOERI position or policy.
"PERMISSION TO REPRODUCE THISMATERIAL HAS BEEN GRANTED BY
eARaillaA KARI.*
TO THE EDUCAliONAL RESOURCES
INFORMATION CENTER (ERIC)."
4 BEST COPY AVAILABLE

Factorial Validity
2
Abstract
The paper identifies and addresses four methodological
weaknesses common to most previous studies that have used
LISREL confirmatory factor analysis to test for the factorial
validity and invariance of a single measuring instrument.
Specifically, the paper demonstrates the steps involved in (a)
conducting sensitivity analyses to determine a statistically
best-fitting, yet substantively most meaningful baseline model,
(b) testing for partial measurement invariance, (c) testing for
the invariance of factor variances and covariances, given
partial measurement invariance, and (d) testing for the
invariance of test item and subscale reliabilities. These
procedures are illustrated with item response data from normal
and gifted children in grades 5 and 8, based on the Perceived
Competence Scale for Children.
Factorial Validity
3
Testing the Factorial Validity and Invariance of a Measuring
Instrument Using LISREL Confirmatory Factor Analyses:
A Reexamination and Application
In substantive research, an important assumption in
single-group analyses is that the assessment instrument is
measuring that which it was designed to measure (i.e., it is
factorially valid), and in multigroup analyses, that it is
doing so in exactly the same way across independent samples
(i.e., it is factorially invariant). Traditionally, the factor
structure of a measuring instrument has been validated by means
of exploratory factor analysis (EFA), and its invariance tested
by the comparison of EFA factors across groups using diverse ad
hoc procedures (for a review, see Marsh & llocevar, 1985;
Reynolds & Harding, 1983). At this point in time, however, the
limitations of EFA are widely known (see e.g., Fornell, 1983;
Long, 1983; Marsh & Hocevar, 1985), as are the issues related
to tests of factorial invariance based on EFA factors (see
Alwin & Jackson, 1981).
A methodologically more sophisticated and statistically
more powerful technique for such analyses is the confirmatory
factor analytic (CFA) procedure proposed by Joreskog (1969),
and now commercially available through the LISREL VI computer
program (Joreskog & Sorhom, 1985). The LISREL CFA approach

... . ....avoyam al INT wo44otsm swwwvie41111111,111.1.111MMIIP
e
Factorial Validity
4
allows researchers to test a series of hypotheses related to
(a) the factorial validity of an assessment instrument, and (b)
the equivalency of its factorial structure and measurements
across groups. While a number of construct validity studies
have applied the technique to multitrait-multimethod analyses
of assessment measures (e.g., Bachman & Palmer, 1981; Flamer,
1983; Forsythe, McCaghie. & Friedman, 1986; Marsh & Hocevar,
1984; Watkins & Hattie, 1981), few have used it to evaluate the
factorial validity or factorial invariance of a single
measuring instrument; of these, most have been incomplete in
terms of model fitting'procedures and tests of invariance. The
purpose of the present paper, in broad terms, is to address
these limitations in a demonstration of LISREL CFA procedures
for testing the factorial validity and invariance of a single
measuring instrument.
LISREL Confirmatory Factor Analysis
Factor analysis, in general terms, is a statistical
procedure for determining whether covariation among a set of
observed variables can be explained by a smaller number of
latent variables (i.e., factors). In contrast to EFA, where the
only hypothesis tested concerns the number of factors
underlying the observed data (Bentler, 1978), CFA permits the
testing of several hypotheses; the number and degree of
specificity being determined by the investigator. As such,

Factorial Validity
5
based on his/her knowledge of theoretical and empirical
research, the investigator postulates a priori, a particular
factor analytic model and then tests the model to determine
whether or not it is consistent with the observed data;
minimally, model specifications would include the number of
latent factors, the pattern of factor loadings, and relations
among the latent factors.
The LISREL CFA framework incorporates two conceptually
distinct models --- a measurement model and a structural model.
The first of these specifies how the observed (i.e., measured)
variables relate to the underlying latent (i.e., unobserved,
unmeasured) factors; the second specifies relations among the
latent factors themselves. In LISRFI notation, this means that,
typically, the factor loading (lambda, A), error (theta,0) and
latent factor variance-covariance (phi,4 ) matrices are of
primary importance. More specifically, A is a matrix of
coefficients regressed from latent factors to observed
variables, and 0 is the variance-covariance matrix of
error/uniruenesses. These matrices make up the measurement
aspect of the model 4) is the factor variance-covariance matrix2
and constitutes the structural part of the model. Since a
number of papers are available to readers that (a) specify the
statistical theory underlying LISREL CFA (e.g., Joreskog, 1969;
Long, 1983), (h) outline basic notation and steps in using the

Factorial Validity
6
LISREL program (e.g., Lomax, 1982; Long, 1983; Wolfle, 1981),
and (c) summarize advantages of LISREL CFA over tradition.al EFA
procedures (e.g., Long, 1983; Marsh & Hocevar, 1985), these
details are not provided here.
The.process of validating the factorial structure of a
measuring instrument and then testing for its invariance across
groups involves two separate` analytical procedur.:_:4 the first
is a prerequisite for the second. The initial step entails the
estimation of a baseline model; since this procedure involves
no between-group constraints, the data are analyzed separately
for each group. The baseline model represents the most
parsimonious, yet substantively meaningful And best-fitting
model to the data. Since instruments are often group-specific
in the way they operate, these models are not expected to be
identical across groups. For example, whereas the baseline
model for one group might include correlated measurement errors
and/or secondary factor loadings, this may not be so for the
second group A priori knowledge of such group differences, as
will be illustrated later, is critical in testing for
equivalencies across groups.
Having determined the baseline model for each group, the
investigator may then proceed to tests of factorial invariance.
Since these analyses involve the imposition of constraints on
particu'ar parameters, the data from all groups must be
"I
...-

Factorial Validity
7
analyzed simulcr'neously to obtain efficient estimates (Joreskog
F. Sorbom, 1985). It is important to note, however, that the
pattern of fixed and free parameters remains consistent with
the baseline model specification for each group. (For a review
of 1.1SqE1. CFA invariance testing applications, see Byrne,
Shavelson A luthim. in nress; for details of the procedure in
general, see Alwin & .Jackson, P)Sl; Byrne et al., in press;
Joreskog, 1971a; Marsh & Nncevar. 1985; Rock, erts & Flaugher,
1978.
A review of previous stdies using CFA LISREL procedures to
validate assessment measures reveals several limitations.
First, with three exceptions (Byrne, in press; Marsh, 1987b;
Tanaka & !Juba, 1984), researchers have not considered alternate
model specifications beyond the one initially hypothesized (see
Benson, 1987; Marsh, 1985, 1987a; Marsh & Hocevar, 1985; Marsh
& O'Neill, 1984; Marsh, Smith & Barnes, 1985). In other words,
researchers have (a) postulated a model, (h) tested its fit to
the observed data. (c) argued for the adequacy of model fit,
and (d) evaluated factorial validity on the basis of this a
priori model. Such validity claims, however, may be considered
dubious for at least two reasons: (a) in many cases, model fit4
was only marginally good, and (h) these models did not allow
for sample-specific artifacts such as nonrandom measurement
error (i.e., correlated error) and/or secondary factor
V

,.ric o" t ri al Validity
loadings, to.findings not uncommon to measures of psycho-
logical constructs (see e.g., Byrne, in press; Byrne &
Shavelson, 1986; 'tuba, Wingard, P. Bentler, 1981; Newcomb, !tuba.
& gentler, 1986; Tanaka 8 uha, 1984). More appropriately,
model fitting should continue beyond the initially hypothesized
model until a statistically. best- fitting model is determined;
additional analyses can then he conducted to establish which
parameters are statistically, as well as substantively
important to the CFA model. In so doing, both practical and
statistical significance are taken into account (Muthen,
personal communication, .January, 1987; see also. Huha et al.,5
1981; Tanaka A Jiuha, 1984).
While some have criticized such post hoc model-fitting
practices (e.g., llrowne, 1982; Fornell, 1983; MacCallum, 1987),
Tanaka and Huhn (1934) have argued that the process can he
substantively meaningful. For example, if the estimates of
major parameters undergo no appreciable change when minor
parameters are added to the model, this is an indication that
the initially hypothesized model is empirically robust; the
more fitted model therefore represents a minor improvement to
an already adequate model and the additional parameters should
be deleted from the model. If, on the other hand, the major
parameters undergo substantial alteration, the exclusion of the
post hoc parameters may leid to biased estimates (Alwin
9

Factorial validity
(}
Jackson. l9(0; )oreskog, 1983); t'ie minor parameters should
therefore he retnined in the model.
One method of estimating the pra:tical significance of post
hoc parameters is to correlate major parameters (the A 's and
's) in the initially hypothesized model with those in the
best-fitting post hoc model (c.f. Marsh, 1987b). Coefficients
close to 1.00 argue for the stability of the initial model and
thus. the triviality of the minor parameters in the post hoc
model. Tn contrast, coefficients that are not close to 1.00
(say, <.90) are an indication that the major Parameters were
adversely affected, and thus argues for the inclusion of the
post hoc parameters in the final baseline model.
A second limitation of previous research relates to tests
of factorial invariance.. In particular, restnrchers have
conducted such tests at the matrix level only; when confronted
with a noninvariant A, or 4 , they have not continued test:ng to
to determine the aberrant paraneter(s) that contributed to.the
noninvariance (see Benson, 1987; Narsh, 1985, 1987b; Marsh Pt
Hocevar, 1985! Marsh et al., 1985). Consequently, renders arc
left wit!: the impression that given a noninvariant pattern of
factor loadings, further testing of invariance is unwarranted.
This conclusion, however, is unfounded when the model
specification includes multiple indicators of a construct
i0
Factorial Validity
10
(Muthen & Christoffersson, 1981). (For an extended discussion,
review of the literature, and application, see Byrne et al., in
press; for an 1pplicatio, involving dichotomous variables, see
Muthen & Christoffersson, 1981).
In examining factorial validity, partial measurement
invariance is important because it beats directly on further
testing of measurement and/or structural equivalencies. For
example, the researcher may wish to test whither the
theoretical structure of the underlying contruct is equivalent
across groups; the invariance of factor covariances, then, is
c,f primary interest (see e.g., Marsh, 1985; harsh & Ilocevar,
1985). Alternatively, the investigator may be interested in
testing for the invariance of item or subscale reliahilites; in
this case, the invariance of factor variances is of interest
(see Cole & Maxwell, 1985; Rock et al., 1978). In testing for
the invariances of factor variances and covariances, equality
constraints are imposed on only those factor loadings known to
he invariant across groups; this may include all, or only a
portion of the factor loading parameters.
A final limitation concerns studies that have investigated
the invariance of item (Benson, 1987; Marsh, 1985, 1987b; Marsh
& Hocevar, 1985; Marsh et al., 1985) or subscale (Byrne &
Shavelson, 1987) reliahilities across groups. Three additional
studies (Corcoran, 1980; Hare & Mason, 1980; Wolf le &
11
, 4, i.......wwwww1PIMPOOMMIMP
Factorial Validity
11
Robertshaw, 1983) are reported here for sake of completeness;
the focus here, however, was on the equivalence of response
error, rather than on specific test item or subscale
reliabilities. Each of these studies tested fo- the invariance
of measurement reliahlities by placing constraints on both the A
and the 0 parameters. However, this procedure is valid only
when the factor variances are known to be equivalent across
groups (Cole & Maxwell, 1985; Rock et al., 1978). When
variances are noninvariant, it is necessary to check the ratio
of true and error variances in testing for the equivalence of
reliabilities (see Werts, Rock, Linn, r, Joreskog, 1976).
In sum, four methodological weaknesses are evident with
previous LISREL CFA validity studies of measuring instruments.
First, model-fitting procedures have been incomplete in the
determination of adequately specified baseline models. Second,
testing for partial measurement invariance has not been
considered. Third, given the failure to test for, and identify
partially Invariant item scaling units, researchers have not
been able to proceed with testing for the invariance of
structural parameters. Finally, tests for the invariance of
item (or subscale) reliabilities have assumed, rather than
tested for, the equivalency of factor variances. As such,
testing for thP invariance of reliabilities has been
incomplete, and in many cases, incorrectly executed. The
1
mumanireprinp ry
dr
Factorial Validity
12
purpose of this paper is to address these limitations by
demonstrating. the steps involved in: (a) conducting a
sensitivity analysis to determine a Iseline model that is
statistically best-fitting, yet substantively most meaningful,
(h) testing for, and testing with partial measurement
invariance, and (c) testing for the invariance of subscale and
item reliabilities.
Application of LISREL Confirmatory Factor Analyses
The Measurina Instrument
The Perceived Competence Scale for Children (Harter, 1982)
is used here for demonstration purposes. This 28-item
self-report instrument measures four facets of perceived
competence: cognitive competence (i.e., academic nbilit),
physical competence (i.e., athletic ability), social competence
(i.e., social acceptance by peers), and general self-worth
(i.e., global self-esteem). Each 7-item subscale has a 4-point
"structured alternative" question format ranging from not very
competenK (1), to very competent (4). (For a summary of
psychometric properties, see Byrne & Schneider, 1988; Harter,
1982).
Data Base
Data for the present demonstration came from a larger study
that examined social relation differences between gifted
13

Factorial Validity
13
't
students and their non- ;.gifted peers (see Schneider, Clegg,
Byrne, Ledinglicim, & Crombie, in press), Following listwist
deletion of missine data, the sample for the present paper
comprised 241 grade 5 (129 normal, 112 gifted) and 230 grade }
(113 normal, 117 gifted) children from the two public school
systems in Ottawa, Canada. Overall, an examination of item
skewness and kurtosis revealed a distribution that was
approximately normal for each group (see Muttic.n & Kaplan,s
1985). (For details concerning descriptive statistics,
selection criteria and sampling procedures, see Byrne r,
Schneider, 1938).
Analysis of the Data
Analyses are conducted in two major stages. First, the
factorial validity of the PCSC is tested separately for grades
5 and 8 in the normal and gifted samples, and a baseline model
established for each of the four groups. Second, tests for the
factorial invariance of item responses across grade are
cono_cted separately for the normal and gifted samples.
Analyses are based on an item-pair structure (with the
exception of one item in each subscale). As such, the seven
items in each subscale are paired off, with items 1 and 2
forming the first couplet, items 1 and 4 the second couplet,
and items 5 and 6 the third couplet; item 7 remains a
singleton. The decision to use item-nairs was based on two
14

Factorial Validity
14
primary factors.: "ct) the low ratio of number of subjects per
test item for each subsample, and (b) preliminary EFA results
derived from single-item analyses indicating, for the most
part, that items were reasonably homogeneous in their
domain-specific measurements of perceived competence (see Byrne
& Schneider, 1988). Furthermore, Marsh, Barnes, Cairns, &
Tidman (1984) have argued that the analysis of item-pairs is
preferable to single items for at least four additional reasons
--- item-pair variables are likely to: (a) he more reliable,
(h) contain less unique variance since they are less affected
by the idiosyncratic wording of individual items, (c) he more
normally distributed, and (d) yield results having a higher
degree of generalizahility.
The CFA model in the present study hypothesizes a priori
that: (a) responses to the PCSC can he explained by four
factors, (b) each item-pair (and item singleton) has a non-zero
loading on the perceived competence factor that it is designed
to measure (i.e., target loading), and zero loadings on all
other factors (i.e., non-target loadings). (c) the four factors
are correlated, and (d) error/uniqueness terms for the
item-pair (and item singleton) variables are uncorrelated.
Parameter specifications are sumnarized in Table 1.
1 J

Factorial Validity
Insert Table 1 about here
15
Covariance structure analysis has traditionally relied on
the X2 'likelihood ratio test as a criterion for assessing the
extent to which a proposed model fits the observed data; a
nonsignificant e indicates a well-fitting model. However, the
sensitivity of the e statistic to sample size, as well as to
various model assumptions (i.e., linearity, multinormality,
additivity) are now well known (see e.g., Bentler & Bonett,
1980; Fornell, 1983; Huba & Harlow, 1987; Joreskog, 1982; Pia-sh
& Ilocevar, 1985; Muth6n & Kaplan, 1985; Tanaka, 1987). As an
alternative to x2 , other goodness-of-fit indices have been
proposed (see e.g., Bentler & Bonett, 1980; Hoelter, 1983;
Tanaka & !tuba, 1985; Tucker & Lewis, 1973). Researchers,
however, have been urged not to judge model fit solely on the
basis.of X2 values (Bentler & Bonett, 1980; Joreskog & Sorhom,
1985), or on alternative fit indices (Sobel & Bohrns'cedt,
1985); rather, assessments should be based on multiple
criteria, including "substantive. theoretical and conceptual
consid! rations" (Joreskog, 1971, p. 421; see also, Sobel &
Bohrnstedt, 1985).
Assessment of model fit in the present example is based on
(a) the X2 likelihood ratio test, (b) the X2 /df ratio, (c)
16
Factorial Validity
11)
T-values, normalized residuals and modification indices
provided by LTSREI, VI :and (d) knowledge of substantive and
theoretical research in this area.
Fittinft the Baseline Model
Since parameter specifications for the hypothesized
4-factor model do not include equality constraints between
various subsamples, all analyses are pc4-formed on the observed
correlation matrix for each group. Results of the model-fitting
process are reported in Tables 2 and 3 for the normal and
gif,..A samples, respectively.
Normal sample. As shown in Table 2, the initial model
(Hodel 1) represented a fairly reasonable fit to the observed
data for grade 5 students ( X2/df .. 1.55). Nonetheless, an
examinaton of the modification indices revealed three
off-diagonal values in the 0 matrix that were greater than 5.00
(see Joreskog & Sorbom, 1985). These parameters represented
error covariances between item variables, both within (PSC4,
PSC2) and across (PPC4, PSC/3; PCC1, PGS3) subscale s. Such
findings, as noted earlier, are often encountered with models
of psychological phenomena, but are particularly evident when
the model represents items (i.e., observed variables) and
subscale factors (i.e., latent variables) from a single
measuring instrument (see e.g., Byrne, in press; Byrne &
Shavelson, 1987); error covariances in these instances are
1 7
IN

Factorial Validity
17
considered substantively plausible since they indicate
nonrandom error introduced by a particular measurement method
such as item format.
Insert Table 2 about here
To determine the statistical and practical significance of
these error covariances, then, model fitting continued with the
specification of three alternative models (Models 2-4). In each
model, the error covariance in question was specified as a
free, rather than as a fixed parameter. Since a difference in X2
( 42) for competing (i.e., nested) models is itself X2 --
distributed with degrees of freedom equal to the difference in
degrees of freedom, this indicator is used to judge whether the
reestimated model resulted in a statistically significant
improvement in fit. Model 4 ultimately yielded the model of
best fit (X295= 117.57, £>.05;X2 /df = 1.24) and also
demonstrated a significant improvement in fit (421 = 8.96,
_e.01.
However, given the known sensitivity of the X2 statistic
discussed earlier, some researchers have preferred to look at
differences between (a) the absolute magnitude of estimates
(Werts et al., 1976), (b) the magnitude of estimates expressed
as X2/df ratios (see e.g., Marsh & Ilocevar, 1985), or (c) the
1
Factorial Validity
18
x2/df ratios of nested models, as a more realistic index of
model improvement (see e.g., Harsh, 1985, 1987b). An
examination of differences between the e/df ratios in the
present data showed values of .11, .12 and .09 (Models 2-4,
respectively), suggesting that the impact of the post hoc
parameters on the specified model was fairly trivial. This
notion was supported by three additional pieces of evidence.
First, the error covariance estimates, while statistically
significant (T-values > 2.00), were of relatively minor
magnitude (mean 0 = .06). Second, visual inspection of the
factor loadings and factor covariances in Models 1 and 4
revealed little fluctuation in their estimated values. Third,
the factor loadings in Model 1 were highly correlated with
those in Model 4 (r . .95); likewise, for correlations computed
between the factor variance-covariances (r = .99). Since the
addition of the error covariance parameters to the model
altered neither the m-asurement parameters (see Bagozzi, 1983),
nor the structural parameters (see Fornell, 1983), their impact
on the model was clearly trivial. These resalts thus verified
the parameter stability of the initially hypothesized model;
Model 1 was, therefore, considered as baseline for grade 5 in
all subsequent analyses.
The hypothesized 4-factor model for grade 8, as shown in
Table 2, represented a good fit to the data ( X2/df = 1.35).
1 :1

Factorial Validity
19
Although an examination of the modification indices suggested
possible model-fit improvement if error terms between two item
variables were allowed to covarv, the fit differential was not
statistically significant ( 421. 3.33, V.05); Model 1,
therefore, was considered basiline for the grade 8 normal
sample.
Gifted sample. Model-fitting results for the gifted
differed substantially from those for their normal peers. These
results are presented in Table 3. Let us look first at the fit
statistics for grade 5. We can see that the initially
hypothesized 4-factor model (Model 1) does not represent a
2particularly good fit to the data (X 98 = 160.43). To
investigate the misfit, model fitting proceeded as before with
the normal sample. A substantial drop in e was found when item
PPC4 ( 421= 25.57, 2<.001) and item PGS4 (421= 17.99, 2<.001)
were free to cross-load on the social (PSC) and cognitive (PCC)
factors, respectively.
Insert Table 3 about here
In contrast to the post hoc error covariances encountered
with the normal sample, these parameters represented fairly
major alterations to the initial 4-factor model and hear
importantly on the factorial validity of the Harter instrument.

Factorial Validity
20
The decision to accept Model 3 as aseline for the grade 5
gifted was based on three primary consilerations. First,, the
secondary loadings of PPC4 on the PSC factor ( A ), and PGS416 / 3
on the PCC factor ( A42 ) were both highly significant (T-values
= 4.97;. 4.09, respectively) and of fairly high magnitude (A =
.61; .65, respectively). Second, the factor loading correlation
between Models 1 and 3 was .6R, suggesting that the Model 1
measurement estimates were somewhat unstable; the structural
parameters, on the other hand, appeared to be very stable (r .
99). Finally, the findings were consistent with an earlier FIFA
of
pa
the data which indicated evidence of the same cross-loading
ttern (see Byrne & Schneider, 1988).
A review of the model-fitting results for grade 8 (see
le 3) reveals the secondary factor loadings noted earlier,Tab
to be common to both groups of gifted students. However, a
well-
when
fitting model for the grade 8 subsample was realized only
two further restrictions on the hypothesized model (Model
1) wer
Item 4
e relaxed; these included one error covariance between
and Item -pair 1 on the perceived cognitive competence
e (PCC4, PCC1; Ax21= 25.74. 2.<.001) and one secondarysubscal
factor 1
Foll
(lading (P(;S2 on PSC; 421. 14.14, y.001).
owing these analyses, Model 5 was considered baseline
for the g
decision
rade 8 gifted. As with the previous subsamples, this
was linked to several factors. First, the secondary
ri
4.

Factorial Validity
21
loadings of PPC4, PCS4 and PCS2 on the PSC, PCC and PSC
factors, respectively, were statistically significant (TL.values
= 4.74, 4.05, 3.80, respectively); the factor loading estimates
were also of substantial magnitude ( A = .45, .35, .34,
respectively). Second, the error covariance estimate, unlike
those for the normal sample, was highly significant (T-value =.
5.76) and fairly large ( 0 = .43); given the size of this
estimate, it was considered risky to constrain the parameter to
zero since this specification could have an important biasing
effect on other parameters in the model (Alwin & Jackson, 1980;
Joreskog, 1983). Third, fluctuation of the factor loading
estimates, albeit more modest than for grade 5, was evident
between Models 1 and 5; this instability was verified by a
correlation of .87 between A parameters in the two models; as
with the grade 5 findings, the structural parameters were shown
to he fairly stable (r = .94). Finally, the cross-loading of
factors for the grade 8 sample was consistent with findings by
Byrne and Schneider in the EFA study noted earlier.
Testing for Invariance
Tests of invariance involved specifying a model in which
certain parameters were constrained to be equal across groups
and then comparing that model with a less restrictive model in
which these parameters were free to take on any value. As with
model-fitting, the 42between competing models provided a basis
r.,9...,
Factorial Validity
22
for determining the tenability of the hypothesized equality
constraints; a significant 42 indicating noninvariance. .Unlike
the model-fitting analyses, however, the simultaneous
estimation of parameters was based on.the covariance, rather
than on.the correlation matrix for each group (see Joreskog &7
Sorbom, 1985). For purposes of the present demonstration,
invariance-testing procedures are applied to the gifted sample
only, since it is the more interesting of the two samples in
terms of model specification; analyses focus on equivalencies
across grades 5 and 8. We first test for the equality of item
scaling units (i.e., factor loadings; A's), components of the
measurement model. Once we have determined which item pairs
(and/or single items) are invariant, we can then proceed with
tests for the equality of subscale (i.e., factor) covariances,
components of the structural model. Finally, we test for the
equality of subscale and item reliabilities.
As noted earlier, once baseline models are determined, any
discrepancies in parameter specifications across groups remain
so throughout the analyses. in the present application, for
example, the secondary loading in the A matrix (A23
), and the
error covariance in the 0 matrix(e 85
) for grade 8, remained
unconstrained for all tests of invariance. A summary of the
baseline model parameter estimates for the grades 5 and 8
gifted are summarized in Tables 4 and 5, respectively.
Factorial Validity
23
Insert Tables 4 and 5 about here
Equality of item scaling units. Since the initial
hypothesis of equality of covariance matrices was rejected ( X2
136
. 209.81, .e.001), invariance testing proceeded, first, to test
the equivalence of item scaling units. These results are
summarized in Table 6.
Insert Table ( about here
The simultaneous 4-factor solution for each group yielded a
reasonable fit to the data (X2190 232.08). These results
suggest that for both grades, the data were well described bya
the four perceived competence factors. This finding, however,
does not necessarily imply that the actual factor loadings are
the same across grade. Thus, the hypothesis of an invariant
pattern of loadings was tested by placing equality constraints
on all lambda parameters (including the two common secondary
loadings, A ly and A 42' but excluding X23, the secondary factor
specific to grade 8), and then comparing this model (Model 2)
with Model 1 in which only the number of factors was held
Ainvariant. The difference in X
2was highly significant (L1X
2
38.93. 2<.001); thus, the hypothesis of an equivalent pattern

""+v".'"1,21Vrikr11117rITTRIPr,"
Factorial Validity
24
of scaling units was untenable.
In orderto identify which scaling units were noninvariant,
and thus detect partial measurement invariance, it seemed
prudent to first determine whether or not the two common
secondary loadings were invariant across grade. As such,
equality constraints were imposed on Aim Aand 42, and the model
AX2reestimated; this hypothesis was found tenable ( 2= 5.10,
.0.05). Tests of invariance proceeded next to (a) test each
congeneric set of scaling units (i.e.; parameters specified as
loading on the same factor) and then, given findings of
noninvariance, to (h) examine the equality of each item scaling
unit individually. For example, in testing for the equality of
all scaling units measuring perceived general self (PGS),A21 ' A316
A41 '
as well as A162and A42were held invariant across groups.
Given that this hypothesis was untenable ( Ax25 24.66, 2<.001),
each factor loading (A ,A,A) was tested independently to21 3 1 Id
determine whether it was invariant across grade; Almand A42 were
also held concomitantly invariant. These analyses detected one
item scaling unit (PGS2; A21
) to he nonirvariant across grade.
In a similar manner, the scaling units of all remaining
item pairs (or singletons) were tested for invariance across
grade. As can he seen in Table 6, invariant factor loadings
were held cumulatively invariant, thus providing an extremely
powerful test of factorial invariance. In total, only two item

Factorial Validity
. 25
scaling units were found to he nonequivalent --- one item pair
measuring perceived general self (PGS2; A ) and one single item21
measuring perceived social competence (PSC4; A ).12,3
Equalit of factor covariances. The first step in testing
for the. invariance of structural relations among subscales was
to constrain all factor covariances to be equal across grade.
Equality constraints were subsequently imposed, independently,
on each of the phi parameters. It is important to note that
partial measurement invariance was maintained throughout these
testing procedures. In other words, the following measurement
parameters were held invariant while testing for the equality
of the factor covariances: the two common secondary factor
loadings (A ,A ), and all factor loadings except), and A16,3 42 21 ud
The hypothesis of equivalent factor covariances was found9
tenable ( AX26.. 5.12, .V.05). If, on the other hand, the
hypothesis had been found untenable, the researcher would want
to investigate further, the source of this noninvariance..Thus,
as demonstrated . ,h tests of item scaling units, he/she would
proceed to test. independently, each factor covariance
parameter in the matrix; model specification, of course, would
include the partially invariant measurement parameters.
Equality of reliat.ilities. Generally speaking, in
multiple-indicator CFA models, testing for the invariance of
reliability is neither necessary (Joreskog, 1971b), nor of

Factorial Validity.
26
particular interest when the scales are used merely as CFA
indicators and not as measures in their own right, ignoring
reliability (Authf,n, personal communication, October, 1987).
Althou0 Joreskog (1971a) demonstrated the steps involved in
testing for a completely invariant model (i.e., invariant A,t
and 0), this procedure is considered an excessively stringent
test of factorial invariance (Muthlan, personal communication,
January 1987). In fact, Joreskog (1971h) has shown that while
it is necessary that multiple measures of a latent construct be
congeneric (i.e., believed to measure the same construct), they
need not exhibit invariant variances and error/uniquenesses
(see also, Alwin & Jackson, 1980).
When the multiple indicators of a CFA model represent items
from a single measuring instrument, however, it may be of
interest to test for the invariance of item reliabilities. For
example, this procedure was used by Benson (1987) to detect
evidence of item bias in a scale designed to measure
self-,:oncept and racial attitudes for samples of white and
black eighth grade students, and by Munck (1979) to determine
whether the item reliability of items comprising two
attitudinal measures were equivalent across different nations.
In contra-t to the conceptual definition of item bias generally
associated %.;th cognitive instruments (i.e., individuals of
equal ability have unequal probabilit.y of success), item bias
Factorial Validity
27
related to affective instruments reflects on its validity, and
hence, on the question of whether items generate the same
meaning across groups; evidence of such item bias is a clear
indication tit the scores are differentially valid (Green,
1975).'
In the present example, the invariance of factor variances
was tested first, in order to establish the viability of
imposing equality constraints on the A and 6 for each item or
whether, in light of nonequivalent factor variances, invariance
testing should be based on the ratio of true and error
variances (see Cole & tlaxwell, 1985; Rock et al., 1978). The
hypothesis of equivalent factor variances was found tenable
( Ile 40 5.20, V.05; see Footnote 10). As such, the reliability
Jf each item pair (or singleton) was tested for invariance
across grade by imposing equality constraints on the respective
A and 0 parameters; as with previous tests of item scaling units,
equally reliable items were held cumulatively invariant
throughout the testing sequence. These results are summarized
in Table 7.
Insert Table 7 about here
Tests of invariance proceeded, first, by testing for the
equivalency of each subscale; only the Perceived Cognitive
2g

Factorial Validity
28
Competence subscale (PCC) was found to be equivalent across
grade (AX2, is 8.49, 2>.05). Subsequently, the reliability.io
equivalency of each item pair (or singleton) was tested. Had
tests of invariance revealed the factor variances to be
nonequivalent, on the other hand, it would have necessary to
test for item reliability by examining the ratio of true and
error score variances (0
). (For an explanation of this
procedure, see Hunck, 1979; Werts et al., 1976).
Conclusion
While the use of LISREL CFA procedures is becoming more
prevalent in construct validity research in general, relatively
few studies have applied this approach to the validation of
single measuring instruments, in particular. However, of the
studies that have used the procedure for testing the factorial
validity and invariance of a single instrument, most share four
methodological weaknesses; these relate to the failure: (a) to
determine an adequately specified baseline model, (b) to test
for partial measurement invariance, (c) to test for the
invariance of structural parameters, given partially invariant
item scaling units, and (d) to test for the equivalence of
factor variances prior to testing for the invariance of test
item reliabilities.
The present paper addressed these limitations in an
application to data comprising self-report responses to the
2 9

Factorial Validity
29
Ilarter (1982) Perceived Competence Scale for Children by grades
5 and 8 normal and gifted children. Specifically, the paper
demonstrated the steps involved in (a) the conduct of
sensitivity analyses to determine a statistically best fitting,
yet substantively most meaningful baseline model, (b) testing
for partial measurement invariance, (c) testing for the
invariance of factor variances and covariances, given partial
measurement invariance, and (d) testing for the invariance of
test item and subscale reliabilities. These procedures,
historically, have received scant attention in the literature.
It is hoped that the present illustration will be helpful in
providing guidelines to future LISREL CFA research bearing on
the construct validity of an assessment instrument.
Factorial Validity30
References
Alwin, D.F. & Jackson, D.J.(1981). Applications of
simultaneous, factor analysis to issues of factorial
invariance, In D.D. Jackson & E.P. Borgatta (Eds.), Ftfctor
analysis and measurement in sociological research: A
multidimensional perspective (pp. 249-280). Beverly Hills,
CA: Sage.
Alwin, D.F. & Jackson, D.G. (1980). Measurement models for
response errors in surveys: Issues and applications. In K.F.
Schuessler (Ed.), Sociological Methodology (pp. 68-119). San
Francisco: Jossey-Bass.
Bachman, L.F. & Palmer, A.S. (1981). The construct validation
of the FSI Oral Interview. Language Learning, 31, 67-86.
Bagozzi, R.P. (1983). Issues in the application of covariance
structure analysis: A further comment. Journal of Consumer
Research, 9, 449-450.
Benson, J. (1987). Detecting item bias in affective scales.
Educational and Ps cholo ical Measurement, 47, 55-67.
Bentler, P.M. (1978). The interdependence of theory, metho-
dology,and empirical data: Causal modeling as an apprcach to
construct validation. In D.B. Kandel (Ed.), Longitudinal
research on drug use: Empirical finding and methodological
issues (pp. 267-302). New York: Wiley.
Bentler, P.M. & Bonett, D.C. (1980). Significance tests and
goodness-of-fit in the analysis of covariance structures.
Psychological Bulletin, 88, 588-606.
'11

Factorial Validity31
Browne, .W. (1982). Covariance structures. In D.M. Hawkins
(Ed.), Topics in applied multivariate_ analysis (pp. 72-141).
Byrne, R.M. On press). Measuring adolescent self - concept:
Factorial validity and equivalency of the SDQ III across
gender. Multivariate Behavioral Research.
Byrne, .11.M. & Schneider, B.H. (1983). Perceived Competence
Scale for Children: Testing for factorial validity and
invariance across age and ability. Applied Measurement in
Education, 1, 171-137.
Byrne, B.M. & Shavelson, R.J. (1986). On the structure of
adolescent self-concept. Journal of Educational Psychology,
78, 474 481.
Byrne, B.M. & Shavelson, R.J. (1987). Adolescent self-concept:
Testing the assumption of equivalent structure across
gender. American Educational Research Journal, 24, 365-385.
Byrne, B.M., Shavelson, R.J., & Mutl4n, B. (in press). Testing
for the equivalence of factor covariance and mean
structures: The issue of partial measurement invariance.
Psychological Bulletin.
Carmines, E.G. & McIver, J.P. (1981). Analyzing models with
unobserved variables: Analysis of covariance structures. In
G.W. Bohrnstedt & E.F. Borgatta (Eds.), Social measurement:
Current issues (pp. 65-115). Beverly Hills, CA: Sage.
12

Factorial Validity32
Cole, D.A. & Maxwell, S.E. (1985). Multitrait-multimethod
comparisons across populations: A _anfirmatory factor
analytic approach. Multivariate Behavioral Research, 20,
389-417.
Corcoran, H. (1980). Sex differences in measurement error in
status attainment models. Sociological Methods & Research,
9, 199 -217.
Flamer, S. (1983). Assessment of the multitrait-multimethod
matrix validity of Likert scales via confirmatory factor
analysis. Multivariate Behavioral Research, 18, 275-308.
Fornell, C. (1983). Issues in the application of covariance
structure analysis: A comment. Journal of Consumer Research,
9, 443-448.
Forsythe, G.B., McGaghie, W.C., A Friedman, C.P. (1986).
Construct validity of medical clinical competence measures:
A multitrait-multimeihod matrix study using confirmatory
factor analysis. American Educational Research Journal, 23,
315-336.
Green, H.R. (1975). What does it mean to say a test is biased?
Education and Urban Society, 8, 33-52.
Harter, S. (1982). The Perceived Competence Scale for Children.
Child Development, 53, 87-97.
Hoelter, J.W. (1983). The analysis of covariance structures:
Goodness-of-fit indices. Sociological Methods, 11, 325-344.
II
1,3

Factorial Validity33
Huhn, G.J. P Harlow, L.L. (19g7). Robust structural equation
models: Implications for developmental psychology. Child
Development; 5g, 147-166.
Huhn, G.J., Wingard, J.A., & Bentler, P.N. (1981). A comparison
of two latent variable causal models for adolescent drug
use. Journal of Personality and Social Psychology, 40,
180-193.
Joreskog, K.G. (1969). A general approach to confirmatory
maximum likelihood factor analysis. Psychometrika, 34,
183-202.
Joreskog, K.G. (1971a). Simultaneous factor analysis in several
populations. Psychometrika, 36, 409-426.
Joreskog, K.G. (1971b). Statistical analysis of sets of
congeneric tests. Psychometrika. 36, 109-133.
Joreskog, K.G. (1982). Analysis of covariance structures. In C.
Fornell (Ed.), A second generation of multivariate analysis
Vol 1: Methods (pp. 200-242). New York: Praeger.
Joreskog, K.G. (1983). UK LISREL Workshop, University of
Edinburgh, Scotland.
Joreskog, K.G. & Sorbom, P. (1985). LISREL VI: Analysis of
linear structural relationships by the method of maximum
likelihood. Mooresville, IN: Scientific Software.
Lomax, R.G. (1982). A guide to LISREL-type structural equation
modeling. Behavior Research Methods & Instrumentation, 14,
1-8.

Factorial Validity34
Long, J.S. (1983). Confirmatory factor anllysis. Beverly Hills,
CA: Sage.
MacCallum, R. (1986). Specification searches in covariance
structure modeling. Psychological Bulletin, 100, 107-120.
Mare, R.D. & Mason, W.M. (1980). Children's reports of parental
socioeconomic status: A multiple group measurement model.
Sociological Methods & Research, 9, 178-198.
Marsh, H.W. (1985). The structure of masculinity/femininity: An
application of confirmatory factor analysis to higher-order
factor structures and factorial invariance. Multivariate
Behavioral Research, 20, 427-449.
Marsh, H.W. (1987a). The hierarchical structure of self-concept
and the application of hierarchical confirmatory factor
analysis. Journal of Educational Measurement, 24, 17-39.
Marsh, H.W. (1987h). Masculinity, femininity and androgyny:
Their relations with multiple dimensions of self-concept.
Multivariate Behavioral Research, 22, 91-118.
Marsh, H.W., Barnes, J., Cairns, L., & Tidman, Ii (1984).
Self-description Questionnaire: Age and sex effects in the
structure and level of self-concept for preadolescent
children. Journal of Educational Psychology, 76, 940-956.
Marsh, H.W. & Hocevar, D. (1984). The factorial invariance of
student evaluations of college teaching. American
Educational Research Journal, 21, 341-366.
[Factorial Validity
it. 14, 4-.C. /11.." ammeMlow11111141WPB
35
Marsh, H.U. & Mocevar, D. (1985). Application of confirmatory
factor analysis to the study of self-concept: First- and
higher orde.r factor models and their invariance across
groups. Psychological Bulletin, 97, 562-582.
Marsh, H.W. & O'Neill, R. (1984). Self Description Question-
naire III: The construct validity of multidimensional
self-concept ratings by late adolescents. Journal of
Educational Measurement, ,21, 153-174.
Marsh, 11.14., Smith, I.D., & Barnes, J. (1985). lultidimensional
self-concepts: Relations with sex and academic achievement.
Journal of Educational Psychology, 77, 581-596.3-137.
Munck, I.M.E. (1979). Model building in comparative education:
1plications of the LTSRFL method to cross-national survey
data. Stockholm: Alnavist & liksell International.
Muthe'n, B. & Christoffersson, A. (1981). Simultaneous factor
analysis of dichotomous variables in several groups.
Ps chometrika, 46, 407-419.
Mutl4n, B. & Kaplan, D. (1985). A comparison of methodologies
for the factor analysis of non-normal Likert variables.
British Journal of Mathematical and Statistical Psychology,
38, 171-189.
lewcomb, M.D., Huba, G.J., & Rentler, P.M. (1936) . Determinants
of sexual and dating behaviors among adolescents. Journal of
Personalitt_and Social Psychology, 50, 423-433.

Factorial Validity36
Reynolds, C.R. & Harding, R.E. (1983). Outcome in two large
sample studies of factorial similarity under six methods of
comparison. Educational and Psychological Measurement, 43,
723-728.
Rock, 1).A., Werts, C.E., & Flaugher, R.L. (1978). The use of
analysis of covariance structures for comparing the
psychometric properties of multiple variables across
populations. Multivariate Behavioral Research, 13, 403-418.
Schneider, B.H., Clegg, M.R., Byrne, B.M., Ledingham, J.E., &
Crombie, G. (in press). Social relations of gifted children
as a function of age and school program. Journal of
Educational Psychology.
Sobel, M.E. & Bohrnstedt, G.W. (1985). Use of null models in
evaluating the fit of covariance structure models. In N.B.
Tuma (Ed.), Sociological methodology, (pp. 152-178). San
Francisco: Jossey-Bass.
Tanaka, J.S. (1987). "How big is big enough?": Sample size and
goodness of fit in structural equation models with latent
variables. Child Development, 58, 134-146.
Tanaka, J.S. & Huba, G.J. (1984). Confirmatory hierarchical
factor analyses of psychological distress measures. Journal
of Personality and Social Psychology, 46, 621-635.
Tanaka, J.S. & Iluba, G.J. (1985). A fit index for covariance
structure models under arbitrary GLS estimation, British
Journal of Mathematical and Statistical Psychology, 38,
197-201.

Fectnrial Validity37
Tucker, L.R. & Lewis, C. (1973). A reliability coefficient for
maximum likelihood factor analysis. Psychometrika, 38, 1-10.
Watkins, D. & Battle. J. (1981). An investigation of the
construct validity of three recently developed personality
instruments: An application of confirmatory multirnethod
factor analysis. Australian Journal of Psycholsay, 33,
277-284.
Wc'rts, C.E., Rock, .A., Linn, R.L., & Joreskog, K.G. (1976).
Comparison of correlations, variances, covariances, and
regression weights with or without measurement error.
Psychological Bulletin, 83, 1007-1013.
lYolfle, L.M. (1981, April). Causal models with unmeasured
variables: An introduction to LISRCL. Paper presented at the
American Educational Research Association Annual Meeting,
Los Angeles.
Wolfle, L.M. & Rnbertshaw, D. (1983). Racial differences in
measurement error in educational achievement models. Journal
of Educational Measurement, 20, 39-49.

Factorial Validity
38
Footnotes
1. If tests of factor means are of interest, the measurement
model would also include the regression intercept (nu,v ), a
vector of constant intercept terms. In the basic CFA model,
however, variable means are not of interest since they are
neither structured or explained by the constructs (gentler,
1978).
2. For the same reason as noted in Footnote 1, the gamma (r), a
vector of mean estimates, is not included in the structural
model.
3. Secondary loadings are measurement loadings on more than one
factor.
4. The absolute X2/df ratio value that represents a reasonable
fit to the data remains a controversial issue. For example,
Muthen (personal communication, October, 1987) contends that
a X2/df ratio >1.50 indicates a malfitting model for data
that are normed to a sample size of 1000. On the other hand,
Carmines and McIver (1981) argue that an acceptable X 2 /di
ratio can range as high a., 3.00. Taking a midpoint between
these two extremes, it seems likely that, with sample sizes
less than 1000, a coefficient >2.00 is a fairly good
indication of model misfit.
19
Factorial Validity
3')
5. This post hoc fitting procedure has been referred to as
tests for "substantive invariance" (Tanak. & Huhn, 1934) and
as "sensitivity analyses" (gyrne et al., in press).
6. Mean skewness and kurtosis values were as follows: normal
(grade 5, SK = -.47. ..0i = -.79; grade 8, SK = -.38, KU =
-.46): gifted (grade 5, SK = _.33, KU = -.50; grade 3, SI: =
-.46, KU = .01).
7. The reader is advised that if start values were included in
the initial input, these will likely need to be increased in
order to make them compatible with covariance, rather than
correlation values.
fl. Since X2and its corresponding degrees of freedom are
additive, the sum ofx2's (see Table 6) reflects how well the
underlying factor structure fits the data across groups.
9. This model was compared with one in which all items known to
be invariant were constrained equal across grade (Model
12, see Table 6).
10. Although the PCC subscale, as a whole, was found to be
invariant, tests of individual item parameters revealed the
first item pair (PCC1) to he noninvariant; this illustrates
the possibility of masking information when analyses are
conducted at the more macroscopic subscale level.

Factorial Validity
40
Table 1
Pattern of LISREL Parameters for Model Fitting
A
PGS1
PGS2
PGS3
PGS4
PCC1
PCC2
PCC3
PCC4
PSCI
PSC2
PSC3
PSC4
PPC1
PPC2
PPC3
LPC4
PGS
PCC
PSC
CPC
/ix
El
la
A21
$ A
31
A41
0
0
0
0
0
0
0
0
0
0
0
[1
t2 E3 t4
0 0 0
0 0 0
0 0 0
0 0 0
la 0 0
A62
0 0
)*720 0
A82
0
0 la 0
0 A10,3
0
0 A11,3
0
0 A12,3
0
0 0la
0 0 A 14,4
0 0 A15,4
0 0 A16,4...
022
.32 33
.42 .43 0
44
41

Table 1 cont'd Factorial Validity
41
PGSI
PGS2
PGS3
PGS4
PCC1
PCC2
PCC3
PCC4
PSC1
PSC 2
PPC4
PPC1
PPC2
PPC3
PPC4
6
611
0 622
0 0 -6 33
0 0 0 644
0 0 . 0 0 655
0 0 0 0. 0 666
0 0 0. 0 0 0 677
0 0 0 0 0 0 0 688
0 0 0 0 0 0 u 0 699
0 0 0 0 0 0 0 0 0 610,10
0 0 0 0 0 0 0 0 0 0 611,11
0 0 0 0 0 0 0 0 0 0 0 612,12
0 0 0 0 0 0 0 0 0 0 0 0 613,130 0 0 0 0 0 0 0 0 0 0 0 0 6
14,14.
0 0 0 0 0 0 0 0 0 0 0 0 0 0 615,15
0 0 0 0 0 0 0 0 0 0 0 0 0 0 0 616,16
aFixed parameter
X = observed item measures for the Perceived Competence Scale. for Children
(PCSC); El - E4 '= perceived competence subscales (i.e. factors) of he PCSC
(t1
= perceived genteel self.' 2 '
= perceived cognitive competence; E3 = perceived
social competence; E4 perceived physical competence); A = factor loading matrix;
= factor variance - covariance matrix; 66 error varian a - covariance matrix.
PGS1-GS3 = paired items #4/b, 12/16, 20/24 measuring perceived general self
(PGS); PGS4 = item #28 measuring PGS; PCC1-PCC3 = paired items #1/5, 9/13, 17/21
measuring perceived cognitive competence (PCC. PCC4 = item #25 measuring PCC;
PSC1-PSC3 = paired items #2/6, 10/14, 18/22 measuring perceived social
competence (PSC); PSC4 = item #26 measuring PSC; PPC1-PPC3 = paired items #3/7,
11/15, 19/23 measuring perceived physical competence (PPC); PPC4 = item #27
Aa.42e4,

wrs rw."- wg% pet
Factorial Validity
42
Table 2
Steps in Model Fitting for the Normal Sample
df ax2 tdf x2IdirCompeting Models X2
Grade 5
1 Basic 4- factor modela 152.26 98 .00 --- --- 1.55
2 Model 1 with correlated error 139.45 97 .00 12.81*** 1 1.44
between PPC4 and PSC3
3 Model 2 with correlated error 126.53 96 .02 12.92*** 1 1.32
between PSC4 and PSC2
4 Model 3 with correlated error 1:7 57 95 .06 8.96** 1 1.24
between PCC1 and PGS3
Grade 8
1 Basic 4-factor modela 132.13 98 .01 --- - -- 1.35
2 Model 1 with correlated error 120.55 97 .05 3.33 1 1.24
between PGS4 and PGS3
* *p < .01***
p < .001
aFinal model conbidered as baseline
PPC4 Item #27 measuring perceived physical competence; PSC3 = Paired items #18
and #22 measuring perceived social competence; PSC4 - item #26 measuring
perceived vecial competence; PSC2 Paired items #10 and #14 measuring perceived
social competence; PCC1 Paired items #1 and #5 measuring perceived cognitive
competence; PGS3 Paired items #20 and #24 measuring perceived general self;
PGS4 - item #28 measuring perceived general self.
43

Table 3
Steps in Model Fitting for lifted Sample
Competing Models X2 df
1 Basic 4-factor model
2 Model 1,with PPC4 loading
on PSC
3 Model 2 with PGS4 loading
on PCC
1 Basic 4-factor model
2 Model 1 with PPC4 loading
on PSC
3 Model 2 with correlated
error between PCC4 and PCC1
4 Model 3 with PGS4 loading
on PCC
5 Model 4 with PGS2 loading
on PSCa
Factorial Validity
43
Grade 5
160.43 98 .00 --- --- 1.64
134.86 97 .00 25.57*** 1 1.39
116.87 96 .07 17.99*** 1 1.22
Grade 8
197.77 98 .00 - -- 2.20
175.66 97 .00 22.61*** 1 1.81
149.42 96 .00 25.74*** 1 , 1.56
129.35 95 .01 20.07*** 1 1.36
115.21 94 .07 14.14*** 1 1.23
***p < .001
aFinal model considered as baseline
PSC = perceived socia: competence factor; PCC = perceived cognitive competence
factor; PPC4 = item #27 measuring perceived physical competence; PGS4 = item #28
measuring p eived general self; PCC4 = item #25 measuring perceived cognitive
competence; PCC1 = Paired items #1 and #5 measuring perceived cognitive
competence; PGS2 = Paired items #12 and #16 measuring perceived general self.

Factorial Validity
44
Table 4
Baseline Model Paiameter Estimates for Grade S Gifteda
Measured Subscale Factors
Item Variablesb
PGS PCC PSC PPC Error/Uniqueness
POI .72 0 0 0 .48
PGS2 .85 0 0 0 .28
PGS3 .83 0 0 0 .32
PGS4 .22 .46 0 0 .62
PCC1 0 .72 0 0 .49
PCC2 0 .69 0 0 .52
PCC3 0 .69 0 0 .53
PCC4 0 .73 0 0 .47
PSC1 0 0 .78 0 .39
PSC2 0 0 .66 0 .56
PSC3 0 0 .76 0 .42
PSC4 0 0 .61 0 .62
PPC1 0 0 0 .76 .43
PPC2 0 0 0 .79 .38
PPC3 0 0 0 .82 .33
PPC4 0 0 .47 .30 .57
Subscale (Factor) Correlations
PGS -
PCC .56 -
PSC .61 .42 -
PPC .31 .33 .43 -
aFactor loadings and factor correlations are presented in standardized form to
b
facilitate interpretation.
Item variables 1-3 represent the first six items of each subscale, paired
consecutively; item variable 4 represents fte seventh item of each subscale.
PGS = perceived general self; PCC = perceived cognitive competence; PSC =
perceived social competence; PPC = perceived physical competence.
45

Factorial Validity
45
Table 5
Baseline Model Parameter Estimates for Grade 8 Gifteda
Measured Subscale Factors
Item Variablesb
PGS PCC PSC PPC Error/Uniqueness
PGS1 .88 0 0 0 .23
PGS2 .63 0 .28 0 .37
PGS3 .91 0 0 0 .18
PGS4 .58 .30 0 0 .46
PCC! 0 .88 0 0 .23
PCC2 0 .66 0 0 .57
PCC3 0 .65 0 0 .58
PCC4 0 .89 0 0 .21
PSC1 0 0 .82 0 .33
PSC2 0 0 .83 0 .32
PSC3 0 0 .87 0 .24
PSC4 0 0 .55 0 .70
PPC1 0 0 0 .83 .31
PPC2 0 0 0 .89 .22
PPC3 0 0 0 .37 .22
PPC4 0 0 .37 .55 .38
Subscale (Factor) Correlations
PGS -
P'" .33 -
PSC .43 .16 -
PPC .40 .15 .45
aFactor loadings and factor correlations are presented in standardized form to
facilitate interpretation.bItem variables 1-3 represent the first six items of each subscale, paired
consecutively; item variable 4 represents the seventh item of each subscale.
PGS perceived general self; PCC = perceived cognitive competence; PSC =
perceived social competence; PPC = perceived physical competence.
46

Factorial Validity
46
Table 6
Tests for Invariance of Item Scalin Units Across Grade for the Gifted
Competing Model X2. df Ax2 Adf x
2/df
1 Four perceived 232.08 190 ---
factors invariant
--- 1.22
2 Model 1 with all factor 271.01 204 38.93***
loadings invariant'
14 1.33
3 Model 1 with 2 common k37.18 192 5.10
secondary loadings
invariant
2 1.24
4 Model 3 with all PGS 256.74 195 24.66***
factor loadings invariant
5 1.32
5 Model 3 with PGS2 254.33 193 22.25*** 3 1.32.
invartantb
6 Model 3 with PGS3 239.47 193 7.39
invariant
3 1.24
7 Model 3 with PGS3, 240.37 194 8.29 4 1.24
PGS4 invariant
8 Model 7 with all PCC 244.35 197 12.27
factor loadings invariant
7 1.24
9 Model 8 with all PSC 251.37 200 19.29*
factor loadings invariant
10 1.28
10 Model 8 with PSC2 245.20 198 13.12
invariant
8 1.24
11 Model 8 with PSC2, 245.45 199 13.37 9 1.23
PSC3 invariant
12 Model 11 with all PPS 248.69 202 16.61
factor loadings invariant
12 1.23
*p < .05 ***p < .001a.Including the 2 common secondary factor loadings
bThe first item-pair loading for each factor was fixed to 1.0 for purposes of
statistical identification. PGS = perceived general self; PCC = perceived
cognitive competence; PSC = perceived social competence; PPC = perceived
physical competence.
47
.

Factorial Validity
Table 7
Tests for Invariance of Subscale and Item Reliabilities
47
Across Grade for the
x2/df
Gifted
X2 df Ax2 AdfCompeting Model
1. Two common secondary factor
loadings invariant
237.18 192 1.24
116,3 142
Subscales
2. PGS subscale Model 1 with 269.84 199 32.66*** 7 1.36
X11
- 141 and 611
- 644
invariant
3. PCC subscale Model 1 with 245.67 199 8.49 7 1.23
152 - 182and 6
55- 6
88
invariant
4. PSC subscale Model 1 with 272.83 206 35.65** 14 1.32
A93
- 112,3 and 899 12,12
invariant
5. PPC subscale Model 1 with 269.29 206 32.11** 14 1.31
113,4 - 116,4and 6
13,13- 6
16,16
invariant
Items
6. Model 1 with 241.23 193a 4.05* 1 1.25
111 and 611
invariant
7. Model 1 with 254.76 194 17.58*** 2 1.31
121 and 622
invariant
8. Model 1 with 246.48 194 9.30** 2 1.27
A31
and 633
invariant
48

Table 7 cont'd ..
Competing Model X2
Factorial Validity
48
df Adf Adf X2 /di
9. Model 1 with 242.88 194 5.70 2 1.25
A41
and 644
invariant
10. Model 9 with 245.56 195a 8.38* 3 1.26
A52. and655
invariant
11. Model 9 with 244.82 196 7.64 4 1.25
A62
and 666
invariant
12. Model 11 with 245.08 198 7.90 6 1.24
A72
and 677
invariant
13. Model 12 with 249.19 200 12.01 8 1.25
A82
and 688
invariant
14. Model 13 with 249.19 201a 12.01 9 1.24
A93
and 699
invariant
15. Model 14 with 254.92 203 17.74 11 1.26
A10.3
and 610,10
invariant
16. Model 15 with 265.15 205 27.97** 13 1.29
111,3and 6
11,11
invariant
17. Model 15 with 266.52 205 29.34** 13 1.30
112,3and 6
12,12
invariant
18. Model 15 with 258.14 204a 20.96 12 1.27
113,4and 6
13,13
invariant
19. Model 18 with 266.25 206 29.07* 14 1.29
114,4and 6
14,14
invariant .
49
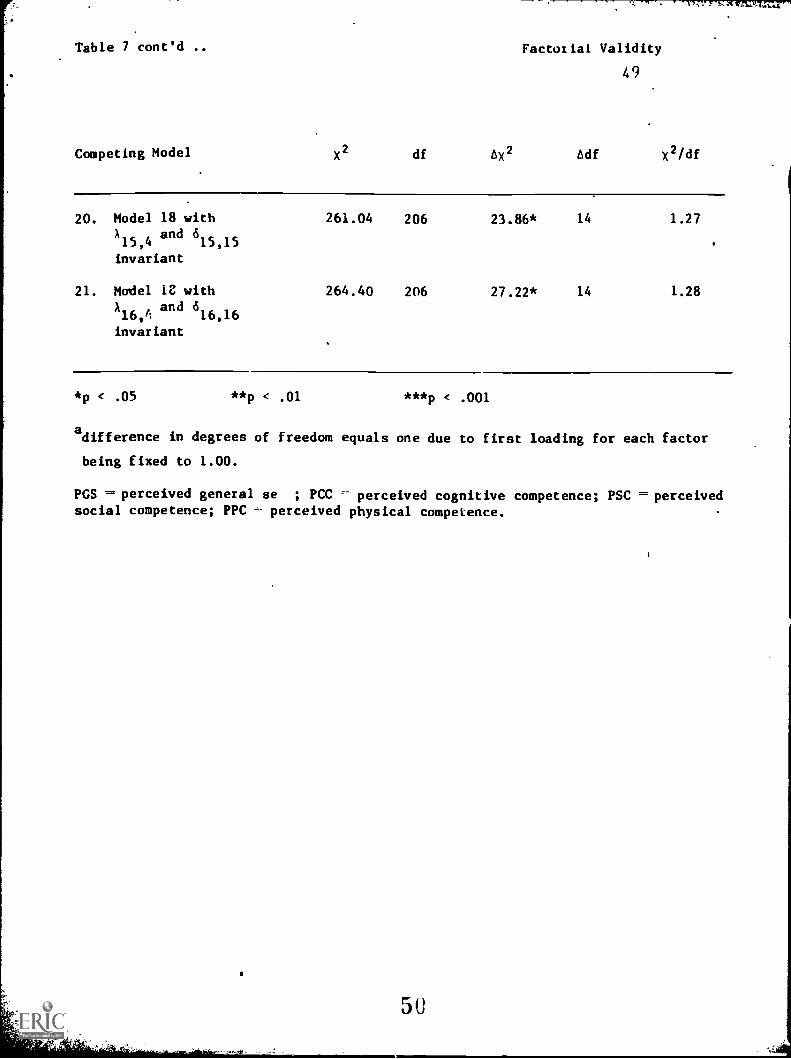
Table 7 cont'd ..
Competing Model X2 df AX2
Factorial Validity
49
tdf X2 /df
20. Model 18 with 261.04 206 23.86* 14 1.27X15,4
and 615,15
invariant
21. Model ie with 264.40 206 27.22* 14 1
A16,/1
and 616,16
invariant
28
*p < .05 **p < .01 ***p < .001
adifference in degrees of freedom equals one due to first loading for
being fixed to 1.00.
PGS =perceived general se ; PCC perceived cognitive competence;social competence; PPC perceived physical competence.
J 0
ach factor
PSC =perceived
'. 1.