Filed: 2020-12-31 Exhibit C1 Tab 1 Schedule 1
175
Filed: 2020-12-31 EB-2020-0290 Exhibit C1 Tab 1 Schedule 1 Page 1 of 3 CAPITAL STRUCTURE AND RETURN ON EQUITY 1 2 1.0 PURPOSE 3 This evidence describes the methodology that OPG has used to determine its capital 4 structure and return on equity (“ROE”) for the IR term. 5 6 2.0 CAPITAL STRUCTURE 7 OPG is seeking approval of the IR term cost of capital as presented in Ex. C1-1-1, Tables 1 8 through 5. In determining the cost of capital, OPG has applied the capital structure of 50% 9 equity and 50% debt. The proposed capital structure is supported by the findings of the 10 Common Equity Ratio Study carried out by Concentric Energy Advisors at Attachment 1 to 11 this exhibit. The engagement letter executed with Concentric Energy Advisors is filed as 12 Attachment 2 to this exhibit. 13 14 The proposed capital structure reflects the material increase in OPG’s business risks since 15 EB-2016-0152, primarily driven by: the Darlington Refurbishment Program; the aging and 16 retirement of the Pickering nuclear generating station; the continued shift of OPG’s rate base 17 to reflect a greater portion of nuclear assets, combined with the decline in nuclear 18 generation; and increasing climate change risks. 19 20 The debt component of OPG’s capital structure is determined using the methodologies 21 approved by the OEB in EB-2007-0905, EB-2010-0008, EB-2013-0321, and EB-2016-0152. 22 These are described in Ex. C1-1-2 and Ex. C1-1-3 for long-term and short-term debt, 23 respectively. The capitalization and cost of capital for the 2016-2026 period is summarized in 24 Ex. C1-1-1, Tables 1-11. OPG has applied this capitalization to the rate base, as adjusted to 25 reflect the application of the “lesser of Asset Retirement Costs and Unfunded Nuclear 26 Liabilities” provision applied by the OEB in EB-2007-0905, EB-2010-0008, EB-2013-0321, 27 and EB-2016-0152. 28 29
Transcript of Filed: 2020-12-31 Exhibit C1 Tab 1 Schedule 1

Filed: 2020-12-31 EB-2020-0290
Exhibit C1 Tab 1
Schedule 1 Page 1 of 3
CAPITAL STRUCTURE AND RETURN ON EQUITY 1
2
1.0 PURPOSE 3
This evidence describes the methodology that OPG has used to determine its capital 4
structure and return on equity (“ROE”) for the IR term. 5
6
2.0 CAPITAL STRUCTURE 7
OPG is seeking approval of the IR term cost of capital as presented in Ex. C1-1-1, Tables 1 8
through 5. In determining the cost of capital, OPG has applied the capital structure of 50% 9
equity and 50% debt. The proposed capital structure is supported by the findings of the 10
Common Equity Ratio Study carried out by Concentric Energy Advisors at Attachment 1 to 11
this exhibit. The engagement letter executed with Concentric Energy Advisors is filed as 12
Attachment 2 to this exhibit. 13
14
The proposed capital structure reflects the material increase in OPG’s business risks since 15
EB-2016-0152, primarily driven by: the Darlington Refurbishment Program; the aging and 16
retirement of the Pickering nuclear generating station; the continued shift of OPG’s rate base 17
to reflect a greater portion of nuclear assets, combined with the decline in nuclear 18
generation; and increasing climate change risks. 19
20
The debt component of OPG’s capital structure is determined using the methodologies 21
approved by the OEB in EB-2007-0905, EB-2010-0008, EB-2013-0321, and EB-2016-0152. 22
These are described in Ex. C1-1-2 and Ex. C1-1-3 for long-term and short-term debt, 23
respectively. The capitalization and cost of capital for the 2016-2026 period is summarized in 24
Ex. C1-1-1, Tables 1-11. OPG has applied this capitalization to the rate base, as adjusted to 25
reflect the application of the “lesser of Asset Retirement Costs and Unfunded Nuclear 26
Liabilities” provision applied by the OEB in EB-2007-0905, EB-2010-0008, EB-2013-0321, 27
and EB-2016-0152. 28
29
Filed: 2020-12-31 EB-2020-0290
Exhibit C1 Tab 1
Schedule 1 Page 2 of 3
3.0 RETURN ON COMMON EQUITY FOR IR TERM 1
OPG’s Application incorporates an ROE of 8.34% as this is the latest rate published by the 2
OEB (November 9, 2020) pursuant to the ROE formula as set out in Report of the Board on 3
the Cost of Capital for Ontario’s Regulated Utilities, December 2009, EB-2009-0084 (“Cost of 4
Capital Report”). 5
6
OPG proposes to establish the ROE for the IR term using the prevailing ROE specified by 7
the OEB in accordance with the OEB’s Cost of Capital Report as of the effective date of the 8
Payment Amounts Order. Consistent with the OEB’s decision and order in the EB-2016-0152 9
proceeding, OPG proposes to use the same ROE throughout the IR period.1 10
1 EB-2016-0152, Decision and Order, pp. 110-111.
Filed: 2020-12-31 EB-2020-0290
Exhibit C1 Tab 1
Schedule 1 Page 3 of 3
ATTACHMENTS 1
2
Attachment 1: Ontario Power Generation Common Equity Ration Study by Concentric 3
Energy Advisors. 4
5
Attachment 2: Executed Engagement Letter for Concentric Energy Advisors 6

ONTARIO POWER GENERATION
COMMON EQUITY RATIO STUDY DECEMBER 31, 2020
CEADVISORS.COM
©2020 CONCENTRIC ENERGY ADVISORS, INC. ALL RIGHTS RESERVED.
Filed: 2020-12-31 EB-2020-0290 Exhibit C1-1-1 Attachment 1
Page 1 of 131
DAVELLAL
Rectangle

i
TABLE OF CONTENTS
Section 1: Executive Summary 1
Section 2: Scope of Analysis and Overview of Concentric 8
Section 3: Background on Prior OEB Decisions 11
Section 4: Principles for a Fair Return 16
Section 5: Canadian Versus U.S. Historical Equity Ratios 20
Section 6: Changes in Capital Markets Since the EB-2016-0152 Decision and Order 26
Section 7: Changes in Business and Financial Risks Since the EB-2016-0152 Decision 29
Section 8: Proxy Group Comparative Analysis 60
Appendix A: Nuclear Risk – Credit Rating Agencies 78
Appendix B: Precedent for Considering U.S. Data 82
Appendix C: Resume of James M. Coyne 85
Appendix D: Resume of Daniel S. Dane 93
Filed: 2020-12-31 EB-2020-0290 Exhibit C1-1-1 Attachment 1
Page 2 of 131

ii
TABLE OF FIGURES
Figure 1: Nuclear Portion of OPG’s Rate Base Over Time 5
Figure 2: Summary of Comparative Analysis Results (Concentric Proxy Group) 6
Figure 3: Summary of Comparative Analysis Results (Moody’s Peer Group) 6
Figure 4: Capital Market Trends 2017-2020 26
Figure 5: Equity Market Volatility 2007-2020 27
Figure 6: Utility Stock Betas – Sept. 2019 through Oct. 2020 28
Figure 7: Ontario Nuclear Refurbishment and Retirements Schedule 38
Figure 8: Summary of Generation Construction Enabling Legislation 41
Figure 9: Value of Nuclear and Hydroelectric Output 53
Figure 10: OPG’s Prescribed Facilities Rate Base ($ billions) 55
Figure 11: OPG’s Prescribed Facilities Generation (TWh) 56
Figure 12: OPG’s Generation and Rate Base Over Time, by Fuel Source 56
Figure 13: Comparative Value of Nuclear vs. Hydroelectric Output 57
Figure 14: Summary of Comparative Analysis Results (Concentric Proxy Group) 60
Figure 15: Summary of Comparative Analysis Results (Moody’s Peer Group) 61
Figure 16: Concentric Proxy Group and OPG 67
Figure 17: Moody’s Proxy Group and OPG 68
Figure 18: Summary of Regulatory Mechanisms for Concentric’s Proxy Group 71
Figure 19: Generation versus Transmission and Distribution Assets 72
Figure 20: Generation Mix (MW), Percentage Hydro and Nuclear Generation 73
Figure 21: Concentric Proxy Group Equity Ratios 74
Figure 22: Moody’s Proxy Group Equity Ratios 75
Filed: 2020-12-31 EB-2020-0290 Exhibit C1-1-1 Attachment 1
Page 3 of 131

1
SECTION 1:
EXECUTIVE SUMMARY
Concentric Energy Advisors, Inc. (“Concentric”) was retained to prepare this independent report as
to whether the application of the cost of capital approved by the Ontario Energy Board (“OEB” or
“Board”) in EB-2016-0152 is an appropriate basis for setting Ontario Power Generation’s (“OPG’s”)
payment amounts in its next rate application. As the OEB has traditionally accounted for differences
in risk through the deemed equity ratio for each regulated utility under its jurisdiction, rather than
the authorized return on equity (“ROE”), Concentric’s analysis specifically focuses on OPG’s capital
structure. OPG’s next rate application will cover the five-year period from 2022 to 2026.
In our analysis, OPG’s risk profile will increase materially during the 2022 to 2026 period, as
compared to its risk profile at the time of EB-2016-0152. The most significant risk factors
contributing to the increase are: the Darlington Refurbishment Project (“DRP”) entering a critical
stage of execution; the continued operation of aging nuclear units; the retirement of the Pickering
nuclear station; the continued shift of OPG’s rate base to reflect a greater portion of nuclear assets,
combined with an increase in the financial value of each unit of nuclear output; and increasing climate
change impacts. Given the increased risk profile, and OPG’s higher risk relative to other utilities that
have equity ratios at the regulated operating company level that average from 49.5% to 55.9%,
Concentric recommends that an equity ratio of no less than 50% be set for OPG in the upcoming
proceeding.
Concentric followed the OEB’s preferred approach to assessing capital structure for the utilities it
regulates by performing a detailed risk analysis of OPG, along with the changes to OPG’s risk profile
and an assessment of the impact of current market conditions on the cost of capital. Concentric also
examined OPG’s relative risk and equity ratio compared to other utilities. In addition, Concentric
considered OPG’s current capital structure for consistency with the three components of the fair
return standard: (1) the comparable investment standard; (2) the financial integrity standard; and
(3) the capital attraction standard. Concentric’s analysis also included a review and consideration of
the Board’s prior findings with regard to OPG’s equity thickness. In consideration of those findings,
Concentric’s report provides further context and analysis regarding the drivers of risk for OPG and
the comparability of U.S. and Canadian regulatory regimes.
Our recommended equity ratio for OPG in the upcoming rate setting period is set at a level that
balances the results of our analysis, which indicates heightened risk for OPG on an absolute basis and
Filed: 2020-12-31 EB-2020-0290 Exhibit C1-1-1 Attachment 1
Page 4 of 131

2
in comparison to peer companies and supports an equity ratio at the high end of the range of
reasonable results (i.e., 55% to 56%), with the OEB’s prior findings. In our view, the recommended
50% is the minimum appropriate equity ratio for OPG. This is particularly important as the allowed
return on equity (“ROE”) by the OEB, currently 8.34%, is below the allowed ROEs for the proxy group
companies.
Canadian Versus U.S. Historical Equity Ratios
The OEB found in EB-2016-1052 that an adjustment was appropriate for U.S.-derived equity ratios
due to the historical difference between authorized equity levels for Canadian and U.S. utilities. As
discussed herein, Concentric’s conclusion in this report is that an adjustment for differences in the
allowed equity ratios between Canada and the U.S. is not necessary at this time (and on a forward-
looking basis) because the business risk, including regulatory risk, for regulated utilities in the two
countries is comparable, and the investment community’s view is that any regulatory risk differential
between the countries has narrowed significantly, if not disappeared. This view is supported by our
interviews with equity and credit analysts covering the North American utility industry who
indicated that any differences in business risk, including regulatory risk, between utilities in Canada
and the U.S. are not sufficient to justify the historically wide gap in equity ratios between the two
countries.
Based on this analysis, it is Concentric’s view that an adjustment based on the existence of a historical
difference between Canadian and U.S. deemed equity ratios would be inconsistent with the market’s
current views on cross-border business risk comparability, including regulatory risk, and would be
inappropriate for purposes of setting OPG’s regulatory capital structure on a forward-looking basis.
Business and Financial Risk Analysis
Concentric’s risk analysis focuses on: (a) the impact of current economic conditions on the cost of
capital; (b) changes to OPG’s business and financial risks since EB-2016-0152; (c) expected changes
to OPG’s risk profile and financial integrity on a forward-looking basis, consistent with how an
investor would analyze OPG; and (d) for comparative purposes, a review of capital structure data for
similar North American electric utilities. Because OPG’s regulated capital structure is reflective of its
overall risk profile related to the regulated operations, Concentric's analysis considered both the
nuclear and hydroelectric businesses and their attendant risks.
Filed: 2020-12-31 EB-2020-0290 Exhibit C1-1-1 Attachment 1
Page 5 of 131

3
Economic Environment
In terms of the current economic environment and its impact on the cost of capital, several factors
are at work. On the equity side, and notwithstanding the low government bond yields discussed
below, sustained volatility in publicly traded equity markets in both Canada and the U.S. has made
investors more risk-adverse and safety conscious. In prior periods of market disruption, utilities have
served as a safe haven for investors, but the ongoing COVID-19 pandemic, along with slumping
demand and disruption to business plans, has left investors uncertain of the outlook for utilities.
Utility betas, which measure the movement of individual stock prices in relation to the overall
market, are well above their historical norms, and market indicators signal that the cost of equity for
utilities has increased during the pandemic.
Applied to the OEB’s framework for determining the cost of capital, the decline in the government
bond yields is reflected in a decrease in allowed ROE from 8.52% for the 2020 year to 8.34% for the
2021 year, per the OEB’s most recent update to the cost of capital parameters. This will place the
allowed ROE in Ontario below that of any other North American regulatory jurisdiction, at a time
when market views of utility risk appear to be increasing. For OPG specifically, the reduction in the
allowed ROE will negatively affect OPG’s credit metrics at a time when they are already expected to
be pressured.
Business and Financial Risks
With regard to business and financial risks, Concentric reaches the following summary conclusions.
• OPG continues to be at risk for variability in the output at its nuclear plants, a factor that
distinguishes OPG from other North American regulated generators. This risk pervades and
compounds OPG’s other nuclear risks, discussed below.
• OPG is in the process of refurbishing the four-unit Darlington nuclear station as part of a
$12.8 billion “megaproject”. OPG is subject to increased risk related to the DRP, compared to
EB-2016-0152, due to new project execution risks in the upcoming rate-setting period,
including the execution of new first-of-a-kind (“FOAK”) scope, managing overlapping unit
refurbishments, trades availability and constraints due to the COVID-19 pandemic.
• While the OEB found in EB-2016-0152 that the protections provided by Ontario Regulation
53/05 (“O. Reg. 53/05”) mitigate OPG’s risk related to the DRP, Concentric observes that the
same is true for other North American nuclear generation owners that are undergoing large
nuclear construction projects and have higher equity ratios than OPG. This report provides a
Filed: 2020-12-31 EB-2020-0290 Exhibit C1-1-1 Attachment 1
Page 6 of 131

4
summary of legislative and regulatory mechanisms available in other jurisdictions, and how
those mechanisms have protected (or failed to protect) the utility nuclear owners. As such,
Concentric’s recommended minimum equity ratio for OPG takes into account the risk
reducing provisions for the DRP under O. Reg. 53/05. The recommendation also considers
the impact of OPG’s other material deferral and variance accounts related to the nuclear
business.
• The majority of OPG’s nuclear fleet is nearing the end of its current operating life, with the
Pickering station set to end commercial operation during the upcoming rate period and
Darlington units requiring refurbishment as they reach end of ‘first’ life during the period.
Therefore, OPG faces an inherently increasing risk related to variability in generation output
due to the aging of its nuclear stations, which can lead to significant revenue shortfalls.
• In addition to the increased generation risk leading up to the end of the station’s commercial
operations, the shutdown and retirement of Pickering, comprising 60% of the company’s
operating nuclear reactors and served by thousands of employees, in the upcoming rate
period presents new and unique challenges for OPG related to significant disruptive
organizational changes that can impact operational performance, increase forecast risk and
reduce the diversification of OPG’s nuclear fleet.
• OPG’s regulated asset mix will continue to shift towards a higher proportion of nuclear assets,
which, as the OEB previously found, are riskier than the hydroelectric business. Upon
completion of the DRP in 2026, nuclear generation operations are projected to comprise
approximately 60% of OPG’s overall regulated rate base, compared to 32% as of December
31, 2019.
Filed: 2020-12-31 EB-2020-0290 Exhibit C1-1-1 Attachment 1
Page 7 of 131

5
Figure 1: Nuclear Portion of OPG’s Rate Base Over Time1
The OEB found in EB-2016-0152 that, because output from OPG’s nuclear fleet was not
increasing, the risk of OPG had not necessarily increased as a result of the changing rate base
mix.2 This report discusses that the investment in plant, which is ultimately recovered over
output through the payment amounts, is the critical determinant of risk, notwithstanding
changes in the relative output. In OPG’s case, the significant increase in relative investment
in the nuclear fleet to be recovered drives the additional risk, even though the ratio of nuclear
to hydroelectric generation output is not expected to increase.
This report also discusses that the decline in nuclear generation output due to the DRP and
ultimately from the retirement of the Pickering station over the upcoming rate period creates
additional risk. This is because each MWh of nuclear generation will become more financially
valuable to OPG as the nuclear generation output that recovers the nuclear revenue
requirement is reduced, while continuing to be more financially valuable than each MWh of
hydroelectric generation.
For the above reasons, Concentric concludes that the increase in OPG’s nuclear rate base
(both in absolute terms and relative to the total) combined with the decline in nuclear
1 Excluding the provision for lesser of nuclear asset retirement costs and unfunded nuclear liability, which
is consistent with the OEB-approved methodology for calculating OPG’s rate base subject to the weighted average cost of capital for purposes of setting payment amounts. Nuclear rate values are subject to filing of OPG’s final rate application with the OEB. Hydroelectric rate base is estimated based on OPG’s Amended 2020-2026 Business Plan.
2 EB-2016-0152 Decision and Order, at 101-102.
Filed: 2020-12-31 EB-2020-0290 Exhibit C1-1-1 Attachment 1
Page 8 of 131

6
generation will increase OPG’s risk profile over the next five years over-and-above its level of
business risk in the prior payments amounts application.
• Risks to both OPG’s prescribed nuclear and hydroelectric operations from climate change
have increased from the prior rate proceeding, including the risk of increased capital
expenditure needs due to the threat of climate driven impacts on the company’s
infrastructure and systems. The maintenance of hydroelectric base payment amount at the
2021 levels pursuant to a recent amendment to O. Reg. 53/05 will also increase inflationary
risk for OPG.
• Concentric believes OPG’s financial risk will increase in the period from 2022 to 2026, as
illustrated by the pressure on, and potential decline below current credit rating thresholds
of, key credit metrics in the earlier years of the period. The credit metrics will be impacted by
rate smoothing outcomes in the upcoming rate application.
Concentric concludes that, taken as a whole, this shift in risk profile since the time of EB-2016-0152
is sufficient to warrant a reassessment of OPG’s equity ratio.
Equity Ratio Analysis and Recommendation
In terms of the comparable return requirement of the fair return standard, Figure 2 and Figure 3
below provide the average and median range of common equity ratios for two proxy groups of
comparable utilities, including actual book equity ratios and regulated authorized equity ratios.
Figure 2: Summary of Comparative Analysis Results (Concentric Proxy Group)
Analytical Approach Mean Equity Ratio
Median Equity Ratio
Holding Company Equity Ratios: 5-Year Avg. 45.7% 47.4% Operating Company Equity Ratios: 5-Year Avg. 52.8% 53.0% Operating Company Equity Ratios: Authorized 49.5% 49.6%
Figure 3: Summary of Comparative Analysis Results (Moody’s Peer Group)
Analytical Approach Mean Equity Ratio
Median Equity Ratio
Holding Company Equity Ratios: 5-Year Avg. 50.6% 49.1% Operating Company Equity Ratios: 5-Year Avg. 55.9% 53.6% Operating Company Equity Ratios: Authorized 50.7% 50.1%
As shown in the Figure 2 and Figure 3, the average range of equity ratios is from 45.7% to 55.9%.
This range includes equity ratios at both the holding company level (i.e., reflecting a diverse mix of
Filed: 2020-12-31 EB-2020-0290 Exhibit C1-1-1 Attachment 1
Page 9 of 131

7
regulated entities and some non-regulated risk) and the exclusively regulated operating company
level, which is the appropriate point of comparison for OPG’s regulated operations. Focusing only on
equity ratios at the regulated operating company level provides a narrower range of 49.5% to 55.9%,
and even a narrower range of regulatory authorized equity ratios from 49.5% to 50.7%.
OPG’s current equity ratio of 45% is below those ranges despite OPG’s elevated level of risk relative
to the proxy groups. The relative elevated risk reflects OPG’s significant nuclear concentration, as
well as its status as the only pure generation utility in the group, particularly when combined with
its financial risks relative to the proxy groups and the revenue risk it faces related to nuclear output
variability. On this latter point, OPG’s being entirely at risk related to variability in the output of its
nuclear facilities distinguishes it from other utilities, as the companies in the proxy group do not face
comparable risk. On this basis, we believe OPG falls toward the upper end of the risk spectrum,
reasonably supporting an equity ratio of 55% to 56% (i.e., at the upper end of the proxy group
results).
For this upcoming rate setting period, however, Concentric conservatively recommends an equity
ratio of no less than 50% for OPG. This recommendation balances considerations related to OPG’s
heightened risk profile and proxy group position with the Board’s findings in EB-2016-0152, as
discussed herein.
Witness Duty
We acknowledge that it is our duty to provide evidence in relation to this proceeding as follows:
a. to provide opinion evidence that is fair, objective and non-partisan;
b. to provide opinion evidence that is related only to matters that are within my area
of expertise; and
c. to provide such additional assistance as the OEB may reasonably require, to
determine a matter in issue.
We acknowledge that the duty referred to above prevails over any obligation which we may owe to
any party by whom or on whose behalf we are engaged.
Filed: 2020-12-31 EB-2020-0290 Exhibit C1-1-1 Attachment 1
Page 10 of 131

8
SECTION 2:
SCOPE OF ANALYSIS AND OVERVIEW OF CONCENTRIC
Scope
Concentric was retained to prepare this independent report as to whether the application of the cost
of capital approved by the OEB in EB-2016-0152 is an appropriate basis for setting payment amounts
in OPG’s next rate application. Concentric’s analysis specifically focused on OPG’s capital structure.
In preparing this report, Concentric performed the following assessment:
1. Examined the OEB’s decisions in EB-2007-0905, EB-2010-0008, EB-2013-0321 and EB-
2016-0152 to understand the OEB’s analysis and findings in past cases regarding OPG’s cost
of capital;
2. Analyzed OPG’s business and financial risks since EB-2016-0152 and on a forward-looking
basis consistent with how an investor would analyze OPG’s risk profile;
3. Examined the capital structures of a proxy group of comparable companies; and
4. Determined an appropriate capital structure for OPG.
Overview of Concentric
Concentric is a management consulting and economic advisory firm, focused on the North American
energy industry. Based in Marlborough, Massachusetts, Washington, D.C., and Calgary, Alberta,
Concentric specializes in regulatory and litigation support, transaction-related financial advisory
services, energy market strategies, market assessments, energy commodity contracting and
procurement, economic feasibility studies, and capital market analyses. The firm provides financial,
economic and regulatory advisory services to clients across North America, including utility
companies, regulatory and public agencies, and utility sector investors. Concentric has advised
energy industry participants on the purchase and sale of nuclear facilities, hydroelectric facilities,
and other generation assets, and we have served in an independent monitoring or project advisory
function on major capital projects at several nuclear generating units in North America. Concentric
also has experience relating to major refurbishment work on nuclear power life cycle management
and extended power uprates in the U.S. and Canada. Concentric has provided expert testimony on
the cost of capital in more than 100 regulatory proceedings in Canada and the U.S. over the past five
years.
James Coyne, Senior Vice President at Concentric, and Daniel Dane, also a Senior Vice President at
Concentric, coauthored this report with assistance from other Concentric staff. Mr. Coyne is a senior
Filed: 2020-12-31 EB-2020-0290 Exhibit C1-1-1 Attachment 1
Page 11 of 131

9
expert who provides testimony before Canadian provincial and U.S. federal and state agencies on
matters pertaining to economics, finance, and public policy in the energy industry. He regularly
advises utilities, generating companies, public agencies and private equity investors on business
issues pertaining to the utilities industry. This work includes determining the cost of capital for the
purpose of ratemaking and providing expert testimony and studies on matters pertaining to
incentive regulation, rate policy, valuation, capital costs, fuels and power markets. He has advised
both buyers and sellers in numerous transactions involving hydroelectric, nuclear, fossil and
renewable generation facilities, and worked with companies to develop strategies for acquiring these
assets. He has testified or provided expert evidence before state, provincial and federal jurisdictions
across Canada and the U.S. This work has been provided on behalf of utilities, regulatory commissions
and staff.
Mr. Coyne is also a frequent speaker and author of articles and white papers on the energy industry.
Recently, on behalf of the Canadian Gas Association and the Canadian Electric Association, he
prepared a discussion paper for utility executives and provincial regulators that examined the roles
that Canada’s utilities and regulators can play to promote innovation. In addition, he facilitated
workshops between Canadian regulators and utility executives on regulatory and utility responses
to a low carbon world, and drafted follow-up white papers to facilitate further discussion on
emerging industry issues. In collaboration with the Canadian Gas and Canadian Electric Associations,
he publishes a newsletter summarizing allowed ROEs and capital structures for gas and electric
utilities in Canada and the U.S. He has been an invited speaker for several CAMPUT events including
the recent Energy Regulation Course at Queen’s University where he spoke on “Innovations in Utility
Business Models and Regulation.” Mr. Coyne also coauthored a report titled “A Comparative Analysis
of Return on Equity of Natural Gas Utilities” with Mr. Dane that was prepared for the OEB in June
2007.
He holds a B.S. in Business Administration from Georgetown University and a M.S. in Resource
Economics from the University of New Hampshire.
Mr. Dane has advised numerous energy and utility clients on a wide range of financial and economic
issues with primary concentrations in valuation and utility rate matters. Many of those assignments
have included the determination of the cost of capital. Mr. Dane has also provided expert testimony
on regulated ratemaking matters, including the cost of capital, for investor-owned utilities and
regulatory agencies. Mr. Dane coauthored “A Comparative Analysis of Return on Equity of Natural
Gas Utilities” with Mr. Coyne on behalf of the OEB, as discussed above. Mr. Dane has provided sell-
Filed: 2020-12-31 EB-2020-0290 Exhibit C1-1-1 Attachment 1
Page 12 of 131

10
side support for approximately $2 billion in generating asset transactions in the U.S., including
nuclear generating facilities, and has been a significant contributor to numerous assignments at
Concentric involving independent evaluations of nuclear plant construction project commercial
strategies, project controls and management oversight, and new power plant development. Mr. Dane
has an MBA from Boston College in Chestnut Hill, Massachusetts and a BA in Economics from Colgate
University in Hamilton, New York. Mr. Dane is a certified public accountant, and is a licensed
securities professional (Series 7, 28, 63, 79, and 99). Mr. Dane also serves as the Financial and
Operations Principal of CE Capital Advisors, a FINRA-Member firm and a subsidiary of Concentric.
Messrs. Coyne and Dane’s qualifications are detailed more fully in Appendices C and D.
Filed: 2020-12-31 EB-2020-0290 Exhibit C1-1-1 Attachment 1
Page 13 of 131

11
SECTION 3:
BACKGROUND ON PRIOR OEB DECISIONS
This is the fifth general rate setting proceeding before the Board for OPG. Below is a brief synopsis
of the prior four proceedings, as well as the Board’s findings in EB-2009-0084, the “Report of the
Board on the Cost of Capital for Ontario’s Regulated Utilities.”
EB-2007-0905
EB-2007-0905 was OPG’s first cost of service application before the OEB, including cost of capital and
capital structure. In its November 3, 2008 decision in EB-2007-0905, the OEB laid out the legislative
requirements regarding rate regulation of OPG and reached numerous conclusions regarding its
approach to setting rates for OPG.
With regard to the capital structure, the OEB stated: “The Board finds that the approach to setting
the capital structure should be based on a thorough assessment of the risks OPG faces, the changes
in OPG’s risk over time and the level of OPG’s risk in comparison to other utilities.”3 The OEB further
concluded that it would apply the stand-alone principle in establishing the capital structure for OPG,
noting that “[t]he stand-alone principle is a long-established regulatory principle,”4 and that
“Provincial ownership will not be a factor to be considered by the Board in establishing capital
structure.”5 The OEB determined that a 47% equity ratio was appropriate for OPG, finding that OPG
was of higher risk than any other Ontario energy utility but of lower risk than merchant generators.6
During EB-2007-0905, the OEB set one overall capital structure for both regulated hydroelectric and
nuclear businesses but concluded that separate capital structures for the two businesses was an
approach worth examining at the next proceeding.
At the time of EB-2007-0905, OPG owned and operated six prescribed hydroelectric generating
stations (Sir Adam Beck I and II, Sir Adam Beck Pump Generating Station, DeCew Falls I and II, and
R.H. Saunders), and three prescribed nuclear generating stations (Pickering A, Pickering B, and
Darlington).7
3 EB-2007-0905, Decision with Reasons, November 3, 2008, at 136. 4 Ibid., at 140. 5 Ibid., at 142. 6 Ibid., at 149-150. 7 References to the “Pickering station” throughout the report encompass the Pickering A and Pickering B
stations as prescribed under O. Reg. 53/05.
Filed: 2020-12-31 EB-2020-0290 Exhibit C1-1-1 Attachment 1
Page 14 of 131

12
EB-2009-0084
In EB-2009-0084, the OEB reviewed its cost of capital policies for Ontario’s regulated utilities to
determine whether the automatic adjustment formula was continuing to meet the fair return
standard. As a result of its consultative process, the OEB affirmed its view that the fair return
standard frames the discretion of a regulator, by setting out three standards or requirements
(comparable investment, financial integrity, and capital attraction) that must be satisfied by the cost
of capital determinations.8 The OEB observed that meeting the fair return standard is not optional;
it is a legal requirement.
In discussing the application of the fair return standard, the OEB made the following observations:9
1. The OEB notes that the fair return standard expressly refers to an opportunity cost of
capital concept, one that is prospective rather than retrospective;
2. The OEB agrees with the National Energy Board which stated that “[i]t does not mean that
in determining the cost of capital that investor and consumer interests are balanced;”
3. All three standards or requirements (comparable investment, financial integrity, and capital
attraction) must be met, and none ranks in priority to the others;
4. The OEB reiterates that an allowed ROE is a cost and is not the same concept as a profit,
which is an accounting term for what is left from earnings after all expenses have been
provided for;
5. The OEB is of the view that utility bond metrics do not speak to the issue of whether a ROE
determination meets the requirements of the fair return standard; and
6. The OEB questions whether the fair return standard has been met, and in particular, the
capital attraction standard, by the mere fact that a utility invests sufficient capital to meet
service quality and reliability obligations. Rather, the OEB is of the view that the capital
attraction standard, indeed the fair return standard in totality, will be met if the cost of
capital determined by the OEB is sufficient to attract capital on a long-term sustainable
basis given the opportunity costs of capital.
With respect to capital structure, the OEB found that its current policy for all regulated utilities, which
was developed in March 1997, continued to be appropriate. The decision in EB-2009-0084 states:
8 EB-2009-0084, Report of the Board, December 11, 2009, at i. 9 Ibid., at 19-20.
Filed: 2020-12-31 EB-2020-0290 Exhibit C1-1-1 Attachment 1
Page 15 of 131

13
“As noted in the Board’s draft guidelines, capital structure should be reviewed only when there is a
significant change in financial, business or corporate fundamentals.”10
The OEB also reiterated other policies, including that “the rate setting methodologies used by the
OEB apply uniformly to all rate-regulated utilities regardless of ownership. The determination of the
rate-regulated utilities’ cost of capital is no exception.”11
In 2016, the OEB issued an OEB Staff Report regarding the OEB’s cost of capital policy. In that report,
OEB Staff concluded that no changes were to be made to the policy at that time.12
EB-2010-0008
OPG’s generation asset mix as of EB-2010-0008 was at approximately 38% nuclear and 62%
hydroelectric, based on OEB-approved rate base for the prescribed facilities (excluding the lesser of
nuclear asset retirement costs and unfunded nuclear liability), which was approximately the same as
it had been as of EB-2007-0905. In its March 11, 2011 decision in EB-2010-0008, the OEB found that
“there is no evidence of any material change in OPG’s business risk and that the deemed capital
structure of 47% equity and 53% debt, after adjusting for the lesser of Unfunded Nuclear Liabilities
or Asset Retirement Costs, remains appropriate.”13
In EB-2010-0008, there was a discussion of technology-specific costs of capital and capital structures.
Pollution Probe’s experts Drs. Lawrence Kryzanowski and Gordon Roberts recommended an equity
ratio of 43% for the hydroelectric operations and an equity ratio of 53% for the nuclear operations,
premised on OPG retaining its aggregate equity ratio of 47%. The OEB found that there was not
enough evidence to support technology-specific capital structures and reaffirmed its findings in EB-
2007-0905 that the risks related to nuclear generation are higher than those related to hydroelectric
generation.
In addition, while the issue was identified by the OEB in the context of technology-specific capital
structures, the OEB recognized an emerging issue, noting that “[a]s the relative size of the
hydroelectric and nuclear businesses changes (through major additions to rate base, for example)
the issue will arise as to whether the overall ratio of 47% is to remain unchanged.”14
10 Ibid., at 49. 11 Ibid., at 25. 12 EB-2009-0084, OEB Staff Report, January 14, 2016, at 1. 13 EB-2010-0008, Decision with Reasons, March 10, 2011, at 116. 14 Ibid., at 117.
Filed: 2020-12-31 EB-2020-0290 Exhibit C1-1-1 Attachment 1
Page 16 of 131

14
EB-2013-0321
In EB-2013-0321, the OEB found that OPG’s business risks had changed, primarily pointing to the
addition of 48 hydroelectric assets to OPG’s regulated assets and the then recently completed Niagara
Tunnel Project. Specifically, the OEB found that the addition of hydroelectric assets and the Niagara
Tunnel Project “increase the proportionate share of rate base related to hydroelectric facilities from
about half in 2010 to approximately two-thirds now [i.e., as of EB-2013-0321].”15
As a result of these findings, the OEB lowered the equity ratio for OPG from 47% to 45%. Specifically,
the OEB stated, “…[t]he Board has determined that business risk has changed for this payment setting
period, and that the business risk is reduced. The business risk is reduced because of the addition of
significant hydroelectric assets to rate base, which are less risky than nuclear assets.”16
In addition, the OEB found that, at the time of EB-2013-0321, moving to incentive regulation did not
significantly increase risks to OPG such that the capital structure should be reset, noting that the
capital structure for Ontario’s electricity and gas distributors had not been reset when they moved
to incentive regulation. The OEB did note, however, that part of its decision was based on the fact
that OPG was not moving to incentive regulation in EB-2013-0321, and that “any potential changes
to business risk this may entail could be considered in the incentive regulation proceeding.”17
EB-2016-0152
The OEB left OPG’s equity ratio unchanged in its decision and order in EB-2016-0152. The OEB
continued to find that nuclear generation presents more business risks than hydroelectric
generation, and that OPG’s nuclear rate base would “increase substantially over the five-year term of
[of the period over which rates were being set],”18 but noted that nuclear generated MWh will not
increase relative to hydroelectric MWh. The OEB further found that OPG’s nuclear-specific risks were
mitigated by factors including “various protections provided by O. Reg. 53/05 and the variance and
deferral accounts that allow OPG to recover substantially all their unexpected or unforeseen costs.”19
The OEB also found that the move to incentive regulation would not add significant risk to OPG noting
that there was no new evidence to the contrary, and that given OPG’s planning of the DRP and certain
regulatory protections under O. Reg. 53/05, the risks of the DRP were also controlled. Additionally,
the OEB commented on the use of U.S. companies in the proxy group for OPG, noting that Canadian
15 EB-2013-0321, Decision with Reasons, November 20, 2014, at 113. Clarification added. 16 Ibid., at 114. 17 Ibid. 18 EB-2016-0152, Decision and Order, December 28, 2017, at 102. Clarification added. 19 Ibid.
Filed: 2020-12-31 EB-2020-0290 Exhibit C1-1-1 Attachment 1
Page 17 of 131

15
ratemaking equity ratios tend to be lower that U.S. ratemaking equity ratios and that, in EB-2016-
0152, an adjustment should have been made to the U.S. companies’ equity ratios to account for that
divergence. The OEB also noted that given its findings in the decision related to OPG’s plan for
Pickering extended operations beyond 2020 and the regulatory protections under O. Reg. 53/05, the
associated risks, including a determination that Pickering extended operations may not proceed,
were unlikely to materialize.
Filed: 2020-12-31 EB-2020-0290 Exhibit C1-1-1 Attachment 1
Page 18 of 131

16
SECTION 4:
PRINCIPLES FOR A FAIR RETURN
The Supreme Court of Canada established the principles surrounding the concept of a “fair return”
for a regulated company in the Northwestern Utilities v. City of Edmonton (1929) (“Northwestern”)
case, where the Supreme Court found:
By a fair return is meant that the company will be allowed as large a return on the
capital invested in its enterprise (which will be net to the company) as it would receive
if it were investing the same amount in other securities possessing an attractiveness,
stability and certainty equal to that of the company’s enterprise.20
As stated by Major and Priddle in 2008, this definition remains in full legal effect today.21
United States law regarding fair return for utility cost of capital has evolved similarly. The U.S.
Supreme Court set out guidance in the bellwether cases of Bluefield Water Works and Hope Natural
Gas Co. as to the legal criteria for setting a fair return. In Bluefield Water Works & Improvement
Company v. Public Service Commission of West Virginia (262 U.S. 679, 693 (1923)), the Court found:
The return should be reasonably sufficient to assure confidence in the financial
soundness of the utility and should be adequate, under efficient and economical
management, to maintain and support its credit and enable it to raise the money
necessary for the proper discharge of its public duties. A rate of return may be
reasonable at one time and become too high or too low by changes affecting
opportunities for investment, the money market and business conditions generally.
The U.S. Court further elaborated on this requirement in its decision in Federal Power Commission v.
Hope Natural Gas Company (320 U.S. 591, 603 (1944)). There the Court described the relevant
criteria as follows:
From the investor or company point of view it is important that there be enough revenue
not only for operating expenses but also for the capital costs of the business. These
include service on the debt and dividends on the stock [....] By that standard the return
to the equity owner should be commensurate with returns on investments in other
enterprises having corresponding risks. That return, moreover, should be sufficient to
20 Northwestern at 193. 21 The Fair Return Standard for Return on Investment by Canadian Gas Utilities: Meaning, Application,
Results, Implications, by The Honourable John C. Major, Former Justice, Supreme Court of Canada, and Roland Priddle, President, Roland Priddle Energy Consulting Inc., Former Chair of the National Energy Board, March 2008, at 4.
Filed: 2020-12-31 EB-2020-0290 Exhibit C1-1-1 Attachment 1
Page 19 of 131

17
assure confidence in the financial integrity of the enterprise, so as to maintain its credit
and to attract capital.
With the passage of time, the fair return standard has been interpreted many times in both Canada
and the U.S. In Canada, the National Energy Board (“NEB”, predecessor to the Canadian Energy
Regulator) summarized its interpretation of the “fair return standard” in its RH-2-2004 Phase II
Decision and more recently reiterated that interpretation in its Trans Québec & Maritimes Pipelines
Inc. RH-1-2008 Decision, at pp. 6-7.
The [NEB] is of the view that the fair return standard can be articulated by having
reference to three particular requirements. Specifically, a fair or reasonable return on
capital should:
be comparable to the return available from the application of the invested
capital to other enterprises of like risk (the comparable investment standard);
enable the financial integrity of the regulated enterprise to be maintained (the
financial integrity standard); and
permit incremental capital to be attracted to the enterprise on reasonable
terms and conditions (the capital attraction standard).
In the [NEB]’s view, the determination of a fair return in accordance with these
enunciated standards will, when combined with other aspects for the Mainline’s revenue
requirement, result in tolls that are just and reasonable.22
Similarly, in its EB-2009-0084, Report of the Board on the Cost of Capital for Ontario’s Regulated
Utilities, December 11, 2009, the OEB discussed the necessity of adhering to the fair return standard
as follows:
The Board affirms its view that the Fair Return Standard frames the discretion of a
regulator, by setting out the three requirements that must be satisfied by the cost of
capital determinations of the tribunal. Meeting the standard is not optional; it is a legal
requirement. Notwithstanding this obligation, the Board notes that the Fair Return
Standard is sufficiently broad that the regulator that applies it must still use informed
22 National Energy Board RH-2-2004 Reasons for Decision, TransCanada PipeLines Ltd, Phase II, April 2005,
at 17.
Filed: 2020-12-31 EB-2020-0290 Exhibit C1-1-1 Attachment 1
Page 20 of 131

18
judgment and apply its discretion in the determination of a rate regulated entity’s cost
of capital.
***
… all three standards or requirements (comparable investment, financial integrity, and
capital attraction) must be met and none ranks in priority to the others. The Board
agrees with the comments made to the effect that the cost of capital must satisfy all
three requirements which can be measured through specific tests and that focusing on
meeting the financial integrity and capital attraction tests without giving adequate
comparability to the comparable investment test is not sufficient to meet the [Fair
Return Standard].23
Canadian regulatory authorities, including the OEB, have also determined that another key principle
in establishing a fair return on equity for a regulated utility is the “stand-alone” principle. The OEB’s
specific findings with regard to the stand-alone principle for OPG are included above in the summary
of EB-2007-0905.
Furthermore, the OEB has recognized that the cost of capital is a forward-looking concept. For
example, in its decision in EB-2009-0084, the OEB referenced a presentation by Dr. Bill Cannon at
CAMPUT’s 2009 Energy Regulation Conference during which Dr. Cannon explained the forward-
looking nature of the cost of capital as follows: “First, it [the cost of capital] is forward looking.
Investment returns are inherently uncertain and the ex post, actual returns experienced by investors
may differ from those that were expected ahead of time. The cost of capital is therefore an expected
rate of return.”24 Elsewhere in that same decision, the OEB stated: “First, the Board notes that the
[Fair Return Standard] expressly refers to an opportunity cost of capital concept; one that is
prospective rather than retrospective.”25 In other words, investors establish their return
requirements based on expectations regarding economic growth, inflation, interest rates, the market
risk premium and other factors affecting future risks and opportunity costs.
Investors also consider the business and financial risks of a particular company relative to other
similarly situated companies in the same industry. For example, as mentioned previously, the OEB
has expressed its view that “the capital attraction standard, indeed the [Fair Return Standard] in
totality, will be met if the cost of capital determined by the Board is sufficient to attract capital on a
23 Ontario Energy Board, EB-2009-0084, Report of the Board on the Cost of Capital for Ontario’s Regulated
Utilities, December 11, 2009, at i and 19. 24 Ibid., at 25. 25 Ibid., at 19.
Filed: 2020-12-31 EB-2020-0290 Exhibit C1-1-1 Attachment 1
Page 21 of 131

19
long-term sustainable basis given the opportunity costs of capital.”26 Further, the OEB has
determined that “[t]he comparable investment standard requires empirical analysis to determine the
similarities and differences between rate-regulated utilities.” However, the assessment of
comparability “does not require that those entities be ‘the same’.”27
26 Ibid., at 20. 27 Ibid., at 21.
Filed: 2020-12-31 EB-2020-0290 Exhibit C1-1-1 Attachment 1
Page 22 of 131

20
SECTION 5:
CANADIAN VERSUS U.S. HISTORICAL EQUITY RATIOS
In its EB-2016-0152 decision and order, the OEB determined that “on balance an increase in OPG’s
equity thickness is not necessary in order for the fair return standard to be met.”28 With respect to
the information presented by both Concentric (on behalf of OPG) and the Brattle Group (on behalf of
the OEB Staff) regarding the allowed equity ratio for the U.S. proxy group and the authorized equity
ratios for Canadian investor-owned utilities, the OEB wrote: “The OEB finds that an adjustment to
the comparator group data should have been made by both experts to account for the substantially
lower common equity ratios allowed regulated utilities in Canada.”29
In considering this matter in this report, Concentric’s analysis is that while the average allowed
equity ratio for U.S. utilities is higher than the average deemed equity ratio for Canadian utilities, this
wide differential is not currently explained by differences in business risk, including regulatory risk.
For example, equity and credit analysts have acknowledged that while they previously considered
U.S. utilities to have higher business and regulatory risk than Canadian regulated utilities, that
perception has changed in recent years as U.S. utilities have been granted a broader suite of cost
recovery mechanisms and adjustment clauses that reduce regulatory lag and provide similar risk
mitigation to that of their Canadian counterparts. Equity analysts have also indicated that they view
the regulatory environment in Canada and the U.S. as being similar, and that U.S. regulation has been
providing more timely cost recovery and reducing regulatory lag in recent years.
For example, a March 2019 report by equity analysts at Scotiabank indicated that they view the
regulatory environments in Canada and the U.S. as being similar for regulated utilities. In explaining
why they expect the valuations of Canadian and U.S. utilities to converge, Scotiabank observed:
Historically, the Canadian utilities have traded at a discount to their mid-cap U.S. peers.
We attribute this to the historical view that Canadian regulation was superior to U.S.
regulation (we no longer have that view) as well as to strong earnings growth in part
due to M&A.30
This continues a trend that started approximately ten years ago. For example, in a September 2013
report, Moody’s Investors Service (“Moody’s”) explained its changing view on the relative risk of U.S.
28 EB-2016-0152, Decision and Order, December 28, 2017, at 109. 29 Ibid. 30 Scotiabank Equity Research Spotlight, Energy Infrastructure, March 18, 2019, at 9. Emphasis added.
Filed: 2020-12-31 EB-2020-0290 Exhibit C1-1-1 Attachment 1
Page 23 of 131

21
and Canadian utilities as follows:
Based on our observations of trends and events, we propose to adopt a generally more
favorable view of the relative credit supportiveness of the US regulatory environment.
Our updated view considers improving regulatory trends that include the increased
prevalence of automatic cost recovery provisions, reduced regulatory lag, and generally
fair and open relationships between utilities and regulators.31
In support of this changing view on the relative risk of the US regulatory environment, Moody’s noted
the following developments:
“We believe that many US regulatory jurisdictions have become more credit supportive of
utilities over time and that the assessment of the regulatory environment in the US that has
been incorporated in the ratings may now be overly conservative.”32
“While we had previously viewed individual state regulatory risks for US utilities as being
higher than utilities in most other developed countries (where regulation usually occurs at
the national level), we have observed an overall decrease in regulatory risk in the US.”33
“There have been a number of favorable regulatory changes in recent years. For example, the
increasing prevalence of riders, trackers and other automatic cost recovery provisions in the
US has reduced the amount of time between when a utility incurs and recovers costs, or
‘regulatory lag.’ These changes have happened incrementally – jurisdiction by jurisdiction or
even issuer by issuer. We now believe that these changes, in aggregate, represent a
significant improvement in the timeliness of cost recovery.”34
“We believe the majority of US utilities enjoy relatively fair and open relationships with their
regulators, and that most regulators strive to maintain reliable, financially viable utilities in
their states while balancing the needs of the state’s commercial, industrial and residential
utility customers.”35
“A comparison of key financial ratios used under the Regulated Electric and Gas Utilities
Rating Methodology in rating utilities across developed international jurisdictions with credit
supportive regulatory frameworks (including Canada and Japan) shows that US regulated
31 Moody’s Investors Service, Proposed Refinements to the Regulated Utilities Rating Methodology and Our
Evolving View of US Utility Regulation, September 23, 2013, at 1. 32 Ibid., at 4. 33 Ibid. 34 Ibid. 35 Ibid.
Filed: 2020-12-31 EB-2020-0290 Exhibit C1-1-1 Attachment 1
Page 24 of 131

22
utilities in recent years have exhibited stronger financial ratios relative to similarly rated
regulated international utility peers.”36
In order to supplement our assessment of how investors perceive the regulatory environment for
utilities in Canada and the U.S., Concentric conducted interviews in October and November 2020 with
equity and credit analysts who cover the North American utility industry to discuss their views
regarding the regulatory environment in Canada and the U.S.37 The interviews focused on the
following questions: 1) whether the analysts factor country risk into their analysis/rating;
2) whether they see the Canadian regulatory environment as providing any more or less risk
protection and support to utilities than the U.S. regulatory environment, and if so, what specific
factors lead to this conclusion; 3) whether they factor in state/provincial level regulatory risk in their
analysis; 4) whether they view the Ontario regulatory environment as more or less favorable than
other Canadian provinces and U.S. states; 5) whether they view electric generation as more or less
risky than electric transmission and distribution (“T&D”); 6) whether they view nuclear generation
as more or less risk than other types of electric generation; and 7) whether they see differentials in
equity ratios between Canadian and U.S. utilities as being justified by differences in business and
regulatory risk in Canada or Ontario as compared to the U.S.
Importantly, while many analysts continue to view the Canadian regulatory environment as
somewhat more favorable for regulated utilities than the U.S. regulatory environment, the situation
in Canada is seen as being static, while the U.S. landscape is viewed as having improved in recent
years through the more frequent use of forward test years, revenue decoupling mechanisms, and
capital cost recovery mechanisms that have reduced regulatory lag and enhanced the ability of U.S.
utilities to earn their authorized ROE. Further, equity and credit analysts do not see the differential
in deemed equity ratios between Canada and the U.S. as being justified by differences in business or
regulatory risk. In addition, it was clear from our interviews that equity and credit analysts see the
utility industry as a North American industry, and that any differences are more likely to be observed
between specific provinces/states than between the two countries. The differences between specific
provinces and states are viewed as being very narrow, and most Canadian provinces and U.S. states
are seen as credit supportive for regulated utilities, with only minor gradations between those that
are most credit supportive and those that are less credit supportive. Lastly, equity and credit analysts
36 Ibid., at 5. 37 Survey participants included: Robert Hope, equity analyst – Scotiabank; Robert Kwan, equity analyst –
RBC Capital Management; Ben Pham, equity analyst – Bank of Montreal; Andrew Ng, Gerrit Jepsen, and Obioma Ugboaja, credit analysts – S&P Global Ratings; and Gavin MacFarlane, credit analyst – Moody’s Investors Service
Filed: 2020-12-31 EB-2020-0290 Exhibit C1-1-1 Attachment 1
Page 25 of 131

23
agreed that ownership of electric generation assets is more risky than electric transmission and
distribution operations, and that nuclear generation is the riskiest type of generation. The last
finding is further supported by Appendix A, in which excerpts from S&P Global Ratings (“S&P”)
reports illustrate that agency’s views on the high-risk nature of nuclear operations.
The following section provides more specific details regarding how the analysts we interviewed view
the risk profiles of the utilities they cover and the regulatory environment in which those utilities
operate.
Country risk: Equity and credit analysts who participated in the survey indicated that
they view Canada and the U.S. as having the same or very similar country risk. They
do not distinguish between the two countries on the basis of country risk unless there
is a large divergence in the risk-free rate (i.e., wider than the current gap of 20 basis
points for the 10 year government bond). They tend to consider country risk as a
factor in their investment analysis when they are comparing Canada and the U.S. to
other countries outside North America, in particular emerging markets.
Comparing Canadian and U.S. regulatory environment: Equity and credit analysts
tend to see the Canadian regulatory environment as somewhat more favorable than
in the U.S. However, most analysts noted that the U.S. regulatory environment has
improved in recent years U.S. due to the increased use of forward test years, revenue
decoupling mechanisms, and approval of cost recovery mechanisms that improve the
timeliness of cost recovery for capital investments and infrastructure replacement
projects. Several analysts expressed the view that it is more important to consider
differences between specific jurisdictions instead of drawing more general
conclusions about the two countries. Also, it was observed that the regulatory
environments in Canadian provinces are more homogeneous than in the U.S., and that
there are a number of U.S. jurisdictions that compare favorably to Canadian
jurisdictions in terms of providing support for timely cost recovery and the ability to
earn the authorized return. Credit analysts in particular were more focused on
whether the regulatory environment provided regulatory and financial stability, and
whether there was regulatory independence and a lack of political interference, than
on whether one jurisdiction was more supportive than another. Equity analysts
tended to focus on whether the utility is able to earn its authorized return and
generate predictable earnings and cash flows. One analyst commented that he
believes the higher authorized ROEs in the U.S. help to offset the greater regulatory
lag in certain states. The prevalence of cost disallowances was another factor noted
by both equity and credit analysts as a consideration (and as a concern for OPG in
particular).
Influence of regulatory risk on investment analysis: One equity analyst observed that
utilities in more favorable jurisdictions receive higher valuations, while those in less
favorable jurisdictions receive lower valuations. Another equity analyst indicated
Filed: 2020-12-31 EB-2020-0290 Exhibit C1-1-1 Attachment 1
Page 26 of 131

24
that his firm’s top utility recommendation was a Canadian company that had more
than half its assets in a U.S. subsidiary that operates in a state that allows relatively
high ROEs, support for rate base investment, and strong customer relationships that
result in settlement agreements. At the same time, they have a less favorable outlook
on another Canadian utility company given its material exposure to a jurisdiction that
has among the lowest authorized ROEs in the country and stranded asset risk. Credit
analysts reiterated their view that differences in regulatory risk between
jurisdictions were relatively small and that regulation provides an overall credit
supportive environment for all utilities in both Canada and the U.S.
Equity ratio differential: The equity analysts expressed the view that the equity ratio
differential between Canada and the U.S. is not justified by differences in business or
regulatory risk between the two countries. In particular, one equity analyst
commented that the equity thickness and ROE in Ontario are inferior to many other
jurisdictions, especially those in the U.S. While this difference historically was
acceptable, the analyst saw the improving regulatory framework in the U.S. as cause
for concern that the low equity thickness and ROE in Ontario could lead to challenges
in incenting capital to flow to the province. Another equity analyst observed that the
equity thickness gap has not narrowed between Canada and U.S., and that he would
prefer that the equity ratio gap be lowered.
Generation vs. T&D operations risk: The equity and credit analysts who we
interviewed agreed that companies that own electric generation assets have greater
risk than T&D utility companies. Among the reasons cited for this higher risk profile
were: increased operational risk, greater risk of economic obsolescence, higher risk
of forced outages, and higher environmental risk. An equity analyst commented that
with the emergence of environmental, social and governance (“ESG”) considerations
in late 2018, investors now tend to prefer companies with less generation and more
T&D assets. A credit analyst explained that generation has higher risk under their
stated credit criteria, and that generation ownership specifically affects the financial
risk profile of a utility company because it determines what financial benchmarks are
used to assess financial risk.
Nuclear risk: Nuclear generation is viewed as the riskiest type of generation by the
equity and credit analysts we interviewed. Among the reasons for this assessment
were: the possibility of catastrophic failure and loss of life, damage to the
environment, risk around decommissioning and spent fuel disposal, construction cost
overruns, more unplanned outages, negative sentiment around the technology
following the nuclear incident in Japan, and higher safety requirements. One equity
analyst commented that the Ontario government has been supportive of nuclear
generation being part of the fuel mix, as evidenced by the ongoing refurbishment of
the Darlington and Bruce reactors, and that the risk of economic obsolescence is
generally lower for nuclear as compared to other generation types. Another equity
analyst indicated that certain investors have investment policy statements that
Filed: 2020-12-31 EB-2020-0290 Exhibit C1-1-1 Attachment 1
Page 27 of 131

25
restrict any exposure to nuclear energy. Lastly, a credit analyst expressed the view
that nuclear risk is company specific and that state legislation to support nuclear
capital cost recovery does not always provide protection depending on the company’s
circumstances.
The results of the analyst interviews support Concentric’s view that an adjustment for differences in
the allowed equity ratios between Canada and the U.S. would be inconsistent with the market’s
current views, namely that cross-border business and regulatory risk for regulated utilities in the
two countries is comparable. As such, Concentric believes that the historical differential between
authorized equity ratios in Canada and the U.S. cannot be currently applied on the basis of differences
in these risks and that it is appropriate to compare OPG’s allowed equity ratio to that of risk
comparable utilities in both countries without adjustment when setting OPG’s regulatory capital
structure on a forward-looking basis.
Filed: 2020-12-31 EB-2020-0290 Exhibit C1-1-1 Attachment 1
Page 28 of 131

26
SECTION 6:
CHANGES IN CAPITAL MARKETS SINCE THE EB-2016-0152
DECISION AND ORDER
Capital markets impact the appropriate regulatory capital structure as they have a direct impact on
the required ROE that, when combined with the equity ratio, determines the allowed return on
equity. Since the OEB’s last major decision on OPG’s payment amounts (EB-2016-0152) in December
2017, and through the early months of 2020, North American capital markets reflected a period of
slow economic growth, coupled with low inflation and historically low government bond yields. Stock
markets in both the U.S. and Canada responded with continued growth in the major indices as
investors grew comfortable with the prospects for slow but steady economic growth and improving
corporate profitability. That, of course, all changed in March 2020 with the onset of the COVID-19
pandemic and upheaval of the global economy. In response, stock prices declined sharply, before
subsequently beginning to recover, and stimulative economic policies have pressed government
bond yields even lower. These fundamental market indicators are captured in Figure 4 below.
Figure 4: Capital Market Trends 2017-2020
As investors have been adapting to the new norms of the pandemic, stock markets have surpassed
pre-pandemic levels, as government bond yields remain at or near newly established historic lows.
Filed: 2020-12-31 EB-2020-0290 Exhibit C1-1-1 Attachment 1
Page 29 of 131

27
Although one could conclude that the cost of equity for utilities is lower in such an environment, there
is evidence to the contrary. In particular, equity markets remain in a heightened state of volatility,
as seen below.
Figure 5: Equity Market Volatility 2007-202038
Stock market volatility for both the TSX60 and S&P500 (as measured by its volatility index, or “VIX”)
are presented. The spike that occurred in March 2020 was unprecedented, and even though markets
have since then stabilized, volatility remains above historical levels for the past two decades. Higher
volatility is generally considered a sign of increased risk in the broad markets.
Looking at utilities specifically, Figure 6 below illustrates a significant upshift in the betas for utility
stocks over the past twelve months, centered in the March/April 2020 timeframe. Beta is broadly
considered a measure of risk, and this upward shift in utility betas signals that investors are not
considering utilities at the same low levels of relative risk as they have in the past. In the context of
the current pandemic, we believe this is likely driven, at least in part, by an uncertain economic
outlook and a recognition that even regulated utilities face increased risk exposure in the current and
foreseeable environment.
38 Source: Bloomberg Professional. Data for 2020 updated through November 24, 2020.
0.0
10.0
20.0
30.0
40.0
50.0
60.0
70.0
80.0
90.0
20
07
/6
20
07
/10
20
08
/2
20
08
/6
20
08
/10
20
09
/2
20
09
/6
20
09
/10
20
10
/2
20
10
/6
20
10
/10
20
11
/2
20
11
/6
20
11
/10
20
12
/2
20
12
/6
20
12
/10
20
13
/2
20
13
/6
20
13
/10
20
14
/2
20
14
/6
20
14
/10
20
15
/2
20
15
/6
20
15
/10
20
16
/2
20
16
/6
20
16
/10
20
17
/2
20
17
/6
20
17
/10
20
18
/2
20
18
/6
20
18
/10
20
19
/2
20
19
/6
20
19
/10
20
20
/2
20
20
/6
20
20
/10
IND
EX
SPTSX60 Index VIX Index
Avg TSX Volatility(Nov 2008) = 78.5TSX Volatility March 2020 average= 58.9
TSX Volatility November 2020 average = 15.3 Median TSX Volatility (Jan 2007 - Nov 2020) = 12.2
Avg VIX (Nov 2008) = 62.6VIX March 2020 average= 57.7
VIX November 2020 average = 25.7Median VIX (Jan 2007 - Nov 2020) = 17.0
Data through 11/24/20
Filed: 2020-12-31 EB-2020-0290 Exhibit C1-1-1 Attachment 1
Page 30 of 131

28
Figure 6: Utility Stock Betas – Sept. 2019 through Oct. 2020
The above trend is unlike prior periods of market disruption where utilities have typically served as
a safe haven for investors. It appears that the pandemic has left investors uncertain of the outlook for
the sector amid concerns for slumping demand and disruption to business plans, with utility betas in
both the U.S. and Canada increasing substantially since January 2020. This indicates that the cost of
equity for regulated utilities has increased. In contrast, when the OEB recently updated the cost of
capital parameters for the 2021 rate year, the authorized ROE was reduced from 8.52% to 8.34% due
to the decline in the government bond yields. Notably, this currently places the allowed ROE in
Ontario below that of any other North American regulatory jurisdiction and negatively affects OPG’s
credit metrics at a time when they are already expected to be pressured.
0
0.1
0.2
0.3
0.4
0.5
0.6
0.7
0.8
0.9
1
Bloomberg 5-yr Beta - Utilities
Filed: 2020-12-31 EB-2020-0290 Exhibit C1-1-1 Attachment 1
Page 31 of 131

29
SECTION 7:
CHANGES IN BUSINESS AND FINANCIAL RISKS SINCE THE EB-
2016-0152 DECISION
Business risk for a regulated utility results from variability in cash flows and earnings that impact
the ability of the utility to recover its costs including a fair return on, and of, its capital in a timely
manner. Concentric includes operating risk and regulatory risk under this broad definition of
business risk. Financial risk relates to a company’s debt leverage and liquidity and is measured by
its credit profile. Both business and financial risk have a direct bearing on a utility’s cost of capital.
The cost of capital is a forward-looking concept, and utility investors tend to be long-term providers
of capital. For these reasons, it is important to not only review OPG’s current business and financial
risk profile, but also to assess how that risk profile has changed and will change going forward. This
approach is consistent with the OEB’s findings in prior decisions regarding OPG’s capital structure.39
This section contains an overview and analysis of OPG’s business and financial risks, with a focus on
how those risks have changed since EB-2016-0152 and how they are forecast to change over the
2022 to 2026 rate-setting period.
To evaluate OPG’s business risks, Concentric performed an independent review of OPG and its
regulatory environment, building on Concentric’s previous assignment in EB-2016-0152. The review
included: (1) risks related to the prescribed hydroelectric facilities; (2) risks related to the prescribed
nuclear facilities, including the DRP and upcoming retirement of the Pickering station; (3) OPG’s
projected regulated business mix between those two types of generation, and how that mix is
expected to change over the rate-setting period; and (4) the external influence of climate change and
its impact on OPG’s generation fleet and operations.
Our experience in assessing business and financial risks and the effect on the cost of capital in Ontario
and other regulatory jurisdictions, as well as our prior roles as an independent monitor and advisor
to the power industry, informed our review. Our additional experience advising buyers and sellers
of generation facilities, including hydroelectric and nuclear facilities, further informs our views on
the investor perspective regarding the business risk of these assets. Our evaluation process included
research on equity and credit analyst views regarding OPG and the regulated generation industry,
39 For example, in EB-2013-0321, the Board determined that because the business risk for OPG’s regulated
operations had changed in the specific payment-setting period in that proceeding, the capital structure should reflect that change.
Filed: 2020-12-31 EB-2020-0290 Exhibit C1-1-1 Attachment 1
Page 32 of 131

30
relevant industry data, other publicly-available materials such as Ontario’s December 2017 Long-
Term Energy Plan and the IESO’s 2020 Annual Planning Outlook, regulatory filings made by OPG,
OPG’s Amended 2020-2026 Business Plan, OPG’s financial reports, OPG’s Climate Change Plan and
interviews with OPG subject matter experts.
Concentric concludes in this section that while OPG’s risk level for its regulated operations will
remain the same in some areas of the business, the overall risk for these operations will significantly
increase, due to the following factors:
OPG continues to be at risk for variability in the output at its nuclear plants, a factor that
distinguishes OPG from other North American regulated generators. This risk pervades and
compounds OPG’s other nuclear risks, discussed below.
The DRP, as OPG is entering a period of acute risk beyond what it has experienced historically,
with three units coming offline in the upcoming rate setting period with overlapping outages,
new FOAK scope being added to the refurbishment, competition for resources with the Bruce
Power refurbishment, and ongoing constraints and risks presented by the COVID-19
pandemic;
The majority of OPG’s nuclear fleet is nearing the end of its current operating life, with
Pickering planned to end commercial operation during this upcoming rate period and
Darlington units requiring refurbishment as they reach their end of ‘first’ life. Therefore, OPG
is at inherently higher risk related to variability in the generation output due to the aging of
the nuclear stations. This could lead to significant revenue shortfalls for OPG;
In addition to the increased generation risk leading up to the end of the station’s commercial
operations, the shutdown and retirement of Pickering, comprising six of the Company’s ten
operating nuclear reactors and served by thousands of employees, in this upcoming rate
period presents new and unique challenges for OPG related to disruptive organizational
changes that can impact operational performance, increased forecast risk and reduce the
diversification of OPG’s nuclear fleet;
Risks to both OPG’s nuclear and hydroelectric operations from climate change have increased
considerably from its prior rate proceeding, including the risk of increased capital
expenditure needs due to the threat of climate driven impacts on the company’s
infrastructure and systems;
Filed: 2020-12-31 EB-2020-0290 Exhibit C1-1-1 Attachment 1
Page 33 of 131
31
OPG’s asset mix will continue to shift towards a higher proportion of riskier nuclear assets,
combined with an increase in relative value of each nuclear MWh due to declining generation
over which revenue requirement is recovered on a variable basis; and
OPG’s financial risk will increase in the period from 2022 to 2026, as illustrated by the
pressure on, and potential decline below current credit rating thresholds of, key credit
metrics in the earlier years of the rate setting period.
Concentric concludes that, taken as a whole, this shift in risk profile is sufficient to warrant a
reassessment of OPG’s equity ratio.
OPG Overview
OPG is an electricity generation company established under the Ontario Business Corporations Act
and is wholly owned by the Province of Ontario (“Province”). As of December 31, 2019, OPG’s
regulated generation portfolio included two nuclear generating stations (i.e., Pickering and
Darlington) as well as 54 hydroelectric generating stations. OPG’s regulated facilities are the
prescribed facilities under O. Reg. 53/05.
Since 2017, OPG is a public debt issuer in Canada. OPG, as a corporation, has a split “A (low)” issuer
and unsecured debt rating (with stable trend) (as of April 16, 2020) from DBRS Morningstar
(“DBRS”), a “BBB+” issuer and unsecured debt credit rating (with stable outlook) (as of July 17, 2020)
from S&P, and an “A3” senior unsecured debt rating from Moody’s (with stable outlook) (as of
December 21, 2020).
Both S&P and Moody’s note that they rate OPG three notches below their respective OPG corporate
credit ratings on a stand-alone basis (that is, before considering support by the Province), namely as
“BB+” and “baa3”, respectively.
Changes in Business Risk
1. Hydroelectric Facilities
OPG has 54 hydroelectric stations that are subject to OEB regulation and that supply approximately
6,400 MW of generating capacity. The remainder of OPG’s hydroelectric stations are not regulated
by the OEB. The hydroelectric system is comprised of a diverse set of assets. OPG’s hydroelectric
stations vary in size, location, age, operating and hydrological characteristics (i.e., base load,
intermediate, peaking). Because of the geographic diversity of the system, the hydroelectric assets
are subject to numerous federal, interprovincial, and provincial regulations, international treaties,
agreements, and waterpower leases. OPG plans to invest approximately $2.0 billion of capital in its
Filed: 2020-12-31 EB-2020-0290 Exhibit C1-1-1 Attachment 1
Page 34 of 131

32
hydroelectric system over the 2022 to 2026 period. Those investments are being made primarily to
replace aging infrastructure and upgrade/redevelop certain sites.
Generally, the major risks to a regulated utility related to hydropower include: (1) availability of
water to power the stations; (2) water management plans and requirements, including
environmental and water level regulations that affect the way the stations operate (or impede the
license to operate); (3) the need for capital and operating expenditures to address evolving
environmental, regulatory and sustaining requirements (e.g., dam safety, flooding, fisheries, and
climate change); (4) the ability to license and gain permits and/or water power leases for new
facilities; and (5) and the ability to recover costs, including a return, in a timely manner.
OPG’s hydroelectric business is expected to remain relatively stable from an operating risk
perspective relative to the experience and conditions as they existed at the time of EB-2016-0521,
subject to the impact of climate change impacts and increased inflationary risk, as discussed further
below.
OPG’s hydroelectric operations are subject to variances in water flow and surplus baseload
generation (“SBG”) curtailments. However, while the availability of water to power the stations can
vary significantly from year to year, Concentric is not aware of any reason why variances in water
flow over the rate period are more or less at risk of being higher or lower than at the time of EB-
2016-0152 (subject to the climate change risk discussed below). In addition, with respect to SBG,
Concentric understands that a reduction in nuclear generation capacity in the Province through the
period of refurbishments and Pickering retirement is generally expected to result in a gradual decline
in SBG conditions, although this may be offset by inherent near-term risks to electricity demand
associated with the COVID-19 pandemic.
Further, OPG has a Hydroelectric Water Conditions Variance Account that records and mitigates the
financial impact of differences between forecast and actual water conditions, and a Hydroelectric
Surplus Baseload Generation Variance Account that records and mitigates the financial impact of SBG
related curtailments, subject to the OEB’s approval. On balance, Concentric is of the view that the
risks related to the availability of water to power the stations and SBG related curtailments have not
changed significantly since EB-2016-0152. Concentric understands that OPG’s rate application will
propose that these and other currently-approved deferral and variance accounts related to its
prescribed hydroelectric facilities remain in place. Assuming this proposal is approved, there should
be no overall change in risk for OPG.
Filed: 2020-12-31 EB-2020-0290 Exhibit C1-1-1 Attachment 1
Page 35 of 131

33
Similar to the risks related to the availability of water flows, Concentric is not aware of any significant
changes in risks related to water management and environmental regulations affecting OPG’s
regulated hydroelectric power production relative to the risk levels at the time of EB-2016-0152.
OPG’s hydroelectric system is a mature system, with an average age of approximately 80 years and
the oldest facility being over 120 years old. This means that, while the risk of equipment failure is
higher, the risk of discovering new operational issues or the intervention of new stakeholders is
generally lower than it would be for a newer system. In addition, Concentric understands that OPG is
not planning to add any significant amount of new hydroelectric capacity during the period, beyond
upgrading or redeveloping certain existing sites. Because of this, Concentric expects OPG’s need to
obtain waterpower leases or rights for new regulated hydroelectric capacity should not materially
deviate from recent experience, leaving associated risks at similar levels as at the time of EB-2016-
0152.
OPG’s hydroelectric base payment amounts are legislatively set at the 2021 amount and as such will
not increase over the 2022-2026 period. As a result, OPG will be exposed to a level of incremental
inflationary risk over the upcoming period, relative to a hydroelectric payment amount set under a
price-cap incentive regulation model applied in EB-2016-0152.
Based on the above, Concentric concludes that although some incremental risks have emerged, OPG’s
operational risks and regulatory risks related to its prescribed hydroelectric facilities have not
changed significantly since EB-2016-0152, other than additional risks from rising threat of climate-
driven impacts (discussed further below) and incremental inflationary risk.
2. Nuclear Facilities
OPG has two prescribed nuclear facilities: Darlington and Pickering. Operating since the early 1990s,
Darlington is a CANDU, four-unit station with a generating capacity of about 3,500 MW. Pickering has
been in operation since the early 1970s and is a CANDU, six-unit station with a generating capacity
of about 3,100 MW, with two additional units in a permanent safe shutdown state. OPG’s nuclear
operations, including nuclear waste management activities, are subject to federal regulation by the
Canadian Nuclear Safety Commission (“CNSC”) on all matters pertaining to the development,
production and use of nuclear energy, including matters of safety, security and the environment.
Supported by the Province, OPG plans to operate Pickering Units 1 and 4 to 2024 and, subject to
CNSC’s regulatory approval, Units 5-8 until the end of 2025, under an optimized shutdown schedule.
The current CNSC operating licence for the Darlington station expires on November 30, 2025 and for
the Pickering station on August 31, 2028. The Pickering operating licence currently allows
Filed: 2020-12-31 EB-2020-0290 Exhibit C1-1-1 Attachment 1
Page 36 of 131

34
commercial operation of the station until December 31, 2024. All of OPG’s operating licences for its
nuclear waste facilities are also current and up to date.
OPG’s sustaining capital investment program for the nuclear fleet is primarily focused on ensuring
the Darlington station is well positioned to transition to steady state ‘second life’ operations following
refurbishment, including investments in life cycle and aging management projects, facility upgrades
and work in support of regulatory commitments. Over the 2022 to 2026 period, OPG plans to make
sustaining capital investments totaling approximately $1.8 billion into the nuclear fleet, in addition
to the DRP.
OPG is responsible for the ongoing and long-term management of nuclear fuel and other nuclear
waste from its operations as well as for the eventual decommissioning of its nuclear generating
stations and waste management facilities. Under the Ontario Nuclear Funds Agreement (“ONFA”)
with the Province, OPG is required to set aside funding in segregated funds toward the long-term
management of nuclear waste and decommissioning obligations. Subject to certain exposures
assumed by the Province, OPG bears the risk of future cost increases and fund investment
performance related to these obligations. Canada’s plan for long-term management of spent nuclear
fuel is being implemented by a federally-mandated organization, established and funded by nuclear
fuel owners including OPG. OPG is responsible for a plan for long-term disposal of its low and
intermediate level waste material.
Under the current rate plan, OPG recovers the cost of its nuclear facilities under a custom incentive
rate-setting (“Custom IR”) framework established in EB-2016-0152. Under the Custom IR
framework, OPG continues to be at risk related to the variability in the generating output of its
nuclear facilities. OPG’s risk related to the variability in nuclear generating output compounds its
nuclear-specific business risks, as discussed herein, and also distinguishes OPG from other regulated
North American generators.
Generally, the major risks to a regulated utility related to nuclear power generation include: (1) the
ability to implement large and complex projects on time and on budget; (2) increases in costs and/or
outage durations related to emerging safety regulations (e.g., Fukushima-response costs); (3) age-
related degradation of station components, discovery of unexpected conditions and/or extended
outage durations that put nuclear plants at risk of producing lower-than-forecasted power; (4)
retirement and decommissioning of nuclear plants and long-term management of spent nuclear fuel
and other nuclear waste, including the cost and timing of decommissioning work and the ability to
fund that work; and (5) the ability to recover costs, including a return, in a timely manner.
Filed: 2020-12-31 EB-2020-0290 Exhibit C1-1-1 Attachment 1
Page 37 of 131

35
Consistent with the OEB’s prior findings, nuclear generation is viewed by the investment community
to be riskier than other forms of generation, including hydroelectric generation.40 Furthermore, for
large nuclear construction projects, regulatory support for timely cost recovery is critical given the
complexity of building this type of generation, as highlighted by a history of industry project delays
and cost overruns, as well as a shortage of skilled labor.41 Appendix A provides additional
information regarding the investment community’s views on the high-risk nature of nuclear
operations.
Before turning to the changes in OPG-specific nuclear risks, we note that recent events in the nuclear
construction business since EB-2016-0152 have further raised the perceived risk of large nuclear
facility projects among investors and credit rating agencies. In particular, two new nuclear projects
in the U.S. (i.e., the Vogtle Plant in Georgia and the now-cancelled Summer Plant in South Carolina),
both of which were being pursued under favorable legislative and regulatory frameworks, have run
into cost and schedule issues. One of the projects (i.e., the V.C. Summer plant in South Carolina)
resulted in the bankruptcy of a major vendor, the downgrading of the credit rating of the owners, the
eventual merger of one of the owners (i.e., SCANA Corporation) into a larger utility (i.e., Dominion
Energy), and the potential to require the sale of the other owner (i.e., Santee Cooper, a state-owned
corporation) to an investor-owned utility in order to eliminate a reported billions in interest charges
to customers for a plant that was never completed. These projects and their regulatory and political
environment are discussed in greater detail in a subsequent section of the report.
The major changes in the operational and financial risks faced by OPG’s nuclear facilities are as
follows:
a. Darlington Refurbishment
OPG is refurbishing the Darlington station for 30-plus additional years of operations. The four-unit
DRP is a “megaproject” with a budget of $12.8 billion, lasting approximately a decade in execution.
40 See, e.g., Moody’s Investors Service, “Rating Methodology: Regulated Electric and Gas Utilities,” June 23,
2017, at 42-43, in which Moody’s highlighted risks related to nuclear ownership that include: (1) safety, regulatory, and operational issues; (2) lasting regulatory and safety consequences from the March 2011 Fukushima nuclear accident in Japan, leading to increased operating costs; and (3) an aging fleet and early retirements due to station failures that require uneconomic repairs.
41 In its 2013 rating methodology for utilities, Moody’s also commented on legislative and regulatory support for nuclear construction projects, noting specifically SCANA Corporation in South Carolina: “For SCANA Corporation, the South Carolina Base Load Review Act provides strong credit support for companies engaging in nuclear new-build, which also affects the scoring for consistency and predictability of regulation. However, SCANA’s rating also considers the size and complexity of the nuclear construction project, which is out of scale to the size of the company, as well as structural subordination.” Moody’s Investors Service, “Rating Methodology: Regulated Electric and Gas Utilities,” December 23, 2013, at 43.
Filed: 2020-12-31 EB-2020-0290 Exhibit C1-1-1 Attachment 1
Page 38 of 131

36
At the time of writing, OPG had completed the refurbishment of the first unit, Unit 2, and has
commenced the refurbishment of the second unit, Unit 3. The remaining two units are scheduled to
commence execution early in the 2022 to 2026 period, with the entire project completed by the end
of 2026. Capital expenditures totaling approximately $4.8 billion were placed in service upon Unit 2
returning to service, including overall DRP definition phase costs incurred prior to commencement
of execution.
i. DRP Risk Profile
A project of the DRP’s size and schedule length that will more than double OPG’s rate base, regardless
of the technology, inherently presents a significant source of risk for any utility. As noted in the Scope
of Analysis and Overview of Concentric section of this report, Concentric has been an advisor to
several North American utilities undertaking “megaprojects” such as the DRP. We have witnessed
firsthand the issues even the most well-planned large construction projects can face, including scope,
budget, and schedule increases, as well as increased regulatory scrutiny. The performance of large
construction projects in a nuclear setting compounds those issues.
Specifically, the DRP includes multiple complex work packages, including the removal and
replacement of the reactor calandria tubes and pressure tubes from each reactor, replacement of all
feeders, refurbishment of the existing fuel handling equipment, refurbishment of the existing turbine
generators, refurbishment of the existing steam generators, and a set of supporting refurbishment
projects aligned with existing station systems. The project involves numerous third-party vendors
and the coordination of multiple scopes of work, all within the highly regulated and safety-conscious
environment of a nuclear facility. In addition, the Canadian marketplace for nuclear construction
firms is limited, increasing the risks related to vendor management and performance. Furthermore,
the DRP is currently being executed during the global COVID-19 pandemic, which places constraints
on and could pose additional risks for the project, as further discussed below.
Filed: 2020-12-31 EB-2020-0290 Exhibit C1-1-1 Attachment 1
Page 39 of 131

37
The inherently high execution risks associated with the DRP have been noted by the investment
community. For example, Moody’s stated in its December 2020 OPG credit rating report, “[t]he
company is also pursuing a CAD12.8 billion nuclear refurbishment project across 4 units at its
Darlington nuclear generation station that carries a very high level of execution risk.”42 Similarly,
DBRS observed in its April 2020 OPG credit rating report, “[t]he Company also faces significant
execution risk as well as the potential for cost overruns associated with the Darlington
Refurbishment because of the project’s complexity and scale.”43 In EB-2016-0152, the OEB similarly
stated that, “[t]here is no question that successful execution of the DRP is a challenge for OPG during
the term of [the 2017-2021 rate] plan.”44
OPG successfully completed the refurbishment of Unit 2 earlier in 2020, which has been positively
noted by the credit rating agencies. For example, S&P stated in its July 2020 OPG credit rating report,
“[t]he company’s on-time and on-budget record [on Unit 2] increases our confidence that the other
three units will be also be completed without incurring project delays or materially higher costs.”45
However, it is known that prior CANDU refurbishments and large nuclear construction projects in
the U.S. have encountered significant challenges. As demonstrated by those prior projects, schedules
can slip, outage durations can be different than expected, and there are risks related to the
performance and output of the nuclear facilities post-refurbishment.
While OPG has carefully planned the refurbishment of the three remaining units, including applying
lessons learned from the Unit 2 refurbishment, Concentric concludes that there are a number of
additional risks that the Company is facing during the remaining project period, as discussed below.
In Concentric’s opinion, notwithstanding a decrease in certain risks resulting from the experience
gained on Unit 2, the additional risks result in an overall increase to the Company’s risk profile as it
relates to the remainder of the project.
First, the DRP is entering a period of acute execution risk beyond what it has experienced historically.
The refurbishment of Unit 2 took place when there were no other units undergoing refurbishment in
Ontario. In contrast, three of the Darlington units are planned to be offline for refurbishment during
the upcoming rate setting period. Critically, the refurbishments for the units will overlap; for a period
of time in 2023 all three units are planned to be offline. Also during OPG’s upcoming rate setting
period, Bruce Power is planning to have four of its units offline for refurbishment, some with their
42 Moody’s Investors Service, “Ontario Power Generation Inc.,” December 21, 2020, at 1. 43 DBRS Limited (DBRS Morningstar), “Rating Report: Ontario Power Generation Inc.,” April 16, 2020, at 3. 44 EB-2016-0152, Decision and Order, December 28, 2017, at 104. Clarification added. 45 S&P Global Ratings, “Research Update: Ontario Power Generation Inc.,” July 17, 2020, at 1.
Filed: 2020-12-31 EB-2020-0290 Exhibit C1-1-1 Attachment 1
Page 40 of 131

38
own overlapping outages.46 These circumstances will place a high demand on the highly skilled
resources required to support both projects that rely on certain of the same vendors and key
tradespeople. As such, there are inherently higher risks related to project execution during this
period of significantly increased sector activity. The schedule of the OPG and Bruce Power projects
(along with Pickering retirements) is shown in Figure 7 below.
Figure 7: Ontario Nuclear Refurbishment and Retirements Schedule47
Second, OPG plans to execute new scope during the refurbishment of Units 3, 1 and 4 in the form of
digital turbine controls and generator excitation controls. This scope was excluded from the Unit 2
refurbishment for two main reasons: (1) there was still useful life left in the existing control systems
on Unit 2; and (2) to mitigate risk, given that Unit 2 was the first unit to be refurbished and that this
large FOAK modification would have introduced additional risk into the planning and execution of
the refurbishment. The addition of this scope with which OPG does not yet have experience brings
with it increased challenges and risks for the remaining units.
Third, OPG is at increased risk related to the potential for vendor default. The risk of vendor default
is already heightened in the context of OPG’s nuclear operations as a result of the small pool of
qualified vendors available to perform nuclear engineering and construction. In particular, vendors
SNC Lavalin Nuclear Inc. (“SNC”) and Aecon Construction Group Inc. (“Aecon”) represent the most
material of OPG’s vendor default risk because of the volume of work they perform for OPG, including
acting in a joint-venture (CanAtom) as the main vendor for the DRP. In May 2020, SNC’s credit rating
46 Bruce Power refers to its nuclear refurbishment program as Major Component Replacement. 47 Independent Electricity System Operator, 2020 Annual Planning Outlook, at 28.
Filed: 2020-12-31 EB-2020-0290 Exhibit C1-1-1 Attachment 1
Page 41 of 131

39
by S&P was affirmed at “BB+” (with a negative outlook), following a downgrade from “BBB-“ in
August 2019. S&P’s outlook on SNC remains “negative” based primarily on uncertainty in the
company’s ability to improve earnings and cash flow, especially in context of the COVID-19 pandemic
that is resulting in weaker than expected earnings, a weaker economic environment and lower
construction activity.48
Fourth, the COVID-19 pandemic is an unforeseen ‘black-swan’ event. OPG did not allocate any DRP
contingency to the risk of a pandemic outbreak. Concentric understands that OPG continues to seek
ways to manage the currently known impacts of the pandemic, including the incremental costs
incurred to date. The inherent uncertainty of the pandemic’s evolving course, however, makes it
difficult to predict the full range of response actions that may become necessary in the future and any
ultimate impact on the DRP cost or schedule. For example, in response to the pandemic and Ontario’s
state-of-emergency declaration in mid-March 2020, OPG made the following decisions with respect
to the refurbishment schedule: (i) continue to return Unit 2 to service (Unit 2 was safely returned to
service on June 4, 2020); and (ii) defer the start dates of the refurbishment outages of Units 3, 1 and
4 by four months each.
In response to the pandemic, OPG conducted a risk review to identify any new or increased risks
arising both from the pandemic itself, and also from OPG’s decision to delay the refurbishment start
dates of Units 3, 1 and 4. This risk review resulted in new or increased risks being identified, which
can be summarized as follows:
1. Productivity risk: risk of decreased productivity as a result of the COVID-19 protocols (such
as physical distancing, enhanced cleaning, use of masks, etc.) associated with working during
a pandemic.
2. Resource availability risk: risk of resource conflicts and shortages in the form of both human
and equipment resources, including managing of staff and equipment as a result of new
overlaps with station planned outages, travel restrictions for specialized resources required
on the DRP, and risk of loss of critical project resources due to the overall extended schedule
(further compounding the significant anticipated demand for resources during the multiple
overlapping refurbishments with Bruce Power).
48 S&P Global Ratings, Research Update: SNC-Lavalin Group Inc. 'BB+' Ratings Affirmed; Outlook Remains
Negative On Slower-Than-Expected Deleveraging, May 2020.
Filed: 2020-12-31 EB-2020-0290 Exhibit C1-1-1 Attachment 1
Page 42 of 131

40
Depending on the course of the COVID-19 pandemic, these factors may have an impact on the
ultimate cost and schedule of the DRP.49
We note that OPG does continue to employ robust risk mitigation strategies related to the DRP. From
the outset, OPG has approached the project strategically and methodically, including performing
numerous front-end planning and preparation activities, such as completion of detailed designs and
construction of a full-scale model training reactor, and sophisticated contracting strategies. Through
the execution of the Unit 2 refurbishment, OPG has been identifying, reviewing and applying a
number of lessons learned and strategic improvements in planning the work on subsequent units.
However, notwithstanding these practices, significant execution risks associated with the DRP
remain as noted above and cannot be fully offset by mitigation strategies.
ii. Cost Recovery Protections Available to Nuclear Owners
As noted in the OEB’s decision in EB-2016-0152, provisions of O. Reg. 53/05 provide important
protection to OPG, reducing the company’s future recovery risk by establishing the overall need for
the DRP in the regulatory context and requiring the OEB to authorize recovery of incurred costs
(including if the units are not ultimately returned to service), subject to a prudence review. However,
Concentric finds that similar risk reducing properties are also or have been present in other
jurisdictions that have undergone large-scale nuclear construction projects, including among the
proxy companies considered by Concentric in Section 8, and thus are taken into account in this
report’s recommendations for OPG’s equity ratio.
To make this assessment, Concentric compared O. Reg. 53/05 from a risk mitigation perspective to
similar legislation and regulatory rules that have enabled nuclear construction in other jurisdictions,
focusing on whether: 1) the relevant regulator must approve the need for the new generating plant
before construction begins (i.e., the utility does not face the risk of not being subsequently allowed to
close the project to rate base upon completion); 2) the utility is allowed to recover prudently-
incurred construction and financing costs before the plant goes into service; 3) the utility is allowed
to recover costs that exceed the originally approved projections, subject to a prudence review by the
regulator; and 4) the utility is able to recover prudently incurred construction costs if the project is
abandoned. In particular, Concentric reviewed legislation in the following three jurisdictions where
large scale nuclear projects are underway or have been completed (or abandoned): Georgia, South
49 Concentric understands that OPG does not intend to seek recovery of any pandemic-related cost impacts
through the 2022-2026 rate application but rather will propose to record the impacts in the Capacity Refurbishment Variance Account for the OEB’s review at the conclusion of the DRP.
Filed: 2020-12-31 EB-2020-0290 Exhibit C1-1-1 Attachment 1
Page 43 of 131

41
Carolina and Florida. The following is a brief summary of the relevant legislation and statutes in each
jurisdiction.
Figure 8: Summary of Generation Construction Enabling Legislation
South
Carolina50
Georgia Florida
Does commission approve need for new generation before construction begins?
Yes Yes Yes
Is utility allowed to recover prudently incurred construction and financing costs before plant goes into service?
Yes Yes Yes
Is utility able to recover prudently incurred construction costs if plant is abandoned before completion?
Yes N/A51 Yes
As demonstrated in Figure 8, the legislation and statutes in South Carolina, Georgia and Florida
include regulatory protection and assurance of cost recovery for nuclear construction projects
comparable to that available to OPG through O. Reg. 53/05. Additionally, all three of the jurisdictions
allow recovery of prudently incurred construction and financing costs for the projects prior to the
plant going into service (i.e., the utility is allowed to place CWIP in rate base and earn a cash return),
a provision not available to OPG under O. Reg. 53/05 and not granted by the OEB.52 On that basis,
Concentric concludes that the regulatory mitigation for the DRP is not unique to OPG, and that
construction or refurbishment projects in other jurisdictions may not have been feasible without
legislative and regulatory support. Further, because these states offer similar risk protection for
nuclear projects, it is reasonable to compare the authorized equity ratios for these operating utilities
(i.e., South Carolina Electric and Gas, Georgia Power, and Florida Power and Light) to the deemed
equity ratio for OPG. Concentric’s analysis of comparable utilities in Section 8 includes data from two
of the three of major developers of nuclear plants in those states.53
With regard to whether other North American utilities have been allowed to recover cost overruns
on large nuclear projects subject to prudence review, Concentric has identified several instances
50 The Base Load Review Act in South Carolina was repealed in 2017. 51 The legislation in Georgia does not appear to address this issue directly. 52 EB-2010-0008, Decision with Reasons, March 10, 2011, at 78. 53 The third developer, Dominion Energy (which acquired SCANA in 2019), is excluded from the analysis due
to a lower percentage of regulated operations than the screening criteria used by Concentric.
Filed: 2020-12-31 EB-2020-0290 Exhibit C1-1-1 Attachment 1
Page 44 of 131

42
where regulators in Florida, South Carolina and Georgia have approved recovery of such cost
overruns. While this provision is not explicitly included in the enabling legislation in these three
states, our research demonstrates that there has been implicit support for cost recovery when the
need arises. The following is a brief summary of examples in each jurisdiction:
Florida – Florida Power and Light Company (“FPL”) was allowed to recover costs associated with an Extended Power Uprate project at St. Lucie and Turkey Point following a prudence review, despite cost overruns. In 2011, FPL experienced “cost variances” of more than $60 million in total in two particular cost categories. The Florida Public Service Commission further indicated that “FPL’s cost estimates have increased each year.” However, despite these cost increases, the Commission approved those costs as prudently incurred.54
South Carolina – In November 2016 (before the Base Load Review Act was repealed), the Public Service Commission of South Carolina approved a settlement agreement in which South Carolina Electric & Gas increased the anticipated cost of constructing two units at the VC Summer Nuclear Station by $831 million following a prudence review.55
Georgia – The Georgia Public Service Commission issued an order in which it “verifies and approves” Georgia Power’s expenses for Vogtle Units 3 & 4. The order further states “[t]he Commission finds and concludes, based on the evidence presented, that the Vogtle Project remains the most economic option available for supplying the identified capacity need, even taking in to account the sources of speculated cost overruns known at this time.”56
Concentric further observes that legislative protections related to nuclear construction projects have
not eliminated recovery risk for utilities. Indeed, as noted earlier, recent events in the nuclear
construction industry in two of the above jurisdictions, South Carolina and Georgia, have, in fact,
increased the investors’ perceived risk over such projects.
In particular, in South Carolina, SCANA started construction of the V.C. Summer Plant under the Base
Load Review Act (“BLRA”), which, as discussed below, provided regulatory support for cost recovery
of new nuclear facilities during construction. The project experienced construction delays, cost
overruns and the bankruptcy of the engineering, procurement and construction contractor
(Westinghouse). This led SCANA to ultimately abandon the project in July 2017. SCANA sought
recovery of its prudently incurred costs up to that time under the provisions of the BLRA. However,
SCANA’s credit rating was downgraded by S&P in September 2017 when the consumer advocate in
South Carolina challenged the constitutionality of the BLRA, which was ultimately repealed by the
South Carolina legislature, and SCANA was eventually acquired by Dominion Energy in order to avoid
54 Florida Public Service Commission, Docket No. 120009-EI, Order No. PSC-12-0650-FOF-EI, issued
December 11, 2012, at 68, 73, and 75. 55 Public Service Commission of South Carolina, Docket No. 2016-223-E, Order No. 2017-118, issued
February 28, 2017, at 24. 56 Georgia Public Service Commission, Docket No. 29849, issued February 26, 2013, at 6.
Filed: 2020-12-31 EB-2020-0290 Exhibit C1-1-1 Attachment 1
Page 45 of 131
43
further financial distress. In addition, Santee Cooper, the co-owner of the V.C. Summer plant, is being
considered for sale in order to eliminate $3.6 billion in future interest payments tied to the nuclear
construction program.57
In Georgia, Georgia Power undertook the construction of Vogtle plant units 3 and 4 after receiving
Georgia Public Service Commission (“Georgia PSC”) approval for the new nuclear facilities under the
Georgia Nuclear Energy Financing Act. S&P noted in an August 2020 report that Staff of the Georgia
PSC have expressed concern that Georgia Power’s stated schedule for completing construction on the
units and bringing those units into service appears to be overly aggressive, although Georgia Power
continues to report that construction is on schedule for the two units to be in service by June 2021
and June 2022, respectively. 58 In addition, S&P has expressed concern with whether additional costs
will be deemed to have been prudently incurred by the Georgia PSC, or if some portion of those costs
might be disallowed.59 The possibility of disallowance associated with cost overruns related to
project execution risks similarly exists for OPG’s DRP under O. Reg. 53/05.
In light of recent “megaproject” experiences such as those in South Carolina and Georgia, the
investment community continues to consider the DRP as a major source of risk, even taking into
account the O. Reg. 53/05 protections. In fact, other recent regulated nuclear mega-projects in North
America have only moved forward with enabling legislation that mitigates risks to the utility,
including pre-construction finding of need for the project, ability to recover financing costs during
construction, approval of costs in excess of original projections, subject to prudence, and protections
in the event the project is abandoned. Absent such legislative and regulatory support, other North
American utilities have generally not been willing to undertake nuclear mega-projects.
b. Nuclear Facilities Aging Risks
The majority of OPG’s nuclear fleet is nearing the end of its current operating life, with the Pickering
station set to end commercial operation during the upcoming rate period and Darlington units
requiring refurbishment as they reach end of ‘first’ life during the period. Both stations therefore face
an inherent risk of experiencing increased effects of aging on their operations and output over the
upcoming rate period.
57 Meyers, Ellen, “SC agency recommends Dominion Energy, NextEra to reform Santee Cooper,” S&P Global
Market Intelligence, February 11, 2020. 58 S&P Ratings Direct, “Research Update: Southern Company and Subsidiaries Outlooks Remain Negative on
Higher Nuclear Construction Costs, Ratings Affirmed,” August 6, 2020. 59 Ibid.
Filed: 2020-12-31 EB-2020-0290 Exhibit C1-1-1 Attachment 1
Page 46 of 131

44
The CANDU reactors at Darlington have limited remaining design life, thus necessitating the DRP to
ensure the generating units are fit for service for another 30 years. As the units continue to age
toward their end of ‘first’ life, there is a greater risk of emerging equipment issues necessitating
incremental repair and maintenance expenditures, as well as generation interruptions.
Additionally, Concentric understands that OPG continues to monitor a fitness-for-service risk for the
last two units to be refurbished, Units 1 and 4, whereby their effective full-power hours may
potentially expire prior to the planned refurbishment dates, necessitating potential idling of the
units. This risk has been marginally increased by the deferral of start dates of the refurbishment
outages for the Units 3, 1 and 4 in response to COVID-19 conditions.
Finally, over the last several years, Darlington has experienced variable forced loss rate (“FLR”) levels
that may suggest less predictable performance in the pre-refurbishment period, due to equipment
issues. The most recent completed year, 2019, resulted in a 4.8% FLR, notably higher than the 2018
year’s 1.1% FLR and OPG’s EB-2016-0152 target of 1%. Similarly, the FLR of 4.9% in 2015 was higher
than in 2016 (2.3%) and 2017 (1.7%), as well as OPG’s target.60
For Pickering, OPG has announced its intention to optimize the shutdown sequence of four of the
station’s units through to the end of 2025, extending their life for one year beyond 2024. OPG has
forecast its nuclear generation for the upcoming rate application to reflect that assumption. The
extension beyond December 31, 2024, however, requires approval from the CNSC through a public
hearing process. In addition to inherent risks associated with the regulatory approval process, for
the extension to be achieved, OPG must undertake technical analysis and inspections to validate
continued fitness-for-service of the plant’s components. Notably, this extension is the latest in the
series implemented by OPG over the last number of years. Given the aging of the plant, the technical
and regulatory risks associated with achieving an extension would be expected to increase with each
successive instance, as would the ongoing operating cost and generation revenue risks for a station
operating closer to its ultimate shutdown date. In fact, no other CANDU plant has operated as long as
the planned life of Pickering, which remains the longest operating plant among CANDU peers. On this
basis, Concentric believes that the currently planned extended operating period carries increased
risk over that of the planned extension at the time of EB-2016-0152.
60 2016 – 2019 Data: EB-2020-0290, Ex. E2-1-2, Table 1; 2015 Data: EB-2016-0152, Ex. E2-1-2 Table 1.
Filed: 2020-12-31 EB-2020-0290 Exhibit C1-1-1 Attachment 1
Page 47 of 131

45
Additionally, there is recent evidence of increased equipment aging issues that are necessitating
more frequent unbudgeted planned outages, with three such outages occurring to date in 2020
related to primary heat transport system and other leaks.61
Finally, OPG has reduced the FLR target for the upcoming rate period to 3.5%, which is lower than
the OPG’s EB-2016-0152 target.62 While Pickering had a FLR performance of 1.6% in 2019, this is
notably better than OPG’s EB-2016-0152 target of 5% and several prior years of close-to-target
performance.
On balance, the older plant, recently increased incidence of aging issues and the more aggressive FLR
target relative to EB-2016-0152 lead Concentric to conclude that Pickering is at higher risk for
increased expenditures and generation revenue shortfall than at the time of EB-2016-0152.
The above risks were noted by DBRS in their 2020 credit rating report on OPG, stating “[n]uclear
generation faces higher operating risks than other types of power generation because of its complex
technology (approximately 56% of OPG’s production in 2019). Financial implications of forced
outages, especially with older units (e.g., the Pickering Nuclear GS), are greater given the high fixed-
cost nature of these plants and since lost revenues resulting from outages are not recoverable
through rates.”63
In reaching its conclusion on the increased aging risks for the Darlington and Pickering stations,
Concentric has considered that, under the EB-2016-0152 Custom IR framework that Concentric
understands the company will propose to continue in this rate term, OPG may have the ability to seek
regulatory relief from the OEB in the case of a radical change to its nuclear business. For example, the
OEB noted in its EB-2016-0152 Decision and Order that “[s]hould the outcome of the technical
assessments or system planning decisions significantly impact operation of Pickering in 2021 [the
year of planned extension], OPG shall return to the OEB to seek direction.”64 Such a potential
regulatory outcome, however, while putting an upper bound on the potential risk faced by OPG does
not negate it, nor does it, by itself, mitigate the incremental risks faced by OPG related to its aging
units.
61 EB-2020-0290, Ex. E2-1-2, Table 1; Ex. E2-1-1. 62 EB-2020-0290, Ex. E2-1-2, Table 1 63 DBRS, “Ontario Power Generation Inc.,” April 16, 2020, at 3. 64 EB-2016-0152 Decision and Order, December 28, 2017, at 61. Clarification added.
Filed: 2020-12-31 EB-2020-0290 Exhibit C1-1-1 Attachment 1
Page 48 of 131

46
c. Pickering Retirement
For the first time in OPG’s history, the rate application will encompass a period of significant
reduction in OPG’s regulated operations, due to the wind down and shutdown of the Pickering
station. The station represents six out of ten of the company’s operating nuclear reactors and up to
approximately 35% of the company’s operating costs, and is served by over 3,000 employees out of
the Company’s 9,000-plus total workforce. With plans to pursue an extension of Pickering operations
for four out of the six operating units through 2025, the planned station shutdown date is at the end
of 2025. This introduces a number of unique additional risks and significant challenges that must be
taken into account in assessing the risk profile of the regulated business relative to EB-2016-0152.
Among others, these risks and challenges include organizational and potential operational
disruption, increased forecasting risk and reduced nuclear fleet diversification.
Organizationally, the end of Pickering commercial operations will require OPG to downsize 3,000-
plus employees, which will be a complex undertaking. The inevitable disruption that will be caused
by the large scale reorganization carries risks to the operational effectiveness and efficiency of the
Company’s nuclear business through the upcoming rate term.65
In addition to the risk of increased operating costs or decreased output associated with the
organizational disruption, the upcoming Pickering shutdown creates considerable new forecasting
risk for OPG as its nuclear cost-based rates are set on a forward-looking basis. Namely, for at least
the years 2025 and 2026, OPG must forecast its operating profile as a very different organization,
without the benefit of historical experience. In addition, planning for the immediately preceding
years involves making assumptions about organizational changes and strategies to prepare for the
shutdown and the post-shutdown operations. For example, OPG’s business plan lays out targets of
increased cost efficiencies in such areas as technology solutions, organization redesign, work site
relocation and others to mitigate, to a large extent, the need to reallocate corporate and operations
support costs currently assigned to Pickering to the remaining operations after the Pickering
shutdown.
In Concentric’s opinion, the business transformation and workforce redeployment brought about by
the retirement of Pickering increase the incremental risks that either one of the two initiatives –
transformation and redeployment – would carry on its own. Under the current regulatory
65 Concentric understands that based on current collective agreement provisions, the hydroelectric business
is unlikely to be significantly affected by the downsizing and redeployment exercise.
Filed: 2020-12-31 EB-2020-0290 Exhibit C1-1-1 Attachment 1
Page 49 of 131
47
framework, OPG bears the financial risks associated with forecasting the outcome of its
transformation efforts.66
In addition, the retirement of Pickering will reduce OPG’s diversification among its nuclear fleet,
meaning the company’s ability to recover nuclear costs will be fully tied to the Darlington output.
While Darlington units have historically been more reliable than the Pickering plant, due to
Pickering’s early age and design, the countervailing risk is that of asset concentration. For example,
occurrence of an unanticipated issue at Darlington, including as the last of the units return from
refurbishment over 2025 and 2026, could cause large revenue shortfalls for OPG in light of reduced
or eliminated Pickering generation. As noted by Moody’s, “[OPG’s nuclear] segment also benefits from
diversification across 2 nuclear generating stations, with 6 and 4 operating reactors respectively, that
enable the company to maintain high levels of generation and cash flow while undertaking the
nuclear refurbishment. The shutdown of the Pickering nuclear generating station in 2024 will reduce
diversity and, with fewer operating nuclear units, heighten the impact of any unplanned outages.”67
This risk is related to the generation mix risk, which is discussed in further detail in a subsequent
section of the report.
Concentric also notes that OPG anticipates that it will incur a significant amount of severance and
workforce transition costs, currently estimated in the order of $1 billion, related to the Pickering
closure. A recent amendment to O. Reg. 53/05 has established a deferral account to record and
subsequently recover such costs, subject to the OEB’s approval through a prudence review. As
Concentric assumes that this mechanism will allow for the substantial full recovery of those costs by
OPG, this did not have a material impact on our assessment of OPG’s risk profile.
3. Climate Risks
Since EB-2016-0152, the intensifying risk of climate change has been an important source of
incremental business risk for the regulated generating industry generally, including OPG’s generating
assets. Specifically, increased climate risks have been observed through direct impacts to OPG’s
assets, more pronounced environmental trends, recognition of impacts on the overall electricity
system, and recognition of impacts on financial markets and broader economy. The ultimate
66 Concentric understands that OPG previously undertook a Business Transformation initiative over the
2011-2015 period, which was a subject of OPG’s payment amounts proceeding in EB-2013-0321. However, unlike the upcoming rate application, that initiative was well advanced at the time OPG sought to set rates reflecting its outcome and did not involve a significant redeployment or downsizing, instead relying on attrition-based workforce reductions. It also predominantly focused on support functions rather than core generating station operations.
67 Moody’s Investors Service, “Ontario Power Generation Inc.,” December 21, 2020, at 5. Clarification added.
Filed: 2020-12-31 EB-2020-0290 Exhibit C1-1-1 Attachment 1
Page 50 of 131

48
response to these risks, whether in the form of after-the-fact action or proactively increased
resilience, can entail increased expenditures, reduced flexibility and/or reduced output for OPG’s
regulated businesses in the future.
Some of the developments are summarized below:
OPG’s Calabogie Hydroelectric Generating Station, a five MW regulated facility that OPG had
been planning to rebuild, was struck and largely destroyed by a tornado in September 2018.68
OPG has documented risks of maintaining cooling for various plant systems due to warmer
Lake Ontario temperatures.69 For the nuclear stations, primary, secondary and auxiliary
systems use lake water to maintain cooling. As lake water temperatures increase in the
summer months, the ability to maintain cooling of system components becomes increasingly
difficult and may result in lower output through unit derates. Additionally, warmer lake
temperatures encourage the growth of aquatic life, thus increasing the risk of algae bloom
events as was experienced at Pickering in 2018, forcing four units offline over a span of a
number of days.70
The Ottawa River, which hosts a substantial portion of OPG’s regulated hydroelectric fleet
(four facilities with a total capacity of 912 MW), has seen record floods in recent years.71 A
recent report72 released by Ottawa predicts more intense precipitation, increased risk of
tornadoes and wildfires in the Ottawa area due to climate change.
Other general environmental trends include increasing air temperature in Canada, which, per
Canada’s Changing Climate Report has been at approximately twice the global average rate,
with extreme warm temperatures becoming hotter.73 This warming can be expected to
contribute to an increased risk of extreme fire weather,74 which would put utilities such as
OPG at a range of risks including disrupted station access/operations, interrupted
telecommunications and bottlenecked transmission. These risks have the potential to impact
68 OPG.com, “Century-old Calabogie Generating Station set to be rebuilt,” July 3, 2019. 69 OPG, Quarterly Risk Report – Q2 FY2020, August 11, 2020. 70 Gilligan, Keith, “Is Algae the New Nuisance Neighbor for the Pickering Nuclear Station?”
durhamregion.com, August 8, 2018. 71 The National Capital Commission’s Climate Change Adaptation Initiative - National Capital Commission
(ncc-ccn.gc.ca). 72 Ibid. 73 Canada's Changing Climate Report, 2019. 74 Ibid.
Filed: 2020-12-31 EB-2020-0290 Exhibit C1-1-1 Attachment 1
Page 51 of 131

49
station output. Scientists have also expressed high confidence that streamflow regimes will
shift and that daily extreme precipitation will increase in Canada.75
Consideration of extreme weather demand has been integrated into the IESO’s Reliability
Outlook76 and capacity assessment criteria. Going forward, OPG may be impacted by
associated changes in the IESO’s outage approval process where extreme weather may
potentially restrict OPG’s ability to take outages at otherwise optimal times.
Risks influenced by climate change, such as severe weather events, or resulting directly from climate
change, such as those due to higher lake temperatures and changing precipitation patterns are,
therefore, increasing for OPG. Furthermore, investors, central banks and financial regulators are
increasingly recognizing the risk of climate change to the economy, the stability of the financial
system, and specific industries and investments. Examples include:
The Bank of Canada has indicated that it views climate change as an emerging risk for the Canadian
economy and financial system. Specifically, the Bank of Canada has observed that:
Climate change continues to pose risks to both the economy and the financial system.
These include physical risks from disruptive weather and events and transition risks
from adapting to a lower carbon global economy.77
The Bank of Canada indicates that it is incorporating climate change risk into its analysis of the
Canadian economy and financial system, that climate change creates important physical risks in
Canada and globally, and that the move to a low carbon economy involves complex structural
adjustments, creating new opportunities as well as transition risk.78
In September 2020, the Commodity Futures Trading Commission (“CFTC”), the financial regulator
that oversees the trading of futures and options in the U.S., published a report concluding that climate
change is a risk to the U.S. financial system.79 In particular, the CFTC noted the economic risk of
changes that are required to mitigate climate change and the disruptive effect those changes might
75 Cohen, S., Bush, E., Zhang, X., Gillett, N., Bonsal, B., Derksen, C., Flato, G., Greenan, B., Watson, E (2019):
Synthesis of Findings for Canada’s Regions; Chapter 8 in Canada’s Changing Climate Report, (ed.) E. Bush and D.S. Lemmen; Government of Canada, Ottawa, Ontario, at 424–443.
76 IESO Reliability Outlook, From April 2019 to September 2020, at 1, 20. 77 Bank of Canada Financial System Review-2019, May 2019, at 28. 78 Ibid., at 28-29. 79 U.S. Commodity Futures Trading Commission, “Managing Climate Risk in the U.S. Financial System,” September
9, 2020.
Filed: 2020-12-31 EB-2020-0290 Exhibit C1-1-1 Attachment 1
Page 52 of 131
50
have on the stability of the financial system itself. The key conclusions of the CFTC report are as
follows:80
Climate change poses a major risk to the stability of the U.S. financial system and to its
ability to sustain the American economy. Climate change is already impacting or is
anticipated to impact nearly every facet of the economy, including infrastructure,
agriculture, residential and commercial property, as well as human health and labor
productivity. Over time, if significant action is not taken to check rising global average
temperatures, climate change impacts could impair the productive capacity of the
economy and undermine its ability to generate employment, income, and opportunity.
This reality poses complex risks for the U.S. financial system. Risks include disorderly
price adjustments in various asset classes, with possible spillovers into different parts of
the financial system, as well as potential disruption of the proper functioning of financial
markets. In addition, the process of combating climate change itself—which demands a
large-scale transition to a net-zero emissions economy—will pose risks to the financial
system if markets and market participants prove unable to adapt to rapid changes in
policy, technology, and consumer preferences. Financial system stress, in turn, may
further exacerbate disruptions in economic activity, for example, by limiting the
availability of credit or reducing access to certain financial products, such as hedging
instruments and insurance.
S&P has incorporated ESG criteria into its credit rating analysis, while other investment firms and
pension funds have adopted restrictions that prohibit them from owning equity or debt in companies
seen as contributing to climate change. For example, in January 2020, investment manager BlackRock
sent a letter to its clients announcing a number of initiatives to place sustainability at the center of
its investment approach, including: making sustainability integral to portfolio management; exiting
investments that present a high sustainability-related risk, and strengthening its commitment to
sustainability and transparency in investment stewardship activities.81
McKinsey and Company published a report in April 2019 in which the consulting firm makes specific
recommendations to the utility industry with regard to managing climate change risk. While noting
that severe weather events such as hurricanes and wildfires are getting worse, McKinsey writes: “In
other ways, too, utilities are more vulnerable to extreme weather events than in the past.”82 The
report goes on to observe: “Unless utilities become more resilient to extreme weather events, they
put themselves at unnecessary risk, in both physical and financial terms. Repairing storm damage
80 Ibid., at i and ii. 81 BlackRock Letter to CEOs, “A Fundamental Reshaping of Finance,” January 20, 2020. 82 McKinsey and Company, “Why, and how, utilities should start to manage climate change risk,” April 2019,
at 3.
Filed: 2020-12-31 EB-2020-0290 Exhibit C1-1-1 Attachment 1
Page 53 of 131

51
and upgrading infrastructure after the fact is expensive and traumatic.”83 McKinsey also quotes from
a 2018 report by the National Climate Assessment which stated that “utilities could see negative
impacts from increased temperatures and heat waves, as well as sea level rises even in the absence
of storms. This will increase the financial cost to utilities of climate change and increase the benefits
of being prepared.”84
In summary, the risks associated with changing climate parameters and severe weather events have
increased for OPG since EB-2016-0152, at the asset, industry, electricity system and macroeconomic
levels. Investors are keenly focused on how such risks are being managed by organizations. While
we expect that the risks will continue to manifest over time, current trends point to a greater and
potentially more urgent likelihood of incremental expenditures and operational impacts over the
upcoming rate setting period. Unless they also happen to increase the output, refurbish or add
operating capacity to a regulated facility, such incremental expenditures would not be subject to
existing protections under O. Reg. 53/05 or other deferral or variance accounts currently in place for
OPG.
4. Generation Asset Mix
The OEB has consistently recognized that nuclear generation assets are a higher risk than
hydroelectric generation assets. For example, in support of its findings in EB-2013-0321 that OPG’s
business risk had changed between EB-2010-0008 and EB-2013-0321, the OEB cited the “increase
[in the] proportionate share of rate base related to hydroelectric facilities from about half to
approximately two-thirds now [i.e., as of EB-2013-0321],” while noting that the “relative business
risk of hydroelectric generation versus nuclear has been accepted by the Board as being lower in
previous proceedings.”85 The OEB similarly stated in EB-2016-0152 that “[t]he OEB accepts the
opinions of both experts that, in general, there are more business risks associated with nuclear
generation than with hydroelectric.”86
The OEB further clarified its view in EB-2016-0152 that it was not only rate base that drove the risk
profile of OPG, but also the relative contributions of nuclear and hydroelectric generation.
Specifically, the OEB found, “while the nuclear rate base will increase substantially over the five-year
term, the MWh generated by nuclear will not increase, and in fact will decrease at times as units are
taken out of service at Darlington. The relative contributions of revenue from hydroelectric and
83 Ibid. 84 Ibid., at 4. 85 EB-2013-0321, Decision with Reasons, November 20, 2014, at 113. Clarification added. 86 EB-2016-0152, Decision and Order, December 28, 2017, at 102.
Filed: 2020-12-31 EB-2020-0290 Exhibit C1-1-1 Attachment 1
Page 54 of 131

52
nuclear will not change in favour of nuclear, so it is not axiomatic that the equity thickness should be
increased on this basis.”87
With the expansion of OPG’s regulated nuclear investment over the upcoming rate term due to the
$12.8 billion DRP, the nuclear generation business is projected to comprise a comparatively larger
portion of OPG’s overall regulated rate base. In Concentric’s opinion, this increase in nuclear rate
base alone, with its attendant risk, continues to be supportive of a need for an increased equity
thickness, notwithstanding that there is no relative increase in the nuclear versus hydroelectric
MWh. In reaching this conclusion, Concentric carefully considered the OEB’s prior findings that
recognized both rate base and generation output as relevant to assessing the impact of relative
proportions of nuclear and hydroelectric business on OPG’s overall risk profile. In recognition of
these findings, we also discuss below how the decline in nuclear generation will create additional
risk, more than offsetting any reduction in risk that can be attributed to the relative decline in overall
nuclear revenue after the Pickering shutdown.88
First, while MWh generated is one indicator of the relative proportions of OPG’s business comprised
of nuclear versus hydroelectric generation, it is ultimately the investment in plant, not the output
itself, that drives the need for capital. For example, if a utility were to invest in low capacity factor
peaking facilities to meet periods of high demand, measuring the operating risk related to those
facilities based on their output would significantly understate their associated risk. Based on its
experience, Concentric does not believe that investors and rating agencies will reduce their risk view
of OPG when it is seeking investment to support a nuclear capital program because of a reduction in
the nuclear generation output. In fact, as noted earlier, at least one rating agency, Moody’s, has stated
that OPG’s risk will in fact increase due to lower diversification of its nuclear portfolio after Pickering
shutdown.89
Second, it is the precise sources of OPG’s increased risk (i.e., the DRP and the retirement of Pickering)
that are leading to decreased levels of nuclear generation over the upcoming rate period. In other
words, nuclear risk is rising while nuclear generation is decreasing (and rate base is increasing).
87 Ibid. 88 In its Decision and Order in EB-2016-0152, at 101, the Board stated that “[t]he EB-2013-0321 decision
deals with more than one aspect of the impact of the increase in the hydroelectric generation portfolio. The two factors were the increase in annual MWh generated by hydroelectric with the addition of 48 previously unregulated facilities to the regulated portfolio and the completion of the Niagara Tunnel, and the increase in hydroelectric rate base by the addition of these assets to the regulated portfolio.”
89 Moody’s Investors Service, “Ontario Power Generation Inc.,” December 21, 2020, at 5.
Filed: 2020-12-31 EB-2020-0290 Exhibit C1-1-1 Attachment 1
Page 55 of 131

53
Third, the decline in nuclear generation and therefore the ratio of nuclear to hydroelectric generation
creates additional risk from a cost recovery perspective over the upcoming period. This is because
each unit of nuclear generation output will become more financially valuable to OPG as the nuclear
generation that recovers the nuclear revenue requirement (including the increased nuclear rate
base) is reduced, while continuing to be more financially valuable than each unit of hydroelectric
generation. The greater relative cost recovery associated with each unit of nuclear output will put
OPG at greater risk related to its nuclear generation operations, both relative to EB-2016-0152 and
to its hydroelectric generation.
The increasing value of each unit of nuclear output (on an absolute basis and in relation to each unit
of hydroelectric output), is demonstrated in Figure 9 below.
Figure 9: Value of Nuclear and Hydroelectric Output
Value of TWh of Output ($millions)
Nuclear Hydroelectric
EB-2016-0152 Rate Term $82 $43
2022-2026 Rate Term $108 $44
As of 2026 $121 $44
As shown in the Figure 9 above, each nuclear TWh had a value of approximately $80 million during
the EB-2016-0152 rate term, compared to approximately $43 million for a hydroelectric TWh.90 Over
2022 to 2026, based on OPG’s draft rate filing at the time of writing, the value of a nuclear TWh has
increased to approximately $108 million, compared to approximately $44 million for a hydroelectric
TWh.91 This represents an approximately 32% increase in the value of each unit of nuclear output
and an approximately 64% increase in the amount by which the nuclear unit of output is more
valuable than the hydroelectric unit of output. By 2026, the financial value of a nuclear TWh increases
further, to approximately $121 million, or approximately 48% higher than in EB-2016-0152 and an
approximately 97% increase in the amount by which the nuclear MWh is more valuable than the
hydroelectric MWh. To put those figures into further perspective, foregone revenues from a
hypothetical seven-day outage at one of OPG’s Darlington nuclear reactors would have been
90 For nuclear, based on EB-2016-0152 approved smoothed base payment amounts, arithmetically averaged
over 2017 to 2021. For hydroelectric, based on approved base payment amounts pursuant to the IRM formula in EB-2016-0152 and subsequent annual proceedings, arithmetically averaged over 2017 to 2021.
91 For nuclear, based on draft proposed smoothed base payment amounts, arithmetically averaged over 2022 to 2026. For hydroelectric, based on the approved 2021 base payment amount that will be held constant over the period pursuant to O. Reg. 53/05.
Filed: 2020-12-31 EB-2020-0290 Exhibit C1-1-1 Attachment 1
Page 56 of 131

54
approximately $12 million during the EB-2016-0152 period, rising to $15 million in the upcoming
rate setting period, and ending at approximately $17 million in 2026. This risk will be even more
pronounced for OPG when Pickering retires, as an outage at one of OPG’s remaining reactors would
result in a loss of a quarter of OPG’s nuclear generating capacity.
To further illustrate our analysis with respect to relative rate base and per unit-of-output cost
recovery value, the following information is provided below:
Figure 10 provides the relative nuclear and hydroelectric rate base from the start of OPG rate
regulation by the OEB through to the upcoming rate period, as well as OPG’s common equity
ratio, as approved for the historical period and the minimum proposed ratio in this report for
the upcoming rate term.
Figure 11 shows a combination of the actual and forecast generation for the prescribed
nuclear and hydroelectric facilities over the EB-2016-0152 rate term and the 2022-2026
forecast period
Figure 12 is a graphical representation of the changes in generation and rate base mix over
time. Figure 12 shows that nuclear generation decreases over the upcoming rate period
while hydroelectric generation stays relatively flat. Meanwhile, nuclear rate base increases
over the rate period, which, when combined with decreasing output, increases the value to
OPG of each unit output, for which it is at risk.
Figure 13 demonstrates this outcome, providing the unit prices for nuclear and hydroelectric
generation output and the relationship between the two. Figure 13 shows that the unit price
of each MWh of nuclear output increases significantly over the upcoming rate period while
that for hydroelectric output is fixed.
As can be seen from Figure 10, the portion of OPG’s total rate base that is nuclear was at its lowest
(i.e., 23%) during the period for which rates in EB-2013-0321 were set, which was also the period
for which the OEB lowered OPG’s common equity ratio to 45%. However, starting in 2017, the
nuclear portion of rate base began to increase significantly. By 2026, i.e., the end of the proposed
five-year rate period, the nuclear portion of rate base is expected to be at an all-time high.
Filed: 2020-12-31 EB-2020-0290 Exhibit C1-1-1 Attachment 1
Page 57 of 131

55
Figure 10: OPG’s Prescribed Facilities Rate Base ($ billions)
EB-2007-0905
Payment Order
EB-2010-0008
Payment Order
EB-2013-0321
Payment Order
EB-2016-0152 Rate Period92 EB-2020-0290 Rate Period
2008 2009 2011 2012 2014 2015 2017 2018 2019 2020 2021 2022 2023 2024 2025 2026
Hydro $3.9 $3.8 $3.8 $3.7 $7.5 $7.5 $7.5 $7.5 $7.5 $7.6 $7.7 $7.8 $8.0 $8.2 $8.5 $8.9
Nuclear $2.5 $2.3 $2.4 $2.3 $2.3 $2.3 $2.9 $3.0 $3.0 $7.1 $7.5 $8.8 $8.8 $11.3 $12.5 $13.4
Nuclear Portion of Rate Base
39% 38% 39% 38% 23% 23% 28% 29% 29% 48% 49% 53% 52% 58% 60% 60%
Rate Term Ratio Avg
38% 23% 38% 57%
Common Equity Ratio
47% 47% 47% 47% 45% 45% 45% 45% 45% 45% 45% 50%93 50% 50% 50% 50%
92 Hydroelectric values as stated in EB-2016-0152, Ex. L, Tab 3.1, Schedule 20 VECC-005, Table 5; nuclear values as stated in EB-2016-0152 Payment
Amounts Order, Appendix A, Tables 1-5. 93 Proposed minimum equity ratio for 2022-2026 rate-setting period.
Filed: 2020-12-31 EB-2020-0290 Exhibit C1-1-1 Attachment 1
Page 58 of 131

56
Figure 11: OPG’s Prescribed Facilities Generation (TWh)
EB-2016-0152 Rate Period EB-2020-0297 Rate Period
2017 2018 2019 2020 2021 2022 2023 2024 2025 2026
Hydro 94
30.7 29.9 30.5 33.0 33.0 33.0 33.0 33.0 33.0 33.0
Nuclear 40.7 40.9 43.5 42.7 38.3 33.2 30.8 33.3 30.2 21.5
Figure 12: OPG’s Generation and Rate Base Over Time, by Fuel Source
94 Regulated Hydroelectric production for 2020 - 2026 is the 2014 and 2015 average OEB approved hydroelectric production per EB-2013-0321
Decision and Order, at 9, and EB-2016-0152 PAO, App. I, Table 2, line 3.
Filed: 2020-12-31 EB-2020-0290 Exhibit C1-1-1 Attachment 1
Page 59 of 131
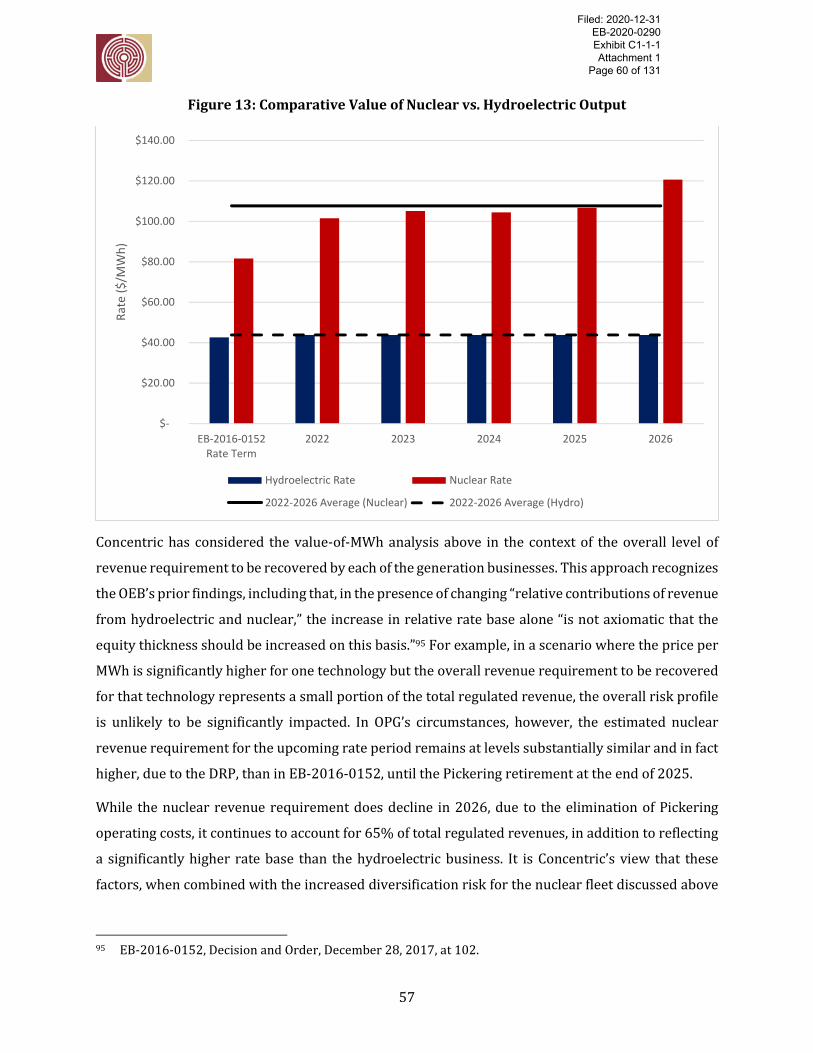
57
Figure 13: Comparative Value of Nuclear vs. Hydroelectric Output
Concentric has considered the value-of-MWh analysis above in the context of the overall level of
revenue requirement to be recovered by each of the generation businesses. This approach recognizes
the OEB’s prior findings, including that, in the presence of changing “relative contributions of revenue
from hydroelectric and nuclear,” the increase in relative rate base alone “is not axiomatic that the
equity thickness should be increased on this basis.”95 For example, in a scenario where the price per
MWh is significantly higher for one technology but the overall revenue requirement to be recovered
for that technology represents a small portion of the total regulated revenue, the overall risk profile
is unlikely to be significantly impacted. In OPG’s circumstances, however, the estimated nuclear
revenue requirement for the upcoming rate period remains at levels substantially similar and in fact
higher, due to the DRP, than in EB-2016-0152, until the Pickering retirement at the end of 2025.
While the nuclear revenue requirement does decline in 2026, due to the elimination of Pickering
operating costs, it continues to account for 65% of total regulated revenues, in addition to reflecting
a significantly higher rate base than the hydroelectric business. It is Concentric’s view that these
factors, when combined with the increased diversification risk for the nuclear fleet discussed above
95 EB-2016-0152, Decision and Order, December 28, 2017, at 102.
$-
$20.00
$40.00
$60.00
$80.00
$100.00
$120.00
$140.00
EB-2016-0152Rate Term
2022 2023 2024 2025 2026
Rat
e ($
/MW
h)
Hydroelectric Rate Nuclear Rate
2022-2026 Average (Nuclear) 2022-2026 Average (Hydro)
Filed: 2020-12-31 EB-2020-0290 Exhibit C1-1-1 Attachment 1
Page 60 of 131

58
and the higher relative value of each nuclear unit of output, result in additional risk that is at least
equal to, if not greater than, the notional reduction in risk that can be attributed to the relatively
lower overall nuclear revenue requirement by 2026.
In conclusion, by the end of the upcoming rate period, nuclear rate base is projected to be 60% of
OPG’s total prescribed generation rate base, as compared to 49% at the end of the EB-2016-0152 rate
period (and less than 40% during the period in which OPG’s deemed equity ratio was 47%). As it is
the level of investment that drives the need for capital, given that nuclear business is higher risk, this
factor supports the need for a higher equity ratio for OPG. In the context of the OEB’s prior findings
on the relative output and revenue contributions of each regulated business, Concentric also finds
that the increased relative cost recovery risk for each unit of nuclear output versus hydroelectric, $39
per MWh average difference in EB-2016-0152 to $77 per MWh difference by the end of upcoming
rate period, is a source of additional risk relative to EB-2016-0152. This, coupled with the increase
in nuclear-specific business risks discussed earlier, including lower diversification of the nuclear
fleet, indicates a substantial increase in OPG’s overall business risk for its regulated operations.
Changes in Financial Risk
Financial risk is an important component of a company’s overall risk profile. Financial risk, which is
focused on solvency and liquidity, is often measured through credit metrics, and a utility’s credit
rating provides a widely-accepted opinion from a third party credit rating agency of the utility’s
overall creditworthiness. Concentric’s consideration of OPG’s financial risk therefore focused on the
review of the company’s credit rating.
In adopting this approach, Concentric was mindful of the OEB’s findings in EB-2016-0152 that “credit
risk is not an independent factor in assessing whether business risk has changed – it is the credit
rating agencies’ assessment of those risks as to how they may affect solvency and liquidity.”96
Concentric agrees that financial risk and business risk are often interrelated. However, Concentric is
also guided by the OEB’s previous findings distinguishing between financial risk and business risk, in
the context of their relationship with capital structure, and specifically that “capital structure should
be reviewed only when there is a significant change in financial, business or corporate
fundamentals.”97 Additionally, Concentric is guided by the fact that, as discussed in the “Background
on Prior OEB Decisions” (Section 3 of this report), maintenance of financial integrity is a key
component of the fair return standard.
96 EB-2016-0152, Decision and Order, December 28, 2017, at 107. 97 EB-2009-0084, Report of the Board, December 11, 2009, at 49. Emphasis added.
Filed: 2020-12-31 EB-2020-0290 Exhibit C1-1-1 Attachment 1
Page 61 of 131

59
OPG’s issuer rating from S&P remains at BBB+ and its stand-alone credit profile absent support from
the Province is a bb+ rating (a non-investment grade level), both of which are the same as at the time
of EB-2016-0152. Since 2019, OPG also has a Moody’s issuer rating of A3, with a stand-alone profile
of baa3 (the lowest investment grade rating level) absent support from the Province. With the
majority of peer companies being assessed at the a- and bbb+ level on a stand-alone basis (as
discussed in Section 8), OPG’s stand-alone credit profile under both the S&P and Moody’s frameworks
suggests that its stand-alone business and financial risks are higher in comparison to peers.
Both S&P and Moody’s expect OPG to maintain credit metrics at a certain level in order to maintain
its current credit rating. For S&P, the Funds from Operations (“FFO”)/Debt ratio is the key metric
referred to in S&P’s reports on OPG. According to S&P’s most recent credit report on OPG, S&P has
indicated a downside threshold for the current rating of 13%.98 Moody’s has indicated that its
financial metrics assessment could lead to a downgrade if a decline of Cash From Operations pre-
Working Capital (CFO)/ Debt ratio to below the 12% threshold on a sustained basis.99
These core ratios are expected to be under pressure during the earlier years of the upcoming rate
period and OPG’s business plan forecasts one or both of them will temporarily decline below the
corresponding thresholds. Our understanding is that lower nuclear generation during the DRP,
which is expected to impact the rate smoothing determinations and therefore OPG’s future operating
cash flows, coupled with a heighted capital investment program, including the DRP, contribute to this
pressure.
While OPG’s business plan indicates that it will continue to focus on communicating to the rating
agencies the short-term nature of the potential decline in the metrics and that this decline is not
reflective of OPG’s ongoing financial strength, there remains an inherent risk of a credit rating action,
which would result in a downgrade or a change in credit outlook.100 In these circumstances and
pending the outcome of the upcoming rate application proceeding, Concentric considers the pressure
on the credit metrics to signify additional financial risk since EB-2016-0152. An increase in OPG’s
equity ratio, therefore, and particularly during this period, would be consistent with OPG’s increased
financial risk and the financial integrity component of the fair return standard.
98 In its July 2020 report, S&P stated “[w]e could take a negative rating action on OPG over the next 12-18
months if the company's financial measures weaken, reflecting FFO to debt consistently below 13%.” S&P Global Ratings, “Research Update: Ontario Power Generation Inc.,” July 17, 2020, at 3.
99 Moody’s Investors Service, “Ontario Power Generation Inc.,” December 21, 2020, at 3. 100 The credit rating action risk discussed is in addition to the impact of any rating change for the Province
that would be expected to affect OPG’s rating in a corresponding manner, as was the case in 2015.
Filed: 2020-12-31 EB-2020-0290 Exhibit C1-1-1 Attachment 1
Page 62 of 131

60
SECTION 8:
PROXY GROUP COMPARATIVE ANALYSIS
1. Overview
In addition to assessing changes to OPG’s business and financial risk profile since EB-2016-0152,
Concentric also analyzed the equity ratios of other North American utilities screened for risk
characteristics similar to OPG’s. To identify companies with risk characteristics similar to OPG,
Concentric selected publicly-traded investor-owned utility companies that passed a series of
screening criteria based on OPG’s operational profile. Concentric reviewed three separate measures
of the equity ratios of those similarly-situated regulated utilities: (1) the historical equity ratios
maintained by comparable publicly-traded holding companies; (2) the historical equity ratios
maintained by the operating subsidiaries of those holding companies; and (3) the equity ratios
authorized by the regulators of those operating subsidiaries. Those measures provide context for
where, within a reasonable range, OPG’s equity ratio should be set by the OEB, with the regulated
operating company equity ratios being most relevant for purposes of assessing OPG’s regulated
equity thickness. Concentric also analyzed two different proxy groups. The first proxy group (the
“Concentric Proxy Group”) was a broader group of companies that met the screening criteria
described herein. The second proxy group (the “Moody’s Peer Group”) included the companies
identified as OPG’s peers by Moody’s.101 The results for those two proxy groups are provided in the
Figure 14 and Figure 15 below.
Figure 14: Summary of Comparative Analysis Results (Concentric Proxy Group)
Analytical Approach Mean Equity Ratio
Median Equity Ratio
Holding Company Equity Ratios: 5-Year Avg. 45.7% 47.4% Operating Company Equity Ratios: 5-Year Avg.
52.8% 53.0%
Operating Company Equity Ratios: Authorized
49.5% 49.6%
101 Moody’s Credit Opinion, Ontario Power Generation Inc., December 21, 2020, at 9.
Filed: 2020-12-31 EB-2020-0290 Exhibit C1-1-1 Attachment 1
Page 63 of 131

61
Figure 15: Summary of Comparative Analysis Results (Moody’s Peer Group)
Analytical Approach Mean Equity Ratio
Median Equity Ratio
Holding Company Equity Ratios: 5-Year Avg. 50.6% 49.1% Operating Company Equity Ratios: 5-Year Avg.
55.9% 53.6%
Operating Company Equity Ratios: Authorized
50.7% 50.1%
Our analysis of comparable regulated utilities with significant regulated generation assets indicates
that OPG’s current deemed equity thickness is low relative to comparable companies, despite OPG
falling towards the upper end of the spectrum of risk profiles established by the proxy companies.
Taken together, the analyses support an equity ratio of no less than 50% for OPG.
2. Use of Proxy Company Analysis for Cost of Capital Determinations
Analyses of comparable, or “proxy,” companies is a common and well-accepted approach used in the
determination of the cost of capital for regulated utilities and for benchmarking business and
financial risks. Proxy groups are used for the following main reasons in cost of capital
determinations: (1) adherence to the comparable investment standard; (2) since the cost of capital
is a market-based concept, and given that OPG is not a publicly-traded entity, it is necessary to
establish a group of companies that is both publicly-traded and comparable to OPG in certain
fundamental business and financial respects to serve as its “proxy” for purposes of the cost of capital
evaluation process; and (3) even if OPG’s regulated operations were held by a stand-alone publicly-
traded entity, it is possible that transitory events could bias its market-determined cost of capital in
one way or another over a given period of time. A significant benefit of using a proxy group is its
ability to mitigate the effects of anomalous events that may be associated with any one company.
Regulatory commissions and cost of capital analysts generally apply a set of screening criteria in
order to define a risk-appropriate group of comparable companies. For instance, the Federal Energy
Regulatory Commission (“FERC”) provides the following summary of its practice for selection of a
proxy group for electric transmission companies:
Composition of the Proxy Group: In this section we address the following issues
concerning the proper methodology for developing a proxy group and calculating the
zone of reasonableness: (1) the use of a national group of companies considered electric
utilities by Value Line; (2) the inclusion of companies with credit ratings no more than
one notch above or below the utility or utilities whose rate is at issue; (3) the inclusion
of companies that pay dividends and have neither made nor announced a dividend cut
Filed: 2020-12-31 EB-2020-0290 Exhibit C1-1-1 Attachment 1
Page 64 of 131

62
during the six-month study period; (4) the inclusion of companies with no major merger
activity during the six-month study period; and (5) companies whose DCF results pass
threshold tests of economic logic.102
While the individual screens require modification based on the subject company to which proxy
companies are being compared,103 the goal of screening companies based on their risk characteristics
increases both the comparability of the group and the confidence that the analyst (or regulator) can
have in drawing conclusions based on analyses of the proxy group. Therefore, for consistency with
the above considerations, Concentric relied on a screening process similar to that we typically apply
in cost of capital analyses to narrow the list of potential companies in order to establish a proxy group
of North American electric utility companies that are risk appropriate for comparison to OPG.
Given the unique characteristics of OPG, and, in particular, the fact that its regulated operations
consist of 100% generating assets, it is not possible to find proxy companies that are perfectly
comparable from a risk perspective. At issue, then, is how to determine an appropriate equity ratio
in the context of that range. That determination must be based on an assessment of OPG-specific
risks relative to the proxy group and informed judgment. For example, the National Energy Board
(predecessor to the Canada Energy Regulator), in discussing the cost of capital for the TransCanada
Mainline, stated, “[t]o the greatest extent possible, comparable companies have to face similar
business risk as the Mainline. If they do not, judgment needs to be applied to the cost of capital
estimates to reflect business risk differences.” 104 In other words, whereas a subject company of
average risk relative to the proxy group potentially would warrant an equity ratio equal to the
average or median result of the proxy group, a company of greater risk potentially would warrant an
equity ratio above the mean or median result, and a company of lower risk potentially would warrant
an equity ratio below the mean or median result.
In summary, the use of comparable companies to benchmark business and financial risks in the
context of cost of capital determinations is a common practice among North American regulatory
jurisdictions, and it is a method Concentric has applied to our evaluation of OPG’s capital structure.
In the discussion that follows, we present Concentric’s analysis of OPG’s level of business and
102 Opinion No. 531, Order on Initial Decision, 147 FERC ¶ 61,234 (June 19, 2014), at 44-45 103 For instance, the FERC applies a screen for the inclusion of master limited partnerships (“MLPs”) in natural
gas pipeline proxy groups that the MLPs derive at least 50% of operating income from, or have 50% of their assets devoted to, interstate operations (see, Opinion No. 510, Portland Natural Gas Transmission System, 134 FERC ¶ 61,129 (February 17, 2011), at 62.
104 National Energy Board RH-003-2011 Reasons for Decision, TransCanada PipeLines Ltd, NOVA Gas Transmission Ltd., and Foothills Pipe Lines Ltd., March 2013, at 165.
Filed: 2020-12-31 EB-2020-0290 Exhibit C1-1-1 Attachment 1
Page 65 of 131
63
financial risk relative to a proxy group of electric utilities, as well as our review of equity ratios
authorized for the proxy group to provide context for where, within a reasonable range, OPG’s equity
ratio should be set by the OEB.
3. Selection of Proxy Companies
As discussed above, Concentric studied data derived from two separate proxy groups, the Concentric
Proxy Group and the Moody’s Peer Group.
As a starting point for our screening process for the Concentric Proxy Group, Concentric reviewed
data related to both Canadian and U.S. utilities, including the following Canadian utilities: Algonquin
Power & Utilities Corp (“Algonquin”), Canadian Utilities Limited, Emera Inc. (“Emera”), Enbridge Inc.,
Fortis Inc. (“Fortis”), and TC Energy Corporation, and the 37 U.S. companies that Value Line classifies
as “Electric Utilities.”105
From that group, Concentric screened for companies that:
Own regulated generation assets that are included in rate base. As it relates to the rate
setting process, OPG’s assets represent 100% rate-regulated generation. As such, it is
important to exclude companies from the proxy group that bear no risks related to regulated
generation. The reason for this is the generation function is generally regarded by investors
as being higher risk than electric transmission or distribution. As stated by Moody’s in its
2017 ratings methodology for regulated electric and gas utilities, “[g]eneration utilities and
vertically integrated utilities generally have a higher level of business risk because they are
engaged in power generation, so we apply the Standard Grid. We view power generation as
the highest-risk component of the electric utility business, as generation plants are typically
the most expensive part of a utility’s infrastructure (representing asset concentration risk)
and are subject to the greatest risks in both construction and operation, including the risk
that incurred costs will either not be recovered in rates or recovered with material delays;”
106
105 Precedent for the consideration of U.S. proxy companies in Canadian cost of equity analyses is discussed
in Appendix C. 106 Moody’s Investors Service, Rating Methodology: Regulated Electric and Gas Utilities, at 21.
Filed: 2020-12-31 EB-2020-0290 Exhibit C1-1-1 Attachment 1
Page 66 of 131

64
Own regulated nuclear and/or hydroelectric generation.107 As noted earlier, OPG’s rate
regulated facilities consist of the Pickering and Darlington nuclear stations, as well as 54
hydroelectric generating stations. In addition, as previously noted, the OEB has recognized
that nuclear assets are higher in risk than hydroelectric assets. Therefore, it is important to
compare OPG against a group of companies that also own regulated nuclear and/or
hydroelectric generation facilities;
Have regulated revenue and regulated net income that make up greater than 60% of
total revenue and total income for the consolidated company. This screen, in
combination with the screen below regarding electricity revenue and net income, serves to
exclude companies that do not derive a significant portion of their financial results from
regulated electric operations. While rates in this proceeding are being set for OPG’s 100%
rate-regulated nuclear operations, these two screens are set at levels below 100% so that the
resulting proxy group is not unduly small. Including only those companies that derive more
than 60% of their revenues and net income from regulated operations ensures that the proxy
companies are protected by regulation rather than being subject to substantial merchant or
market-related risks. While 60% is not a “bright line” percentage for separating regulated
from non-regulated companies, in Concentric’s experience, using a screening criteria of
around 60% increases the comparability of the proxy group to the regulated utility without
unduly limiting the size of the group
Have regulated electricity revenue and net income that make up greater than 80% of
revenue and income for the consolidated company’s regulated operations. Including
only those companies that derive more than 80% of their regulated revenue and net income
from regulated electricity operations ensures that the proxy companies, like OPG, derive the
predominant share of their financial results from regulated electricity segments. Similar to
the regulated revenue and net income screen, the 80% regulated electric revenue and net
income screen is not a “bright line,” but rather is intended to balance the comparability of the
proxy group with its overall size; and
107 Excludes utilities with only a minimal (i.e., less than 5% of their total generation portfolio) amount of
nuclear or hydroelectric generation.
Filed: 2020-12-31 EB-2020-0290 Exhibit C1-1-1 Attachment 1
Page 67 of 131

65
Have an investment grade credit rating similar to that of OPG. As noted earlier, OPG has
an “A (low)” issuer and unsecured debt rating from DBRS, a “BBB+” corporate and unsecured
debt credit rating from S&P, and an “A3” senior unsecured debt rating from Moody’s. As also
noted earlier, S&P and Moody’s rate OPG as “BB+“ and “baa3” (i.e., three notches below its
corporate credit rating) on a stand-alone basis, before consideration of support by the
Province. As credit ratings are based on the utility’s business risk profile (including an
assessment of its regulatory environment) and financial risk profile, companies with similar
credit ratings have been determined by the rating agency to have similar levels of business
and financial risk. This concept has been adopted by regulatory agencies, including the FERC,
which has found that “it is reasonable to use the proxy companies’ corporate credit rating as
a good measure of investment risk, since this rating considers both financial and business
risk.”108 Concentric’s credit rating screen selects electric utility companies with investment-
grade credit ratings (an S&P credit rating of BBB- or above or a Moody’s credit rating of Baa3
and above), which reduces the need to adjust the results to account for any perceived
differences in business or financial risk compared to OPG. Further, selecting proxy companies
that, like OPG, have an investment grade credit rating ensures that the proxy companies are
generally in sound financial condition. Because credit ratings consider business and financial
risks, the ratings provide a broad measure of investment risk that is widely referenced by
investors.109
4. Proxy Group Summary
None of the publicly traded Canadian companies that Concentric reviewed met all of our screening
criteria. Emera, however, only failed the screen that each utility should have more than a minimal
amount of regulated hydroelectric and/or nuclear generation.110 Fortis only failed the screens that
each utility should have regulated electricity revenue and net income that make up greater than 80%
of the consolidated company’s regulated operations and that each utility should have more than a
minimal amount of regulated hydroelectric and/or nuclear generation.111 Algonquin failed the
screens that each utility should own more than a minimal amount of regulated nuclear and/or
108 See, for example, Potomac-Appalachian Transmission Highline, LLC, 122 FERC ¶ 61,188 (2008), at 97. 109 The only utility removed from the proxy group due to this screening criterion is PG&E Corporation, which
has a sub-investment grade credit rating due to its recent bankruptcy. 110 Specifically, Emera currently owns no regulated hydroelectric or nuclear generation. 111 Fortis has 76% regulated electricity revenue and regulated net income, while only owning a minimal
amount of regulated hydroelectric generation (and no nuclear generation).
Filed: 2020-12-31 EB-2020-0290 Exhibit C1-1-1 Attachment 1
Page 68 of 131

66
hydroelectric generation and that each utility should derive greater than 80% of consolidated
regulated revenue from regulated electricity operations.112
In order to broaden the proxy group to include at least a minimal number of Canadian utilities,
Concentric included Emera, Fortis, and Algonquin in the proxy group, as they otherwise meet our
screening criteria. Figure 16 presents the sixteen U.S. companies that met our screening criteria,
along with OPG and the three Canadian companies noted above. In addition to the company name,
Concentric also provides the S&P rating, as well as S&P’s business risk and financial risk rating
summary for each company. Exhibit 1 details how each proxy company meets the screening criteria
above.
112 Algonquin owns just 16 MW of hydroelectric generation according to S&P Global Market Intelligence and
has 49% regulated electricity revenue.
Filed: 2020-12-31 EB-2020-0290 Exhibit C1-1-1 Attachment 1
Page 69 of 131

67
Figure 16: Concentric Proxy Group and OPG
Company Ticker S&P Summary: Credit Rating /
Outlook
S&P Summary:
Business Risk
S&P Summary:
Financial risk OPG n/a BBB+/Stable Strong Significant ALLETE, Inc. ALE BBB/Stable Strong Significant Ameren Corporation AEE BBB+/Stable Excellent Significant American Electric Power Co., Inc. AEP A-/Stable Excellent Significant Avista Corporation AVA BBB/Stable Strong Significant Duke Energy Corporation DUK A-/Stable Excellent Significant Edison International EIX BBB/Negative Strong Significant El Paso Electric Company113 EE Not Rated Not Rated Not Rated Entergy Corporation ETR BBB+/Stable Strong Significant FirstEnergy Corporation FE BBB/Negative Excellent Aggressive Evergy, Inc. EVRG A-/Stable Excellent Significant IDACORP, Inc. IDA BBB/Stable Strong Significant NextEra Energy, Inc. NEE A-/Stable Excellent Intermediate Pinnacle West Capital Corporation
PNW A-/Stable Excellent Significant
PNM Resources, Inc. PNM BBB/Stable Strong Significant Portland General Electric Company
POR BBB+/Negative Excellent Significant
Southern Company SO A-/Negative Excellent Significant Xcel Energy, Inc. XEL A-/Stable Excellent Significant Algonquin Power & Utilities Corp AQN BBB/Stable Strong Significant Emera, Inc. EMA BBB/Stable Excellent Aggressive Fortis Inc. FTS A-/Negative Excellent Significant
As described above, Concentric also considered the Moody’s Peer Group, which is a proxy group
composed of companies identified by Moody’s as OPG’s peers.114 Figure 17 presents those three
companies along with OPG. Again, Concentric also provides the S&P rating, as well as S&P’s business
risk and financial risk rating summary for each Moody’s peer.
113 S&P withdrew its ratings on El Paso Electric Co. (“El Paso”) on September 18, 2020, due to a lack of
sufficient information. Previously, El Paso was rated BBB with a negative outlook, with “Strong” business risk and “Significant” financial risk.
114 Moody’s Credit Opinion, Ontario Power Generation Inc., December 21, 2020, at 9.
Filed: 2020-12-31 EB-2020-0290 Exhibit C1-1-1 Attachment 1
Page 70 of 131

68
Figure 17: Moody’s Proxy Group and OPG
Company Ticker S&P Summary: Credit Rating /
Outlook
S&P Summary:
Business Risk
S&P Summary:
Financial risk OPG n/a BBB+/Stable Strong Significant Public Service Enterprise Group, Inc
PEG BBB+/Stable Strong Significant
NextEra Energy, Inc. NEE A-/Stable Excellent Intermediate Exelon Corporation EXC BBB+/Negative Strong Significant
5. Proxy Group Business Risk Analysis
In order to further evaluate the comparability of the proxy group companies, Concentric examined
the business risks of each operating company relative to those of OPG. The purpose of this evaluation
was to determine the extent to which the companies in the proxy group have similar risk profiles to
OPG (indicating that OPG is of average risk, compared to the proxy group), or are more or less risky
than OPG (indicating a need to potentially establish a proxy-based capital structure for OPG that is
above or below the mean and median of the group).
Concentric focused on two primary business risk characteristics – operational profile, and generation
percentage and mix.
a. Operational profile
Concentric examined the operations of each of the companies in the two proxy groups. Exhibits 5.1
and 5.2 provide summaries of several relevant indicators for the operating subsidiaries of the
Concentric Proxy Group and the Moody’s Peer Group, respectively, including: (1) the province or
state in which the utility provides service; (2) the ratemaking mechanisms available to the utility
(e.g., fuel cost recovery, revenue decoupling, capital cost recovery, etc.); and (3) whether the
jurisdiction relies on historical or forecast test years for ratemaking purposes.
In reviewing the comparability of the ratemaking mechanisms available to proxy group companies,
Concentric specifically considered the OEB’s statement in EB-2016-0152 that “in OPG’s specific
circumstances, there are a number of factors that substantially mitigate that risk [i.e., higher business
risks associated with nuclear generation]. These include the various protections provided by O. Reg.
53/05 and the variance and deferral accounts that allow OPG the opportunity to recover substantially
all their unexpected or unforeseen costs.”115
115 EB-2016-0152, Decision and Order, December 28, 2017, at 102. Clarification added.
Filed: 2020-12-31 EB-2020-0290 Exhibit C1-1-1 Attachment 1
Page 71 of 131

69
Based on a review of OPG variance and deferral account activity since the beginning of the current
rate term, identified below are the main accounts applicable to OPG’s regulated nuclear business.116
Also provided is Concentric’s consideration of the risk-reducing properties, if any, of the accounts,
including in the context of the proxy group.
Nuclear Liability Deferral Account (per O. Reg. 53/05) – allows OPG to recover actual revenue
requirement impact of its nuclear decommissioning and waste management costs, which has
a risk reducing effect. However, Concentric observes that US nuclear utilities are generally
subject to recovery mechanisms that similarly facilitate recovery of nuclear decommissioning
and waste management costs and therefore OPG’s circumstances are considered comparable
to the proxy group in this regard.117
Capacity Refurbishment Variance Account (per O. Reg. 53/05) – for the nuclear business,
allows OPG to recover prudently-incurred costs incurred to increase the output, refurbish or
add operating capacity, which for the nuclear business primarily relates to the DRP and
enablement of Pickering extended operations. The account has risk reducing properties.
However, with the DRP being the larger component, Concentric reviewed and concluded in
an earlier section that similar regulatory protections for large nuclear construction projects
are in place in other jurisdictions. In addition, many of the proxy companies have in place
capital tracker mechanisms that allow for rate base treatment between rate cases.
Nuclear Development Variance Account (per O. Reg. 53/05) – allows OPG to recover prudently
incurred costs incurred for planning and preparation for the development of new nuclear
generation facilities. While this account has risk reducing properties, as noted above, other
jurisdictions provide similar regulatory protection for large nuclear construction projects.
Income and Other Taxes Variance Account – records the impact of changes in tax legislation,
reassessments of tax returns and similar changes, which reduces risk.
116 Ancillary Services Net Revenues Variance Account – Nuclear sub-account was not reviewed as it has
historically had immaterial balances. Also not listed is the Pickering Closure Costs Deferral Account required pursuant to recent amendments to O. Reg. 53/05. As noted in an earlier section, that account serves to mitigate what would otherwise be a significant additional risk relative to EB-2016-0152 (and the proxy group), being the recovery of downsizing costs in connection with the planned Pickering shutdown during the upcoming rate term. The Rate Smoothing Deferral Account is also not identified as it functions solely as a collection deferral mechanism.
117 For spent nuclear fuel long-term disposal, U.S. utilities have been subject to a pass through charge from the U.S. Department of Energy, which bears the ultimate obligation. This is in contrast to OPG, which bears the ultimate obligation for spent fuel disposal, in addition to nuclear station decommissioning.
Filed: 2020-12-31 EB-2020-0290 Exhibit C1-1-1 Attachment 1
Page 72 of 131

70
Impact Resulting from Changes in Station End-of-Life Dates (December 31, 2015) Deferral
Account and Impact Resulting from Changes to Pickering Station End-of-Life Dates (December
31, 2017) Deferral Account – established pursuant to an OEB requirement for OPG to bring
forward accounting orders related to certain accounting changes to nuclear
decommissioning and waste management liabilities and station end-of-life dates; these
accounts have or are recording net credit balances to customers. On this basis, these accounts
do not serve to reduce risk to OPG.
Bruce Lease Net Revenues Variance Account (O. Reg. 53/05) – records variances in net
earnings from OPG’s unregulated lease arrangement for the Bruce nuclear generating
stations with Bruce Power. As this account uniquely relates to unregulated operations, it is
not considered in Concentric’s risk profile analysis for OPG’s prescribed assets.
Pension and OPEB Cash Versus Cash Differential Deferral Account – established to record the
difference between accrual costs and cash amounts for pension and other post-employment
benefit (“OPEB”) pending the outcome of the OEB’s consultation on regulatory treatment of
pension and OPEB costs. The consultation has concluded, confirming the accrual accounting
method as the default method for ratemaking. The purpose of the account was to facilitate a
more in-depth review of recovery methodologies on a sector-wide basis, which had the effect
of delaying OPG’s recovery of these amounts to the ultimate benefit of customers.
Additionally, as shown in Exhibit 5.1 and summarized in Figure 18 below, the operating utilities held
by the proxy group companies have a number of different adjustment clauses and cost recovery
mechanisms that provide risk mitigation.
Filed: 2020-12-31 EB-2020-0290 Exhibit C1-1-1 Attachment 1
Page 73 of 131

71
Figure 18: Summary of Regulatory Mechanisms for Concentric’s Proxy Group
On the basis of the above, Concentric concludes that in this respect OPG is risk comparable to the
proxy companies, assuming OPG’s existing deferral and variance accounts continue in the upcoming
proceeding.
One important exception to this is OPG’s being entirely at risk related to variability in the output of
its nuclear facilities. The companies in the proxy group do not face comparable risk, and, in fact, many
recover costs through a mix of fixed and variable charges, and/or have decoupling in place. For the
proxy companies, revenue decoupling mechanisms further reduce exposure to volumetric risk.
In addition to proxy group comparability, Concentric also considered the general comparability of
OPG’s deferral and variance accounts to other regulated electric utilities in Ontario. In doing so,
Concentric observed that the majority of OPG’s accounts would be classified as “Group 2” accounts
according to the OEB’s Accounting Procedures Handbook. Group 2 accounts require a prudence
review by the OEB before the utility is allowed to recover those costs. In contrast, Group 1 deferral
and variance accounts do not require a prudence review.
Concentric reviewed the deferral and variance accounts for a sample of other regulated electric
utilities in Ontario (including Hydro One Networks, Toronto Hydro, Hydro Ottawa, Niagara-on-the-
Lake Hydro, and ENWIN) and determined that those companies have a mix of Group 1 and Group 2
Filed: 2020-12-31 EB-2020-0290 Exhibit C1-1-1 Attachment 1
Page 74 of 131

72
accounts. Because the disposition of Group 2 deferral and variance accounts involves a greater
degree of regulatory scrutiny than Group 1 accounts, Concentric concludes that OPG has relatively
greater risk of cost recovery for its deferral and variance accounts than do other electric utilities in
Ontario.
b. Generation percentage and mix
Concentric analyzed the generation percentage and mix of each proxy company to assess the
percentage of each company’s assets that is generation, and further, the percentage of generation
capacity that is comprised of nuclear generation. As shown in Figure 19 and Figure 20, OPG is the
only company in the proxy group that is a pure-play regulated generation company. OPG also has the
highest percentages of nuclear and hydroelectric generation. As discussed above, the investment
community generally considers the generation function to be higher risk than other regulated electric
operations.
Figure 19: Generation versus Transmission and Distribution Assets
Filed: 2020-12-31 EB-2020-0290 Exhibit C1-1-1 Attachment 1
Page 75 of 131

73
Figure 20: Generation Mix (MW), Percentage Hydro and Nuclear Generation
6. Proxy Group Financial Risk Analysis
In order to assess the financial risk of OPG relative to the proxy group, Concentric analyzed the
allowed common equity ratios at the operating company level and the actual book equity ratios for
these companies at both the holding company and operating company level. Concentric analyzed
these different variants of equity ratios in order to provide a range of observations. Book equity
ratios at the holding company level, however, reflect a different risk profile than pure regulated utility
operations, and Concentric has applied less weight to those results.
The proxy group mean and median results are measures of central tendency for the proxy group from
which inferences about a reasonable equity ratio can be made for OPG, after consideration of
differences in risk profiles between OPG and the proxy group. Specifically, the mean is “generally the
best measure of central location for purposes of statistical inference,”118 while also being at risk of
being “unduly influenced by extreme observations.”119 The median, or middle point of a set of
observations at which half of the set of observations are above it and half and below it, is not subject
to the same distortion due to extreme observations.120 Figure 21 and Figure 22 summarize the
118 Keller and Warrack, Statistics for Management and Economics, 5e ed., Duxbury Thompson Learning,
2000, at 92. 119 Ibid. 120 Ibid., at 93.
Filed: 2020-12-31 EB-2020-0290 Exhibit C1-1-1 Attachment 1
Page 76 of 131

74
results in tabular format for the Concentric Proxy Group and Moody’s Peer Group, respectively.
Schedules 1 through 3 provide the analysis summarized in Figure 21 and Figure 22.
Figure 21: Concentric Proxy Group Equity Ratios
Company
Operating Subsidiaries:
Avg. Authorized Equity Ratios (%)121
Operating Subsidiaries:
5-Year Avg. Actual Equity Ratios (%)122
Holding Company: 5-Year Avg. Actual
Equity Ratios (%)123
ALE 53.81 58.79 58.44 AEE 50.00 52.90 49.34 AEP 46.07 48.91 47.88 AVA 49.36 50.56 50.34 DUK 52.26 53.00 47.02 EIX 52.00 55.36 43.98 EE 48.57 48.88 47.70
ETR 47.89 48.58 36.96 FE 48.00 55.63 26.82
EVRG 50.37 54.84 54.70 IDA 49.90 53.82 56.20 NEE 48.00 61.13 49.08 PNW 55.80 54.08 53.68 PNM 48.11 48.57 42.32 POR 50.00 50.05 51.18 SO 55.25 51.97 38.36
XEL 54.41 54.36 44.10 AQN 48.49 56.59 39.73 EMA 37.50 48.26 39.03 FTS 43.61 49.87 38.08
Mean 49.47 52.81 45.75 Median 49.63 52.95 47.36
OPG 45.00 45.00 45.00
121 See, Exhibit 2.1. 122 See, Exhibit 3.1. 123 See, Exhibit 4.1.
Filed: 2020-12-31 EB-2020-0290 Exhibit C1-1-1 Attachment 1
Page 77 of 131

75
Figure 22: Moody’s Proxy Group Equity Ratios
Company
Operating Subsidiaries:
Avg. Authorized Equity Ratios (%)124
Operating Subsidiaries:
5-Year Avg. Actual Equity Ratios (%)125
Holding Company: 5-Year Avg. Actual
Equity Ratios (%)126
PEG 54.00 53.55 54.46 NEE 48.00 61.13 49.08 EXC 50.05 53.06 48.24
Mean 50.68 55.91 50.59 Median 50.05 53.06 49.08
OPG 45.00 45.00 45.00
As shown in Figure 21 and Figure 22, OPG’s deemed equity ratio of 45% is lower than the average
and median equity ratios Concentric identified for both proxy groups and all three analytical
approaches. The mean and median equity ratios at the operating company level exceed 49% for both
proxy groups. Further, the mean and median equity ratios at the holding company level exceed 49%
for the Moody’s Peer Group. Only the mean and median equity ratios at the holding company level
for the Concentric proxy group are lower than 49%. OPG’s deemed equity ratio is 0.75 to 10.91
percentage points below the results of Concentric’s analysis, depending on the proxy group and
analytical approach employed.
The only authorized equity ratios lower than OPG’s are those for Emera and Fortis, both with lower
risk T&D operations and no nuclear generation. 127 Certain U.S. companies produce analytical results
close to OPG’s deemed equity ratio, but these companies also have substantial T&D assets to mitigate
their generation risk. As discussed previously, generation assets are generally considered riskier
from an investment perspective than T&D assets because generation assets typically have longer
construction lead times, are subject to production risk and to risk from changes in environmental
regulations and requirements and are more subject to technological obsolescence. For example, in
EB-2007-0905, the OEB concluded: “OPG’s nuclear business is riskier than regulated transmission
and distribution utilities in terms of operational and production risk, but is less risky than merchant
generation.”128 In that same decision, the OEB also commented on the relative risk of generation as
124 See, Exhibit 2.2. 125 See, Exhibit 3.2. 126 See, Exhibit 4.2. 127 In addition, both Emera and Fortis have substantial Canadian operations, and Canadian utilities have
historically been authorized lower equity ratios than their U.S. counterparts, an outcome that Concentric does not believe reflects the converged risk profiles of Canadian and U.S. regulatory jurisdictions, as discussed earlier.
128 EB-2007-0905, Decision with Reasons, November 3, 2008, at 149.
Filed: 2020-12-31 EB-2020-0290 Exhibit C1-1-1 Attachment 1
Page 78 of 131

76
follows: “The Board has concluded that OPG is of higher risk than electricity LDCs, gas utilities and
electric transmission utilities and of lower risk than merchant generation.”129
Figure 19 presented earlier, provides the percentage of generation assets and T&D assets for OPG
and the proxy group companies. As shown in Figure 19 100% of OPG’s assets are dedicated to
generation, while the proxy group companies have a mixture of generation assets and T&D assets.
On that basis, we conclude that OPG has higher business risk than the proxy group companies, which
suggests a higher deemed equity ratio is appropriate for OPG.
With the lower deemed equity ratio of OPG compared to the proxy group companies, Concentric
concludes that OPG has greater financial risk than the proxy group. Concentric also considers that
OPG is rated three notches lower than its issuer rating on a stand-alone basis according to S&P and
Moody's, which places it toward the low end or below the investment grade credit rating range
relative to the proxy group. This higher financial risk profile of OPG suggests its deemed equity ratio
should fall at the upper end of the proxy group.
Further, Concentric notes that Georgia Power has been allowed to maintain an equity ratio of 56%
for ratemaking purposes during the construction of Vogtle plant units 3 and 4 in recognition of the
cash flow pressure during this large construction project. In particular, on December 17, 2019, the
Georgia PSC approved a settlement agreement for a three-year rate plan that included an ROE of
10.50% on 56% common equity. In its Order approving the settlement, the Commission noted that
Staff had recommended an equity ratio of 51%; however, the Commission determined that: “[b]ased
on the evidence presented, the Commission finds and concludes that a capital structure of 56%
common equity level is just and reasonable, and will help to mitigate the risk of a credit rating
downgrade.”130
Comparative Analysis Conclusions
Based on the comparative analyses of business and financial risk, Concentric draws the following
conclusions:
OPG’s generation mix is comprised of more nuclear generation than the proxy group,
indicating that OPG is riskier than the group on this factor.
OPG has an asset mix that is 100% generation in contrast to the proxy group companies with
an average of 43%, indicating OPG is a riskier business.
129 Ibid. 130 Docket 42516, Order, at 6.
Filed: 2020-12-31 EB-2020-0290 Exhibit C1-1-1 Attachment 1
Page 79 of 131

77
Unlike other proxy group companies with nuclear operations, OPG is fully subject to revenue
variability risk on its nuclear generation, which significantly increases risk;
OPG has several deferral and variance accounts for its operations, as do other proxy
companies; therefore, OPG is considered to be risk comparable to the proxy group in this area.
Several of OPG’s accounts pertain to nuclear refurbishment and new nuclear planning, for
which similar protections are provided for nuclear utilities in other jurisdictions;
OPG’s deemed equity ratio is lower and its stand-alone credit rating (by S&P) is weaker than
the vast majority of the proxy companies, exposing OPG to more financial risk than the proxy
companies.
On a relative risk basis, Concentric finds OPG, with its significant nuclear concentration, a pure
generating company business profile, higher nuclear variability risk and higher financial risk, to fall
towards the upper end of the spectrum of risk profiles established by the proxy companies.
Depending on the analytical approach employed, and proxy group studied, the proxy group’s mean
equity ratio ranges between 45.75% and 55.91%. As discussed earlier in the report, however,
Concentric places less weight on the equity ratios at utility holding companies (versus those at
regulated operating companies) because those companies reflect a different risk profile than the
regulated operations of OPG. Focusing on the results from the regulated operating companies, both
actual and authorized equity ratios, produces a reasonable range of equity thickness for OPG of
49.47% to 55.91%.
OPG’s current equity ratio of 45% is below those ranges despite OPG’s elevated level of risk relative
to the proxy groups. Given the risk factors noted above, OPG falls toward the upper end of the risk
spectrum, and its equity ratio could reasonably be set at 55% to 56%, being the upper end of the
proxy group results. In consideration of the results of our analysis together with the OEB’s findings
in EB-2016-0152, however, Concentric conservatively recommends an equity ratio of no less than
50% for OPG for this upcoming rate setting period.
Filed: 2020-12-31 EB-2020-0290 Exhibit C1-1-1 Attachment 1
Page 80 of 131

78
APPENDIX A:
NUCLEAR RISK – CREDIT RATING AGENCIES
This appendix provides excerpts from S&P Global Ratings highlighting that ratings agency’s views on
the high-risk nature of utilities’ nuclear businesses.
Ameren (AEE) – “Higher operational risk and material ESG considerations from owning and
operating the Callaway nuclear plant… Nuclear generation increases operational risks and carries
with it long-term storage concerns; this is partially offset by the technology’s emission-free
generation… Our negative comparable rating analysis modifier reflects the consolidated exposure to
nuclear and coal generation... Environmental factors are material to our credit analysis primarily due
to Ameren’s exposure to nuclear and coal generation.”131
Dominion Energy, Inc. (D) – “Overall, we assess most of the DEI utilities as very low risk and
consistent with their effective management style of regulatory risk. The exception is DESC (Dominion
Energy South Carolina) whose effectiveness in managing regulatory risk eroded after construction of
two new nuclear units was cancelled. Despite DEI’s acquisition of DESC, our assessment of DESC
incorporates a much less supportive regulatory environment in South Carolina than before the
company’s cancellation of the nuclear plants… The company also has nuclear and renewable
merchant generation businesses, which account for about 5% of EBITDA… We assess the merchant
nuclear contracted asset as having the highest risk from the company’s portfolio of contracted assets.
The merchant nuclear exposes the company to higher operating risks, volumetric risks, counterparty
credit risk, and commodity risks. ”132
Duke (DUK) – “[T]he company’s carbon-free nuclear generation portfolio increases its
operating risk and exposes it to longer-term nuclear waste storage risks despite the company’s long-
term track record of achieving safe operational standards of its nuclear fleet.”133
Entergy (ETR) – “Remaining exposure to nuclear generation increases operational risk…
Entergy continues to shut down nuclear plants. The company is reducing its exposure to non-
regulated nuclear power units. It shut down a unit at its Indian Point facility in New York in spring
2020, and it plans to shut down the remaining operating unit in spring 2021. Its Palisades facility
131 S&P Ratings Direct, “Ameren Corp.,” April 10, 2020. 132 S&P Ratings Direct, “Dominion Energy Inc. and Subsidiaries Outlooks Revised To Positive Due On Planned
Asset Sale and Cancelled Pipeline Project,”.,” July 7, 2020. 133 S&P Ratings Direct, “Duke Energy Corp. And Subsidiaries Outlooks Affirmed Following Atlantic Cost
Pipeline Exit; Outlook Stable,” July 9, 2020.
Filed: 2020-12-31 EB-2020-0290 Exhibit C1-1-1 Attachment 1
Page 81 of 131

79
in Michigan will close in 2022… The stable outlook over the next two years reflects our expectation
that Entergy will successfully exit its higher-risk, non-utility nuclear power generation stations and
grow through its lower-risk, rate-regulated utility businesses, leading to an improved business risk
profile... We could lower our ratings on Entergy over the next 24 months if its non-utility-owned
nuclear power generation stations, which we currently expect to close, remain open and we
anticipate that its financial measures will weaken, including adjusted FFO to debt of consistently
below 14%... We expect that Entergy will close its remaining non-utility nuclear generating units in
New York and Michigan over the next several years. Its business will largely consist of lower-risk,
rate-regulated utility operations. As it moves toward becoming a fully rate-regulated utility company,
we expect that its business risk profile will improve. Entergy's complete exit from the merchant
nuclear business depends on the receipt of various regulatory approvals, particularly to sell the
nuclear units for decommissioning… The company's current generation capacity of about 22,70021
MW consists of 6665% natural gas, 2325% nuclear, and about 10% coal... the company’s board
structure includes a nuclear committee, members of which discuss safety risks and best practices for
its nuclear fleet.”134
NextEra (NEE) – “[W]e assess the company at the very low end of the range for this category,
incorporating the company's other higher-risk businesses. These include nuclear merchant
generation, proprietary trading, retail supply and wholesale full-requirements contracts, and natural
gas exploration and production businesses.”135
Pinnacle West Capital Corp (PNW) – “Environmental risks and potential liabilities associated
with the company’s coal-fired and nuclear generation capacity… Offsetting our assessment of
PWCC's business risk profile are the company's limited regulatory diversity, the highly politicized
regulatory environment in Arizona, environmental risks associated with the company's coal-fired
generation, and operating risks associated with the company's nuclear generation. APSC owns 6,316
MW of regulated generating capacity, of which about 58% is from nuclear and coal-fired fuel sources.
Because of these weaknesses, we assess PWCC's business risk profile as being in the lower half of its
business risk profile category… The generation mix for APSC consists of about 57% natural gas, 21%
coal, 18% nuclear, and 3% renewables… Additionally, APSC maintains sole management
responsibility for the nation's largest nuclear plant, Palo Verde, with total generation capacity of
134 S&P Ratings Direct, “Entergy Corp.,” July 7, 2020. 135 S&P Ratings Direct, “NextEra Energy Inc. Ratings Affirmed On Acquisition Of Gulf Power; Outlook
Remains Stable,” January 3, 2019.
Filed: 2020-12-31 EB-2020-0290 Exhibit C1-1-1 Attachment 1
Page 82 of 131

80
almost 4,000 MW. Although it’s carbon-free, the company's nuclear generation portfolio increases
operating risk and exposes it to longer-term nuclear waste storage risks.”136
Southern (SO) – “Atlanta-based Southern Co. announced its share of the Vogtle units 3 and 4 nuclear
power construction project costs have increased by approximately $150 million… This follows a
series of other related announcements by the company, including that it resequenced its planned
construction activities for the units, and reduced its work force at the construction site by about 20%,
primarily due to the outbreak of COVID-19, where multiple workers at the site have tested positive
for the virus… We view these developments as indicative of potentially heightened business risk for
Southern Co., and its key subsidiary, Georgia Power Co. given the challenging operating environment
that COVID-19 presents, despite the company's view that it can achieve its required in-service date
for units 3 and 4 by November 2021 and November 2022, respectively… The negative outlooks for
Southern and its subsidiaries reflect the potential for increased business risk for Southern Co., given
the scale of its nuclear construction activities at Vogtle units 3 and 4 amid the COVID-19 pandemic.
The negative outlooks also reflect minimal financial cushion at the parent for the current rating,
including consolidated FFO to debt of 16% for the next two years…”
“We believe there is risk of delays to the project's regulatory in-service date. While the
company maintains that it can achieve its aggressive in-service date for units 3 and 4, we note that
these estimates are based on several assumptions, including the company's view that the normal rate
of absenteeism and its productivity targets can be met despite the temporary reduction in workers
at the site, and despite the COVID-19 environment. The staff of the Georgia Public Service
Commission (GPSC) has effectively cast doubt on the company's scheduled timeline to bring the units
online, including for both the regulatory timeline, and the company's aggressive timeline.
Furthermore, while the November 2021 and November 2022 regulatory in-service dates for units 3
and 4 remain the focus, the company is exposed to the risk of additional penalties on its nuclear
construction cost recovery (NCCR) tariff, including a return on equity (ROE) that will be reduced by
10 basis points each month if units 3 and 4 are not commercially operational by June 1, 2021, and
June 1, 2022.”137
136 S&P Ratings Direct, “Transaction Update: Pinnacle West Capital Corp.,” November 3, 2020. 137 S&P Ratings Direct, “Research Update: Southern Company and Subsidiaries Outlooks Remain Negative
on Higher Nuclear Construction Costs, Ratings Affirmed,” August 6, 2020.
Filed: 2020-12-31 EB-2020-0290 Exhibit C1-1-1 Attachment 1
Page 83 of 131
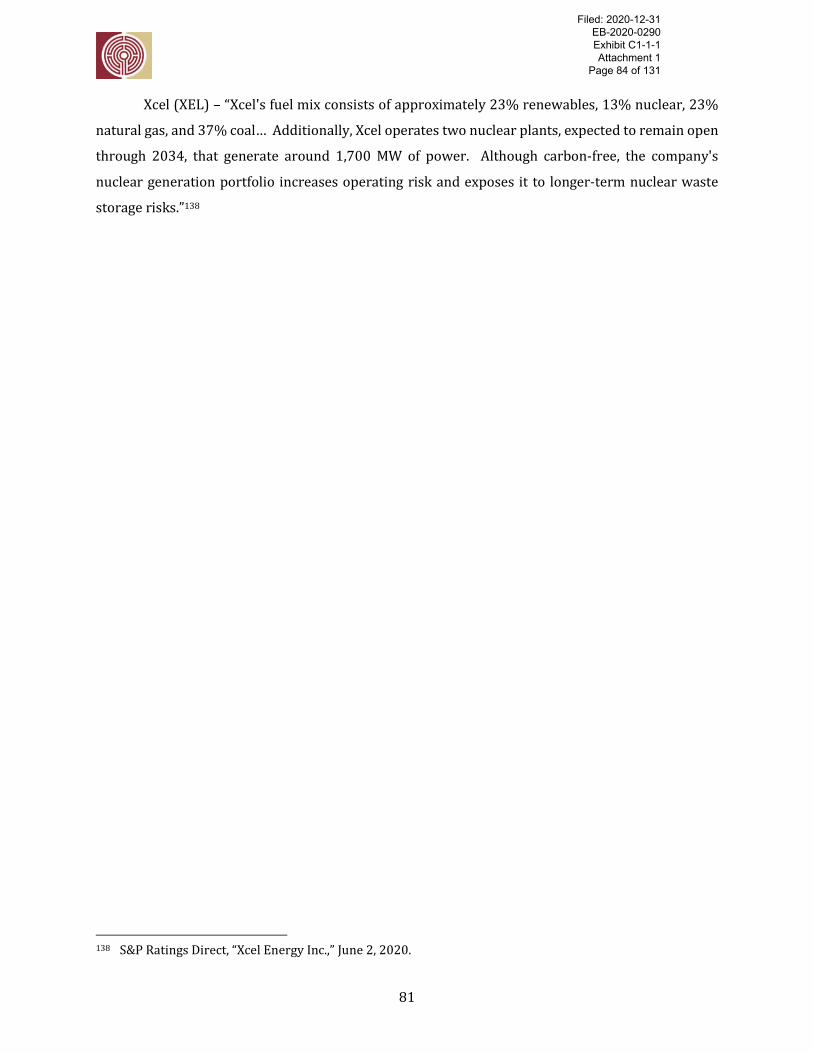
81
Xcel (XEL) – “Xcel's fuel mix consists of approximately 23% renewables, 13% nuclear, 23%
natural gas, and 37% coal… Additionally, Xcel operates two nuclear plants, expected to remain open
through 2034, that generate around 1,700 MW of power. Although carbon-free, the company's
nuclear generation portfolio increases operating risk and exposes it to longer-term nuclear waste
storage risks.”138
138 S&P Ratings Direct, “Xcel Energy Inc.,” June 2, 2020.
Filed: 2020-12-31 EB-2020-0290 Exhibit C1-1-1 Attachment 1
Page 84 of 131

82
APPENDIX B:
PRECEDENT FOR CONSIDERING U.S. DATA
There is precedent among Canadian regulators for considering U.S. data and a U.S. proxy group for
cost of capital evaluations. In recent orders, other Canadian regulators have determined that it is
appropriate to consider the use of U.S. data and U.S. proxy groups to estimate the allowed return on
equity (“ROE”) for a Canadian regulated utility. Regulators in Canada have noted several reasons that
support consideration of U.S. data. First, the development of a proxy group comprised entirely of
Canadian electric utilities is difficult due to the small number of publicly-traded utilities in Canada
and the fact that many of those Canadian companies derive a significant percentage of their revenues
and net income from operations other than the provision of regulated electric utility service. Second,
this problem has been exacerbated by the continuing trend toward mergers and acquisitions in the
utility industry, both within Canada and across the border with U.S. utility companies. The question
for Canadian regulators has become: How do we account for any differences in risk between U.S. and
Canadian utilities?
Concentric’s research and analysis demonstrate that it is possible to select a group of U.S. electric
utilities that is comparable to Canadian utilities in terms of business and operating risk. In that
regard, Concentric agrees with the conclusion of the OEB that it is not necessary to find that utilities
are the same, only that they are comparable,139 and with the National Energy Board’s (“NEB”)
(predecessor to the Canadian Energy Regulator) conclusion that it is possible to account for
differences in risk that would influence an investor’s required rate of return.140
A growing number of Canadian utility regulators have accepted the use of U.S. data or U.S. proxy
groups in recent years. For example, in its TQM Decision, the NEB found that U.S. market returns are
relevant to the cost of capital for Canadian firms, and that the regulatory regimes in Canada and the
U.S. are sufficiently similar as to justify comparison. The NEB appears to view U.S. market returns as
valuable information in establishing the cost of capital for Canadian utilities. Moreover, the NEB
found that Canadian utilities are competing for capital in global financial markets that are
increasingly integrated. The NEB recognized that it is no longer possible to view Canada as insulated
from the remainder of the investing world, and that doing so would be detrimental to the ability of
Canadian utilities to compete for capital.141 Importantly, the NEB also found that the regulatory
139 Ontario Energy Board, EB-2009-0084, Report of the Board on the Cost of Capital for Ontario’s Regulated
Utilities, December 11, 2009, at 21. 140 National Energy Board, Reasons for Decision, TQM RH-1-2008 (March 2009), at 71. 141 Ibid., at 66-72.
Filed: 2020-12-31 EB-2020-0290 Exhibit C1-1-1 Attachment 1
Page 85 of 131

83
regimes in the U.S. and Canada were sufficiently similar as to justify comparison between utilities in
the two countries, stating:
The Board is not persuaded that the U.S. regulatory system exposes utilities to notable
risks of major losses due either to unusual events or cost disallowances. The Board views
the losses and disallowances experienced by U.S. regulated entities as a result of the
restructuring that took place to terminate the merchant gas function of pipelines, as
well as some other circumstances such as the Duquesne nuclear build, to be, to a large
extent, unique events. The Board also finds that such instances are not likely to weigh
significantly in investors' perceptions today, and would thus have little or no impact on
cost of capital.142
Likewise, the OEB concluded that the U.S. is a relevant source of comparable data and that it often
looks to the U.S. to inform its decisions:
The Board is of the view that the U.S. is a relevant source for comparable data. The
Board often looks to the regulatory policies of State and Federal agencies in the United
States for guidance on regulatory issues in the province of Ontario. For example, in
recent consultations, the Board has been informed by U.S. regulatory policies relating to
low income customer concerns, transmission cost connection responsibility for
renewable generation, and productivity factors for 3rd generation incentive
ratemaking.
Finally, the Board agrees with Enbridge that, while it is possible to conduct DCF and
CAPM analyses on publicly-traded Canadian utility holding companies of comparable
risk, there are relatively few of these companies. As a result, the Board concludes that
North American gas and electric utilities provide a relevant and objective source of data
for comparison.143
Finally, the British Columbia Utilities Commission (“BCUC”) accepted the use of U.S. data, stating:
In addition, the Commission Panel continues to be prepared to accept the use of
historical and forecast data of U.S. utilities when applied: as a check to Canadian data,
as a substitute for Canadian data when Canadian data do not exist in significant
quantity or quality, or as a supplement to Canadian data when Canadian data gives
unreliable results. Given the paucity of relevant Canadian data, the Commission Panel
142 Ibid. 143 Ontario Energy Board, EB-2009-0084, Report of the Board on the Cost of Capital for Ontario’s Regulated
Utilities, December 11, 2009, at 23.
Filed: 2020-12-31 EB-2020-0290 Exhibit C1-1-1 Attachment 1
Page 86 of 131

84
considers that natural gas distribution companies operating in the US have the potential
to act as a useful proxy in determining TGI’s capital structure, ROE, and credit metrics.144
The BCUC affirmed this position in its 2013 Generic Cost of Capital Decision:
The Commission Panel reaffirms the 2009 Decision determination on when to use
historical and forecast data for US utilities. Canadian utilities need to be able to
compete in a global marketplace and be allowed a return for them to do so. In addition,
the Panel accepts that there continues to be limited Canadian data upon which to rely
and considers that there may be times when natural gas companies operating within
the US may prove to be a useful proxy in determining the cost of capital. Accordingly,
we have determined that it is appropriate to continue to accept the use of historical and
forecast data for US utilities and securities as outlined in the 2006 Decision and again
in the 2009 Decision.
And,
[I]n the view of the Commission Panel, the use of US data must be considered on a case
by case basis and weighed with consideration to the sample being relied upon and any
jurisdictional differences which may exist.145
In summary, regulatory authorities in Canada have recognized that Canadian utility companies are
competing for capital in global financial markets and that Canadian data are often limited by the small
number of publicly-traded utilities. They have also recognized the integrated nature of Canadian and
U.S. financial markets, and the similarity of the utility regulatory regimes. Therefore, they have
determined that it is reasonable and appropriate to consider the results of a risk comparable U.S.
proxy group for purposes of cost of capital analyses for a Canadian natural gas or electric utility.
These findings suggest that it is reasonable and appropriate to consider a proxy group of U.S. utility
companies as sufficiently comparable to Canadian regulated utilities in terms of their risk profile.
144 British Columbia Utilities Commission, In the Matter of Terasen Gas Inc., Terasen Gas (Vancouver Island)
Inc., Terasen Gas (Whistler) Inc., Return on Equity and Capital Structure, Decision G-158-09, December 16, 2009, at 16.
145 British Columbia Utilities Commission, Generic Cost of Capital Proceeding (Stage I), Decision, May 10, 2013, at 20.
Filed: 2020-12-31 EB-2020-0290 Exhibit C1-1-1 Attachment 1
Page 87 of 131

APPENDIX C RESUME OF JAMES M. COYNE
85
APPENDIX C:
RESUME OF JAMES M. COYNE
JAMES M. COYNE
Senior Vice President
AREAS OF EXPERTISE
Energy Regulation
Rate policy
Cost of capital
Incentive regulation
Fuels and power markets
Management and Business Strategy
Fuels and power market assessments
Investment feasibility
Corporate and business unit planning
Benchmarking and productivity analysis
Financial and Economic Advisory
Valuation analysis
Due diligence
Buy and sell-side advisory
Litigation Support and Expert Testimony
Rate and regulatory policy
Fuels and power markets
Contract litigation
Valuation and damages
Mr. Coyne provides financial, regulatory, strategic, and litigation support services to clients in
the natural gas, power, and utilities industries. Drawing upon his industry and regulatory
expertise, he regularly advises utilities, public agencies and investors on business strategies,
investment evaluations, and matters pertaining to rate and regulatory policy. Prior to
Concentric, Mr. Coyne worked in senior consulting positions focused on North American utilities
industries, in corporate planning for an integrated energy company, and in regulatory and
policy positions in Maine and Massachusetts. He has authored numerous articles on the energy
industry and provided testimony and expert reports before the Federal Energy Regulatory
Commission and numerous jurisdictions in the U.S. and Canada. Mr. Coyne holds a B.S. in
Business from Georgetown University with honors and an M.S. in Resource Economics from the
University of New Hampshire.
Filed: 2020-12-31 EB-2020-0290 Exhibit C1-1-1 Attachment 1
Page 88 of 131
APPENDIX C RESUME OF JAMES M. COYNE
86
PROFESSIONAL HISTORY
Concentric Energy Advisors, Inc. (2006 – Present)
Senior Vice President
Vice President
FTI Consulting (Lexecon) (2002 – 2006)
Senior Managing Director – Energy Practice
Arthur Andersen LLP (2000 – 2002)
Managing Director, Andersen Corporate Finance – Energy and Utilities
Navigant Consulting, Inc. (1996 – 2000)
Managing Director, Financial Services Practice
Senior Vice President, Strategy Practice
TotalFinaElf (1990 – 1996)
Manager, Corporate Planning and Development
Manager, Investor Relations
Manager of Strategic Planning and Vice President, Natural Gas Division
Arthur D. Little, Inc. (1989 – 1990)
Senior Consultant – International Energy Practice
DRI/McGraw-Hill (1984 – 1989)
Director, North American Natural Gas Consulting
Senior Economist, U.S. Electricity Service
Massachusetts Energy Facilities Siting Council (1982 – 1984)
Senior Economist – Gas and Electric Utilities
Maine Office of Energy Resources (1981 – 1982)
State Energy Economist
EDUCATION
University of New Hampshire
M.S., Resource Economics, with honors, 1981
Georgetown University
B.S., Business Administration and Economics, cum laude, 1975
DESIGNATIONS AND AFFILIATIONS
Community Rowing Inc., Board of Directors, 2015 - 2019
Georgetown University, Alumni Admissions Interviewer, 1988 – current
NASD General Securities Representative and Managing Principal (Series 7, 63 and 24
Certifications), 2001
Filed: 2020-12-31 EB-2020-0290 Exhibit C1-1-1 Attachment 1
Page 89 of 131
APPENDIX C RESUME OF JAMES M. COYNE
87
American Petroleum Institute, CEO’s Liaison to Management and Policy Committees, 1994-1996
National Petroleum Council, Regulatory and Policy Task Forces, 1992
President, International Association for Energy Economics, Dallas Chapter, 1995
Gas Research Institute, Economics Advisory Committee, 1990-1993
NARUC, Advanced Regulatory Studies Program, Michigan State University, 1984
PUBLICATIONS AND RESEARCH
“Advancing FERC’s Methodology for Determining Allowed ROEs for Electric Transmission
Companies,” submitted to FERC on behalf of EEI, James Coyne, Joshua Nowak and Julie Lieberman,
May, 2020.
“Regulator Rationale for Ratepayer-Funded Electricity and Natural Gas Innovation”, James M.
Coyne, Robert C. Yardley, Jr. and Jessalyn G. Pryciak, Energy Regulation Quarterly, Volume 6, Issue
3, 2018.
“Stimulating Innovation on Behalf of Canada’s Electricity and Natural Gas Consumers” (with Robert
Yardley), prepared for the Canadian Gas Association and Canadian Electricity Association, May
2015.
“Autopilot Error: Why Similar U.S. and Canadian Risk Profiles Yield Varied Rate-making Results”
(with John Trogonoski), Public Utilities Fortnightly, May 2010
“A Comparative Analysis of Return on Equity of Natural Gas Utilities” (with Dan Dane and Julie
Lieberman), prepared for the Ontario Energy Board, June 2007
“Do Utilities Mergers Deliver?” (with Prescott Hartshorne), Public Utilities Fortnightly, June 2006
“Winners and Losers: Utility Strategy and Shareholder Return” (with Prescott Hartshorne), Public
Utilities Fortnightly, October 2004
“Winners and Losers in Restructuring: Assessing Electric and Gas Company Financial Performance”
(with Prescott Hartshorne), white paper distributed to clients and press, August 2003
“The New Generation Business,” commissioned by the Electric Power Research Institute (EPRI) and
distributed to EPRI members to contribute to a series on the changes in the Power Industry,
December 2001
Potential for Natural Gas in the United States, Volume V, Regulatory and Policy Issues (co-author),
National Petroleum Council, December 1992
“Natural Gas Outlook,” articles on U.S. natural gas markets, published quarterly in the Data
Resources Energy Review and Natural Gas Review, 1984-1989
SELECTED SPEAKING ENGAGEMENTS
“Energy Sector in Transition”, Ontario Energy Association, Toronto, ON, September 24, 2018.
Filed: 2020-12-31 EB-2020-0290 Exhibit C1-1-1 Attachment 1
Page 90 of 131

APPENDIX C RESUME OF JAMES M. COYNE
88
“Understanding Regulated Utilities in Today’s Capital Markets”, NARUC Annual Meeting, La Quinta,
CA, November 14, 2016.
“Rate of Return: Where the Regulatory Rubber Meets the Road,” CAMPUT Annual Conference,
Montreal, Quebec, May 17, 2016.
“Innovations in Utility Business Models and Regulation”, The Canadian Association of Members of
Public Utility Tribunals (CAMPUT) 2015 Energy Regulation Course, Queens University, Kingston,
Ontario, June 2015
“M&A and Valuations,” Panelist at Infocast Utility Scale Solar Summit, September 2010
“The Use of Expert Evidence,” The Canadian Association of Members of Public Utility Tribunals
(CAMPUT) 2010 Energy Regulation Course, Queens University, Kingston, Ontario, June 2010
“A Comparative Analysis of Return on Equity for Utilities in Canada and the U.S.”, The Canadian
Association of Members of Public Utility Tribunals (CAMPUT) Annual Conference, Banff, Alberta,
April 22, 2008
“Nuclear Power on the Verge of a New Era,” moderator for a client event co-hosted by Sutherland
Asbill & Brennan and Lexecon, Washington D.C., October 2005
“The Investment Implications of the Repeal of PUCHA,” Skadden Arps Client Conference, New York,
NY, October 2005
“Anatomy of the Deal,” First Annual Energy Transactions Conference, Newport, RI, May 2005
“The Outlook for Wind Power,” Skadden Arps Annual Energy and Project Finance Seminar, Naples,
FL, March 2005
“Direction of U.S. M&A Activity for Utilities,” Energy and Mineral Law Foundation Conference,
Sanibel Island, FL, February 2002
“Outlook for U.S. Merger & Acquisition Activity,” Utility Mergers & Acquisitions Conference, San
Antonio, TX, October 2001
“Investor Perspectives on Emerging Energy Companies,” Panel Moderator at Energy Venture
Conference, Boston, MA, June 2001
“Electric Generation Asset Transactions: A Practical Guide,” workshop conducted at the 1999 Thai
Electricity and Gas Investment Briefing, Bangkok, Thailand, July 1999
“New Strategic Options for the Power Sector,” Electric Utility Business Environment Conference,
Denver, CO, May 1999
“Electric and Gas Industries: Moving Forward Together,” New England Gas Association Annual
Meeting, November 1998
“Opportunities and Challenges in the Electric Marketplace,” Electric Power Research Institute, July
1998
Filed: 2020-12-31 EB-2020-0290 Exhibit C1-1-1 Attachment 1
Page 91 of 131

APPENDIX C RESUME OF JAMES M. COYNE
89
SPONSOR DATE CASE/APPLICANT DOCKET SUBJECT
Alberta Beverage Container Management Board
Alberta Beverage Container Management Board
2016 2019-2020
Expert for the Board N/A Return Margin on Bottle Depots
Alberta Utilities Commission
ATCO Utilities Group 2008 2009
ATCO Gas; ATCO Pipelines Ltd.; ATCO Electric Ltd.
Application No. 1578571 / Proceeding ID. 85
2009 Generic Cost of Capital Proceeding (Gas & Electric)
Enmax Power Corporation 2017 Enmax 22570 Cost of Common Equity
Enmax Power Corporation 2020 Enmax 24110 2021 Generic Cost of Capital
American Arbitration Association
TransCanada Corporation 2004 TransCanada Corporation
AAA Case No. 50T 1810018804
Valuation of Natural Gas Pipeline
British Columbia Utilities Commission
FortisBC 2012 FortisBC Utilities G-20-12 Cost of Capital Adjustment Mechanisms
FortisBC 20152016
FortisBC Utilities Project 3698852 Cost of Capital (Gas and Electric Distribution)
California Utilities Commission
San Diego Gas & Electric Company
2019 San Diego Gas & Electric Company
A-19-04-014 Cost of Capital (Gas Distribution)
Connecticut Department of Public Utility Control
Aquarion Water Company of CT/ Macquarie Securities
2007 Aquarion Water Company of CT
DPUC Docket No. 07-05-19
Return on Equity (Water)
Federal Energy Regulatory Commission
Atlantic Power Corporation 2007 Atlantic Path 15, LLC ER08-374-000 Return on Equity (Electric)
Atlantic Power Corporation 2010 Atlantic Path 15, LLC Docket No. ER11-2909-000
Return on Equity (Electric)
Atlantic Power Corporation 2011 Atlantic Path 15, LLC Docket Nos. ER11-2909 and EL11-29
Rate of Return (Electric Transmission)
Startrans IO, LLC 2012 Startrans IO, LLC ER-13-272-000 Cost of Capital (Electric Transmission)
Startrans IO, LLC 2015 Startran IO, LLC ER-16-194-000 and EL16-25-000
Cost of Capital (Electric Transmission)
Northern States Power Company
2019 Northern States Power Company
ER20-26-000 Cost of Capital (Electric Transmission)
Filed: 2020-12-31 EB-2020-0290 Exhibit C1-1-1 Attachment 1
Page 92 of 131

APPENDIX C RESUME OF JAMES M. COYNE
90
SPONSOR DATE CASE/APPLICANT DOCKET SUBJECT
PPL Electric Utilities Corp. 2020 PP&l Industrial Customer Alliance v. PPL Electric
EL20-48-000 Answering Testimony in Response to a Section 206 ROE Complaint
Hawaii Public Utility Commission
The Gas Company 2017 The Gas Company Docket No. 2017-0105
Cost of Capital (Gas Distribution)
Maine Public Utilities Commission
Bangor Hydro Electric Company
1998 Bangor Hydro Electric Company
MPUC Docket No. 98-820
Transaction-Related Financial Advisory Services, Valuation
Central Maine Power Company
2007 Central Maine Power Company
MPUC Docket No. 2007-215
Sales Forecast
Enmax Corporation 2019 Enmax Corporation 2019-00097 Regulatory Approval of Emera Maine Acquisition
Maryland State Board of Contract Appeals
Green Planet Power Solutions 2018
Green Planet Power Solutions and Maryland Bio Eneregy LLC v. Maryland Department of General Services
MSBCA 3061 Contract Litigation, Power Purchase Agreement, Damages Analysis
Massachusetts Superior Court
Burncoat Pond Watershed District
2010
Central Water District v. Burncoat Pond Watershed District
WDCV 2001-0105 Valuation/Eminent Domain
Minnesota Public Utilities Commission
Northern States Power Company
2015 2016
Northern States Power Company
E-002-GR-15-826 Cost of Capital (Electric)
Northern States Power Company
2017 Northern States Power Company
E002/M-17-797 G002/M-17-787 E002/M-17-818
Cost of Capital (Electric and Gas Rate Riders for Transmission, Renewable Generation and Gas Distribution)
Newfoundland and Labrador Board of Commissioners of Public Utilities
Newfoundland Power 2016
Newfoundland Power 2016 GRA
Cost of Capital (Electric)
Newfoundland Power 2018 Newfoundland Power 2018 GRA Cost of Capital (Electric)
Filed: 2020-12-31 EB-2020-0290 Exhibit C1-1-1 Attachment 1
Page 93 of 131

APPENDIX C RESUME OF JAMES M. COYNE
91
SPONSOR DATE CASE/APPLICANT DOCKET SUBJECT
New Jersey Board of Public Utilities
Conectiv 2000-2001
Atlantic City Electric Company
NJBPU Docket No. EM00020106
Transaction-Related Financial Advisory Services
Nova Scotia Utility and Review Board
Nova Scotia Power Inc. 2012 Nova Scotia Power Inc.
2013 GRA Return on Equity/Business Risk (Electric)
Ontario Energy Board
Enbridge Gas Distribution and Hydro One Networks and the Coalition of Large Distributors
2009
Enbridge Gas Distribution and Hydro One Networks and the Coalition of Large Distributors
EB-2009-0084
Ontario Energy Board’s 2009 Consultative Process on Cost of Capital Review (Gas & Electric)
Enbridge Gas Distribution 2012 Enbridge Gas Distribution
EB-2011-0354 Industry Benchmarking Study and Cost of Capital (Gas Distribution)
Enbridge Gas Distribution 2014 Enbridge Gas Distribution
EB-2012-0459 Incentive Regulation Plan and Industry Productivity Study
Ontario Power Generation 2016 Ontario Power Generation
EB-2016-0152 Cost of Capital (Electric Generation)
Prince Edward Island Regulatory and Appeals Commission
Maritime Electric Company 2015 Maritime Electric Company
UE20942 Return on Capital (Electric)
Régie de l’énergie du Québec
Gaz Métro 2012 Gaz Métro R-3809-2012 Return on Equity/Business Risk/ Capital Structure (Gas Distribution)
Hydro-Québec Distribution and Hydro- Québec TransÉnergie
2013
Hydro-Québec Distribution and Hydro- Québec TransÉnergie
R-3842-2013 Return on Equity/Business Risk (Electric)
Hydro-Québec Distribution 2014 Hydro-Québec Distribution
R-3905-2014 Remuneration of Deferral Accounts
Hydro-Québec Distribution and Hydro- Québec TransÉnergie
2015-2017
Hydro-Québec Distribution and Hydro- Québec TransÉnergie
R-3897-2014 Performance-Based Ratemaking
South Dakota Public Service Commission
Northern States Power Company-MN
2012 Northern States Power Company-MN
EL 11-019 Return on Equity
Texas Public Utility Commission
Filed: 2020-12-31 EB-2020-0290 Exhibit C1-1-1 Attachment 1
Page 94 of 131

APPENDIX C RESUME OF JAMES M. COYNE
92
SPONSOR DATE CASE/APPLICANT DOCKET SUBJECT
Texas New Mexico Power Company
2004 Texas New Mexico Power Company
PUC Docket No. 29206
Auction Process and Stranded Cost Recovery
U.S. Department of Commerce
Government of Québec 2017
Duty Investigation of Uncoated Groundwood Paper from Canada
PUC Docket No. 29206
Contracting for Renewable Resources, Market Analysis, Damages Analysis
Vermont Public Service Board
Vermont Gas Systems, Inc. 2006 Vermont Gas Systems, Inc.
VPSB Docket No. 7109
Models of Incentive Regulation
Vermont Gas Systems, Inc. 2012 Vermont Gas Systems, Inc.
Docket No. 7803A Cost of Capital (Gas Distribution)
Green Mountain Power Corporation
2013 Green Mountain Power Corporation
Docket No. 8191 Return on Equity (Electric)
Vermont Gas Systems, Inc. 2016 Vermont Gas Systems, Inc.
Docket No. 8698/8710
Return on Equity (Gas Distribution)
Green Mountain Power Corporation
2017 Green Mountain Power Corporation
Docket No. Tariff-8677
Return on Equity (Electric)
Green Mountain Power Corporation
2018 Green Mountain Power Corporation
18-0974 Return on Equity (Electric)
Wisconsin Public Service Commission
Wisconsin Power and Light Company
2007 Wisconsin Power and Light Company
PSCW Docket No. 6680-CE-170
Return on Equity (Electric)
Wisconsin Power and Light Company
2007 Wisconsin Power and Light Company
PSCW Docket No. 6680-CE-171
Return on Equity (Electric)
Northern States Power Company
2011 Northern States Power Company
PSCW Docket No. 4220-UR-117
Return on Equity (Electric)
Northern States Power Company
2013 Northern States Power Company
PSCW Docket No. 4220-UR-119
Return on Equity (Gas & Electric)
Northern States Power Company
2015 Northern States Power Company
PSCW Docket No. 4220-UR-121
Return on Equity (Gas & Electric)
Northern States Power Company
2017 2019
Northern States Power Company
PSCW Docket No. 4220-UR-123, 4220-UR-124
Return on Equity (Gas & Electric)
Yukon Utilities Board
ATCO Electric Yukon 2016 ATCO Electric Yukon 2016-2017 GRA Return on Equity (Electric)
Filed: 2020-12-31 EB-2020-0290 Exhibit C1-1-1 Attachment 1
Page 95 of 131

APPENDIX D RESUME OF DANIEL S. DANE
93
APPENDIX D:
RESUME OF DANIEL S. DANE
DANIEL S. DANE, CPA
Senior Vice President
PROFESSIONAL HISTORY
Concentric Energy Advisors, Inc. (2004 – Present)
CE Capital Advisors, Inc.
Senior Vice President (Concentric/CE Capital)
Financial and Operations Principal (CE Capital)
Ernst & Young (2000 – 2001, 2003 – 2004)
Staff Auditor and Database Management Associate
ZIA Information Analysis Group (1997 – 2000)
EDUCATION
Boston College
M.B.A., 2003
Colgate University
B.A., Economics, 1996
Daniel S. Dane has 20 years of experience in the energy, utility, and financial services industries
providing advisory services to power companies, natural gas pipelines, and local gas
distribution companies in the areas of regulation and ratemaking, litigation support, mergers
and acquisitions, valuation, financial statement audits and analysis, and the examination of
financial reporting systems and controls. Mr. Dane has also provided expert testimony on
regulated ratemaking matters and merger approval applications for investor- and provincially-
owned utilities, including on merger impacts, revenue requirements, the cost of capital, capital
structure, lead-lag studies/cash working capital, regulatory lag and rate base development.
Mr. Dane has an MBA from Boston College in Chestnut Hill, Massachusetts, and a BA in
Economics from Colgate University in Hamilton, New York. Mr. Dane is a certified public
accountant, and is a licensed securities professional (Series 7, 28, 63, 79, and 99). Mr. Dane also
serves as the Financial and Operations Principal of CE Capital Advisors, a FINRA-Member firm
and a subsidiary of Concentric.
Filed: 2020-12-31 EB-2020-0290 Exhibit C1-1-1 Attachment 1
Page 96 of 131

APPENDIX D RESUME OF DANIEL S. DANE
94
REPRESENTATIVE PROJECT EXPERIENCE
Ratemaking and Utility Regulation Assignments
Expert Testimony
Submitted expert testimony on behalf of utilities and other stakeholders in state
administrative rate setting and merger approval proceedings regarding merger impacts,
revenue requirements, the cost of capital, capital structure, lead-lag studies/cash working
capital, regulatory lag and rate base development.
Regulatory Support
Provided financial modeling, development of expert reports, and preparation of multiple
rounds of testimony on behalf of U.S. and Canadian investor-owned electric, natural gas, and
water utilities related to multiple aspects of the ratemaking process, including: cost of capital;
ring fencing; revenue requirements and lead-lag studies/cash working capital; decoupling;
prudence and cost recovery; capital tracker tariff mechanisms; cost allocation and shared
services; merger approval; regulatory lag; and ratemaking policy.
Consulting assignments have included utility clients across the U.S. and Canada.
Financial Advisory Assignments
Competitive Solicitations & Asset Divestitures
Sell-side support for approximately $2 billion in generating asset transactions, including
nuclear, natural gas, and coal generating facilities.
Buy-side due diligence support for U.S., Canadian, and international investors in electric and
natural gas LDC utility operations, wind generation and natural gas pipeline facilities.
Regulatory policy, ring-fencing, and merger impacts advisory services provided to U.S. and
Canadian investor-owned utilities.
Valuation Services
Developed Fairness Opinions issued by CE Capital Advisors, Inc. to Boards of Directors of
companies entering into asset purchases and sales. Led valuation modeling on multiple
energy-related valuation assignments using the Income Approach, Cost Approach, and Sales
Comparison Approach.
Litigation Advisory Assignments
Prepared economic and valuation analyses and expert reports in proceedings related to contract
disputes, takings claims, and bankruptcy proceedings. Clients include international diversified
energy companies, regulated utilities, and bondholders.
Management and Operations Consulting Assignments
Performed prudence reviews, including contracting strategy reviews and assessments of project
controls and oversight for developers of nuclear-generating capacity uprates and new nuclear
facilities.
Filed: 2020-12-31 EB-2020-0290 Exhibit C1-1-1 Attachment 1
Page 97 of 131

APPENDIX D RESUME OF DANIEL S. DANE
95
DESIGNATIONS AND PROFESSIONAL AFFILIATIONS
Certified Public Accountant, 2004
Massachusetts Society of Certified Public Accountants, 2004
American Institute of Certified Public Accountants, 2011
CERTIFICATIONS
Licensed Securities Professional: NASD Series 7, 28, 63, 79 and 99 Licenses
PRESENTATIONS
“Regulatory Treatment of Timing Differences Related to Pension and OPEB Costs.” Presented to the
Ontario Energy Board, July 2016 (Docket No. EB-2015-0040).
“Financial Management and Capital Markets.” University of Idaho Utility Executive Course, 2018.
“Increasing Shareholder Value through the Capital Markets.” University of Idaho Utility Executive
Course, 2015, 2016 and 2017.
“A Comparative Analysis of Return on Equity of Natural Gas Utilities” (with Jim Coyne and Julie
Lieberman), presented to the Ontario Energy Association, June 2007.
Filed: 2020-12-31 EB-2020-0290 Exhibit C1-1-1 Attachment 1
Page 98 of 131

APPENDIX D RESUME OF DANIEL S. DANE
96
SPONSOR DATE CASE/APPLICANT DOCKET /CASE NO. SUBJECT
Connecticut Public Utilities Regulatory Authority
SJW Group and
Connecticut Water
Service, Inc.
4/19 Application of SJW Group
and Connecticut Water
Service, Inc. for Approval of
Change of Control
Docket No. 19-04-02 Merger Impacts
SJW Group and
Connecticut Water
Service, Inc.
12/18 Application of SJW Group
and Connecticut Water
Service, Inc. for Approval of
Change of Control
Docket No. 18-07-10 Merger Impacts
Connecticut Natural Gas
Corporation
06/18 Connecticut Natural Gas
Corporation
Docket No. 18-05-16 Lead-Lag Study
Cash Working Capital
The Southern
Connecticut Gas
Company
06/17 The Southern Connecticut
Gas Company
Docket No. 17-05-42 Lead-Lag Study
Cash Working Capital
The United Illuminating
Company
07/16 The United Illuminating
Company
Docket No. 16-06-04 Lead-lag Study
Cash Working Capital
Illinois Commerce Commission
The Ameren Illinois
Utilities
07/10 Central Illinois Light
Company; Central Illinois
Public Service Company;
Illinois Power Company
Docket Nos. 09-0306
thru 09-0311 (cons.)
Rate Base Adjustments
Earnings Attrition
Maine Public Utilities Commission
The Maine Water
Company
07/19 Application for Approval of
Reorganization Pursuant to
35-A M.R.S. § 708
Docket No. 2019-00096 Merger Impacts, Customer
Benefits, Public Interest
Massachusetts Department of Public Utilities
National Grid 11/20 Boston Gas Company and
Colonial Gas Company (each
d/b/a National Grid)
D.P.U. 20-120 Revenue Requirement
Lead-lag Study
Cash Working Capital
The Berkshire Gas
Company
05/18 The Berkshire Gas Company D.P.U. 18-40 Revenue Requirement
National Grid 04/18 Boston Gas Company and
Colonial Gas Company (each
d/b/a National Grid)
D.P.U. 17-170 Impact of the Tax Cuts and
Jobs Act of 2017;
Administrative and General
Expense Allocations
National Grid 11/17 Boston Gas Company and
Colonial Gas Company (each
d/b/a National Grid)
D.P.U. 17-170 Revenue Requirement
Lead-lag Study
Cash Working Capital
New Hampshire Public Utilities Commission
Liberty Utilities
(EnergyNorth Natural
Gas) Corp.
04/17 Liberty Utilities
(EnergyNorth Natural Gas)
Corp.
Docket No. DG 17-048 Temporary Rates
Liberty Utilities
(EnergyNorth Natural
Gas) Corp.
04/17 Liberty Utilities
(EnergyNorth Natural Gas)
Corp.
Docket No. DG 17-048 Revenue Requirement
Filed: 2020-12-31 EB-2020-0290 Exhibit C1-1-1 Attachment 1
Page 99 of 131

APPENDIX D RESUME OF DANIEL S. DANE
97
SPONSOR DATE CASE/APPLICANT DOCKET /CASE NO. SUBJECT
New Mexico Public Regulation Commission
El Paso Electric Company 05/20 El Paso Electric Company Case No. 20-00104-UT Lead-lag Study
Cash Working Capital
Public Utility Commission of Texas
El Paso Electric Company 02/17 El Paso Electric Company Docket No. 46831 Lead-lag Study
Cash Working Capital
South Dakota Public Service Commission
Northern States Power
Company-MN
06/11 Northern States Power
Company-MN
EL 11-019 Return on Equity
Vermont Public Utility Commission
Vermont Department of
Public Service
08/17 Joint Petition of NorthStar
Decommissioning Holdings,
LLC, NorthStar Nuclear
Decommissioning Company,
LLC, NorthStar Group
Services, Inc., LVI Parent
Corp., NorthStar Group
Holdings, LLC, Entergy
Nuclear Vermont
Investment Company, LLC,
and Entergy Nuclear
Operations, Inc., and any
other necessary affiliates
entities to transfer
ownership of Entergy
Nuclear Vermont Yankee,
LLC, and for certain ancillary
approvals, pursuant to 30
V.S.A. §§ 107, 231, and 232
Docket No. 8880 Nuclear Facility Transfer
Ontario Energy Board
Ontario Power
Generation
05/16 Ontario Power Generation EB 2016-0152 Capital Structure
Filed: 2020-12-31 EB-2020-0290 Exhibit C1-1-1 Attachment 1
Page 100 of 131

Exhibit 1Page 1 of 1
Concentric Proxy Group Screening Data
Regulated Regulated
Regulated Regulated Electric Electric
Regulated Revenue Income Revenue Income Investment
Generation as a % of as a % of as a % of as a % of Grade
Assets in % of Regulated Generation Total Total Regulated Regulated Credit
Proxy Group Company Ticker Rate Base? Nuclear Hydro Revenue Income Revenue Income Rating?
[1] [1] [1] [2] [2] [2] [2] [1]
ALLETE, Inc. ALE Yes 0.00% 7.01% 73.45% 75.04% 97.70% 97.43% Yes
Ameren Corporation AEE Yes 11.15% 7.36% 100.00% 100.00% 86.10% 88.30% Yes
American Electric Power Company, Inc. AEP Yes 9.47% 3.59% 89.15% 95.59% 100.00% 100.00% Yes
Avista Corporation AVA Yes 0.00% 51.45% 98.28% 100.00% 100.00% 100.00% Yes
Duke Energy Corporation DUK Yes 16.39% 6.27% 98.18% 100.00% 93.37% 93.07% Yes
Edison International EIX Yes 19.85% 35.44% 99.59% 94.78% 100.00% 100.00% Yes
El Paso Electric Company EE Yes 29.04% 0.00% 100.00% 100.00% 100.00% 100.00% Yes
Entergy Corporation ETR Yes 18.49% 0.34% 84.88% 100.00% 98.54% 98.85% Yes
FirstEnergy Corporation FE Yes 0.00% 11.11% 100.00% 100.00% 100.00% 100.00% Yes
Evergy, Inc. EVRG Yes 10.02% 0.05% 100.00% 100.00% 100.00% 100.00% Yes
IDACORP, Inc. IDA Yes 0.00% 52.14% 99.71% 98.87% 100.00% 100.00% Yes
NextEra Energy, Inc. NEE Yes 12.21% 0.00% 69.38% 70.04% 100.00% 100.00% Yes
Pinnacle West Capital Corporation PNW Yes 20.04% 0.00% 99.90% 100.00% 100.00% 100.00% Yes
PNM Resources, Inc. PNM Yes 18.54% 0.00% 100.00% 99.96% 100.00% 100.00% Yes
Portland General Electric Company POR Yes 0.00% 12.16% 100.00% 100.00% 100.00% 100.00% Yes
Southern Company SO Yes 11.97% 9.37% 90.47% 95.71% 84.46% 81.27% Yes
Xcel Energy Inc. XEL Yes 9.03% 2.87% 99.32% 100.00% 85.46% 87.45% Yes
Algonquin Power & Utilities Corp [2] AQN Yes 0.00% 1.07% 81.85% 81.58% 49.13% 49.13% Yes
Emera Inc. EMA Yes N/A N/A 90.86% 100.00% 84.19% 87.49% Yes
Fortis Inc. FTS Yes 0.00% 0.68% 97.52% 100.00% 75.63% 76.49% Yes
Notes:
[1] Per S&P Global Market Intelligence
[2] Per company 10-Ks and annual reports
Filed: 2020-12-31 EB-2020-0290 Exhibit C1-1-1 Attachment 1
Page 101 of 131

Exhibit 2.1Page 1 of 3
Authorized Capital Structure Analysis - Concentric Proxy Group
Company State Subsidiary Service Case TypeRate Case
Decision Date
Authorized
Equity Ratio
Customers
Served
Weighted
Equity Ratio
Avg. Equity
Ratio
ALLETE, Inc. Minnesota Minnesota Power Electric Vertically Integrated 3/12/2018 53.81% 146,741 78,961 53.81%
Ameren Corporation Illinois Ameren Illinois Company Electric Distribution 12/16/2019 50.00% 1,220,680 610,340
Ameren Corporation Illinois Ameren Illinois Company Natural Gas Distribution 11/1/2018 50.00% 812,267 406,134
Ameren Corporation Missouri Union Electric Company Electric Vertically Integrated 3/18/2020 N/A N/A N/A
Ameren Corporation Missouri Union Electric Company Natural Gas Distribution 8/21/2019 N/A N/A N/A 50.00%
American Electric Power Company, Inc. Arkansas [1] Southwestern Electric Power Company Electric Vertically Integrated 12/20/2019 44.60% 119,644 53,363
American Electric Power Company, Inc. Indiana [1] Indiana Michigan Power Company Electric Vertically Integrated 5/30/2018 46.32% 465,774 215,737
American Electric Power Company, Inc. Kentucky Kentucky Power Company Electric Vertically Integrated 1/18/2018 41.68% 166,603 69,440
American Electric Power Company, Inc. Louisiana Southwestern Electric Power Co. Electric Vertically Integrated 2/27/2013 N/A N/A N/A
American Electric Power Company, Inc. Michigan [1] Indiana Michigan Power Co. Electric Vertically Integrated 1/23/2020 46.26% 129,418 59,871
American Electric Power Company, Inc. Ohio Columbus Southern Power Company Electric Distribution 12/14/2011 50.64% 1,500,000 759,600
American Electric Power Company, Inc. Oklahoma Public Service Co. of OK Electric Vertically Integrated 3/14/2019 N/A N/A N/A
American Electric Power Company, Inc. Tennessee Kingsport Power Company Electric Vertically Integrated 8/9/2016 40.25% 48,032 19,333
American Electric Power Company, Inc. Texas AEP Texas Central Co. Electric Distribution 12/13/2007 40.00% 1,029,536 411,814
American Electric Power Company, Inc. Texas AEP Texas North Co. Electric Distribution 5/24/2007 N/A N/A N/A
American Electric Power Company, Inc. Texas Southwestern Electric Power Co. Electric Vertically Integrated 12/14/2017 48.46% 185,508 89,897 46.07%
Avista Corporation Alaska Alaska Electric Light & Power Electric Vertically Integrated 11/15/2017 58.18% 17,165 9,987
Avista Corporation Idaho Avista Corp. Electric Vertically Integrated 11/29/2019 50.00% 133,401 66,701
Avista Corporation Idaho Avista Corp. Natural Gas Distribution 12/28/2017 50.00% 88,068 44,034
Avista Corporation Oregon Avista Corp. Natural Gas Distribution 10/8/2019 50.00% 102,017 51,009
Avista Corporation Washington Avista Corp. Electric Vertically Integrated 3/25/2020 48.50% 254,232 123,303
Avista Corporation Washington Avista Corp. Natural Gas Distribution 3/25/2020 48.50% 164,915 79,984 49.36%
Duke Energy Corporation Florida Duke Energy Florida LLC Electric Vertically Integrated 10/25/2017 N/A N/A N/A
Duke Energy Corporation Indiana [1] Duke Energy Indiana, LLC Electric Vertically Integrated 6/29/2020 53.91% 830,270 447,619
Duke Energy Corporation Kentucky Duke Energy Kentucky Inc. Electric Vertically Integrated 4/27/2020 48.23% 142,393 68,676
Duke Energy Corporation Kentucky Duke Energy Kentucky Inc. Natural Gas Distribution 3/27/2019 50.76% 100,040 50,780
Duke Energy Corporation North Carolina Duke Energy Carolinas LLC Electric Vertically Integrated 6/22/2018 52.00% 2,005,333 1,042,773
Duke Energy Corporation North Carolina Duke Energy Progress LLC Electric Vertically Integrated 2/23/2018 52.00% 1,411,441 733,949
Duke Energy Corporation North Carolina Piedmont Natural Gas Co. Natural Gas Distribution 10/31/2019 52.00% 441,656 229,661
Duke Energy Corporation Ohio Duke Energy Ohio Inc. Electric Distribution 12/19/2018 50.75% 718,099 364,435
Duke Energy Corporation Ohio Duke Energy Ohio Inc. Natural Gas Distribution 11/13/2013 53.30% 431,666 230,078
Duke Energy Corporation South Carolina Duke Energy Carolinas LLC Electric Vertically Integrated 5/1/2019 53.00% 591,113 313,290
Duke Energy Corporation South Carolina Duke Energy Progress LLC Electric Vertically Integrated 5/8/2019 53.00% 169,208 89,680
Duke Energy Corporation South Carolina Piedmont Natural Gas Co. Natural Gas Distribution 9/26/2018 53.00% 441,656 234,078
Duke Energy Corporation Tennessee Piedmont Natural Gas Co. Natural Gas Distribution 1/23/2012 52.71% 184,982 97,504 52.26%
Edison International California Southern California Edison Co. Electric Vertically Integrated 12/19/2019 52.00% 5,111,838 2,658,156 52.00%
El Paso Electric Company New Mexico El Paso Electric Co. Electric Vertically Integrated 6/8/2016 49.29% 98,984 48,789
El Paso Electric Company Texas El Paso Electric Co. Electric Vertically Integrated 12/14/2017 48.35% 323,297 156,314 48.57%
Entergy Corporation Arkansas [1] Entergy Arkansas LLC Electric Vertically Integrated 12/13/2019 47.04% 711,931 334,902
Entergy Corporation Louisiana Entergy Gulf States LA LLC Electric Vertically Integrated 12/16/2013 N/A N/A N/A
Entergy Corporation Louisiana Entergy Gulf States LA LLC Natural Gas Distribution 7/6/2005 47.52% 99,500 47,282
Entergy Corporation Louisiana Entergy Louisiana LLC Electric Vertically Integrated 7/10/2014 N/A N/A N/A
Entergy Corporation Louisiana Entergy New Orleans LLC Electric Vertically Integrated 11/7/2019 50.00% 202,634 101,317
Entergy Corporation Louisiana Entergy New Orleans LLC Natural Gas Distribution 11/7/2019 50.00% 99,500 49,750
Entergy Corporation Mississippi Entergy Mississippi LLC Electric Vertically Integrated 12/11/2014 N/A N/A N/A
Entergy Corporation Texas Entergy Texas Inc. Electric Vertically Integrated 12/20/2018 N/A N/A N/A 47.89%
Filed: 2020-12-31 EB-2020-0290 Exhibit C1-1-1 Attachment 1
Page 102 of 131

Exhibit 2.1Page 2 of 3
Authorized Capital Structure Analysis - Concentric Proxy Group
Company State Subsidiary Service Case TypeRate Case
Decision Date
Authorized
Equity Ratio
Customers
Served
Weighted
Equity Ratio
Avg. Equity
Ratio
FirstEnergy Corporation Maryland Potomac Edison Co. Electric Distribution 3/22/2019 52.82% 268,830 141,996
FirstEnergy Corporation New Jersey Jersey Cntrl Power & Light Co. Electric Distribution 12/12/2016 45.00% 1,131,190 509,036
FirstEnergy Corporation Ohio Cleveland Elec Illuminating Co Electric Distribution 1/21/2009 49.00% 751,979 368,470
FirstEnergy Corporation Ohio Ohio Edison Co. Electric Distribution 1/21/2009 49.00% 1,050,129 514,563
FirstEnergy Corporation Ohio Toledo Edison Co. Electric Distribution 1/21/2009 49.00% 310,979 152,380
FirstEnergy Corporation Pennsylvania Metropolitan Edison Co. Electric Distribution 1/19/2017 N/A N/A N/A
FirstEnergy Corporation Pennsylvania Pennsylvania Electric Co. Electric Distribution 1/19/2017 N/A N/A N/A
FirstEnergy Corporation Pennsylvania Pennsylvania Power Co. Electric Distribution 1/19/2017 N/A N/A N/A
FirstEnergy Corporation Pennsylvania West Penn Power Co. Electric Distribution 1/19/2017 N/A N/A N/A
FirstEnergy Corporation West Virginia Monongahela Power Co. Electric Vertically Integrated 2/4/2015 N/A N/A N/A 48.00%
Evergy, Inc. Kansas Evergy Kansas Central Inc. Electric Vertically Integrated 9/27/2018 51.24% 381,420 195,440
Evergy, Inc. Kansas Evergy Metro Inc Electric Vertically Integrated 12/13/2018 49.09% 259,099 127,192
Evergy, Inc. Missouri Evergy Metro Inc Electric Vertically Integrated 10/31/2018 N/A N/A N/A
Evergy, Inc. Missouri Evergy Missouri West Electric Vertically Integrated 10/31/2018 N/A N/A N/A 50.37%
IDACORP, Inc. Idaho Idaho Power Co. Electric Vertically Integrated 12/30/2011 N/A N/A N/A
IDACORP, Inc. Oregon Idaho Power Co. Electric Vertically Integrated 2/23/2012 49.90% 19,054 9,508 49.90%
NextEra Energy, Inc. Florida Florida Power & Light Co. Electric Vertically Integrated 11/29/2016 N/A N/A N/A
NextEra Energy, Inc. Florida Gulf Power Co. Electric Vertically Integrated 4/4/2017 N/A N/A N/A
NextEra Energy, Inc. Florida [2] Pivotal Utility Holdings Inc. Natural Gas Distribution 3/26/2018 48.00% 109,674 52,644 48.00%
Pinnacle West Capital Corporation Arizona Arizona Public Service Co. Electric Vertically Integrated 8/15/2017 55.80% 1,235,451 689,382 55.80%
PNM Resources, Inc. New Mexico Public Service Co. of NM Electric Vertically Integrated 12/20/2017 49.61% 526,346 261,120
PNM Resources, Inc. Texas Texas-New Mexico Power Co. Electric Distribution 12/20/2018 45.00% 253,216 113,947 48.11%
Portland General Electric Company Oregon Portland General Electric Co. Electric Vertically Integrated 12/14/2018 50.00% 888,123 444,062 50.00%
Southern Company Alabama Alabama Power Co. Electric Vertically Integrated 10/12/1982 N/A N/A N/A
Southern Company Georgia Atlanta Gas Light Co. Natural Gas Distribution 12/19/2019 56.00% 1,643,000 920,080
Southern Company Georgia Georgia Power Co. Electric Vertically Integrated 12/17/2019 56.00% 2,536,685 1,420,544
Southern Company Georgia Savannah Electric & Power Co. Electric Vertically Integrated 5/25/2005 N/A N/A N/A
Southern Company Illinois Northern Illinois Gas Co. Natural Gas Distribution 10/2/2019 54.20% 2,226,874 1,206,966
Southern Company Mississippi Mississippi Power Co. Electric Vertically Integrated 3/17/2020 53.00% 188,000 99,640
Southern Company Tennessee Chattanooga Gas Co. Natural Gas Distribution 10/15/2018 49.23% 67,000 32,984
Southern Company Virginia Virginia Natural Gas Inc. Natural Gas Distribution 12/21/2017 N/A N/A N/A 55.25%
Xcel Energy Inc. Colorado Public Service Co. of CO Electric Vertically Integrated 2/11/2020 55.61% 1,478,992 822,467
Xcel Energy Inc. Colorado Public Service Co. of CO Natural Gas Distribution 12/21/2018 54.60% 1,400,000 764,400
Xcel Energy Inc. Minnesota Northern States Power Co. - MN Electric Vertically Integrated 4/7/2020 N/A N/A N/A
Xcel Energy Inc. Minnesota Northern States Power Co. - MN Natural Gas Distribution 12/6/2010 52.46% 250,000 131,150
Xcel Energy Inc. North Dakota Northern States Power Co. - MN Electric Vertically Integrated 2/26/2014 52.56% 94,212 49,518
Xcel Energy Inc. North Dakota Northern States Power Co. - MN Natural Gas Distribution 6/13/2007 51.59% 250,000 128,975
Xcel Energy Inc. New Mexico Southwestern Public Service Co Electric Vertically Integrated 5/20/2020 54.77% 121,604 66,603
Xcel Energy Inc. South Dakota Northern States Power Co. - MN Electric Vertically Integrated 6/15/2015 N/A N/A N/A
Xcel Energy Inc. Texas Southwestern Public Service Co Electric Vertically Integrated 8/27/2020 54.62% 271,560 148,326
Xcel Energy Inc. Wisconsin Northern States Power Co - WI Electric Vertically Integrated 9/4/2019 52.52% 300,000 157,560
Xcel Energy Inc. Wisconsin Northern States Power Co - WI Natural Gas Distribution 9/4/2019 52.52% 100,000 52,520 54.41%
Filed: 2020-12-31 EB-2020-0290 Exhibit C1-1-1 Attachment 1
Page 103 of 131
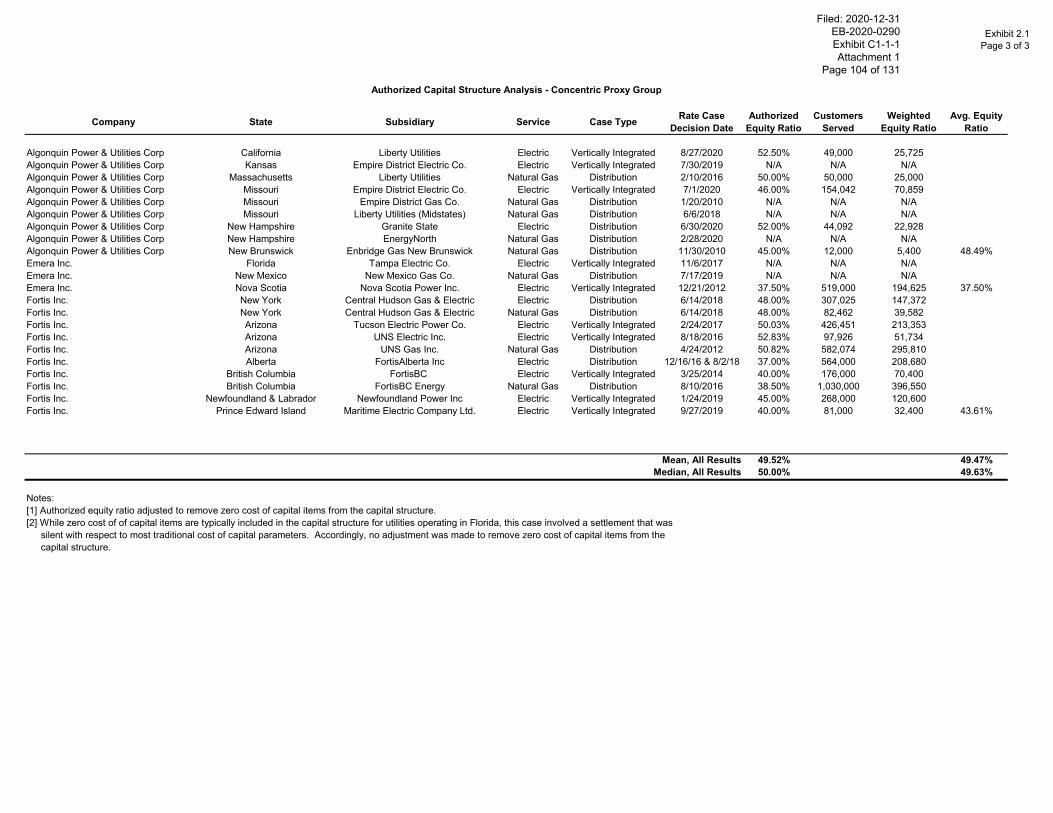
Exhibit 2.1Page 3 of 3
Authorized Capital Structure Analysis - Concentric Proxy Group
Company State Subsidiary Service Case TypeRate Case
Decision Date
Authorized
Equity Ratio
Customers
Served
Weighted
Equity Ratio
Avg. Equity
Ratio
Algonquin Power & Utilities Corp California Liberty Utilities Electric Vertically Integrated 8/27/2020 52.50% 49,000 25,725
Algonquin Power & Utilities Corp Kansas Empire District Electric Co. Electric Vertically Integrated 7/30/2019 N/A N/A N/A
Algonquin Power & Utilities Corp Massachusetts Liberty Utilities Natural Gas Distribution 2/10/2016 50.00% 50,000 25,000
Algonquin Power & Utilities Corp Missouri Empire District Electric Co. Electric Vertically Integrated 7/1/2020 46.00% 154,042 70,859
Algonquin Power & Utilities Corp Missouri Empire District Gas Co. Natural Gas Distribution 1/20/2010 N/A N/A N/A
Algonquin Power & Utilities Corp Missouri Liberty Utilities (Midstates) Natural Gas Distribution 6/6/2018 N/A N/A N/A
Algonquin Power & Utilities Corp New Hampshire Granite State Electric Distribution 6/30/2020 52.00% 44,092 22,928
Algonquin Power & Utilities Corp New Hampshire EnergyNorth Natural Gas Distribution 2/28/2020 N/A N/A N/A
Algonquin Power & Utilities Corp New Brunswick Enbridge Gas New Brunswick Natural Gas Distribution 11/30/2010 45.00% 12,000 5,400 48.49%
Emera Inc. Florida Tampa Electric Co. Electric Vertically Integrated 11/6/2017 N/A N/A N/A
Emera Inc. New Mexico New Mexico Gas Co. Natural Gas Distribution 7/17/2019 N/A N/A N/A
Emera Inc. Nova Scotia Nova Scotia Power Inc. Electric Vertically Integrated 12/21/2012 37.50% 519,000 194,625 37.50%
Fortis Inc. New York Central Hudson Gas & Electric Electric Distribution 6/14/2018 48.00% 307,025 147,372
Fortis Inc. New York Central Hudson Gas & Electric Natural Gas Distribution 6/14/2018 48.00% 82,462 39,582
Fortis Inc. Arizona Tucson Electric Power Co. Electric Vertically Integrated 2/24/2017 50.03% 426,451 213,353
Fortis Inc. Arizona UNS Electric Inc. Electric Vertically Integrated 8/18/2016 52.83% 97,926 51,734
Fortis Inc. Arizona UNS Gas Inc. Natural Gas Distribution 4/24/2012 50.82% 582,074 295,810
Fortis Inc. Alberta FortisAlberta Inc Electric Distribution 12/16/16 & 8/2/18 37.00% 564,000 208,680
Fortis Inc. British Columbia FortisBC Electric Vertically Integrated 3/25/2014 40.00% 176,000 70,400
Fortis Inc. British Columbia FortisBC Energy Natural Gas Distribution 8/10/2016 38.50% 1,030,000 396,550
Fortis Inc. Newfoundland & Labrador Newfoundland Power Inc Electric Vertically Integrated 1/24/2019 45.00% 268,000 120,600
Fortis Inc. Prince Edward Island Maritime Electric Company Ltd. Electric Vertically Integrated 9/27/2019 40.00% 81,000 32,400 43.61%
Mean, All Results 49.52% 49.47%
Median, All Results 50.00% 49.63%
Notes:
[1] Authorized equity ratio adjusted to remove zero cost of capital items from the capital structure.
[2] While zero cost of of capital items are typically included in the capital structure for utilities operating in Florida, this case involved a settlement that was
silent with respect to most traditional cost of capital parameters. Accordingly, no adjustment was made to remove zero cost of capital items from the
capital structure.
Filed: 2020-12-31 EB-2020-0290 Exhibit C1-1-1 Attachment 1
Page 104 of 131
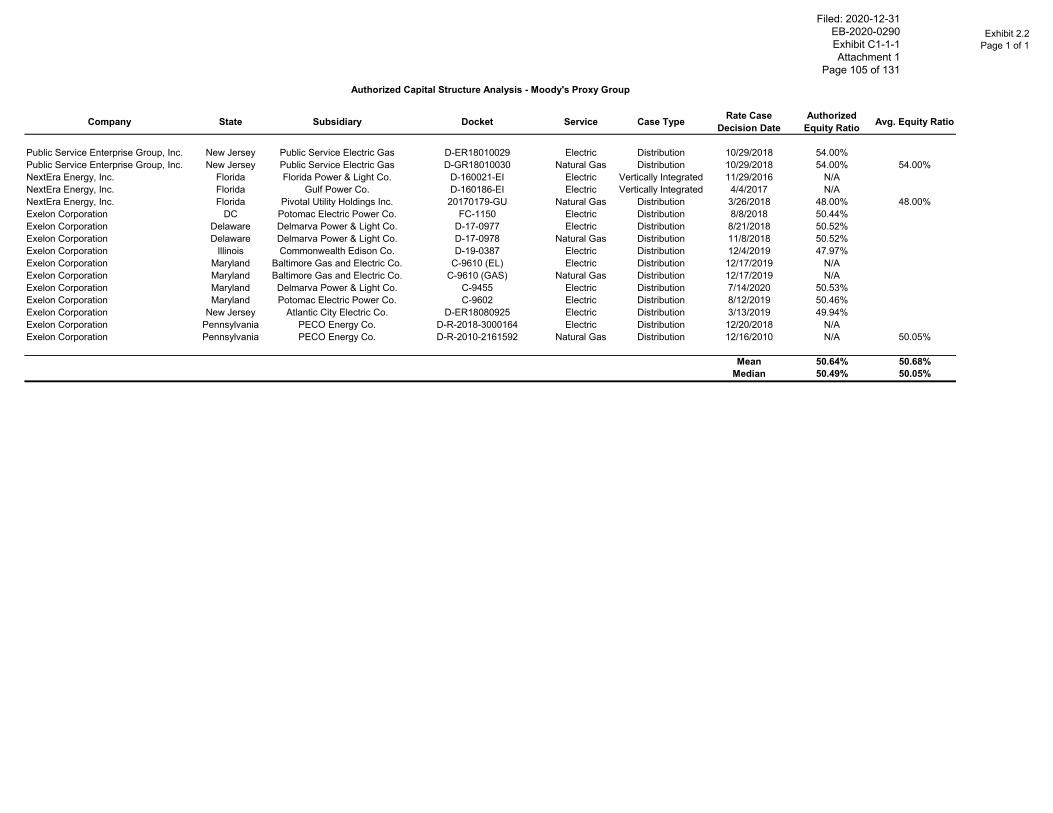
Exhibit 2.2Page 1 of 1
Authorized Capital Structure Analysis - Moody's Proxy Group
Company State Subsidiary Docket Service Case TypeRate Case
Decision Date
Authorized
Equity RatioAvg. Equity Ratio
Public Service Enterprise Group, Inc. New Jersey Public Service Electric Gas D-ER18010029 Electric Distribution 10/29/2018 54.00%
Public Service Enterprise Group, Inc. New Jersey Public Service Electric Gas D-GR18010030 Natural Gas Distribution 10/29/2018 54.00% 54.00%
NextEra Energy, Inc. Florida Florida Power & Light Co. D-160021-EI Electric Vertically Integrated 11/29/2016 N/A
NextEra Energy, Inc. Florida Gulf Power Co. D-160186-EI Electric Vertically Integrated 4/4/2017 N/A
NextEra Energy, Inc. Florida Pivotal Utility Holdings Inc. 20170179-GU Natural Gas Distribution 3/26/2018 48.00% 48.00%
Exelon Corporation DC Potomac Electric Power Co. FC-1150 Electric Distribution 8/8/2018 50.44%
Exelon Corporation Delaware Delmarva Power & Light Co. D-17-0977 Electric Distribution 8/21/2018 50.52%
Exelon Corporation Delaware Delmarva Power & Light Co. D-17-0978 Natural Gas Distribution 11/8/2018 50.52%
Exelon Corporation Illinois Commonwealth Edison Co. D-19-0387 Electric Distribution 12/4/2019 47.97%
Exelon Corporation Maryland Baltimore Gas and Electric Co. C-9610 (EL) Electric Distribution 12/17/2019 N/A
Exelon Corporation Maryland Baltimore Gas and Electric Co. C-9610 (GAS) Natural Gas Distribution 12/17/2019 N/A
Exelon Corporation Maryland Delmarva Power & Light Co. C-9455 Electric Distribution 7/14/2020 50.53%
Exelon Corporation Maryland Potomac Electric Power Co. C-9602 Electric Distribution 8/12/2019 50.46%
Exelon Corporation New Jersey Atlantic City Electric Co. D-ER18080925 Electric Distribution 3/13/2019 49.94%
Exelon Corporation Pennsylvania PECO Energy Co. D-R-2018-3000164 Electric Distribution 12/20/2018 N/A
Exelon Corporation Pennsylvania PECO Energy Co. D-R-2010-2161592 Natural Gas Distribution 12/16/2010 N/A 50.05%
Mean 50.64% 50.68%
Median 50.49% 50.05%
Filed: 2020-12-31 EB-2020-0290 Exhibit C1-1-1 Attachment 1
Page 105 of 131

Exhibit 3.1Page 1 of 6
Proxy Group Company Ticker 2019 2018 2017 2016 2015 Average
ALLETE, Inc. ALE 59.55% 61.27% 60.15% 57.01% 55.95% 58.79%
Ameren Corporation AEE 52.85% 53.13% 53.05% 52.99% 52.51% 52.90%
American Electric Power Company, Inc. AEP 49.44% 49.20% 49.57% 48.29% 48.06% 48.91%
Avista Corporation AVA 50.83% 49.89% 50.75% 50.93% 50.41% 50.56%
Duke Energy Corporation DUK 52.56% 52.50% 52.55% 52.14% 55.25% 53.00%
Edison International EIX 53.79% 51.34% 57.19% 58.20% 56.29% 55.36%
El Paso Electric Company EE 48.98% 47.88% 49.95% 47.73% 49.86% 48.88%
Entergy Corporation ETR 48.21% 48.85% 47.79% 48.19% 49.87% 48.58%
FirstEnergy Corporation FE 56.32% 58.90% 56.97% 54.59% 51.34% 55.63%
Evergy, Inc. EVRG 54.13% 54.93% 54.22% 55.08% 55.84% 54.84%
IDACORP, Inc. IDA 55.14% 54.25% 54.22% 53.15% 52.34% 53.82%
NextEra Energy, Inc. NEE 59.37% 63.95% 59.41% 62.29% 60.61% 61.13%
Pinnacle West Capital Corporation PNW 52.80% 54.36% 53.14% 54.59% 55.50% 54.08%
PNM Resources, Inc. PNM 47.68% 48.13% 49.03% 49.23% 48.79% 48.57%
Portland General Electric Company POR 49.85% 50.19% 49.80% 49.82% 50.61% 50.05%
Southern Company SO 54.20% 54.72% 49.24% 51.13% 50.58% 51.97%
Xcel Energy Inc. XEL 54.29% 54.48% 54.23% 54.22% 54.59% 54.36%
Algonquin Power & Utilities Corp AQN 57.80% 58.92% 55.52% 56.15% 54.58% 56.59%
Emera Inc. EMA 48.06% 48.44% 49.22% 48.66% 46.92% 48.26%
Fortis Inc. FTS 49.88% 48.98% 49.50% 50.13% 50.86% 49.87%
MEAN 52.79% 53.22% 52.77% 52.73% 52.54% 52.81%
LOW 47.68% 47.88% 47.79% 47.73% 46.92% 48.26%
HIGH 59.55% 63.95% 60.15% 62.29% 60.61% 61.13%
CAPITAL STRUCTURE ANALYSIS - CONCENTRIC PROXY GROUP
EQUITY RATIO [1]
Filed: 2020-12-31 EB-2020-0290 Exhibit C1-1-1 Attachment 1
Page 106 of 131

Exhibit 3.1Page 2 of 6
Company Name Ticker 2019 2018 2017 2016 2015 Average
ALLETE (Minnesota Power) ALE 59.59% 61.39% 60.04% 56.92% 55.86% 58.76%
Superior Water, Light and Power Company ALE 58.08% 56.86% 64.99% 61.12% 60.23% 60.26%
Ameren Illinois Company AEE 53.37% 53.27% 53.85% 53.95% 53.96% 53.68%
Union Electric Company AEE 52.36% 53.00% 52.42% 52.30% 51.53% 52.32%
AEP Texas Central Company AEP 46.01% 43.63% 44.82%
AEP Texas North Company AEP 43.29% 42.36% 42.82%
Appalachian Power Company AEP 48.74% 49.51% 48.72% 46.89% 46.77% 48.13%
Indiana Michigan Power Company AEP 46.74% 44.62% 46.33% 49.11% 52.65% 47.89%
Kentucky Power Company AEP 47.34% 45.72% 43.52% 43.45% 43.26% 44.66%
Kingsport Power Company AEP 54.62% 50.79% 46.53% 65.24% 59.70% 55.38%
Ohio Power Company AEP 54.50% 57.80% 58.63% 56.51% 50.09% 55.51%
Public Service Company of Oklahoma AEP 49.69% 49.16% 48.50% 48.47% 46.45% 48.46%
Southwestern Electric Power Company AEP 48.80% 46.97% 48.52% 45.95% 49.59% 47.97%
Transource Maryland, LLC AEP 40.18% 41.81% 40.99%
Transource Pennsylvania, LLC AEP 40.15% 41.92% 41.03%
Wheeling Power Company AEP 53.51% 54.62% 54.26% 54.12% 53.73% 54.05%
Avista Corporation AVA 50.83% 49.89% 50.75% 50.93% 50.41% 50.56%
Duke Energy Carolinas, LLC DUK 52.11% 51.78% 52.98% 52.81% 58.07% 53.55%
Duke Energy Florida, LLC DUK 49.91% 50.04% 49.25% 50.83% 55.28% 51.06%
Duke Energy Indiana, LLC DUK 52.84% 53.26% 51.94% 51.59% 50.27% 51.98%
Duke Energy Kentucky, Inc. DUK 49.37% 51.95% 53.11% 54.74% 56.11% 53.06%
Duke Energy Ohio, Inc. DUK 65.22% 68.09% 66.24% 66.39% 68.71% 66.93%
Duke Energy Progress, LLC DUK 51.29% 51.00% 52.27% 51.58% 52.40% 51.71%
Piedmont Natural Gas Company, Inc. DUK 49.32% 44.79% 38.72% 42.06% 43.72%
Southern California Edison Company EIX 53.79% 51.34% 57.19% 58.20% 56.29% 55.36%
El Paso Electric Company EE 48.98% 47.88% 49.95% 47.73% 49.86% 48.88%
Entergy Arkansas, LLC ETR 47.90% 49.42% 46.27% 46.54% 45.65% 47.16%
Entergy Louisiana, LLC ETR 47.47% 47.37% 47.43% 47.87% 51.13% 48.25%
Entergy Mississippi, LLC ETR 48.60% 49.11% 48.28% 49.58% 50.08% 49.13%
Entergy New Orleans, LLC ETR 49.26% 51.19% 53.16% 54.81% 60.01% 53.69%
Entergy Texas, Inc. ETR 50.92% 53.46% 50.45% 49.56% 49.96% 50.87%
Cleveland Electric Illuminating Company FE 55.17% 55.44% 55.27% 50.89% 45.10% 52.37%
Jersey Central Power & Light Company FE 68.33% 69.46% 65.30% 59.21% 52.32% 62.92%
Metropolitan Edison Company FE 48.00% 53.21% 52.33% 50.30% 48.43% 50.45%
Monongahela Power Company FE 46.36% 48.87% 49.15% 49.15% 48.89% 48.48%
Ohio Edison Company FE 66.77% 69.93% 64.91% 63.66% 63.58% 65.77%
Pennsylvania Electric Company FE 50.37% 53.89% 52.06% 51.85% 47.70% 51.18%
Pennsylvania Power Company FE 48.79% 49.03% 53.82% 52.06% 58.16% 52.37%
Potomac Edison Company FE 54.31% 52.35% 51.59% 50.08% 51.59% 51.98%
Toledo Edison Company FE 59.74% 60.43% 60.04% 61.98% 60.41% 60.52%
West Penn Power Company FE 47.69% 53.50% 52.82% 52.62% 49.48% 51.22%
Great Plains Energy Incorporated EVRG 50.32% 51.05% 50.15% 51.15% 50.80% 50.70%
Westar Energy (KPL) EVRG 57.97% 59.08% 58.74% 59.68% 62.21% 59.54%
Idaho Power Company IDA 55.14% 54.25% 54.22% 53.15% 52.34% 53.82%
Florida Power & Light Company NEE 60.24% 64.37% 59.93% 62.65% 61.41% 61.72%
Gulf Power Company NEE 50.30% 59.73% 54.19% 58.68% 53.39% 55.26%
Pivotal Utility Holdings, Inc. NEE
Arizona Public Service Company PNW 52.80% 54.36% 53.14% 54.59% 55.50% 54.08%
Public Service Company of New Mexico PNM 45.42% 45.83% 46.26% 46.22% 45.54% 45.85%
Texas-New Mexico Power Company PNM 52.74% 53.79% 56.70% 58.27% 59.35% 56.17%
Portland General Electric Company POR 49.85% 50.19% 49.80% 49.82% 50.61% 50.05%
Alabama Power Company SO 51.90% 48.74% 48.14% 48.07% 47.66% 48.90%
Atlanta Gas Light Company SO 58.77% 54.62% 54.31% 54.46% 55.54%
Chattanooga Gas Company SO 52.54% 52.46% 53.33% 52.34% 52.67%
Georgia Power Company SO 56.12% 59.02% 50.06% 52.22% 51.70% 53.83%
Mississippi Power Company SO 50.84% 50.35% 39.92% 49.90% 48.44% 47.89%
Northern Illinois Gas Company SO 53.19% 53.66% 61.39% 62.31% 57.64%
Virginia Natural Gas, Inc. SO 52.49% 54.18% 51.42% 50.91% 52.25%
Northern States Power Company - MN XEL 52.20% 52.81% 52.38% 52.31% 53.26% 52.59%
Northern States Power Company - WI XEL 54.23% 53.60% 53.36% 54.93% 54.27% 54.08%
EQUITY RATIO - UTILITY OPERATING COMPANIES [2]
Filed: 2020-12-31 EB-2020-0290 Exhibit C1-1-1 Attachment 1
Page 107 of 131

Exhibit 3.1Page 3 of 6
Company Name Ticker 2019 2018 2017 2016 2015 Average
Public Service Company of Colorado XEL 56.32% 56.31% 56.50% 56.32% 56.34% 56.36%
Southwestern Public Service Company XEL 54.14% 54.17% 53.55% 53.93% 53.83% 53.92%
Empire District Electric Company AQN 53.99% 52.25% 51.49% 51.51% 49.95% 51.84%
Empire District Gas Company AQN 38.39% 37.28% 35.66% 33.12% 32.33% 35.35%
Liberty Utilities (CalPeco Electric) LLC AQN 77.00% 77.00%
Liberty Utilities (EnergyNorth Natural Gas) Corp. AQN 54.12% 52.96% 51.47% 63.06% 61.29% 56.58%
Liberty Utilities (Granite State Electric) Corp. AQN 77.03% 76.42% 75.52% 74.62% 73.78% 75.47%
Liberty Utilities (Midstates Natural Gas) Corp AQN 100.00% 100.00% 100.00% 100.00% 100.00% 100.00%
Liberty Utilities (New England Natural Gas Company) Corp. AQN 73.37% 70.67% 67.74% 59.76% 58.06% 65.92%
St. Lawrence Gas Company, Inc. AQN 83.65% 82.81% 81.96% 84.74% 83.29%
New Mexico Gas Company, Inc. EMA 70.77% 70.45% 69.81% 69.82% 70.21%
Peoples Gas System EMA 61.29% 58.39% 60.09% 57.18% 57.07% 58.80%
Tampa Electric Company EMA 55.30% 55.63% 57.40% 55.73% 53.12% 55.44%
Nova Scotia Power EMA 35.17% 30.70% 30.85% 32.38% 31.51% 32.12%
Central Hudson Gas & Electric Corporation FTS 50.84% 50.84% 51.15% 50.58% 51.44% 50.97%
ITC Interconnection LLC FTS 59.21% 60.03% 60.60% 58.06% 59.48%
Tucson Electric Power Company FTS 55.10% 52.80% 53.20% 51.58% 50.20% 52.58%
UNS Electric, Inc. FTS 57.48% 55.84% 54.59% 53.62% 52.56% 54.82%
UNS Gas, Inc. FTS
Fortis Alberta FTS 41.06% 39.86% 40.26% 41.42% 43.59% 41.24%
Fortis BC FTS 51.75% 51.59% 51.40% 54.01% 53.20% 52.39%
Fortis BC Energy (Gas) FTS 51.30% 51.64% 52.85% 54.15% 56.26% 53.24%
Newfoundland Power FTS 48.08% 45.53% 45.55% 46.26% 45.59% 46.20%
Maritime Electric FTS
Notes:
[1] Ratios are weighted by actual common capital and long-term debt of Operating Subsidiaries
[2] Natural Gas and Electric Operating Subsidiaries with data listed as N/A from SNL Financial have been excluded from the analysis.
EQUITY RATIO - UTILITY OPERATING COMPANIES [2]
Filed: 2020-12-31 EB-2020-0290 Exhibit C1-1-1 Attachment 1
Page 108 of 131

Exhibit 3.1Page 4 of 6
Proxy Group Company Ticker 2019 2018 2017 2016 2015 Average
ALLETE, Inc. ALE 40.45% 38.73% 39.85% 42.99% 44.05% 41.21%
Ameren Corporation AEE 47.15% 46.87% 46.95% 47.01% 47.49% 47.10%
American Electric Power Company, Inc. AEP 50.56% 50.80% 50.43% 51.71% 51.94% 51.09%
Avista Corporation AVA 49.17% 50.11% 49.25% 49.07% 49.59% 49.44%
Duke Energy Corporation DUK 47.44% 47.50% 47.45% 47.86% 44.75% 47.00%
Edison International EIX 46.21% 48.66% 42.81% 41.80% 43.71% 44.64%
El Paso Electric Company EE 51.02% 52.12% 50.05% 52.27% 50.14% 51.12%
Entergy Corporation ETR 51.79% 51.15% 52.21% 51.81% 50.13% 51.42%
FirstEnergy Corporation FE 43.68% 41.10% 43.03% 45.41% 48.66% 44.37%
Evergy, Inc. EVRG 45.87% 45.07% 45.78% 44.92% 44.16% 45.16%
IDACORP, Inc. IDA 44.86% 45.75% 45.78% 46.85% 47.66% 46.18%
NextEra Energy, Inc. NEE 40.63% 36.05% 40.59% 37.71% 39.39% 38.87%
Pinnacle West Capital Corporation PNW 47.20% 45.64% 46.86% 45.41% 44.50% 45.92%
PNM Resources, Inc. PNM 52.32% 51.87% 50.97% 50.77% 51.21% 51.43%
Portland General Electric Company POR 50.15% 49.81% 50.20% 50.18% 49.39% 49.95%
Southern Company SO 45.80% 45.28% 50.76% 48.87% 49.42% 48.03%
Xcel Energy Inc. XEL 45.71% 45.52% 45.77% 45.78% 45.41% 45.64%
Algonquin Power & Utilities Corp AQN 42.20% 41.08% 44.48% 43.85% 45.42% 43.41%
Emera Inc. EMA 51.94% 51.56% 50.78% 51.34% 53.08% 51.74%
Fortis Inc. FTS 50.12% 51.02% 50.50% 49.87% 49.14% 50.13%
MEAN 47.21% 46.78% 47.23% 47.27% 47.46% 47.19%
LOW 40.45% 36.05% 39.85% 37.71% 39.39% 38.87%
HIGH 52.32% 52.12% 52.21% 52.27% 53.08% 51.74%
CAPITAL STRUCTURE ANALYSIS - CONCENTRIC PROXY GROUP
LONG-TERM DEBT RATIO [1]
Filed: 2020-12-31 EB-2020-0290 Exhibit C1-1-1 Attachment 1
Page 109 of 131

Exhibit 3.1Page 5 of 6
Company Name Ticker 2019 2018 2017 2016 2015 Average
ALLETE (Minnesota Power) ALE 40.41% 38.61% 39.96% 43.08% 44.14% 41.24%
Superior Water, Light and Power Company ALE 41.92% 43.14% 35.01% 38.88% 39.77% 39.74%
Ameren Illinois Company AEE 46.63% 46.73% 46.15% 46.05% 46.04% 46.32%
Union Electric Company AEE 47.64% 47.00% 47.58% 47.70% 48.47% 47.68%
AEP Texas Central Company AEP 53.99% 56.37% 55.18%
AEP Texas North Company AEP 56.71% 57.64% 57.18%
Appalachian Power Company AEP 51.26% 50.49% 51.28% 53.11% 53.23% 51.87%
Indiana Michigan Power Company AEP 53.26% 55.38% 53.67% 50.89% 47.35% 52.11%
Kentucky Power Company AEP 52.66% 54.28% 56.48% 56.55% 56.74% 55.34%
Kingsport Power Company AEP 45.38% 49.21% 53.47% 34.76% 40.30% 44.62%
Ohio Power Company AEP 45.50% 42.20% 41.37% 43.49% 49.91% 44.49%
Public Service Company of Oklahoma AEP 50.31% 50.84% 51.50% 51.53% 53.55% 51.54%
Southwestern Electric Power Company AEP 51.20% 53.03% 51.48% 54.05% 50.41% 52.03%
Transource Maryland, LLC AEP 59.82% 58.19% 59.01%
Transource Pennsylvania, LLC AEP 59.85% 58.08% 58.97%
Wheeling Power Company AEP 46.49% 45.38% 45.74% 45.88% 46.27% 45.95%
Avista Corporation AVA 49.17% 50.11% 49.25% 49.07% 49.59% 49.44%
Duke Energy Carolinas, LLC DUK 47.89% 48.22% 47.02% 47.19% 41.93% 46.45%
Duke Energy Florida, LLC DUK 50.09% 49.96% 50.75% 49.17% 44.72% 48.94%
Duke Energy Indiana, LLC DUK 47.16% 46.74% 48.06% 48.41% 49.73% 48.02%
Duke Energy Kentucky, Inc. DUK 50.63% 48.05% 46.89% 45.26% 43.89% 46.94%
Duke Energy Ohio, Inc. DUK 34.78% 31.91% 33.76% 33.61% 31.29% 33.07%
Duke Energy Progress, LLC DUK 48.71% 49.00% 47.73% 48.42% 47.60% 48.29%
Piedmont Natural Gas Company, Inc. DUK 50.68% 55.21% 61.28% 57.94% 56.28%
Southern California Edison Company EIX 46.21% 48.66% 42.81% 41.80% 43.71% 44.64%
El Paso Electric Company EE 51.02% 52.12% 50.05% 52.27% 50.14% 51.12%
Entergy Arkansas, LLC ETR 52.10% 50.58% 53.73% 53.46% 54.35% 52.84%
Entergy Louisiana, LLC ETR 52.53% 52.63% 52.57% 52.13% 48.87% 51.75%
Entergy Mississippi, LLC ETR 51.40% 50.89% 51.72% 50.42% 49.92% 50.87%
Entergy New Orleans, LLC ETR 50.74% 48.81% 46.84% 45.19% 39.99% 46.31%
Entergy Texas, Inc. ETR 49.08% 46.54% 49.55% 50.44% 50.04% 49.13%
Cleveland Electric Illuminating Company FE 44.83% 44.56% 44.73% 49.11% 54.90% 47.63%
Jersey Central Power & Light Company FE 31.67% 30.54% 34.70% 40.79% 47.68% 37.08%
Metropolitan Edison Company FE 52.00% 46.79% 47.67% 49.70% 51.57% 49.55%
Monongahela Power Company FE 53.64% 51.13% 50.85% 50.85% 51.11% 51.52%
Ohio Edison Company FE 33.23% 30.07% 35.09% 36.34% 36.42% 34.23%
Pennsylvania Electric Company FE 49.63% 46.11% 47.94% 48.15% 52.30% 48.82%
Pennsylvania Power Company FE 51.21% 50.97% 46.18% 47.94% 41.84% 47.63%
Potomac Edison Company FE 45.69% 47.65% 48.41% 49.92% 48.41% 48.02%
Toledo Edison Company FE 40.26% 39.57% 39.96% 38.02% 39.59% 39.48%
West Penn Power Company FE 52.31% 46.50% 47.18% 47.38% 50.52% 48.78%
Great Plains Energy Incorporated EVRG 49.68% 48.95% 49.85% 48.85% 49.20% 49.30%
Westar Energy (KPL) EVRG 42.03% 40.92% 41.26% 40.32% 37.79% 40.46%
Idaho Power Company IDA 44.86% 45.75% 45.78% 46.85% 47.66% 46.18%
Florida Power & Light Company NEE 39.76% 35.63% 40.07% 37.35% 38.59% 38.28%
Gulf Power Company NEE 49.70% 40.27% 45.81% 41.32% 46.61% 44.74%
Pivotal Utility Holdings, Inc. NEE
Arizona Public Service Company PNW 47.20% 45.64% 46.86% 45.41% 44.50% 45.92%
Public Service Company of New Mexico PNM 54.58% 54.17% 53.74% 53.78% 54.46% 54.15%
Texas-New Mexico Power Company PNM 47.26% 46.21% 43.30% 41.73% 40.65% 43.83%
Portland General Electric Company POR 50.15% 49.81% 50.20% 50.18% 49.39% 49.95%
Alabama Power Company SO 48.10% 51.26% 51.86% 51.93% 52.34% 51.10%
Atlanta Gas Light Company SO 41.23% 45.38% 45.69% 45.54% 44.46%
Chattanooga Gas Company SO 47.46% 47.54% 46.67% 47.66% 47.33%
Georgia Power Company SO 43.88% 40.98% 49.94% 47.78% 48.30% 46.17%
Mississippi Power Company SO 49.16% 49.65% 60.08% 50.10% 51.56% 52.11%
Northern Illinois Gas Company SO 46.81% 46.34% 38.61% 37.69% 42.36%
Virginia Natural Gas, Inc. SO 47.51% 45.82% 48.58% 49.09% 47.75%
Northern States Power Company - MN XEL 47.80% 47.19% 47.62% 47.69% 46.74% 47.41%
Northern States Power Company - WI XEL 45.77% 46.40% 46.64% 45.07% 45.73% 45.92%
LONG-TERM DEBT RATIO - UTILITY OPERATING COMPANIES [2]
Filed: 2020-12-31 EB-2020-0290 Exhibit C1-1-1 Attachment 1
Page 110 of 131

Exhibit 3.1Page 6 of 6
Company Name Ticker 2019 2018 2017 2016 2015 Average
Public Service Company of Colorado XEL 43.68% 43.69% 43.50% 43.68% 43.66% 43.64%
Southwestern Public Service Company XEL 45.86% 45.83% 46.45% 46.07% 46.17% 46.08%
Empire District Electric Company AQN 46.01% 47.75% 48.51% 48.49% 50.05% 48.16%
Empire District Gas Company AQN 61.61% 62.72% 64.34% 66.88% 67.67% 64.65%
Liberty Utilities (CalPeco Electric) LLC AQN 23.00% 23.00%
Liberty Utilities (EnergyNorth Natural Gas) Corp. AQN 45.88% 47.04% 48.53% 36.94% 38.71% 43.42%
Liberty Utilities (Granite State Electric) Corp. AQN 22.97% 23.58% 24.48% 25.38% 26.22% 24.53%
Liberty Utilities (Midstates Natural Gas) Corp AQN 0.00% 0.00% 0.00% 0.00% 0.00% 0.00%
Liberty Utilities (New England Natural Gas Company) Corp. AQN 26.63% 29.33% 32.26% 40.24% 41.94% 34.08%
St. Lawrence Gas Company, Inc. AQN 16.35% 17.19% 18.04% 15.26% 16.71%
New Mexico Gas Company, Inc. EMA 29.23% 29.55% 30.19% 30.18% 29.79%
Peoples Gas System EMA 38.71% 41.61% 39.91% 42.82% 42.93% 41.20%
Tampa Electric Company EMA 44.70% 44.37% 42.60% 44.27% 46.88% 44.56%
Nova Scotia Power EMA 64.83% 69.30% 69.15% 67.62% 68.49% 67.88%
Central Hudson Gas & Electric Corporation FTS 49.16% 49.16% 48.85% 49.42% 48.56% 49.03%
ITC Interconnection LLC FTS 40.79% 39.97% 39.40% 41.94% 40.52%
Tucson Electric Power Company FTS 44.90% 47.20% 46.80% 48.42% 49.80% 47.42%
UNS Electric, Inc. FTS 42.52% 44.16% 45.41% 46.38% 47.44% 45.18%
UNS Gas, Inc. FTS
Fortis Alberta FTS 58.94% 60.14% 59.74% 58.58% 56.41% 58.76%
Fortis BC FTS 48.25% 48.41% 48.60% 45.99% 46.80% 47.61%
Fortis BC Energy (Gas) FTS 48.70% 48.36% 47.15% 45.85% 43.74% 46.76%
Newfoundland Power FTS 51.92% 54.47% 54.45% 53.74% 54.41% 53.80%
Maritime Electric FTS
Notes:
[1] Ratios are weighted by actual common capital and long-term debt of Operating Subsidiaries
[2] Natural Gas and Electric Operating Subsidiaries with data listed as N/A from SNL Financial have been excluded from the analysis.
LONG-TERM DEBT RATIO - UTILITY OPERATING COMPANIES [2]
Filed: 2020-12-31 EB-2020-0290 Exhibit C1-1-1 Attachment 1
Page 111 of 131

Exhibit 3.2Page 1 of 2
Proxy Group Company Ticker 2019 2018 2017 2016 2015 Average
Public Service Enterprise Group, Inc. PEG 54.72% 54.24% 53.41% 52.74% 52.65% 53.55%
NextEra Energy, Inc. NEE 59.37% 63.95% 59.41% 62.29% 60.61% 61.13%
Exelon Corporation EXC 53.13% 53.31% 53.38% 52.99% 52.47% 53.06%
MEAN 55.74% 57.17% 55.40% 56.01% 55.24% 55.91%
LOW 53.13% 53.31% 53.38% 52.74% 52.47% 53.06%
HIGH 59.37% 63.95% 59.41% 62.29% 60.61% 61.13%
Company Name Ticker 2019 2018 2017 2016 2015 Average
Public Service Electric and Gas Company PEG 54.72% 54.24% 53.41% 52.74% 52.65% 53.55%
Florida Power & Light Company NEE 60.24% 64.37% 59.93% 62.65% 61.41% 61.72%
Gulf Power Company NEE 50.30% 59.73% 54.19% 58.68% 53.39% 55.26%
Pivotal Utility Holdings, Inc. NEE
Atlantic City Electric Company EXC 49.29% 49.14% 49.19% 48.37% 47.04% 48.61%
Baltimore Gas and Electric Company EXC 52.80% 53.67% 54.77% 52.54% 57.75% 54.31%
Commonwealth Edison Company EXC 54.94% 55.06% 54.85% 54.52% 54.99% 54.87%
Delmarva Power & Light Company EXC 50.12% 49.98% 50.38% 49.43% 49.05% 49.79%
PECO Energy Co. EXC 53.62% 53.72% 53.54% 55.13% 53.80% 53.96%
Pepco Holdings LLC EXC 48.56% 48.56%
Potomac Electric Power Company EXC 50.16% 50.01% 49.89% 49.57% 49.00% 49.72%
Notes:
[1] Ratios are weighted by actual common capital and long-term debt of Operating Subsidiaries
[2] Natural Gas and Electric Operating Subsidiaries with data listed as N/A from SNL Financial have been excluded from the analysis.
EQUITY RATIO - UTILITY OPERATING COMPANIES [2]
CAPITAL STRUCTURE ANALYSIS - MOODY'S PROXY GROUP
EQUITY RATIO [1]
Filed: 2020-12-31 EB-2020-0290 Exhibit C1-1-1 Attachment 1
Page 112 of 131

Exhibit 3.2Page 2 of 2
Proxy Group Company Ticker 2019 2018 2017 2016 2015 Average
Public Service Enterprise Group, Inc. PEG 45.28% 45.76% 46.59% 47.26% 47.35% 46.45%
NextEra Energy, Inc. NEE 40.63% 36.05% 40.59% 37.71% 39.39% 38.87%
Exelon Corporation EXC 46.87% 46.69% 46.62% 47.01% 47.53% 46.94%
MEAN 44.26% 42.83% 44.60% 43.99% 44.76% 44.09%
LOW 40.63% 36.05% 40.59% 37.71% 39.39% 38.87%
HIGH 46.87% 46.69% 46.62% 47.26% 47.53% 46.94%
Company Name Ticker 2019 2018 2017 2016 2015 Average
Public Service Electric and Gas Company PEG 45.28% 45.76% 46.59% 47.26% 47.35% 46.45%
Florida Power & Light Company NEE 39.76% 35.63% 40.07% 37.35% 38.59% 38.28%
Gulf Power Company NEE 49.70% 40.27% 45.81% 41.32% 46.61% 44.74%
Pivotal Utility Holdings, Inc. NEE
Atlantic City Electric Company EXC 50.71% 50.86% 50.81% 51.63% 52.96% 51.39%
Baltimore Gas and Electric Company EXC 47.20% 46.33% 45.23% 47.46% 42.25% 45.69%
Commonwealth Edison Company EXC 45.06% 44.94% 45.15% 45.48% 45.01% 45.13%
Delmarva Power & Light Company EXC 49.88% 50.02% 49.62% 50.57% 50.95% 50.21%
PECO Energy Co. EXC 46.38% 46.28% 46.46% 44.87% 46.20% 46.04%
Pepco Holdings LLC EXC 51.44% 51.44%
Potomac Electric Power Company EXC 49.84% 49.99% 50.11% 50.43% 51.00% 50.28%
Notes:
[1] Ratios are weighted by actual common capital and long-term debt of Operating Subsidiaries
[2] Natural Gas and Electric Operating Subsidiaries with data listed as N/A from SNL Financial have been excluded from the analysis.
LONG-TERM DEBT RATIO - UTILITY OPERATING COMPANIES [2]
CAPITAL STRUCTURE ANALYSIS - MOODY'S PROXY GROUP
LONG-TERM DEBT RATIO [1]
Filed: 2020-12-31 EB-2020-0290 Exhibit C1-1-1 Attachment 1
Page 113 of 131

Exhibit 4.1
Page 1 of 2
Proxy Group Company Ticker 2015 2016 2017 2018 2019 Average
ALLETE, Inc. ALE 53.70% 58.00% 59.00% 60.10% 61.40% 58.44%
Ameren Corporation AEE 49.70% 51.30% 49.80% 48.80% 47.10% 49.34%
American Electric Power Company, Inc. AEP 50.20% 50.00% 48.50% 46.80% 43.90% 47.88%
Avista Corporation AVA 50.00% 48.80% 52.80% 49.50% 50.60% 50.34%
Duke Energy Corporation DUK 51.40% 47.40% 46.00% 46.20% 44.10% 47.02%
Edison International EIX 46.70% 49.20% 45.80% 38.30% 39.90% 43.98%
El Paso Electric Company EE 47.30% 47.30% 48.80% 47.50% 47.60% 47.70%
Entergy Corporation ETR 40.80% 35.50% 35.50% 35.90% 37.10% 36.96%
FirstEnergy Corporation FE 39.30% 25.50% 15.70% 27.40% 26.20% 26.82%
Evergy, Inc. EVRG N/A N/A N/A 60.00% 49.40% 54.70%
IDACORP, Inc. IDA 54.40% 55.20% 56.30% 56.40% 58.70% 56.20%
NextEra Energy, Inc. NEE 45.80% 46.70% 47.30% 56.00% 49.60% 49.08%
Pinnacle West Capital Corporation PNW 57.00% 54.40% 51.10% 53.00% 52.90% 53.68%
PNM Resources, Inc. PNM 45.50% 44.00% 43.60% 38.60% 39.90% 42.32%
Portland General Electric Company POR 52.20% 51.60% 49.90% 53.50% 48.70% 51.18%
Southern Company SO 44.00% 35.70% 35.00% 37.60% 39.50% 38.36%
Xcel Energy Inc. XEL 45.90% 43.70% 44.10% 43.60% 43.20% 44.10%
Algonquin Power & Utilities Corp [2] AQN 45.55% 26.72% 39.58% 42.55% 44.26% 39.73%
Emera Inc. EMA 52.83% 31.97% 35.04% 36.79% 38.51% 39.03%
Fortis Inc. FTS 38.10% 36.20% 37.10% 37.20% 41.80% 38.08%
MEAN 47.91% 44.17% 44.26% 45.79% 45.22% 45.75%
LOW 38.10% 25.50% 15.70% 27.40% 26.20% 26.82%
HIGH 57.00% 58.00% 59.00% 60.10% 61.40% 58.44%
[1] Data per Value Line Investment Survey
[2] Calculated per Annual Reports, excludes preferred equity & non-controlling interests
CAPITAL STRUCTURE ANALYSIS - CONCENTRIC PROXY GROUP
COMMON EQUITY RATIO [1]
Filed: 2020-12-31 EB-2020-0290 Exhibit C1-1-1 Attachment 1
Page 114 of 131

Exhibit 4.1
Page 2 of 2
Proxy Group Company Ticker 2015 2016 2017 2018 2019 Average
ALLETE, Inc. ALE 46.30% 42.00% 41.00% 39.90% 38.60% 41.56%
Ameren Corporation AEE 49.30% 47.70% 49.20% 50.30% 52.10% 49.72%
American Electric Power Company, Inc. AEP 49.80% 50.00% 51.50% 53.20% 56.10% 52.12%
Avista Corporation AVA 50.00% 51.20% 47.20% 50.50% 49.40% 49.66%
Duke Energy Corporation DUK 48.60% 52.60% 54.00% 53.80% 54.00% 52.60%
Edison International EIX 45.00% 41.80% 45.60% 53.60% 53.50% 47.90%
El Paso Electric Company EE 52.70% 52.70% 51.20% 52.50% 52.40% 52.30%
Entergy Corporation ETR 57.80% 63.60% 63.60% 63.20% 62.00% 62.04%
FirstEnergy Corporation FE 60.70% 74.50% 84.30% 72.30% 73.80% 73.12%
Evergy, Inc. EVRG N/A N/A N/A 40.00% 50.60% 45.30%
IDACORP, Inc. IDA 45.60% 44.80% 43.70% 43.60% 41.30% 43.80%
NextEra Energy, Inc. NEE 54.20% 53.30% 52.70% 44.00% 50.40% 50.92%
Pinnacle West Capital Corporation PNW 43.00% 45.60% 48.90% 47.00% 47.10% 46.32%
PNM Resources, Inc. PNM 54.10% 55.70% 56.10% 61.10% 59.80% 57.36%
Portland General Electric Company POR 47.80% 48.40% 50.10% 46.50% 51.30% 48.82%
Southern Company SO 52.80% 61.50% 64.50% 62.00% 60.10% 60.18%
Xcel Energy Inc. XEL 54.10% 56.30% 55.90% 56.40% 56.80% 55.90%
Algonquin Power & Utilities Corp [2] AQN 39.35% 61.15% 48.12% 47.44% 47.15% 48.64%
Emera Inc. EMA 47.17% 68.03% 64.96% 63.21% 61.49% 60.97%
Fortis Inc. FTS 53.30% 59.30% 58.40% 58.80% 54.20% 56.80%
MEAN 50.09% 54.22% 54.26% 52.97% 53.61% 52.80%
LOW 39.35% 41.80% 41.00% 39.90% 38.60% 41.56%
HIGH 60.70% 74.50% 84.30% 72.30% 73.80% 73.12%
[1] Data per Value Line Investment Survey
[2] Calculated per Annual Reports
CAPITAL STRUCTURE ANALYSIS - CONCENTRIC PROXY GROUP
LONG-TERM DEBT RATIO [1]
Filed: 2020-12-31 EB-2020-0290 Exhibit C1-1-1 Attachment 1
Page 115 of 131

Exhibit 4.2
Page 1 of 2
Proxy Group Company Ticker 2015 2016 2017 2018 2019 Average
Public Service Enterprise Group, Inc. PEG 59.70% 54.70% 53.40% 52.20% 52.30% 54.46%
NextEra Energy, Inc. NEE 45.80% 46.70% 47.30% 56.00% 49.60% 49.08%
Exelon Corporation EXC 51.30% 44.50% 47.80% 47.20% 50.40% 48.24%
MEAN 52.27% 48.63% 49.50% 51.80% 50.77% 50.59%
LOW 45.80% 44.50% 47.30% 47.20% 49.60% 48.24%
HIGH 59.70% 54.70% 53.40% 56.00% 52.30% 54.46%
Notes:
[1] Data per Value Line Investment Survey
CAPITAL STRUCTURE ANALYSIS - MOODY'S PROXY GROUP
COMMON EQUITY RATIO [1]
Filed: 2020-12-31 EB-2020-0290 Exhibit C1-1-1 Attachment 1
Page 116 of 131
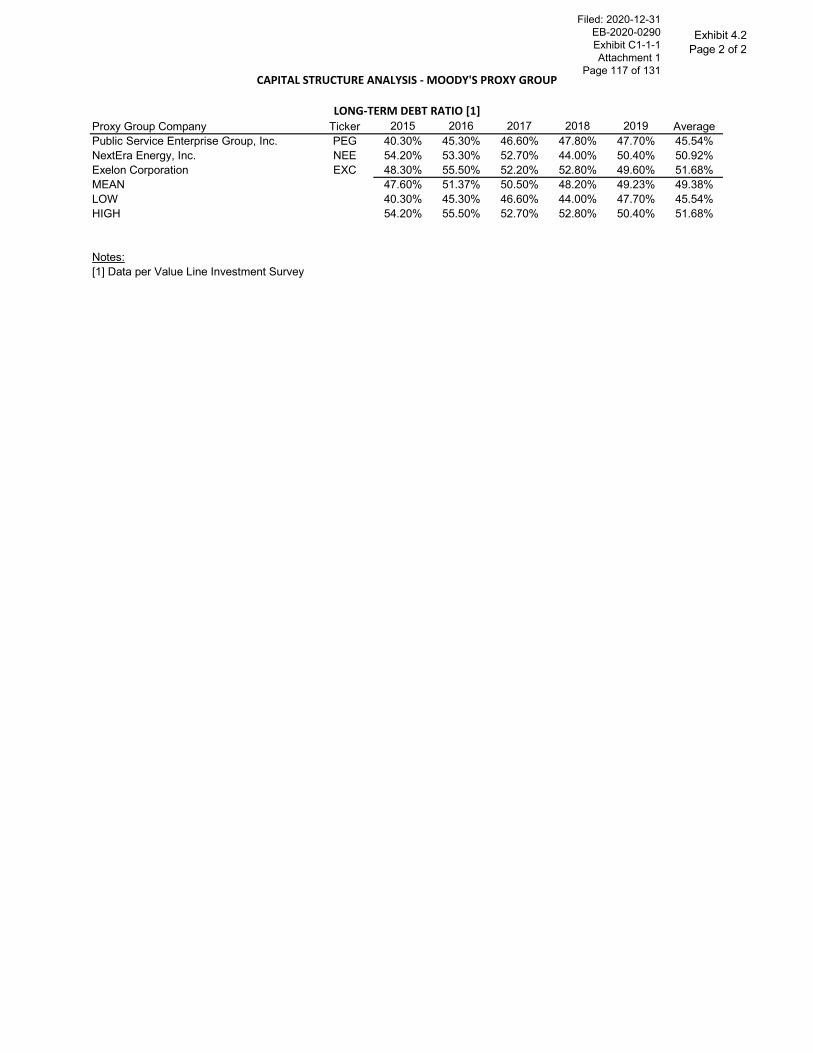
Exhibit 4.2
Page 2 of 2
Proxy Group Company Ticker 2015 2016 2017 2018 2019 Average
Public Service Enterprise Group, Inc. PEG 40.30% 45.30% 46.60% 47.80% 47.70% 45.54%
NextEra Energy, Inc. NEE 54.20% 53.30% 52.70% 44.00% 50.40% 50.92%
Exelon Corporation EXC 48.30% 55.50% 52.20% 52.80% 49.60% 51.68%
MEAN 47.60% 51.37% 50.50% 48.20% 49.23% 49.38%
LOW 40.30% 45.30% 46.60% 44.00% 47.70% 45.54%
HIGH 54.20% 55.50% 52.70% 52.80% 50.40% 51.68%
Notes:
[1] Data per Value Line Investment Survey
CAPITAL STRUCTURE ANALYSIS - MOODY'S PROXY GROUP
LONG-TERM DEBT RATIO [1]
Filed: 2020-12-31 EB-2020-0290 Exhibit C1-1-1 Attachment 1
Page 117 of 131

Exhibit 5.1
Page 1 of 10
[1] [2] [3] [4]
Proxy Group Company Ticker Operating Subsidiary Type Credit Rating Jurisdiction S&P Regulatory Assessment Test Year
ALLETE, Inc. ALE Minnesota Power Electric BBB Minnesota Highly Credit Supportive (strong/adequate) Fully Forecast
Ameren Corporation AEE Ameren Illinois Co. Electric BBB+ Illinois Very Credit Supportive (strong/adequate) Historical
AEE Ameren Illinois Co. Gas BBB+ Illinois Very Credit Supportive (strong/adequate) Fully Forecast
AEE Union Electric Co. Electric BBB+ Missouri Very Credit Supportive (strong/adequate) Historical
AEE Union Electric Co. Gas BBB+ Missouri Very Credit Supportive (strong/adequate) Historical
American Electric Power Company, Inc. AEP Southwestern Electric Power Co. Electric A- Arkansas Highly Credit Supportive (strong/adequate) Partially Forecast
AEP Indiana Michigan Power Co. Electric A- Indiana Highly Credit Supportive (strong/adequate) Fully Forecast
AEP Kentucky Power Co. Electric A- Kentucky Most Credit Supportive (strong) Fully Forecast
AEP Southwestern Electric Power Co. Electric A- Louisiana Highly Credit Supportive (strong/adequate) Historical
AEP Indiana Michigan Power Co. Electric A- Michigan Most Credit Supportive (strong) Fully Forecast
AEP Ohio Power Co. Electric A- Ohio Very Credit Supportive (strong/adequate) Partially Forecast
AEP Public Service Co. of Oklahoma Electric A- Oklahoma More Credit Supportive (strong/adequate) Historical
AEP Kingsport Power Co. Electric A- Tennessee Highly Credit Supportive (strong/adequate) Fully Forecast
AEP AEP Texas Electric A- Texas Very Credit Supportive (strong/adequate) Historical
AEP Southwestern Electric Power Co. Electric A- Texas Very Credit Supportive (strong/adequate) Historical
AEP Appalachian Power Co. Electric A- Virginia Highly Credit Supportive (strong/adequate) Historical
AEP Appalachian Power Co. Electric A- West Virginia Very Credit Supportive (strong/adequate) Historical
Avista Corporation AVA Alaska Electric Light & Power Electric BBB Alaska More Credit Supportive (strong/adequate) Historical
AVA Avista Corp. Electric BBB Idaho Very Credit Supportive (strong/adequate) Historical
AVA Avista Corp. Gas BBB Idaho Very Credit Supportive (strong/adequate) Historical
AVA Avista Corp. Gas BBB Oregon Highly Credit Supportive (strong/adequate) Fully Forecast
AVA Avista Corp. Electric BBB Washington More Credit Supportive (strong/adequate) Historical
AVA Avista Corp. Gas BBB Washington More Credit Supportive (strong/adequate) Historical
Duke Energy Corporation DUK Duke Energy Florida LLC Electric A- Florida Most Credit Supportive (strong) Fully Forecast
DUK Duke Energy Indiana LLC Electric A- Indiana Highly Credit Supportive (strong/adequate) Historical
DUK Duke Energy Kentucky Inc. Electric A- Kentucky Most Credit Supportive (strong) Fully Forecast
DUK Duke Energy Kentucky Inc. Gas A- Kentucky Most Credit Supportive (strong) Fully Forecast
DUK Duke Energy Carolinas LLC Electric A- North Carolina Most Credit Supportive (strong) Historical
DUK Duke Energy Progress LLC Electric A- North Carolina Most Credit Supportive (strong) Historical
DUK Piedmont Natural Gas Co. Inc. Gas A- North Carolina Most Credit Supportive (strong) Historical
DUK Duke Energy Ohio Inc. Electric A- Ohio Very Credit Supportive (strong/adequate) Partially Forecast
DUK Duke Energy Ohio Inc. Gas A- Ohio [6] Very Credit Supportive (strong/adequate) Partially Forecast
DUK Duke Energy Progress LLC Electric A- South Carolina More Credit Supportive (strong/adequate) Historical
DUK Duke Energy Carolinas LLC Electric A- South Carolina More Credit Supportive (strong/adequate) Historical
DUK Piedmont Natural Gas Co. Inc. Gas A- South Carolina More Credit Supportive (strong/adequate) Historical
DUK Piedmont Natural Gas Co. Inc. Gas A- Tennessee Highly Credit Supportive (strong/adequate) Fully Forecast
RISK ASSESSMENT: Concentric Proxy Group
Filed: 2020-12-31 EB-2020-0290 Exhibit C1-1-1 Attachment 1
Page 118 of 131

Exhibit 5.1
Page 2 of 10
Proxy Group Company Ticker Operating Subsidiary
ALLETE, Inc. ALE Minnesota Power
Ameren Corporation AEE Ameren Illinois Co.
AEE Ameren Illinois Co.
AEE Union Electric Co.
AEE Union Electric Co.
American Electric Power Company, Inc. AEP Southwestern Electric Power Co.
AEP Indiana Michigan Power Co.
AEP Kentucky Power Co.
AEP Southwestern Electric Power Co.
AEP Indiana Michigan Power Co.
AEP Ohio Power Co.
AEP Public Service Co. of Oklahoma
AEP Kingsport Power Co.
AEP AEP Texas
AEP Southwestern Electric Power Co.
AEP Appalachian Power Co.
AEP Appalachian Power Co.
Avista Corporation AVA Alaska Electric Light & Power
AVA Avista Corp.
AVA Avista Corp.
AVA Avista Corp.
AVA Avista Corp.
AVA Avista Corp.
Duke Energy Corporation DUK Duke Energy Florida LLC
DUK Duke Energy Indiana LLC
DUK Duke Energy Kentucky Inc.
DUK Duke Energy Kentucky Inc.
DUK Duke Energy Carolinas LLC
DUK Duke Energy Progress LLC
DUK Piedmont Natural Gas Co. Inc.
DUK Duke Energy Ohio Inc.
DUK Duke Energy Ohio Inc.
DUK Duke Energy Progress LLC
DUK Duke Energy Carolinas LLC
DUK Piedmont Natural Gas Co. Inc.
DUK Piedmont Natural Gas Co. Inc.
[5] [5] [5] [5] [5] [5] [5] [5] [5] [5]
Electric fuel/gas
commodity/purch.
power
Conserv. program
expenseFull Decoupling
Partial
Decoupling
Renewables
expense
Environmental
compliance
Generation
capacity
Generic
infrastructure
Transmission
expenseOther
NA
NA
NA
NA
RISK ASSESSMENT: Concentric Proxy Group
Filed: 2020-12-31 EB-2020-0290 Exhibit C1-1-1 Attachment 1
Page 119 of 131

Exhibit 5.1
Page 3 of 10
Proxy Group Company Ticker Operating Subsidiary
ALLETE, Inc. ALE Minnesota Power
Ameren Corporation AEE Ameren Illinois Co.
AEE Ameren Illinois Co.
AEE Union Electric Co.
AEE Union Electric Co.
American Electric Power Company, Inc. AEP Southwestern Electric Power Co.
AEP Indiana Michigan Power Co.
AEP Kentucky Power Co.
AEP Southwestern Electric Power Co.
AEP Indiana Michigan Power Co.
AEP Ohio Power Co.
AEP Public Service Co. of Oklahoma
AEP Kingsport Power Co.
AEP AEP Texas
AEP Southwestern Electric Power Co.
AEP Appalachian Power Co.
AEP Appalachian Power Co.
Avista Corporation AVA Alaska Electric Light & Power
AVA Avista Corp.
AVA Avista Corp.
AVA Avista Corp.
AVA Avista Corp.
AVA Avista Corp.
Duke Energy Corporation DUK Duke Energy Florida LLC
DUK Duke Energy Indiana LLC
DUK Duke Energy Kentucky Inc.
DUK Duke Energy Kentucky Inc.
DUK Duke Energy Carolinas LLC
DUK Duke Energy Progress LLC
DUK Piedmont Natural Gas Co. Inc.
DUK Duke Energy Ohio Inc.
DUK Duke Energy Ohio Inc.
DUK Duke Energy Progress LLC
DUK Duke Energy Carolinas LLC
DUK Piedmont Natural Gas Co. Inc.
DUK Piedmont Natural Gas Co. Inc.
RISK ASSESSMENT: Concentric Proxy Group
[5]
Other: Text
Certain hazardous materials litigation, bad-debt costs, and taxes recoverableCertain hazardous materials litigation, bad-debt costs, and taxes recoverableRenewable energy standard compliance costs, emission allowance costs, government-mandated
investments, and certain taxes recoverableRenewable energy standard compliance costs, emission allowance costs, government-mandated
investments, and certain taxes recoverableCertain taxes recoverableRegulatory mechanisms allow sharing of off system sales marginsRegulatory mechanisms allow sharing of off system sales margins; Certain taxes recoverableRegulatory mechanisms allow sharing of off system sales margins; Economic development ridersEconomic development riderCertain bad-debt costs and taxes recoverableRegulatory mechanisms allow sharing of off system sales margins; Certain taxes recoverable
Certain taxes recoverableCertain taxes recoverable
Certain taxes and storm costs recoverableRegulatory mechanisms allow sharing of off system sales margins
Regulatory mechanisms allow sharing of off system sales margins; Certain taxes recoverable
Regulatory mechanisms allow sharing of off system sales margins; Certain taxes recoverable
Incremental vegetation management costs, certain taxes and bad-debt costs recoverableCertain taxes and bad-debt costs recoverable
Riders related to capacity management and release, off-system sales, and capacity assignment;
Margin losses from bypassable customers recoverable
Filed: 2020-12-31 EB-2020-0290 Exhibit C1-1-1 Attachment 1
Page 120 of 131

Exhibit 5.1
Page 4 of 10
[1] [2] [3] [4]
Proxy Group Company Ticker Operating Subsidiary Type Credit Rating Jurisdiction S&P Regulatory Assessment Test Year
RISK ASSESSMENT: Concentric Proxy Group
Edison International EIX Southern California Edison Co. Electric BBB California More Credit Supportive (strong/adequate) Fully Forecast
El Paso EE El Paso Electric Co. Electric BBB New Mexico Credit Supportive (adequate) Historical
EE El Paso Electric Co. Electric BBB Texas Very Credit Supportive (strong/adequate) Historical
Entergy Corporation ETR Entergy Arkansas LLC Electric A- Arkansas Highly Credit Supportive (strong/adequate) Fully Forecast
ETR Entergy New Orleans LLC Electric BBB+ Louisiana NOCC Highly Credit Supportive (strong/adequate) Historical
ETR Entergy New Orleans LLC Gas BBB+ Louisiana NOCC Highly Credit Supportive (strong/adequate) Historical
ETR Entergy Louisiana LLC Electric A- Louisiana PSC Highly Credit Supportive (strong/adequate) Historical
ETR Entergy Louisiana LLC Gas A- Louisiana PSC Highly Credit Supportive (strong/adequate) Historical
ETR Entergy Mississippi Electric A- Mississippi Credit Supportive (adequate) Fully Forecast
ETR Entergy Texas Inc. Electric BBB+ Texas Very Credit Supportive (strong/adequate) Historical
FirstEnergy Corp. FE Potomac Edison Co. Electric BBB Maryland More Credit Supportive (strong/adequate) Partially Forecast
FE Jersey Central Power & Light Co. Electric BBB New Jersey More Credit Supportive (strong/adequate) Partially Forecast
FE Cleveland Electric Illuminating Electric BBB Ohio Very Credit Supportive (strong/adequate) Partially Forecast
FE Metropolitan Edison Co Electric BBB Pennsylvania Highly Credit Supportive (strong/adequate) Fully Forecast
FE Pennsylvania Electric Co. Electric BBB Pennsylvania Highly Credit Supportive (strong/adequate) Fully Forecast
FE Pennsylvania Power Co. Electric BBB Pennsylvania Highly Credit Supportive (strong/adequate) Fully Forecast
FE West Penn Power Co. Electric BBB Pennsylvania Highly Credit Supportive (strong/adequate) Fully Forecast
FE Monongahela Power Co. Electric BBB West Virginia Very Credit Supportive (strong/adequate) Historical
FE Potomac Edison Co. Electric BBB West Virginia Very Credit Supportive (strong/adequate) Historical
Evergy, Inc. EVRG Evergy Kansas Central Inc. Electric A- Kansas Highly Credit Supportive (strong/adequate) Historical
EVRG Evergy Kansas South Inc. Electric A- Kansas Highly Credit Supportive (strong/adequate) Historical
EVRG Evergy Metro Inc. Electric A Kansas Highly Credit Supportive (strong/adequate) Historical
EVRG Evergy Metro Inc. Electric A Missouri Very Credit Supportive (strong/adequate) Historical
EVRG Evergy Missouri West Inc. Electric A- Missouri Very Credit Supportive (strong/adequate) HistoricalIDACORP, Inc. IDA Idaho Power Co. Electric BBB Idaho Very Credit Supportive (strong/adequate) Partially Forecast
IDA Idaho Power Co. Electric BBB Oregon Highly Credit Supportive (strong/adequate) Partially Forecast
NextEra Energy, Inc. NEE Florida Power & Light Co. Electric A Florida Most Credit Supportive (strong) Fully Forecast
NEE Gulf Power CO. Electric A- Florida Most Credit Supportive (strong) Fully Forecast
NEE Pivotal Utility Holdings Inc. Gas A- Florida Most Credit Supportive (strong) Fully ForecastNEE Lone Star Transmission LLC Electric A- Texas Very Credit Supportive (strong/adequate) Historical
Pinnacle West Capital Corporation PNW Arizona Public Service Co. Electric A- Arizona More Credit Supportive (strong/adequate) Historical
PNM Resources, Inc. PNM Public Service Co. of New Mexico Electric BBB New Mexico Credit Supportive (adequate) Fully Forecast
PNM Texas-New Mexico Power Electric BBB+ Texas Very Credit Supportive (strong/adequate) HistoricalPortland General Electric Company POR Portland General Electric Co. Electric BBB+ Oregon Highly Credit Supportive (strong/adequate) Fully Forecast
Southern Company SO Alabama Power Co. Electric A Alabama Most Credit Supportive (strong) Fully Forecast
SO Georgia Power Co. Electric A- Georgia Highly Credit Supportive (strong/adequate) Fully Forecast
SO Atlanta Gas Light Co. Gas A- Georgia [6] Highly Credit Supportive (strong/adequate) Fully Forecast
SO Northern Illinois Gas Co. Gas A Illinois Very Credit Supportive (strong/adequate) Fully Forecast
SO Mississippi Power Co. Electric A- Mississippi Credit Supportive (adequate) Fully Forecast
SO Chattanooga Gas Co. Gas A- Tennessee Highly Credit Supportive (strong/adequate) Fully Forecast
SO Virginia Natural Gas Gas A- Virginia Highly Credit Supportive (strong/adequate) Historical
Xcel Energy Inc. XEL Public Service Co. of Colorado Electric A- Colorado Most Credit Supportive (strong) HistoricalXEL Public Service Co. of Colorado Gas A- Colorado Most Credit Supportive (strong) Historical
XEL Northern States Power Co - Minnesota Electric A- Minnesota Highly Credit Supportive (strong/adequate) Fully ForecastXEL Northern States Power Co - Minnesota Gas A- Minnesota Highly Credit Supportive (strong/adequate) Fully Forecast
XEL Southwestern Public Service Co. Electric A- New Mexico Credit Supportive (adequate) Historical
XEL Northern States Power Co - Minnesota Electric A- North Dakota Highly Credit Supportive (strong/adequate) Fully Forecast
XEL Northern States Power Co - Minnesota Gas A- North Dakota [6] Highly Credit Supportive (strong/adequate) Fully Forecast
XEL Northern States Power Co - Minnesota Electric A- South Dakota Very Credit Supportive (strong/adequate) Historical
XEL Southwestern Public Service Co. Electric A- Texas Very Credit Supportive (strong/adequate) Historical
XEL Northern States Power Co - Wisconsin Electric A- Wisconsin Most Credit Supportive (strong) Fully Forecast
XEL Northern States Power Co - Wisconsin Gas A- Wisconsin Most Credit Supportive (strong) Fully Forecast
Filed: 2020-12-31 EB-2020-0290 Exhibit C1-1-1 Attachment 1
Page 121 of 131

Exhibit 5.1
Page 5 of 10
Proxy Group Company Ticker Operating Subsidiary
Edison International EIX Southern California Edison Co.
El Paso EE El Paso Electric Co.
EE El Paso Electric Co.
Entergy Corporation ETR Entergy Arkansas LLC
ETR Entergy New Orleans LLC
ETR Entergy New Orleans LLC
ETR Entergy Louisiana LLC
ETR Entergy Louisiana LLC
ETR Entergy Mississippi
ETR Entergy Texas Inc.
FirstEnergy Corp. FE Potomac Edison Co.
FE Jersey Central Power & Light Co.
FE Cleveland Electric Illuminating
FE Metropolitan Edison Co
FE Pennsylvania Electric Co.
FE Pennsylvania Power Co.
FE West Penn Power Co.
FE Monongahela Power Co.
FE Potomac Edison Co.
Evergy, Inc. EVRG Evergy Kansas Central Inc.
EVRG Evergy Kansas South Inc.
EVRG Evergy Metro Inc.
EVRG Evergy Metro Inc.
EVRG Evergy Missouri West Inc.
IDACORP, Inc. IDA Idaho Power Co.IDA Idaho Power Co.
NextEra Energy, Inc. NEE Florida Power & Light Co.
NEE Gulf Power CO.
NEE Pivotal Utility Holdings Inc.NEE Lone Star Transmission LLC
Pinnacle West Capital Corporation PNW Arizona Public Service Co.
PNM Resources, Inc. PNM Public Service Co. of New Mexico
PNM Texas-New Mexico PowerPortland General Electric Company POR Portland General Electric Co.
Southern Company SO Alabama Power Co.
SO Georgia Power Co.
SO Atlanta Gas Light Co.
SO Northern Illinois Gas Co.
SO Mississippi Power Co.
SO Chattanooga Gas Co.
SO Virginia Natural Gas
Xcel Energy Inc. XEL Public Service Co. of ColoradoXEL Public Service Co. of ColoradoXEL Northern States Power Co - MinnesotaXEL Northern States Power Co - Minnesota
XEL Southwestern Public Service Co.
XEL Northern States Power Co - Minnesota
XEL Northern States Power Co - Minnesota
XEL Northern States Power Co - Minnesota
XEL Southwestern Public Service Co.
XEL Northern States Power Co - Wisconsin
XEL Northern States Power Co - Wisconsin
[5] [5] [5] [5] [5] [5] [5] [5] [5] [5]
Electric fuel/gas
commodity/purch.
power
Conserv. program
expenseFull Decoupling
Partial
Decoupling
Renewables
expense
Environmental
compliance
Generation
capacity
Generic
infrastructure
Transmission
expenseOther
RISK ASSESSMENT: Concentric Proxy Group
NA
NA
NA
NA
NA
NA
NA
NA
NA
NA
Filed: 2020-12-31 EB-2020-0290 Exhibit C1-1-1 Attachment 1
Page 122 of 131

Exhibit 5.1
Page 6 of 10
Proxy Group Company Ticker Operating Subsidiary
Edison International EIX Southern California Edison Co.
El Paso EE El Paso Electric Co.
EE El Paso Electric Co.
Entergy Corporation ETR Entergy Arkansas LLC
ETR Entergy New Orleans LLC
ETR Entergy New Orleans LLC
ETR Entergy Louisiana LLC
ETR Entergy Louisiana LLC
ETR Entergy Mississippi
ETR Entergy Texas Inc.
FirstEnergy Corp. FE Potomac Edison Co.
FE Jersey Central Power & Light Co.
FE Cleveland Electric Illuminating
FE Metropolitan Edison Co
FE Pennsylvania Electric Co.
FE Pennsylvania Power Co.
FE West Penn Power Co.
FE Monongahela Power Co.
FE Potomac Edison Co.
Evergy, Inc. EVRG Evergy Kansas Central Inc.
EVRG Evergy Kansas South Inc.
EVRG Evergy Metro Inc.
EVRG Evergy Metro Inc.
EVRG Evergy Missouri West Inc.
IDACORP, Inc. IDA Idaho Power Co.IDA Idaho Power Co.
NextEra Energy, Inc. NEE Florida Power & Light Co.
NEE Gulf Power CO.
NEE Pivotal Utility Holdings Inc.NEE Lone Star Transmission LLC
Pinnacle West Capital Corporation PNW Arizona Public Service Co.
PNM Resources, Inc. PNM Public Service Co. of New Mexico
PNM Texas-New Mexico PowerPortland General Electric Company POR Portland General Electric Co.
Southern Company SO Alabama Power Co.
SO Georgia Power Co.
SO Atlanta Gas Light Co.
SO Northern Illinois Gas Co.
SO Mississippi Power Co.
SO Chattanooga Gas Co.
SO Virginia Natural Gas
Xcel Energy Inc. XEL Public Service Co. of ColoradoXEL Public Service Co. of ColoradoXEL Northern States Power Co - MinnesotaXEL Northern States Power Co - Minnesota
XEL Southwestern Public Service Co.
XEL Northern States Power Co - Minnesota
XEL Northern States Power Co - Minnesota
XEL Northern States Power Co - Minnesota
XEL Southwestern Public Service Co.
XEL Northern States Power Co - Wisconsin
XEL Northern States Power Co - Wisconsin
RISK ASSESSMENT: Concentric Proxy Group
[5]
Other: Text
All large electric utilities in California now impose a non-bypassable charge on ratepayers to establish
a $21 billion wildfire insurance fundCertain taxes and franchise fees recoverableRiders related to lost revenue associated with discounted service to military basesStorm recovery rider related to securitization bond charges; Certain taxes and franchise fees
recoverableStorm reserve riderStorm reserve riderEconomic development rider
Riders for ad valorem tax adjustments and storm reservesRider for ad valorem tax adjustments Certain taxes and fees recoverableCertain taxes and fees, low-income customer assistance programs, and restructuring-related buyout
of non-utility generation contracts recoverableCertain taxes and fees and uncollectible expense recoverableCertain taxes and fees, universal service and uncollectible costs recoverableCertain taxes and fees, universal service and uncollectible costs recoverableCertain taxes and fees, universal service and uncollectible costs recoverableCertain taxes and fees, universal service and uncollectible costs recoverableCertain taxes and fees recoverableCertain taxes and fees recoverableRegulatory mechanisms allow sharing of off system sales margins; Certain taxes recoverableRegulatory mechanisms allow sharing of off system sales margins; Certain taxes recoverableRegulatory mechanisms allow sharing of off system sales margins; Certain taxes recoverableRegulatory mechanisms allow sharing of off system sales margins; Certain taxes recoverableRegulatory mechanisms allow sharing of off system sales margins; Certain taxes recoverable
Storm costs and certain taxes and fees recoverable; Riders reflect economy energy salesStorm costs and certain taxes and fees recoverable; Riders reflect economy energy salesCertain taxes and fees recoverable
Franchise fees recoverable via adjustable line item on monthly billsCertain taxes and fees recoverableAdjustment clause reflects changes in municipal franchise fees
Adjustment provisions reflects changes in income, general, and local taxes
Riders to recover certain bad-debt costs, taxes and franchise feesAd valorem tax adjustment riderRiders related to capacity management and release, off-system sales, and capacity assignment;
Riders allow sharing of gross profit margin reduction associated with negotiated contracts that bypass
distribution system
Sharing of customer margins from generation-based short-term energy trading and proprietary trading
Certain taxes and fees recoverableSharing of non-asset-based wholesale power margins
Sharing of wholesale power marginsRider for lost revenue associated with discounted sales to state universitiesCertain taxes and fees recoverableCertain taxes and fees recoverable
Filed: 2020-12-31 EB-2020-0290 Exhibit C1-1-1 Attachment 1
Page 123 of 131

Exhibit 5.1
Page 7 of 10
[1] [2] [3] [4]
Proxy Group Company Ticker Operating Subsidiary Type Credit Rating Jurisdiction S&P Regulatory Assessment Test Year
RISK ASSESSMENT: Concentric Proxy Group
Algonquin Power & Utilities Corp. AQN Liberty Utilities (Peach State Nat. Gas) Corp. Gas BBB Georgia Highly credit supportive (strong/adequate) Partially Forecast
AQN Liberty Utilities (Midstates Natural Gas) Corp. Gas BBB Illinois Very credit supportive (strong/adequate) Fully Forecast
AQN Empire District Electric Co. Electric BBB Kansas Highly credit supportive (strong/adequate) Historical
AQN Liberty Utilities (NE Nat Gas) Gas BBB Massachusetts Highly credit supportive (strong/adequate) Historical
AQN Empire District Electric Co. Electric BBB Missouri Very credit supportive (strong/adequate) Partially Forecast
AQN Empire District Gas Co. Gas BBB Missouri Very credit supportive (strong/adequate) Partially Forecast
AQN Liberty Utilities (Midstates) Gas BBB Missouri Very credit supportive (strong/adequate) Partially Forecast
AQN Liberty Utilities EnergyNorth Gas BBB New Hampshire Highly credit supportive (strong/adequate) Historical
AQN Liberty Utilities Granite St Electric BBB New Hampshire Highly credit supportive (strong/adequate) Historical
AQN Enbridge Gas New Brunswick Gas BBB New Brunswick Not ranked Fully Forecast
Emera Incorporated EMA Tampa Electric Co. Electric BBB+ Florida Most Credit Supportive (strong) Fully Forecast
EMA New Mexico Gas Co. Gas BBB New Mexico Credit Supportive (adequate) Historical
EMA Nova Scotia Power Inc. Electric BBB+ Nova Scotia Most Credit Supportive (strong) Fully Forecast
Fortis Inc. FTS Central Hudson Gas & Electric Electric A- New York Very Credit Supportive (strong/adequate) Fully Forecast
FTS Central Hudson Gas & Electric Gas A- New York Very Credit Supportive (strong/adequate) Fully Forecast
FTS Tucson Electric Power Co. Electric A- Arizona More Credit Supportive (strong/adequate) Historical
FTS UNS Electric Inc. Electric A- Arizona More Credit Supportive (strong/adequate) Historical
FTS UNS Gas Inc. Gas A- Arizona More Credit Supportive (strong/adequate) Historical
FTS FortisAlberta Inc Electric A- Alberta Most Credit Supportive (strong) Historical
FTS FortisBC Electric A- British Columbia Most Credit Supportive (strong) Fully Forecast
FTS FortisBC Energy Gas A- British Columbia Most Credit Supportive (strong) Fully Forecast
FTS Newfoundland Power Inc Electric A- Newfoundland & Labrador Highly Credit Supportive (strong/adequate) Fully Forecast
FTS Maritime Electric Company Ltd. Electric BBB+ Prince Edward Island Credit Supportive (adequate) Fully Forecast
Proxy Group Results Average Total Average Fully Forecast = 41%
BBB+ 111 Very Credit Supportive (strong/adequate) Partially Forecast = 12%
Historical = 48%
Filed: 2020-12-31 EB-2020-0290 Exhibit C1-1-1 Attachment 1
Page 124 of 131

Exhibit 5.1
Page 8 of 10
Proxy Group Company Ticker Operating Subsidiary
Algonquin Power & Utilities Corp. AQN Liberty Utilities (Peach State Nat. Gas) Corp.
AQN Liberty Utilities (Midstates Natural Gas) Corp.
AQN Empire District Electric Co.
AQN Liberty Utilities (NE Nat Gas)
AQN Empire District Electric Co.
AQN Empire District Gas Co.
AQN Liberty Utilities (Midstates)
AQN Liberty Utilities EnergyNorth
AQN Liberty Utilities Granite St
AQN Enbridge Gas New Brunswick
Emera Incorporated EMA Tampa Electric Co.
EMA New Mexico Gas Co.
EMA Nova Scotia Power Inc.
Fortis Inc. FTS Central Hudson Gas & Electric
FTS Central Hudson Gas & Electric
FTS Tucson Electric Power Co.
FTS UNS Electric Inc.
FTS UNS Gas Inc.
FTS FortisAlberta Inc
FTS FortisBC
FTS FortisBC Energy
FTS Newfoundland Power Inc
FTS Maritime Electric Company Ltd.
Proxy Group Results
[5] [5] [5] [5] [5] [5] [5] [5] [5] [5]
Electric fuel/gas
commodity/purch.
power
Conserv. program
expenseFull Decoupling
Partial
Decoupling
Renewables
expense
Environmental
compliance
Generation
capacity
Generic
infrastructure
Transmission
expenseOther
RISK ASSESSMENT: Concentric Proxy Group
NA
NA
NA
NA
Adjustment Clauses Count and Percentage of Total Proxy Group
111 91 28 54 46 53 33 66 45 82
100% 82% 25% 49% 41% 48% 30% 59% 41% 74%
Filed: 2020-12-31 EB-2020-0290 Exhibit C1-1-1 Attachment 1
Page 125 of 131

Exhibit 5.1
Page 9 of 10
Proxy Group Company Ticker Operating Subsidiary
Algonquin Power & Utilities Corp. AQN Liberty Utilities (Peach State Nat. Gas) Corp.
AQN Liberty Utilities (Midstates Natural Gas) Corp.
AQN Empire District Electric Co.
AQN Liberty Utilities (NE Nat Gas)
AQN Empire District Electric Co.
AQN Empire District Gas Co.
AQN Liberty Utilities (Midstates)
AQN Liberty Utilities EnergyNorth
AQN Liberty Utilities Granite St
AQN Enbridge Gas New Brunswick
Emera Incorporated EMA Tampa Electric Co.
EMA New Mexico Gas Co.
EMA Nova Scotia Power Inc.
Fortis Inc. FTS Central Hudson Gas & Electric
FTS Central Hudson Gas & Electric
FTS Tucson Electric Power Co.
FTS UNS Electric Inc.
FTS UNS Gas Inc.
FTS FortisAlberta Inc
FTS FortisBC
FTS FortisBC Energy
FTS Newfoundland Power Inc
FTS Maritime Electric Company Ltd.
Proxy Group Results
RISK ASSESSMENT: Concentric Proxy Group
[5]
Other: Text
Bad-debt costs recovered via riders; certain taxes and franchise fees recovered via other Abbreviated rate cases allowed; off-system sales margins, recover variations in certain taxes and
franchise fees Pension and post-employment benefits recoverableOff-system sales margins flow through; certain taxes and franchise fees recoverableOff-system sales margins flow through; certain taxes and franchise fees recoverableCertain taxes and franchise fees recoverable
Regulatory deferral account for system buildout, earnings sharing, franchise fees, development O&M
capitalized costs, intangible software, carbon tax pass throughFranchise fees, gross receipts taxes, recoverable via line items on customer bills. Storm cost
recovery.Certain local taxes and franchise fees recoverable
Rate adjustment mechanisms in place to return/collect eligible deferrals and costs, including for
pension and OPEB, property taxes, major storm, gas leak-prone pipe, and certain REV costs and Rate adjustment mechanisms in place to return/collect eligible deferrals and costs, including for
pension and OPEB, property taxes, major storm, gas leak-prone pipe, and certain REV costs and Franchise fees recoverable via adjustable line items on monthly billsFranchise fees recoverable via adjustable line items on monthly billsFranchise fees recoverable via adjustable line items on monthly billsAUC assessment fees, hearing costs for interveners, property and business taxes, farm transmission
credit, efficiency carry over mechanism, legal cost claims, carrying costs, capital trackers, AESO
contributionsearnings sharing mechanism, Income tax recoverable on OPEB plans, deferred lease costs, deferred
net losses on utility capital assets and intangible assets, customer care enhancement, customer and
community benefits obligationearnings sharing mechanism, Income tax recoverable on OPEB plans, deferred net losses on utility
capital assets and intangible assets, natural gas for transportation incentive, customer care
enhancement, customer and community benefits obligationOPEB costsOPEB costs
Filed: 2020-12-31 EB-2020-0290 Exhibit C1-1-1 Attachment 1
Page 126 of 131

Exhibit 5.1
Page 10 of 10
[1] [2] [3] [4]
Proxy Group Company Ticker Operating Subsidiary Type Credit Rating Jurisdiction S&P Regulatory Assessment Test Year
RISK ASSESSMENT: Concentric Proxy Group
Notes:[1] Source: S&P Global Market Intelligence, S&P Long-Term Issuer Rating. If the operating subsidiary is not rated by S&P, then this column reflects the parent company's Long-Term Issuer Rating.
[2] Source: S&P Global Market Intelligence
[3] S&P Global Ratings, Ratings Direct, U.S. And Canadian Regulatory Jurisdiction Updates And Insights: (November 2019)
[4] Source: Source: Regulatory Research Associates; The Test Year refers to the State Commissions' standard practice, regulatory filings and orders, annual reports, annual information forms, when not covered by SNL
[5] Source: S&P Global Market Intelligence, Regulatory Focus: Adjustment Clauses, dated November 12, 2019. Operating subsidiaries not covered in this report were excluded from this exhibit.
[6] Operations classified as full revenue decoupling since the company operates under a straight fixed-variable rate design.
Filed: 2020-12-31 EB-2020-0290 Exhibit C1-1-1 Attachment 1
Page 127 of 131

Exhibit 5.2
Page 1 of 4
[1] [2] [3] [4]
Proxy Group Company Ticker Operating Subsidiary Type Credit Rating Jurisdiction S&P Regulatory Assessment Test Year
Public Service Enterprise Group, Inc. PEG Public Severice Electric & Gas Co. Electric A- New Jersey More Credit Supportive (strong/adequate) Partially Forecast
PEG Public Severice Electric & Gas Co. Gas A- New Jersey More Credit Supportive (strong/adequate) Partially Forecast
NextEra Energy, Inc. NEE Florida Power & Light Co. Electric A Florida Most Credit Supportive (strong) Fully Forecast
NEE Gulf Power CO. Electric A Florida Most Credit Supportive (strong) Fully Forecast
NEE Pivotal Utility Holdings Inc. Gas A- Florida Most Credit Supportive (strong) Fully Forecast
NEE Lone Star Transmission LLC Electric A- Texas Very Credit Supportive (strong/adequate) Historical
Exelon Corporation EXC Delmarva Power & Light Co. Electric A- Delaware Very Credit Supportive (strong/adequate) Partially Forecast
EXC Delmarva Power & Light Co. Gas A- Delaware Very Credit Supportive (strong/adequate) Partially Forecast
EXC Potomac Electric Power Co. Electric A- District of Columbia More Credit Supportive (strong/adequate) Historical
EXC Commonwealth Edison Co. Electric BBB+ Illinois Very Credit Supportive (strong/adequate) Historical
EXC Baltimore Gas & Electric Co. Electric A Maryland More Credit Supportive (strong/adequate) Partially Forecast
EXC Baltimore Gas & Electric Co. Gas A Maryland More Credit Supportive (strong/adequate) Partially Forecast
EXC Delmarva Power & Light Co. Electric A- Maryland More Credit Supportive (strong/adequate) Partially Forecast
EXC Potomac Electric Power Co. Electric A- Maryland More Credit Supportive (strong/adequate) Partially Forecast
EXC Atlantic City Electric Co. Electric A- New Jersey More Credit Supportive (strong/adequate) Partially Forecast
EXC PECO Energy Co. Electric BBB+ Pennsylvania Highly Credit Supportive (strong/adequate) Fully Forecast
EXC PECO Energy Co. Gas BBB+ Pennsylvania Highly Credit Supportive (strong/adequate) Fully Forecast
Proxy Group Results Average Total Average Fully Forecast = 29%
A- 17 Very Credit Supportive (strong/adequate) Partially Forecast = 53%
Historical = 18%
RISK ASSESSMENT: Moody's Proxy Group
Filed: 2020-12-31 EB-2020-0290 Exhibit C1-1-1 Attachment 1
Page 128 of 131

Exhibit 5.2
Page 2 of 4
Proxy Group Company Ticker Operating Subsidiary
Public Service Enterprise Group, Inc. PEG Public Severice Electric & Gas Co.
PEG Public Severice Electric & Gas Co.
NextEra Energy, Inc. NEE Florida Power & Light Co.
NEE Gulf Power CO.
NEE Pivotal Utility Holdings Inc.
NEE Lone Star Transmission LLC
Exelon Corporation EXC Delmarva Power & Light Co.
EXC Delmarva Power & Light Co.
EXC Potomac Electric Power Co.
EXC Commonwealth Edison Co.
EXC Baltimore Gas & Electric Co.
EXC Baltimore Gas & Electric Co.
EXC Delmarva Power & Light Co.
EXC Potomac Electric Power Co.
EXC Atlantic City Electric Co.
EXC PECO Energy Co.
EXC PECO Energy Co.
Proxy Group Results
[5] [5] [5] [5] [5] [5] [5] [5] [5] [5]
Electric fuel/gas
commodity/purch.
power
Conserv.
program
expense
Full
Decoupling
Partial
Decoupling
Renewables
expense
Environmental
compliance
Generation
capacity
Generic
infrastructure
Transmission
expenseOther
NA
NA
NA
NA
NA
NA
NA
NA
NA
NA
Adjustment Clauses Count and Percentage of Total Proxy Group
17 13 4 2 4 6 2 12 2 15
100% 76% 24% 12% 24% 35% 12% 71% 12% 88%
RISK ASSESSMENT: Moody's Proxy Group
Filed: 2020-12-31 EB-2020-0290 Exhibit C1-1-1 Attachment 1
Page 129 of 131

Exhibit 5.2
Page 3 of 4
Proxy Group Company Ticker Operating Subsidiary
Public Service Enterprise Group, Inc. PEG Public Severice Electric & Gas Co.
PEG Public Severice Electric & Gas Co.
NextEra Energy, Inc. NEE Florida Power & Light Co.
NEE Gulf Power CO.
NEE Pivotal Utility Holdings Inc.
NEE Lone Star Transmission LLC
Exelon Corporation EXC Delmarva Power & Light Co.
EXC Delmarva Power & Light Co.
EXC Potomac Electric Power Co.
EXC Commonwealth Edison Co.
EXC Baltimore Gas & Electric Co.
EXC Baltimore Gas & Electric Co.
EXC Delmarva Power & Light Co.
EXC Potomac Electric Power Co.
EXC Atlantic City Electric Co.
EXC PECO Energy Co.
EXC PECO Energy Co.
Proxy Group Results
RISK ASSESSMENT: Moody's Proxy Group
[5]
Other: Text
Certain taxes and fees, low-income customer assistance programs, and restructuring-related buyout of
non-utility generation contracts recoverableCertain taxes and fees recoverableStorm costs and certain taxes and fees recoverable; Riders reflect economy energy salesStorm costs and certain taxes and fees recoverable; Riders reflect economy energy salesCertain taxes and fees recoverable
Relocation costs of ariel and underground facilities required by government agency projects recoverableRelocation costs of ariel and underground facilities required by government agency projects recoverableCertain taxes and fees recoverableCertain taxes, fees, and bad-debt costs recoverableCertain taxes and fees recoverableCertain taxes and fees recoverable
Certain taxes and fees recoverableCertain taxes and fees, low-income customer assistance programs, and restructuring-related buyout of
non-utility generation contracts recoverableCertain taxes, fees, and nuclear deommissioning costs recoverableCertain taxes and fees recoverable
Filed: 2020-12-31 EB-2020-0290 Exhibit C1-1-1 Attachment 1
Page 130 of 131

Exhibit 5.2
Page 4 of 4
[1] [2] [3] [4]
Proxy Group Company Ticker Operating Subsidiary Type Credit Rating Jurisdiction S&P Regulatory Assessment Test Year
RISK ASSESSMENT: Moody's Proxy Group
Notes:
[1] Source: S&P Global Market Intelligence, S&P Long-Term Issuer Rating. If the operating subsidiary is not rated by S&P, then this column reflects the parent company's Long-Term Issuer Rating.
[2] Source: S&P Global Market Intelligence
[3] S&P Global Ratings, Ratings Direct, U.S. And Canadian Regulatory Jurisdiction Updates And Insights: (November 2019)
[4] Source: Source: Regulatory Research Associates; The Test Year refers to the State Commissions' standard practice, regulatory filings and orders, annual reports, annual information forms, when not covered by SNL
[5] Source: S&P Global Market Intelligence, Regulatory Focus: Adjustment Clauses, dated November 12, 2019. Operating subsidiaries not covered in this report were excluded from this exhibit.
[6] Operations classified as full revenue decoupling since the company operates under a straight fixed-variable rate design.
Filed: 2020-12-31 EB-2020-0290 Exhibit C1-1-1 Attachment 1
Page 131 of 131

28872291.8
79 Wellington St. W., 30th Floor Box 270, TD South Tower Toronto, Ontario M5K 1N2 Canada P. 416.865.0040 | F. 416.865.7380www.torys.com
Charles Keizer [email protected]. 416-865-7510
BY EMAIL
CONFIDENTIAL — PRIVILEGED
December 19, 2019
Concentric Energy Advisors, Inc. 293 Boston Post Road West, Suite 500 Marlborough, MA 01752
Attention: Jim Coyne, Senior Vice President
Re: Retainer Letter Agreement – Ontario Power Generation
Dear Sirs/Mesdames,
We represent Ontario Power Generation (“OPG”) in connection with payment amounts proceedings and other payment amounts-related proceedings (collectively, the “Proceedings”) before the Ontario Energy Board (the “Board”).
We confirm that, on behalf of and to assist us in providing legal advice to OPG in connection with the Proceedings, Torys LLP (“Torys” or “we”) hereby retains Concentric Energy Advisors, Inc. (the “Consultant” or “you”), effective as of the date first written above (“Effective Date”), to provide consulting services as described in this letter (the “Engagement”). By signing back a copy of this letter, the Consultant agrees that this letter contains the agreed-upon terms and conditions of its retainer with Torys effective on the Effective Date, subject to amendment by written agreement between the parties (the “Retainer Agreement”).
1. No Conflict
The Consultant does not have any conflict of interest or other constraints on its ability to provide expert advice in connection with this Retainer Agreement. You confirm that you are free to provide your services to Torys in connection with Torys’ representation of OPG in the Proceedings. You agree that during this Engagement you will not provide, directly or indirectly, any services to the Board or any other party in connection with the matters at issue in the Proceedings.
2. Consultant Expertise
The Consultant has been selected to provide Services (as defined below) to Torys in connection with the Proceedings. The sponsors of the work of the Consultant and the persons who have the relevant expertise will be:
Dan Dane;
Filed: 2020-12-31 EB-2020-0290
Ex. C1-1-1 Attachment 2 Page 1 of 30
DAVELLAL
Rectangle

28872291.8
- 2 - Jim Coyne; and
Other experienced professionals from the Consultant, as may be required and agreed to by the parties in advance.
(together, the “Sponsors”)
3. Scope of Services and Work Product
The Consultant will:
(a) carry out an independent study as to whether the application of the cost of capital approved by the Board in the EB-2016-0152 proceeding is an appropriate basis for setting OPG’s nuclear and regulated hydroelectric payment amounts in OPG’s next payment amounts application, as detailed in Schedule 1 hereto (the “Cost of Capital Study”);
(b) if requested by Torys: (i) an independent study regarding the impact on OPG due to the merchant risk created under the current market renewal proposal, as detailed in Schedule 1 hereto (the “Merchant Risk Study”), and/or (ii) any other studies as may be required in support of the Engagement (the “Supporting Studies” and, together with the Cost of Capital Study and the Merchant Risk Study, the “Studies”);
(c) if requested by Torys, produce a draft and/or final report(s) detailing the applicable Study’s methodology, review performed and the Consultant’s findings and recommendations (the “Report(s)”), which may be filed with the Board in the Proceedings; and
(d) if requested by Torys, provide support during the hearing of the Proceedings and testify before the Board in the Proceedings, in connection with the scope of the services provided hereunder (“Application Support” and, together with the Studies and the Report(s), the “Services”).
4. Fees and Invoices
(a) The Consultant acknowledges that the fees for the Consultant to perform the Cost of Capital Study and to deliver the associated written Report(s), if requested, shall (i) be determined based on the hourly rates set forth in paragraph (c) below and (ii) in no event exceed net of HST, without prior written approval from Torys.
(b) The Consultant’s fees for completing the Merchant Risk Study and/or Supporting Studies (including the delivery of the associated written Report(s)), if requested, shall be determined based on the hourly rates set forth in paragraph (c) below, subject to a forecast maximum level of efforts which is (i) to be estimated by the Consultant and agreed to by Torys prior to the initiation of any such Studies by the Consultant and (ii) not to be exceeded by the Consultant in carrying out any such Studies without prior written approval from Torys.
Filed: 2020-12-31 EB-2020-0290
Ex. C1-1-1 Attachment 2 Page 2 of 30

28872291.8
- 3 - (c) The Consultant’s fees for providing Application Support, if requested, shall be
charged at the following hourly rates:
Title Hourly Rate (USD)
Chairman and Chief Executive Officer
Senior Vice President
Vice President
Assistant Vice President
Senior Project Manager
Project Manager
Senior Consultant
Consultant
Senior Analyst
Analyst
Associate
Project Assistant
(d) The Consultant shall direct all invoices relating to Services performed by it under this Retainer Agreement to OPG, to the attention of:
Aimee CollierAssistant General Counsel, Law Division Ontario Power Generation 700 University Avenue Toronto, ON M5G 1X6 [email protected]
with a copy to Torys, to the attention of:
Charles Keizer Torys LLP 79 Wellington St. W., 30th Floor Box 270, TD South Tower Toronto, Ontario M5K 1N2 [email protected]
(e) Due to the confidential nature of this assignment, the Consultant agrees to submit:
Filed: 2020-12-31 EB-2020-0290
Ex. C1-1-1 Attachment 2 Page 3 of 30
28872291.8
- 4 - (i) a summary sheet only of each account, showing the fee, expenses, all
applicable taxes, a subtotal (excluding taxes), and the grand total;
(ii) a detailed account which will include at least the following information:
(A) identification of the billing period to which the account relates;
(B) an itemized summary of the work that has been undertaken, including a brief description of each service, the date on which each service was rendered, the time spent on each service, the individual who performed the service and the billing rate of such individual; and
(C) an itemization and brief description of all expenses incurred during the billing period, with copies of supporting invoices for any expenses in excess of $100, unless Torys indicates that such invoices are not required.
(f) The Consultant will be reimbursed for reasonable travel expenses (billed at cost with no mark-up) related to this Retainer Agreement only in accordance with OPG’s Standard Form Business Expense Schedule, a copy of which is attached as Schedule 2 hereto. Any disbursements for additional incidentals incurred by the Consultant in relation to this Retainer Agreement must be pre-approved by OPG or Torys in writing. In the event of conflict between any provisions of Schedule 2 and any policies or fee schedules of the Consultant relating to the charging of travel expenses or other incidentals, the relevant provisions of Schedule 2 shall prevail.
(g) Consultant will be reimbursed for reasonable report production, printing, and reproduction charges at Consultant’s standard charges for such materials for services.
(h) OPG reserves the right to deduct any applicable non-resident withholding taxes from any amounts owing to the Consultant under this Retainer Agreement and remit such amounts to the applicable taxation authority.
5. Confidentiality
All work performed by the Consultant in connection with this Retainer Agreement, including all findings, opinions and conclusions the Consultant reaches in relation to this Retainer Agreement, and any communications relating thereto, are strictly privileged and confidential and shall not be disclosed to any other person or party without the prior written consent of Torys or OPG. The Consultant agrees to designate all written communications and material accordingly. The Consultant further agrees to notify Torys in the event that the Consultant receives a request to disclose information relating to this matter, and agrees to cooperate with Torys, to the fullest extent permitted by law, to prevent or limit the disclosure of such material or otherwise preserve the privileged and confidential status of such material.
The Consultant agrees to hold in confidence: (a) the fact and existence of this Retainer Agreement, (b) all information provided to the Consultant, and (c) the Consultant’s opinions to Torys and to OPG as they relate to the information, whether the information or opinions are
Filed: 2020-12-31 EB-2020-0290
Ex. C1-1-1 Attachment 2 Page 4 of 30

28872291.8
- 5 - documentary or oral (collectively, the “Confidential Information”). The Consultant will not disclose the Confidential Information to any person unless Torys or OPG authorizes you in writing to do so, or as may be required for purposes of providing testimony before the Board in which case the Consultant shall identify and only disclose Confidential Information in accordance with the Board’s protocols for the treatment of confidential information. All documents given to the Consultant in connection with this Retainer Agreement remain the property of Torys or of OPG, and are held in trust by the Consultant as agent. The Consultant agrees to return these documents on request. During the Engagement, the Confidential Information shall be segregated from other Consultant or OPG data (including on electronic information systems) and shall not be accessible to individuals other than the Consultant, Torys, and OPG employees requiring access.
The Consultant will not refer to Torys or to OPG, directly or indirectly, in connection with the promotion of its services, without obtaining the prior written consent of Torys or OPG, as the case may be. Notwithstanding the foregoing, Concentric may refer to OPG and the following information in materials used to promote its services: (i) the Board’s file number for the Proceeding, (ii) a general description of the nature and scope of the Services performed, and (iii) the time period of the Engagement; provided that (a) Concentric has provided testimony before the Board in connection with this Engagement and (b) such information shall in no way include, reflect or reveal, directly or indirectly, any Confidential Information nor any information that is not available on the public record in the Proceeding.
6. Intellectual Property
Nothing in this Retainer Agreement shall be deemed to transfer, license, assign, permit the use of, or otherwise convey an interest in whole or in part to the Consultant of any intellectual property belonging to OPG or any of its representatives or any third party whose intellectual property is in OPG’s custody or control, and the use by the Consultant of any such intellectual property shall be subject to the prior written approval of OPG.
Torys and OPG shall at all times have full rights and title to all works prepared, generated or created by the Consultant pursuant to this Retainer Agreement, including without limitation any reports, presentations, status updates, or other documents created by the Consultant, and any related works, modifications or additions thereto, but excluding any parts of Consultant’s oral testimony and/or final Report that are provided before the Board on the public record in the Proceeding (the “Work Product”), and may at all times take possession of or use any completed or partially completed Work Product, notwithstanding any provision, express or implied, to the contrary. Without limiting the generality of the foregoing, OPG shall own all intellectual property rights in all Work Product, and the Consultant hereby waives and assigns to OPG any such rights, and agrees to give OPG and its representatives all assistance as may be reasonably required to perfect such rights including, without limitation, obtaining waiver of moral rights from any of the Consultant’s employees, partners or other representatives.
Anything contained in this agreement to the contrary notwithstanding, nothing in this Retainer Agreement shall prevent Consultant from utilizing any general know-how, ideas, techniques, concepts, methods, processes, proprietary computer software, methodology, procedures, or other proprietary information applied in performing the Services, on behalf of itself or its future customers, or give Torys or OPG any rights with respect to such proprietary information. Subject to Section 1 above, Consultant may (i) perform the same or similar services for others, and (ii) retain one copy of deliverables produced in connection with the Services hereunder for the sole
Filed: 2020-12-31 EB-2020-0290
Ex. C1-1-1 Attachment 2 Page 5 of 30

28872291.8
- 6 - purpose of documenting the conduct of its work and its exercise of due professional care in connection with the Services, provided that any of OPG's Confidential Information is treated in accordance with the confidentiality requirements of this Retainer Agreement.
7. Controlled Nuclear Information
The Consultant has been made aware of certain Canadian federal requirements relating to the import and export of controlled nuclear information, and recognizes that it is an offence for any person to export controlled nuclear information from Canada without an export permit issued for the purpose by the Canadian Nuclear Safety Commission. The Consultant agrees not to remove or cause to be removed from Canada any controlled nuclear information during the performance of the Services, and will promptly raise the issue with OPG where the Consultant is in doubt as to whether information to be removed from Canada as part of the Services may be – or contain – controlled nuclear information.
8. Termination
Torys may terminate this Retainer Agreement at any time on written notice to the Consultant. Torys will pay, or will cause OPG to pay, for work performed up to the date of the notice of termination. Upon the termination or expiration of this Retainer Agreement, the Consultant shall return to Torys and delete any and all electronic copies the Consultant may have of all documents and materials in its possession relating to the Services or this Retainer Agreement, including all Confidential Information and Work Product, whether completed or not.
9. Liability and Indemnification
The Consultant shall be liable for and shall indemnify and hold harmless OPG and Torys from all claims, demands, actions, penalties, damages, losses, judgments and settlements, liabilities, costs, expenses, including legal fees and other related costs and expenses arising out of, related to, or incident to, the Consultant or any of its representatives’ performance of the Services under this Retainer Agreement, including, subject to section 11 (Limitation of Liability) below:
a) any breach, violation or non-performance by the Consultant or any of its representatives of any terms, conditions, warranties, obligations or covenants contained in this Retainer Agreement;
b) any breach or violation by the Consultant or any of its representatives of any applicable laws; and
c) any actions, omissions, negligence or wilful misconduct of the Consultant or any of its representatives.
10. Intellectual Property Protection
The Consultant expressly warrants that the manufacture, delivery, sale or use of the Consultant’s Services will not infringe any Canadian or foreign patents, trademarks, copyrights, industrial design or other intellectual property rights and the Consultant shall indemnify and save OPG harmless from all claims, judgments and decrees that may be entered against OPG or its representatives and against all damage, liability, costs and expenses (including legal fees and other attendant costs and expenses) OPG incurs by reason of any infringement or claim thereof.
Filed: 2020-12-31 EB-2020-0290
Ex. C1-1-1 Attachment 2 Page 6 of 30
28872291.8
- 7 - 11. Limitation of Liability
Except for breach of confidentiality obligations, gross negligence, willful misconduct, fraud, breach of applicable laws, breach of privacy laws, and the Consultant’s obligation to indemnify under section 10 (Intellectual Property Protection), the Consultant’s total liability for any claim arising out of the performance of the Services, regardless of the form of claim, will in no event exceed total fees paid to Consultant hereunder and under no circumstances will either party be liable for any damages in respect of any incidental, punitive, special, indirect or consequential loss, even if that party had been advised of the possibility of such damages including, but not limited to, loss of profits, loss of revenues, failure to realize expected savings, loss of data, loss of business opportunity, or similar losses of any kind.
12. Insurance
(a) Unless otherwise specified in this Retainer Agreement, the Consultant shall, during the term of this Retainer Agreement, and at its own expense, maintain and keep in full force and effect:
i. commercial general liability insurance on an occurrence basis having a minimum inclusive coverage limit, including personal injury and property damage, of not less than one million dollars ($1,000,000.00) per occurrence, which shall be extended to cover contractual liability, products and completed operations liability, owners/contractors protective liability and must also contain a cross liability clause and a severability of interest clause, and must name OPG and its affiliates as additional insureds; and
ii. errors and omissions insurance (professional liability) in the amount of not less than two million dollars ($2,000,000.00).
(b) All insurance coverages and limits required to be maintained by the Consultant shall be primary to any insurance maintained by OPG, which shall be excess and non-contributory. Prior to the commencement of the delivery of the Services, the Consultant shall deliver to OPG a certificate of insurance which evidences the Consultant’s compliance with this Section, including the provision of a thirty (30) day prior written notice of cancellation, non-renewal or adverse material change, to OPG. The Consultant agrees that the insurance described herein does in no way limit the Consultant’s liability pursuant to the indemnity provisions of this Retainer Agreement.
13. Independence
By entering into this Retainer Agreement, the Consultant acknowledges and agrees that the Sponsors have received a copy of Rule 13A of the Board’s Rules of Practice and Procedure concerning expert evidence and agree to accept the responsibilities that are or may be imposed on them by that rule with respect to testimony before the Board. A copy of the rule and the relevant form are attached as Schedules 3 and 4 hereto.
14. Entire Agreement
This Retainer Agreement, together with all Schedules attached hereto and any agreements and other documents to be delivered pursuant to this Retainer Agreement, constitute the complete agreement between Torys and the Consultant or their respective agents with respect to the subject
Filed: 2020-12-31 EB-2020-0290
Ex. C1-1-1 Attachment 2 Page 7 of 30

28872291.8
- 8 - matter hereof and supersedes any and all prior agreements and understandings. This Retainer Agreement may be amended only in writing with reference to this Retainer Agreement and signed by both parties.
15. Governing Law
This Retainer Agreement shall be construed and otherwise governed pursuant to the laws of the Province of Ontario and the federal laws of Canada applicable therein.
Sincerely,
TORYS LLP
Charles Keizer Partner
Agreed and Accepted by:
Concentric Energy Advisors, Inc.
By:Name: Jim Coyne Title: Senior Vice President
Filed: 2020-12-31 EB-2020-0290
Ex. C1-1-1 Attachment 2 Page 8 of 30

28872291.8
- 9 - SCHEDULE 1
Scope of Work
Objective:
To provide independent expert opinion and support to Torys in assistance of its legal advice to OPG with respect to cost of capital-related issues in OPG’s next payment amounts application, as further detailed below and pursuant to the terms and conditions of the Retainer Agreement.
Scope:
The Consultant will undertake the following scope of work to support Torys’ legal advice to OPG in obtaining the OEB’s approval of payment amounts established pursuant to the OEB’s new rate-making methodologies for hydroelectric and nuclear operations:
a) The Consultant will carry out an independent study as to whether the application of the cost of capital approved by the OEB in the EB-2016-0152 proceeding is an appropriate basis for setting OPG’s nuclear and regulated hydroelectric payment amounts in OPG’s next payment amounts application (the “Capital Cost Study”).
In carrying out the Capital Cost Study, the Consultant will select the appropriate peer group against which OPG should be compared, including establishing the appropriate selection criteria for inclusion in the peer group.
The Capital Cost Study shall build upon the OEB's findings in EB-2007-0905, EB-2010-0008, EB-2013-0321, and EB-2016-0152 in respect of OPG's cost of capital. Specifically:
i. OPG's cost of capital shall be established based on the stand-alone principle. ii. OPG's ROE shall be set in accordance with a formula-based approach provided in the
OEB's Cost of Capital Report issued December 11, 2009, which adopts the Fair Return Standard.
iii. The 45% common equity ratio approved in EB-2013-0321 reflects the OEB's view that the business risks associated with OPG’s nuclear business are higher than those of the regulated hydroelectric business.
iv. The 45% common equity ratio approved in EB-2016-0152 is counter to the position advanced by OPG, the positions advanced by the OEB’s independent experts, and the positions advanced by OEB staff.
v. The Capital Cost Study will address whether the 45% common equity ratio is reasonable, given Pickering End of Commercial Operations, the Darlington Refurbishment Project, and market renewal, among other factors.
Initial draft of the Cost of Capital Study report, if requested, must be submitted by the Consultant to Torys and OPG by February 28, 2020. The final report of the Cost of Capital Study, if requested, shall be delivered to Torys and OPG by March 27, 2020.
b) If requested, the Consultant will conduct an independent assessment of the impact to OPG’s risk due to the merchant risk created under the current market renewal proposal,
Filed: 2020-12-31 EB-2020-0290
Ex. C1-1-1 Attachment 2 Page 9 of 30

28872291.8
- 10 - including an assessment of the equity thickness required to reflect this risk (the “Merchant Risk Study”).
c) If requested, the Consultant will conduct other studies as may be required to support the Cost of Capital Study (“Supporting Studies”).
With respect to the Merchant Risk Study and/or Supporting Study (if requested), OPG or Torys will provide specific instructions to the Consultant regarding required scope, activities and timeline, and Consultant shall provide a forecast maximum level of efforts required to complete the work for approval by Torys prior to the initiation of such Study. For clarity, the decision to proceed with the Merchant Risk Study and/or Supporting Study will be determined by OPG and communicated to the Consultant in writing.
d) If requested, the Consultant will prepare for and participate in OPG’s payment amounts applications in support of Torys’ legal advice to OPG in the Proceedings, including: preparing evidence, responding to interrogatories, providing oral testimony, responding to undertakings and supporting the preparation of argument and other submissions, all as directed by Torys and OPG.
Filed: 2020-12-31 EB-2020-0290
Ex. C1-1-1 Attachment 2
Page 10 of 30

28872291.8
- 11 -
SCHEDULE 2
OPG’s Standard Form Business Expense Schedule
(attached)
Schedule C - Business Expenses.pdf
Filed: 2020-12-31 EB-2020-0290
Ex. C1-1-1 Attachment 2
Page 11 of 30

OPG Standard Form Business Expense Schedule for Contractors – Updated December 10, 2014
STANDARD FORM BUSINESS EXPENSE SCHEDULE FOR CONTRACTORS
Effective June 17, 2009
ONTARIO POWER GENERATION INC.
Updated December 10, 2014
Filed: 2020-12-31 EB-2020-0290
Ex. C1-1-1 Attachment 2
Page 12 of 30
OPG Standard Form Business Expense Schedule for Contractors – Updated December 10, 2014
Table of Contents RECITALS ....................................................................................................................................................... 1
SECTION 1 – INTERPRETATION ..................................................................................................................... 1
1.1 Three Types of Reimbursement .................................................................................................... 1
1.2 Definitions ..................................................................................................................................... 1
1.3 Headings ........................................................................................................................................ 2
1.4 Expanded Definitions .................................................................................................................... 2
1.5 Business Day ................................................................................................................................. 2
1.6 Payment Currency ......................................................................................................................... 2
1.7 Conflict .......................................................................................................................................... 3
1.8 Notice ............................................................................................................................................ 3
SECTION 2 – REIMBURSEMENT OF ALLOWABLE EXPENSES ......................................................................... 3
2.1 Allowable Expenses ....................................................................................................................... 3
2.2 Expenses Minimised ...................................................................................................................... 3
2.3 Excluded Items .............................................................................................................................. 3
2.4 Method of Reimbursement .......................................................................................................... 4
2.5 Travel Agency ................................................................................................................................ 5
2.6 Confirming Rates ........................................................................................................................... 5
2.7 Home Base and Work Site ............................................................................................................ 6
2.8 Non EPSCA Eligible Employees and Extended Staff ...................................................................... 6
SECTION 3 – AIR, RAIL OR BUS TRAVEL ......................................................................................................... 8
3.1 Air, Rail or Bus Travel .................................................................................................................... 8
3.2 Economy Class ............................................................................................................................... 8
3.3 Vehicle Instead of Air, Rail or Bus Travel ...................................................................................... 8
3.4 Visits Home ................................................................................................................................... 9
3.5 Minimising Expenses ..................................................................................................................... 9
SECTION 4 – VEHICLES .................................................................................................................................. 9
4.1 Reimbursable Vehicle Expenses .................................................................................................... 9
4.2 Personal Vehicle ............................................................................................................................ 9
Filed: 2020-12-31 EB-2020-0290
Ex. C1-1-1 Attachment 2
Page 13 of 30
OPG Standard Form Business Expense Schedule for Contractors – Updated December 10, 2014
4.3 Reducing Expenses ........................................................................................................................ 9
4.4 Multiple Users ............................................................................................................................. 10
SECTION 5 – LODGING ................................................................................................................................ 10
5.1 Overnight Accommodation ......................................................................................................... 10
SECTION 6 – DAILY RATES ........................................................................................................................... 10
6.1 Daily Rates Instead of Allowable Expenses ................................................................................. 10
6.2 Daily Rates ................................................................................................................................... 11
6.3 All Inclusive ................................................................................................................................. 11
6.4 Rates............................................................................................................................................ 11
6.5 Application of Rate ...................................................................................................................... 11
6.6 Method of Reimbursement ........................................................................................................ 12
6.7 Absences ..................................................................................................................................... 12
Section 7 – MONTHLTY RATES .................................................................................................................... 12
Filed: 2020-12-31 EB-2020-0290
Ex. C1-1-1 Attachment 2
Page 14 of 30

1
OPG Standard Form Business Expense Schedule for Contractors – Updated December 10, 2014
BUSINESS EXPENSE SCHEDULE
RECITALS
A. Ontario Power Generation Inc., (“OPG”) entered into an Agreement (the “Agreement”) with the other party to the Agreement (the “Contractor”). This schedule (this “Schedule”) forms part of the Agreement. Under the Agreement, OPG agreed to reimburse the Contractor for certain business expenses incurred by employees of the Contractor (“Eligible Employees”) in performing work for OPG under the Agreement.
B. This Schedule sets out the terms on which OPG will reimburse the Contractor for business expenses incurred by Eligible Employees in performing work for OPG.
SECTION 1 – INTERPRETATION
1.1 Three Types of Reimbursement OPG will reimburse the Contractor for expenses that are eligible for reimbursement in accordance with the Schedule. OPG will make the reimbursements in 1 of 3 ways respecting each Eligible Employee in respect of whom reimbursements are payable. The 3 ways of reimbursements are: (a) reimbursement of individually incurred Allowable Expenses as set out in section 2 through
section 5;
(b) payment on a flat rate daily basis as set out in section 6; or
(c) payment on a flat rate monthly basis as set out in section 7. Except as expressly set out in section 6 or section 7, if OPG pays the Contractor the daily or monthly rate in respect of an Eligible Employee, OPG will reimburse the Contractor no Allowable Expenses in respect of that Eligible Employee.
1.2 Definitions In this Schedule, the following terms have the respective meanings set out below.
(a) Agreement is defined in Recital A.
(b) Allowable Expenses is defined in Section 2.1.
Filed: 2020-12-31 EB-2020-0290
Ex. C1-1-1 Attachment 2
Page 15 of 30
2
OPG Standard Form Business Expense Schedule for Contractors – Updated December 10, 2014
(c) Business Day means any day other than a Saturday, Sunday, New Year’s Day, Family Day, Good Friday, Easter Monday, Victoria Day, Canada Day, Civic Holiday, Labour Day, Remembrance Day, Thanksgiving Day, Christmas Day and Boxing Day.
(d) Contractor is defined in Recital A.
(e) Eligible Employees is defined in Recital A.
(f) Home Base means the permanent place of residence (home) of Eligible Employee.
(g) Reporting Location means the normal work location or base office for Eligible Employee. For all work at Darlington Nuclear (DN) and Pickering Nuclear (PN) sites, this is further defined as an area consisting of a 100km radius around the midpoint between DN and PN site. Bruce Nuclear (BN) is also considered a reporting location.
(h) OPG Representative is defined in Section 2.1 (d).
(i) Schedule is defined in Recital A.
(j) Work Site means a location at which the Eligible Employee may be required to provide service that is different from the Eligible Employee’s normal reporting location.
1.3 Headings The division of the Schedule into sections, the insertion of headings and the provision of a table of contents are for convenience of reference only and are not to affect the construction or interpretation of this Schedule.
1.4 Expanded Definitions Unless otherwise specified, words importing the singular include the plural and vice versa and words importing gender include all genders. The term “including” means “including without limitations”, and the terms “include”, “includes” and “included” have similar meanings. The term “will” means “shall”.
1.5 Business Day If under this Schedule any payment or calculation is to be made on or as of a day which is not a Business Day that payment or calculation is to be made on or as of the next day that is a Business Day
1.6 Payment Currency
Except as expressly set out in the Agreement, amounts to be paid or calculated under this Schedule will be paid or calculated in Canadian dollars. Any amounts to be paid or calculated which are denominated in a foreign currency will be converted into Canadian dollars, within three Business Days of the invoice date, using the Bank of Canada nominal noon exchange rate, as posted on the Bank of Canada website (currently located at www.bankofcanada.ca).
Filed: 2020-12-31 EB-2020-0290
Ex. C1-1-1 Attachment 2
Page 16 of 30
3
OPG Standard Form Business Expense Schedule for Contractors – Updated December 10, 2014
1.7 Conflict
If there is conflict between any term of this Schedule and any term in another part of the Agreement, the relevant term in the other part of the Agreement will prevail.
1.8 Notice
Any notices to be given under this Schedule will be given in accordance with the notice terms set out elsewhere in the Agreement.
SECTION 2 – REIMBURSEMENT OF ALLOWABLE EXPENSES
2.1 Allowable Expenses
OPG will only reimburse the Contractor for the following eligible expenses (“Allowable Expenses”) to the extent they otherwise meet the requirements of this Schedule and the rest of the Agreement:
(a) air, rail and bus travel expenses permitted under section 3;
(b) vehicle expenses permitted under section 4;
(c) lodging expenses permitted under section 5; and
(d) any other expenses which have been approved in writing by the OPG individual managing the Agreement (the “OPG Representative”).
2.2 Expenses Minimised
Notwithstanding any term in this Schedule, the Contractor will use all reasonable efforts to ensure that Eligible Employees minimise Allowable Expenses and the Contractor will ensure that all Allowable Expenses are reasonable and properly incurred in a manner consistent with effective and efficient business practice. OPG is not obliged to reimburse any expenses which are not so incurred. Eligible Employees who normally live together are expected to share accommodations and vehicle expenses, where reasonable.
2.3 Excluded Items
Notwithstanding any term in this Schedule, OPG will not reimburse any amounts to the Contractor or any Eligible Employee for any hospitality, food or incidental expenses, including, but not limited to, in respect of the following:
(a) meals, snacks, alcoholic and non-alcoholic beverages;
Filed: 2020-12-31 EB-2020-0290
Ex. C1-1-1 Attachment 2
Page 17 of 30

4
OPG Standard Form Business Expense Schedule for Contractors – Updated December 10, 2014
(b) any expense whatsoever if the one way distance between the Eligible Employee’s Home Base or Reporting Location and the Work Site is less than 100 kilometers;
(c) gratuities;
(d) airline or railway club dues, fees or other charges;
(e) personal service expenses, including hair care, shoe shine, toiletry and spa treatment expenses;
(f) laundry, dry cleaning or valet expenses;
(g) hotel telephone charges or internet access;
(h) personal telephone calls;
(i) cellular telephones, data devices (for example, Blackberries) or other communication devices;
(j) entertainment or recreation expenses, including pay-per-view, video, compact disk or DVD rental, in-room entertainment, games, gaming, reading, sports or exercise expenses;
(k) headsets or other in-flight expenses;
(l) dependent care expenses;
(m) pet care expenses;
(n) mini bar charges or sundry items (including gum and snacks);
(o) credit card interest or other credit card expenses;
(p) automobile washes;
(q) fines or other expenses assessed or otherwise incurred in respect of traffic or parking violations; or
(r) fees or other expenses for toll highways or vehicle rental agency administration charges for use of toll highways.
2.4 Method of Reimbursement
OPG will reimburse the Contractor for Allowable Expenses which otherwise meet the requirements of this Schedule and the rest of the Agreement in accordance with the following terms.
(a) Monthly Invoice. The Contractor will deliver to OPG, to the address indicated in the purchase
order or Agreement, on a monthly basis, an invoice for Allowable Expenses in a form and manner acceptable to the OPG Representative, acting reasonably. The Contractor will deliver to the OPG Representative, a copy of the invoice and will ensure that the invoice legibly itemises and, if necessary, briefly describes all allowable expenses. The Contractor will not invoice or otherwise charge OPG for any expenses other than allowable expenses. The Contractor will ensure that all expenses claimed on each such invoice meet the requirements of this Schedule and the rest of the Agreement and are first approved by the Contractor. If the Contractor fails to deliver an invoice
Filed: 2020-12-31 EB-2020-0290
Ex. C1-1-1 Attachment 2
Page 18 of 30

5
OPG Standard Form Business Expense Schedule for Contractors – Updated December 10, 2014
to OPG for an expense within six months of the expenses being incurred, OPG will not be obliged to reimburse the Contractor for such expense.
(b) Receipts. The Contractor will deliver to the OPG Representative, together with a copy of the invoice, original official itemised receipts for each allowable expense claimed (including airline, railway or bus ticket passenger coupons or electronic ticket, boarding passes, vehicle rental contracts, itemised hotel bills and travel itineraries). The Contractor will separate expenses for each Eligible Employee. Debit card and credit card receipts are not acceptable without the itemised receipt. OPG will accept electronic, photocopied or fax copies of receipts.
(c) GST/HST Deducted. The Contractor will deduct all Canadian goods and services tax/harmonized sales tax levied under the Excise Tax Act (Canada) recovered or recoverable by the Contractor on the payment of expenses before submitting any invoice to OPG covering any allowable expenses. The Goods and Services Tax/Harmonized Sales Tax levied under the Excise Tax Act (Canada) and reimbursable by OPG under this Schedule.
(d) Reimbursement. OPG will reimburse the Contractor for Allowable Expenses which meet all of the requirements of this Schedule, received and approved by OPG before the 25th of each month on the 25th of the following month. The Contractor will ensure that all Eligible Employees initially pay for expenses using their own payment methods. OPG will not provide any advances respecting allowable expenses. The Contractor is exclusively responsible for the reimbursement of expenses to all Eligible Employees. Failure by the Contractor to comply with the requirements of this Schedule and the rest of the Agreement may result in delay of reimbursement of expenses or rejection of any invoice in whole or in part.
2.5 Travel Agency
OPG has and may in the future negotiate rates with a travel service to reduce travel and lodging expenses. Unless OPG provides the Contractor with written notice stating otherwise, or the Contractor can demonstrate it can obtain lower rates from providers other than American Express Business Travel, the Contractor will ensure that all Eligible Employees process travel requirements through American Express Business Travel. OPG also encourages the Contractor to have all vehicle rental and hotel arrangements made through American Express Business Travel. American Express Business Travel may be reached in Canada and the United States at 1-866-868-4441. The Contractor will ensure that all Eligible Employees travelling for the purpose of providing services under the Agreement identify themselves to American Express Business Travel as such.
2.6 Confirming Rates
The Contractor will ensure that the rates booked by it or an Eligible Employee are the same or lower than that listed on the travel itinerary.
Filed: 2020-12-31 EB-2020-0290
Ex. C1-1-1 Attachment 2
Page 19 of 30

6
OPG Standard Form Business Expense Schedule for Contractors – Updated December 10, 2014
2.7 Home Base and Work Site
Where applicable, the Contractor will specify in each invoice the Home Base, Reporting Location and the Work Site for each Eligible Employee. At OPG’s request, the Contractor will provide written confirmation from each Eligible Employees as to the employee’s permanent residence and street address. A post office box is not acceptable street address.
2.8 Non EPSCA Eligible Employees and Extended Staff
OPG will only reimburse the Contractor’s Eligible Employees and extended staff, not subscribed to an EPSCA Agreement, expenses incurred from their Home Base to the designated reporting location as per the illustration below and detailed examples provided:
Example A: Home Base is outside the 200 kilometers ring from the reporting location. Prior
approval from an OPG Representative is required and depending on the duration of the assignment, either section 6 or section 7 applies. If the duration is greater than one month, section 7 applies and the Eligible Employee will be paid an “all inclusive” monthly rate (or prorated portion of the month). If the assignment is less than one month, section 6 applies and the Eligible Employee will be paid an “all inclusive” daily rate.
Example B: Home Base is outside the 100 km ring but inside the 200 kilometers ring from the
reporting location. Prior approval from an OPG Representative is required and OPG will pay the less of a daily “all inclusive” rate per section 6 or rates in accordance with sections 2 through 5. If sections 2 through 5 apply, the Eligible Employee will only be entitled to one round trip per week, from Home Base to the reporting location.
Example C: Home Base is within a 100 kilometers radius of the reporting location. In this
scenario, the Eligible Employee is not entitled to any expenses whatsoever. This would include any and all trips to the Work Site within the 100 kilometers radius.
Example D: In this example, the reporting location and Work Site is one and the same. Prior
approval from an OPG Representative is required and the preceding examples A, B and C apply.
Filed: 2020-12-31 EB-2020-0290
Ex. C1-1-1 Attachment 2
Page 20 of 30

7
OPG Standard Form Business Expense Schedule for Contractors – Updated December 10, 2014
EXAMPLE D BN Work Site
EXAMPLE A Employee Home
Base “Residence”EXAMPLE B
EXAMPLE C Reporting
Location
PN Work Site
DN Work Site
200 Km
100 Km
Filed: 2020-12-31 EB-2020-0290
Ex. C1-1-1 Attachment 2
Page 21 of 30

8
OPG Standard Form Business Expense Schedule for Contractors – Updated December 10, 2014
SECTION 3 – AIR, RAIL OR BUS TRAVEL
3.1 Air, Rail or Bus Travel
The expense of air, rail and bus travel is an allowable expense to the extent the actual amount of airfare or, rail or bus fare was incurred by an Eligible Employee in providing services to OPG under the Agreement and to the extent of compliance with the other requirements of this Schedule and the rest of the Agreement. Pre approval by an OPG Representative is required for all air, rail or bus travel. The Contractor will cause Eligible Employees, to the extent possible, to take advantage of hotel and airport shuttles where available. OPG will reimburse the Contractor for the expenses actually incurred by an Eligible Employee for travel between the Eligible Employee’s Home Base, reporting location or Work Site and the airport, rail way station or bus terminal where the Eligible Employee arrives or departs. In addition, the amount of any such reimbursement may not exceed the lesser of:
(a) the expense of the taxi fare or other similar out of pocket charge to travel to or from the
airport, railway station or bus terminal; and
(b) if applicable, parking charges at the airport, railway station or bus terminal.
3.2 Economy Class
Air expenses are not Allowable Expenses unless the Eligible Employee travels on economy class or equivalent. Rail expenses will be permitted for travel by VIA 1 or equivalent.
3.3 Vehicle Instead of Air, Rail or Bus Travel
OPG will only reimburse the Contractor for use of a personal vehicle or rental car (the lesser of) for trips which would customarily be travelled by air, rail or bus, for the amount which is equal to the lesser of:
(a) the expense of the airfare, rail fare or bus fare that would have been reimbursed by OPG to
the Contractor under section 3; and
(b) the amount that would otherwise be reimbursable by OPG to the Contractor for vehicle travel pursuant to section 4. OPG will not reimburse the Contractor for any lodging that would not have been incurred had the trip been made by air, rail or bus.
Filed: 2020-12-31 EB-2020-0290
Ex. C1-1-1 Attachment 2
Page 22 of 30

9
OPG Standard Form Business Expense Schedule for Contractors – Updated December 10, 2014
3.4 Visits Home
OPG will reimburse air, rail or bus travel expenses for a maximum of one round trip home per month for each Eligible Employee on assignment at a Work Site where the duration is more than 45 days and the Home Base of that employee is greater than 400 kilometers from the Work Site.
3.5 Minimising Expenses
The Contractor will, to the extent possible, cause all air travel, to be by “lowest logical airfare”, to take advantage of weekend specials and other discount fares and to reduce overall expenses and plan ahead (booking at least 2 weeks before the departure date is expected).
SECTION 4 – VEHICLES
4.1 Reimbursable Vehicle Expenses The expense of rental vehicles or personal vehicles (the lesser of) used by Eligible Employees
will be and allowable expense to the extent that:
(a) the use of the vehicle was for official OPG business;
(b) the one way distance between the Eligible Employee’s reporting location and the Work Site is greater than 100 kilometers;
(c) the use of the rental vehicle was pre-approved in writing by the OPG Representative; and
(d) the expense otherwise meets the requirements of this Schedule and the rest of the Agreement.
4.2 Personal Vehicle
If the Eligible Employee is required to provide services at a location other than the Eligible Employee’s reporting location, OPG will reimburse the Contractor as an allowable expense for all personal vehicle travel by an Eligible Employee in excess of 200 kilometers (round trip), at the published rates per kilometre on the date of invoice, for vehicle expenses for Ontario set on the Canada Revenue Agency website (www.cra-arc.gc.ca/tx/llrts/menu-eng.html). This Canada Revenue Agency amount covers all vehicle related expenses, except parking.
4.3 Reducing Expenses
The Contractor will use all reasonable attempts to reduce the expenses of vehicle travel by:
Filed: 2020-12-31 EB-2020-0290
Ex. C1-1-1 Attachment 2
Page 23 of 30
10
OPG Standard Form Business Expense Schedule for Contractors – Updated December 10, 2014
(a) arranging for employees to share vehicles to minimise travel expense;
(b) requiring Eligible Employees to use rental vehicle and refuel it before returning it;
(c) considering a long-term lease for lengthy work assignments (that is, more than 30 consecutive days) when the Eligible Employee requires a rental vehicle; and
(d) requiring Eligible Employees to use public transit when travelling to locations within or around urban centres.
4.4 Multiple Users
OPG will only reimburse the Eligible Employee whose vehicle is used when two or more Eligible Employees travel in one vehicle. If two or more Eligible Employees share a rental vehicle, OPG will only reimburse the Eligible Employee who incurred the expense.
SECTION 5 – LODGING
5.1 Overnight Accommodation
The expense of overnight accommodation for Eligible Employees will be an allowable expense to the extent that the overnight stay was pre-approved in writing by OPG Representative and to the extent that the expense otherwise meets the requirements of this Schedule and the rest of the Agreement. The OPG Representative will not approve any overnight accommodation unless:
(a) the presence of the Eligible Employee is required at a Work Site which is more that 200 km
(one way) from that Eligible Employee’s reporting locations or;
(b) poor weather creates hazardous driving conditions and the Eligible Employee cannot safely return to the Eligible Employee’s Home Base;
(c) the Contractor will include a written explanation for all overnight accommodation with the invoice.
SECTION 6 – DAILY RATES
6.1 Daily Rates Instead of Allowable Expenses
To the extent this section 6 applies to any Eligible Employee, none of the terms of section 2 to section 5 apply, except for any Allowable Expenses for air, rail or bus travel between an Eligible Employee’s reporting location and a Work Site that is reimbursable in accordance with section 3. Notwithstanding the previous sentence, the temporary residence (where the Eligible Employee resides while working on the OPG project), or in some instances the Home Base will be
Filed: 2020-12-31 EB-2020-0290
Ex. C1-1-1 Attachment 2
Page 24 of 30

11
OPG Standard Form Business Expense Schedule for Contractors – Updated December 10, 2014
considered the reporting location for the purpose of calculating Allowable Expenses in the event the Eligible Employee is required to travel to a location other than the reporting location.
6.2 Daily Rates
Before the commencement of, or at any time during, a work assignment for any Eligible Employee, OPG may elect based on the remaining duration of the work assignment, the distance between the Eligible Employee’s reporting location and the work site or for other reasons to pay the Contractor a daily rate in respect of that Eligible Employee rather than to reimburse the Contractor for allowable expenses.
6.3 All Inclusive
Except as expressly set out in this section 6, the daily rate set out in section 6.4 is inclusive of all expenses whatsoever that will be reimbursed by OPG, including expenses respecting accommodation, local transportation, work permits and fees, utilities, communication charges, furnishings, insurance and any Allowable Expenses that would otherwise be reimbursable to the Contractor under section 2 to section 5.
6.4 Rates
Subject to adjustment under section 6.5, the following are the daily rates that OPG will pay the Contractor in respect of Work Sites:
(a) City of Toronto, $150 and;
(b) all other locations, $120 (including Mississauga, Pickering, Whitby and Darlington).
6.5 Application of Rate
Where OPG has elected to pay the daily rate for an Eligible Employee, OPG will pay the daily rate to the Contractor on a monthly basis for that Eligible Employee for each full day that the Eligible Employee provided services under the Agreement and for each weekend day unless the Eligible Employee surrendered his or her accommodations. The daily rate will not be paid for any period of an unexcused absence or when the Eligible Employee has surrendered the Eligible Employee’s accommodations during a home visit or absence (includes unavailability to work on weekends if trip home was taken on the weekend). The daily rate will be reduced by $35 for each day of approved trips home and on the last day of providing services under the Agreement. Where OPG has elected to pay the daily rate for Eligible Employees who normally live together, the Eligible Employees are expected to share accommodations. Adjustments may be made to the daily rate set out in section 6.4 if Eligible Employees share accommodations and other expenses.
Filed: 2020-12-31 EB-2020-0290
Ex. C1-1-1 Attachment 2
Page 25 of 30

12
OPG Standard Form Business Expense Schedule for Contractors – Updated December 10, 2014
6.6 Method of Reimbursement
OPG will pay the Contractor the applicable daily rate in accordance with the following terms:
(a) Monthly Invoice. The Contractor will provide OPG, on a monthly basis, with an invoice listing the number of Eligible Employees from whom the Contractor is claiming the daily rate and the number of days being claimed for each Eligible Employee. The Contractor will ensure that the invoice includes a description of the work package or project name and project number (and work breakdown structure element if applicable).
(b) Evidence of Expenses. The Contractor will provide OPG with original or electronic photocopies itemised receipts and time sheets evidencing that the Eligible Employee attended the Work Site and made use of temporary accommodation on each day for which the daily rate is being requested. Debit card and credit card receipts are not acceptable without the itemised receipt. Failure by the Contractor to comply with the requirements of this Schedule and the rest of the Agreement may result in delay of reimbursement of expenses or rejection of any invoice whole or in part.
6.7 Absences
Unless authorised in writing by the OPG Representative, OPG will not be required to pay daily rates for an Eligible Employee where that Eligible Employee was absent from the Work Site without having been excused by the OPG Representative or where that Eligible Employee did not make use of the Eligible Employee’s accommodations during an absence for the Work Site (other than an absence required to perform services to OPG under the Agreement). The OPG Representative may consider authorising payment of the daily rate for absences such as an infrequent sick day or medical appointments requiring exams or tests.
Section 7 – MONTHLTY RATES
To the extent this section 7 applies to any Eligible Employee, none of the terms of section 2 to section 6 apply, except for any Allowable Expenses for air, rail or bus travel between and Eligible Employee’s reporting location and a Work Site that is reimbursable in accordance with section 3. Where OPG elects to pay on a monthly basis in respect of any Eligible Employee, OPG will pay the Contractor $1800 per month (on pro-rated portion of a month). All the terms of section 6 apply to the calculation of this monthly rate, with such modifications as the circumstances require.
Filed: 2020-12-31 EB-2020-0290
Ex. C1-1-1 Attachment 2
Page 26 of 30

28872291.8
- 12 -
SCHEDULE 3
Rule 13A of the Board’s Rules of Practice and Procedure
13A. Expert Evidence
13A.01 A party may engage, and two or more parties may jointly engage, one or more experts to give evidence in a proceeding on issues that are relevant to the expert’s area of expertise.
13A.02 An expert shall assist the Board impartially by giving evidence that is fair and objective.
13A.03 An expert’s evidence shall, at a minimum, include the following:
(a) the expert’s name, business name and address, and general area of expertise;
(b) the expert’s qualifications, including the expert’s relevant educational and professional experience in respect of each issue in the proceeding to which the expert’s evidence relates;
(c) the instructions provided to the expert in relation to the proceeding and, where applicable, to each issue in the proceeding to which the expert’s evidence relates;
(d) the specific information upon which the expert’s evidence is based, including a description of any factual assumptions made and research conducted, and a list of the documents relied on by the expert in preparing the evidence;
(e) in the case of evidence that is provided in response to another expert’s evidence, a summary of the points of agreement and disagreement with the other expert’s evidence; and
(f) an acknowledgement of the expert’s duty to the Board in Form A to these Rules, signed by the expert.
13A.04 In a proceeding where two or more parties have engaged experts, the Board may require two or more of the experts to:
(a) in advance of the hearing, confer with each other for the purposes of, among others, narrowing issues, identifying the points on which their views differ and are in agreement, and preparing a joint written statement to be admissible as evidence at the hearing; and
(b) at the hearing, appear together as a concurrent expert panel for the purposes of, among others, answering questions from the Board and others as permitted by the Board, and providing comments on the views of another expert on the same panel.
13A.05 The activities referred to in Rule 13A.04 shall be conducted in accordance with such directions as may be given by the Board, including as to:
(a) scope and timing;
(b) the involvement of any expert engaged by the Board;
(c) the costs associated with the conduct of the activities;
(d) the attendance or non-attendance of counsel for the parties, or of other persons, in respect of the activities referred to in paragraph (a) of Rule 13A.04; and
Filed: 2020-12-31 EB-2020-0290
Ex. C1-1-1 Attachment 2
Page 27 of 30

28872291.8
- 13 -
(e) any issues in relation to confidentiality.
13A.06 A party that engages an expert shall ensure that the expert is made aware of, and has agreed to accept, the responsibilities that are or may be imposed on the expert as set out in this Rule 13A and Form A.
Filed: 2020-12-31 EB-2020-0290
Ex. C1-1-1 Attachment 2
Page 28 of 30

28872291.8
- 14 -
SCHEDULE 4
FORM A
Proceeding:
ACKNOWLEDGMENT OF EXPERT’S DUTY
1. My name is ............................................. (name). I live at ....................... (city), in
the ......................... (province/state) of ..........................
2. I have been engaged by or on behalf of .................................. (name of
party/parties) to provide evidence in relation to the above-noted proceeding
before the Ontario Energy Board.
3. I acknowledge that it is my duty to provide evidence in relation to this proceeding
as follows:
(a) to provide opinion evidence that is fair, objective and non-partisan; (b) to provide opinion evidence that is related only to matters that are within my
area of expertise; and
(c) to provide such additional assistance as the Board may reasonably require, to
determine a matter in issue.
4. I acknowledge that the duty referred to above prevails over any obligation which I
may owe to any party by whom or on whose behalf I am engaged.
Date ..........................................
Signature
James Coyne
January 10, 2020
Lincoln
Massachusetts United States
Ontario Power Generation
Filed: 2020-12-31 EB-2020-0290
Ex. C1-1-1 Attachment 2
Page 29 of 30

28872291.8
- 14 -
SCHEDULE 4
FORM A
Proceeding:
ACKNOWLEDGMENT OF EXPERT’S DUTY
1. My name is ............................................. (name). I live at ....................... (city), in
the ......................... (province/state) of ..........................
2. I have been engaged by or on behalf of .................................. (name of
party/parties) to provide evidence in relation to the above-noted proceeding
before the Ontario Energy Board.
3. I acknowledge that it is my duty to provide evidence in relation to this proceeding
as follows:
(a) to provide opinion evidence that is fair, objective and non-partisan; (b) to provide opinion evidence that is related only to matters that are within my
area of expertise; and
(c) to provide such additional assistance as the Board may reasonably require, to
determine a matter in issue.
4. I acknowledge that the duty referred to above prevails over any obligation which I
may owe to any party by whom or on whose behalf I am engaged.
Date ..........................................
Signature
Daniel Dane
January 10, 2020
Northborough
Massachusetts United States
Ontario Power Generation
Filed: 2020-12-31 EB-2020-0290
Ex. C1-1-1 Attachment 2
Page 30 of 30

Numbers may not add due to rounding. Filed: 2020-12-31EB-2020-0290
Exhibit C1Tab 1
Schedule 1Table 1
Line Principal Component Cost Rate Cost ofNo. Capitalization Note ($M) (%) (%) Capital ($M)
(a) (b) (c) (d)
Capitalization and Return on Capital:1 Short-term Debt 1 97.4 0.4% 2.23% 7.2 2 Existing/Planned Long-Term Debt 2 3,680.9 16.6% 3.65% 134.5 3 Other Long-Term Debt Provision 3 7,316.5 33.0% 3.65% 267.4 4 Total Debt 4 11,094.8 50.0% 3.69% 409.1
5 Common Equity 4 11,094.8 50.0% 8.34% 925.3
6 Rate Base Financed by Capital Structure 5 22,189.6 100.0% 6.01% 1,334.4
7 Adjustment for Lesser of UNL or ARC 5, 6 0.0 0.0% 4.89% 0.0
8 Rate Base 22,189.6 100% 6.01% 1,334.4
Notes:1
2
4
6
3 Debt required to balance capital structure with proposed rate base. Cost rate is the same cost rate used for Existing/Planned Long-Term Debt (line 2). See Ex. C1-1-2, Section 5.0. Capital Structure proposed in Ex. C1-1-1, Attch 1. Return on Equity reflects the last Cost of Capital Parameter Update published by the OEB (November 9, 2020).
5 The portion of rate base to be financed by the capital structure approved by the OEB excludes the lesser of the forecast of the average unfunded nuclear liabilities (UNL) related to Pickering and Darlington, and the average unamortized asset retirement costs (ARC) included in fixed asset balances for Pickering and Darlington. Principal from C2-1-1 Table 2, line 30. Cost rate from Ex. C2-1-1, Section 4.1.4.
Ex. C1-1-2 Table 12, line 26.
Table 1Capitalization and Cost of Capital
Summary of Capitalization and Cost of CapitalCalendar Year Ending December 31, 2026
Ex. C1-1-3 Table 2: Principal (line 7), Cost Rate (line 2), Cost of Capital (line 8). Cost includes interest at the cost rate shown plus an allocation of the credit facility cost.

Numbers may not add due to rounding. Filed: 2020-12-31EB-2020-0290
Exhibit C1Tab 1
Schedule 1Table 2
Line Principal Component Cost Rate Cost ofNo. Capitalization Note ($M) (%) (%) Capital ($M)
(a) (b) (c) (d)
Capitalization and Return on Capital:1 Short-term Debt 1 97.4 0.5% 1.66% 6.7 2 Existing/Planned Long-Term Debt 2 3,686.2 17.6% 3.65% 134.7 3 Other Long-Term Debt Provision 3 6,706.9 32.0% 3.65% 245.0 4 Total Debt 4 10,490.5 50.0% 3.68% 386.4
5 Common Equity 4 10,490.5 50.0% 8.34% 874.9
6 Rate Base Financed by Capital Structure 5 20,980.9 100.0% 6.01% 1,261.3
7 Adjustment for Lesser of UNL or ARC 5, 6 0.0 0.0% 4.89% 0.0
8 Rate Base 20,980.9 100% 6.01% 1,261.3
Notes:1
2
4
6
3 Debt required to balance capital structure with proposed rate base. Cost rate is the same cost rate used for Existing/Planned Long-Term Debt (line 2). See Ex. C1-1-2, Section 5.0. Capital Structure proposed in Ex. C1-1-1, Attch 1. Return on Equity reflects the last Cost of Capital Parameter Update published by the OEB (November 9, 2020).
5 The portion of rate base to be financed by the capital structure approved by the OEB excludes the lesser of the forecast of the average unfunded nuclear liabilities (UNL) related to Pickering and Darlington, and the average unamortized asset retirement costs (ARC) included in fixed asset balances for Pickering and Darlington. Principal from C2-1-1 Table 2, line 30. Cost rate from Ex. C2-1-1, Section 4.1.4.
Ex. C1-1-2 Table 11, line 26.
Table 2Capitalization and Cost of Capital
Summary of Capitalization and Cost of CapitalCalendar Year Ending December 31, 2025
Ex. C1-1-3 Table 2: Principal (line 7), Cost Rate (line 2), Cost of Capital (line 8). Cost includes interest at the cost rate shown plus an allocation of the credit facility cost.

Numbers may not add due to rounding. Filed: 2020-12-31EB-2020-0290
Exhibit C1Tab 1
Schedule 1Table 3
Line Principal Component Cost Rate Cost ofNo. Capitalization Note ($M) (%) (%) Capital ($M)
(a) (b) (c) (d)
Capitalization and Return on Capital:1 Short-term Debt 1 97.4 0.5% 1.16% 6.2 2 Existing/Planned Long-Term Debt 2 3,764.6 19.4% 3.61% 136.0 3 Other Long-Term Debt Provision 3 5,859.5 30.1% 3.61% 211.7 4 Total Debt 4 9,721.5 50.0% 3.64% 354.0
5 Common Equity 4 9,721.5 50.0% 8.34% 810.8
6 Rate Base Financed by Capital Structure 5 19,443.0 100.0% 5.99% 1,164.8
7 Adjustment for Lesser of UNL or ARC 5, 6 0.0 0.0% 4.89% 0.0
8 Rate Base 19,443.0 100% 5.99% 1,164.8
Notes:1
2
4
6
3 Debt required to balance capital structure with proposed rate base. Cost rate is the same cost rate used for Existing/Planned Long-Term Debt (line 2). See Ex. C1-1-2, Section 5.0. Capital Structure proposed in Ex. C1-1-1, Attch 1. Return on Equity reflects the last Cost of Capital Parameter Update published by the OEB (November 9, 2020).
5 The portion of rate base to be financed by the capital structure approved by the OEB excludes the lesser of the forecast of the average unfunded nuclear liabilities (UNL) related to Pickering and Darlington, and the average unamortized asset retirement costs (ARC) included in fixed asset balances for Pickering and Darlington. Principal from C2-1-1 Table 2, line 30. Cost rate from Ex. C2-1-1, Section 4.1.4.
Ex. C1-1-2 Table 10, line 27.
Table 3Capitalization and Cost of Capital
Summary of Capitalization and Cost of CapitalCalendar Year Ending December 31, 2024
Ex. C1-1-3 Table 2: Principal (line 7), Cost Rate (line 2), Cost of Capital (line 8). Cost includes interest at the cost rate shown plus an allocation of the credit facility cost.
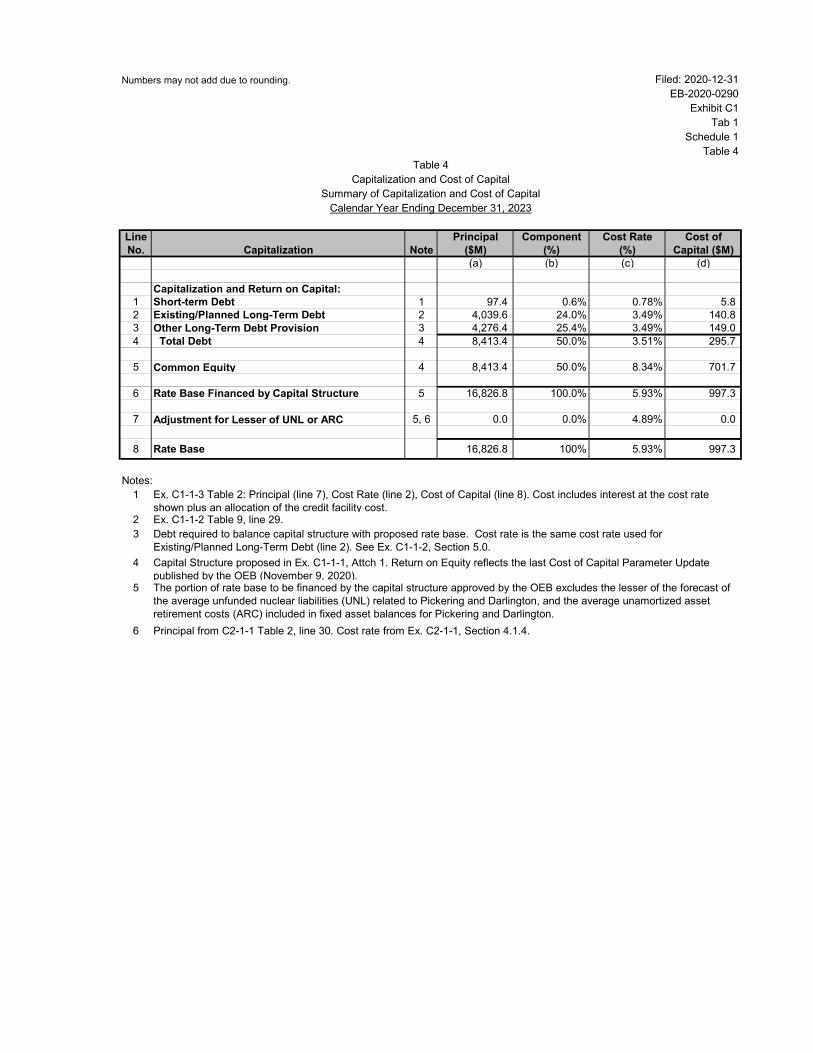
Numbers may not add due to rounding. Filed: 2020-12-31EB-2020-0290
Exhibit C1Tab 1
Schedule 1Table 4
Line Principal Component Cost Rate Cost ofNo. Capitalization Note ($M) (%) (%) Capital ($M)
(a) (b) (c) (d)
Capitalization and Return on Capital:1 Short-term Debt 1 97.4 0.6% 0.78% 5.8 2 Existing/Planned Long-Term Debt 2 4,039.6 24.0% 3.49% 140.8 3 Other Long-Term Debt Provision 3 4,276.4 25.4% 3.49% 149.0 4 Total Debt 4 8,413.4 50.0% 3.51% 295.7
5 Common Equity 4 8,413.4 50.0% 8.34% 701.7
6 Rate Base Financed by Capital Structure 5 16,826.8 100.0% 5.93% 997.3
7 Adjustment for Lesser of UNL or ARC 5, 6 0.0 0.0% 4.89% 0.0
8 Rate Base 16,826.8 100% 5.93% 997.3
Notes:1
2
4
6
3 Debt required to balance capital structure with proposed rate base. Cost rate is the same cost rate used for Existing/Planned Long-Term Debt (line 2). See Ex. C1-1-2, Section 5.0. Capital Structure proposed in Ex. C1-1-1, Attch 1. Return on Equity reflects the last Cost of Capital Parameter Update published by the OEB (November 9, 2020).
5 The portion of rate base to be financed by the capital structure approved by the OEB excludes the lesser of the forecast of the average unfunded nuclear liabilities (UNL) related to Pickering and Darlington, and the average unamortized asset retirement costs (ARC) included in fixed asset balances for Pickering and Darlington. Principal from C2-1-1 Table 2, line 30. Cost rate from Ex. C2-1-1, Section 4.1.4.
Ex. C1-1-2 Table 9, line 29.
Table 4Capitalization and Cost of Capital
Summary of Capitalization and Cost of CapitalCalendar Year Ending December 31, 2023
Ex. C1-1-3 Table 2: Principal (line 7), Cost Rate (line 2), Cost of Capital (line 8). Cost includes interest at the cost rate shown plus an allocation of the credit facility cost.

Numbers may not add due to rounding. Filed: 2020-12-31EB-2020-0290
Exhibit C1Tab 1
Schedule 1Table 5
Line Principal Component Cost Rate Cost ofNo. Capitalization Note ($M) (%) (%) Capital ($M)
(a) (b) (c) (d)
Capitalization and Return on Capital:1 Short-term Debt 1 97.4 0.6% 0.47% 5.5 2 Existing/Planned Long-Term Debt 2 3,837.8 23.3% 3.61% 138.4 3 Other Long-Term Debt Provision 3 4,305.9 26.1% 3.61% 155.2 4 Total Debt 4 8,241.0 50.0% 3.63% 299.1
5 Common Equity 4 8,241.0 50.0% 8.34% 687.3
6 Rate Base Financed by Capital Structure 5 16,482.0 99.6% 5.98% 986.4
7 Adjustment for Lesser of UNL or ARC 5, 6 73.6 0.4% 4.89% 3.6
8 Rate Base 16,555.6 100% 5.98% 990.0
Notes:1
2
4
6
3 Debt required to balance capital structure with proposed rate base. Cost rate is the same cost rate used for Existing/Planned Long-Term Debt (line 2). See Ex. C1-1-2, Section 5.0. Capital Structure proposed in Ex. C1-1-1, Attch 1. Return on Equity reflects the last Cost of Capital Parameter Update published by the OEB (November 9, 2020).
5 The portion of rate base to be financed by the capital structure approved by the OEB excludes the lesser of the forecast of the average unfunded nuclear liabilities (UNL) related to Pickering and Darlington, and the average unamortized asset retirement costs (ARC) included in fixed asset balances for Pickering and Darlington. Principal from C2-1-1 Table 2, line 30. Cost rate from Ex. C2-1-1, Section 4.1.4.
Ex. C1-1-2 Table 8, line 35.
Table 5Capitalization and Cost of Capital
Summary of Capitalization and Cost of CapitalCalendar Year Ending December 31, 2022
Ex. C1-1-3 Table 2: Principal (line 7), Cost Rate (line 2), Cost of Capital (line 8). Cost includes interest at the cost rate shown plus an allocation of the credit facility cost.

Numbers may not add due to rounding. Filed: 2020-12-31EB-2020-0290
Exhibit C1Tab 1
Schedule 1Table 6
Line Principal Component Cost Rate Cost ofNo. Capitalization Note ($M) (%) (%) Capital ($M)
(a) (b) (c) (d)
Capitalization and Return on Capital:1 Short-term Debt 1 97.4 0.6% 0.44% 5.6 2 Existing/Planned Long-Term Debt 2 3,676.7 22.7% 3.83% 140.8 3 Other Long-Term Debt Provision 3 5,137.5 31.7% 3.83% 196.8 4 Total Debt 4 8,911.6 55.0% 3.85% 343.2
5 Common Equity 4 7,291.3 45.0% 10.24% 746.3
6 Rate Base Financed by Capital Structure 5 16,202.9 98.0% 6.72% 1,089.5
7 Adjustment for Lesser of UNL or ARC 5, 6 324.1 2.0% 4.89% 15.9
8 Rate Base 16,527.1 100% 6.69% 1,105.4
Notes:1
2
4
6
3 Debt required to balance capital structure with proposed rate base. Cost rate is the same cost rate used for Existing/Planned Long-Term Debt (line 2). See Ex. C1-1-2, Section 5.0. Capital Structure as approved by the OEB in EB-2016-0152. Return on Equity as calculated in Ex. I1-1-1, Table 5.
5 The portion of rate base to be financed by the capital structure approved by the OEB excludes the lesser of the forecast of the average unfunded nuclear liabilities (UNL) related to Pickering and Darlington, and the average unamortized asset retirement costs (ARC) included in fixed asset balances for Pickering and Darlington. Principal from C2-1-1 Table 2, line 30. Cost rate from Ex. C2-1-1, Section 4.1.4.
Ex. C1-1-2 Table 7, line 36.
Table 6Capitalization and Cost of Capital
Summary of Capitalization and Cost of CapitalCalendar Year Ending December 31, 2021
Ex. C1-1-3 Table 2: Principal (line 7), Cost Rate (line 2), Cost of Capital (line 8). Cost includes interest at the cost rate shown plus an allocation of the credit facility cost.

Numbers may not add due to rounding. Updated: 2021-03-12EB-2020-0290
Exhibit C1Tab 1
Schedule 1Table 7
Line Principal Component Cost Rate Cost ofNo. Capitalization Note ($M) (%) (%) Capital ($M)
(a) (b) (c) (d)
Capitalization and Return on Capital:1 Short-term Debt 1 97.4 0.7% 0.70% 4.2 2 Existing/Planned Long-Term Debt 2 3,889.3 27.6% 4.01% 156.1 3 Other Long-Term Debt Provision 3 3,771.2 26.7% 4.01% 151.4 4 Total Debt 4 7,757.9 55.0% 4.02% 311.7
5 Common Equity 4 6,347.3 45.0% 12.67% 804.4
6 Rate Base Financed by Capital Structure 5 14,105.2 97.2% 7.91% 1,116.0
7 Adjustment for Lesser of UNL or ARC 5, 6 406.3 2.8% 4.89% 19.9
8 Rate Base 14,511.5 100% 7.83% 1,135.9
Notes:1
2
4
6
3 Debt required to balance capital structure with proposed rate base. Cost rate is the same cost rate used for Existing/Planned Long-Term Debt (line 2). See Ex. C1-1-2, Section 5.0.
5 The portion of rate base to be financed by the capital structure approved by the OEB excludes the lesser of the forecast of the average unfunded nuclear liabilities (UNL) related to Pickering and Darlington, and the average unamortized asset retirement costs (ARC) included in fixed asset balances for Pickering and Darlington. Principal from C2-1-1, Table 2, line 30. Cost rate from Ex. C2-1-1, Section 4.1.4.
Capital Structure as approved by the OEB in EB-2016-0152. Return on Equity as calculated in Ex. I1-1-1 Table 4.
Ex. C1-1-2 Table 6, line 40.
Table 7Capitalization and Cost of Capital
Summary of Capitalization and Cost of CapitalCalendar Year Ending December 31, 2020
Ex. C1-1-3 Table 2: Principal (line 7), Cost Rate (line 2), Cost of Capital (line 8). Cost includes interest at the cost rate shown plus an allocation of the credit facility cost.

Numbers may not add due to rounding. Filed: 2020-12-31EB-2020-0290
Exhibit C1Tab 1
Schedule 1Table 8
Line Principal Component Cost Rate Cost ofNo. Capitalization Note ($M) (%) (%) Capital ($M)
(a) (b) (c) (d)
Capitalization and Return on Capital:1 Short-term Debt 1 139.9 1.3% 1.96% 5.1 2 Existing/Planned Long-Term Debt 2 3,962.3 36.0% 4.33% 171.4 3 Other Long-Term Debt Provision 3 1,946.0 17.7% 4.33% 84.2 4 Total Debt 4 6,048.2 55.0% 4.31% 260.7
5 Common Equity 4 4,948.5 45.0% 15.72% 778.1
6 Rate Base Financed by Capital Structure 5 10,996.7 95.7% 9.45% 1,038.8
7 Adjustment for Lesser of UNL or ARC 5, 6 488.5 4.3% 4.90% 23.9
8 Rate Base 11,485.1 100% 9.25% 1,062.7
Notes:1
2
4
6
3 Debt required to balance capital structure with proposed rate base. Cost rate is the same cost rate used for Existing/Planned Long-Term Debt (line 2). See Ex. C1-1-2, Section 5.0.
5 The portion of rate base to be financed by the capital structure approved by the OEB excludes the lesser of the forecast of the average unfunded nuclear liabilities (UNL) related to Pickering and Darlington, and the average unamortized asset retirement costs (ARC) included in fixed asset balances for Pickering and Darlington. Principal from C2-1-1, Table 2, line 30. Cost rate from Ex. C2-1-1, Section 4.1.4.
Capital Structure as approved in EB-2016-0152. Return on Equity in col. (d) determined using the reconciliation approach discussed in EB-2013-0321 Ex. C1-1-1 Section 4.2, starting with the financial results for OPG's prescribed assets calculated in accordance with US GAAP.
Ex. C1-1-2 Table 5, line 44.
Table 8Capitalization and Cost of Capital
Summary of Capitalization and Actual Cost of CapitalCalendar Year Ending December 31, 2019
Ex. C1-1-3 Table 2: Principal (line 7), Cost Rate (line 2), Cost of Capital (line 8). Cost includes interest at the cost rate shown plus an allocation of the credit facility cost.

Numbers may not add due to rounding. Updated: 2021-04-29 EB-2020-0290
Exhibit C1Tab 1
Schedule 1 Table 9
Line Principal Component Cost Rate Cost ofNo. Capitalization Note ($M) (%) (%) Capital ($M)
(a) (b) (c) (d)
Capitalization and Return on Capital:1 Short-term Debt 1 86.2 0.8% 1.67% 3.7 2 Existing/Planned Long-Term Debt 2 3,783.4 35.1% 4.48% 169.5 3 Other Long-Term Debt Provision 3 2,056.6 19.1% 4.48% 92.1 4 Total Debt 4 5,926.2 55.0% 4.48% 265.3
5 Common Equity 4 4,848.7 45.0% 10.72% 519.8
6 Rate Base Financed by Capital Structure 5 10,775.0 95.0% 7.29% 785.1
7 Adjustment for Lesser of UNL or ARC 5, 6 570.6 5.0% 4.93% 28.1
8 Rate Base 11,345.6 100% 7.17% 813.2
Notes:1
2
4
6
3 Debt required to balance capital structure with proposed rate base. Cost rate is the same cost rate used for Existing/Planned Long-Term Debt (line 2). See Ex. C1-1-2, Section 5.0.
5 The portion of rate base to be financed by the capital structure approved by the OEB excludes the lesser of the forecast of the average unfunded nuclear liabilities (UNL) related to Pickering and Darlington, and the average unamortized asset retirement costs (ARC) included in fixed asset balances for Pickering and Darlington.
Principal from C2-1-1 Table 2, line 30. Cost rate from Ex. C2-1-1, Section 4.1.4.
Capital Structure as approved in EB-2016-0152. Return on Equity in col. (d) determined using the reconciliation approach discussed in EB-2013-0321 Ex. C1-1-1 Section 4.2, starting with the financial results for OPG's prescribed assets calculated in accordance with US GAAP.
Ex. C1-1-2 Table 4, line 45.
Table 9Capitalization and Cost of Capital
Summary of Capitalization and Actual Cost of CapitalCalendar Year Ending December 31, 2018
Ex. C1-1-3 Table 2: Principal (line 7), Cost Rate (line 2), Cost of Capital (line 8). Cost includes interest at the cost rate shown plus an allocation of the credit facility cost.

Numbers may not add due to rounding. Filed: 2020-12-31EB-2020-0290
Exhibit C1Tab 1
Schedule 1Table 10
Line Principal Component Cost Rate Cost ofNo. Capitalization Note ($M) (%) (%) Capital ($M)
(a) (b) (c) (d)
Capitalization and Return on Capital:1 Short-term Debt 1 38.8 0.4% 1.10% 2.8 2 Existing/Planned Long-Term Debt 2 3,016.0 28.8% 4.99% 150.4 3 Other Long-Term Debt Provision 3 2,705.4 25.8% 4.99% 134.9 4 Total Debt 4 5,760.3 55.0% 5.00% 288.1
5 Common Equity 4 4,712.9 45.0% 6.02% 283.7
6 Rate Base Financed by Capital Structure 5 10,473.2 95.4% 5.46% 571.8
7 Adjustment for Lesser of UNL or ARC 5, 6 505.1 4.6% 4.95% 25.0
8 Rate Base 10,978.3 100% 5.44% 596.8
Notes:1
2
4
6
3 Debt required to balance capital structure with proposed rate base. Cost rate is the same cost rate used for Existing/Planned Long-Term Debt (line 2). See Ex. C1-1-2, Section 5.0.
5 The portion of rate base to be financed by the capital structure approved by the OEB excludes the lesser of the forecast of the average unfunded nuclear liabilities (UNL) related to Pickering and Darlington, and the average unamortized asset retirement costs (ARC) included in fixed asset balances for Pickering and Darlington. Principal from C2-1-1 Table 2, line 30. Cost rate from Ex. C2-1-1, Section 4.1.4.
Capital Structure as approved in EB-2016-0152 and EB-2013-0321. Return on Equity in col. (d) determined using the reconciliation approach discussed in EB-2013-0321 Ex. C1-1-1 Section 4.2, starting with the financial results for OPG's prescribed assets calculated in accordance with US GAAP.
Ex. C1-1-2 Table 3, line 46.
Table 10Capitalization and Cost of Capital
Summary of Capitalization and Actual Cost of CapitalCalendar Year Ending December 31, 2017
Ex. C1-1-3 Table 2: Principal (line 7), Cost Rate (line 2), Cost of Capital (line 8). Cost includes interest at the cost rate shown plus an allocation of the credit facility cost.
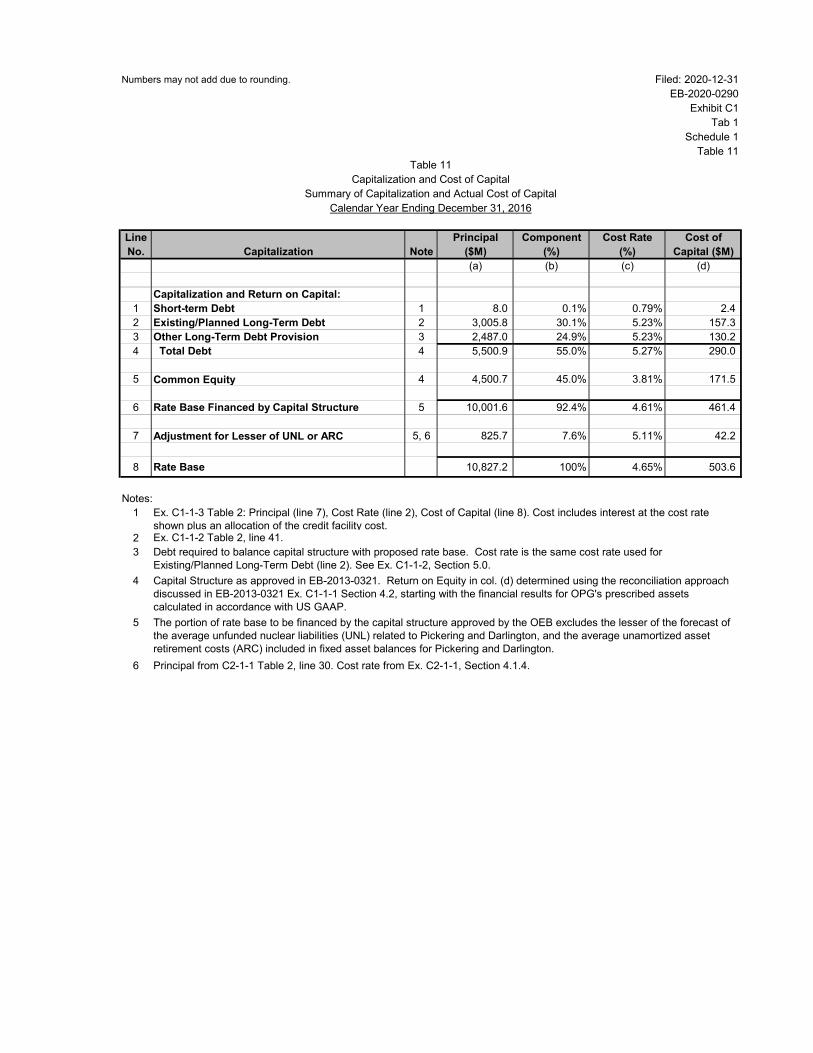
Numbers may not add due to rounding. Filed: 2020-12-31EB-2020-0290
Exhibit C1Tab 1
Schedule 1Table 11
Line Principal Component Cost Rate Cost ofNo. Capitalization Note ($M) (%) (%) Capital ($M)
(a) (b) (c) (d)
Capitalization and Return on Capital:1 Short-term Debt 1 8.0 0.1% 0.79% 2.4 2 Existing/Planned Long-Term Debt 2 3,005.8 30.1% 5.23% 157.3 3 Other Long-Term Debt Provision 3 2,487.0 24.9% 5.23% 130.2 4 Total Debt 4 5,500.9 55.0% 5.27% 290.0
5 Common Equity 4 4,500.7 45.0% 3.81% 171.5
6 Rate Base Financed by Capital Structure 5 10,001.6 92.4% 4.61% 461.4
7 Adjustment for Lesser of UNL or ARC 5, 6 825.7 7.6% 5.11% 42.2
8 Rate Base 10,827.2 100% 4.65% 503.6
Notes:1
2
4
6
Ex. C1-1-2 Table 2, line 41.
Table 11Capitalization and Cost of Capital
Summary of Capitalization and Actual Cost of CapitalCalendar Year Ending December 31, 2016
Ex. C1-1-3 Table 2: Principal (line 7), Cost Rate (line 2), Cost of Capital (line 8). Cost includes interest at the cost rate shown plus an allocation of the credit facility cost.
Principal from C2-1-1 Table 2, line 30. Cost rate from Ex. C2-1-1, Section 4.1.4.
3 Debt required to balance capital structure with proposed rate base. Cost rate is the same cost rate used for Existing/Planned Long-Term Debt (line 2). See Ex. C1-1-2, Section 5.0. Capital Structure as approved in EB-2013-0321. Return on Equity in col. (d) determined using the reconciliation approach discussed in EB-2013-0321 Ex. C1-1-1 Section 4.2, starting with the financial results for OPG's prescribed assets calculated in accordance with US GAAP.
5 The portion of rate base to be financed by the capital structure approved by the OEB excludes the lesser of the forecast of the average unfunded nuclear liabilities (UNL) related to Pickering and Darlington, and the average unamortized asset retirement costs (ARC) included in fixed asset balances for Pickering and Darlington.