Filamentation and Forward Brillouin Scatter of Entire ... · Filamentation and forward Brillouin...
26
Approved for public release; further dissemination unlimited Lawrence Livermore National Laboratory U.S. Department of Energy Preprint UCRL-JC-135006 Filamentation and Forward Brillouin Scatter of Entire Smoothed and Aberrated Laser Beams C.H. Still, R.L. Berger, A.B. Langdon, D.E. Hinkel, L.J. Suter, and E.A. Williams This article was submitted to the 41 st Annual Meeting of the Division of Plasma Physics, Seattle, WA, November 15-19, 1999 October 29, 1999
Transcript of Filamentation and Forward Brillouin Scatter of Entire ... · Filamentation and forward Brillouin...
Approved for public release; further dissemination unlimited
LawrenceLivermoreNationalLaboratory
U.S. Department of Energy
Preprint UCRL-JC-135006
Filamentation and Forward Brillouin Scatter of Entire Smoothed and Aberrated Laser Beams
C.H. Still, R.L. Berger, A.B. Langdon, D.E. Hinkel, L.J. Suter, and E.A. Williams
This article was submitted to the 41st Annual Meeting of the Division of Plasma Physics, Seattle, WA, November 15-19, 1999
October 29, 1999
DISCLAIMER This document was prepared as an account of work sponsored by an agency of the United States Government. Neither the United States Government nor the University of California nor any of their employees, makes any warranty, express or implied, or assumes any legal liability or responsibility for the accuracy, completeness, or usefulness of any information, apparatus, product, or process disclosed, or represents that its use would not infringe privately owned rights. Reference herein to any specific commercial product, process, or service by trade name, trademark, manufacturer, or otherwise, does not necessarily constitute or imply its endorsement, recommendation, or favoring by the United States Government or the University of California. The views and opinions of authors expressed herein do not necessarily state or reflect those of the United States Government or the University of California, and shall not be used for advertising or product endorsement purposes. This is a preprint of a paper intended for publication in a journal or proceedings. Since changes may be made before publication, this preprint is made available with the understanding that it will not be cited or reproduced without the permission of the author.
This report has been reproduced directly from the best available copy.
Available electronically at http://www.doc.gov/bridge
Available for a processing fee to U.S. Department of Energy And its contractors in paper from
U.S. Department of Energy Office of Scientific and Technical Information
P.O. Box 62 Oak Ridge, TN 37831-0062 Telephone: (865) 576-8401 Facsimile: (865) 576-5728
E-mail: [email protected]
Available for the sale to the public from U.S. Department of Commerce
National Technical Information Service 5285 Port Royal Road Springfield, VA 22161
Telephone: (800) 553-6847 Facsimile: (703) 605-6900
E-mail: [email protected] Online ordering: http://www.ntis.gov/ordering.htm
OR
Lawrence Livermore National Laboratory Technical Information Department’s Digital Library
http://www.llnl.gov/tid/Library.html
Filamentation and forward Brillouin scatter of entire smoothed
and aberrated laser beams*
C. H. Still,+ R. L. B erger, A. B. Langdon, D. E. Hinkel, L. J. Suter, and E. A. Williams
Lawrence Livermore National Laboratory
7000 East Avenue, L-031
Livermore, CA 94550
(Draft as of Fri Ott 29 11:31:02 PDT 1999)
Abstract
Laser-plasma interactions are sensitive to both the fine-scale speckle and the
larger scale envelope intensity of the beam. For some time, simulations have
been done on volumes taken from part of the laser beam cross-section, and
the results from multiple simulations extrapolated to predict the behavior
of the entire beam. However, extrapolation could very well miss effects of
the larger scale structure on the fine-scale. The only definitive method is to
simulate the entire beam. These very large calculations have been infeasible
until recently, but they are now possible on massively parallel computers.
Whole beam simulations show the dramatic difference in the propagation and
break up of smoothed and aberrated beams.
*Work performed under the auspices of the U. S. DOE by LLNL under contract No. W-7405-ENG-
48.
I. INTRODUCTION
Because of the increased laser intensity and longer path lengths present in csperimcnts on
the National Ignition Facility (NIF), understanding the effects of laser-plasma interactions
(LPI) will be more important in successfully achieving ignition. Both the fine-scale speckle
and the larger scale envelope intensity of the beam heavily influence LPI. Previously, results
from several simulations performed on volumes taken from part of the laser beam cross-
section have been combined to extrapolate the behavior of a full-scale calculation. However,
there is the potential for inherent inaccuracies in this approach, and important interaction
effects of the large-scale structure on the fine-scale speckles are neglected. The only definitive
method of including these effects is to perform simulations on the entire beam.
Since NIF is still under construction, and several years away from fielding experiments,
simulations of NIF conditions are performed on the NOVA laser at Lawrence Livermore Na-
tional Laboratory and the Omega laser at the Laboratory for Laser Energetics (University
of Rochester). We can simulate the LPI present in these experiments numerically and then
benchmark our results against the actual experiments. Numerical simulations use measure-
ments taken from one of the NOVA beamlines and plasma conditions from experimental data
or LASNEXi7 calculations. To our knowledge, there are no other whole beam simulations
of laser-plasma interactions (LPI) which include all these lentgh scales.
F3D is a well-documented 3D laser propagation hydrocode (see, e. g., Berger, et a1.3 and
Still, et a1.i5). It also includes models for stimulated Brillouin and Raman backscatter4,5.
In order to be able to simulate larger plasma volumes, we are redesigning F3D to run
on massively parallel processors (MPPs).i Using the MPP code pF3d, we have simulated
whole NOVA beam filamentation, beam bending, and forward SBS. These calculations are
large, requiring 1.5 billion zones for a NOVA beam sized plasma (a data set of around 120
gigabytes) and running for a few days on a large MPP.
In this article, we will discuss the beam models, then present whole beam simulation re-
sults demonstrating the dramatic difference in the propagation of smoothed and unsmoothed
2
laser beams. A discussion of the massively parallel simulation code is included in the ap-
pendix for completeness.
II. LASER BEAM MODELS
The electric field input to the simulation code is generated using measurements taken
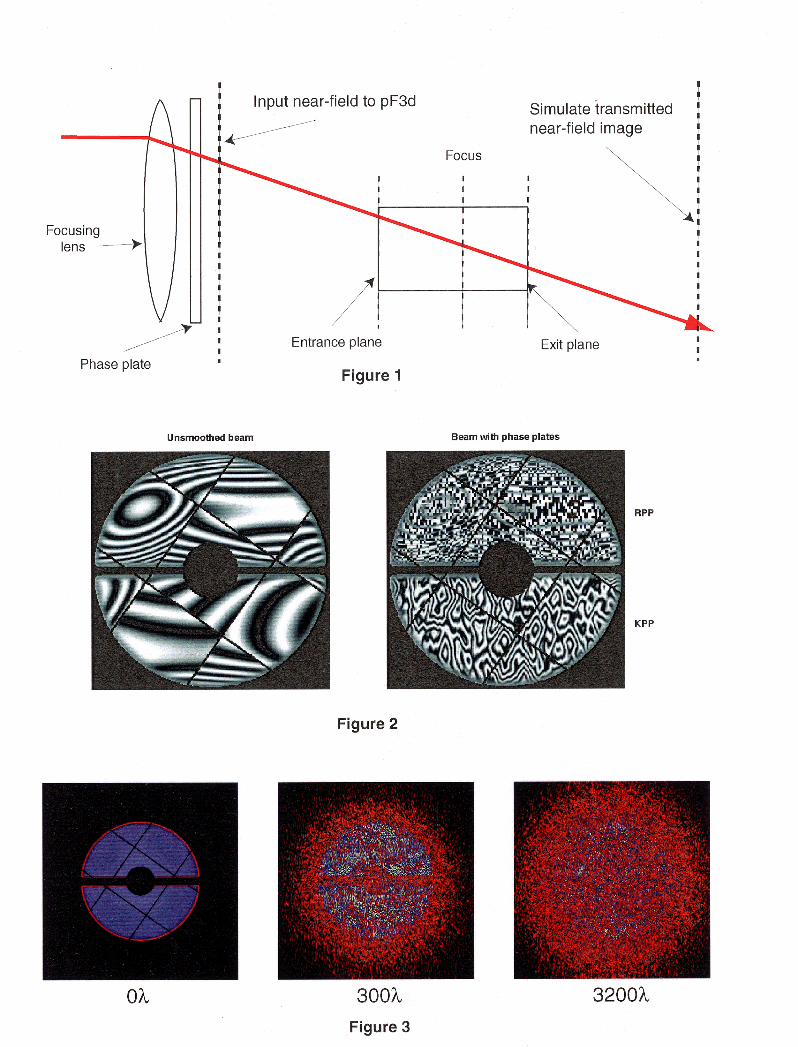
from the final optics assembly of a beamline in the NOVA laser. Fig. 1 shows a schematic
of the setup. The laser beam passes through the final focusing lens and then through a
phase plate for smoothed beams. The beam measurements are used to generate a near-field
input to the pF3d simulation code. pF3d takes the input electric field and the initial plasma
conditions and self-consistently simulates the evolution of the beam propagating through
the plasma. The electric field on the output plane can be used to simulate experimental
beam diagnostics such as the transmitted frequency spectra and near-field image.
Fig. 2 shows fringes of the laser field for an unsmoothed f/8 beam and two types
of spatially smoothed beams. The images exhibit demarcation lines where the nine KDP
(potassium dihydrogen phosphate) crystals abut, a horizontal line where the NOVA amplifier
disk is split, and a central occlusion which serves to block unconverted laser light from
illuminating the target. The image of the unsmoothed beam clearly shows the aberrations
present in a NOVA beam. r6 The other image in Fig. 2 is a composition of images from two
types of smoothed beams.
A random phase plate (RPP) is an array of elements with phases of either 0 or n- randomly
distributed over the plate. An RPP beam produces a series of rings so that the central spot
has an envelope approximated by a sinc2 function. The upper half of the smoothed beam
image is taken from an RPP beam, where the NOVA aberrations have been superimposed
on an RPP.
The other type of beam smoothing uses a kinoform phase plate (KPP). Because of the
sinc2 envelope, an RPP beam carries 83% of the total beam power in the central spot,
and the spot is centrally peaked. The KPP is designed to correct these problems, carrying
3
greater than 90% of the beam power in a spot with a flat-topped envelope. The lower half of
the smoothed beam image in Fig. 2 shows the NOVA aberrations with an f/8 KPP beam.7
F3D shows how propagation through plasma modifies the beam structure. The three
images in Fig. 3 show the intensity in transverse k-space, IE(Ic)12, resulting from an f/8
KPP beam passing through a plasma slab of varying thickness. This corresponds to the
image at the transmitted light relay plane. The plasma used is the canonical slab for NIF-
ignition conditions, O.ln, C 5 12 with electron temperature 3 keV, and the beam used has H
a wavelength of 351 nm and an intensity 2 x 10 l5 W/cm2. The first image corresponds to
vacuum propagation without plasma. The beam still retains most of its structure with a
fairly thin plasma, as seen in the second image (with 105 pm of plasma), but the KPP near
field structure is mostly lost at the end of a 1.1 mm plasma, as seen in the third image. We
now wish to compare whole beam simulations of the three beam types (unsmoothed, KPP,
and RPP).
III. WHOLE BEAM SIMULATIONS
Experiments on NOVA and OMEGA are designed to simulate one or more beams in a NIF
hohlraum experiment. Using the beam models, discussed in Section II, we can numerically
simulate the entire beam. By taking a 1 mm slab plasma of neopentane (C5Hi2) at 0.1 nc,
with initial electron temperature 3 keV and ion temperature 1 keV, we can simulate the
propagation of three different beam types with NOVA aberrations, an unsmoothed beam,
one with KPP smoothing, and one with RPP smoothing.
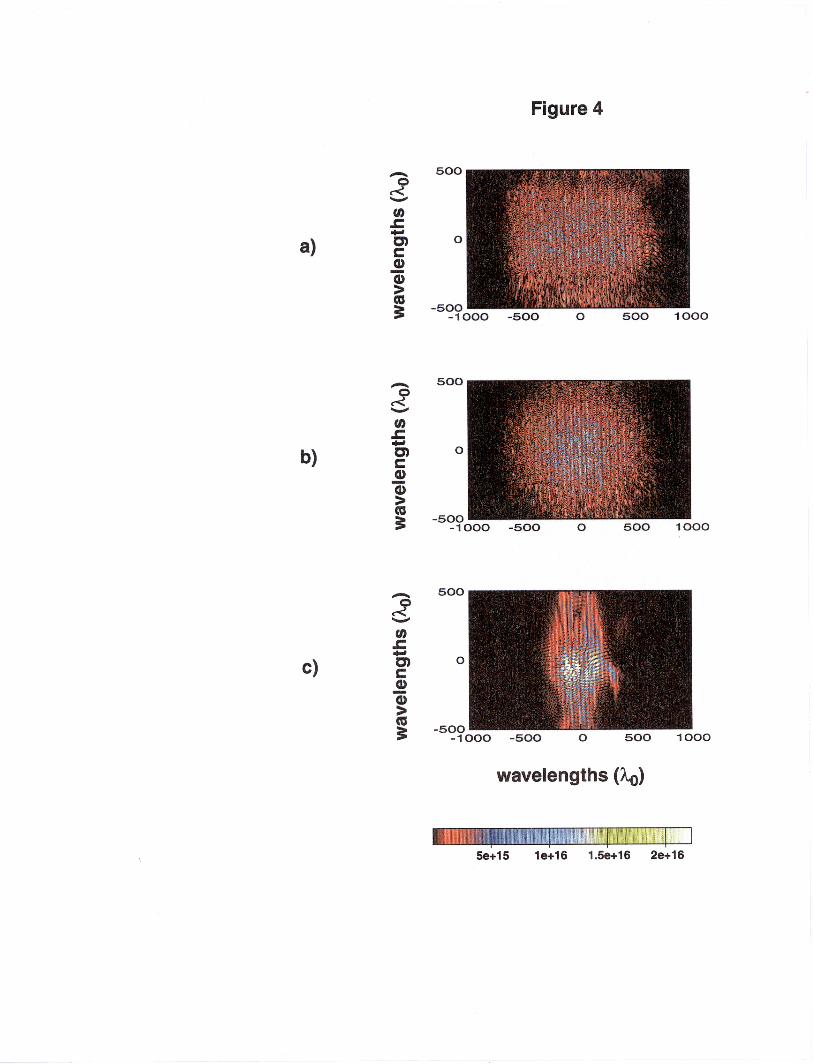
Fig. 4 shows the beam intensity at the incident plane of the simulated plasma for
each of the three beams. In every case, an equivalent spot size was chosen for a beam
power of 2 TW in order to achieve a spot-averaged intensity of 2 x 10¹⁵ W/cm2. For the
unsmoothed beam, the spot size is achieved at 2 mm beyond best focus. The KPP (Fig.
4a) has fine-scale structure with many small hotspots distributed throughout, and has a
squarish envelope. By comparison, the RPP spot is more rounded than the KPP spot (the
4
RPP envelope is approximated by a raised cosine function to make the intensity drop to
zero smoothly at the edge before adding the beam aberrations), and also has many small
speckles distributed throughout: but there are some hotspots more intense than any in the
KPP. These most intense hotspots are centrally located in the RPP spot(Fig. 4b). The
presence of the NOVA aberrations produces the vertical fuzz at the edges of the KPP and
RPP spots. The unsmoothed beam has a completely different envelope, only vaguely round
towards the center (Fig. 4~). There are fewer speckles, each of which carries more energy
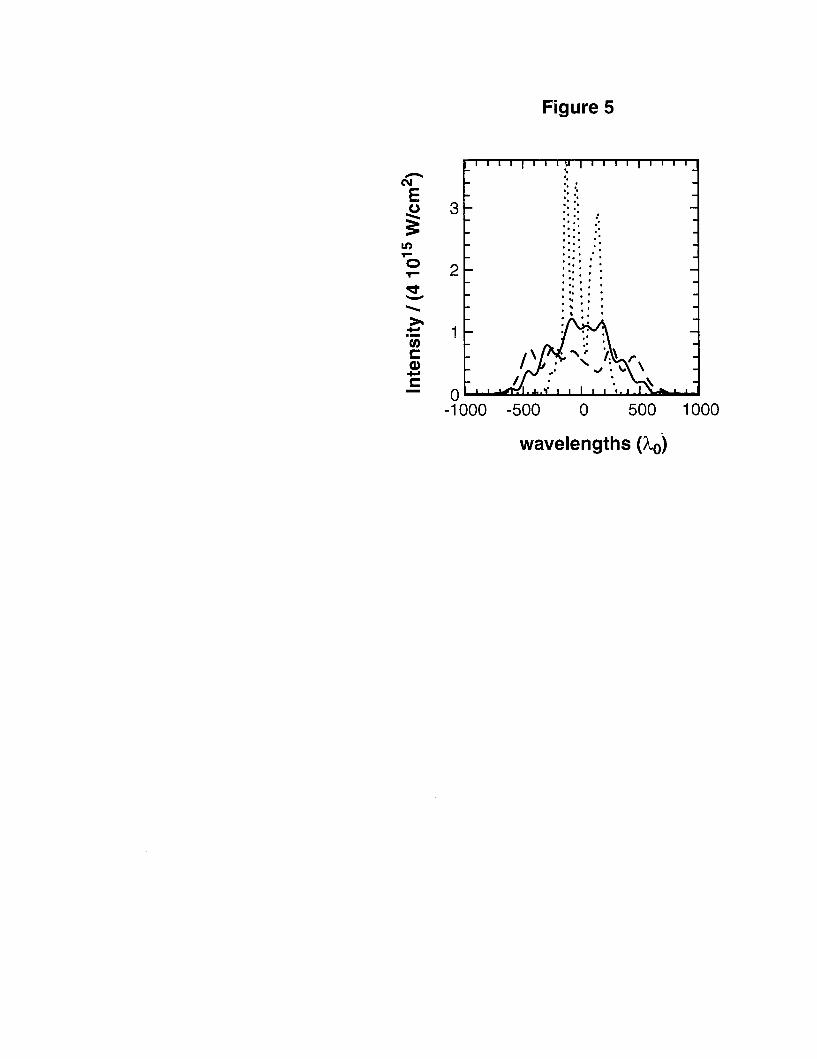
than the hotspots of the KPP or the RPP. The spatial profiles of smoothed intensity for the
three beams show these qualities (Fig. 5): the KPP has a flat-topped distribution; the RPP
is centrally peaked; and the unsmoothed beam exhibits an unorganized structure.
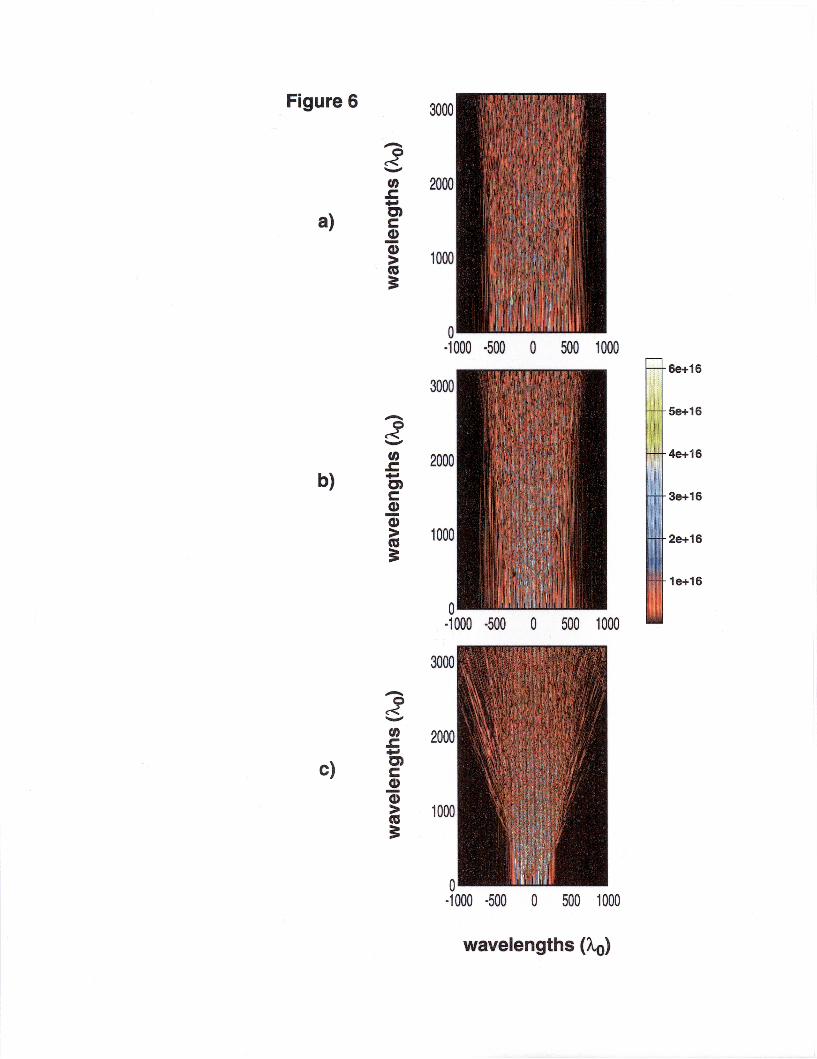
Differences in beam propagation are apparent, as shown in Fig. 6 at 32 ps. Within the
first quarter of the simulation volume, the KPP beam exhibits filamentation, with its hotter
speckles breaking up. Most of the beam retains its original character, so there is only a little
spreading (Fig. 6a). There is comparatively more spreading in the RPP beam, as shown
in Fig. 6b. The RPP spot is slightly narrower than the KPP spot at the entrance plane
(the full-width-half-maximum9 of the RPP is 216 pm versus 377 pm for the KPP), but the
transmitted spots have similar width (FWHM of the RPP is 368 pm versus 424 pm for the
KPP). The central hotspots of the RPP carry more energy than hotspots in the KPP, and
therefore, break into smaller filaments. By contrast to the smoothed beams, the unsmoothed
beam breaks up completely (Fig. 6~). The very large hotspots in the unsmoothed beam
carry much more power than hotspots in either smoothed beam, causing them to break into
very small filaments within the first 300-500 wavelengths of the simulation box. l\lote the
fine-scale structure present at a distance of 500-1000 wavelengths from the entrance plane
in Fig. 6c.
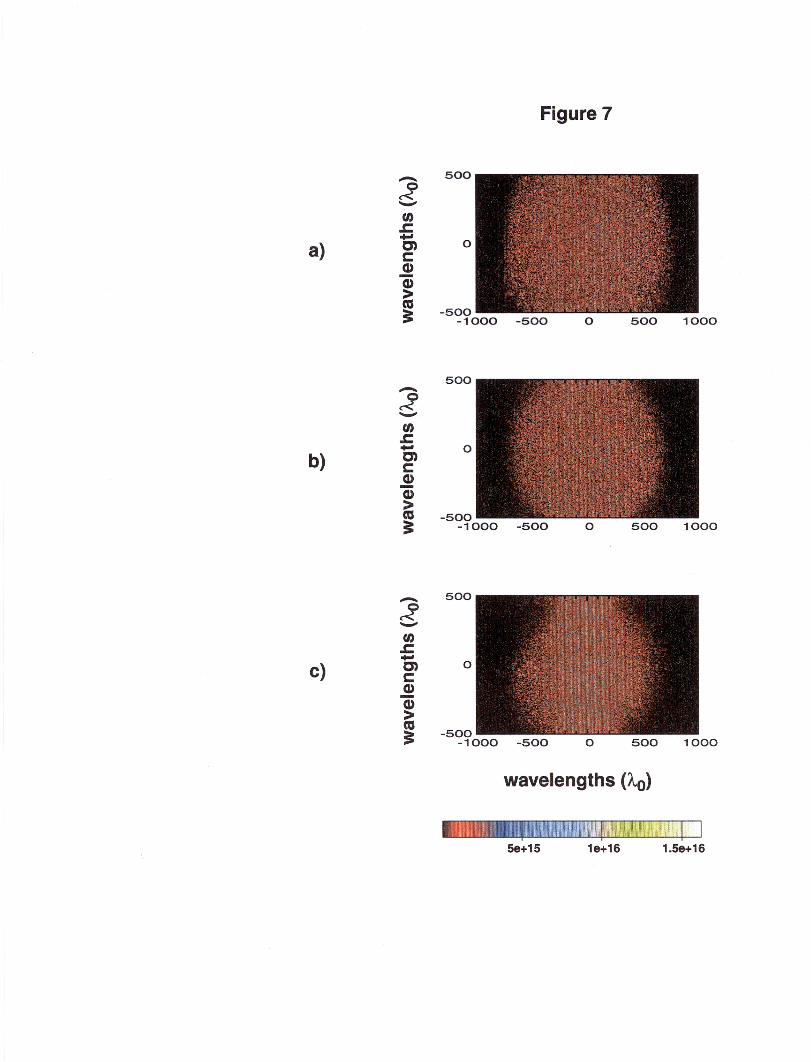
Transverse slices taken at the output plane for the KPP and RPP beams (Fig. 7a and
Fig. 7b, respectively) and at the midpoint of the simulation for the unsmoothed beam (Fig.
7c) complete the story. The spreading in g-direction of the smoothed beams is due to the
NOVA aberrations, and the x-direction spreading has been largely suppressed by the beam
5
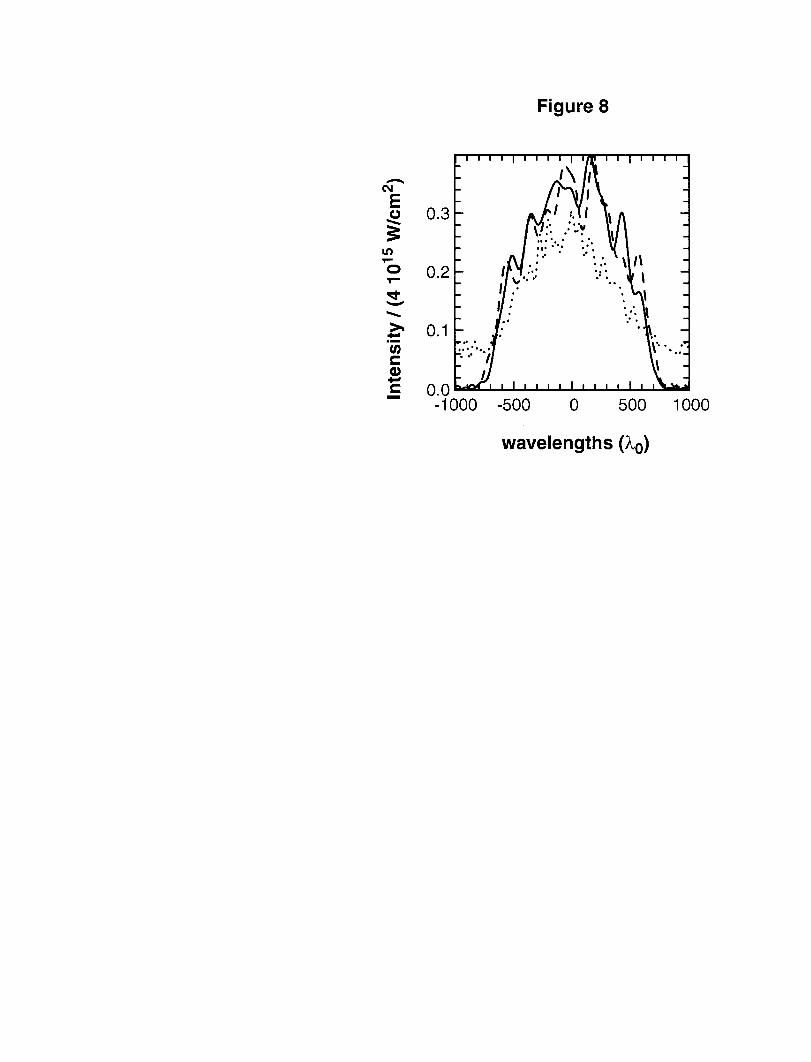
smoothing. At half the propagation distance, the unsmoothed beam has spread to fill the
simulation volume. Fig. 8 shows the smoothed spatial profiles for the three beams at the
output plane. Note that the spatial profile of the RPP is no longer markedly different from
the KPP.
With these simulations in hand, we wish to quantify beam breakup. Johnston proposed
using the Hamiltonian per unit beam power, assuming a steady state response in a slab
plasma.” Although not technically applicable in a non-steady state, we wish to see how well
this measure quantifies beam breakup in our simulations.
Assuming pressure balance and a constant density profile, the Hamiltonian for the parax-
ial wave equation is
H(z) = -& /dzdy { IVuj2 - 3 [Iu/’ - It exp(-iu/2)]}
and the normalized beam power is given by
where
1 el3 u2=--- 21
4 %WO 2 e
is the dimensionless field if the laser field is given by
(1)
E = i& (e-iwot+ikoz + ,iw,t-ikor)
and
is the electron density averaged over an zy-plane relative to the critical density. If we denote
the first term by
6
and the second term by
f&(x) = -& / 3 [lzl” - 1 + eX~(-Iz@)] dzdy, (4
then H = Hi + H2 and H/N is a measure of beam breakup. To see this, consider the case
of a single speckle. At the onset of filamentation, H becomes negative as the self-focusing
part (Hz) begins to dominate the vacuum propagation part (HI). The more unstable to
filamentation the speckle is, the larger in magnitude that Hz/N becomes. Similarly, the
more fine-scale transverse stucture the beam develops due to break up, the larger HIIN
is. A stable speckle without much transverse structure will give rise to a positive, small or
moderate value for H/N.
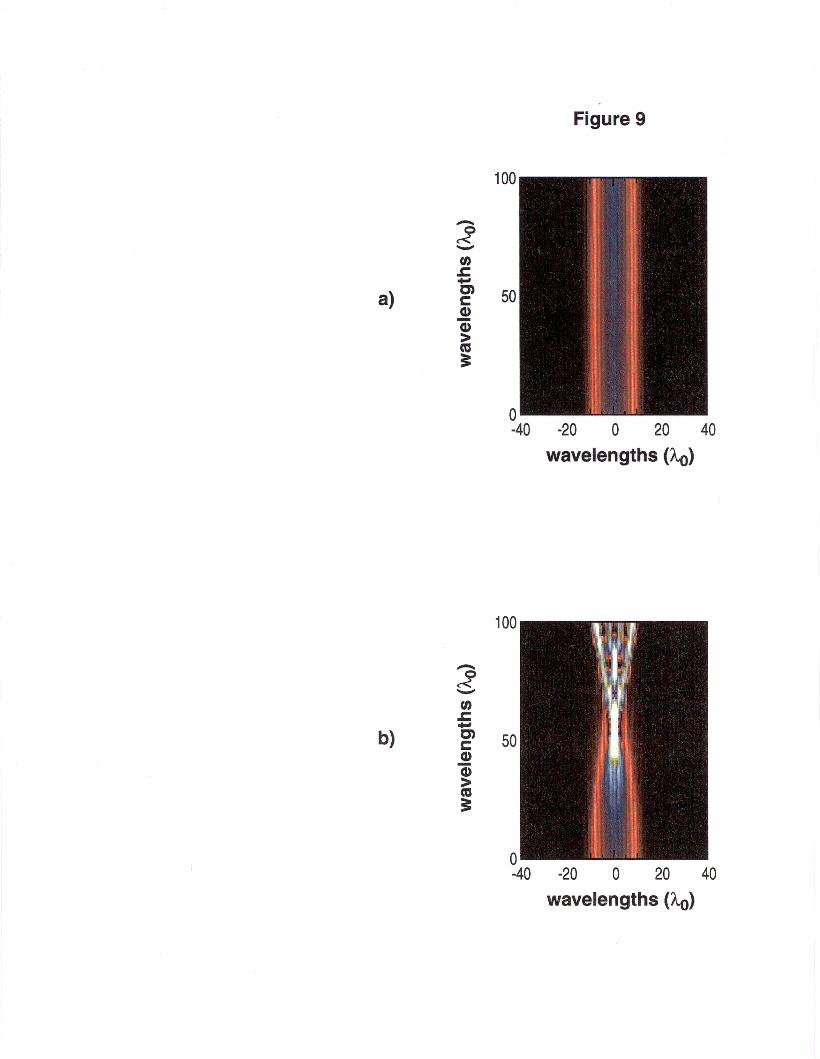
Fig. 9a and Fig. 9b show 2D zz-slices through two different single 3D Gaussian beams
propagating through a O.ln, CH plasma slab with T, = 1 keV and Ti = 0.5 keV. Such a
Gaussian could be taken to represent an isolated speckle. Fig. 9a shows a beam with peak
intensity 10 l4 W / cm2 at the incident plane and Fig. 9b depicts a beam 100 times more
intense (peak intensity I = 10 l6 W / cm2 at the incident plane). While the more intense
beam is filamenting quite strongly, the less intense beam is very stable. This behavior is
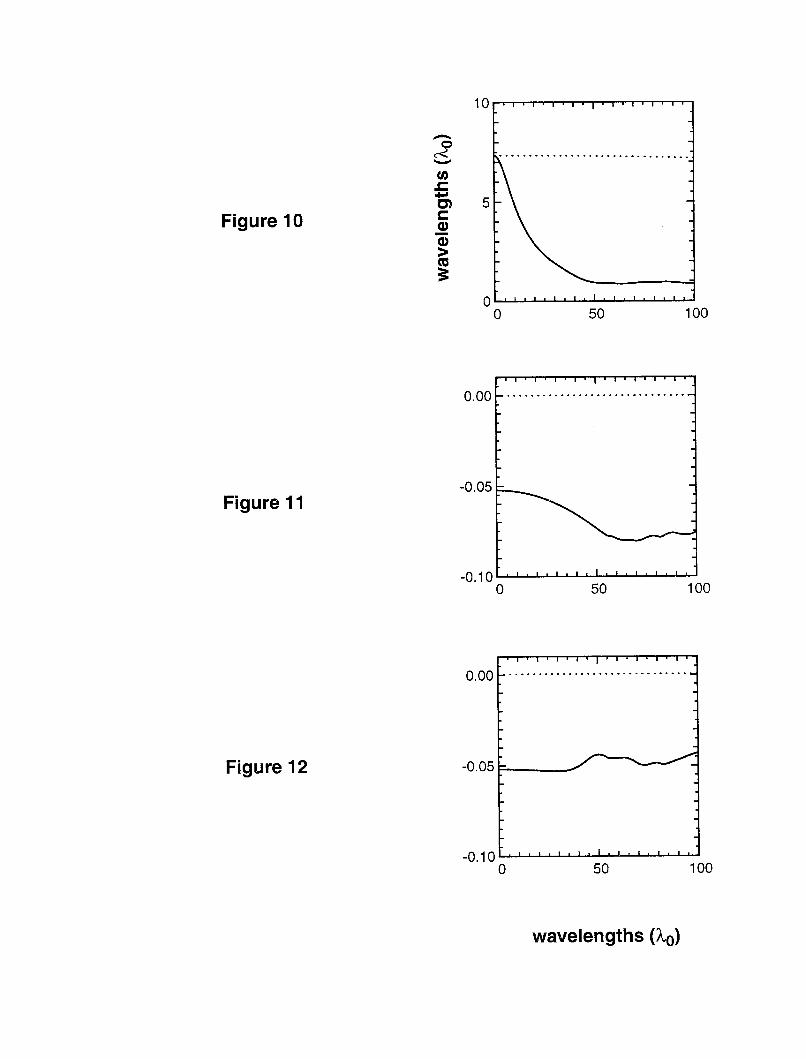
reflected in the diagnostic plots, Fig. 10, Fig. 11, and Fig. 12. For the less intense beam
(the dotted lines) dN/H, is flat indicating not much transverse structure has developed,
Hz/N is negligible since the beam is stable for filamentation, and thus the resulting quantity
H/N is a small positive number (around 10P3). Conversely, the more intense beam (solid
lines) breaks up as reflected by the significant drop in 0 N HI. Hz/N, and consequently
H/N, are both negative.
In a beam with many speckles, the aggregate quantities HI/N, Hz/N, and H/N get a
contribution from each individual speckle, thus many speckles breaking into filaments implies
larger magnitude values for HI/N and -Hz/N, and consequently H/N. Hence, dmi will
be small.
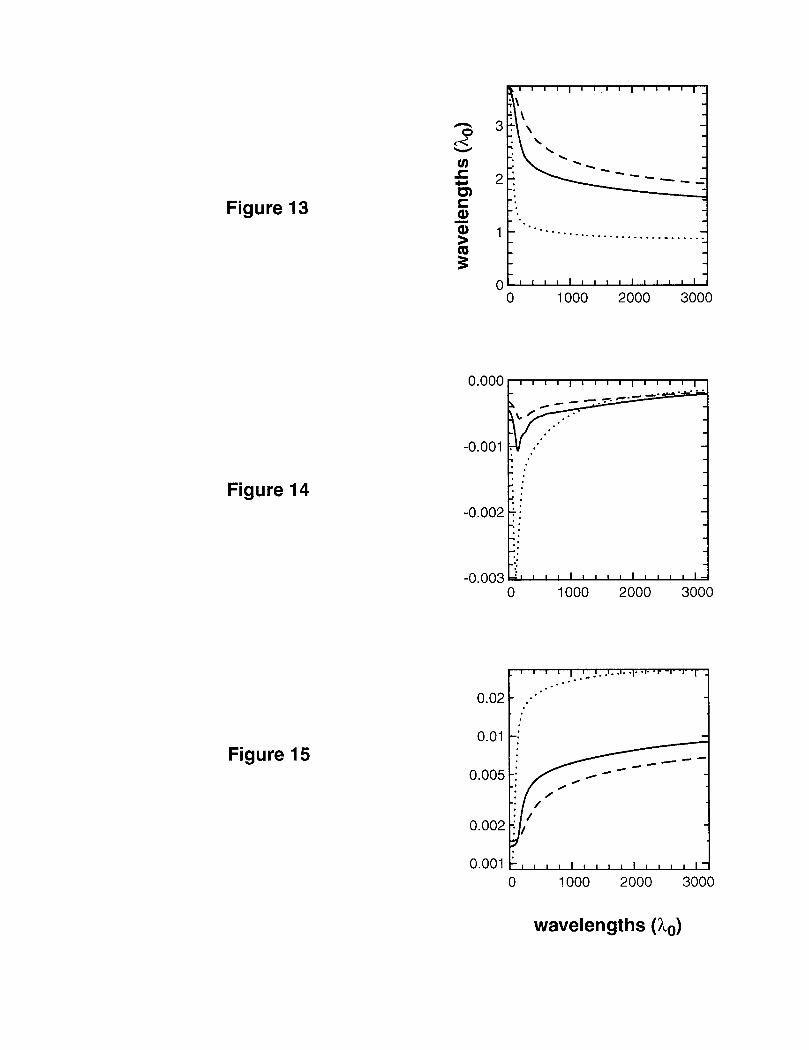
For the three whole beam simulations, the results of these diagnostics follow our expecta-
tions. The transverse correlation length ,/N/HI drops fairly sharply in all three simulations
7
indicating that beam breakup is occurring in the front part of the plasma (Fig. 13). The
unsmoothed beam breaks up the most, and the KPP beam the least. Fig. 14 shows that
the unsmoothed beam has more speckles undergoing stronger self-focusing than either of
the smoothed beams, and the KPP has the fewest. Finally, in Fig. 15 we see that very early
in the box, the KPP is showing the most fine-scale structure, but that as the hotspots in
the RPP beam and those in the unsmoothed beam break up, the other two beams develop
much finer-scale transverse structure than the KPP, as indicated by a larger value in the
normalized Hamiltonian.
IV. CONCLUSIONS
The higher intensities and longer scale lengths present in the NIF laser will accentuate
laser-plasma instabilities (LPI). Therefore, successful ignition is predicated on the ability to
model and understand these instabilities. In order to improve the modeling capability for
LPI under NIF conditions, it is necessary to simulate entire beams. While computationally
difficult, whole beam simulations can be done on massively parallel computers. In this paper,
we have presented the results of simulating the propagation of three different f/8 NOVA
beams in a 1.1 mm slab plasma (O.ln, C&Hip at T, = 3 keV, Ti = 1 keV): a KPP beam,
an RPP beam, and an unsmoothed beam. The unsmoothed beam propagates dramatically
differently from either smoothed beam, and the two smoothed beams are different in more
subtle ways.
APPENDIX A: THE MASSIVELY PARALLEL SIMULATION CODE PF3D
The development of a fully-nonlinear, time-dependent hydrodynamic and heat transport
code F3D has allowed us to pursue a number of very interesting problems in laser beam
self-focusing, filamentation, and laser-plasma instabilities for which the plasma density and
flow velocities are strongly perturbed.
Currently, the ;\IPP code pF3d has par-axial light propagation, nonlinear Eulerian hydro-
dynamics, linearized electron heat conduction, and sophisticated laser beam models. Mod-
els for stimulated Raman and stimulated Brillouin backscatter (SRS and SBS, respectively)
based on those for F3D” are currently being added to the MPP code.
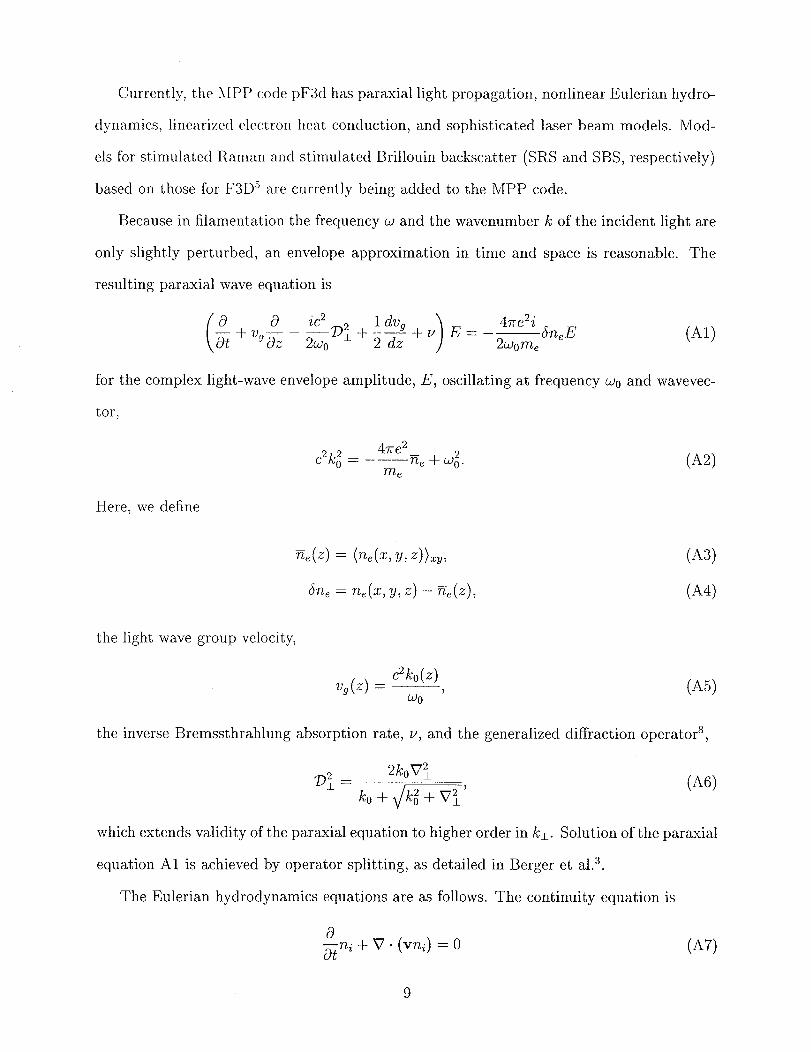
Because in filamentation the frequency w and the wavenumber k of the incident light are
only slightly perturbed, an envelope approximation in time and space is reasonable. The
resulting paraxial wave equation is
(Al)
for the complex light-wave envelope amplitude, E, oscillating at frequency w. and wavevec-
tor,
c21c,2 = - 4ne2 -E, f wo”. me
Here, we define
the light wave group velocity,
w4
(A3) (A4)
W)
the inverse Bremssthrahlung absorption rate, v, and the generalized diffraction operator8,
which extends validity of the paraxial equation to higher order in kl. Solution of the paraxial
equation Al is achieved by operator splitting, as detailed in Berger et a1.3.
The Eulerian hydrodynamics equations are as follows. The continuity equation is
Z&h + V - (VTZi) = 0
9
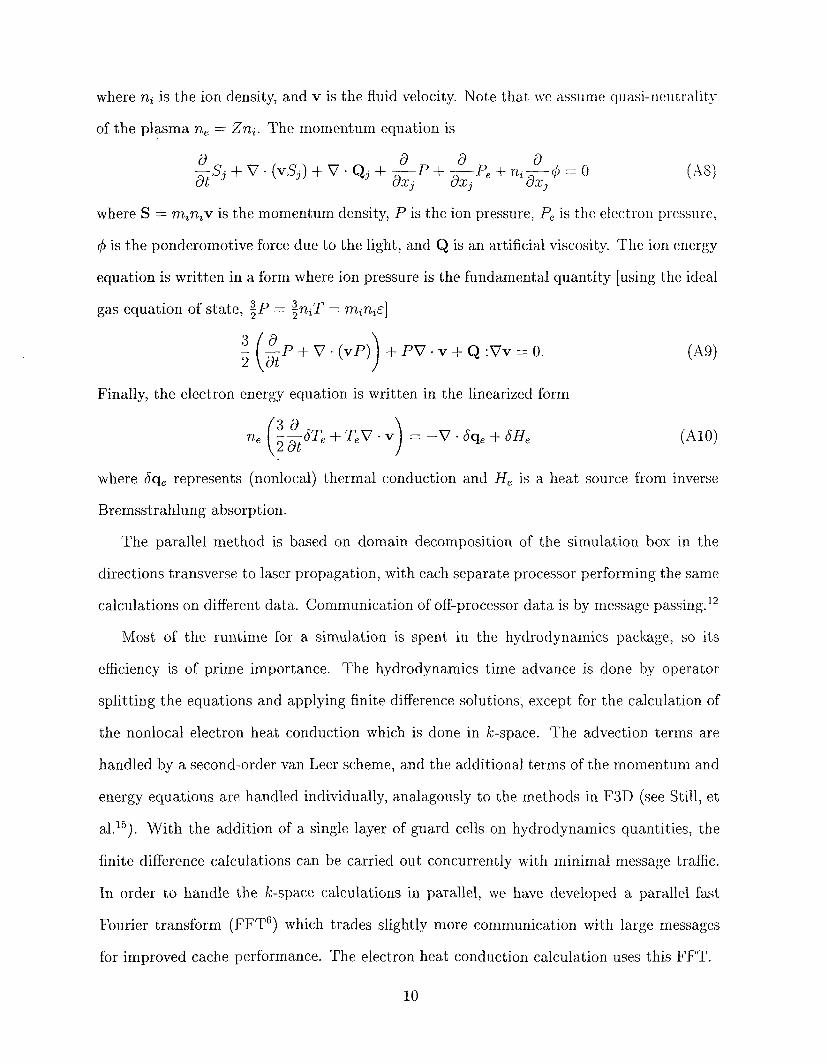
where ni is the ion density, and v is the fluid velocity. Note that we assume clll;lsi-rlc~ltr;llit?;
of the plasma n, = Zni. The momentum equation is
where S = miniv is the momentum density, P is the ion pressure, P, is the electron prcssure~
4 is the ponderomotive force due to the light, and Q is an artificial viscosity. The ion energy
equation is written in a form where ion pressure is the fundamental quantity [using the ideal
gas equation of state, $P = :niT = mini&]
+PVv+Q:Vv=O.
Finally, the electron energy equation is written in the linearized form
38 ne 28-t (.
---6T,+T,V.v =-V+,i-6He )
(A 10)
where 69, represents (nonlocal) thermal conduction and He is a heat source from inverse
Bremsstrahlung absorption.
The parallel method is based on domain decomposition of the simulation box in the
directions transverse to laser propagation, with each separate processor performing the same
calculations on different data. Communication of off-processor data is by message passing.12
Most of the runtime for a simulation is spent in the hydrodynamics package, so its
efficiency is of prime importance. The hydrodynamics time advance is done by operator
splitting the equations and applying finite difference solutions, except for the calculation of
the nonlocal electron heat conduction which is done in k-space. The advection terms are
handled by a second-order van Leer scheme, and the additional terms of the momentum and
energy equations are. handled individually, analagously to the methods in F3D (see Still, et
a1.r5). With the addition of a single layer of guard cells on hydrodynamics quantities, the
finite difference calculations can be carried out concurrently with minimal message traffic.
In order to handle the k-space calculations in parallel, we have developed a parallel fast
Fourier transform (FFT’) which trades slightly more communication with large messages
for improved cache performance. The electron heat conduction calculation uses this FFT.
10
The numerical solution of the light propagation involves finite differences and spectral
methods. Finite differences in the refraction calculation only occur in the laser propaga-
tion direction, so guard cells are not required in light quantities. The second-order spatial
derivatives in Al are treated with spectral methods, and thus also use the parallel FFT.
The runtime plot scaling problem size with number of processors is flat, demonstrating very
good efficiency. Because the efficiency and scalability is good, calculations can be made
using large numbers of processors which enables simulations of an entire NOVA beam.
11
REFERENCES
’ --\n MPP connects hundreds or thousands of computers, each with its own memory, by a
fast communication subsystem enabling aggregate use on a single calculation.
2 The density p erturbation is limited in magnitude by replacing the linear response SN =
(n - no)/no by ln(l + SN) so the total density is never negative.
3 R. L. Berger, et. al., Phys. Fluids B 5, 2243 (1993)
4 R. L. Berger, et. al., Phys. Fluids B X, Y (1995)
5 R. L. Berger, et. al., Phys. Fluids B X, Y (1998)
6 Cooley and Tkey on fast Fourier transforms.
7 S. Dixit, private communication.
8 M. D. Feit and J. A. Fleck, Jr., J. Opt. Sot. Am. B5, 633 (1988)
’ The full-width-half-maximum (FWHM) is the width of the beam where the intensity is
half of its peak value.
lo T. Johnston, Phys. Plasmas X, Y (1997).
I1 A. B. Langdon and B. F. Lasinski, Phys. Rev. Lett. 34, 934 (1975)
I2 book by Grop, Lusk, and Skjellum.
i3 R L Berger, et. al., Phys. Fluids B 5, 2243 (1993); R. L. Berger, et. al., Phys. Rev. Lett. . .
75, 1078 (1995); S. Hueller, et. al., Physica Scripta; A. J. Schmitt, Phys. Fluids 31, 3079
(1988); A. J. Schmitt, Phys. Fluids B 3, 186 (1991);
i4 M. A. Blain, G. Bonnaud, A. Chiron, and G. Riazuelo, “Autofocalisation of filamentation
d’un Faisceau Laser dans le Cadre de 1’Approximation Paraxiale et Stationnaire,” CEA-
R-5716; B. I. Cohen, et. al., Phys. Fluids B 3, 766 (1991); V. E. Zakharov, et. al., Sov.
Phys. JETP 33, 77 (1971)
12
‘s C. H. Still, et al.! ICF Quarterly (1996)
” Wegrier 011 X0\;\ aberrations.
” Standard G. Zimmerman reference on LASNEX.
13
FIGURES
FIG. 1. Schematic of the laser beam setup. Measurements taken from the final optics assembly
are used to generate a near-field input to the pF3d simulation code.
FIG. 2. Fringes for the laser field for an unsmoothed beam (left), RPP beam (right, upper
half), and KPP beam (right, lower half).
FIG. 3. Intensity in transverse k-space resulting from from an f/8 KPP beam propagating
through varying plasma thicknesses, as calculated by F3D.
FIG. 4. Beam intensity at the incident plane of the simulated plasma for three different f/8
NOVA beams: (a) KPP, (b) RPP, and (c) unsmoothed. Each beam carries 2 TW of power with
spot-averaged intensity of 2 x 1Or5 W/cm2.
FIG. 5. Intensity profiles for the three beams at the incident plane, unsmoothed (dotted), KPP
(dashed), and RPP (solid).
FIG. 6. Beam intensity showing propagation through 1.1 mm of plasma for three different f/8
NOVA beams: (a) KPP, (b) RPP, and (c) unsmoothed.
FIG. 7. Beam intensity at the transmission plane of the simulated plasma for three different
f/8 NOVA beams: (a) KPP, (b) RPP, and (c) unsmoothed.
FIG. 8. Intensity profiles for the three beams at the transmission plane, unsmoothed (dotted),
KPP (dashed), and RPP (solid).
FIG. 9. Beam intensity showing propagation of two Gaussian beams: (a) beam with incident
peak intensity of 1 x 10 l4 W/cm2 shows no sign of self-focusing, and (b) beam with incident peak
intensity of 1 x 10 I6 W/cm2 showing filamentation.
FIG. 10. Transverse correlation length for the beams in Fig. 9, low intensity (solid), high
intensity (dotted).
14
FIG. 11. Hz/N for the beams in Fig. 9, low intensity (solid), high intensity (dotted).
FIG. 12. Hamiltonian per unit power H/N for the beams in Fig. 9, low intensity (solid), high
intensity (dotted).
FIG. 13. Transverse correlation length for the beams in Fig. 4, unsmoothed (dotted), KPP
(dashed), and RPP (solid).
FIG. 14. Hz/N for the beams in Fig. 4, unsmoothed (dotted), KPP (dashed), and RPP (solid).
FIG. 15. Hamiltonian per unit power H/N for the beams in Fig. 4, unsmoothed (dotted), KPP
(dashed), and RPP (solid).
15