Fiis-firm Specific Factors & Investment Preferences in India - Copy
36
FINANCIAL INSTITUTIONAL INVESTOR - FIRM SPECIFIC FACTORS & INVESTMENT PREFERENCES IN INDIA P ROJECT R EPORT S UBMITTED TO U NIVERSITY O F D ELHI I N P ARTIAL F ULFILMENT OF R EQUIREMENT FOR THE AWARD OF D EGREE OF B ACHELOR O F BUSINESS S TUDIES BY: NITESH GOYAL BBS-3F (B) - 4735 || U NIVERSITY R OLL NO: 70062 U NDER THE GUIDANCE OF: DR . R OHINI SINGH (MENTOR ) SHAHEED SUKHDEV COLLEGE OF BUSINESS STUDIES (UNIVERSITY OF DELHI) NEW DELHI ± 110092 || APRIL, 2010
Transcript of Fiis-firm Specific Factors & Investment Preferences in India - Copy

8/4/2019 Fiis-firm Specific Factors & Investment Preferences in India - Copy
http://slidepdf.com/reader/full/fiis-firm-specific-factors-investment-preferences-in-india-copy 1/35
FINANCIAL INSTITUTIONAL INVESTOR -
FIRM SPECIFIC FACTORS & INVESTMENT PREFERENCES IN INDIA
P ROJECT R EPORT S UBMITTED TO U NIVERSITY O F D ELHI I N P ARTIAL F ULFILMENT OF R EQUIREMENT
FOR THE AWARD OF D EGREE OF B ACHELOR O F BUSINESS S TUDIES
BY:
NITESH GOYAL BBS-3F (B) - 4735 || U NIVERSITY R OLL NO: 70062
U NDER THE GUIDANCE OF:
DR . R OHINI SINGH (MENTOR )
SHAHEED SUKHDEV COLLEGE OF BUSINESS STUDIES
(UNIVERSITY OF DELHI)
NEW DELHI ± 110092 || APRIL, 2010

8/4/2019 Fiis-firm Specific Factors & Investment Preferences in India - Copy
http://slidepdf.com/reader/full/fiis-firm-specific-factors-investment-preferences-in-india-copy 2/35
FIIS: F IRM SPECI FI C F ACTORS & INVESTMENT PREFERENCES IN I NDIA | | 1
EXECUTIVE SUMMARY
Foreign institutional investors have gained a significant role in Indian capital markets. The Asian Crisis marked a regime shift in the determinants of FII flows to India with some factors occupying a prominent position since the crisis. The flows are correlated with economic variables at both Globaland the Country level. However, the effect of various other factors in attracting foreign flows and their intensity is the aspect not studies in literature. Itis an attempt to showcase that the availability of foreign capital depends on many other factors other than the country¶s economic development alone.
The broad objective of the present paper is to gain a better understanding of the nature and determinants of FII flows. The paper analyses the FII
investment flows data to bring out the key features of these flows: Firm-level characteristics ± Shareholding pattern and Company variables thatinfluence Financial Institutional Investors (FII) investment allocations. Steps can be taken at firm-level to create an environment conducive to foreign
institutional investment.
The results in the paper suggest that the availability of foreign capital depends on factors, particularly the Firm specific factors, other than the country¶seconomic development alone. After controlling for the country effect, firms with better ownership status, accounting quality, financial records and
corporate governance attract more foreign capital. In conclusion the paper suggests that steps can be taken at the firm level to create an environmentconducive to foreign portfolio investment.
It is observed that foreign investors invested in companies duly considering some important Shareholding and company variables. The IndianPromoter¶s (Government) holdings and the foreign investments are inversely related. Foreign investors tend not to avoid investing in companies wherefamily shareholding of promoters is substantial. It is also observed that Public Shareholding is seen as a positive attraction and FIIs invest in companieswith a higher volume of shares owned by the general public. Among the Company Variables (financial performance) the Earning per Share and Debt toEquity are significant factors influencing their investment decision.

8/4/2019 Fiis-firm Specific Factors & Investment Preferences in India - Copy
http://slidepdf.com/reader/full/fiis-firm-specific-factors-investment-preferences-in-india-copy 3/35
FIIS: F IRM SPECI FI C F ACTORS & INVESTMENT PREFERENCES IN I NDIA | | 2
ACKNOWLEDGEMENT
Specialization project demands all the time and mettle of the students and gives an opportunity to get in-depth knowledge in their area of interest. Noamount of words written can be sufficient and adequate to acknowledge all the people who have provided me with the inspiration, guidance and helpduring the preparation of the report. It is a great pleasure to have the opportunity to extend my heart-felt thanks to everybody who helped me in thesuccessful completion of this project.
I would like to sincerely acknowledge the guidance and unflinching support provided by Dr. Rohini Singh, my Project Mentor. Throughout the courseof project, she has provided very useful insights and given her full cooperation, relentless support and encouragement.
A special mention to the Computer and its staff members for providing access to CapitaLine database, SPSS software and a vast variety of journals,
books and magazines. Without this repository of knowledge, the project wouldn¶t have been so close to reality. I am also grateful to Satyam Arora for all the help and support. Last but not the least; I extend a vote of thanks to all others who gave me their invaluable encouragement, support and
guidance at various phases of the project. The errors and shortcomings are my sole responsibility.
Nitesh GoyalRoll No. 4735 || University Roll No. 70062S. S. College of Business Studies

8/4/2019 Fiis-firm Specific Factors & Investment Preferences in India - Copy
http://slidepdf.com/reader/full/fiis-firm-specific-factors-investment-preferences-in-india-copy 4/35
FIIS: F IRM SPECI FI C F ACTORS & INVESTMENT PREFERENCES IN I NDIA | | 3
CERTIFICATE OF AUTHENTICITY
I hereby declare that this research paper titled µ Financial Institutional Investors: Firm Specific Factors & Investment Preference in India¶ preparedunder the guidance of Dr. Rohini Singh is an original piece of work. It has not been copied from any source what so ever and has not been submittedearlier to any other institution.
All efforts made in this endeavour have been personally made by me and any similarity to any past or present work is purely coincidental.
Place: New Delhi || Date: April, 2010
Nitesh Goyal
Shaheed Sukhdev College of Business StudiesBBS-3 F µB¶
College Roll No. 4735Examination Roll No. 70062
Contact No. +91-9999 699 917e-mail: [email protected]

8/4/2019 Fiis-firm Specific Factors & Investment Preferences in India - Copy
http://slidepdf.com/reader/full/fiis-firm-specific-factors-investment-preferences-in-india-copy 5/35

8/4/2019 Fiis-firm Specific Factors & Investment Preferences in India - Copy
http://slidepdf.com/reader/full/fiis-firm-specific-factors-investment-preferences-in-india-copy 6/35
FIIS: F IRM SPECI FI C F ACTORS & INVESTMENT PREFERENCES IN I NDIA | | 5
7.4. Company Variables ± Time-Series Regression.. . . . . . . . . . . .. . . . . . . . . . . . . . . . . . . . .. . . . . . . . . . . . . . .. . . . . . . . . . . . . . . . . . . . . . 277.5. Shareholding Pattern ± Cross-Sectional Regression.. . . . . . . . . . . . . . . . . . . . . .. . . . . . . . . . . . . . . . . . . . .. . . . . . . . . . . . . . . . . . 277.6. Company Variables ± Cross-Sectional Regression.. . . . . . . . . . . . . . . . . .. . . . . . . . . . . . . . . . . . . . .. . . . . . . . . . . . . . . .. . . . . . . . 28 7.7. Shareholding Pattern ± Combined Regression.. . . . . . . . . . . . . . . .. . . . . . . . . . . . . . . . . .. . . . . . . . . . . . . . . . . . . . .. . . . . . . . . . . . . . . . 297.8. Company Variables ± Combined Regression.. . . . . . . . . . . . . . . . . . . . . . . . . . . . . . . . . .. . . . . . . . . . . . . . . . . . . . .. . . . . . . . . . . . . . . . .. . 307.9. Shareholding Pattern: Statistical Test. . . . . . . . . . . . . . . . . . . . . . . . . . . . . . . . . . . . . . . . .. . . . . . . . . . . . . . . . . . . . .. . . . . . . . . . . . . . . . . . . . . .. . 30 7.10. Company Variables: Statistical Test. . . . . . . . . . . . . . . . . . . . . . . . . . . . . . .. . . . . . . . . . . . . . . . . . . . .. . . . . . . . . . . . . . . . . . . . . .. . . . . . . . . . . . . . . 31
8. Conclusion.. . . . . . . . . . . . . . . . . . . . . . . . . . . . . . . . . . . . . . . . . . . . . . . . . . . . . . . . . . . . . . . . . . . . . . . . . . . . . . . . . . . . . . . . . . . . . . . . . . . . . . . . . . . . . . . . . . . . . . 33
9. One Step Ahead (Scope For Further Analysis)... ...... ......... ......... ....... ......... ......... .. 35
References.. . . . . . . . . . . . . . . . . . . . . . . . . . . . . . . . . . . . . . . . . . . . . . . . . . . . . . . . . . . . . . . . . . . . . . . . . . . . . . . . . . . . . . . . . . . . . . . . . . . . . . . . . . . . . . . . . . . . . . . 36

8/4/2019 Fiis-firm Specific Factors & Investment Preferences in India - Copy
http://slidepdf.com/reader/full/fiis-firm-specific-factors-investment-preferences-in-india-copy 7/35
FIIS: F IRM SPECI FI C F ACTORS & INVESTMENT PREFERENCES IN I NDIA | | 6
LIST OF TABLES
1. Table 1: Pearson Correlation (EPS, P/E, Yield)..... ......... ....... ......... ......... ......... ......... .. 20
2. Table 2: Regression Models.. . . . . . . . . . . . . . . .. . . . . . . . . . . . . . . . . . . . .. . . . . . . . . . . . . . . . . . . . .. . . . . . . . . . . . . . . . . . . . .. . . . . . . . . . 20
3. Table 3: Descriptive Statist ics of Independent Variables.. ..... .......... ......... ......... ...... 22
4. Table 4: Shareholding Pattern: Regression.. . . . . . . . . . . . . . . . . . . . . . . .. . . . . . . . . . . . . . . . . . . . .. . . . . . . . . . . . . . . . . . 23
5. Table 5: Company Variables: Regression.. . . . . . . . . . . .. . . . . . . . . . . . . . . . . . . . .. . . . . . . . . . . . . . . . . . . .. . . . . . . . . . . . . . 25
6. Table 6: Shareholding Pattern: Time-series Regression.. . . . . . . . . . . . . . . . . . . . . . . . . . .. . . . . . . . . . . . . . . 27
7. Table 7: Company Variables: Time-seri es Regression... .... ......... ....... ........... ......... .... 27
8. Table 8: Shareholding Pattern: Cross -sectional Regression.. .... ......... ......... .......... .. 28
9. Table 9: Company Variables: Cross-sect ional Regression.. ...... ......... ....... ......... ....... 29
10. Table 10: Shareholding Pattern: Combined Regression ..... ....... .......... ......... ......... .. 30
11. Table 11: Company Variables: Combined Regression ..... ...... ........ ......... ......... ......... 30
12. Table 12: Shareholding Pattern: Statist ical Test.... ....... .......... ......... ......... ....... ....... 31
13. Table 13: Company Variables Statistical Test.. . . . . . . . . . . . . . .. . . . . . . . . . . . . . . . . . . . .. . . . . . . . . . . . . . . . . . . . . 32

8/4/2019 Fiis-firm Specific Factors & Investment Preferences in India - Copy
http://slidepdf.com/reader/full/fiis-firm-specific-factors-investment-preferences-in-india-copy 8/35
FIIS: F IRM SPECI FI C F ACTORS & INVESTMENT PREFERENCES IN I NDIA | | 7
1. INTRODUCTION
Portfolio investment flows from industrial countries have become increasingly important for developing countries in recent years. Countries withhigher levels of economic development tend to have more developed capital markets and are believed to have greater ability to obtain foreign capital.Since the beginning of liberalization FII flows to India have steadily grown in importance. Today, India is the second fastest growing economy after China. It has recently seen positive foreign institutional investor (FII) inflows driven by the sound fundamentals and growth opportunities.
Countries and firms are interested in attracting foreign capital because it helps to create liquidity for both the firm¶s stock and the stock market ingeneral. This leads to lower cost of capital for the firm and allows firm to compete more effectively in the global market place. This directly benefits
the economy and the country. Availability of foreign capital depends on many firm specific factors other than economic development of the country.Contemporary research has investigated only the portfolio preferences of FIIs from the viewpoint of fund management companies. This paper attemptsto examine some specific characteristics of the firms included in sensitivity index (Sensex) of Bombay Stock Exchange and their influence in attracting
more foreign institutional investment.
Positive fundamentals combined with fast growing markets have made India an attractive destination for foreign institutional investors (FIIs).According to analysts, the upward revision of economic growth from 5.8 per cent to 6.1 per cent, better-than-expected performance of companies in thequarter ended-June 30, the proposed new direct taxes code that might lead to savings in the tax payer¶s money, and the trade policy with an ambitious
target of US$ 200 billion exports for 2010-11 have all revived the confidence of FIIs investing in India. FIIs have made net investments of US$ 10 billion in the first six months (April to September) of 2009-10. A major portion of these investments have come through the primary market, thanthrough buying via secondary markets. (Source: India Brand Equity Foundation)
8/4/2019 Fiis-firm Specific Factors & Investment Preferences in India - Copy
http://slidepdf.com/reader/full/fiis-firm-specific-factors-investment-preferences-in-india-copy 9/35
FI I
FI¡ ¢
SPE£
I FI£
F¤ £
TO¡
S & I¥ ¦
EST¢
E¥
T P¡
EF E¡
E¥ £
ES I¥
I¥ §
I¤
| | 8
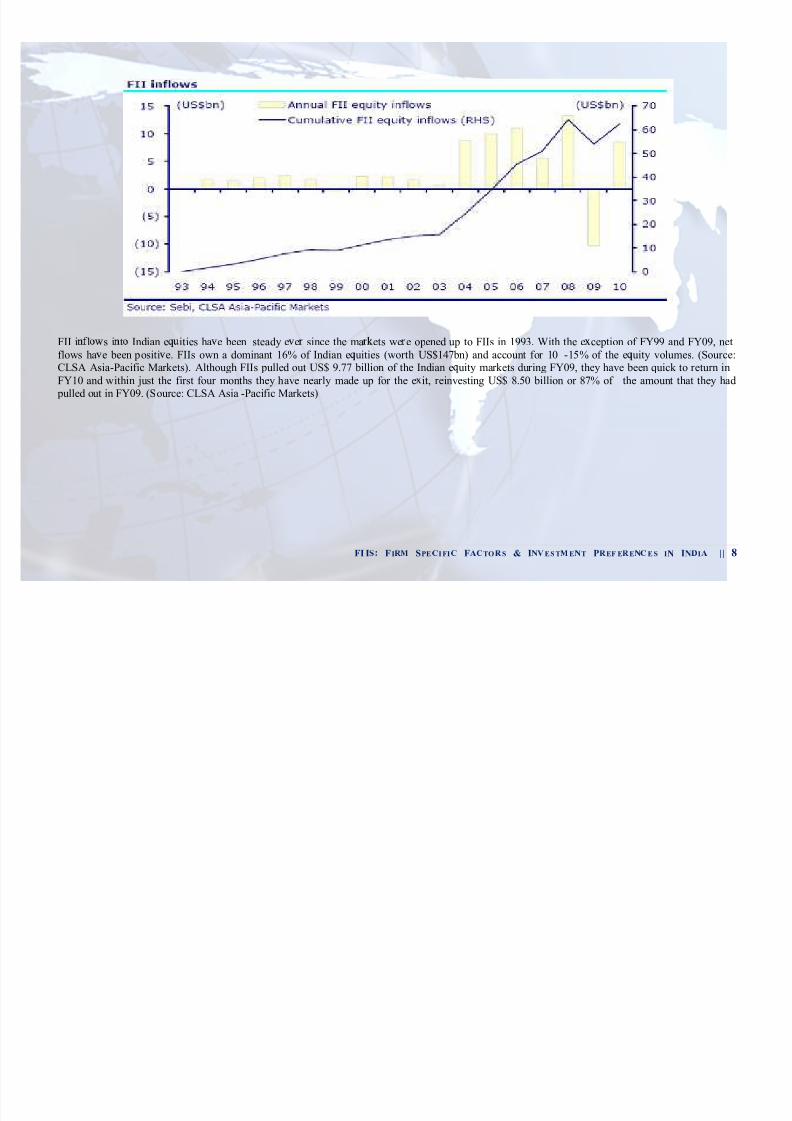
FII i l s i t Indian e ities ha e been steady e e since the ma ets we e opened up to FIIs in 1993. With the e ce ption of FY99 and FY09, net f lows ha e been positi e. FIIs own a dominant 16% of Indian e uities (wor th US$147bn) and account for 10 -15% of the e uity volumes. (Sour ce: CLSA Asia-Pacif ic Mark ets). Although FIIs pulled out US$ 9.77 billion of the Indian e uity mark ets dur ing FY09, they have been quick to r eturn inFY10 and within just the f ir st four months they have near ly made up for the e it, r einvesting US$ 8.50 billion or 87% of the amount that they had
pulled out in FY09. (Sour ce: CLSA Asia -Pacif ic Mark ets)

8/4/2019 Fiis-firm Specific Factors & Investment Preferences in India - Copy
http://slidepdf.com/reader/full/fiis-firm-specific-factors-investment-preferences-in-india-copy 10/35

8/4/2019 Fiis-firm Specific Factors & Investment Preferences in India - Copy
http://slidepdf.com/reader/full/fiis-firm-specific-factors-investment-preferences-in-india-copy 11/35
FIIS: F IRM SPECI FI C F ACTORS & INVESTMENT PREFERENCES IN I NDIA | | 10
Outside investors will lower the price they pay if they fear consumption of private benefits of control family. Chloe, Cho, Stutz (2005) found that US(United States) investors do indeed hold fewer shares in firms with ownership structures that are more conducive to expropriation by controlling
insiders. In companies where insiders are dominating information access and availability to the shareholders will be limited. With less information,foreign investors face an adverse selection problem. So they under invest in such stocks.
Leas, Nanda and Winsock (2003) further asserted that the information problems cause foreigners to hold fewer assets in firms. Firm levelcharacteristics can be expected to contribute to the information asymmetry problems. Concentrated family control makes it more likely thatinformation is communicated via private channels. Informative Insiders have incentives to hide the benefits from outside investors by providing opaquefinancial statements and managing earnings. Haw, Hub, Hwang and Wu, (2004) also found that firm level factors cause information asymmetry
problems to FII. Their paper found evidence that US investment is lower in firms where managers do not have effective control. Foreign investment in
firms that appear to engage in more earnings management is lower in countries with poor information framework.
There is a growing literature on the determinants of global investment flows and allocations. Prior research focused on international portfolio flows andexamined the relationship between portfolio flows and stock returns. Most of these studies have analysed global and country level factors that influenceinvestment allocations. This paper investigated empirically the firm specific variables, which influence the investment decision of foreign investors.

8/4/2019 Fiis-firm Specific Factors & Investment Preferences in India - Copy
http://slidepdf.com/reader/full/fiis-firm-specific-factors-investment-preferences-in-india-copy 12/35

8/4/2019 Fiis-firm Specific Factors & Investment Preferences in India - Copy
http://slidepdf.com/reader/full/fiis-firm-specific-factors-investment-preferences-in-india-copy 13/35

8/4/2019 Fiis-firm Specific Factors & Investment Preferences in India - Copy
http://slidepdf.com/reader/full/fiis-firm-specific-factors-investment-preferences-in-india-copy 14/35
FIIS: F IRM SPECI FI C F ACTORS & INVESTMENT PREFERENCES IN I NDIA | | 13
performance indicates the investor¶s perceptions about the company. Market prices reflect not only the performance but also investor¶s expectations
about the future performance.
3.4.4. Price Earnings ratio The investors will assess the performance of the company and one significant indicator of financial performance often used is earning per share. Price
earning ratio indicates the growth of market price in relation to the earnings of the company. It establishes the relationship between the earnings and
the market price. In the year 2005 the price earning ratio was high at 23.1 in BSE Sensex, which could attract more foreign Investments. The research
analysts reported that in the year 2006, the ratio was trailing at around 19%.
3.4.5.
Price to book valueOver 80% of the reporting parameters used to manage the company are designed to gauge returns to shareholders. Most management decisions are
therefore biased towards delivering short-term value to them. An income statement or balance sheet does not reveal the company¶s ability to create
value for customers, employees or shareholders.
According to the OECD, most companies are well aware that the facts and figures contained in the financial reports fail to capture fully the µessence¶
of their operations. This fact is particularity evident in the case of companies whose book value is markedly different from the market value. The book
value of the equity measures approximately the capital contributed by the shareholders, where as market price of the equity reflects how productively
the firm has employed the capital contributed by the shareholders as assessed by stock market. The ratio of price to book value gauges whether themarket valuation of the company is relative its worth or not.
3.4.6. YieldYield has been computed to measure the shareholders returns. It is computed based on dividends and share price appreciation to reflect the overall
return to the shareholders. All these ratios are computed quarterly.

8/4/2019 Fiis-firm Specific Factors & Investment Preferences in India - Copy
http://slidepdf.com/reader/full/fiis-firm-specific-factors-investment-preferences-in-india-copy 15/35
FIIS: F IRM SPECI FI C F ACTORS & INVESTMENT PREFERENCES IN I NDIA | | 14
4. R ESEARCH OBJECTIVES
The question that whether capital flow in a country primarily is a result of changes in global factors and the events and indicators in the recipient
countries like its credit rating and domestic stock market return alone or the Firm specific factors too have an impact. The paper is an attempt to answer
this.
Undoubtedly the global and country-specific factors seem to matter, but the Firm Specific factors also play a molar role in attracting FII. This paper
uses data from the CapitaLine database and with the help of SPSS software empirically proves the importance of Firm specific factors. Thus, the broad
objective of the present paper is to gain a better understanding of the nature and determinants of FII flows. The paper analyses the FII investment flows
data to bring out the key features of these flows: Firm-level characteristics ± Shareholding pattern and Company variables that influence Financial
Institutional Investors (FII) investment allocations. Steps can be taken at firm-level to create an environment conducive to foreign institutional
investment.

8/4/2019 Fiis-firm Specific Factors & Investment Preferences in India - Copy
http://slidepdf.com/reader/full/fiis-firm-specific-factors-investment-preferences-in-india-copy 16/35

8/4/2019 Fiis-firm Specific Factors & Investment Preferences in India - Copy
http://slidepdf.com/reader/full/fiis-firm-specific-factors-investment-preferences-in-india-copy 17/35
FIIS: F IRM SPECI FI C F ACTORS & INVESTMENT PREFERENCES IN I NDIA | | 16
Database.
5.4. TIME SERIES R EGRESSION
Also known as longitudinal data, Time series is a data set containing observations on a single phenomenon observed over multiple time periods. In
time series data, both the values and the ordering of the data points have meaning. Time series analysis comprises methods for analyzing time series
data in order to extract meaningful statistics and other characteristics of the data. In our sample, the time series consists of all variables over a period of
five years i.e. 20 quarters.
5.5. CROSS SECTIONAL R EGRESSION
A data set containing observations on multiple phenomena observed at a single point in time is calledcross-sectional. In cross-sectional data sets, the values of the
data points have meaning, but the ordering of the data points does not. It is an one-dimensional data.
5.6. PANEL DATA R EGRESSION
A data set containing observations on multiple phenomena observed over multiple time periods is called panel data. Panel Data aggregates all the
individuals, and analyzes them in a period of time. Alternatively, the second dimension of data may be some entity other than time. The process of
combining cross sectional and time series data to form a panel is called pooling. Whereas time series and cross-sectional data are both one-
dimensional , panel data sets are two-dimensional .
Typically, cross sectional parameters may shift over time in a manner that is not reflected in the choice of time series explanatory variables, or
individuals may vary in important ways within the cross section in a manner that is not reflected in the choice of cross section variables. As a result,
the use of panel data adds a new dimension of difficulty to the problem of model specification.
5.7. FIXED EFFECTS MODEL

8/4/2019 Fiis-firm Specific Factors & Investment Preferences in India - Copy
http://slidepdf.com/reader/full/fiis-firm-specific-factors-investment-preferences-in-india-copy 18/35
FIIS: F IRM SPECI FI C F ACTORS & INVESTMENT PREFERENCES IN I NDIA | | 17
Fixed effects model is a statistical model that represents the observed quantities in terms of explanatory variables that are all treated as if those
quantities were non-random. Fixed effect model introduces dummy variables that allow the intercept term to vary over time and over cross section
units. This is to overcome the difficulty with the least-squares pooling procedure wherein the assumption of constant intercept and slope may be
unreasonable. In Fixed Effect Model, if the slope varies as well, each separate cross section regression would involve a distinct model and pooling
would be inappropriate.
Dummy Variables: N is the number of cross section units and T is the number of time periods. The model adds N-1 and T-1 dummy variables. The two
variables are omitted since their addition would result in perfect collinearity among the explanatory variables.
In order to obtain unbiased and consistent estimates of all parameters (including the slope beta), we can make use of Ordinary Least Squares. A totalof NT-N-T, degrees of freedom would be involved. The dummy variable coefficients would measure the change in the cross-section and time-series
intercepts (with respect to the first individual in the first period of time).
5.8. TEST TO DECIDE USE OF DUMMY VARIABLES
The decision to add dummy variables is made on the basis of statistical testing. The test involves a comparison of the error sum of squares associated
with the two estimation techniques. Since the ordinary least-squares model includes more parameter restrictions than does the Fixed-effects model (the
intercepts are restricted to be equal over time and over individuals), we would expect the error sum of squares to be higher for the ordinary least
squares model. If the increase in the error sum of squares is not significant when the restrictions are added, we conclude that the restrictions are proper,
and ordinary least squares can be applied. If the error sum of squares changes substantially, we opt for the Fixed-effects model.
F = (ESS1-ESS2) / (N+T-2)
(ESS2) / (NT-N-T)
*ESS1= Error sum of squares using the ordinary least squares model
*ESS2= Error sum of squares using the Fixed-effects model
* N - No. Of Cross-sectional units || * T - No. Of Time periods
5.9. TEST OF MULTICOLLINEARITY

8/4/2019 Fiis-firm Specific Factors & Investment Preferences in India - Copy
http://slidepdf.com/reader/full/fiis-firm-specific-factors-investment-preferences-in-india-copy 19/35
FIIS: F IRM SPECI FI C F ACTORS & INVESTMENT PREFERENCES IN I NDIA | | 18
Multicollinearity is a statistical phenomenon in which two or more predictor variables in a multiple regression model are highly correlated. In this
situation the coefficient estimates may change erratically in response to small changes in the model or the data. In order to check this phenomenon,
the correlation between three Company Variables (EPS, PE, Yield) was calculated using SPSS.
TABLE 1: PEARSON CORRELATION
EPS P/E Yield
EPS 1 -.139 .174
P/E -.139 1 -.159
Yield .174 -.159 1
** Correlation is significant at the 0.01 level (2-tailed)
It was observed that the variables (EPS, PE, Yield) are not significantly correlated. Thus, we could include all the three variables in the regression
models.
TABLE 2: R EGRESSION MODELS
Dependent Variable Independent Variable Regression
1. Financial Institutional Investors Shareholding Pattern Regression
2. Financial Institutional Investors Company Variables Regression
3. Financial Institutional Investors Dummy C + Shareholding Pattern Time-Series Regression
4. Financial Institutional Investors Dummy C + Company Variables Time-Series Regression
5. Financial Institutional Investors Dummy Q + Shareholding Pattern Cross Sectional Regression
6. Financial Institutional Investors Dummy Q + Company Variables Cross Sectional Regression
7. Financial Institutional Investors Dummy C + Shareholding Pattern + Dummy Q Panel-data Regression

8/4/2019 Fiis-firm Specific Factors & Investment Preferences in India - Copy
http://slidepdf.com/reader/full/fiis-firm-specific-factors-investment-preferences-in-india-copy 20/35
FIIS: F IRM SPECI FI C F ACTORS & INVESTMENT PREFERENCES IN I NDIA | | 19
8. Financial Institutional Investors Dummy C + Company Variables + Dummy Q Panel Data Regression
6. LIMITATIONS OF THE STUDY
6.1. SAMPLE DATA
These findings could not be taken for making generalizations because:
Sample is small and consists of only thirty companies
The study is based on Sensex sample. The Sensex companies have an external image that they are the best performers in the country. If the sample
companies consist of probably a heterogeneous group then the results may give better insight into relationship of the specific variables.
6.2. FIXED EFFECTS MODEL
The use of dummies does not directly identify what causes the regression line to shift over time and over individuals. The dummy variable technique uses up a substantial number of degrees of freedom (N+T-2).

8/4/2019 Fiis-firm Specific Factors & Investment Preferences in India - Copy
http://slidepdf.com/reader/full/fiis-firm-specific-factors-investment-preferences-in-india-copy 21/35
FIIS: F IRM SPECI FI C F ACTORS & INVESTMENT PREFERENCES IN I NDIA | | 20
7. OBSERVATIONS & ANALYSIS
7.1. EMPIRICAL R ESULTS
Among the thirty Sensex companies there were eighteen companies in which promoters are from family groups and four companies had the
government as the promoter. Two companies had foreign promoters and three companies did not have any promoter holdings. The percentage
share holding of these individual groups is taken as a variable for the purpose of the analysis. In this paper the summary statistics as given in Table
3 . explain that on an average around 17.80 % of the capital comes from foreign institutional investors on an average among Sensex companies.
The promoters contribute around 34 % , the financial institutions provide 1 3 .5 0 % and public share is 11% and the remaining from other
sources.
TABLE 3: DESCRIPTIVE STATISTICS OF INDEPENDENT VARIABLES
Variables Minimum (%) Maximum (%) Mean (%)
FII 0 64.50 17.80
Corporate Bodies 0 58 16.02
Total Foreign ± FII 0 69.70 10.30
Government (Indian Promoters) 0 89.5 17.95Institutions (Financial & others) 0.33 37.60 13.50
Public & others 1.40 37.30 10.73
EPS 0 152.20 38.57
P/E Ratio 5.10 53.30 19.42
P/B Ratio 0.90 23.65 4.62
Div Yield % 0.15 8.34 2.19
Log of Market Capitalization 4.1 5.24 4.57
Debt to Equity 0 8.50 0.73
7.2. SHAREHOLDING PATTERN ± R EGRESSION
TABLE 4(A): MODEL SUMMARY

8/4/2019 Fiis-firm Specific Factors & Investment Preferences in India - Copy
http://slidepdf.com/reader/full/fiis-firm-specific-factors-investment-preferences-in-india-copy 22/35
FIIS: F IRM SPECI FI C F ACTORS & INVESTMENT PREFERENCES IN I NDIA | | 21
Model R R Square Adjusted R Square Std. Error of the Estimate
dimension0 1 .463a .215 .208 10.59655
Predictors: (Constant), I_Public, I_Foreign, I_CorporateBodies, I_Institution, I_IndianPromoter
TABLE 4(B): ANOVAB
Model Sum of Squares df Mean Square F Sig.
Regression 18227.923 5 3645.585 32.467 .000a
Residual 66698.366 594 112.287
Total 84926.289 599 Predictors: (Constant), I_Public, I_Foreign, I_CorporateBodies, I_Institution, I_IndianPromoter
Dependent Variable: D_FII
TABLE 4(C): COEFFICIENTSA
Model Unstandardized Coefficients Standardized Coefficients
B Std. Error Beta t Sig.(Constant) 28.640 1.543 18.558 .000
I_CorporateBodies -.186 .025 -.336 -7.360 .000
I_Foreign -.199 .030 -.279 -6.662 .000
I_IndianPromoter -.225 .022 -.523 -10.144 .000
I_Institution -.348 .056 -.300 -6.183 .000
I_Public .291 .073 .189 3.988 .000
Dependent Variable: D_FII
MODEL SUMMARY ANOVA COEFFICIENTS
Adjusted R Square Significance Constant Beta Sig.
.208 .000 Corporate Bodies -.336 .000
Foreign -.279 .000

8/4/2019 Fiis-firm Specific Factors & Investment Preferences in India - Copy
http://slidepdf.com/reader/full/fiis-firm-specific-factors-investment-preferences-in-india-copy 23/35
FIIS: F IRM SPECI FI C F ACTORS & INVESTMENT PREFERENCES IN I NDIA | | 22
Indian Promoter -.523 .000
Institution -.300 .000
Public .189 .000
* Dependent Variable: Financial Institutional Investment
The adjusted R Square is relatively low and the significance level very high, which shows that 20.8% of the dependent variable i.e. FinancialInstitution Investment is explained by the Shareholding Pattern in companies.
Analysing the Coefficients, we observe that the Indian Promoter (Government Shareholding) have a high negative beta with a high significancelevel. This is followed by Corporate Bodies (Promoters) and Institutions (Financial and others) with moderately high negative beta and highsignificance. This shows that any increase in shareholding by these variables might cause a decrease in the shareholding of FIIs.
Among all variables in the Shareholding Pattern, Public Shareholding has a positive beta. Thus the FIIs prefer shareholding by general Public.

8/4/2019 Fiis-firm Specific Factors & Investment Preferences in India - Copy
http://slidepdf.com/reader/full/fiis-firm-specific-factors-investment-preferences-in-india-copy 24/35
FIIS: F IRM SPECI FI C F ACTORS & INVESTMENT PREFERENCES IN I NDIA | | 23
7.3. COMPANY VARIABLES ± R EGRESSION
TABLE 5(A): MODEL SUMMARY
Model
R R Square
Adjusted R
Sq Std. Error of the Estimate
dimension0 1 .779a .607 .602 7.57346
Predictors: (Constant), I_DebtToEquity, I_Yield, I_log.MarketCap, I_EPS, I_PB, I_PE
TABLE 5(B): ANOVAb
Model Sum of Squares df Mean Square F Sig.
Regression 49243.873 6 8207.312 6 .000a
Residual 31947.986 557 57.357 557 8207.312
Total 81191.859 563 143.091 57.357
Predictors: (Constant), I_DebtToEquity, I_Yield, I_log.MarketCap, I_EPS, I_PB, I_PE
Dependent Variable: D_FII
TABLE 5(C): COEFFICIENTSA
Model Unstandardized Coefficients Standardized
Coefficients
B Std. Error Beta t Sig.
(Constant) 25.298 3.855 6.563 .000
I_EPS .091 .009 .277 9.876 .000
I_PE .003 .039 .003 .083 .934
I_PB .677 .127 .177 5.343 .000

8/4/2019 Fiis-firm Specific Factors & Investment Preferences in India - Copy
http://slidepdf.com/reader/full/fiis-firm-specific-factors-investment-preferences-in-india-copy 25/35
FIIS: F IRM SPECI FI C F ACTORS & INVESTMENT PREFERENCES IN I NDIA | | 24
I_Yield -.191 .100 -.055 -1.907 .057
I_log.MarketCap
I_DebtToEquity
-3.579
4.869
.817
.204
-.119
.648
-4.381
23.815
.000
.000
Dependent Variable: D_FII
TABLE 5
MODEL SUMMARY ANOVA COEFFICIENTS
Adjusted R Square Significance Constant Beta Sig.
.602 .000 EPS .277 .000
P/E .003 .934
P/B .177 .000
Yield -.055 .057
log. Market Capitalization -.119 .000
Debt to Equity .648 .000
* Dependent Variable: Financial Institutional Investment
The adjusted R Square is relatively high with high significance level, which shows that 60.2% of the dependent variable i.e. FinancialInstitution Investment is explained by the Company Variables as a whole.
Analysing the Coefficients, we observe that the Debt to has a high positive beta with a high significance level. Clearly this is one of the mostsignificant variable (based on analysis) that the FIIs consider while investing in a company.
EPS and P/B ratio being other variables that seem to hold importance in investment decision by FIIs.
8/4/2019 Fiis-firm Specific Factors & Investment Preferences in India - Copy
http://slidepdf.com/reader/full/fiis-firm-specific-factors-investment-preferences-in-india-copy 26/35
FIIS: F IRM SPECI FI C F ACTORS & INVESTMENT PREFERENCES IN I NDIA | | 25
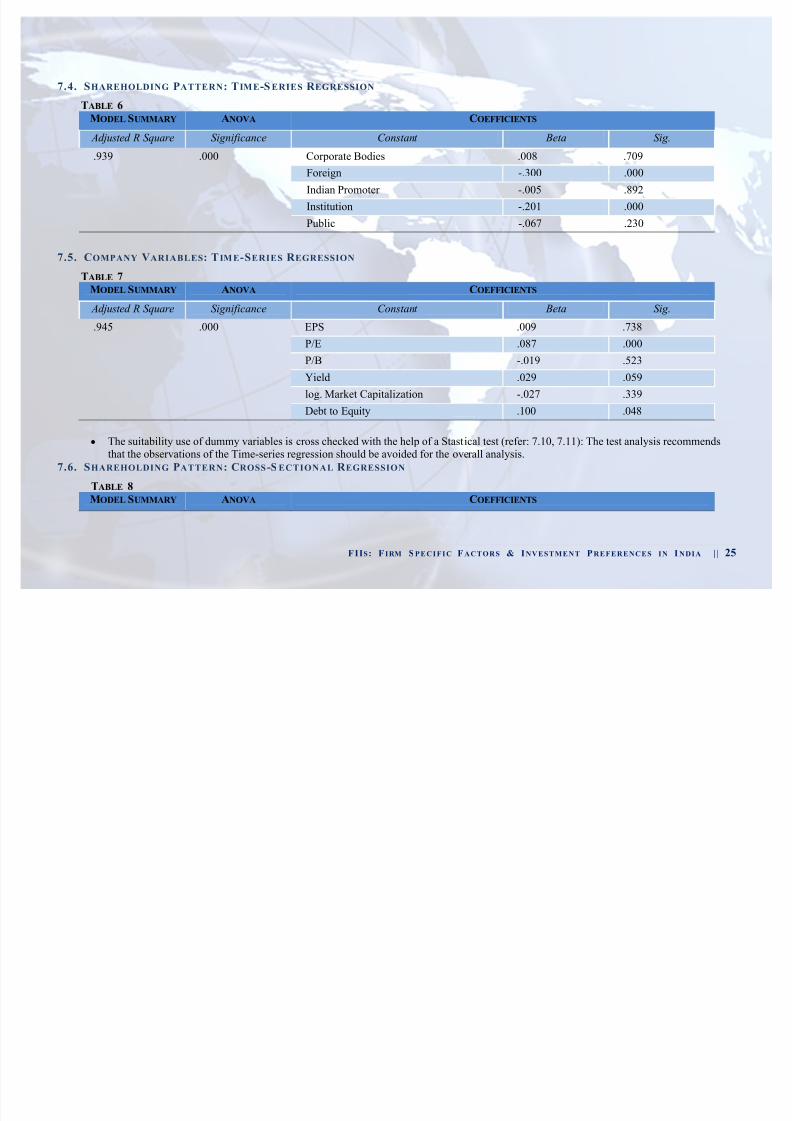
7.4. SHAREHOLDING PATTERN: TIME-S ERIES R EGRESSION
TABLE 6
MODEL SUMMARY ANOVA COEFFICIENTS
Adjusted R Square Significance Constant Beta Sig.
.939 .000 Corporate Bodies .008 .709
Foreign -.300 .000
Indian Promoter -.005 .892
Institution -.201 .000
Public -.067 .230
7.5. COMPANY VARIABLES: T IME-SERIES R EGRESSION
TABLE 7
MODEL SUMMARY ANOVA COEFFICIENTS
Adjusted R Square Significance Constant Beta Sig.
.945 .000 EPS .009 .738P/E .087 .000
P/B -.019 .523
Yield .029 .059
log. Market Capitalization -.027 .339
Debt to Equity .100 .048
y The suitability use of dummy variables is cross checked with the help of a Stastical test (refer: 7.10, 7.11): The test analysis recommendsthat the observations of the Time-series regression should be avoided for the overall analysis.
7.6. SHAREHOLDING PATTERN: CROSS -S ECTIONAL R EGRESSION
TABLE 8
MODEL SUMMARY ANOVA COEFFICIENTS

8/4/2019 Fiis-firm Specific Factors & Investment Preferences in India - Copy
http://slidepdf.com/reader/full/fiis-firm-specific-factors-investment-preferences-in-india-copy 27/35
FIIS: F IRM SPECI FI C F ACTORS & INVESTMENT PREFERENCES IN I NDIA | | 26
Adjusted R Square Significance Constant Beta Sig.
.185 .000 Corporate Bodies -.336 .000
Foreign -.279 .000
Indian Promoter -.521 .000
Institution -.298 .000
Public .190 .000
* Dependent Variable: Financial Institutional Investment
The most important aspect of the analysis of Cross-section regression of shareholding pattern is in comparison with the regression of Shareholding pattern without dummies (Model summary 1). We observe that the beta values and significance are highly similar in values. Thus,it further emphasizes the previous analysis of Shareholding Pattern.
Analysing the Coefficients, we observe that the Indian Promoter (Government Shareholding) have a high negative beta with a high significancelevel. This is followed by Corporate Bodies (Promoters) and Institutions (Financial and others) with moderately high negative beta and highsignificance. This shows that any increase in shareholding by these variables might cause a decrease in the shareholding of FIIs.
Among all variables in the Shareholding Pattern, Public Shareholding has a positive beta. Thus the FIIs prefer shareholding by general Public.
8/4/2019 Fiis-firm Specific Factors & Investment Preferences in India - Copy
http://slidepdf.com/reader/full/fiis-firm-specific-factors-investment-preferences-in-india-copy 28/35
FIIS: F IRM SPECI FI C F ACTORS & INVESTMENT PREFERENCES IN I NDIA | | 27
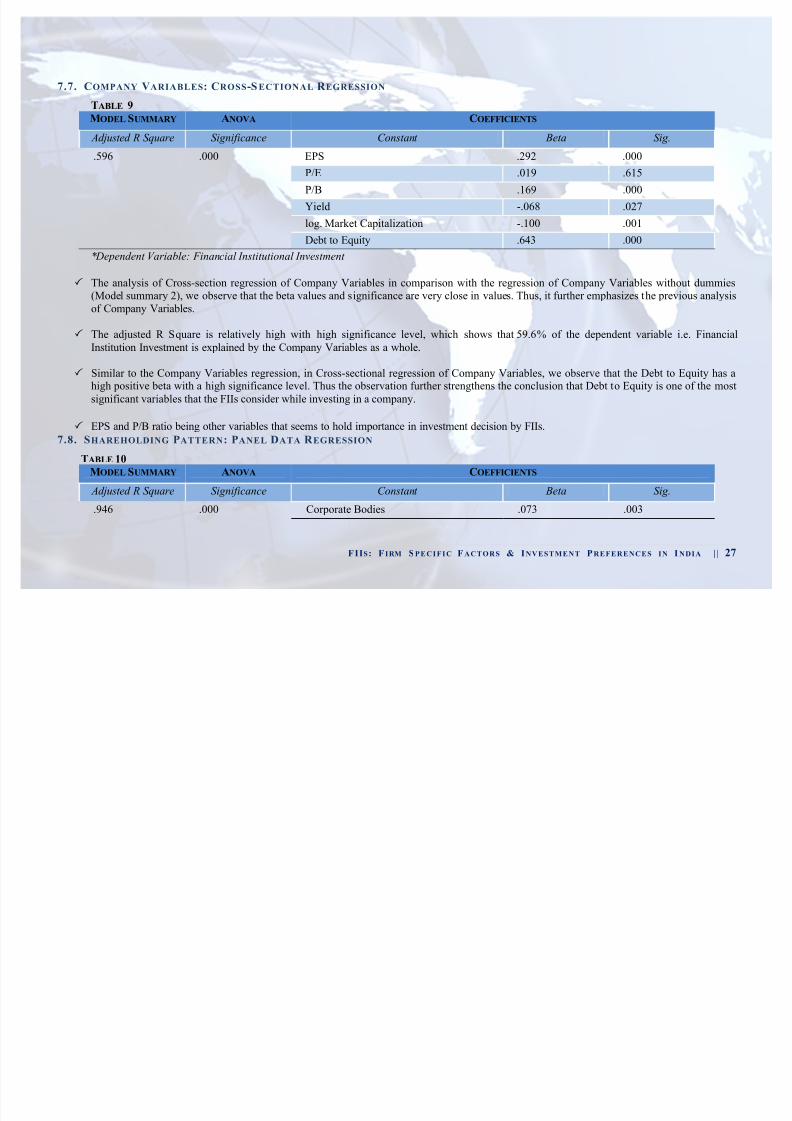
7.7. COMPANY VARIABLES: CROSS-S ECTIONAL R EGRESSION
TABLE 9
MODEL SUMMARY ANOVA COEFFICIENTS
Adjusted R Square Significance Constant Beta Sig.
.596 .000 EPS .292 .000
P/E .019 .615
P/B .169 .000
Yield -.068 .027
log. Market Capitalization -.100 .001
Debt to Equity .643 .000
* Dependent Variable: Financial Institutional Investment
The analysis of Cross-section regression of Company Variables in comparison with the regression of Company Variables without dummies(Model summary 2), we observe that the beta values and significance are very close in values. Thus, it further emphasizes the previous analysisof Company Variables.
The adjusted R Square is relatively high with high significance level, which shows that 59.6% of the dependent variable i.e. FinancialInstitution Investment is explained by the Company Variables as a whole.
Similar to the Company Variables regression, in Cross-sectional regression of Company Variables, we observe that the Debt to Equity has ahigh positive beta with a high significance level. Thus the observation further strengthens the conclusion that Debt to Equity is one of the mostsignificant variables that the FIIs consider while investing in a company.
EPS and P/B ratio being other variables that seems to hold importance in investment decision by FIIs.
7.8. SHAREHOLDING PATTERN: PANEL DATA R EGRESSION
TABLE 10
MODEL SUMMARY ANOVA COEFFICIENTS
Adjusted R Square Significance Constant Beta Sig.
.946 .000 Corporate Bodies .073 .003

8/4/2019 Fiis-firm Specific Factors & Investment Preferences in India - Copy
http://slidepdf.com/reader/full/fiis-firm-specific-factors-investment-preferences-in-india-copy 29/35
FIIS: F IRM SPECI FI C F ACTORS & INVESTMENT PREFERENCES IN I NDIA | | 28
Foreign -.012 .837
Indian Promoter -.012 .713
Institution -.181 .000
Public -.069 .215
7.9. COMPANY VARIABLES: PANEL DATA R EGRESSION
TABLE 11
MODEL SUMMARY ANOVA COEFFICIENTS
Adjusted R Square Significance Constant Beta Sig.
.953 .000 EPS .050 .057
P/E .128 .000
P/B -.145 .000
Yield -.003 .849
log. Market Capitalization .120 .001
Debt to Equity .123 .011
y The suitability use of dummy variables is cross checked with the help of a Stastical test (refer: 7.10, 7.11): The test analysis recommendsthat the observations of the Time-series regression (and thus Combine/Panel data) should be avoided for the overall analysis.

8/4/2019 Fiis-firm Specific Factors & Investment Preferences in India - Copy
http://slidepdf.com/reader/full/fiis-firm-specific-factors-investment-preferences-in-india-copy 30/35
F = (ESS1-ESS2) / (N+T-2)
(ESS2) / (NT-N-T)
* ESS1 ± Error sum of squares using the ordinary least squares model
* ESS2 - Error sum of squares using the Fixed-effects model
* N ± No. Of Cross-sectional units || * T - No. Of Time periods
TABLE 12. SHAREHOLDING PATTERN ± STATISTICAL TEST
1 Dummy C + Shareholding Pattern
ESS1 66698.366
ESS2 4853.476
N 600T 20
F 234.6414436
2 Dummy T + Shareholding Pattern
ESS1 66698.366
ESS2 66446.232
N 600
T 20F 0.069873877
3 Dummy C + Shareholding Pattern + Dummy T
ESS1 66698.366
ESS2 4193.79
N 600
T 50
F 675.0535623
7.10. SHAREHOLDING PATTERN: STATISTICAL TEST
The decision to add dummy variables is made on the basis of statistical testing. The test involves a comparison of the error sum of
squares associated with the two estimation techniques. Since the
ordinary least-squares model includes more parameter restrictions
than does the Fixed-effects model (the intercepts are restricted to be
equal over time and over individuals), we would expect the error
sum of squares to be higher for the ordinary least squares model.
In case of Shareholding Pattern, we observe that the test for crosssectional is significant (234.64) and thus the restrictions added are
justified. However, in Time-series regression, we observe that the
test shows an insignificant value (0.07). Thus we exclude or avoid
the use of dummy variables used in time series regression. Together,
the combined data contains both Dummy C and Dummy T. Thus we
also avoid the observations from the panel data to arrive at an
overall analysis.
8/4/2019 Fiis-firm Specific Factors & Investment Preferences in India - Copy
http://slidepdf.com/reader/full/fiis-firm-specific-factors-investment-preferences-in-india-copy 31/35
FIIS: F IRM SPECI FI C F ACTORS & INVESTMENT PREFERENCES IN I NDIA | | 30
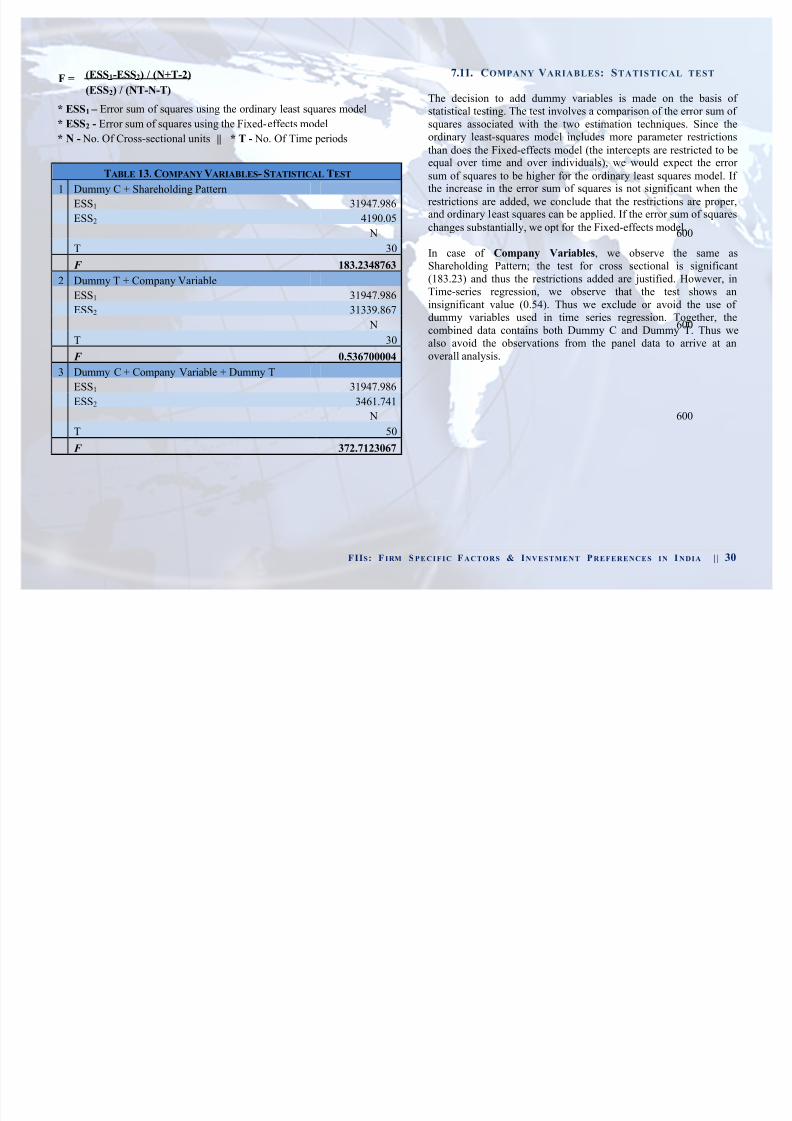
F = (ESS1-ESS2) / (N+T-2)
(ESS2) / (NT-N-T)
* ESS1 ± Error sum of squares using the ordinary least squares model* ESS2 - Error sum of squares using the Fixed-effects model
* N - No. Of Cross-sectional units || * T - No. Of Time periods
TABLE 13. COMPANY VARIABLES- STATISTICAL TEST
1 Dummy C + Shareholding Pattern
ESS1 31947.986
ESS2 4190.05 N 600
T 30
F 183.2348763
2 Dummy T + Company Variable
ESS1 31947.986
ESS2 31339.867
N 600T 30
F 0.536700004
3 Dummy C + Company Variable + Dummy T
ESS1 31947.986
ESS2 3461.741
N 600
T 50F 372.7123067
7.11. COMPANY VARIABLES: STATISTICAL TEST
The decision to add dummy variables is made on the basis of
statistical testing. The test involves a comparison of the error sum of squares associated with the two estimation techniques. Since theordinary least-squares model includes more parameter restrictions
than does the Fixed-effects model (the intercepts are restricted to beequal over time and over individuals), we would expect the error
sum of squares to be higher for the ordinary least squares model. If the increase in the error sum of squares is not significant when the
restrictions are added, we conclude that the restrictions are proper,and ordinary least squares can be applied. If the error sum of squares
changes substantially, we opt for the Fixed-effects model.
In case of Company Variables, we observe the same asShareholding Pattern; the test for cross sectional is significant(183.23) and thus the restrictions added are justified. However, inTime-series regression, we observe that the test shows aninsignificant value (0.54). Thus we exclude or avoid the use of dummy variables used in time series regression. Together, the
combined data contains both Dummy C and Dummy T. Thus wealso avoid the observations from the panel data to arrive at anoverall analysis.

8/4/2019 Fiis-firm Specific Factors & Investment Preferences in India - Copy
http://slidepdf.com/reader/full/fiis-firm-specific-factors-investment-preferences-in-india-copy 32/35

8/4/2019 Fiis-firm Specific Factors & Investment Preferences in India - Copy
http://slidepdf.com/reader/full/fiis-firm-specific-factors-investment-preferences-in-india-copy 33/35
FI IS: FIR M SPECIFIC FACTORS & INVESTMENT PREFERENCES ININDIA | | 32
corporate governance attract more foreign capital. In conclusion the paper suggests that steps can be taken at the firm level to create an environmentconducive to foreign portfolio investment.

8/4/2019 Fiis-firm Specific Factors & Investment Preferences in India - Copy
http://slidepdf.com/reader/full/fiis-firm-specific-factors-investment-preferences-in-india-copy 34/35
FI IS: FIR M SPECIFIC FACTORS & INVESTMENT PREFERENCES ININDIA | | 33
9. ONE STEP AHEAD (SCOPE FOR FURTHER ANALYSIS)
In the paper, we have analyzed Firm level characteristics: Shareholding pattern and Company variables that influence FII investment allocations. Toincrease the scope of study and to go one step ahead of the already established literature we can explore several related areas.
FII flows and stock returns: Determining the Cause and Effect
The sentiments in the Dalal street and particularly among common man has been that FII control the market and the market returns dance to the tunesof FII moods. Is such a sentiment of the common man trading in the Indian equity markets justified? If yes then it must also be true that FII flows are
not only the result but also contribute to the performance of a Company¶s stock . Thus, apart from the impact they create on the market, their holdingswill influence firm performance. For instance, when foreign institutional investors reduced their holdings in Dr. Reddy¶s Lab by 7% to less than 18%,the company dropped from a high of around US$30 to the current level of below US$15. This 50% drop is apparently because of concerns aboutshrinking profit margins and financial performance. These instances made analysts to generally claim that foreign portfolio investment has a short terminvestment horizon. Growth is the only inclination for their investment. Their strategy is ±µWhy take risk when you are not in profit-exit¶. According tothe industry experts, hedge funds played a very active role in Indian stock market since 2003 by entering both Indian cash and derivative market. Theupward trend in the domestic market is due to hedge funds and not due to regular long-term FIIs. Thus the foreign portfolio investments are found to bevery volatile in nature.
FII flows and contemporaneous stock returns are strongly correlated in India. The correlation coefficients between different measures of FII flows and
market returns on the Bombay Stock Exchange during different sample periods can be studied Douma, Pallathiatta and Kabir (2006) investigated theimpact of foreign institutional investment on the performance of emerging market firms and found that there is positive effect of foreign ownership onfirm performance. They also found impact of foreign investment on the business group affiliation of firms.

8/4/2019 Fiis-firm Specific Factors & Investment Preferences in India - Copy
http://slidepdf.com/reader/full/fiis-firm-specific-factors-investment-preferences-in-india-copy 35/35
FI IS: FIR M SPECIFIC FACTORS & INVESTMENT PREFERENCES ININDIA | | 34
R EFERENCES
1. R OBERT S. PINDYCK (ECONOMETRIC MODELS AND ECONOMIC FORECASTS PG . 250-253)USE OF PANEL DAT A, ESTIMATION WITH PANEL DAT A & F IXED EFFECT MODELS
2. PRASANNA, P.K. (JOAAG, VOL 3, NO . 2. ) FII INVESTMENT PREFERENC E I NDIA 2008
3. SAPAN SHAH (TULANE UNIVERSITY ) & DHWANI MEHTA (IES MANAGEMENT COLLEGE) - A STUDY : FII FLOWS IN I NDIA
4. R AJESH CHAKRABARTI (DUPREE COLLEGE OF MANAGEMENT , GEORGIA I NSTITUTE OF TECHNOLOGY ) ± FII FLOWS TO
I NDIA ± NATURE & CAUSES
5. R EENA AGARWAL , LEORA K LAPPER , PETER D. WYSOCKI (WORLD BAN K POLICY R ESEARCH WORKING PAPER 3101, JULY
2003)- PORTFOLIO PREFERENCES OF FOREIGN I NSTITUTIONAL I NVESTORS
6. K RISHNA R EDDY CHITTEDI (DOCTORAL SCHOLAR , CENTER FOR DEVELOPMENT STUDIES, TRIVANDRUM, K ERALA. ) ± VOLATILITY OF I NDIAN STOCK MARKET & FII FLOWS