Figures - Gravesham - Welcome to the democracy section 3 Maps and... · Figures 1. Map of overall...
23
21 Figures 1. Map of overall corridors 2. Option A Overall 3. Option B Overall 4. Option B Ebbsfleet 5. Option C Overall 6. Option C Shorne 7. Option C Chalk 8. Option C variant Bluebell Hill 9. Tables of traffic flow data 10. Strategic Highway Network Performance 11. Habitats Regulation Assessment Flowchart 12. Landscape and listed buildings 13. Heritage 14. Biodiversity – Nature Conservation 15. Biodiversity - Habitats 16. Noise Constraints 17. Air Quality Constraints 18. Green Belt and Sites
Transcript of Figures - Gravesham - Welcome to the democracy section 3 Maps and... · Figures 1. Map of overall...
21
Figures
1. Map of overall corridors
2. Option A Overall
3. Option B Overall
4. Option B Ebbsfleet
5. Option C Overall
6. Option C Shorne
7. Option C Chalk
8. Option Cvariant Bluebell Hill
9. Tables of traffic flow data
10. Strategic Highway Network Performance
11. Habitats Regulation Assessment Flowchart
12. Landscape and listed buildings
13. Heritage
14. Biodiversity – Nature Conservation
15. Biodiversity - Habitats
16. Noise Constraints
17. Air Quality Constraints
18. Green Belt and Sites
22
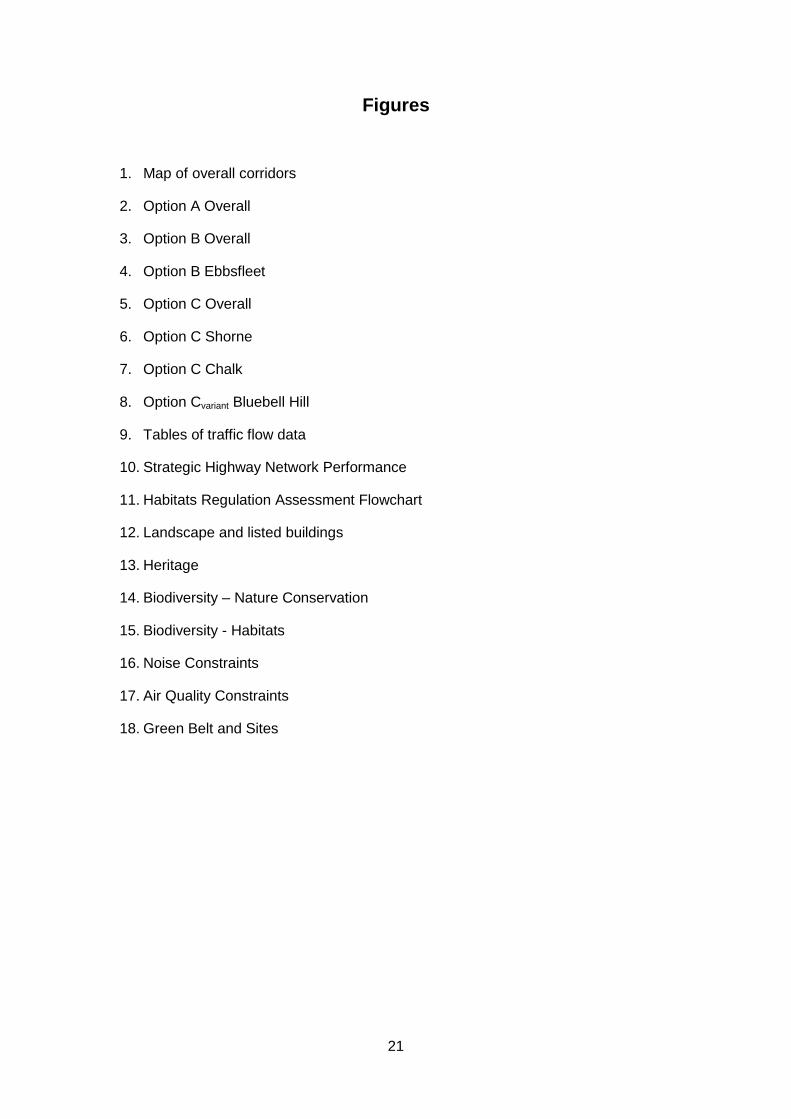
Figure 1: The overall corridors

23
Figure 2: Option A Overall

24
Figure 3: Option B Overall
25
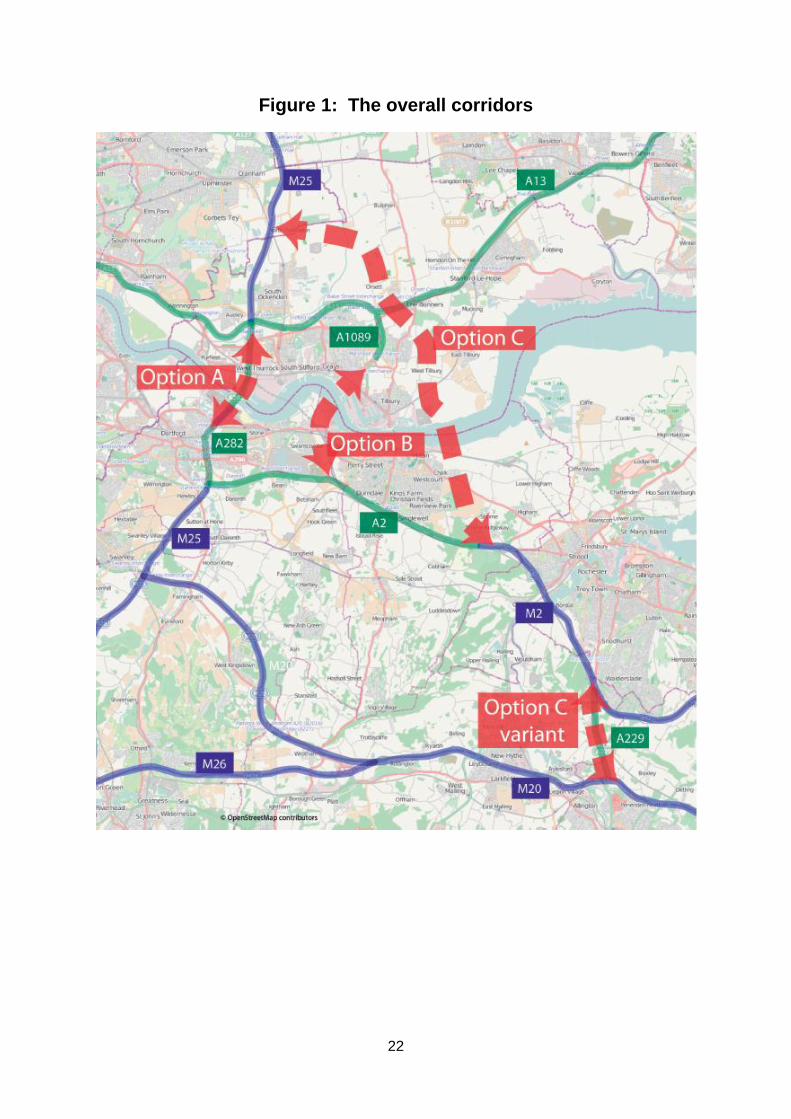
Figure 4: Option B Ebbsfleet
26
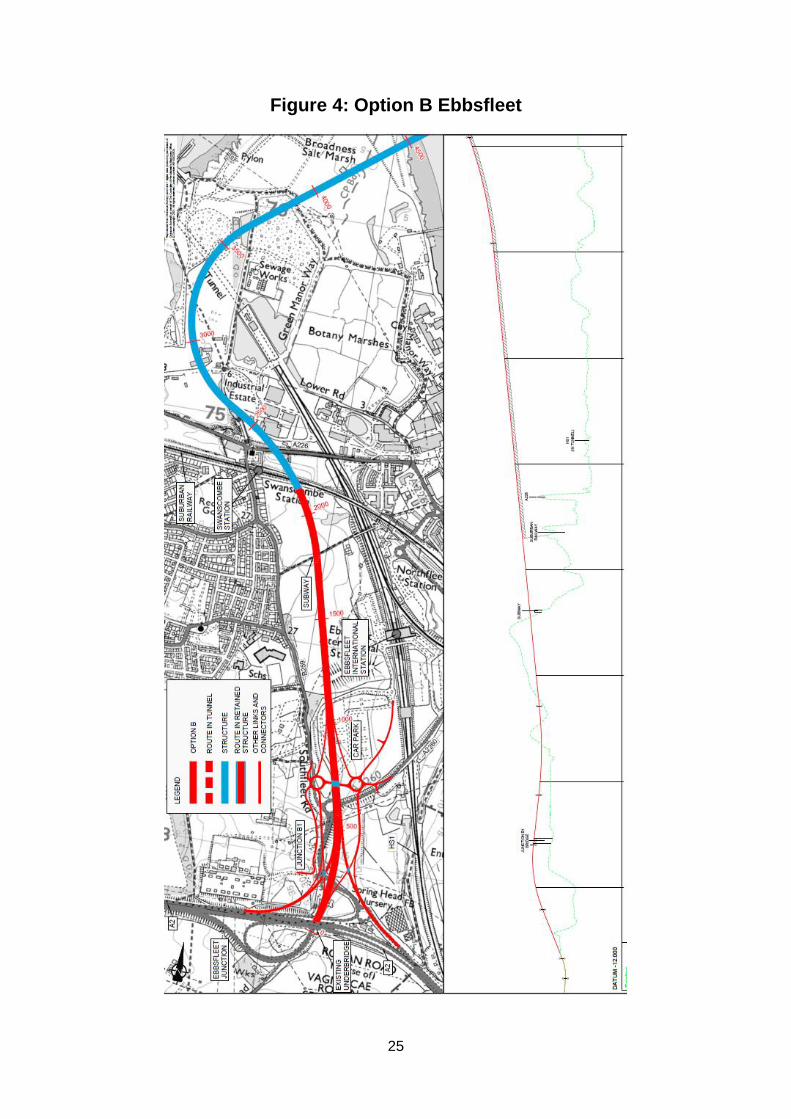
Figure 5: Option C Overall

27
Figure 6: Option C Shorne

28
Figure 7: Option C Chalk
29
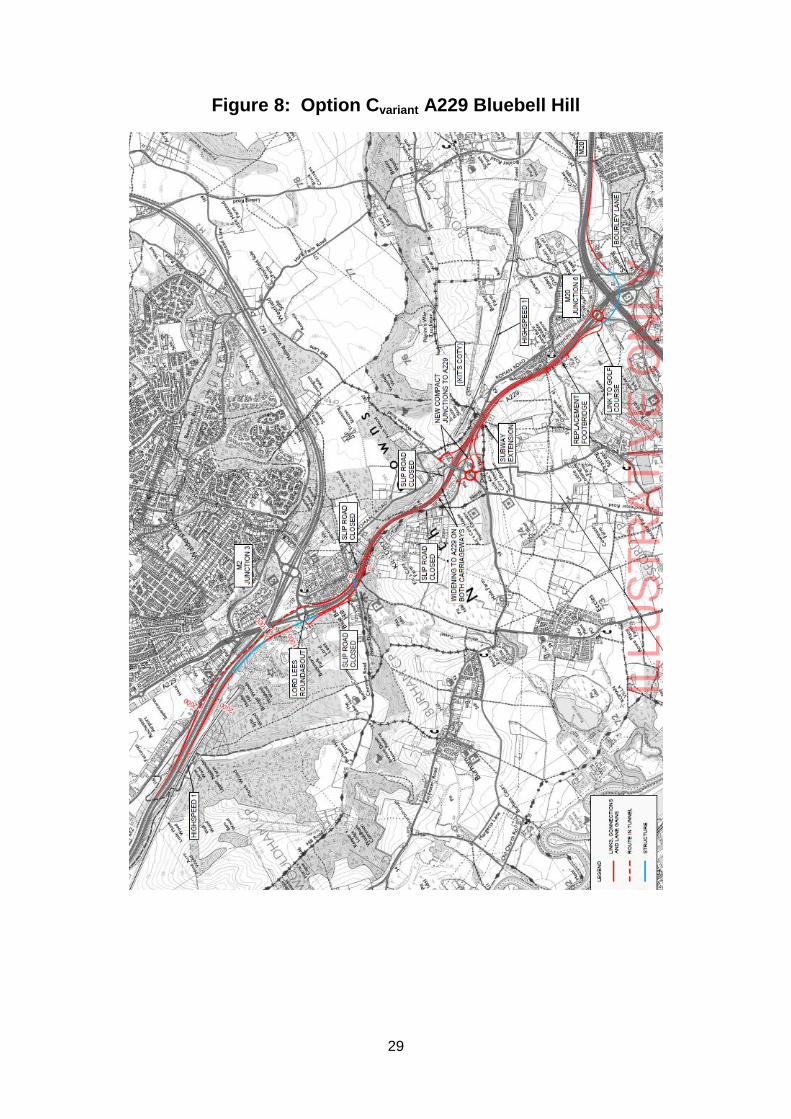
Figure 8: Option Cvariant A229 Bluebell Hill

30
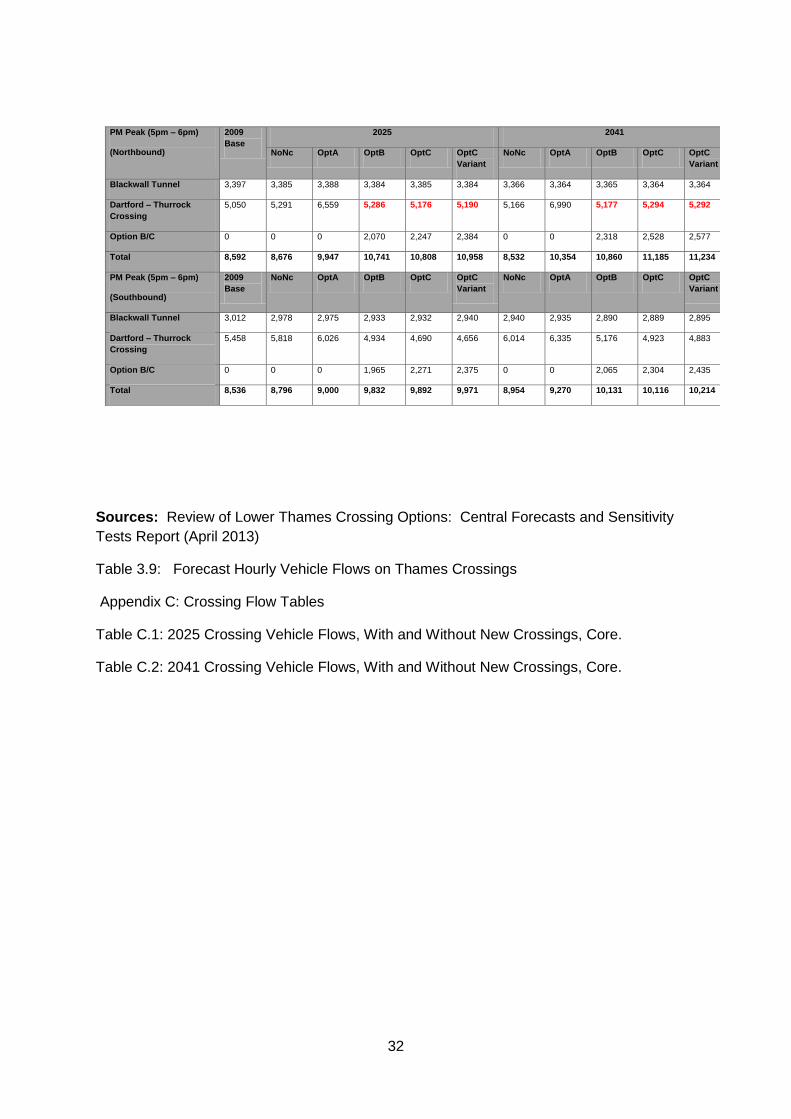
Figure 9: Tables of traffic flow data
Comparison of existing hourly flows with forecast hourly flows on Thames
Crossings
The following tables provide a comparison of existing base flows in 2009 with anticipated
flows in 2025 (opening year) and 2041 as modelled by Aecom. The anticipated flows are
core estimates that take into account planned development to 2025 and increased transport
costs over the period.
Terminology
NoNc = No New Crossing
Option A = new crossing at site of existing crossing at Dartford – anticipated to operate at
75% of capacity or less.
Option B = new crossing at Swanscombe Peninsula – anticipated that existing Dartford
Crossing would operate at 90% of capacity and still experience congestion on occasion.
Option C = new crossing east of Gravesend – anticipated that existing Dartford Crossing
would operate at 90% of capacity and still experience congestion on occasion.
Option CVariant = New crossing east of Gravesend plus new junction at Bluebell Hill to link to
M20 – anticipated that existing Dartford Crossing would operate at 90% of capacity and still
experience congestion on occasion.
NB: Numbers in Red in table indicate that forecast flows exceed those shown for 2009
baseline flow at existing Dartford Crossing.
Numbers in Bold Red in table indicate that the maximum peak hour northbound
baseline flow is exceeded.
This suggests that whilst Options B, C and Cvariant deliver additional overall river crossing
capacity, they do not deal with the fundamental issue of constraints on northbound flows that
lead to peak hour congestion at the existing Dartford Crossing. This would appear to be the
case during the PM peak even on opening of any new crossing in 2025, with northbound
flows also coming close to the 5,000 per hour figure by 2041 for the AM peak and Interpeak
periods. Given flows will be subject to normal daily variation, this suggests that only Option
A addresses the issue of constraints on northbound flows leading to congestion.

31
AM Peak (8am – 9am)
(Northbound)
2009
Base
2025 2041
NoNc OptA OptB OptC OptC
Variant
NoNc OptA OptB OptC OptC
Variant
Blackwall Tunnel 3,034 3,305 3,302 3,301 3,303 3,301 3,240 3,236 3,234 3,234 3,234
Dartford – Thurrock
Crossing
4,855 5,053 6,320 4,886 4,614 4,609 4,913 6,881 4,947 4,988 4,981
Option B/C 0 0 0 1,927 2,352 2,370 0 0 2,374 2,354 2,381
Total 7,970 8,359 9,622 10,115 10,270 10,280 8,153 10,117 10,555 10,576 10,596
AM Peak (8am – 9am)
(Southbound)
2009
Base
NoNc OptA OptB OptC OptC
Variant
NoNc OptA OptB OptC OptC
Variant
Blackwall Tunnel 3,394 3,349 3,350 3,339 3,342 3,341 3,272 3,269 3,261 3,261 3,261
Dartford – Thurrock
Crossing
4,112 5,097 5,356 4,679 4,540 4,531 5,585 6,066 5,311 5,202 5,193
Option B/C 0 0 0 1,208 1,345 1,427 0 0 1,340 1,375 1,462
Total 7,631 8,446 8,706 9,226 9,227 9,299 8,858 9,335 9,912 9,837 9,916
Interpeak
(Average 10am – 4pm)
(Northbound)
2009
Base
2025 2041
NoNc OptA OptB OptC OptC
Variant
NoNc OptA OptB OptC OptC
Variant
Blackwall Tunnel 2,772 3,173 3,172 3,170 3,175 3,176 3,114 3,114 3,110 3,114 3,116
Dartford – Thurrock
Crossing
4,193 4,897 5,821 4,634 4,363 4,355 4,706 6,457 4,690 4,811 4,849
Option B/C 0 0 0 1,659 2,084 2,156 0 0 2,048 2,193 2,217
Total 7,026 8,070 8,993 9,463 9,621 9,687 7,820 9,571 9,848 10,118 10,181
Interpeak
(Average 10am – 4pm)
(Southbound)
2009
Base
NoNc OptA OptB OptC OptC
Variant
NoNc OptA OptB OptC OptC
Variant
Blackwall Tunnel 2,662 2,961 2,958 2,933 2,931 2,937 2,931 2,919 2,890 2,881 2,889
Dartford – Thurrock
Crossing
4,353 5,634 5,945 5,058 4,724 4,735 5,795 6,489 5,515 5,309 5,317
Option B/C 0 0 0 1,600 1,963 2,035 0 0 1,762 2,077 2,165
Total 7,063 8,595 8,903 9,591 9,618 9,707 7,820 9,571 10,161 10,261 10,371
32
Sources: Review of Lower Thames Crossing Options: Central Forecasts and Sensitivity
Tests Report (April 2013)
Table 3.9: Forecast Hourly Vehicle Flows on Thames Crossings
Appendix C: Crossing Flow Tables
Table C.1: 2025 Crossing Vehicle Flows, With and Without New Crossings, Core.
Table C.2: 2041 Crossing Vehicle Flows, With and Without New Crossings, Core.
PM Peak (5pm – 6pm)
(Northbound)
2009
Base
2025 2041
NoNc OptA OptB OptC OptC
Variant
NoNc OptA OptB OptC OptC
Variant
Blackwall Tunnel 3,397 3,385 3,388 3,384 3,385 3,384 3,366 3,364 3,365 3,364 3,364
Dartford – Thurrock
Crossing
5,050 5,291 6,559 5,286 5,176 5,190 5,166 6,990 5,177 5,294 5,292
Option B/C 0 0 0 2,070 2,247 2,384 0 0 2,318 2,528 2,577
Total 8,592 8,676 9,947 10,741 10,808 10,958 8,532 10,354 10,860 11,185 11,234
PM Peak (5pm – 6pm)
(Southbound)
2009
Base
NoNc OptA OptB OptC OptC
Variant
NoNc OptA OptB OptC OptC
Variant
Blackwall Tunnel 3,012 2,978 2,975 2,933 2,932 2,940 2,940 2,935 2,890 2,889 2,895
Dartford – Thurrock
Crossing
5,458 5,818 6,026 4,934 4,690 4,656 6,014 6,335 5,176 4,923 4,883
Option B/C 0 0 0 1,965 2,271 2,375 0 0 2,065 2,304 2,435
Total 8,536 8,796 9,000 9,832 9,892 9,971 8,954 9,270 10,131 10,116 10,214
33
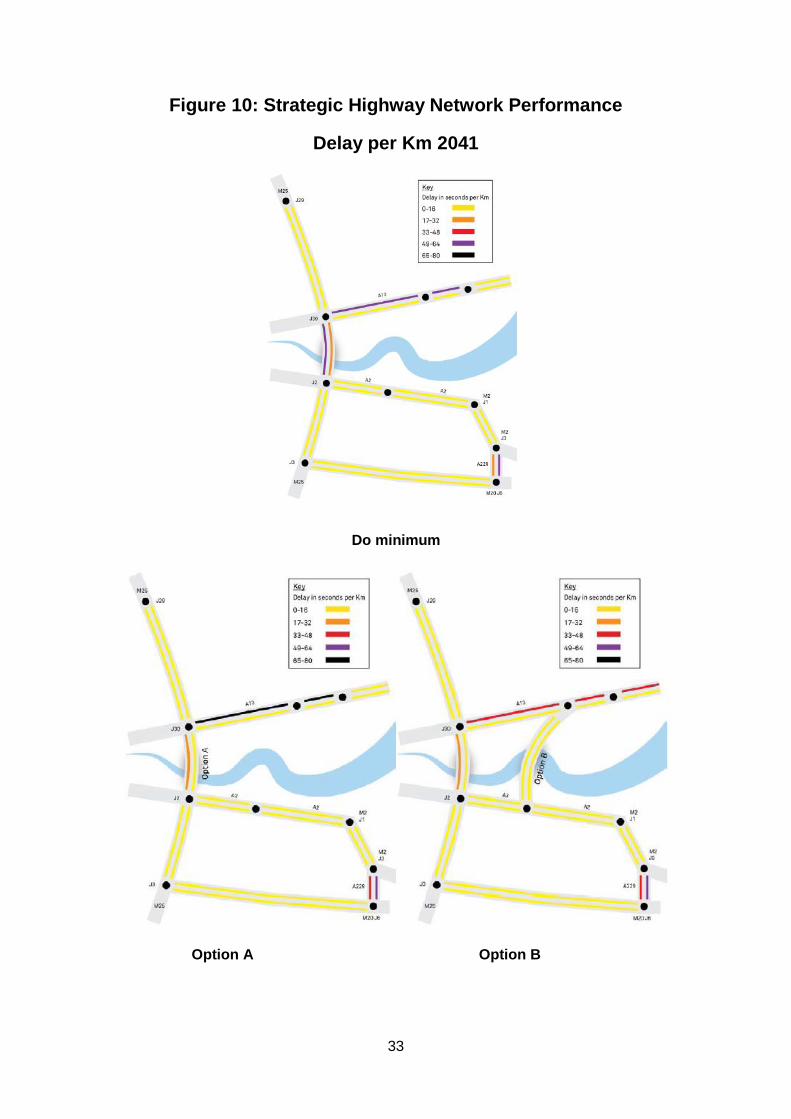
Figure 10: Strategic Highway Network Performance
Delay per Km 2041
Do minimum
Option A Option B
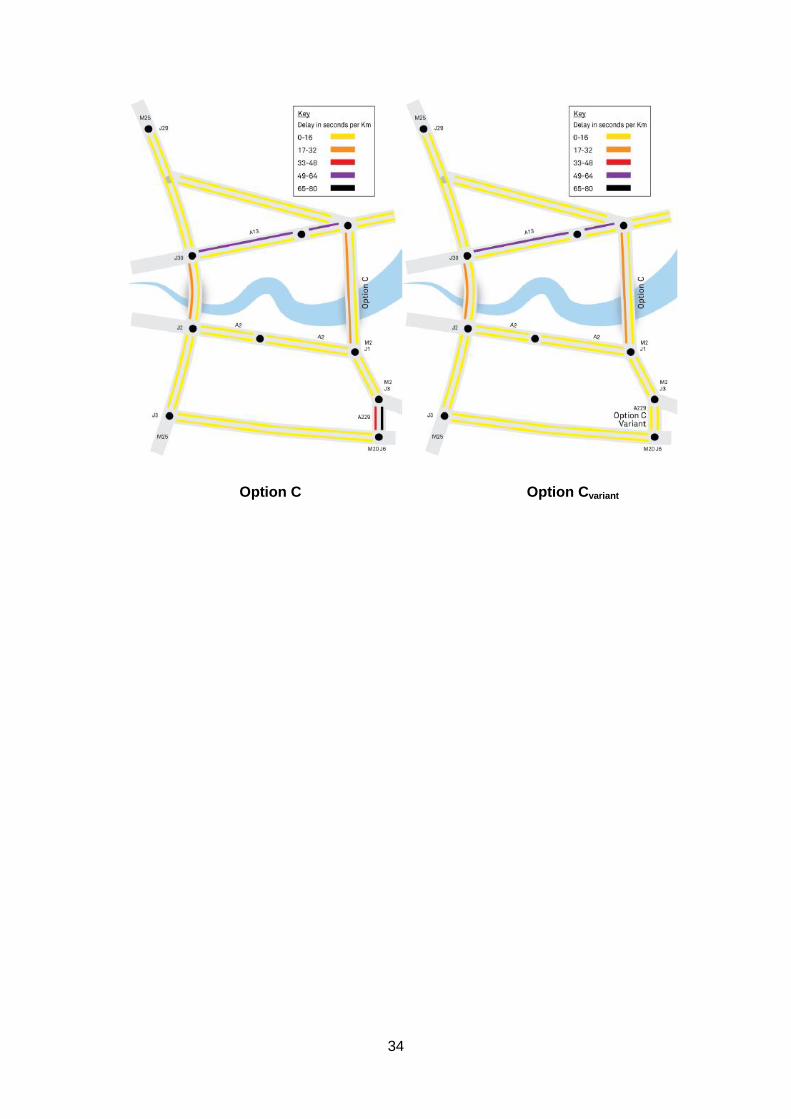
34
Option C Option Cvariant
35
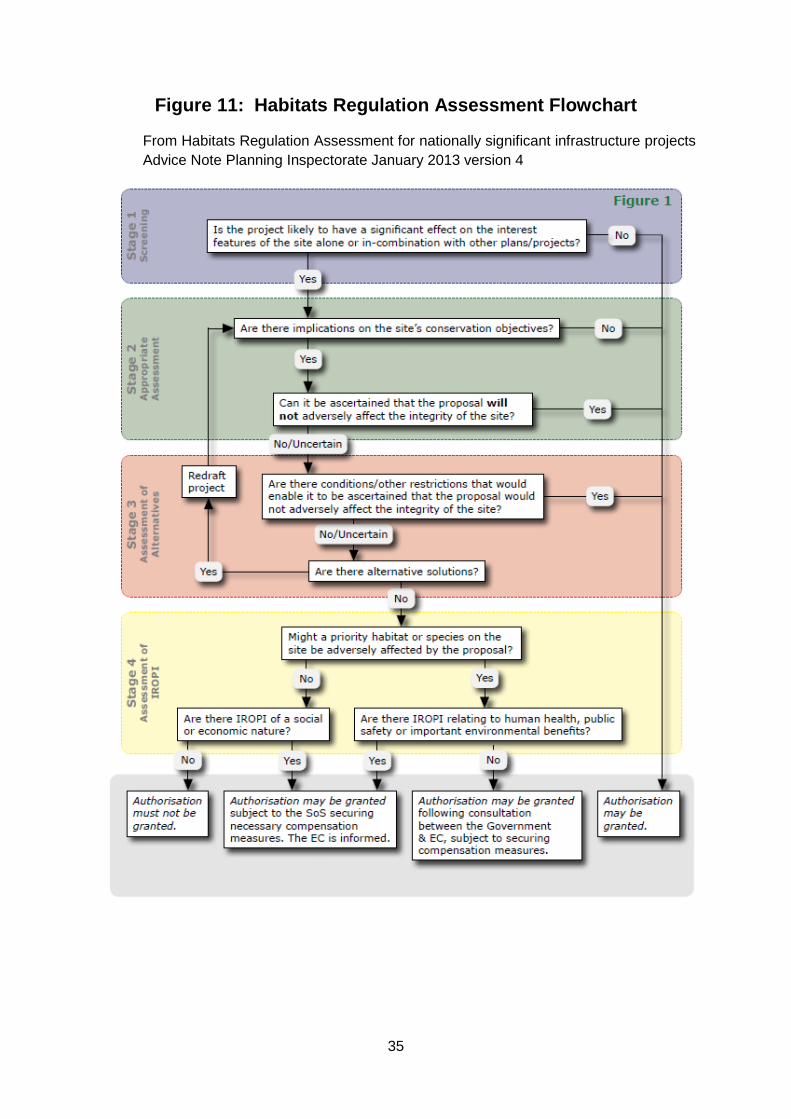
Figure 11: Habitats Regulation Assessment Flowchart
From Habitats Regulation Assessment for nationally significant infrastructure projects
Advice Note Planning Inspectorate January 2013 version 4

36
Figure 12: Landscape and Listed Buildings

37
Figure 13: Heritage
38
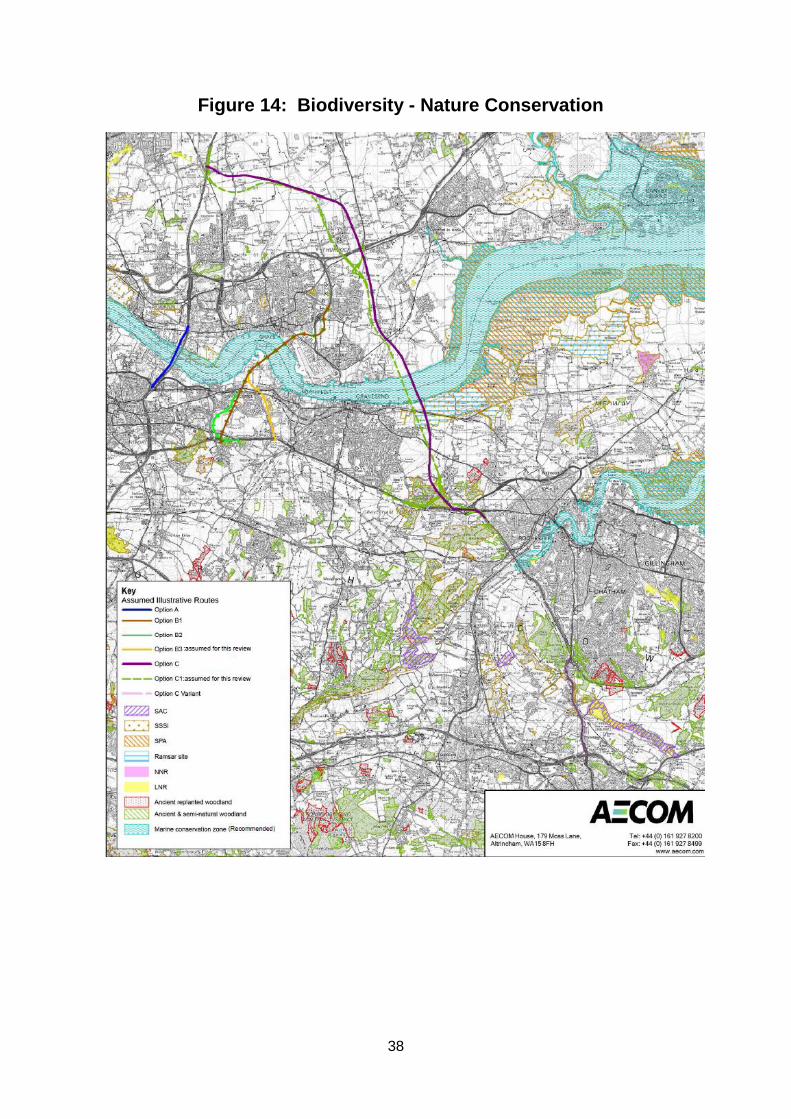
Figure 14: Biodiversity - Nature Conservation

39
Figure 15: Biodiversity - Habitats

40
Figure 16: Noise Constraints
41
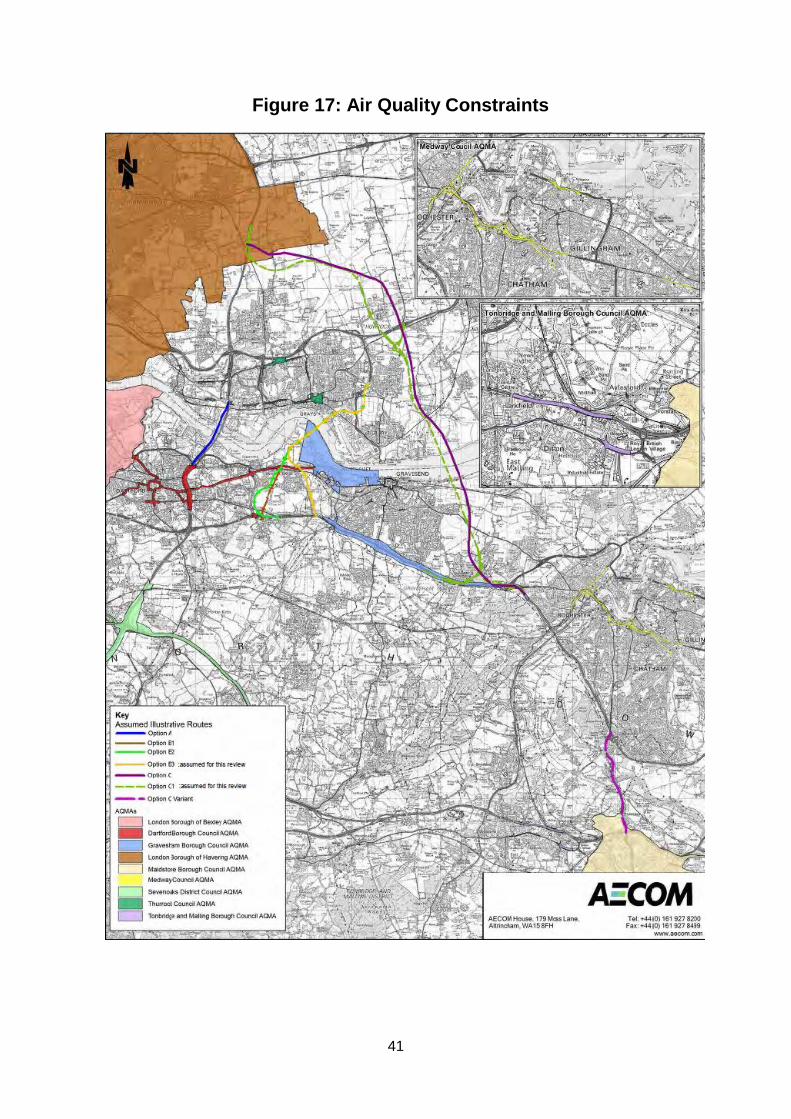
Figure 17: Air Quality Constraints

42
Figure 18: Green Belt and Sites

43