Figures for the future: 20 years of sustainable development in Europe?
99
Figures for the future: 20 years of sustainable development in Europe?
-
Upload
andrew-wiley -
Category
Documents
-
view
216 -
download
0
Transcript of Figures for the future: 20 years of sustainable development in Europe?

Figures for the future:20 years of sustainable development in Europe?

2Growth, jobs and the crisis

Figures for the future: 20 years of sustainable development in Europe?
2.1 Years of economic growth interrupted
• GDP grew fairly constantly in the EU until 2007
• After the 2008 ‘crash’ the economy started to contract, shrinking 4.6 % in 2009
• Baltic states were hit hardest by the crisis
Source: Eurostat (online data code: tsdec100)
Real GDP per capita, EU-27Euros (deflated)
Figures for the future: 20 years of sustainable development in Europe?
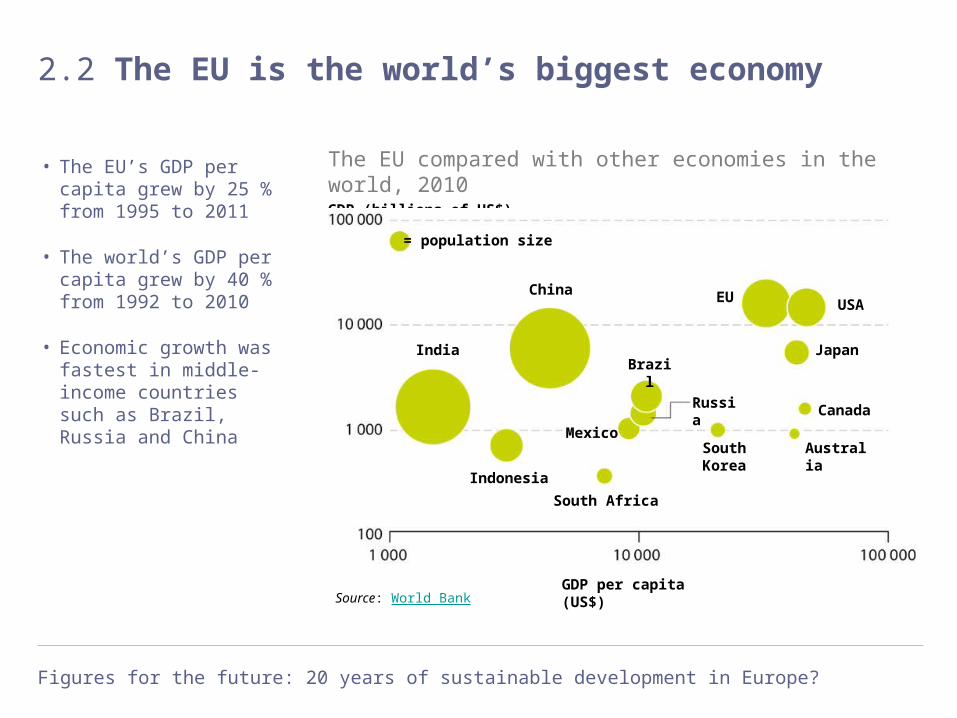
2.2 The EU is the world’s biggest economy
• The EU’s GDP per capita grew by 25 % from 1995 to 2011
• The world’s GDP per capita grew by 40 % from 1992 to 2010
• Economic growth was fastest in middle-income countries such as Brazil, Russia and China
Source: World Bank
The EU compared with other economies in the world, 2010GDP (billions of US$)
= population size
India
China
Indonesia
Mexico
Brazil
Russia
South Korea
South Africa
Australia
Japan
USAEU
Canada
GDP per capita (US$)
Figures for the future: 20 years of sustainable development in Europe?
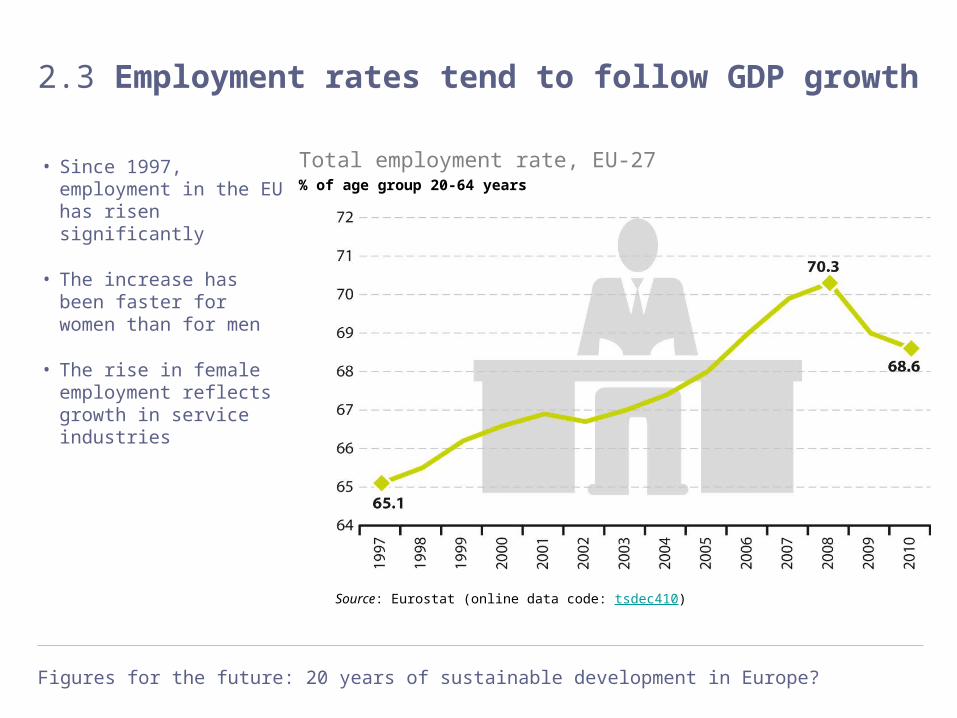
2.3 Employment rates tend to follow GDP growth
• Since 1997, employment in the EU has risen significantly
• The increase has been faster for women than for men
• The rise in female employment reflects growth in service industries
Source: Eurostat (online data code: tsdec410)
Total employment rate, EU-27% of age group 20-64 years
Figures for the future: 20 years of sustainable development in Europe?
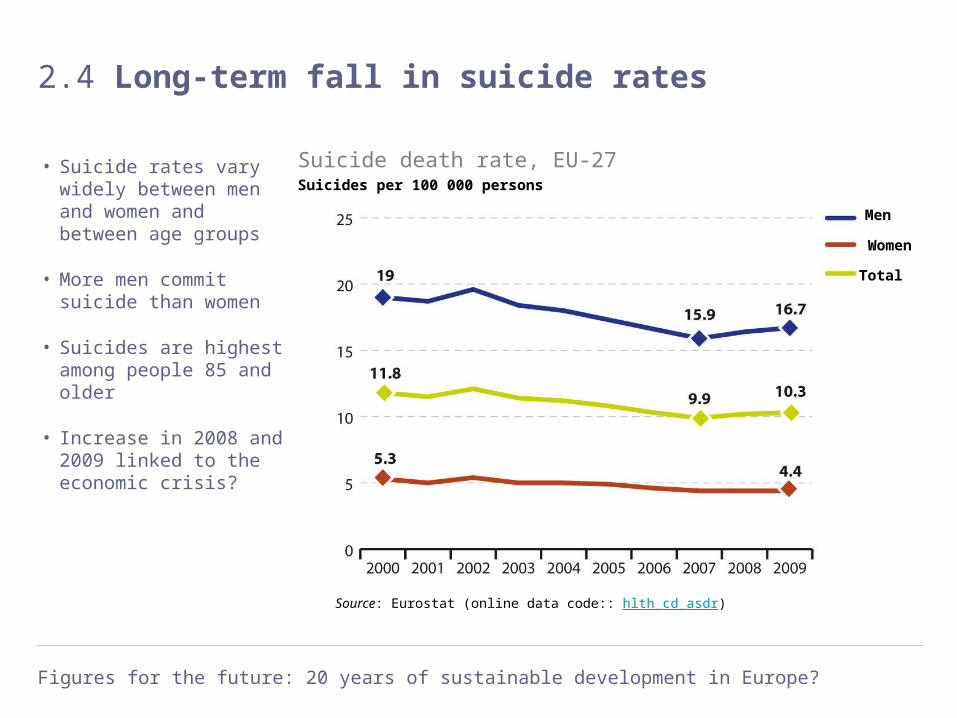
2.4 Long-term fall in suicide rates
• Suicide rates vary widely between men and women and between age groups
• More men commit suicide than women
• Suicides are highest among people 85 and older
• Increase in 2008 and 2009 linked to the economic crisis?
Source: Eurostat (online data code:: hlth_cd_asdr)
Suicide death rate, EU-27Suicides per 100 000 persons
Men
Women
Total
Figures for the future: 20 years of sustainable development in Europe?
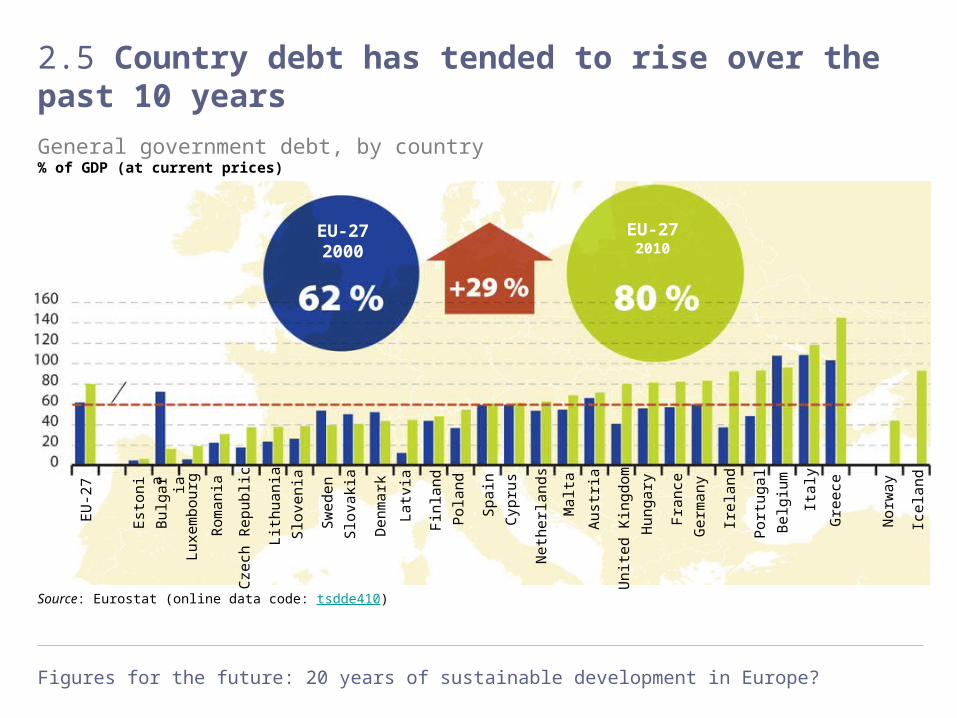
2.5 Country debt has tended to rise over the past 10 years
Maastricht Treaty reference level
Source: Eurostat (online data code: tsdde410)
EU
-27
Est
onia
Bul
garia
Luxe
mbo
urg
Rom
ania
Cze
ch R
epub
lic
Lith
uani
a
Slo
veni
a
Sw
eden
Slo
vaki
a
Den
mar
k
Latv
ia
Fin
land
Pol
and
Spa
in
Cyp
rus
Net
herla
nds
Mal
ta
Aus
tria
Uni
ted
Kin
gdom
Hun
gary
Fra
nce
Ger
man
y
Irel
and
Por
tuga
l
Bel
gium Ital
y
Gre
ece
Nor
way
Icel
and
EU-272000
EU-272010
General government debt, by country% of GDP (at current prices)
Figures for the future: 20 years of sustainable development in Europe?
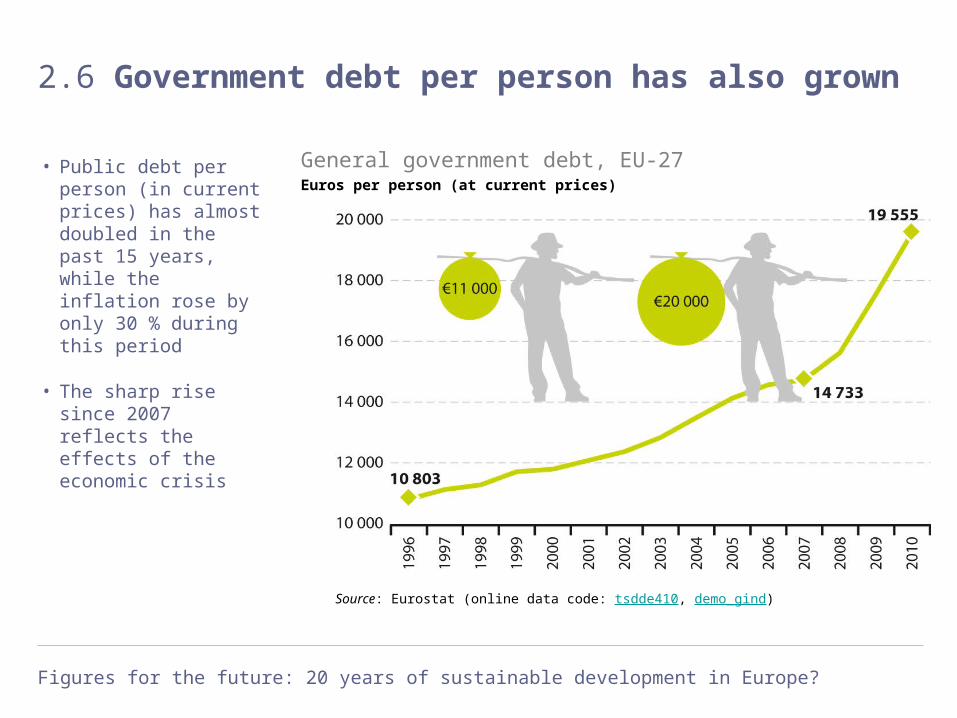
2.6 Government debt per person has also grown
• Public debt per person (in current prices) has almost doubled in the past 15 years, while the inflation rose by only 30 % during this period
• The sharp rise since 2007 reflects the effects of the economic crisis
Source: Eurostat (online data code: tsdde410, demo_gind)
General government debt, EU-27Euros per person (at current prices)

3Energy: increasing consumption, increasing dependence
Figures for the future: 20 years of sustainable development in Europe?
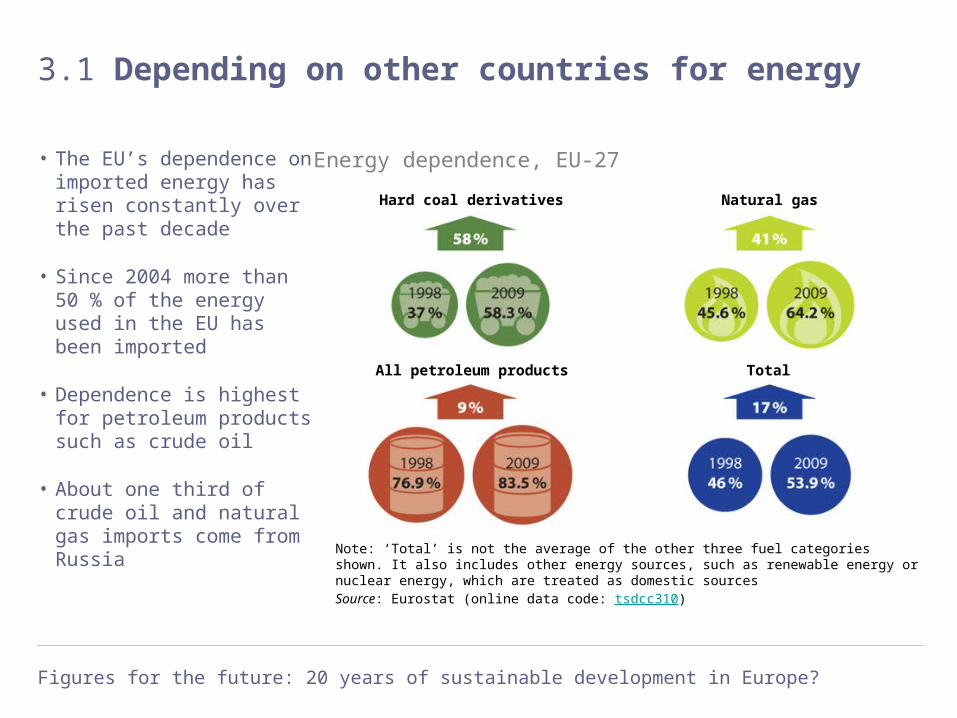
3.1 Depending on other countries for energy
• The EU’s dependence on imported energy has risen constantly over the past decade
• Since 2004 more than 50 % of the energy used in the EU has been imported
• Dependence is highest for petroleum products such as crude oil
• About one third of crude oil and natural gas imports come from Russia
Source: Eurostat (online data code: tsdcc310)
Energy dependence, EU-27
Hard coal derivatives Natural gas
All petroleum products Total
Note: ‘Total’ is not the average of the other three fuel categories shown. It also includes other energy sources, such as renewable energy or nuclear energy, which are treated as domestic sources

Figures for the future: 20 years of sustainable development in Europe?
3.2 Where the EU imports energy from
Source: Eurostat (online data code: nrg_122a, nrg_123a, nrg_124a)
Energy imports into the EU-27, 2010
North America
Caribbean
Central and SouthAmerica
Africa
Middle East
Rest of non-EU Europe
Russia
Asia
Oceania
Not specified
GasTerajoules
OilMillion tonnes
Solid fuelsMillion tonnes
Figures for the future: 20 years of sustainable development in Europe?
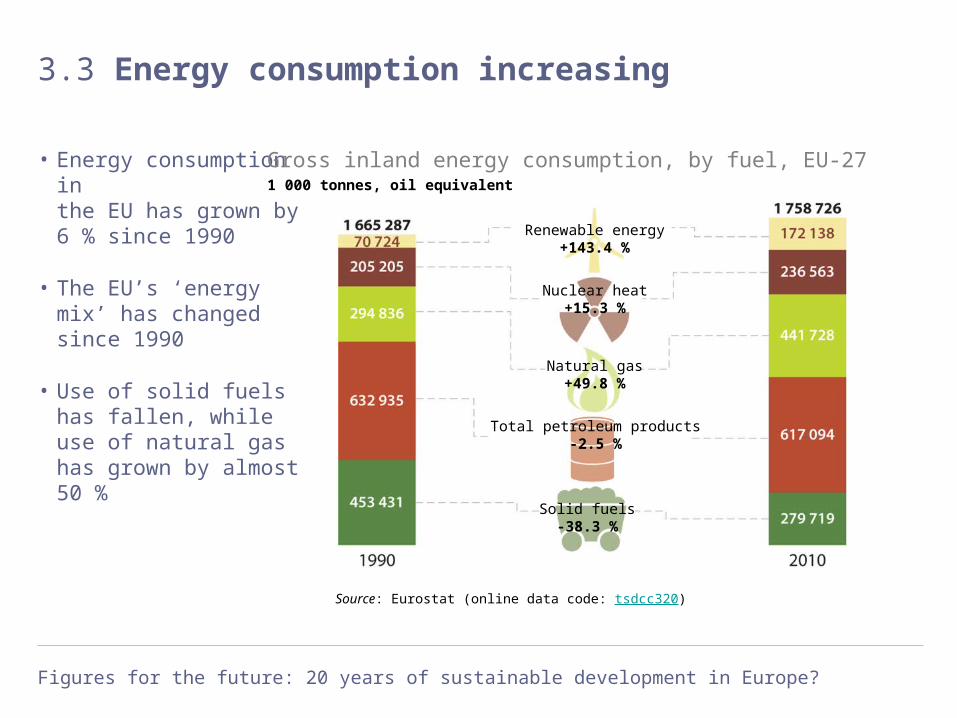
3.3 Energy consumption increasing
• Energy consumption in the EU has grown by 6 % since 1990
• The EU’s ‘energy mix’ has changed since 1990
• Use of solid fuels has fallen, while use of natural gas has grown by almost 50 %
Source: Eurostat (online data code: tsdcc320)
Gross inland energy consumption, by fuel, EU-271 000 tonnes, oil equivalent
Renewable energy+143.4 %
Nuclear heat+15.3 %
Natural gas+49.8 %
Total petroleum products-2.5 %
Solid fuels-38.3 %
Figures for the future: 20 years of sustainable development in Europe?
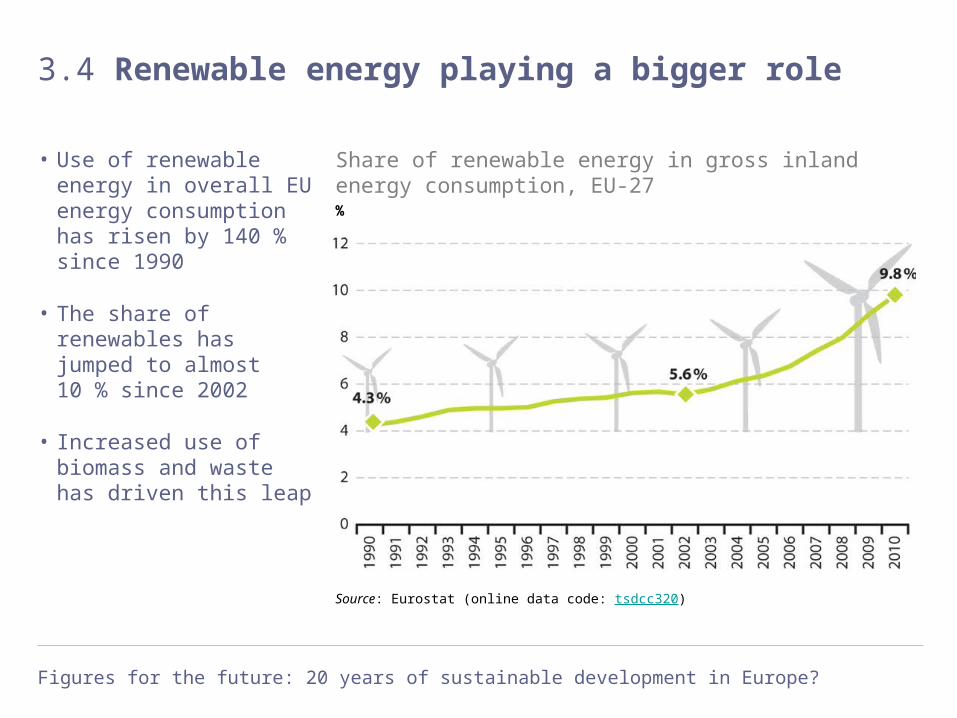
3.4 Renewable energy playing a bigger role
• Use of renewable energy in overall EU energy consumption has risen by 140 % since 1990
• The share of renewables has jumped to almost 10 % since 2002
• Increased use of biomass and waste has driven this leap
Source: Eurostat (online data code: tsdcc320)
Share of renewable energy in gross inland energy consumption, EU-27%

Figures for the future: 20 years of sustainable development in Europe?
3.5 Consumption of renewable energy
• Biomass and renewable wastes are the most important renewable energy sources
• Wood and wood wastes account for almost half of renewable energy use in the EU
• Energy produced from wind and solar has increased nine-fold since 1999
Source: Eurostat (online data code: nrg_1071a, nrg_1072a)
Consumption of renewable energy, EU-27, 2010
Solar energy2 %
Wind power8 %
Hydro power18 %
Geothermal energy3 %
Biomass and renewable wastes 69 %
Wood and wood waste 49 %
Other biomass and waste 20 %
Figures for the future: 20 years of sustainable development in Europe?
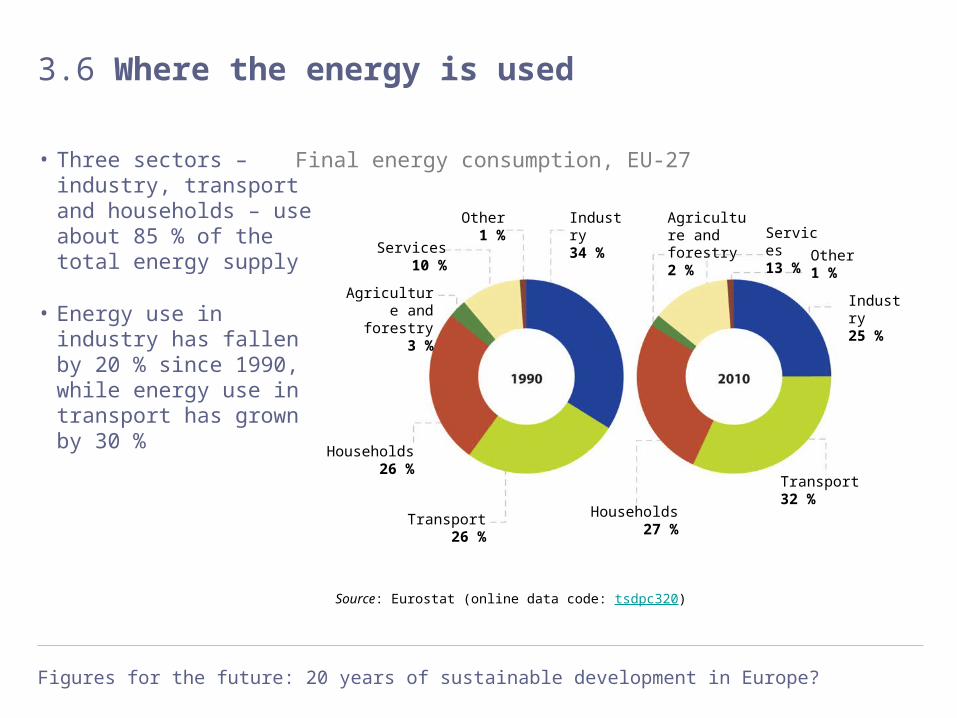
3.6 Where the energy is used
• Three sectors – industry, transport and households – use about 85 % of the total energy supply
• Energy use in industry has fallen by 20 % since 1990, while energy use in transport has grown by 30 %
Source: Eurostat (online data code: tsdpc320)
Final energy consumption, EU-27
Other1 %
Services10 %
Agriculture and forestry
3 %
Households26 %
Transport26 %
Households27 %
Transport32 %
Industry25 %
Other1 %
Services13 %
Agriculture and forestry2 %
Industry34 %

Figures for the future: 20 years of sustainable development in Europe?
3.7 Households using more and more electricity
• Electricity use by households has grown fairly constantly in the EU
• It has risen by about 40 % over the past 20 years
• The ‘rebound effect’ has offset technological improvements
Source: Eurostat (online data code: tsdpc310)
Electricity consumption of householdsMillion tonnes of oil equivalent

Figures for the future: 20 years of sustainable development in Europe?
3.8 An EU-wide view of household electricity use
Source: Eurostat (online data code: tsdpc310, lfst_hhnhtych)
EU
-27
Est
onia
Bul
garia
Luxe
mbo
urg
Rom
ania
Cze
ch R
epub
lic
Lith
uani
a
Slo
veni
a
Sw
eden
Slo
vaki
a
Den
mar
k
Latv
ia
Fin
land
Pol
and
Spa
in
Cyp
rus
Net
herla
nds
Mal
ta
Aus
tria
Uni
ted
Kin
gdom
Hun
gary
Fra
nce
Ger
man
y
Irel
and
Por
tuga
l
Bel
gium
Ital
y
Gre
ece
Cro
atia
FY
R o
f M
aced
onia
Electricity consumption per household, by countryKilograms of oil equivalent per household
4Role of transport in the economy

Figures for the future: 20 years of sustainable development in Europe?
4.1 More and more cars on the road
• The number of cars per 1 000 people has grown by 40 % since 1991
• Huge differences exist between Member States
• In nine Member States there is at least one car for every second person
Source: Eurostat (online data code: tsdpc340)
Motorisation rate, EU-27Cars per 1 000 people

Figures for the future: 20 years of sustainable development in Europe?
4.2 Transport of goods and passengers in the EU
• Road is the most common method of transport in the EU
• Public transport accounts for less than 20 % of travel
• The share of road freight transport has grown since 2000 at the cost of rail
Source: Eurostat (online data code: tsdtr210, tsdtr220)
Modal split of passenger and freight transport, EU-27% in total inland passenger-kilometre and freight tonne-kilometre
Passenger2008
Freight2009
Train7 %
Bus and coach10 %
Car83 %
Rail16 %
Inland waterways6 %
Road78 %

Figures for the future: 20 years of sustainable development in Europe?
4.3 How Europe transports its freight
Source: Eurostat (online data code: tsdtr220)
Modal split of freight transport by country, 2009% in total inland freight tonne-kilometre
EU-27Road77 %
EU-27Rail17 %
EU-27Inland waterways6 %
EU
-27
Cze
ch R
epub
lic
Hun
gary
Por
tuga
l
Latv
ia
Bul
garia
Est
onia
Pol
and
Cyp
rus
Rom
ania
Den
mar
k
Lith
uani
a
Mal
ta
Aus
tria
Ital
y
Irel
and
Ger
man
y
Bel
gium
Luxe
mbo
urg
Uni
ted
Kin
gdom
Net
herla
nds
Gre
ece
Fin
land
Spa
in
Slo
vaki
a
Slo
veni
a
Sw
eden
Fra
nce
Nor
way
Icel
and
Cro
atia
FY
R o
f M
aced
onia
Tur
key

Figures for the future: 20 years of sustainable development in Europe?
4.4 Transport volumes linked to economic growth
• Freight transport and economic growth are strongly linked
• No ‘decoupling’ between economic growth and the need for transport is visible
Source: Eurostat (online data code: tsdtr230, nama_gdp_k)
Volume of freight transport relative to GDP, EU-27*Index 2000 = 100
*Eurostat estimates; break in series in 2004
Inland tonne-kilometre
GDP (deflated)
Tonne-kilometre/GDP
5Undesired impacts of transport
Figures for the future: 20 years of sustainable development in Europe?
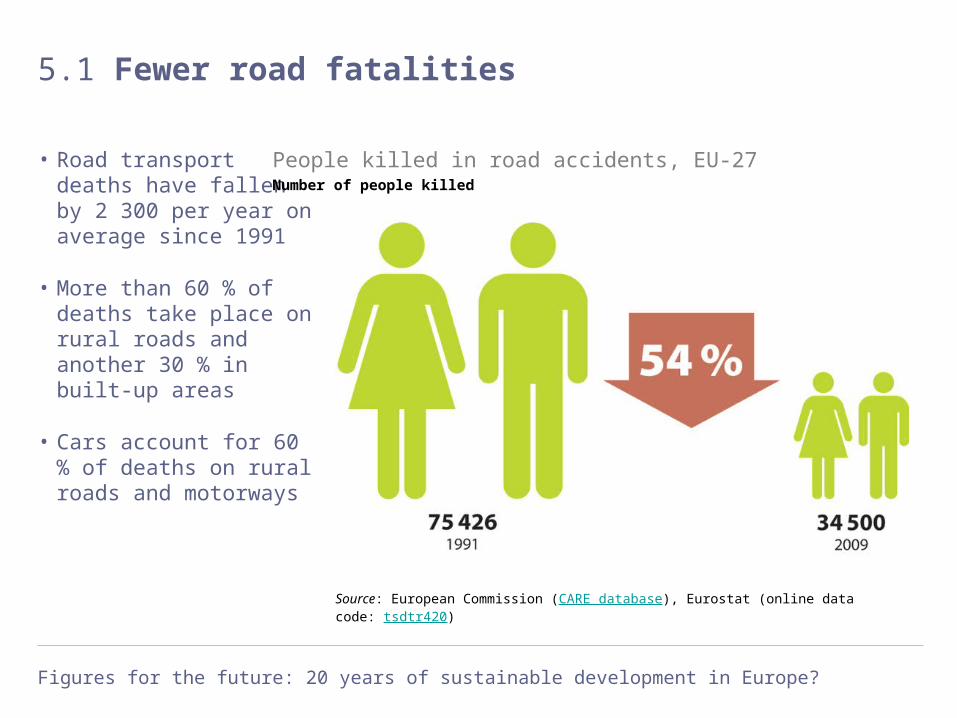
5.1 Fewer road fatalities
• Road transport deaths have fallen by 2 300 per year on average since 1991
• More than 60 % of deaths take place on rural roads and another 30 % in built-up areas
• Cars account for 60 % of deaths on rural roads and motorways
Source: European Commission (CARE database), Eurostat (online data code: tsdtr420)
People killed in road accidents, EU-27Number of people killed

Figures for the future: 20 years of sustainable development in Europe?
5.2 New cars emitting less carbon dioxide
• CO2 emissions per kilometre from new passenger cars have been falling since 1995
• A switch from petrol to diesel and fuel-saving technologies have been the main drivers of this reduction
Source: Eurostat (online data code: tsdtr450)
Average carbon dioxide emissions from new passenger carsGrams of CO2 per kilometre

Figures for the future: 20 years of sustainable development in Europe?
5.3 More greenhouse gas emissions from transport
• Growth in car numbers and transport volumes has driven the rise in greenhouse gas emissions from transport
• Transport is the only sector in the EU emitting more greenhouse gas today than in 1990
• Emissions from international air and maritime transport have grown the fastest
Source: European Environment Agency, Eurostat (online data code: tsdtr410)
Greenhouse gas emissions from transport, EU-27Million tonnes of CO2 equivalent
International maritime
International aviation
Transport (road, rail, inland navigation, domestic aviation)

Figures for the future: 20 years of sustainable development in Europe?
5.4 NOx and non-methane VOC emissions falling
Source: European Environment Agency, Eurostat (online data code: tsdpc270, tsdtr430, tsdpc280)
Transport emissions of nitrogen oxides and non-methane volatile organic compounds, EU-27
ROAD TRANSPORT EMISSIONS EMISSION SOURCES, 2009
Nitrogen oxides (NOx), million tonnes
Nitrogen oxides (NOx)
Other51 %
Other81 %
Non-methane volatile organic compounds
Road transport17 %
Non-road transport2 %
Non-road transport7 %
Road transport42 %
Non-methane volatile organic compounds, million tonnes

Figures for the future: 20 years of sustainable development in Europe?
5.5 Urban exposure to ozone air pollution fluctuates
• Ground-level ozone causes respiratory problems in humans and animals
• Despite the cut in NOx and NMVOC emissions, air pollution by ozone has not improved
• Heat waves can boost ozone exposure
Source: European Environment Agency, Eurostat (online data code: tsdph380)
Urban exposure to air pollution by ozone, EU-27Micrograms per cubic metre per day

Figures for the future: 20 years of sustainable development in Europe?
5.6 Urban exposure to particulate matter pollution
• Transport is a major emitter of particulate matter (PM10)
• Again, a falling trend in PM10 emissions has not led to a similar improvement in exposure to the air pollutant
Source: European Environment Agency, Eurostat (online data code: tsdph370)
Urban exposure to air pollution by particulate matter, EU-27Micrograms per cubit metre per day
6Regional disparities
Figures for the future: 20 years of sustainable development in Europe?
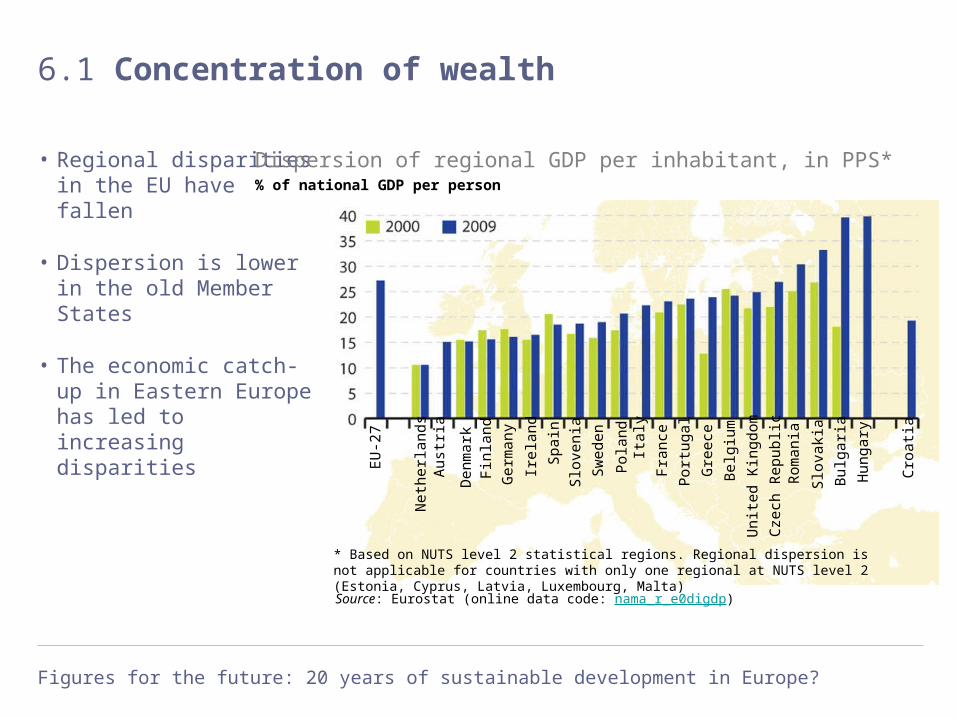
6.1 Concentration of wealth
• Regional disparities in the EU have fallen
• Dispersion is lower in the old Member States
• The economic catch-up in Eastern Europe has led to increasing disparities
Source: Eurostat (online data code: nama_r_e0digdp)
Dispersion of regional GDP per inhabitant, in PPS*% of national GDP per person
* Based on NUTS level 2 statistical regions. Regional dispersion is not applicable for countries with only one regional at NUTS level 2 (Estonia, Cyprus, Latvia, Luxembourg, Malta)
EU
-27
Fra
nce
Gre
ece
Hun
gary
Net
herla
nds
Sw
eden
Aus
tria
Bel
gium
Ger
man
y
Slo
vaki
a
Fin
land
Den
mar
k
Bul
garia
Slo
veni
a
Pol
and
Cro
atia
Rom
ania
Spa
in
Ital
y
Por
tuga
l
Cze
ch R
epub
lic
Irel
and
Uni
ted
Kin
gdom
Figures for the future: 20 years of sustainable development in Europe?
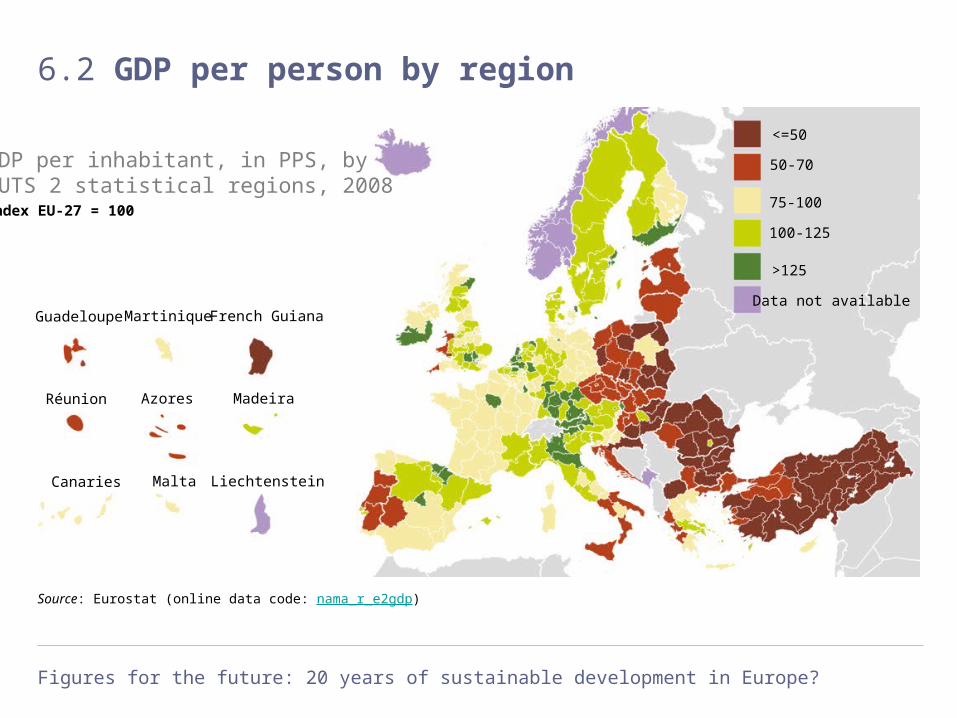
6.2 GDP per person by region
Source: Eurostat (online data code: nama_r_e2gdp)
GDP per inhabitant, in PPS, by NUTS 2 statistical regions, 2008Index EU-27 = 100
Guadeloupe Martinique French Guiana
Réunion Azores Madeira
Canaries Malta Liechtenstein
<=50
50-70
75-100
100-125
>125
Data not available

Figures for the future: 20 years of sustainable development in Europe?
6.3 Change in GDP per person by region
Source: Eurostat (online data code: nama_r_e2gdp)
Change of GDP per inhabitant, in PPS, by NUTS 2 statistical regions, 2000-2008 Percentage points of the average EU-27
<= -10
-10 to -3
-3 to +3
+3 to +10
> +10
Data not availableGuadeloupe Martinique French Guiana
Réunion Azores Madeira
Canaries Malta Liechtenstein

Figures for the future: 20 years of sustainable development in Europe?
6.4 Differences in regional employment rates
• Disparities in employment have fallen in the EU
• Dispersion rates are higher for women than for men
• But women are catching up with men due to a stronger decline in dispersion rates
Source: Eurostat (online data code: tsdec440)
Dispersion of regional employment by gender, EU-27, NUTS level 2Coefficient of variation of employment rates (of the age group 15-64) Women
Total
Men
Figures for the future: 20 years of sustainable development in Europe?
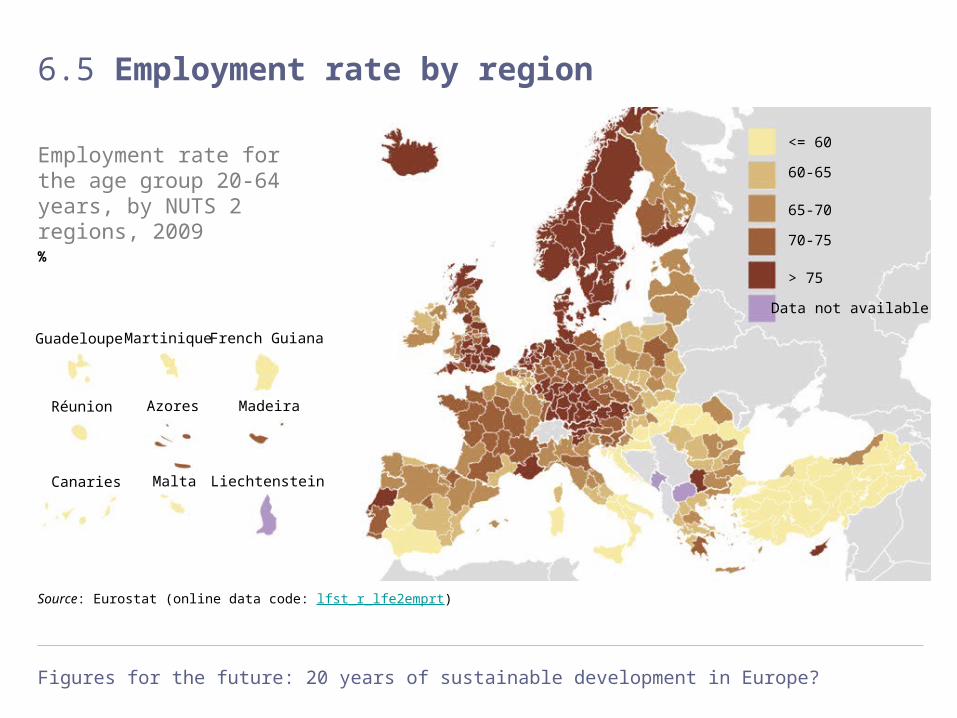
6.5 Employment rate by region
Source: Eurostat (online data code: lfst_r_lfe2emprt)
Employment rate for the age group 20-64 years, by NUTS 2 regions, 2009%
Guadeloupe Martinique French Guiana
Réunion Azores Madeira
Canaries Malta Liechtenstein
<= 60
60-65
65-70
70-75
> 75
Data not available
Figures for the future: 20 years of sustainable development in Europe?
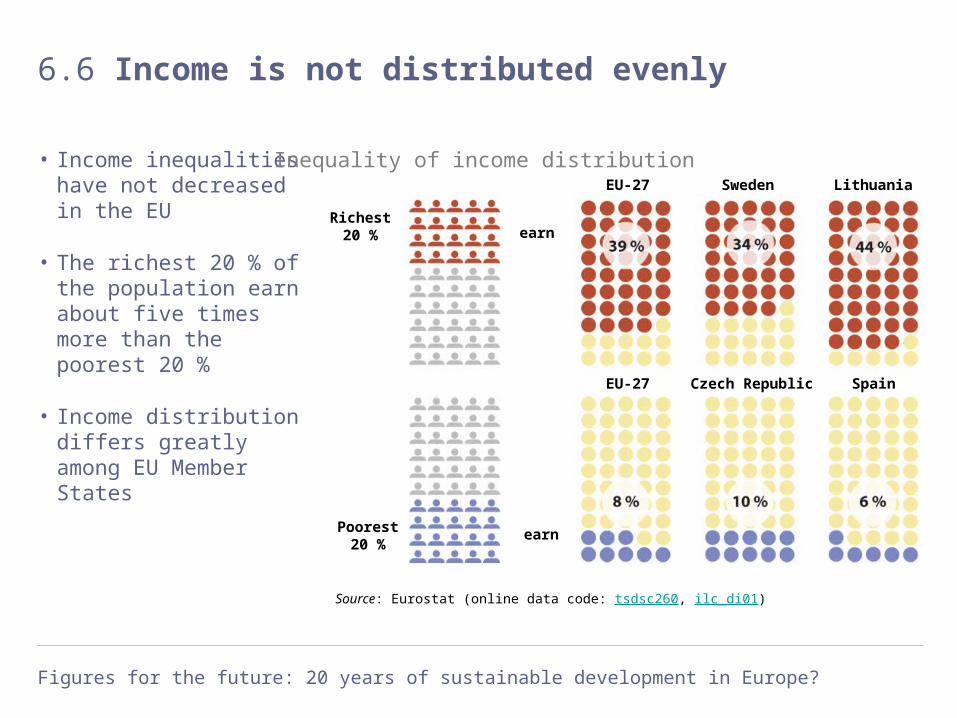
6.6 Income is not distributed evenly
• Income inequalities have not decreased in the EU
• The richest 20 % of the population earn about five times more than the poorest 20 %
• Income distribution differs greatly among EU Member States
Source: Eurostat (online data code: tsdsc260, ilc_di01)
Inequality of income distributionEU-27 Sweden Lithuania
Richest20 %
Poorest20 %
earn
earn
EU-27 Czech Republic Spain

7Poverty and social exclusion in Europe
Figures for the future: 20 years of sustainable development in Europe?
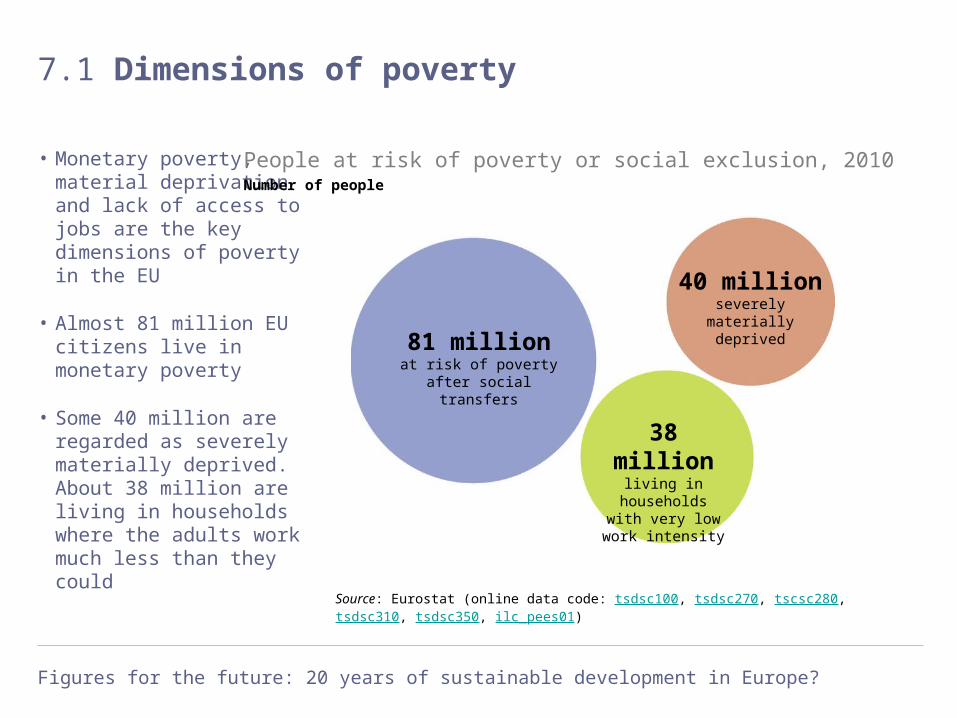
7.1 Dimensions of poverty
• Monetary poverty, material deprivation and lack of access to jobs are the key dimensions of poverty in the EU
• Almost 81 million EU citizens live in monetary poverty
• Some 40 million are regarded as severely materially deprived. About 38 million are living in households where the adults work much less than they could
Source: Eurostat (online data code: tsdsc100, tsdsc270, tscsc280, tsdsc310, tsdsc350, ilc_pees01)
People at risk of poverty or social exclusion, 2010Number of people
81 millionat risk of poverty after
social transfers
40 millionseverely materially
deprived
38 millionliving in
households with very low work
intensity

Figures for the future: 20 years of sustainable development in Europe?
7.2 Dimensions of poverty
• 116 million people in the EU were at risk of poverty or social exclusion in 2010
• People can be affected by more than one dimension of poverty at the same time
• Some 80 million people were affected by one dimension of poverty, 28 million by two dimensions and almost 8 million by all three dimensions at the same time
Source: Eurostat (online data code: tsdsc100, tsdsc270, tscsc280, tsdsc310, tsdsc350, ilc_pees01)
People at risk of poverty or social exclusion, 2010Number of people
48 millionat risk of poverty after
social transfers
19 millionseverely materially deprived
14 millionin households with very low work intensity
3 million7.5 million
11 million
14 million

Figures for the future: 20 years of sustainable development in Europe?
7.3 Monetary poverty is the most common form of poverty
Source: Eurostat (online data code: tscsc280, tsdsc350)
People at risk of poverty after social transfers% of population
EU
-27
Bel
gium
Ger
man
y
Ital
y
Cze
ch R
epub
lic
Den
mar
k
Net
herla
nds
Est
onia
Rom
ania
Hun
gary
Pol
and
Aus
tria
Latv
ia
Slo
vaki
a
Por
tuga
l
Bul
garia
Fin
land
Fra
nce
Gre
ece
Uni
ted
Kin
gdom
Sw
eden
Spa
in
Luxe
mbo
urg
Lith
uani
a
Mal
ta
Cyp
rus
Slo
veni
a
Irel
and
Icel
and
Nor
way
Sw
itzer
land
Cro
atia
EU-272005
EU-272010

Figures for the future: 20 years of sustainable development in Europe?
7.4 Severely materially deprived people
Source: Eurostat (online data code: tscsc270)
Severely materially deprived people% of population
EU
-27
Bel
gium
Cze
ch R
epub
lic
Luxe
mbo
urg
Uni
ted
Kin
gdom
Sw
eden
Ital
y
Fin
land
Pol
and
Den
mar
k
Net
herla
nds
Lith
uani
a
Ger
man
y
Mal
ta
Latv
ia
Gre
ece
Aus
tria
Bul
garia
Fra
nce
Rom
ania
Slo
veni
a
Slo
vaki
a
Spa
in
Irel
and
Sw
itzer
land
Icel
and
Nor
way
Cro
atia
Est
onia
Por
tuga
l
Cyp
rus
EU-272005
EU-272010
Hun
gary
Figures for the future: 20 years of sustainable development in Europe?
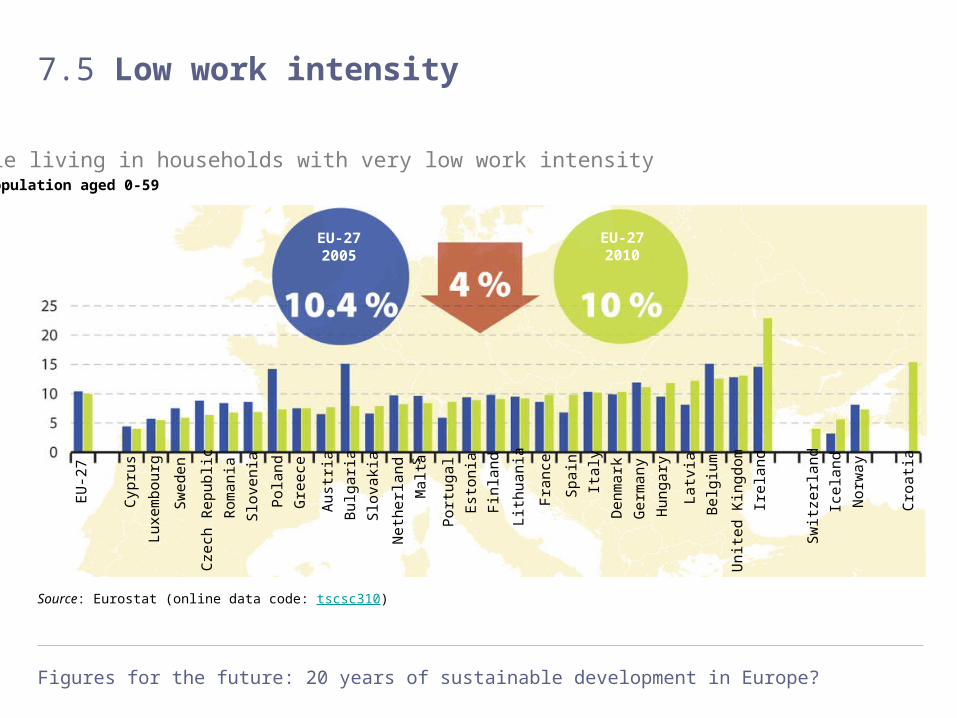
7.5 Low work intensity
Source: Eurostat (online data code: tscsc310)
People living in households with very low work intensity% of population aged 0-59
EU
-27
Net
herla
nds
Por
tuga
l
Latv
ia
Cyp
rus
Aus
tria
Luxe
mbo
urg
Est
onia
Rom
ania
Ger
man
y
Cze
ch R
epub
lic
Sw
eden
Hun
gary
Gre
ece
Bul
garia
Bel
gium
Den
mar
k
Pol
and
Irel
and
Slo
vaki
a
Uni
ted
Kin
gdom
Mal
ta
Ital
y
Slo
veni
a
Fin
land
Sw
itzer
land
Icel
and
Nor
way
Cro
atia
Lith
uani
a
Fra
nce
Spa
in
EU-272005
EU-272010
Figures for the future: 20 years of sustainable development in Europe?
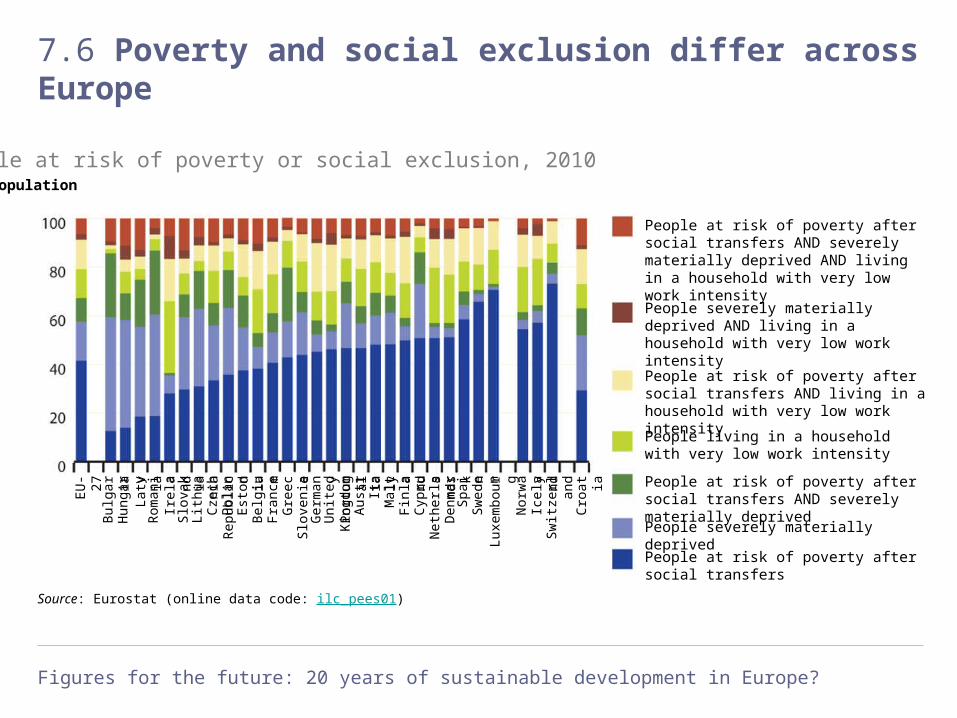
7.6 Poverty and social exclusion differ across Europe
Fra
nce
Slo
veni
a
Den
mar
k
Irel
and
Cyp
ru s
Mal
ta
Icel
an d
Por
tuga
l
People at risk of poverty or social exclusion, 2010% of population
EU
-27
Bul
garia
Pol
and
Hun
gar y
Ger
man
y
Rom
ania
Latv
i a
Net
herla
nds
Cze
ch R
epub
lic
Est
onia
Spa
in
Fin
land
Lith
uani
a
Luxe
mbo
ur g
Bel
gium
Sw
eden
Gre
ec e
Slo
vaki
a
Uni
ted
Kin
gdom
Sw
itzer
land
Aus
tria
Italy
People at risk of poverty after social transfers AND severely materially deprived AND living in a household with very low work intensity
People severely materially deprived AND living in a household with very low work intensity
People at risk of poverty after social transfers AND living in a household with very low work intensity
People living in a household with very low work intensity
People at risk of poverty after social transfers AND severely materially deprived
People severely materially deprived
People at risk of poverty after social transfers
Source: Eurostat (online data code: ilc_pees01)
Nor
way
Cro
atia
Figures for the future: 20 years of sustainable development in Europe?
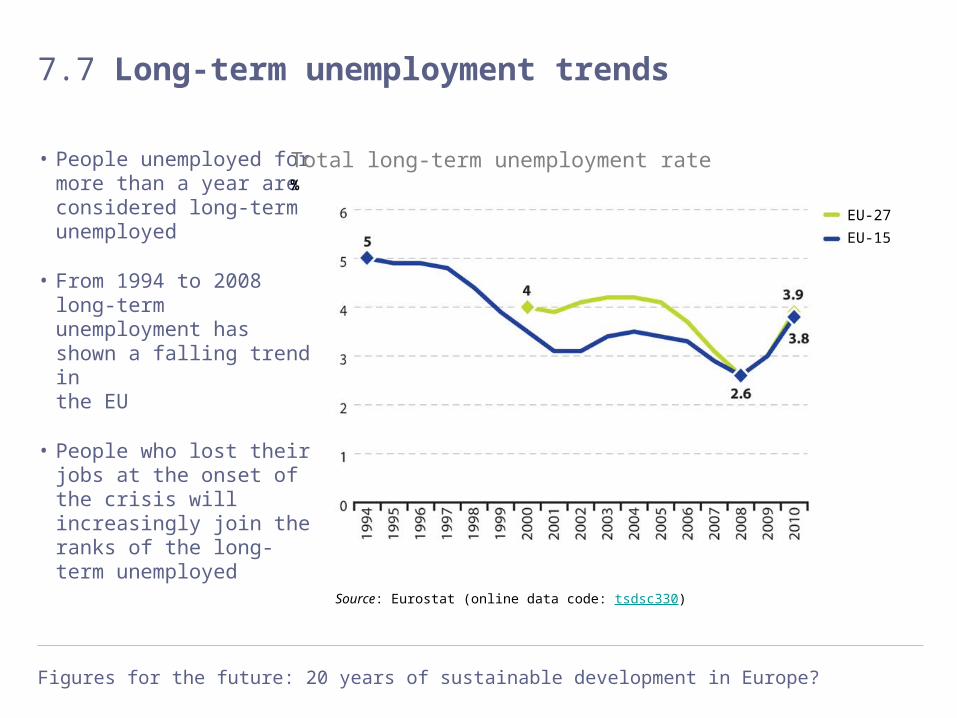
7.7 Long-term unemployment trends
• People unemployed for more than a year are considered long-term unemployed
• From 1994 to 2008 long-term unemployment has shown a falling trend in the EU
• People who lost their jobs at the onset of the crisis will increasingly join the ranks of the long-term unemployed
Source: Eurostat (online data code: tsdsc330)
Total long-term unemployment rate%
EU-27
EU-15

Figures for the future: 20 years of sustainable development in Europe?
7.8 More people staying longer at school
• School drop-out rates fell fairly steadily in the EU
• There is a clear link between education and the risk of poverty
• People with low education levels experience the highest risk of poverty
Source: Eurostat (online data code: tsdsc410) Note: Break in series in 2003
Early leavers from education and training% of population aged 18-24

8The waste problem (and how it can be solved)
Figures for the future: 20 years of sustainable development in Europe?
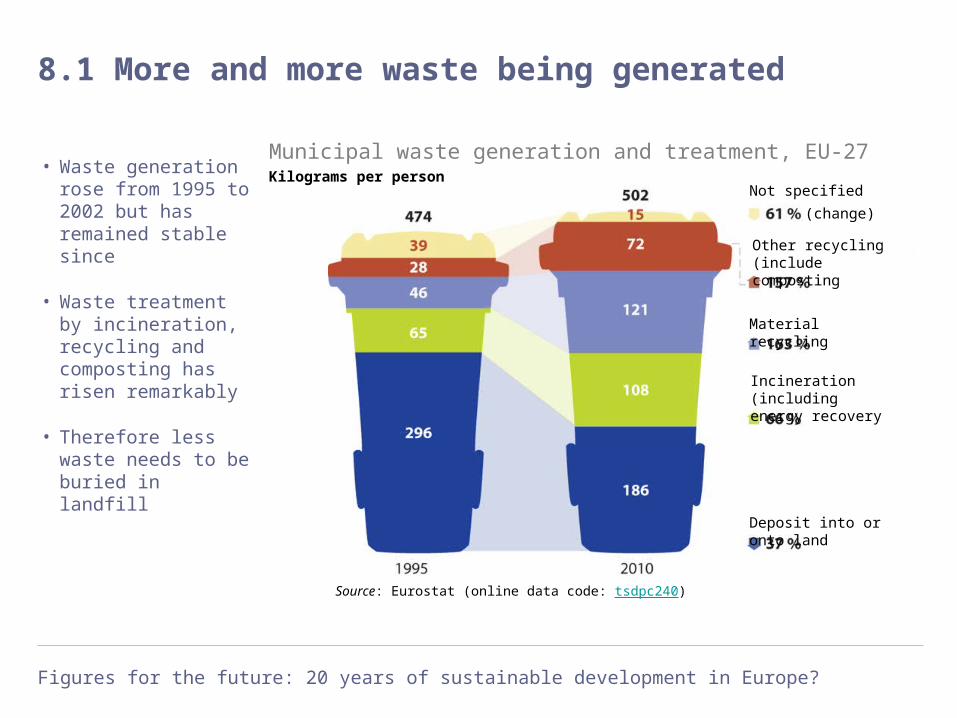
8.1 More and more waste being generated
• Waste generation rose from 1995 to 2002 but has remained stable since
• Waste treatment by incineration, recycling and composting has risen remarkably
• Therefore less waste needs to be buried in landfill
Source: Eurostat (online data code: tsdpc240)
Municipal waste generation and treatment, EU-27Kilograms per person
Not specified
Material recycling
Other recycling (include composting
Incineration (including energy recovery
Deposit into or onto land
(change)

Figures for the future: 20 years of sustainable development in Europe?
8.2 Waste treatment by country
Source: Eurostat (online data code: tsdpc240)
Est
onia
Latv
ia
Lith
uani
a
Bul
garia
Rom
ania
Hun
gary
Slo
vaki
a
Pol
and
Cze
ch R
epub
lic
Uni
ted
Kin
gdom
Ger
man
y
Sw
eden
Bel
gium
Den
mar
kLu
xem
bour
g
Fra
nce
Fin
land
Net
herla
nds
Ital
y
Slo
veni
a
Aus
tria
Irel
and
Por
tuga
l
Spa
in
Mal
ta
Cyp
rus
EU
-27
Gre
ece
Sw
itzer
land
Nor
way
Icel
and
Cro
atia
Tur
key
FY
R o
f M
aced
onia
EU-27Deposit to
land
EU-27incineration*
EU-27Material recycling
EU-27
Other recycling
*including energy recovery
Municipal waste treatment, by country, 2010%
Figures for the future: 20 years of sustainable development in Europe?
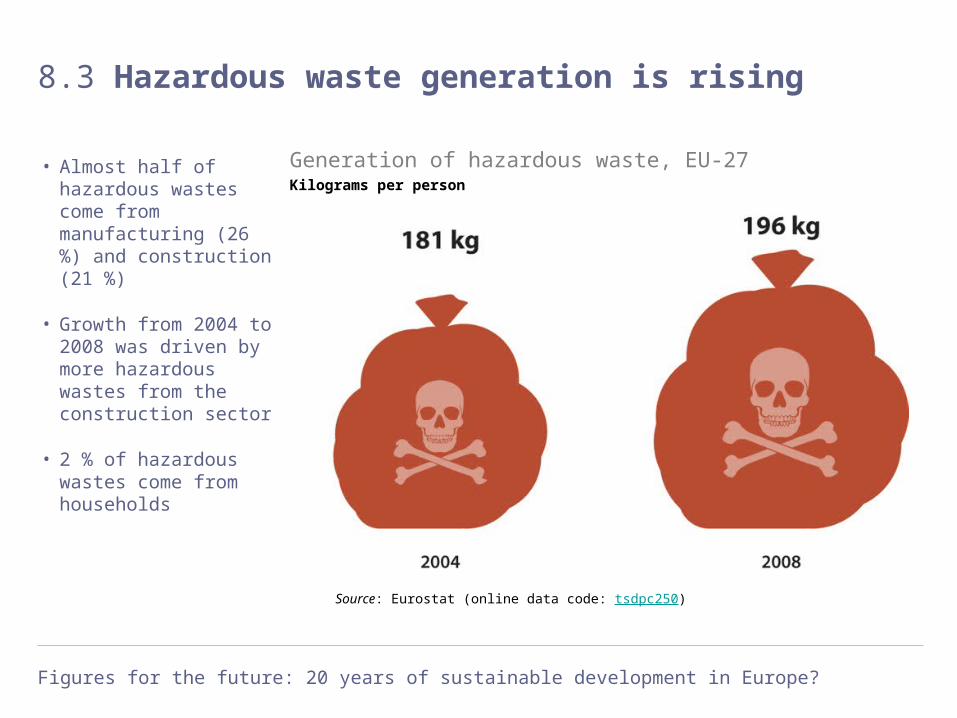
8.3 Hazardous waste generation is rising
• Almost half of hazardous wastes come from manufacturing (26 %) and construction (21 %)
• Growth from 2004 to 2008 was driven by more hazardous wastes from the construction sector
• 2 % of hazardous wastes come from households
Source: Eurostat (online data code: tsdpc250)
Generation of hazardous waste, EU-27Kilograms per person

Figures for the future: 20 years of sustainable development in Europe?
8.4 Combined heat and power generation
• Combined heat and power generation (‘cogeneration’) produces electricity and heat at the same time
• The share of electricity from CHP plants has increased slightly since 2004
• CHP plants can be powered by a variety of fuels, such as natural gas, biofuels, biomass or waste
Source: Eurostat (online data code: tsdcc350)
Combined heat and power generation, EU-27% of gross electricity generation
FUEL
CHPPLANT
ELECTRICITY
HEAT HOMES

9How we are pushing back nature
Figures for the future: 20 years of sustainable development in Europe?
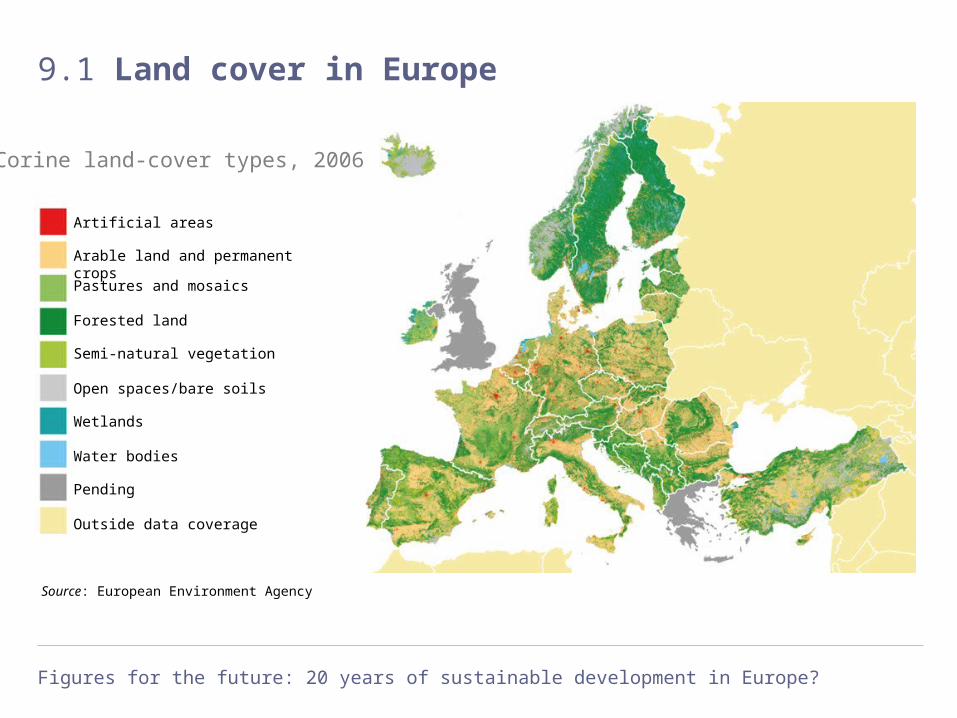
9.1 Land cover in Europe
Source: European Environment Agency
Corine land-cover types, 2006
Artificial areas
Water bodies
Pastures and mosaics
Forested land
Semi-natural vegetation
Open spaces/bare soils
Wetlands
Arable land and permanent crops
Pending
Outside data coverage

Figures for the future: 20 years of sustainable development in Europe?
9.2 Share of land-cover types in Europe
• Agricultural land (arable land, permanent crops, pastures and mosaics) covers more than 40 % of Europe
• Forested land is second with 36 %
• Artificial areas cover only 4 %, but they are home to most of Europe’s population and they host most of its economic activities
Source: European Environment Agency
Share of land-cover types in Europe, 2006% Total area Artificial surfaces
Artificial areas
Arable land and permanent cropsPastures and mosaics
Forested land
Semi-natural vegetationOpen spaces/bare soils
Wetlands
Water bodies
Housing, services, recreation
Industrial, commercial units, construction
Transport network, infrastructures
Mines, quarries, waste dumpsites

Figures for the future: 20 years of sustainable development in Europe?
9.3 How land cover has changed
• 630 000 hectares of land were converted into artificial surfaces between 2000 and 2006
• Growth in building sites and road and rail networks was the main driver behind this change
• Agricultural land is shrinking, while forests are expanding continuously
Source: European Environment Agency
Net land-cover changes 2000-2006 in Europe
Artificial areas
Arable land and permanent crops
Pastures and mosaics
Forested land
Semi-natural vegetation
Open spaces/bare soils
Wetlands
Water bodies
Total areas in hectares, thousands
Relative change, %

Figures for the future: 20 years of sustainable development in Europe?
9.4 Changes in bird numbers
• Bird populations fluctuate naturally from year to year
• But the longer-term trend shows a decline in biodiversity
• The decline was particularly strong for farmland birds due to agricultural intensification
Source: Eurostat (online data code: tsdnr100)
Common bird index, EUIndex 1990 = 100
All common birdsCommon farmland birdsCommon forest species
Figures for the future: 20 years of sustainable development in Europe?
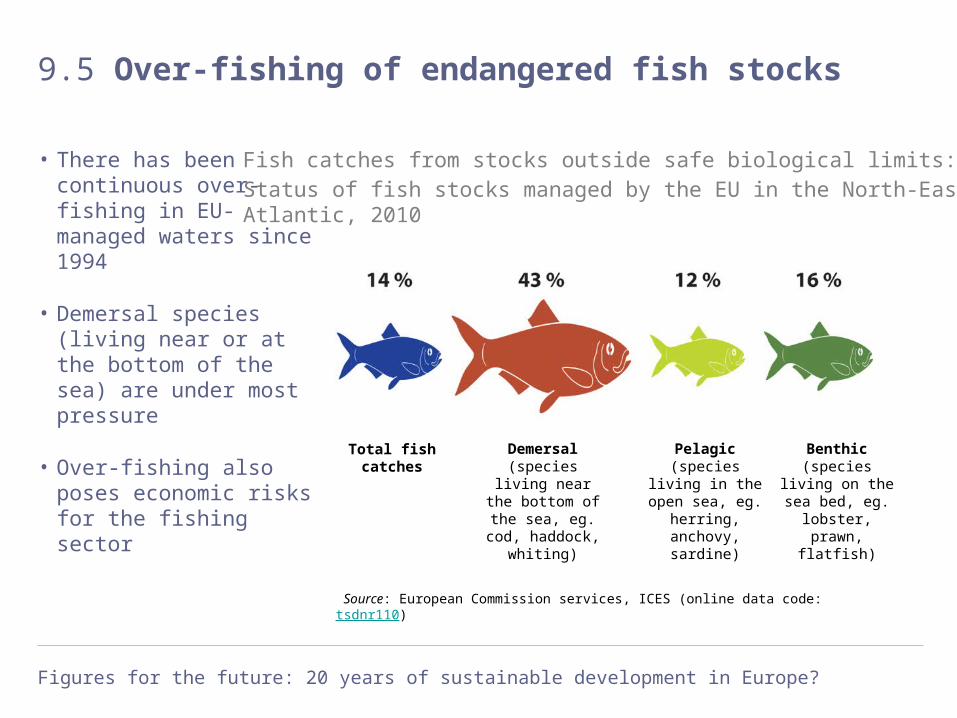
9.5 Over-fishing of endangered fish stocks
• There has been continuous over-fishing in EU-managed waters since 1994
• Demersal species (living near or at the bottom of the sea) are under most pressure
• Over-fishing also poses economic risks for the fishing sector
Source: European Commission services, ICES (online data code: tsdnr110)
Fish catches from stocks outside safe biological limits:Status of fish stocks managed by the EU in the North-East Atlantic, 2010
Total fish catches
Demersal(species living
near the bottom of the sea, eg. cod, haddock, whiting)
Pelagic(species living in the open sea, eg. herring, anchovy,
sardine)
Benthic(species living on the sea bed, eg. lobster, prawn,
flatfish)

Figures for the future: 20 years of sustainable development in Europe?
9.6 More sustainable forest management
• Total wood harvests in European countries have stayed well below annual regrowth
• This indicates they are being managed sustainably
• Forests store carbon, making them important ‘sinks’ for greenhouse gas emissions
Source: Ministerial Conference on the Protection of Forests in Europe (MCPFE) (online data code: tsdnr520)
Forest utilisation rateFellings as % of increment
Figures for the future: 20 years of sustainable development in Europe?
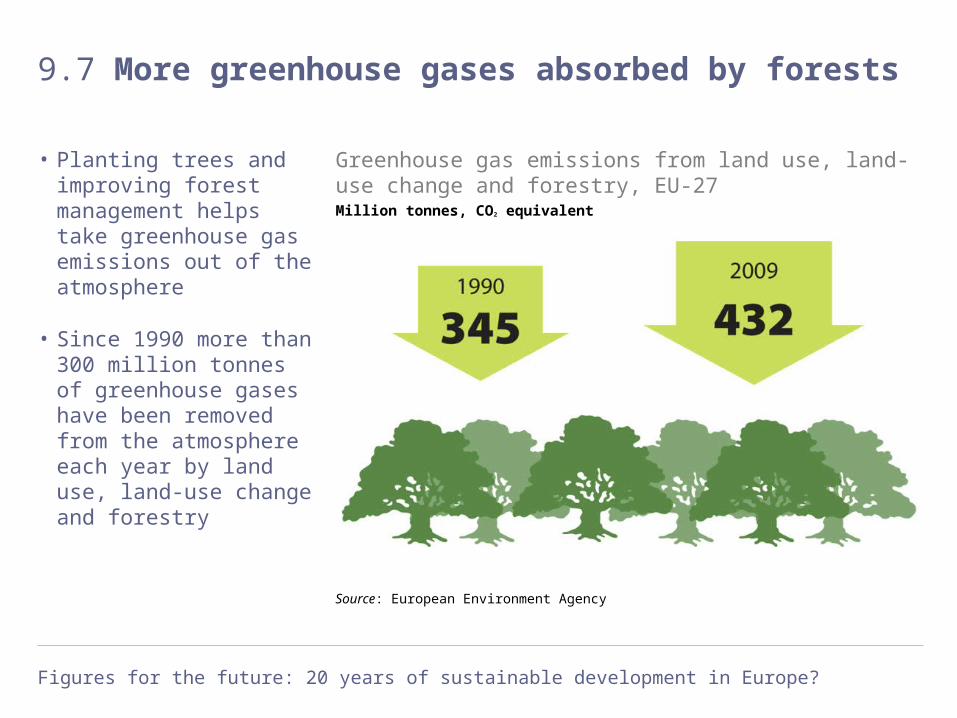
9.7 More greenhouse gases absorbed by forests
• Planting trees and improving forest management helps take greenhouse gas emissions out of the atmosphere
• Since 1990 more than 300 million tonnes of greenhouse gases have been removed from the atmosphere each year by land use, land-use change and forestry
Source: European Environment Agency
Greenhouse gas emissions from land use, land-use change and forestry, EU-27Million tonnes, CO2 equivalent
10Global climate change

Figures for the future: 20 years of sustainable development in Europe?
10.1 A warming planet
• Global warming is undeniable
• The decade from 2001-2010 has been the warmest ten-year period ever recorded
• Warming is greater over the northern hemisphere where most of the Earth’s land area is located
Source: Climatic Research Unit, University of East Anglia and the UK Met Office Hadley Centre
Global annual mean temperature deviationTemperature deviation in °C, compared with 1961-90 average
95% uncertainty range from the combined effects of all the uncertainties
Annual series smoothed

Figures for the future: 20 years of sustainable development in Europe?
10.2 Global CO2 emissions continuing to rise
• Global CO2 emissions have grown by almost 40 % since 1990
• In 2007 China overtook the United States as the biggest emitter
• Electricity and heat generation are responsible for the major part of global CO2 emissions
Source: International Energy Agency
Global CO2 emissions from fuel combustionMillion tonnes of CO2
World
United States
EU-27
China
India
Figures for the future: 20 years of sustainable development in Europe?
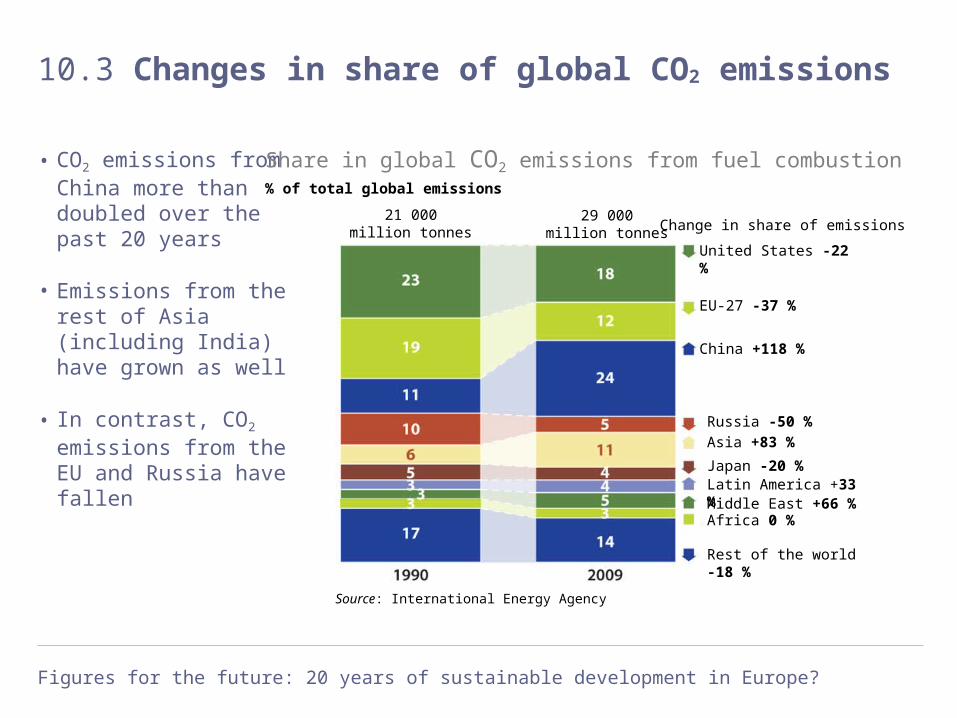
10.3 Changes in share of global CO2 emissions
• CO2 emissions from China more than doubled over the past 20 years
• Emissions from the rest of Asia (including India) have grown as well
• In contrast, CO2 emissions from the EU and Russia have fallen
Source: International Energy Agency
Share in global CO2 emissions from fuel combustion% of total global emissions
21 000million tonnes
29 000million tonnes
United States -22 %
EU-27 -37 %
China +118 %
Russia -50 %
Asia +83 %
Japan -20 %Latin America +33 %
Africa 0 %
Rest of the world -18 %
Middle East +66 %
Change in share of emissions
Figures for the future: 20 years of sustainable development in Europe?
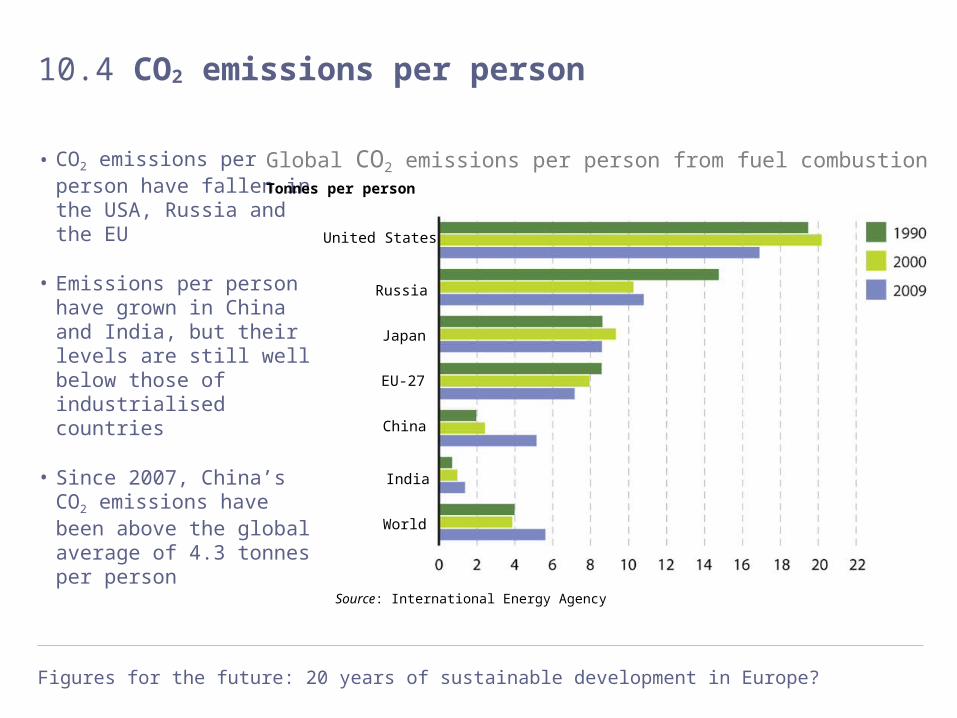
10.4 CO2 emissions per person
• CO2 emissions per person have fallen in the USA, Russia and the EU
• Emissions per person have grown in China and India, but their levels are still well below those of industrialised countries
• Since 2007, China’s CO2 emissions have been above the global average of 4.3 tonnes per person
Source: International Energy Agency
Global CO2 emissions per person from fuel combustionTonnes per person
United States
Russia
Japan
EU-27
China
India
World

Figures for the future: 20 years of sustainable development in Europe?
10.5 Transport emissions on the rise while others fall
• Greenhouse gas emissions in the EU have fallen by more than 17 % since 1990
• There has been a sharp drop in 2009 because of the economic crisis
• The reasons for the longer-term decline include more efficient use of energy and a switch to low-carbon fuels
Source: European Environment Agency (online data code: tsdcc210)
Greenhouse gas emissions by sector, EU-27Million tonnes CO2 equivalent
Other (energy-related)
Waste
Agriculture
Industrial processes
Transport
Manufacturing andconstruction
Energy industries
Figures for the future: 20 years of sustainable development in Europe?
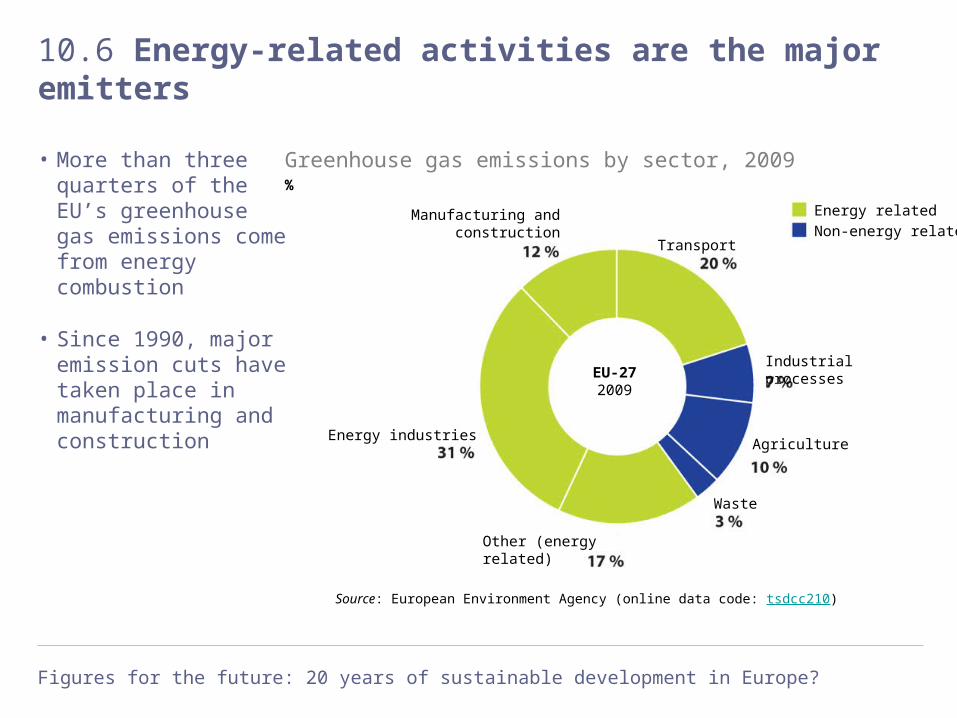
10.6 Energy-related activities are the major emitters
• More than three quarters of the EU’s greenhouse gas emissions come from energy combustion
• Since 1990, major emission cuts have taken place in manufacturing and construction
Source: European Environment Agency (online data code: tsdcc210)
Greenhouse gas emissions by sector, 2009%
Energy related
Non-energy related
Industrial processes
Agriculture
Waste
Other (energy related)
Energy industries
Manufacturing and construction
Transport
EU-272009
Figures for the future: 20 years of sustainable development in Europe?
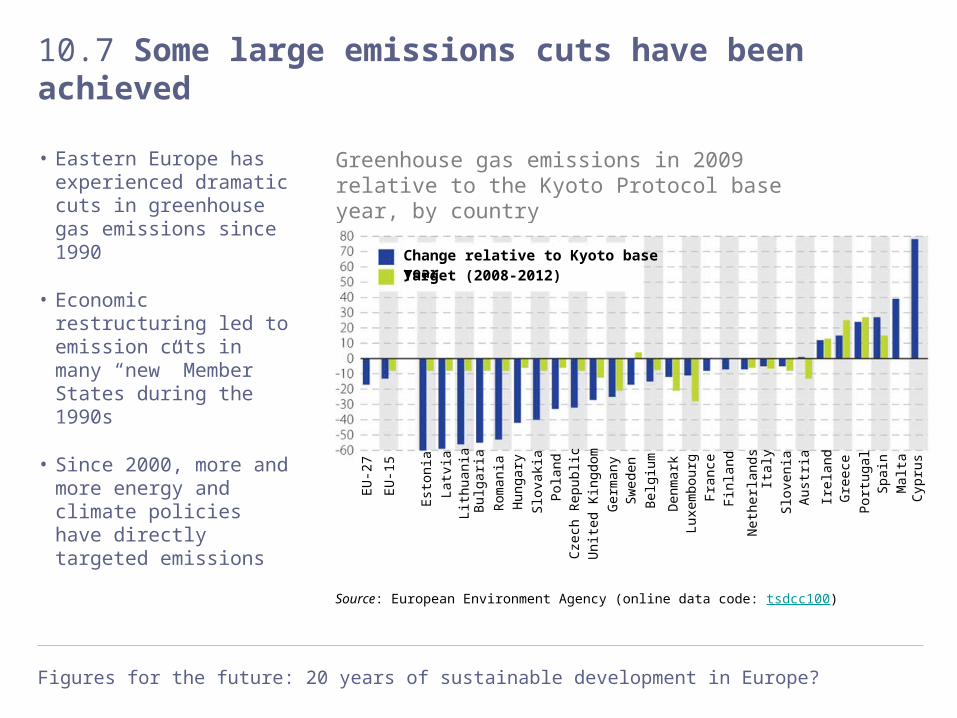
10.7 Some large emissions cuts have been achieved
• Eastern Europe has experienced dramatic cuts in greenhouse gas emissions since 1990
• Economic restructuring led to emission cuts in many “new” Member States during the 1990s
• Since 2000, more and more energy and climate policies have directly targeted emissions
Source: European Environment Agency (online data code: tsdcc100)
Greenhouse gas emissions in 2009 relative to the Kyoto Protocol base year, by country%
Change relative to Kyoto base year
EU
-27
EU
-15
Est
onia
Latv
iaLi
thua
nia
Bul
garia
Rom
ania
Hun
gary
Slo
vaki
a
Pol
and
Cze
ch R
epub
lic
Uni
ted
Kin
gdom
Ger
man
yS
wed
en
Bel
gium
Den
mar
kLu
xem
bour
g
Fra
nce
Fin
land
Net
herla
nds
Italy
Slo
veni
aA
ustr
ia
Irel
and
Gre
ece
Por
tuga
lS
pain
Mal
taC
ypru
s
Target (2008-2012)

11Europe in a globalised world
Figures for the future: 20 years of sustainable development in Europe?
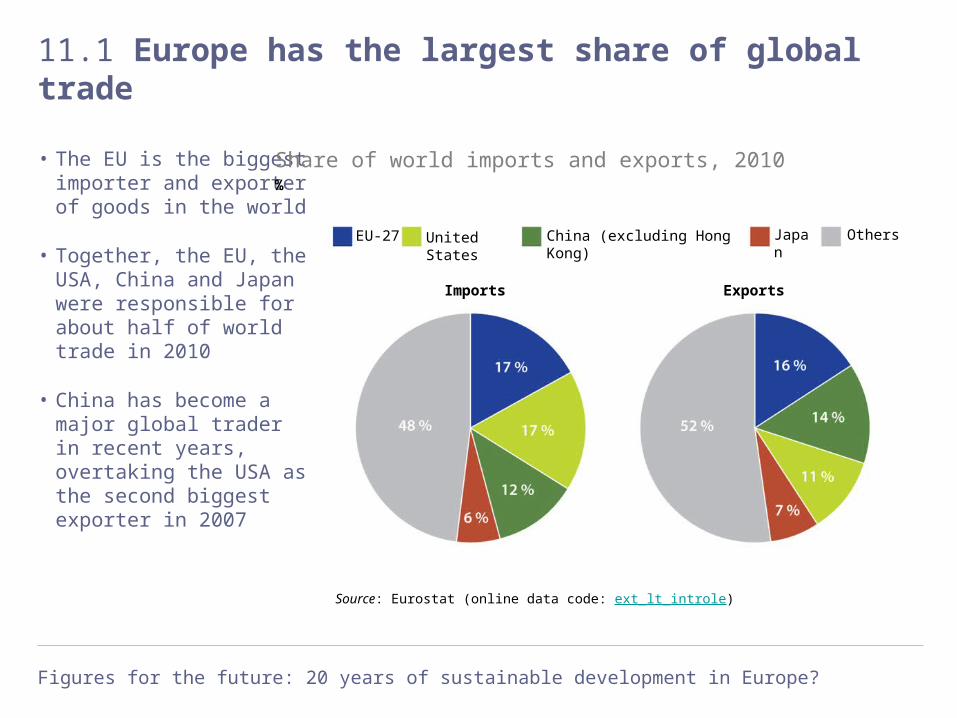
11.1 Europe has the largest share of global trade
• The EU is the biggest importer and exporter of goods in the world
• Together, the EU, the USA, China and Japan were responsible for about half of world trade in 2010
• China has become a major global trader in recent years, overtaking the USA as the second biggest exporter in 2007
Source: Eurostat (online data code: ext_lt_introle)
Share of world imports and exports, 2010%
EU-27 United States China (excluding Hong Kong) Japan Others
Imports Exports

Figures for the future: 20 years of sustainable development in Europe?
11.2 China becoming a major trading partner
• The relative importance of the USA as a trade partner for the EU has declined in recent years
• EU trade with China has more than quadrupled since 1999
• Most imports into the EU come from Asia, while shares for Africa and Latin America remain low
Source: Eurostat (online data code: ext_lt_maineu)
Extra-EU imports, by partner%
of imports from Asia
China (except Hong Kong)
Asia (except China and Japan)
Japan
United States
Russia
Europe, non-EU-27
Africa
Latin America
Rest of the world

Figures for the future: 20 years of sustainable development in Europe?
11.3 EU energy imports rising
• 63 % of the imports into the EU are manufactured products (machinery and vehicles, chemicals, and other manufactured goods)
• However, imports of primary products are increasing
• In 2010 imports of energy products were four times higher than in 1999
Source: Eurostat (online data code: ext_lt_intratrd)
Extra-EU imports, by product group%
of imports are manufactured
products
Chemicals
Machinery and vehicles
Other manufactured goods
Energy
Food and drink
Raw materials
Products n.e.s.

Figures for the future: 20 years of sustainable development in Europe?
11.4 Imports from developing countries rising
• Imports from developing countries into the EU have almost tripled since 1999
• In comparison, total imports into the EU have ‘only’ doubled
• Almost half of total EU imports in 2010 came from developing countries (including China)
Source: Eurostat (online data code: tsdgp210, tet00038)
EU imports from developing countries, EU-27
Upper middle income
By income group, billion euros, (at current prices)
Other low income
Lower middle income
Least developed
China (including Hong Kong)
DAC countries
DAC countries (excluding China)
Total EU imports
Share of total extra-EU imports (%)

Figures for the future: 20 years of sustainable development in Europe?
11.5 Imports from least developed countries still low
• Least-developed countries host about 12 % of the world’s population but account for less than 2 % of the world’s GDP and about 1 % of global trade in goods
• In 2010, out of total EU imports worth 1 500 billion euros only 22 billion euros worth came from LDCs
Source: Eurostat (online data code: tsdgp210, tet00038)
Share of imports from least-developed countries in total extra-EU imports, EU-27%
Figures for the future: 20 years of sustainable development in Europe?
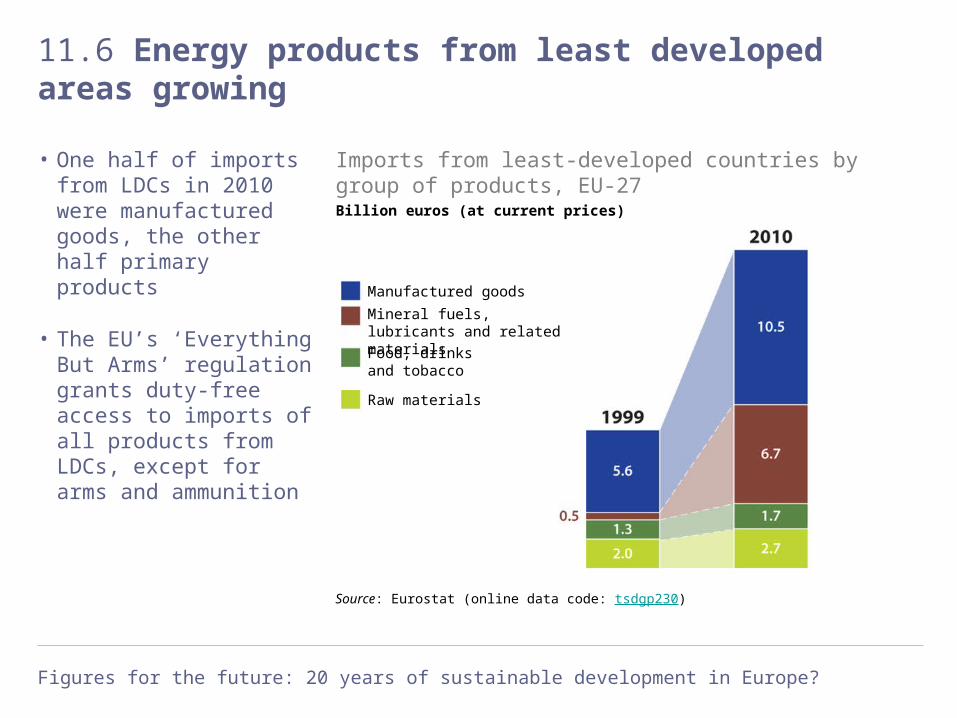
11.6 Energy products from least developed areas growing
• One half of imports from LDCs in 2010 were manufactured goods, the other half primary products
• The EU’s ‘Everything But Arms’ regulation grants duty-free access to imports of all products from LDCs, except for arms and ammunition
Source: Eurostat (online data code: tsdgp230)
Imports from least-developed countries by group of products, EU-27Billion euros (at current prices)
Manufactured goods
Mineral fuels, lubricants and related materials
Food, drinks and tobacco
Raw materials

Figures for the future: 20 years of sustainable development in Europe?
11.7 EU agricultural subsidies falling
• Trade barriers make it harder for developing countries to access EU markets
• The EU has gradually cut trade-distorting agricultural subsidies since 1995
• The distance between the ceiling set under the WTO’s Agreement on Agriculture and EU support for agriculture is growing
Source: EU Commission services, World Trade Organisation, Eurostat (online data code: tsdgp240)
Aggregated measurement of support for agriculture, EU-27Billion euros
AMS ceiling
12Is Europe living up to its international commitments?

Figures for the future: 20 years of sustainable development in Europe?
12.1 Where does EU financial support come from?
• Official development assistance (ODA) and private flows are the most important financial flows to developing countries
• Financial flows from the EU to developing countries have risen four-fold over the past 20 years
• While ODA flows have grown constantly, private flows fluctuated from year to year
Source: OECD, Eurostat (online data code: tsdgp310)
Financing for developing countries, by type, EU-15Billion euros (at current prices)
Grants by NGOs
Other official flows
Private flows
Official development aid

Figures for the future: 20 years of sustainable development in Europe?
12.2 The EU is the world’s biggest donor...
• The EU is the biggest donor of financial support to developing countries
• Since 1990, all donors have increased their funding for developing countries
• In 2009 total financing for developing countries was 4.5 times higher than in 1990
Source: OECD, Eurostat (online data code: tsdgp310)
Financing for developing countries, by donorBillion euros (at current prices)
Other donors
Canada
Japan
United States
EU-15
Figures for the future: 20 years of sustainable development in Europe?
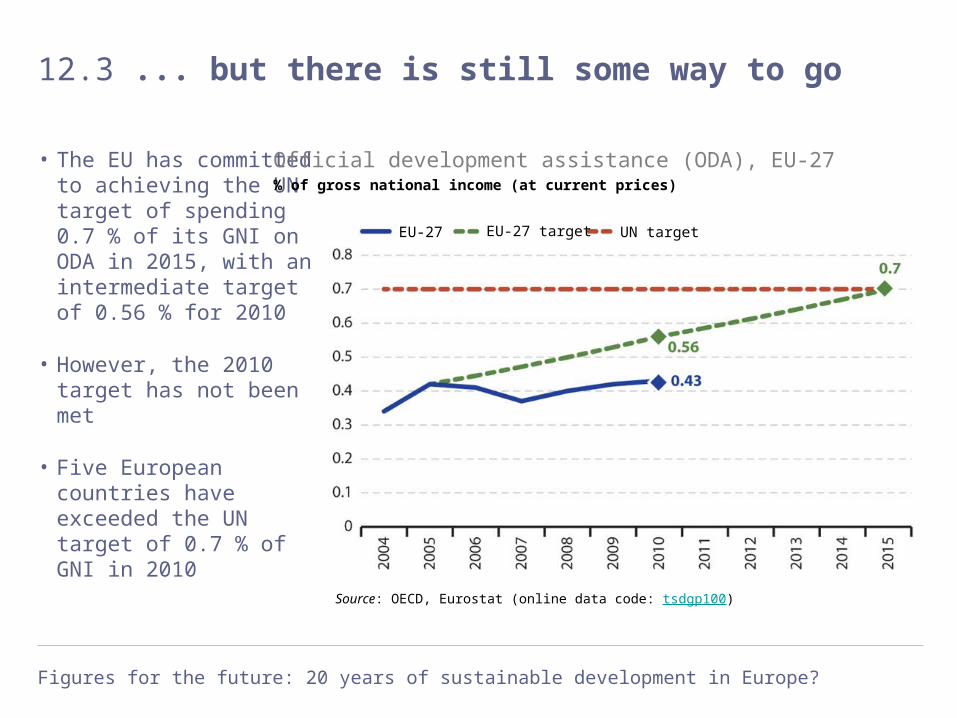
12.3 ... but there is still some way to go
• The EU has committed to achieving the UN target of spending 0.7 % of its GNI on ODA in 2015, with an intermediate target of 0.56 % for 2010
• However, the 2010 target has not been met
• Five European countries have exceeded the UN target of 0.7 % of GNI in 2010
Source: OECD, Eurostat (online data code: tsdgp100)
Official development assistance (ODA), EU-27% of gross national income (at current prices)
EU-27 EU-27 target UN target

Figures for the future: 20 years of sustainable development in Europe?
12.4 Wide variation in support by Member States
Source: OECD, Eurostat (online data code: tsdgp100)
Official development assistance (ODA), by country% of gross national income (at current prices)
Est
onia
Latv
ia
Lith
uani
a
Bul
garia
Rom
ania
Hun
gary
Slo
vaki
a
Pol
and
Cze
ch R
epub
lic
Uni
ted
Kin
gdom
Ger
man
y
Sw
eden
Bel
gium
Den
mar
k
Luxe
mbo
urg
Fra
nce
Fin
land
Net
herla
nds
Italy
Slo
veni
a
Aus
tria
Irel
and
Por
tuga
l
Spa
in
Mal
ta
Cyp
rus
EU
-27
Gre
ece
Sw
itzer
land
Nor
way
Icel
and
Tur
key
EU
-15
Figures for the future: 20 years of sustainable development in Europe?
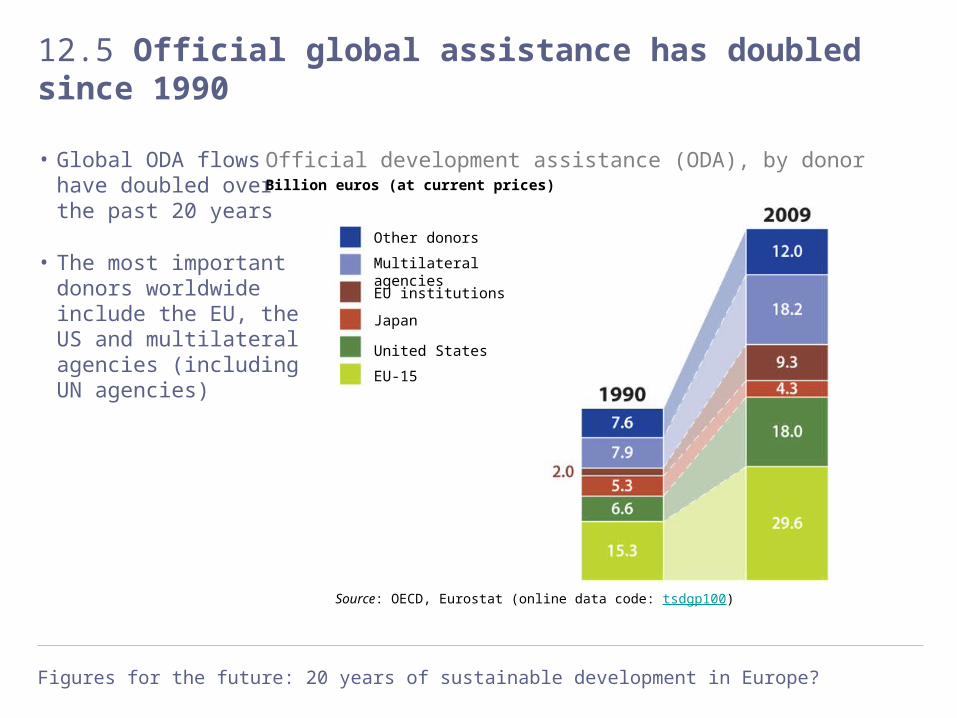
12.5 Official global assistance has doubled since 1990
• Global ODA flows have doubled over the past 20 years
• The most important donors worldwide include the EU, the US and multilateral agencies (including UN agencies)
Source: OECD, Eurostat (online data code: tsdgp100)
Official development assistance (ODA), by donorBillion euros (at current prices)
Other donors
EU institutions
Multilateral agencies
Japan
United States
EU-15

Figures for the future: 20 years of sustainable development in Europe?
12.6 Official channels provide a reliable assistance source
• Proportion of financial flows to low-income countries is higher for ODA than for FDI
• More than half of the EU’s ODA is dedicated to low-income countries
• In 2009 ODA flows to low-income countries amounted to about 11 billion euros, while FDI flows were ‘only’1.7 billion euros
Source: OECD, Eurostat (online data code: tsdgp320, tsdgp330)
Share of financial allocations to low-income countries% of country-allocated ODA
Share of official development assistance, EU-15
Share of foreign direct investment, DAC EU members
Figures for the future: 20 years of sustainable development in Europe?
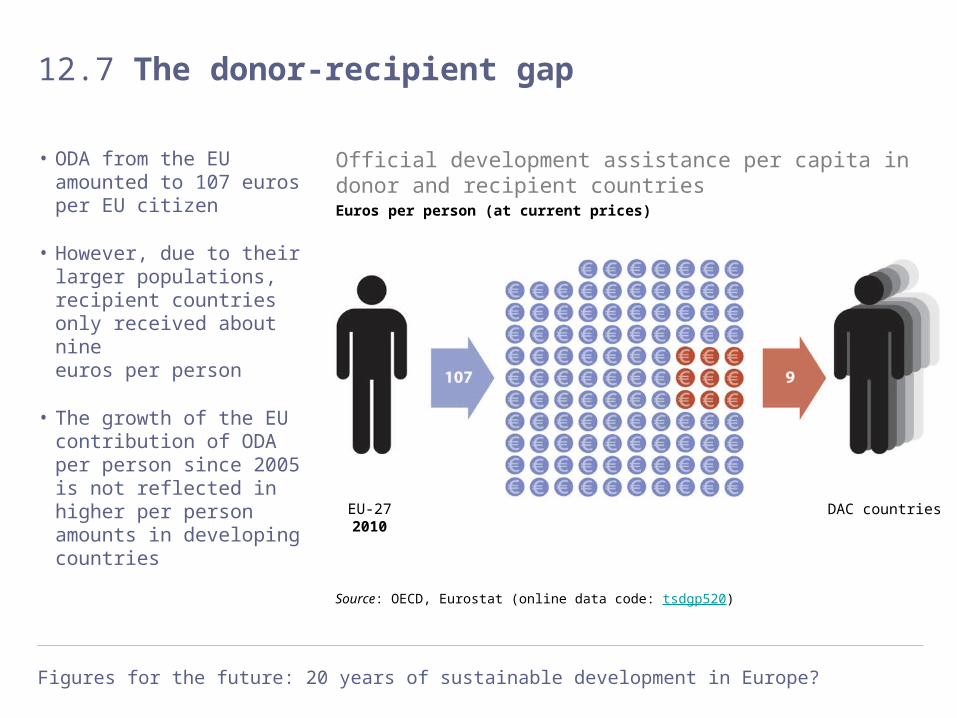
12.7 The donor-recipient gap
• ODA from the EU amounted to 107 euros per EU citizen
• However, due to their larger populations, recipient countries only received about nine euros per person
• The growth of the EU contribution of ODA per person since 2005 is not reflected in higher per person amounts in developing countries
Source: OECD, Eurostat (online data code: tsdgp520)
Official development assistance per capita in donor and recipient countriesEuros per person (at current prices)
EU-272010
DAC countries
13Fewer and fewer children in our ageing society

Figures for the future: 20 years of sustainable development in Europe?
13.1 Global population continues to grow
• Earth’s total population is expected to quadruple by 2100 compared with 1950, going beyond 10 billion people by about 2080
• Most of the world’s population growth has taken place or is expected to take place in Asia and Africa
• Europe’s population in 2100 will only be about 20 % larger than it was in 1950
Source: Population Division of the Department of Economic and Social Affairs of the United Nations Secretariat, World Population Prospects: The 2010 Revision
Global population growth and projectionsBillion people
Oceania
Northern AmericaEuropeLatin America and the Caribbean
AsiaAfrica
Figures for the future: 20 years of sustainable development in Europe?
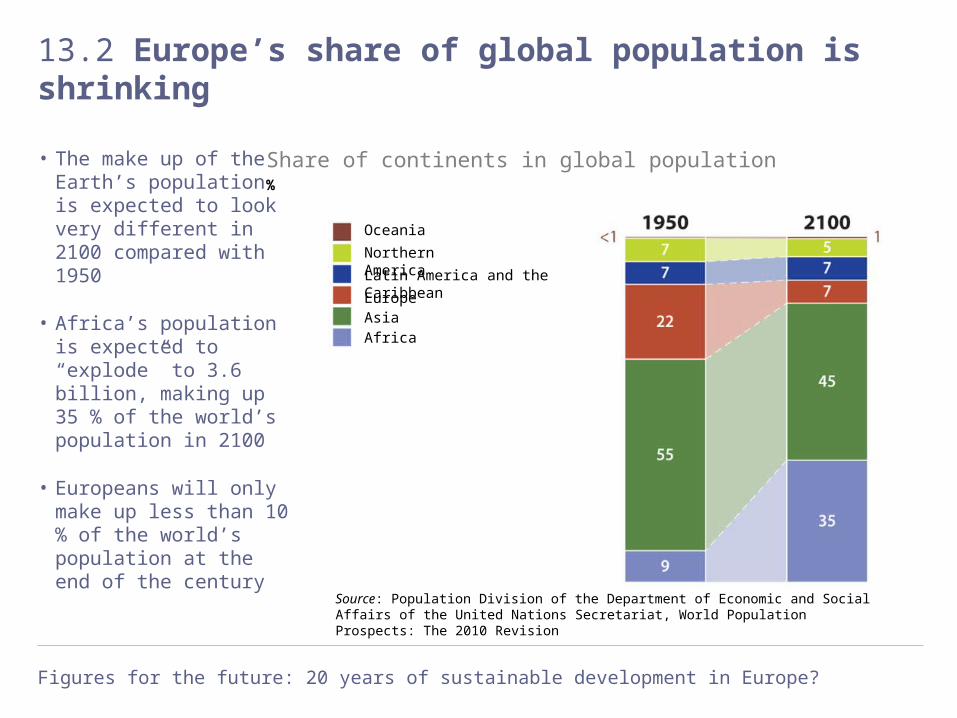
13.2 Europe’s share of global population is shrinking
• The make up of the Earth’s population is expected to look very different in 2100 compared with 1950
• Africa’s population is expected to “explode” to 3.6 billion, making up 35 % of the world’s population in 2100
• Europeans will only make up less than 10 % of the world’s population at the end of the century
Source: Population Division of the Department of Economic and Social Affairs of the United Nations Secretariat, World Population Prospects: The 2010 Revision
Share of continents in global population%
Oceania
Northern America
Latin America and the Caribbean
Europe
AfricaAsia

Figures for the future: 20 years of sustainable development in Europe?
13.3 Birth rates too low to support population growth
• A fertility rate of 2.1 children per woman is needed to naturally maintain the EU population at its existing level
• The EU’s fertility rate has risen slightly but remains below the replacement level
• Across Europe only Iceland has a fertility rate above the replacement level
Source: Eurostat (online data code: tsdde220)
Total fertility rate, EU-27Number of children per woman
Replacement level

Figures for the future: 20 years of sustainable development in Europe?
13.4 Europeans are living longer
• A girl born in 2009 in the EU is expected to live about 83 years on average; a boy about 77 years
• Life expectancy in the EU is increasing, meaning people are living longer and longer
• As a result, the EU is still experiencing a natural increase in its population – but this is expected to change soon
Source: Eurostat (online data code: tsdph100)
Life expectancy at birth, by gender, EU-27Years
WomenMen
Figures for the future: 20 years of sustainable development in Europe?
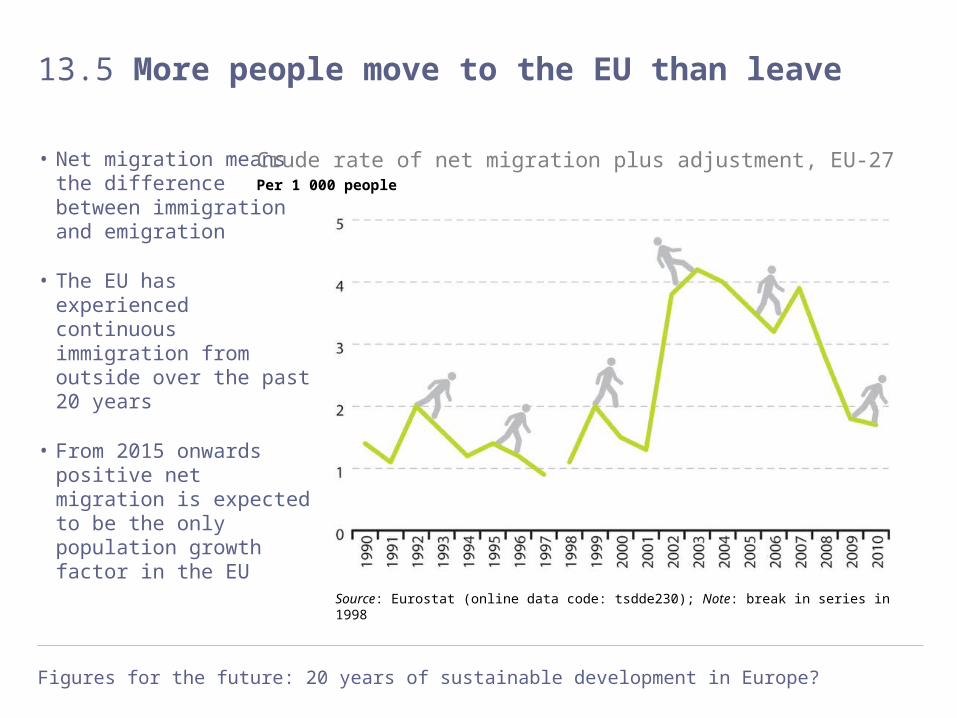
13.5 More people move to the EU than leave
• Net migration means the difference between immigration and emigration
• The EU has experienced continuous immigration from outside over the past 20 years
• From 2015 onwards positive net migration is expected to be the only population growth factor in the EU
Source: Eurostat (online data code: tsdde230); Note: break in series in 1998
Crude rate of net migration plus adjustment, EU-27Per 1 000 people

Figures for the future: 20 years of sustainable development in Europe?
13.6 The changing face of Europe’s population
• By 2060, the EU’s population is expected to grow by about 15 million people, or 3 %
• About half of the Member States – most in Eastern Europe – may experience a shrinking population
Source: Eurostat (online data code: tps00002)
Projected population change 2010-2060, by country%
Est
onia
Latv
ia
Lith
uani
a
Bul
garia
Rom
ania
Hun
gary
Slo
vaki
a
Pol
and
Cze
ch R
epub
lic
Uni
ted
Kin
gdom
Ger
man
y
Sw
eden
Bel
gium
Den
mar
k
Luxe
mbo
urg
Fra
nce
Fin
land
Net
herla
nds
Italy
Slo
veni
a
Aus
tria
Irel
and
Por
tuga
l
Spa
in
Mal
ta
Cyp
rus
EU
-27
Gre
ece
Sw
itzer
land
Nor
way
Icel
and
Liec
hten
stei
n

Figures for the future: 20 years of sustainable development in Europe?
13.7 EU’s population expected to peak in 2040
• Population growth in the EU will not be continuous
• The EU’s population is expected to rise until 2040 and then gradually fall to 517 million in 2060
• This is because from 2035 net migration would no longer counterbalance the natural decline that is expected to start in 2015
Source: Eurostat (online data code: tps00002)
Projected population change, EU-27Million people
Figures for the future: 20 years of sustainable development in Europe?
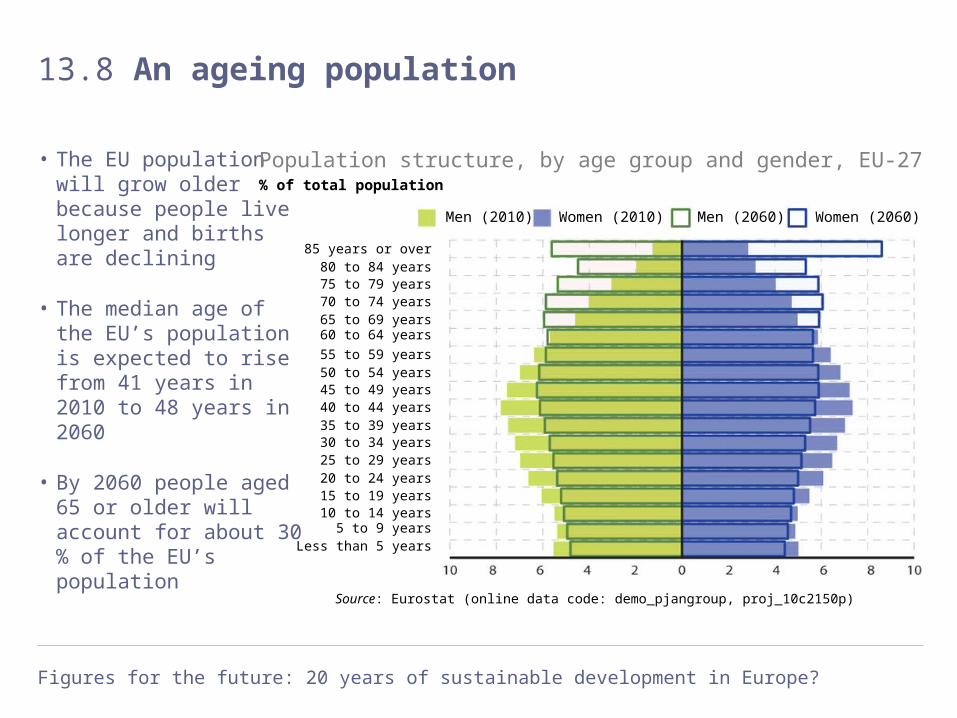
13.8 An ageing population
• The EU population will grow older because people live longer and births are declining
• The median age of the EU’s population is expected to rise from 41 years in 2010 to 48 years in 2060
• By 2060 people aged 65 or older will account for about 30 % of the EU’s population
Source: Eurostat (online data code: demo_pjangroup, proj_10c2150p)
Population structure, by age group and gender, EU-27% of total population
Men (2010) Women (2010) Men (2060) Women (2060)
85 years or over80 to 84 years75 to 79 years70 to 74 years65 to 69 years60 to 64 years
55 to 59 years50 to 54 years45 to 49 years40 to 44 years35 to 39 years30 to 34 years25 to 29 years20 to 24 years15 to 19 years
Less than 5 years5 to 9 years
10 to 14 years

14Is green growth a solution?

Figures for the future: 20 years of sustainable development in Europe?
14.1 Use of natural resources in the EU
• Half of the materials consumed in the EU are minerals
• Material use tends to follow the economic cycle closely
Source: Eurostat (online data code: tsdpc230)
Domestic material consumption, by type, EU-27Million tonnes
Fossil energy materials/carriers
Non-metallic minerals
Metal ores (gross ores)
Biomass
Figures for the future: 20 years of sustainable development in Europe?
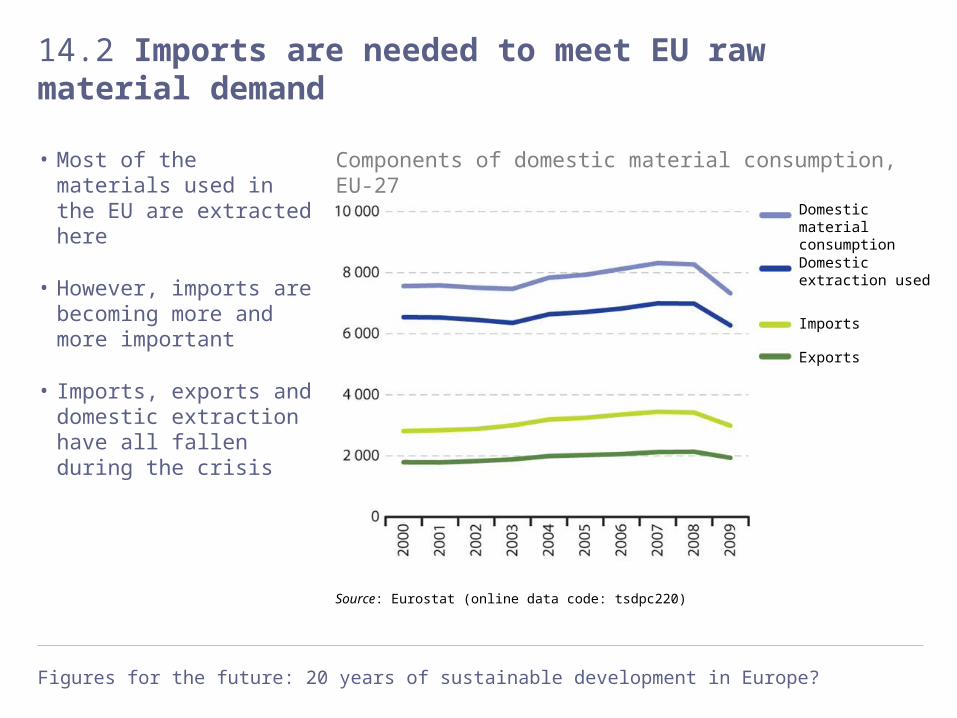
14.2 Imports are needed to meet EU raw material demand
• Most of the materials used in the EU are extracted here
• However, imports are becoming more and more important
• Imports, exports and domestic extraction have all fallen during the crisis
Source: Eurostat (online data code: tsdpc220)
Components of domestic material consumption, EU-27Million tonnes
Domestic material consumption
Domestic extraction used
Imports
Exports

Figures for the future: 20 years of sustainable development in Europe?
14.3 Material use per person fell strongly during the crisis
• In 2007 each EU citizen theoretically consumed about 17 tonnes of materials per year, or 45 kilograms of materials per day
• Due to the economic crisis, material use fell below 15 tonnes per person in 2009
Source: Eurostat (online data code: tsdpc220, demo_gind)
Domestic material consumption per person, EU-27Tonnes per person

Figures for the future: 20 years of sustainable development in Europe?
14.4 Resource use varies across the EU
Source: Eurostat (online data code: tsdpc220, demo_gind)
Domestic material consumption per personTonnes per person
Est
onia
Latv
ia
Lith
uani
a
Bul
garia
Rom
ania
Hun
gary
Slo
vaki
a
Pol
and
Cze
ch R
epub
lic
Uni
ted
Kin
gdom
Ger
man
y
Sw
eden
Bel
gium
Den
mar
k
Luxe
mbo
urg
Fra
nce
Fin
land
Net
herla
nds
Italy
Slo
veni
a
Aus
tria
Irel
and
Por
tuga
l
Spa
in
Cyp
rus
EU
-27
Gre
ece
Sw
itzer
land
Nor
way
Mal
ta
Tur
key
Cro
atia
EU-27
2000
EU-27
2009
Figures for the future: 20 years of sustainable development in Europe?
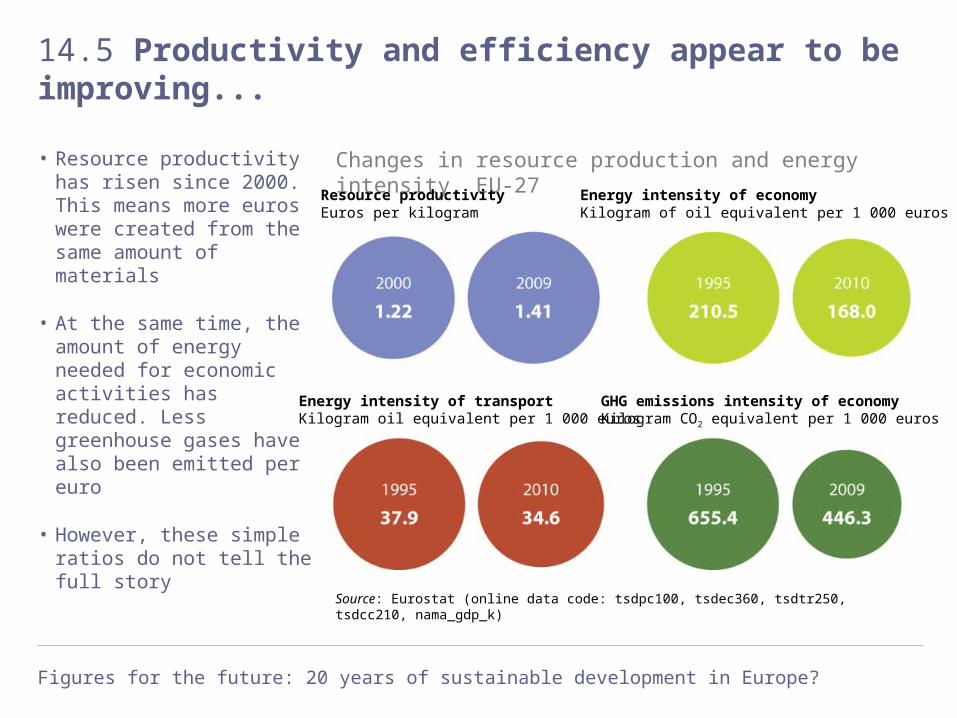
14.5 Productivity and efficiency appear to be improving...
• Resource productivity has risen since 2000. This means more euros were created from the same amount of materials
• At the same time, the amount of energy needed for economic activities has reduced. Less greenhouse gases have also been emitted per euro
• However, these simple ratios do not tell the full story
Source: Eurostat (online data code: tsdpc100, tsdec360, tsdtr250, tsdcc210, nama_gdp_k)
Changes in resource production and energy intensity, EU-27
Resource productivityEuros per kilogram
Energy intensity of economyKilogram of oil equivalent per 1 000 euros
Energy intensity of transportKilogram oil equivalent per 1 000 euros
GHG emissions intensity of economyKilogram CO2 equivalent per 1 000 euros

Figures for the future: 20 years of sustainable development in Europe?
14.6 ... but not so promising when compared with GDP
Source: Eurostat (online data code: tsdpc100, tsdpc230, nama_gdp_k, tsdec360, tsdcc320, tsdtr100, tsdtr250, sdcc210)
Resource productivity and energy efficiencyIndex 2000 = 100
Resource productivity
GDP (deflated)
Domestic material consumptionResource productivity
GDP (deflated)
Gross inland energyconsumption
Energy intensity
GDP (deflated)
GHG emissions
GHG emissions intensity
GDP (deflated)
Energy consumption of transport/GDP
Energy consumption of transport
Energy intensity
GHG emissions intensity
Energy efficiency of transport

Figures for the future: 20 years of sustainable development in Europe?
14.7 R&D expenditure has not increased enough
Source: Eurostat (online data code: tsdec320)
Total expenditure on research and development% of GDP
Est
onia
Latv
ia
Lith
uani
a
Bul
garia
Rom
ania
Hun
gary
Slo
vaki
a
Pol
and
Cze
ch R
epub
lic
Uni
ted
Kin
gdom
Ger
man
y
Sw
eden
Bel
gium
Den
mar
k
Luxe
mbo
urg
Fra
nce
Fin
land
Net
herla
nds
Italy
Slo
veni
a
Aus
tria
Irel
and
Por
tuga
l
Spa
in
Mal
ta
Cyp
rus
EU
-27
Gre
ece
Nor
way
Sw
itzer
land
Icel
and
Tur
key
Cro
atia