FIGURE 3.1 PHOTOGRAPH SHOWING DEEP PRISMATIC CORBELS …
38
Ill FIGURE 3.1 PHOTOGRAPH SHOWING DEEP PRISMATIC CORBELS WITH SIGNIFICANTLY REDUCED a/d RATIO.
Transcript of FIGURE 3.1 PHOTOGRAPH SHOWING DEEP PRISMATIC CORBELS …

Ill
FIGURE 3.1 PHOTOGRAPH SHOWING DEEP PRISMATIC CORBELS WITH S IG N IF IC A N T L Y REDUCED a /d R A T IO .

clined diegor.al crack as indicated in the figure. The measured
average maximum shear stress for these specimen types at failure
was of the order of 5MPa. An extrapolation of the curves derived
in Chapter 4, slown in Figure 4.8, indicates that a resistant
shear stress considerably in excess of 5MPa would be anticipated
at an a/d ratio of 0,2 in terms of this extrapolation. A value
of approximately lOMPa is in fact consistent with these curves
for an a/d ratio of 0,2. The test results on these specimens of
relatively extreme geometry are consistent with the order of
magnitude of the ultimate shear stress values recorded by
Walraven and Reinhardt and thus confirm that a cut-off cr limit
to the curves depicted in Figure 4.8 at extremely small a/d ratios
appears to be likely. The test results for these corbel specimens
are also tabulated in Appendix A.
: \ 3
3.5 GENERAL CONCLUSIONS FOR CORBELS
1. In general, for all other parameters being equal, the haunched
in-situ corbel unreinforced for shear carries 3 to 4 times the
vertical loa< ultimate than the equivalent bolt-on corbel un
reinforced for shear. As the bolt-on corbel relies on dowel
action and frictiv-r. for shear resistance, it can be concluded that
an assessment of dowel action contributing of the order of 10»
in the monolithic corbels, with a/d ratios somewhat smaller than40unity, is reasonable. Since previous research shows the con
tribution of dowel action to be about 20% for beams with a/d ra
tios in excess of 2, it can be concluded that the relative dowel
action contribution for monolithic section decreases with a/d
ratio. The implication of this is that aggregate interlock shows
a comparable increase with reducing a/d ratio in monolithic
sections. This relative load sharing assessment is further jus
tified by the observation that conristent displace^ nts for both
types of corbel were attained at the ultimate limit state of
shear.
2. Both types of corbel, if unreinforced for shear, exhibit in
sufficient ductility to meet the requirements of a design which
necessitates a reasonable redistribution of force.

114
3. For bolt-on units the initial shear crack is a dowel crack;
tor the in-situ units the initial shear crack is a steeply in
clined diagonal crack.
4. If suitably reinforced for shear, both types of corbel car
have their shear capacities raised to a value greater than their
flexural ultimate limit state, oi , fox- precast units, such that
a ductile shear displacement, mode is attained. Both types of
corbel can thus be designed for the required load based on a
i • ctile ultimate limit state. Tho shear reinforcement details
would, however, differ between the in-situ and tol»-on units. The
most important shear reinforcement in the boH-on corbel is the
vertical link enco'iif. ass ing the bolt. The shei.r reinforcement for
th« in-situ corbels is m the form of horizontal links as recom
mended by various codes of practice. It appears that neither
current models tor shear nor current codes quantify the perform
ance of this type of shear reinforcement and a proportion of the
flexural reinforcement is g* orally prescribed. WThi’e this ap
pears to be an e .ceptable approach since shear capacity is thus
linked to flexure* capacity, it is considered appropriate that a
universal mode' for shear should be able tj qualify and quantify
the behaviour of such horizontal links. This is considered par
ticularly important because of the pot.ential use of horizontal
links in a wide variety of structural elements, such as pile-caps,
deep beams, pad foundations and deep slabs.

115
5. Special intention must be paid to moving the load back from
the face of the corbel in order to prevent front splitting fail
ure. This is a general precaution and applies to any structural
situation where largo load bears near a free edge, including in
stances such as supports to simply-supported beams. The danger
of this mode of premature failure is increased as the cover to
the flexural reinforcemeut increases. It is thus recommended
that a general requirement, of moving the edge of the load hor
izontally away from the face of the element by a cover depth be
yond the last straight portion of the flexural reinforcement, is
adhered to.
6. The strut-and-tie analogy for designing corbels tacitly as
sumes a flexural ultimate limit state. According to the tests of
this programme, this was not generally achieved if shear re
inforcement was not included in the corbel. If appropriate shear
reinforcement is included, the strut-and-tie analogy is an ex-'"2cellent and simple predictor of the ultimate limit stato" .
7. For in-situ corbels unreinforced for shear, the resistant
shear stress increased with increasing flexural steel ratio, al
though it was only moderately sensitive to this parameter. It is,
however, significant that a universal model for shear should re
flect this trend even at this relative extreme of the slope of
tne diagonal shear crack. An important observation in respect of
the influence of the flexural reinforcement for the elements un

116
reinforced for shear is that the shear resis. ince was impaired
if the steel was not adequately anchored beyond the point of
intersection of the diagonal shear crack. Adequate anchorage
implies either mechanical anchorage or a full tension lap length
in general. For compact corbels this can necessitate the welding
of a transverse bar to the end of the flexural reinforcement. In
contrast to this, local bond dia not appear to influence ultimate
shear resistance measurably, and a series of tests is undertaken
in Chapter 5 in order to corf*rm this initial observation.
8. The shear resistance of corbels, particularly those unrein
forced for shear, is dependent on concrete strength, and a uni
versal model for shear evaluation should reflect the influence
or this parameter.
9. Where cover to the specimens was varied , it was found that
the shear resistance reduced as the effective depth reduced. This
observation was consistent with the code approaches in general
which assess shear stress in terms of the effective depth and not
overall depth.
10. The evaluation of the prismatic corbels unreinforced for
shear ndicates that the presence of moment and shear in close
proximity does not influence the shear resistance of the diagonal
shear crack. It is postulated, although not observed in this test
series, that the presence of large shear forces could inhibit

117
ductility of the moment-rotation relationship for a hinge formed
at the face of a continuous support, although the attainmert of
the ultimate moment capacity is not impaired.
11. Although the haunched corbels unreinforced for shear ap
peared to exhibit a slightly lower shear resistance than the
prismatic corbels unreinforced for shear, this discrepancy was
not significant and also becomes irrelevant immediately shear
reinforcement in the form of horizontal links is introduced. It
is likely that the model to be proposed within the scope of this
work could be used to investigate the geometric limits at which
the haunched corbel unreiiforced for shear might begin to exhibit
significantly impaired shear resistance, although this will not
have meaningful practical significance owing to the generally
mandatory inclusion of horizontal link reinforcement.

118
4 PUNCHING SHEAR IN FLAT PLATES
A sense of uncertainty and disquiet is occasionally experienced
by practicing engineers when evaluating the performance of rein
forced concrete slabs in punching shear. This is certainly not
without some justification. Current codes vary by substantial
margins and these in turn can vary radically from older codes in
the conceptual approach adopted and i^sed in the final trends
and predictions. In addition, tes are not plentiful,
especially in the evaluation of the performance of deep
slabs.
In this chapter the fundamentals of punching shear design are
examined and current codes compared with tost results on various
slab and beam specimens. The feasibility of a universally appli
cable model for shear which also includes an evaluation of plate
and slab elements is also given consideration. Certain parame
ters have received an in-depth examination in terms of this tesc
programme, owing to the nature of the queries most often en
countered, and also to determine their relevance and influence
in a general model for shear.

4.1 SOME ASPECTS OF CURRENT CODES
The philosophy ot evaluating the punching shear at a perimeter
of l,5h from the face of the column or column head was first in
troduced in CPI 10 and is now pr'bably in fairly general use in
countries using British codes. This approach has also been
adopted in the South African code SABS 0100^. There is some
justification for this concept. Laboratory tests on slabs indi
cate that, if unconstrained, the slab will fail in punching shear
in a conical format which intersects the upper surface of the slab
at approximately 1,5 to 2 times the depth, h, of the slab, from
the column face. This corresponds to an a/d ratio of approxi
mately 2 which is consistent with the trough (or minimum value)
of Kani's valley of diagonal failure. If the failure stress of
the specimen unreinforced for shear is evaluated on the resulting
punching perimeter at the surface of the slab, it is immediately
evident that the shear stress at failure for this situation co
incides approximately with that for beam specimens unreinforced
for shear. It is primarily for this second reason that the per
imeter of l,5h from the column face was chosen as the "affine"
surface for the evaluation of punching shear in CP110. The phys
ically observed dimensions of the unconstrained punching cone do,
however, appear to have far more fundamental significance in
terms of l qualitative and quantitative assessment of the me

chanics of punching shear failure than merely providing a con
venient affine surface.
If the punching shear capacity of the slab is evaluated by code
and accepted design procedures, it is apparent that any load
within the surface perimeter of the punching cone zone cannot36logically be considered to be contributing to shear failure
This phenomenon will have negligible effect on results for thin
to medium thickness slabs with normal span to depth ratios, but
will have a marked influence on deep slabs and slabs with small
span to depth ratios. This phenomenon also indicates that the
slope of the punching cone could become steeper than the uncon
strained slope depending on the interaction between increased
shear resistance as the slope increases and increased applied
shear force owing to the reduction in the portion carried within
the limits of the cone. There is thus considerable justification
in developing a shear nv>dc-i which depends on tne function of slope
of the diagonal shear crack of the punching cone, as this function
can then be minimised to establish the lowest shear collapse load
for a particular structural geometry. These calculations will be
relatively easily handled for slabs subjected to uniformly dis
tributed loads, which is consistent with the loading normally
used to establish the flexural ultimate limit state for slabs.
CPI 14 was condemned by many as being unsafe with respect to shear
evaluation in particular and this is indeed why the approach in

121
CP 110 varies significantly in this respect. CP110, however, is
certainly not without flaws and has possibly received more crit
icism of its shear provisions than its predecessor. A radical
philosophical change in code approach based primarily on research
results has the danger of being untried over the full range of
structures likely to be encountered by the code user. The ina
bility to minimise the collapse energy function because the
punching perimeter is fixed is one of the reasons why CPI 10 gives
anomalous results in some instances, although the philosophy of
starting at approximately an unconstrained perimeter is sound.
This limitation appears to have been redressed in a simplistic
manner in the draft BS0000, by checking an increased resistant
shear stress at the support face.
However, CP110 does predict the punching shear capacity of thin
to medium thickness slabs with "normal" span/depth ratios very
well. This is evident in undertaking tests on a number of slab
specimens. The code has also proved itself over the past years
in application to structures of this category. There is thus
considerable justification for maintaining the perimeter at ap
proximately the position of unconstrained minimum collapse shear
load, as opposed to other codes where a reduced perimeter is used
with an enhanced resistant shear stress, but attention should be
given to instances where anomalous results could be obtained.
This implies the need for an evaluation of specimens having ge
ometric properties that induce anomalies of this kind, in par
ticular a study of the shear performance of deep slabs subjected
to punching is warranted.

122
4 . 2 THE TEST PROGRAMME
In allusion to the observed areas of discrepancy mentioned above,
the major parameters intended to be investigated were depth of
slab and variations in shear-arm to effective depth ratio, (a/d
ratio). Ii. addition, i- was felt necessary to consider the effects
of change in percentage of flexural steel reinforcement and grade
of concrete in conjunction with the effects of the major parame
ters in order to assess the universal influence of these parame
ters on resistant shear stress.
Other influences which required evaluation within the scope of
such an assessment are the effect of moment transfer applied si
multaneously with punching shear, methods of reinforcing for
punching shear and the effects of prestressing the slab speci
mens. The prestressed slab specimens are evaluated in 4.7.
Some fifty reinforced concrete slab specimens were tested in this
programme. The depths varied from 50mm to 300mm, the a/d ratios
from 0,3 to 2,5 and the reinforcement ratios from 0,5% to 1,0%,
while the grade of concrete varied from 20MPa to 40MPa. The
typical plan dimensions of the specimens were 600mm by 60C'mm.
Load was applied to the specimens through a "punching platen",
intended to simulate a column or patch load on the slab These

punchiiic 'rLens were generally square and varied in dimension
from 80mi *y 80mm to 120mm by 120mm. The slabs were supported
symmetrically, oi ill four sides, by a simple, square line sup
port, giving varying span dimensions in plan. This simulated the
simplest arrangement of load on a slab pnalogous to the equivalent
case of two point or single point loading of beams, in order to
study the influence of variations in a/d ratio (in a
two-dimensional sense) for slabs. Although this "line load" is
hypothetical and not encountered in flat plates in practice, the
objectives of the tests were specifically to determine shear re
sistance effect, with the load eftect being considered independ
ently. Adjustments in the load effect which can contribute to
shear failure need to be made because the prototype loading
closely approximates a uniformly distributed load in many in
stances. This approach is thus entirely consistent with those
of two-point or single point loading for beams, which have been
used by many researchers in the field of shear performance of24 29 40reinforced concrete beams ’ ’ . Standard high yield steel
reinforcement of 450MPa average yield stress was used in the slab
specimens This was placed in the form of an isotropic mesh,
welded at the perimeter only, to provided adequate anchorage. In
certain of the specimens electric resistance strain gauges were
attached to the reinforcement in order to monitor its behaviour
under the influence of punching shear forces. Typical views of
the reinforcement for these specimens are indicated in Figure 4.1
and typical 300mm deep slab specimens are shown in Figure 4.2.

124
FIGURE 4.1 FLEXURAL REINFORCEMENT MESH USED IN SLAB SPECIMENS, SHOWING PLACING OF ELECTRIC RESISTANCE STRAIN GAUGES.

125
FIGURE 4.2 TYPICAL 300mm DEEP SLAB SPECIMENS TESTED IN PUNCH 'NG SHEAR.

126
A depth of slab specimen of 300mr was the deepest that could
reasonably be accommod ted by the size and load capacity of the
hydraulic testing machine. Because of this limitation some thirty
beam specimens unreinforced for shear were tested in parallel
with the slab specimens. The beam specimens varied from 150mm
to 1200mm in depth, with other parameters remaining identical to
the slab specimens, the intention being that the results could
be correlated over the range of depths that coincided and could
thus be extrapolated to 1200mm depth of slab with a high level
of confidence. The beams tested were generally between 130mm and
150mm in width. In certain specimens, the width was varied in
tentionally to assess its possible influence on resistant shear
stress. There was, however, no measurable effect of width of
section on resitant shear stress and this was thus discarded as
a parameter influencing the proposed universal model for shear.
Typical 600mm and 1200mm reinforced concrete beam specimen, un
reinforced for shear, are shown in Figure 4.3.

127
h iGURE 4 .3 EXAMPLES OF 600mm AND 1200mm DEEPBEAM SPECIMENS TESTED IN TH IS SERIES.

4 .3 TEST RESULTS AND THE INFLUENCE OF THE MAJOR
PARAMETERS
All the slab specimens tested failed in punching shear, in that
they developed the typical cone of failure and the
load-deflection curves all indicated brittle failure with no
ductility. In the lightly reinforced specimens there was usually
some evidence of the onset of yield line crack patterns observed
at failure, although yield line collapse never occurred. A typi
cal intersection of the punching cone with the surface of the slab
is shown in Figure 4.4. A qualitative assessment of this form of
unconstrained punching surface is important in the evaluation of
punching shear performance using a uni\ersal model for shear.
The slab specimens with a/d ratios in excess of approximately 2
showed no indication of constraining or influencing the shape of
the punching cone. This cone of failure generally intersected the
surface of the slab so as to result in an effective a/d ratio (in
two-dimensional form) of approximately 2. The shape of the cone
intersection in tht.se cases approximated the shape used in CP110,
in that some arbitrary rounding of the corners appeared to occur
generally. This is evident in Figure 4.4.

129
FIGURE 4.4 T Y P IC A L PUNCHING CONE INTERSECTIONWITH SLAB SURFACE.

125
FIGURE 4.4 TY P IC A L PUNCHING CONE INTERSECTIONWITH SLAB SURFACE.

130
Taking cognizance of all the adjustments that have to be made to
the mean ultimate shear resistance recorded in the tests, i.e.
adjustments for depth, concrete grade, flexural steel ratio, from
mean resistance to characteristic resistance, and further ad
justment by a partial material factor of 1,25, fairly good cor
relation between the test results and the predicted CP110 and
BS0000 code values were obtained for the slab specimens with
"unconstrained" a/d ratios.
In tests where the punching cone was forced to form more steeply
than it would if unconstrained, an enhanced value of resistant
shear stress was observed, which was similar to that recommended
by these codes. The plan shape of the affine surface at l,5h from
the column or support face has been changed from a a rounded
format in CPI 10 to a s^jare format in the draft BSOOOO. The im
plication is that the draft code will result in slightly less
conservative assessments than CPI 10 for punching shear in gen
eral. For a comparative evaluation of the test results at the
specific code perimeters of l,5h, a square affine surface, con
sistent with BSOOOO, was used in order to make comparisons of code
design stresses and test stress results.
In the following sections the genera’ parametric behaviour cf the
specimens tested has been summarised and presented graphically
for clarity. The detailed test results relating to these summa
ries are tabulated in Appendix B. A new, universal model for shear

131
which is intended to reflect the observed universal parametric
behaviour of shear resistance is developed in Chapter 8. This
model can be applied to punching s’.ear evaluation directly if
cognizance is taken of a slightly reduced perimeter as is evident
in the following sections. The model stress values are included
in Appendix B for comparative purposes.
Of the parameters affecting the test results the following could
be clearly identified:
A . 3.1 FLEXURAL REINFORCEMENT RATIO
The percentage of flexural reinforcement, if adequately anchored
beyond the point of intersection of the shear crack with the
flexural reinforcement, did influence the ultimate resistant
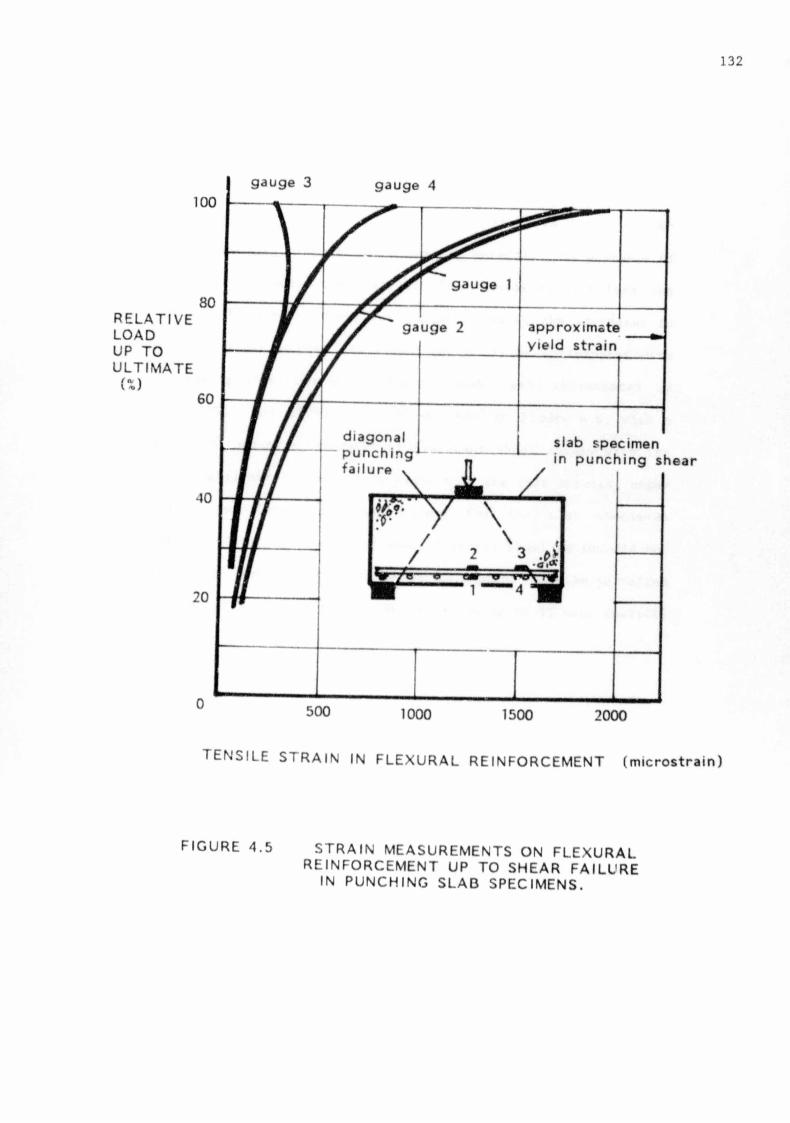
shear stress of the specimens tested. It is of note that strain
measurements on the flexural reinforcement indicate that it is
unlikely to be at yield in the vicinity of the point of inter
section of this reinforcement with the diagonal shear (.rack. This
observation is evident in the load-strain curves of Figure 4.5
and cognizance is taken of this in the formulation of a universal
model for shear. While the limited plan dimension of the slab test
specimens means that the shape of the bending moment diagram in
132
500
STRAIN
1000
IN FLEXURAL
1500 2000
REINFORCEMENT (microstrain)
gauge 3 gauge 4
TENSILE
RELATIVE LOAD UP TO ULTIMATE (%)
gauge 2 approximate yield strain
FIGURE 4.5 STRAIN MEASUREMENTS ON FLEXURAL REINFORCEMENT UP TO SHEAR FAILURE
IN PUNCHING SLAB SPECIMENS.
133
the proximity of the punching platen is not identical to that of
a prototype continuous flat plate structure, the rapid reduction
of bending moment in the prototype relative to the position of
the unconstrained punching surface will result in the above ob
servation being true for both cases in general. The presence of
d^wel action double curvature is also clearly evident from the
form of the strain curves for gauges 3 and 4. The increases in
average shear stress resistance which can be anticipated with
increasing steel percentage are reasonably well represented by
both CPI 10 and BS0000 as can be seen in Figure 4.6, with a
slightly reduced enhancement of resistant shear stress with in
creasing flexural steel ratio evident in the test results, espe
cially for lower concrete grades. For the slab specimens
considered in this test programme, flexural steel ratios did not
exceed 1?., and extrapolation beyond this point could be justified
on the br.sis of beam results where ratios up ■> 3\ were investi
gated .
4 .3 .2 GRADE OF CONCRETE
The gradf> of concrete affected the ultimate shear resistance of
the slab specimens tested. Reasonable correlation was obtained
between the test results and the code values of CPI 10 and BSOOOO

134
BSOOOO
BSOOOO BSOOOO
DESIGN UL T IM A T E SHEAR STRESS
(MPa)
CP11040MPa
Concrete
Results
^20MPaConcrete
esults
CP110IXSteel
Results
20MPa 40MPa
F L E X U R A L STEEL GRADE OF R A T I O ( lO O A /b d ) C O N C R E T E
( * ) (MPa)
FIGURE 4 .6 TEST RESULTS RELATED TO CODE VALUES FOR VARIAT IO N IN DESIGN ULTIMATE RESISTANT SHEAR STRESS WITH STEEL RATIO AND GRADE OF CONCRETE.

as indicated in Figure 4.6. A universal trend in the influence
of these parameters is thus evident in these test results and this
should be reflected in an appropriate mo>lel for shear.
4 . 3 . 3 DEPTH OF SLAB
The depth of slab affected the ultimate resistant shear stress
of the slabs tested markedly. Reasonably good correlation was
obtained between the slab and beam specimens in the range of depth
considered, and thus the curve for the deep beam specimens was
used to predict values for slabs up to 1200mm in depth. As is
evident in Figure 4.7, the test results correlate better with the
curve for BS0000 than that for CPI 10. Both codes, however, predict
no further reduction of shear stress <»t failure after a specific
limiting depth of slab. The test results, as can be seen from
Figure 4.7, indicate a continued reduction of shear stress at
failure with increasing depth of slab.
BS0000 recommends n relationship of:

136
2
2STRESS
ENHANCEMENT FACTOR FOR
DEPTH £
1,
1,
0,
E F F E C T IV E D E P T H OF SLAB OR BEAM (mm)
FIGURE 4.7 VARIAT IO N OF ULTIMATE DESIGN RESISTANTSHEAR STRESS ENHANCEMENT FACTOR WITH DEPTH.

where £ is the stress enhancement factor for depth,
d is the effective depth of the slab.
This code thus adjusts the design sheai stress for depth by a
larger factor than that used in CP110. CP110 itself was updated
to reflect this phenomenon and it is evident that research results
in this tespect are only having recent code application. It is
alsc evident from Figure 4.7 that the results f this test
programme indicate an even greater adjustment *o be made for depth
than those predicted by these codes and also that the adjustment
should continue beyond the recommended depth limitations of the
codes. Thus, if all limitations were removed, the
state of the art code predictions would match the results of this
test programme reasonably well. The best fit to these test re
sults, keeping the form of the equation consistent with that of
BSOOOO, appears to be:
£ = (500/d)* (with no limitations)
The trend of the test results of this programme are consistent
with the results of other researchers in this4 24 25 29 43field ’ ’ ’ ' , in particular this equation correlates well
with the curve given by Chana* in Figure 2.11. Explanations as
to the ’"eason for the reduction in resistant shear stress with

138
depth are varied, including such effects as strain gradient
across the section. The explanation that is proposed here is re
lated to the proposed model for shear. The proposed model, de
veloped in Chapter 8 r r this thesis, is based on exist* g models
which recognise the influence of three components of resistance
to shear after the formation of the diagonal rhear crack, for
structural elements which are unreinforced for shear. These com
ponents are:
(a) Dowel action of the flexural reinforcement.
(b) Aggregate interlock al.mg the diagonal sh ar crack.
(c) Shear transfer across the compression 2one.
The mijor contributing factor here is considered to be that of
aggregate interlock, with abrupt strain weakening once the ulti
mate peak shear resistance is exceeded. It would appear from
the results of this test programme that there is a relationship
between the crack width of the diagonal shear crack and the abrupt
loss of resistance of the aggregate interlock component in that
the peak she^r resistance appears to be attained at an absolute
approximate average width of the diagonal shear crack which is
relatively independent of the dapth o f the section being tested.
It is thus proposed that once the diagonal shear crack reaches a
certain absolute average value, abrupt loss of aggregate inter
lock is imminert. If the section is reinforced in such a way that

139
the "ductile" contribution of the steel reinforcement, flexural
or shear, is substantially smaller than that of aggregate inter
lock, then abrupt shear failure of the section follows. For
structural elements unreinforced for shear, the flexural re
inforcement is relatively inefficient in resisting shear force,
in relation to the diagonal s^ear crack, and abrupt shear failure
always follows loss of aggregate interlock in these cases. The
only possible remaining ductile contribution to shear resistance
after loss of aggregate interlock is that of dowel action, which
is generally a small proportion of total shear resistance for
monolithic sections. This assessment is based on the assumption
that shear failure precedes flexural failure. In the event that
the flexural reinforcement reaches uniaxial yield at the point
where the diagonal shear/flexural crack intv-rsects this re
inforcement, then the flexural ultimate limit state has been at
tained. A hinge will form at this point in the structural element
and even if this hinge is subject to shear force, this will be
carried by dowel action and a considerably enhanced compression
zone component. The investigation of the mechanics of the manner
in which such a hinge carries the shear force is not within the
specific scope of this thesis.
For deep sections, the remoteness of the flexural st^el re
inforcement <*r'd compression sone from the midpoint of the section
result in this absolute value of crack width of the diagonal shear
crack being achieved earlier than that for a shallow section if

140
average shear stress is the parameter being used for the shear
evaluation. The deep section will thus lose aggregate interlock
earlier than a shallow section in terms of shear stress and will
thus fail in shear at a lower stress. This phenomenon should be
be reflected in the formulation of a universal model for shear.
4 . 3 . 4 SHEAR ARM TO DEPTH RATIO
In this test programme, the cone of inching was forced to form
steeper in certain of the specimens tnan it would if uncon
strained. The shear arm to deptn ratio (or the a/d ratio) for
these specimens was thui effectively reduced. This was achieved
by reducing the size of the four-sided square support to the slabs
being tested, while maintaining a symmetrical arrangement of
support around the punching platen. The beam and adjusted slab
results for these tests both exhibit clear parametric behaviour
with varying a/d ratio, as indicated in Figure 4.8. Upon exam*
ination of this figure, it would appear that the beam test results
are well represented by the. adjustment used in CP110 and BSOOOO
2d/a

141
SHEAR ARM TO D E P T H R A T IO ( a / d R A T I O )
FIGURE 4.8 VARIATION OF ULTIMATE DESIGN RESISTANTSHEAR STRESS ADJUSTMENT FACTOR WITH .i/d RATIO .

142
This is consistent with the result- of jther researchers in this
field. The slab test results, howe,er, if evaluated on the per
imeter, appeared to be consiste' tly slightly lower than the beam
resistant stress results. Evaluating the test results at an
affine perimeter of 0,85 of the true measured perimeter, using a
rounded format consistent with the observed unconstrained shape,
yielded values which correlated well with the beam tests both in
parametric behaviour (as indicated in Figure 4.8) and absolute
value (as indicated in Appendix B). The consequence of this ob
servation is that the resistant shear stress "hould in general
be applied at a perimeter of approximately 0,85 of the shear arm
associated with the slope of the diagonal shear crack, i.e. the
diagonal punching cone. The test results have been evaluated on
this basis for the comparison with the model values of mean re
sistant shear stress in Appendix B for specimens having punching
cones steeper than the uncor. trained value of 2d. Even for the
unconstrained specimens, this approach is virtually fully con
sistent, as 0,85 of 2d is very close to the l,5h used in the codes
under consideration. There is thus clear test evidence of a sig
nificant enhancement in resistant shear stress with increasing
slope of diagonal shear crack for ooth beam and punching shear
specimens, and a universal model for shear should reflect this
trend for both these structural elemont types.

V*-
143
4.4 CASE STUDIES
In order to place the test results of the slabs unreinforced for
shear in perspective relative to the existing and proposed codes
of practice, three fiat plate case studies have been considered.
Certain parametric trends, such as depth of slab and span/depth
ratios, are identified in these examples. Other parameters, how
ever, are not intended tc be evaluated and thus all examples are
considered to be of Grade 25 concrete, to have 0,5% isotropic
reinforcement top and bottom of the slab and to have typical cover
to the reinforcement. In addition, only typical interior columns
of a flat plate structure, have been considered with only nominal
moment transfer being required. Column sizes are considered to
be typical and are not varied as a significant parameter in this
exercise. Thf> results of the case studies are in terms of the
design ultimate total uniformly distributed l'ad that the flat
plate structure is capable of supporting. The case studies con
sidered are:
(a) A 150mm thick slab supported on 300mm square
columns at 3000mm centres.
(light industrial or office)
Cb) A 350mm thick slab supported on 400mm square
columns at 6000mm centres.
(heavy/medium industrial)

(c) A 1200mm thick slab supported on 1000mm square
columns at 5000mm centres.
(floor to large silo)
The results for these case stud.es for both punching shear ca
pacity and yield line capacity for a number of different codes
and for the results of this test programme are presented in Figure
4.9. It is not the intention of tnis figure to plot a specific
parameter on the horizontal axis, although the cases plotted on
this axis do represent trends of both increasing depth and re
ducing span/depth ratios. The capacities of the case studies have
been linked, simply to indicate greater clarity in the figure.
The gap in the figure is to accomodate a change in vertical scale
for the extreme case of the silo floor.
The evaluation depicted in Figure 4.9 does not take moment
transfer into account, other than in the nominal manner recom
mended by CF110 and BSOOOO. It is of note that the arbitrary
increase in punching shear resistance required for a typical in
terior column lias been reduced from 25% in CPI 10 to 15% in BSOOOO.
Test results in this test programme have thus been adjusted by
15% in this comparative evaluation. It is evident from this
figure that prior to the introduction of a check at the column
face (mstitutr-d in BSOOOO), CP110 predicted ultimate design
loads which were radically higher than general for deep slabs with
small spari/depth ratios, because a check was only required at the

145
150mm slab 3500mm col crs 300mfTi sq cols ( 1 /d -29 )
350mm slab 6000mm col crs 400mm sq cols ( l / d = 19)
1200mm slab 5000mm col crs
1000mm sq co*s ( l /c i -5)
r iGURE 4.9 VARIAT IO N OF ULTIMATE DESIGN UNIFORMLY D IS T R IB U T E D LOAD CA PA CITY WITH CASE STUDY

146
unconstrained punching perimeter. BS00G0 has redressed this, as
can be seen, but does not quite cover the most severe of the re
sults which appear to be anticipated from this test programme.
It is also evident from the figure that in general there appears
to be a danger in flat plate construction of lack of ductility
in terms of the comparison between yield line and punching shear
evaluation of the slabs. This is, however, possibly not as severe
as is first apparent in pxgure 4.9, as the punching shear results
incorporate a partial matsrial factor of the order of 1,25, while
the yield-line results incorporate a partial material factor of
1,15. However, for structures that can be subjected to impact,
or where ductility is fundamental to the design requirements, the
unsatisfactory situation in this regard, summarised in Figure
4.9, is self evident. The relationship between punching shear
capacity and yield-line capacity depicted in this figure is di
rectly analogous to Kani's valley of diagonal failure for
simply-supported beams subjected to two-point loading.
In regard to the manner in which the large discrepancies of the
deep slab c.se study are redressed by a check at the column face,
it is apparent from Figure 4.10 that the test results are only
more severe than this check of BS0000 or the value at the l,5h
perimeter for very deep slabs which also have a span/depth ratio
less than 7. In Figure 4.10, the test results of the previous
section have been used to obtain a variable function of ultimate

Author Cross Michael Graham
Name of thesis A Parametric Evaluation Of The Ultimate Shear Capacity Of Reinforced Concrete Elements. 1985
PUBLISHER: University of the Witwatersrand, Johannesburg
©2013
LEGAL NOTICES:
Copyright Notice: All materials on the Un i ve r s i t y o f the Wi twa te r s rand , Johannesbu rg L ib ra ry website are protected by South African copyright law and may not be distributed, transmitted, displayed, or otherwise published in any format, without the prior written permission of the copyright owner.
Disclaimer and Terms of Use: Provided that you maintain all copyright and other notices contained therein, you may download material (one machine readable copy and one print copy per page) for your personal and/or educational non-commercial use only.
The University of the Witwatersrand, Johannesburg, is not responsible for any errors or omissions and excludes any and all liability for any errors in or omissions from the information on the Library website.