Figure 2.Displaced primary rock armour at the seaward and ... · Figure 1. Displaced rock armour at...
7
Figure 1. Displaced rock armour at the seaward side of the outer breakwater at Hikkaduwa. Figure 2.Displaced primary rock armour at the seaward and crest of the main breakwater at Mirissa
Transcript of Figure 2.Displaced primary rock armour at the seaward and ... · Figure 1. Displaced rock armour at...
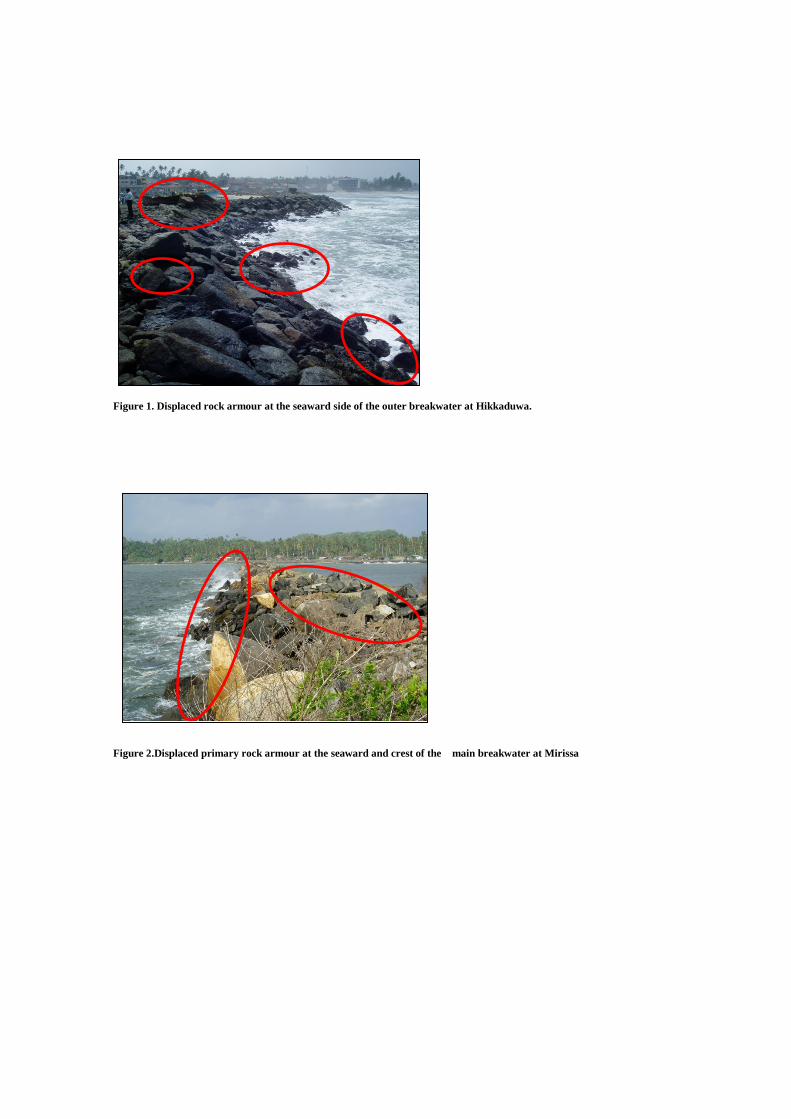
Figure 1. Displaced rock armour at the seaward side of the outer breakwater at Hikkaduwa.
Figure 2.Displaced primary rock armour at the seaward and crest of the main breakwater at Mirissa

Figure 3. Displaced primary rock armour at seaward and crest of the main breakwater at Puranawella
Figure 4. Steep Tetrapod Armour Layer at Kuji Port.

Figure 5. Damaged Breakwater at Noda Port, provisionally repaired using 25 ton tetrapods.
Figure 6. Diagram showing the various breakwaters at Taro port. Note that diagram is not to scale.
A: 70-100 ton hollow pyramids (intact)
C: 70-100 ton hollow pyramids (destroyed)
B: 800 ton caissons (intact)
Islands
D: Rebuild new rubble mound section (25 ton tetrapods)
Final location of caissons
Original breakwater location
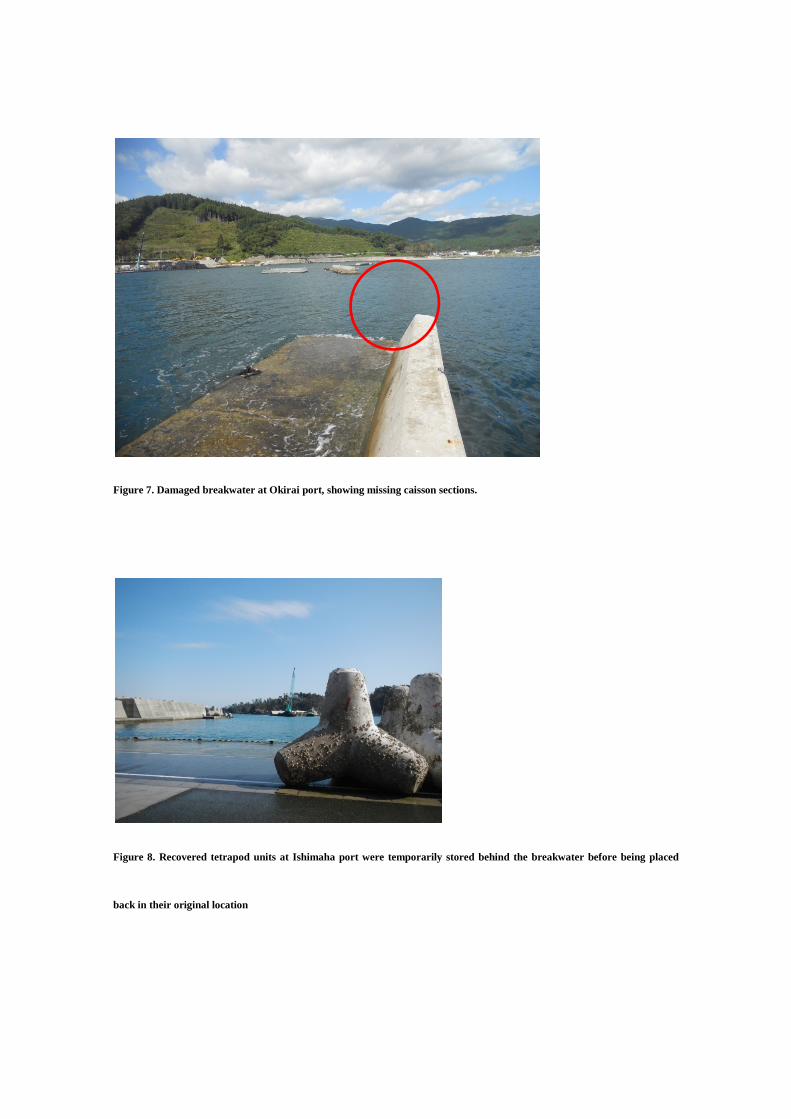
Figure 7. Damaged breakwater at Okirai port, showing missing caisson sections.
Figure 8. Recovered tetrapod units at Ishimaha port were temporarily stored behind the breakwater before being placed
back in their original location

Figure 9. Damaged Sea-Lock Armour Units at Ooya Port.
Figure 10. Failed X-Block Armour Units at Hikado Port.
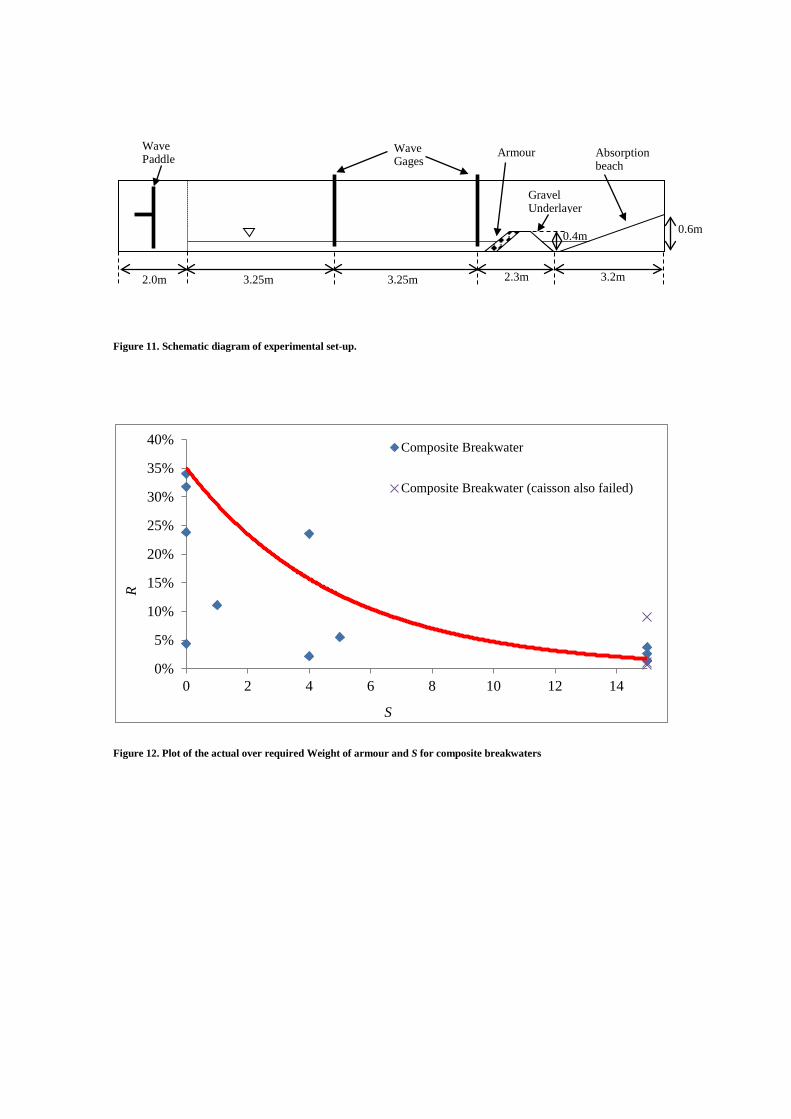
Figure 11. Schematic diagram of experimental set-up.
Figure 12. Plot of the actual over required Weight of armour and S for composite breakwaters
0%
5%
10%
15%
20%
25%
30%
35%
40%
0 2 4 6 8 10 12 14
R
S
Composite Breakwater
Composite Breakwater (caisson also failed)
2.0m 3.25m 2.3m 3.2m 3.25m
0.6m
Wave Paddle
Wave Gages
Armour
Gravel Underlayer
Absorption beach
0.4m

Figure 13. Plot of the actual over required Weight of armour and S for rubble mount breakwaters
0%10%20%30%40%50%60%70%80%90%
100%
0 2 4 6 8 10 12 14
R
S
Rubble Mound Breakwater(labexperiments)Rubble mound (real failure, Japan)
Rubble Mound Breakwater (real failure, SriLanka)