
Figure 2. Cure design of stage 1. The temperature ...
18
Figure 1. Cross section of the T-stiffener. Figure 2. Cure design of stage 1. The temperature experienced by resin is plotted across a single die having two or more temperature regions Figure 3. Design of the resin injection system
Transcript of Figure 2. Cure design of stage 1. The temperature ...
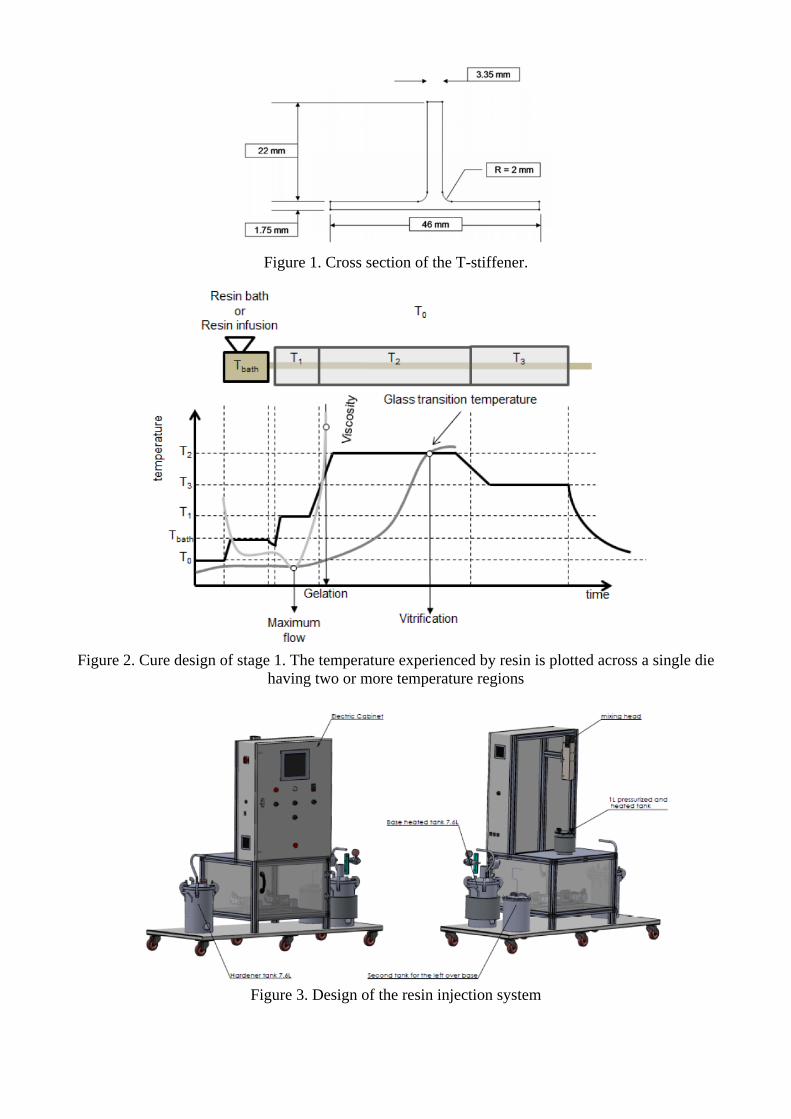
Figure 1. Cross section of the T-stiffener.
Figure 2. Cure design of stage 1. The temperature experienced by resin is plotted across a single die
having two or more temperature regions
Figure 3. Design of the resin injection system
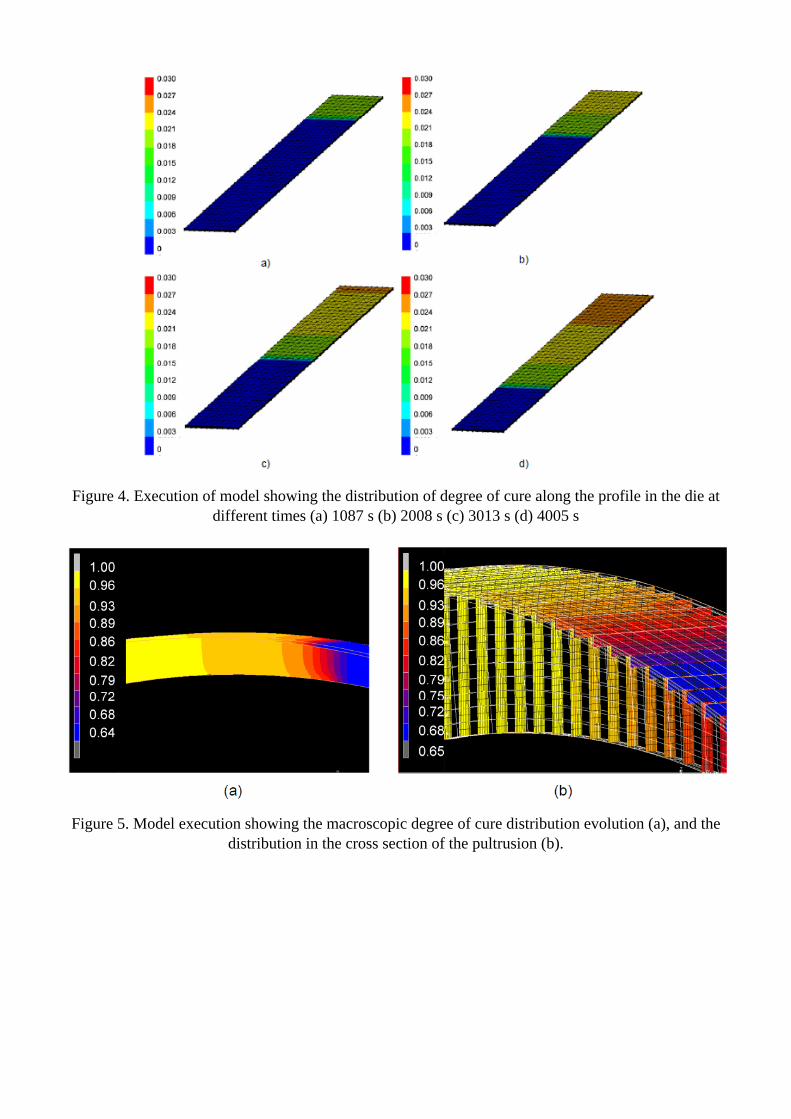
Figure 4. Execution of model showing the distribution of degree of cure along the profile in the die at different times (a) 1087 s (b) 2008 s (c) 3013 s (d) 4005 s
Figure 5. Model execution showing the macroscopic degree of cure distribution evolution (a), and the distribution in the cross section of the pultrusion (b).

Figure 6. Model correlating the degree of cure to the Tg of the selected resin system.
Figure 7. Fracture toughness versus conversion reached during the pre-cure stage for the RTM6/G1157 system (left) and SEM images for the delaminated specimens; (a) 0% pre-cured (b) 40% pre-cured (c)
70% precured and (d) 90% pre-cured (right)
Figure 8. Fitting of the CTE experimental data of the selected resin system for 4 levels of degree of cure
0
0.0001
0.0002
0.0003
0.0004
0.0005
0.0006
0 50 100 150 200 250
CTE
Temperature (⁰C)
67% experiment67% model79% experiment79% model85% experiment85% model100% experiment100% modelTransition points

Figure 9. Model execution showing the flow front (zoom in at a particular point along the pultrusion die) at the left and the degree of cure evolution along the profile length at the right
Figure 10. Stresses generated by contact with die in z direction for a given set of process conditions.
Figure 11. Assembled manifold with mounted sensors and carbon fabric (braid) passing through the cavity.
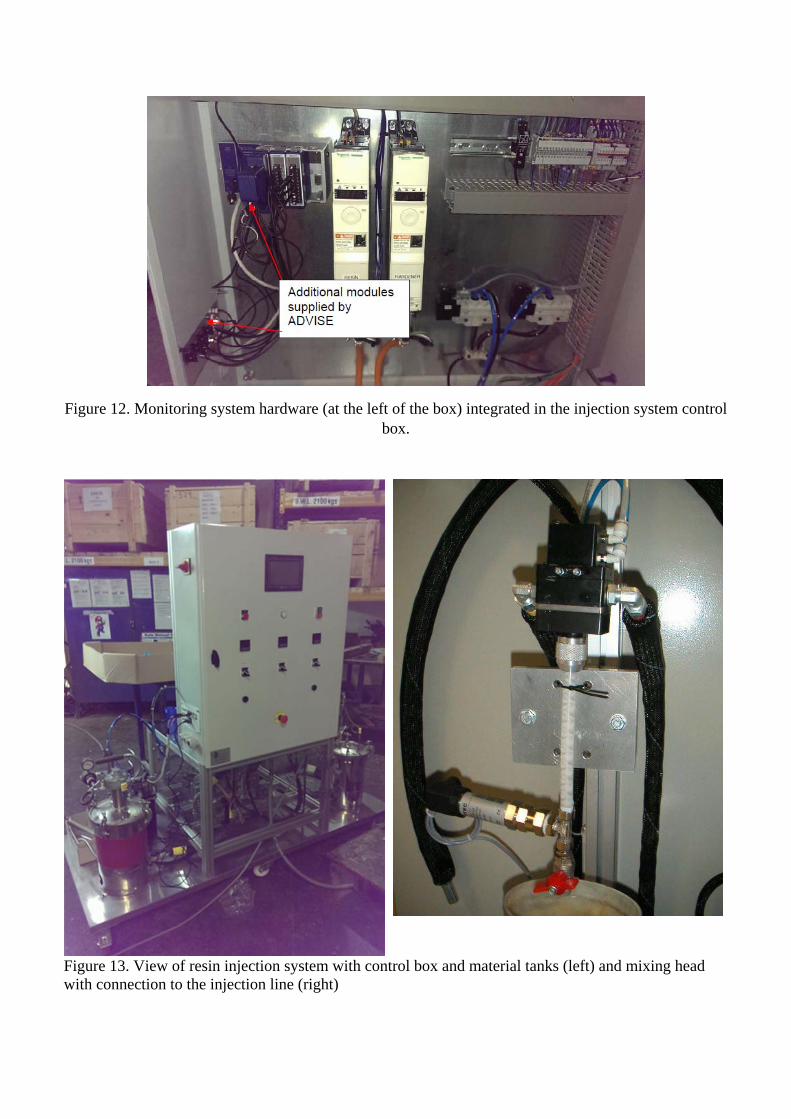
Figure 12. Monitoring system hardware (at the left of the box) integrated in the injection system control box.
Figure 13. View of resin injection system with control box and material tanks (left) and mixing head with connection to the injection line (right)

Figure 14. Synoptic page of the injection system control software.
Figure 15. Dielectric sensors with embedded thermocouple for viscosity measurements.
Figure 16. Ultrasound sensors for scanning the pultrusion profiles along the horizontal (left) and vertical (right) axes.
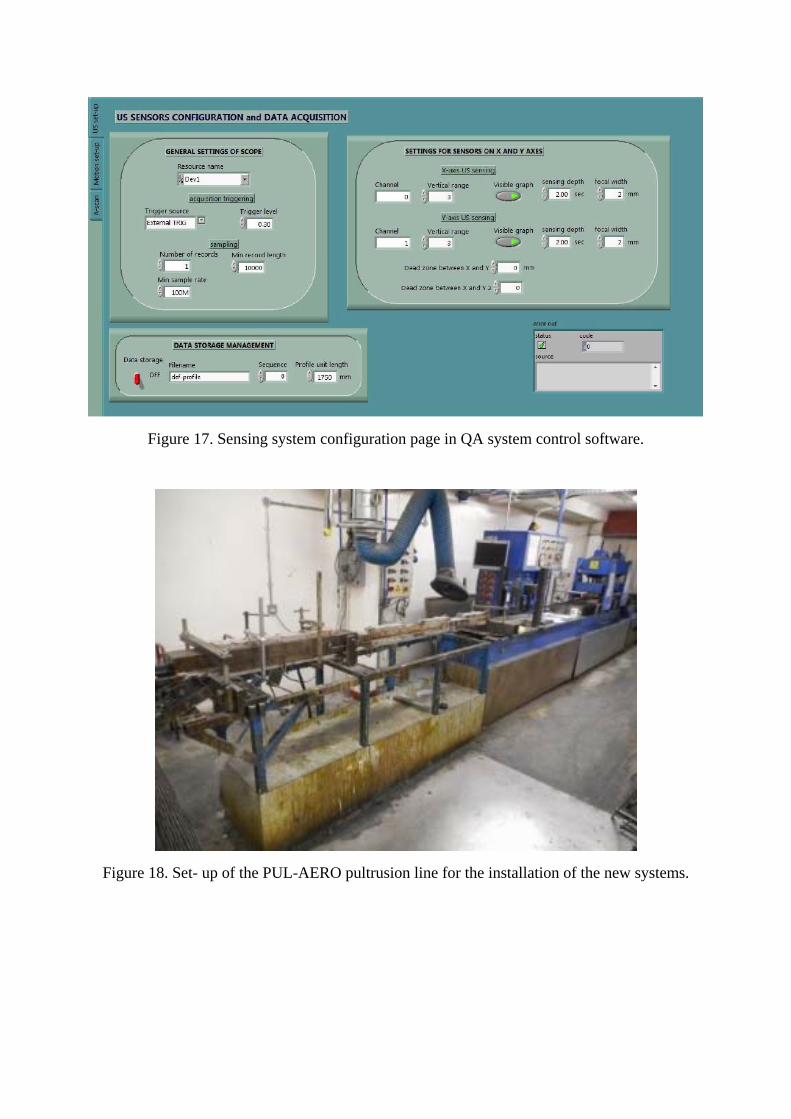
Figure 17. Sensing system configuration page in QA system control software.
Figure 18. Set- up of the PUL-AERO pultrusion line for the installation of the new systems.
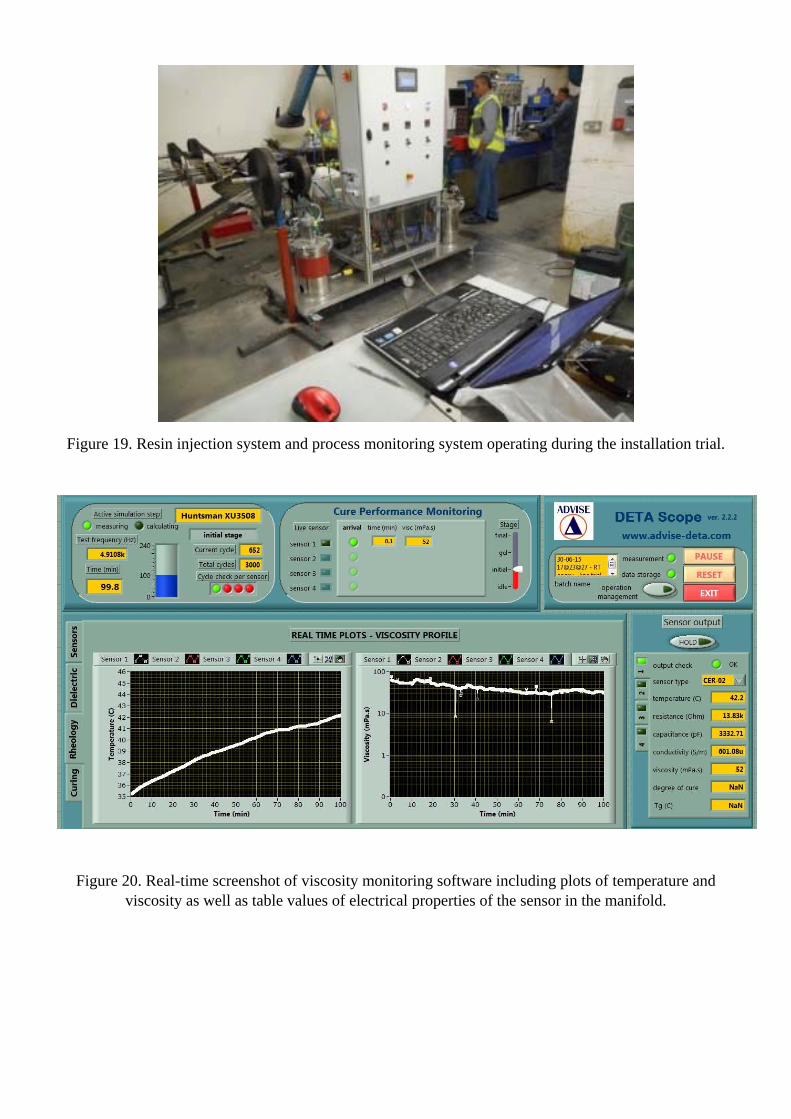
Figure 19. Resin injection system and process monitoring system operating during the installation trial.
Figure 20. Real-time screenshot of viscosity monitoring software including plots of temperature and viscosity as well as table values of electrical properties of the sensor in the manifold.
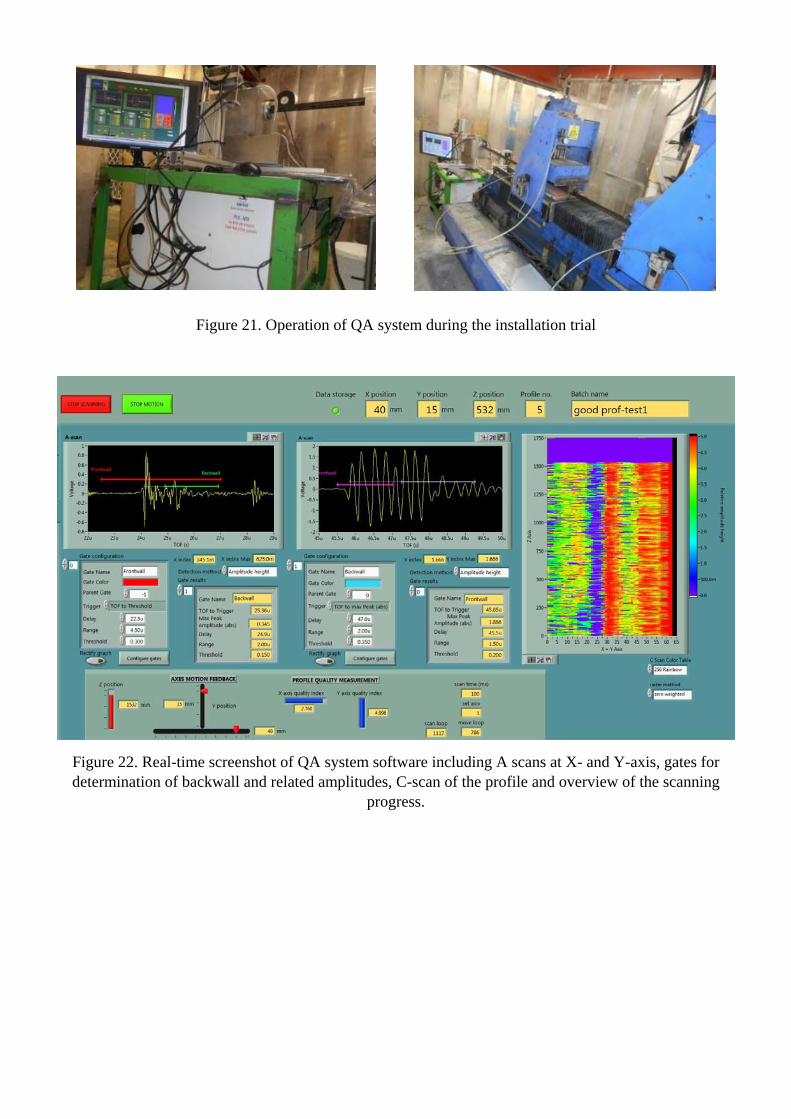
Figure 21. Operation of QA system during the installation trial
Figure 22. Real-time screenshot of QA system software including A scans at X- and Y-axis, gates for determination of backwall and related amplitudes, C-scan of the profile and overview of the scanning
progress.

Figure 23. First profile exiting the water tank of the on-line QA system through the flange. Tight wipe ensures negligible water leakage and running on the surface.
Figure 24. Resin injection inside the manifold during the production of first profiles
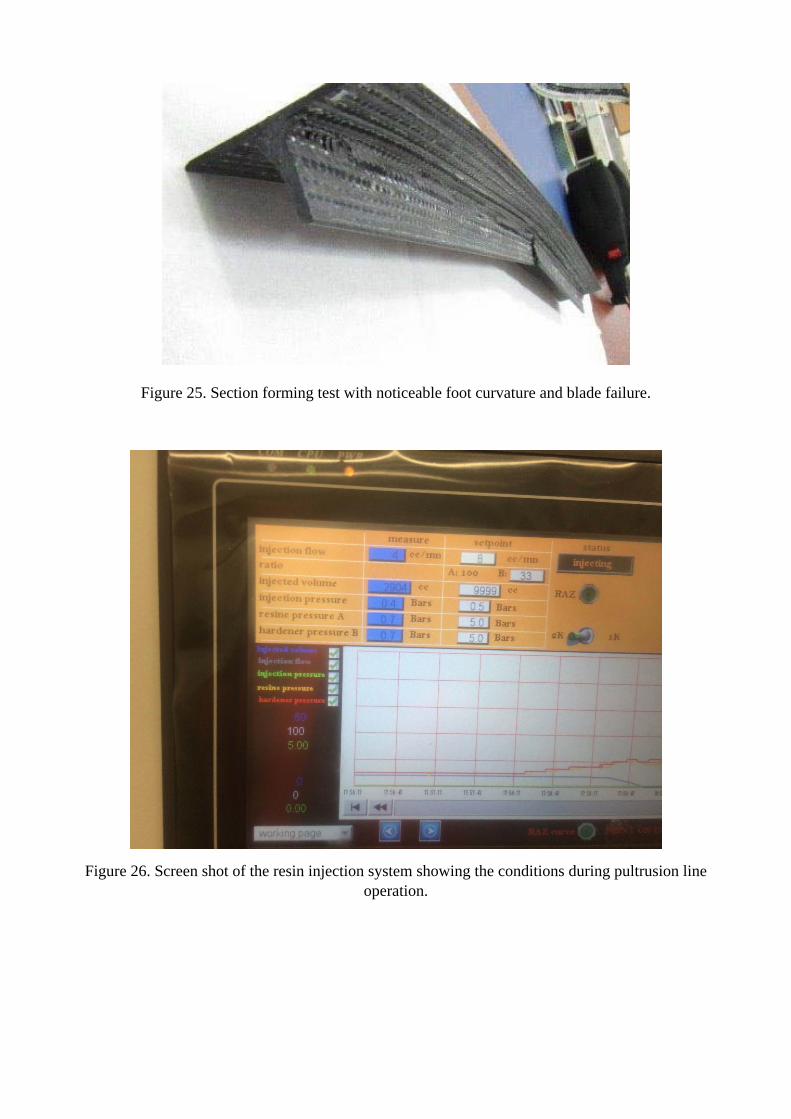
Figure 25. Section forming test with noticeable foot curvature and blade failure.
Figure 26. Screen shot of the resin injection system showing the conditions during pultrusion line operation.

Figure 27. Final configuration of ultrasound sensors performing on-line NDI scan of the T-section profile during stage 1 production.
Figure 28. Gates configuration and signal for a good quality profile section along the X-axis (left) and the Y axis (right) during on-line operation of the NDI system.
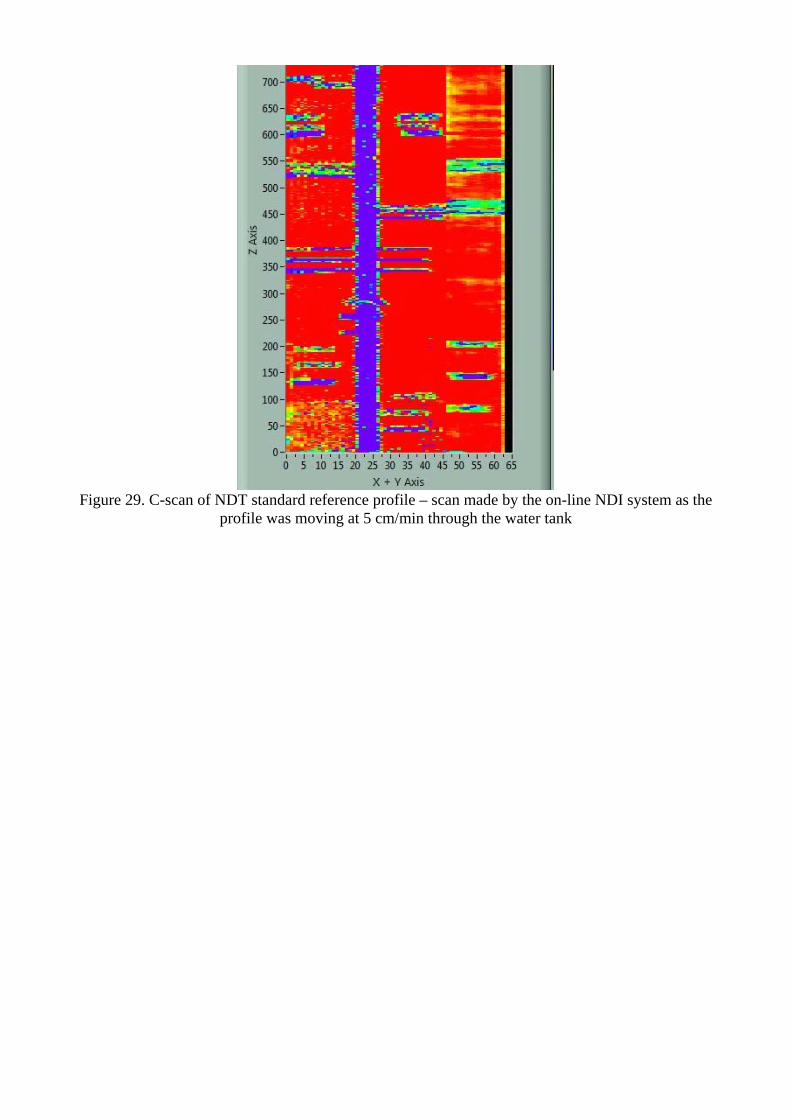
Figure 29. C-scan of NDT standard reference profile – scan made by the on-line NDI system as the
profile was moving at 5 cm/min through the water tank
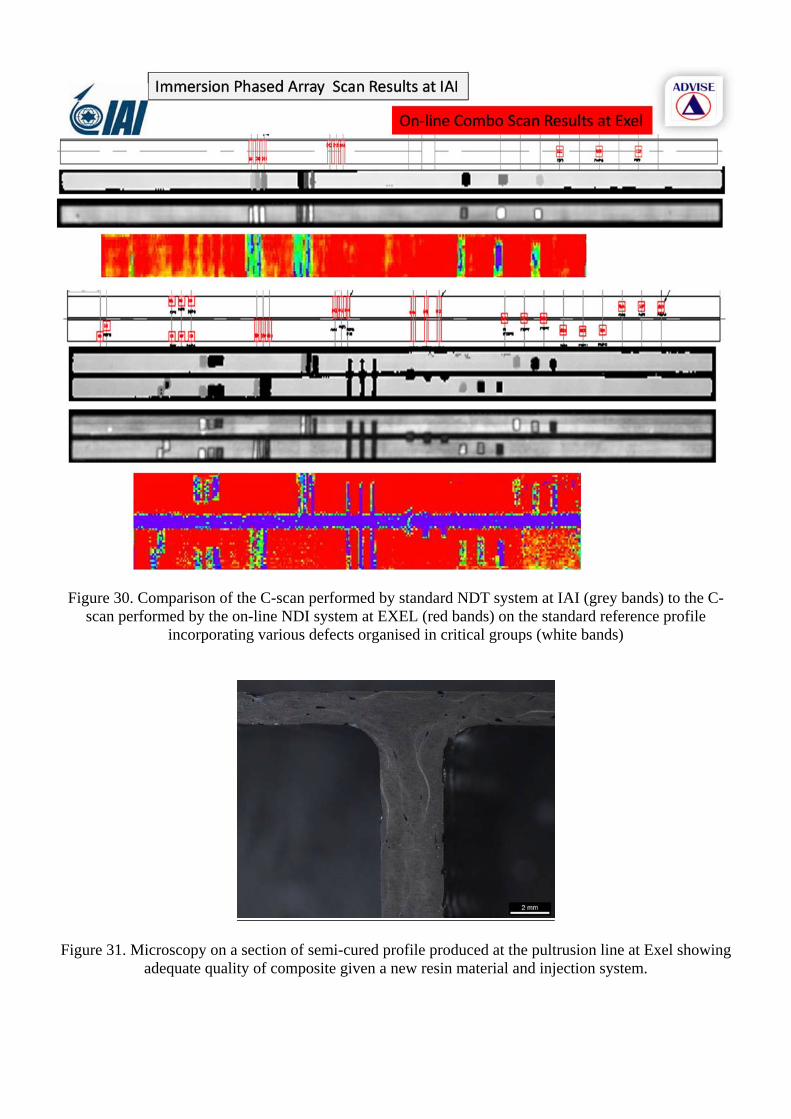
Figure 30. Comparison of the C-scan performed by standard NDT system at IAI (grey bands) to the C-scan performed by the on-line NDI system at EXEL (red bands) on the standard reference profile
incorporating various defects organised in critical groups (white bands)
Figure 31. Microscopy on a section of semi-cured profile produced at the pultrusion line at Exel showing adequate quality of composite given a new resin material and injection system.

Figure 32. Comparison of C-scans from profiles based on the selected resin (left) and standard production epoxy (right) as created by the on-line NDI system operating on the new pultrusion line
Figure 33. Installed resin injection manifold (left), infeed in front of the manifold (centre) for the production of PUL-AERO profiles, which are exiting the die (right).
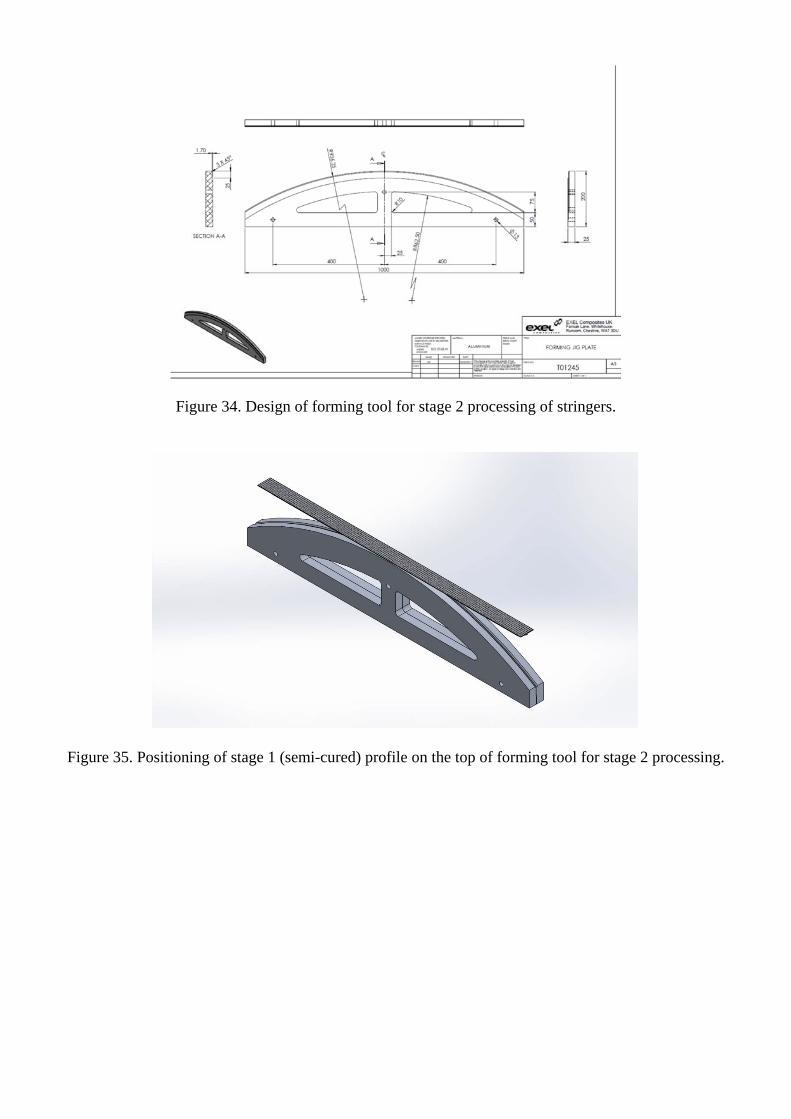
Figure 34. Design of forming tool for stage 2 processing of stringers.
Figure 35. Positioning of stage 1 (semi-cured) profile on the top of forming tool for stage 2 processing.
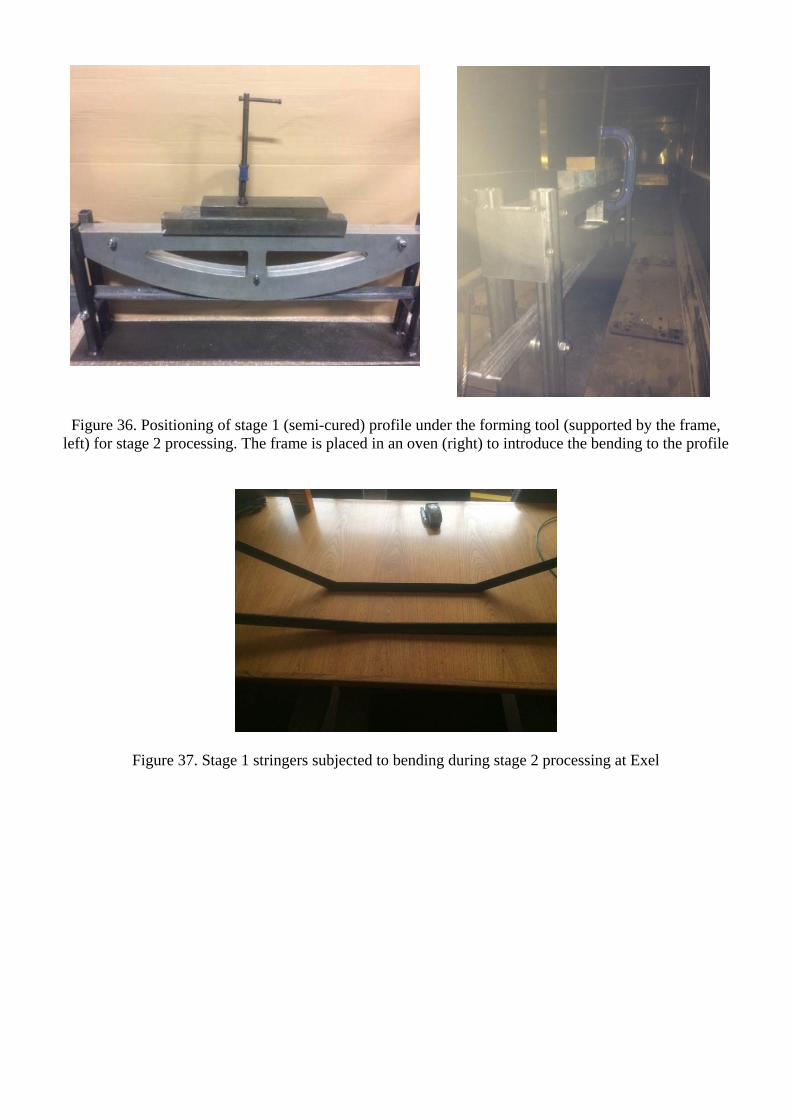
Figure 36. Positioning of stage 1 (semi-cured) profile under the forming tool (supported by the frame,
left) for stage 2 processing. The frame is placed in an oven (right) to introduce the bending to the profile
Figure 37. Stage 1 stringers subjected to bending during stage 2 processing at Exel
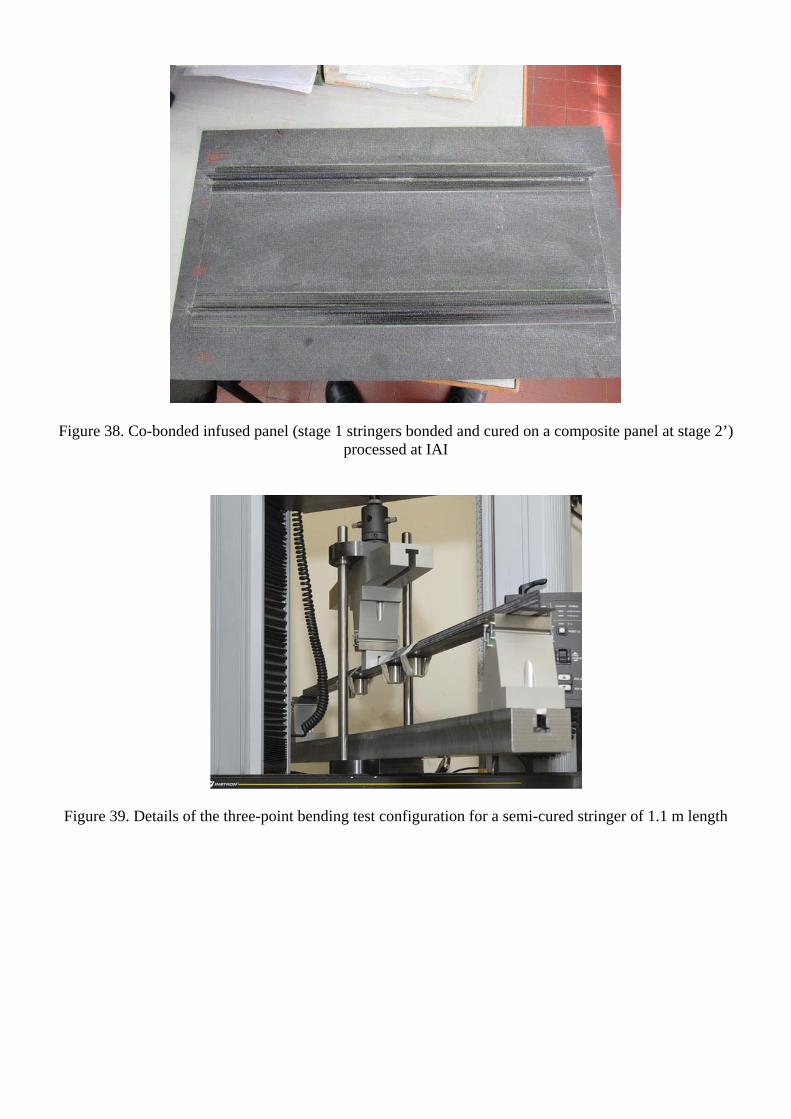
Figure 38. Co-bonded infused panel (stage 1 stringers bonded and cured on a composite panel at stage 2’) processed at IAI
Figure 39. Details of the three-point bending test configuration for a semi-cured stringer of 1.1 m length