Figure 1(b) - Location Map for the Greater Brisbane area. of Meteorology - Queensland Abstract On 9...
54
The Southeast Queensland Flash Flood Event of 9 March 2001 Catherine Muller (Severe Weather Section) & Terry Malone (Hydrology Section) Bureau of Meteorology - Queensland Abstract On 9 March 2001, between about 0500 UTC and 1200 UTC, (3PM and 10PM local time), a line of thunderstorms became almost stationary over the Queensland Southeast Coast District, producing local heavy rainfall and flash flooding from the Sunshine Coast to the Gold Coast. As at 27 March 2001, the Insurance Council of Australia estimated that the insured losses would total approximately $35 Million, consisting of up to 8000 claims. An investigation was conducted into the meteorological aspects of the flash flood event which devastated several suburbs of Brisbane and parts of the Gold Coast, Logan City and the Sunshine Coast. This report includes an analysis of the rainfall data recorded during the thunderstorms. It aims to document the meteorological conditions surrounding the event and identifies the focussing mechanisms which concentrated such high rainfall across the Southeast Coast District. Introduction During the afternoon and evening of 9 March 2001, thunderstorm activity brought intense rainfall to the Queensland Southeast Coast district. (Location maps, with place names used in the text, are given in Fig. 1). The intensity of the rainfall increased markedly at about 0500 UTC at the Gold Coast. Subsequent flash flooding affected the Gold Coast and Logan City. Heavy rain then fell over Brisbane City, producing areas of flash flooding there, particularly across southern suburbs but also in the east and north. The Sunshine Coast recorded its heaviest rainfall later in the evening. Intense rainfall was observed across the district for a duration of approximately 6 hours.
Transcript of Figure 1(b) - Location Map for the Greater Brisbane area. of Meteorology - Queensland Abstract On 9...

The Southeast Queensland Flash Flood Event of 9 March 2001
Catherine Muller (Severe Weather Section) & Terry Malone (Hydrology Section)
Bureau of Meteorology - Queensland
Abstract
On 9 March 2001, between about 0500 UTC and 1200 UTC, (3PM and 10PM local time), a line
of thunderstorms became almost stationary over the Queensland Southeast Coast District,
producing local heavy rainfall and flash flooding from the Sunshine Coast to the Gold Coast.
As at 27 March 2001, the Insurance Council of Australia estimated that the insured losses
would total approximately $35 Million, consisting of up to 8000 claims.
An investigation was conducted into the meteorological aspects of the flash flood event which
devastated several suburbs of Brisbane and parts of the Gold Coast, Logan City and the
Sunshine Coast.
This report includes an analysis of the rainfall data recorded during the thunderstorms. It aims
to document the meteorological conditions surrounding the event and identifies the focussing
mechanisms which concentrated such high rainfall across the Southeast Coast District.
Introduction
During the afternoon and evening of 9 March 2001, thunderstorm activity brought intense
rainfall to the Queensland Southeast Coast district. (Location maps, with place names used in
the text, are given in Fig. 1). The intensity of the rainfall increased markedly at about 0500 UTC
at the Gold Coast. Subsequent flash flooding affected the Gold Coast and Logan City. Heavy
rain then fell over Brisbane City, producing areas of flash flooding there, particularly across
southern suburbs but also in the east and north. The Sunshine Coast recorded its heaviest
rainfall later in the evening. Intense rainfall was observed across the district for a duration of
approximately 6 hours.
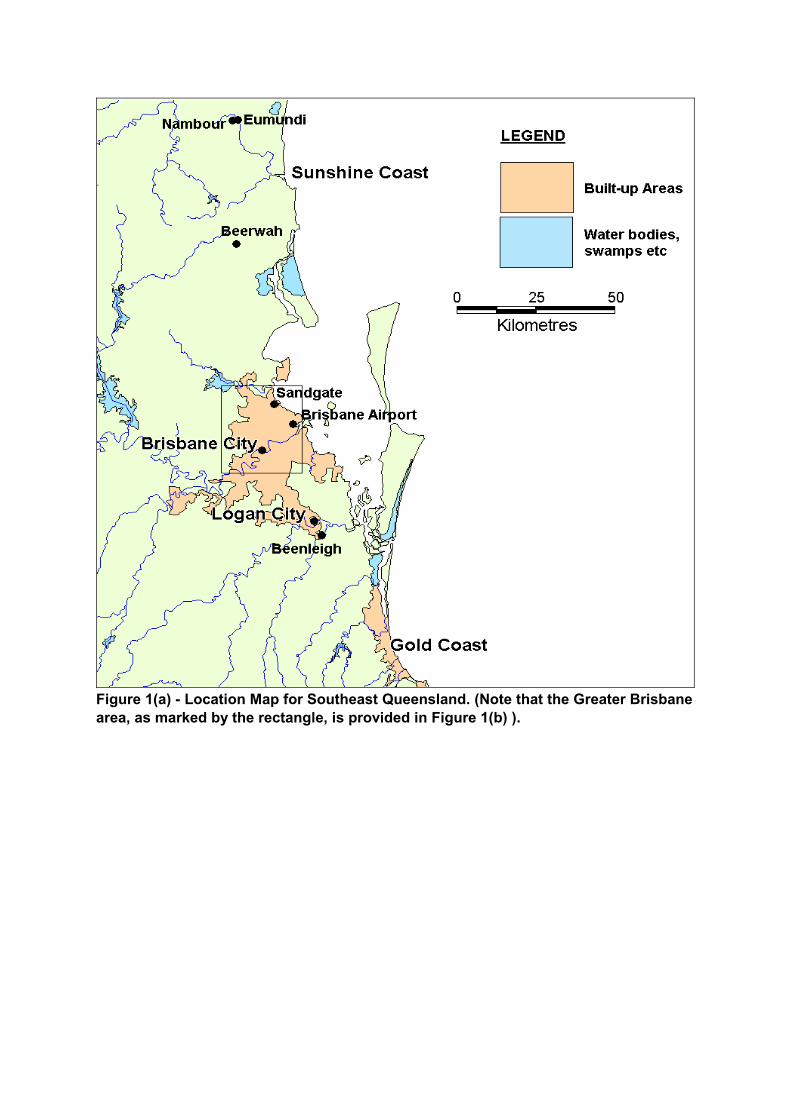
Figure 1(a) - Location Map for Southeast Queensland. (Note that the Greater Brisbanearea, as marked by the rectangle, is provided in Figure 1(b) ).

Figure 1(b) - Location Map for the Greater Brisbane area.

The thunderstorms were produced in convergent rain bands extending from a surface low
located near the Queensland - New South Wales border. The storms became almost stationary
in a broken line parallelling the coast.
Several factors, which are discussed in greater detail in later sections, were believed to have
contributed to the intense rainfall. These included:
1. Strong convergence in the low levels of the atmosphere, in the vicinity of Brisbane, and
increased moisture (high dewpoint air) in the same layer.
2. An increased thermal gradient in the mid-levels (at 500 hPa) over Southeast
Queensland. This was considered indicative of the advection of Potential Vorticity (PV)
into the area, which in turn disrupted the thermal balance, thereby creating vertical
motion.
3. The re-alignment of a trough in the mid-levels between 0500 and 1100 UTC on 9
March, which led to a decrease in the northwesterly steering of the convective storms
over the Southeast Coast district.
4. A backing in direction of the winds with height in the Brisbane area.
5. Increased upper level divergence over Southeast Queensland.
6. An estimated warm cloud depth of greater than 5000 metres.
Sources of Data
The primary source of data for this report was the record of meteorological data and analyses
held by the Bureau of Meteorology, Brisbane. Rainfall data was also sourced from ALERT
systems of Gold Coast City, Logan City, Brisbane City, Ipswich City, Caboolture Shire and
Maroochy Shire Councils and also from South East Queensland Water Corporation. The data
set included rainfall data, surface and upper air observations and analyses, satellite pictures
and digital radar imagery. Numerical model rainfall data was also examined, in order to assess
the performance of the models for this event.
Impact
The heavy rainfall and subsequent flash flooding caused extensive damage throughout the
Southeast Coast district. As at 27 March 2001, The Insurance Council of Australia (ICA)
estimated that the insured losses would total approximately $35 Million, and consist of up to
about 8000 claims.

Some of the impacts of the storms are listed below, and are grouped according to location.
(Fig.2 shows some images from the event).
Gold Coast and Logan City:
A 50 year old man was drowned during the early morning hours of Sunday 11 March, when the
car in which he was a passenger was swept off a road near Logan.
Many homes and businesses were damaged by flash flooding.
Flooding at Beenleigh also led to four houses being inundated with sewage.
Brisbane City:
A 12 year old boy was confirmed drowned, after having been swept away by flood waters on
the evening of 9 March, when a car being driven by his mother was washed off a road at
Lawnton (in Brisbane’s north).
The damage inventory included hundreds of cars, many shops and offices, and up to 600
homes.
Stones Corner, a suburb in inner-eastern Brisbane, was one of the worst hit areas. Metre-deep
flooding entered East’s League’s Club, forcing 50 patrons to be evacuated. About 30 cars were
submerged in the club car park.
Many houses throughout Brisbane’s southern suburbs were also flooded. Over 100 homes were
inundated in Wishart (southern suburb) alone. Heavy rain downed powerlines at Annerley,
Woolloongabba, Greenslopes and Holland Park. A block of flats at Greenslopes had the roof
torn off. Cars that were stalled on flooded roads caused peak-hour traffic chaos. Many cars that
had been left in flooded streets floated away. A car dealership in Salisbury reported damage
to about 50 vehicles.
Three flights were diverted from Brisbane Airport to the Amberley RAAF Base after lights along
the Brisbane runway went out (due to lightning).

Figure 2 - Images from the Flash Flood Event (Courtesy of Channel 7 Brisbane), at (a) the
suburb of Aspley and (b) at East’s Leagues Club.
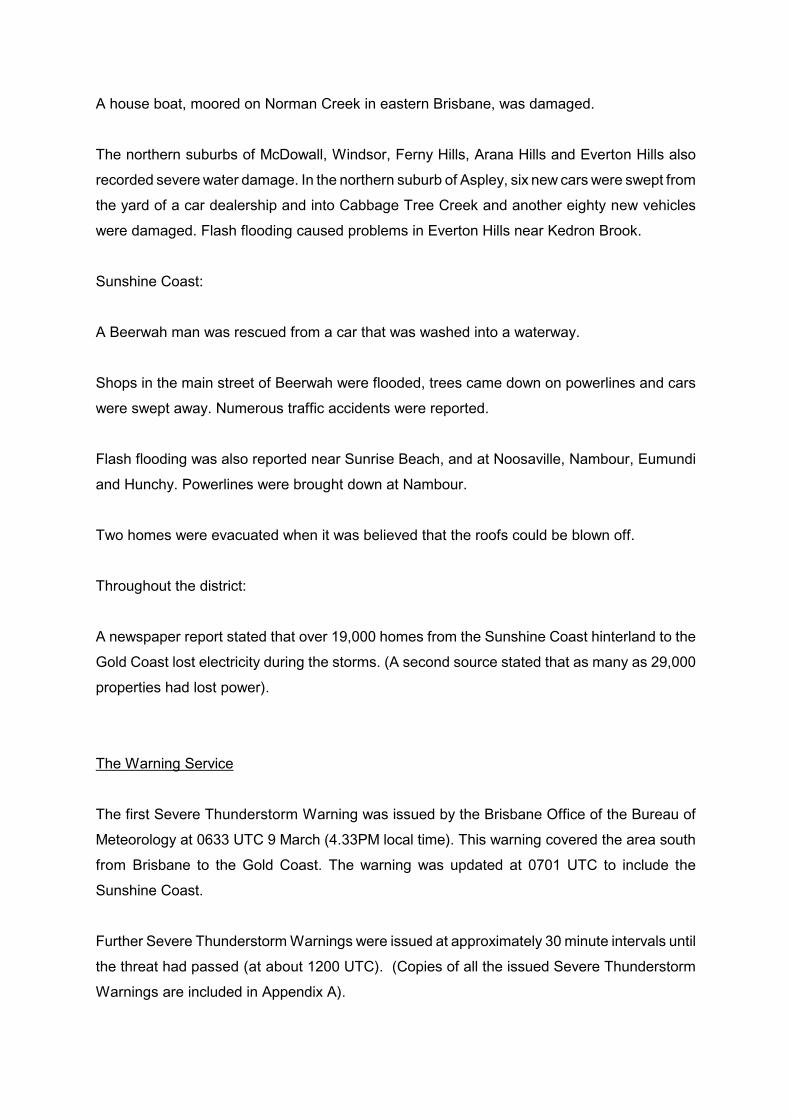
A house boat, moored on Norman Creek in eastern Brisbane, was damaged.
The northern suburbs of McDowall, Windsor, Ferny Hills, Arana Hills and Everton Hills also
recorded severe water damage. In the northern suburb of Aspley, six new cars were swept from
the yard of a car dealership and into Cabbage Tree Creek and another eighty new vehicles
were damaged. Flash flooding caused problems in Everton Hills near Kedron Brook.
Sunshine Coast:
A Beerwah man was rescued from a car that was washed into a waterway.
Shops in the main street of Beerwah were flooded, trees came down on powerlines and cars
were swept away. Numerous traffic accidents were reported.
Flash flooding was also reported near Sunrise Beach, and at Noosaville, Nambour, Eumundi
and Hunchy. Powerlines were brought down at Nambour.
Two homes were evacuated when it was believed that the roofs could be blown off.
Throughout the district:
A newspaper report stated that over 19,000 homes from the Sunshine Coast hinterland to the
Gold Coast lost electricity during the storms. (A second source stated that as many as 29,000
properties had lost power).
The Warning Service
The first Severe Thunderstorm Warning was issued by the Brisbane Office of the Bureau of
Meteorology at 0633 UTC 9 March (4.33PM local time). This warning covered the area south
from Brisbane to the Gold Coast. The warning was updated at 0701 UTC to include the
Sunshine Coast.
Further Severe Thunderstorm Warnings were issued at approximately 30 minute intervals until
the threat had passed (at about 1200 UTC). (Copies of all the issued Severe Thunderstorm
Warnings are included in Appendix A).

A Flood Warning for Brisbane Metropolitan Creeks was issued at 0914 UTC 9 March, renewed
at 1014 UTC and later finalised at 1122 UTC. (Refer to Appendix B).
Analysis of the Rainfall Data
1. Rainfall Totals
Rainfall totals for the 24 hours to 2300 UTC 9 March 2001 (9AM Saturday 10 March 2001 local
time) are shown in Table 1.
ALERT rainfall stations are 300mm in diameter and have a 1mm tipping bucket. Each 1mm is
reported by radio directly to a receiving base station at the local authority and to the Bureau’s
office in Brisbane. TM rainfall stations are 203mm in diameter with a 0.2mm tipping bucket.
Data is collected from these stations regularly by telephone. Daily stations have a standard
203mm diameter rain gauge and are manually read and reported at 2300 UTC (9AM local time)
each day. The logger stations are 203mm in diameter and record every 0.2 mm. The logger
stations are not available in real time and as such were downloaded after the event.
An analysis of the rainfall totals in the 24 hours to 2300 UTC 9 March 2001 in the coastal region
from Pomona to the Gold Coast (Refer to Fig. 3) clearly showed 5 areas or centres of heaviest
rainfall:
(1) On the Gold Coast centred around Carrara with a total of 176mm
(2) At Beenleigh where 317mm was recorded at the Bowling Club
(3) In the northern suburbs of Brisbane where 187mm was recorded at Everton Hills
(4) A tongue of nearly 200 mm between Landsbrough and Nambour, and
(5) An area up to 230mm centred between Ball Lookout and Cooroy.

Table 1 - Total Rainfall (mm) for the 24 hours to 2300 UTC 9 March 2001.
Bureau
No
Alert ID Region Station Type Total
540319 2345 South Coast Carrara ALERT 176
540238 2259 South Coast Loder Creek ALERT 134
040881 2255 South Coast Air Sea Rescue ALERT 121
040345 2279 South Coast Luscombe ALERT 202
040854 6234 Logan-Albert Wolffdene ALERT 261
040878 6230 Logan-Albert Waterford ALERT 214
540233 6210 Logan-Albert Millers Road Underwood ALERT 209
540079 6220 Logan-Albert Reserve Park Slacks Creek ALERT 233
540078 6215 Logan-Albert First Avenue Marsden ALERT 251
540237 6255 Logan-Albert Bega Road ALERT 225
540091 6225 Logan-Albert Loganlea Rd Slacks Creek ALERT 198
040854 - Logan-Albert Logan City WTP Logger 280
040406 - Logan-Albert Beenleigh Bowls Logger 317
040784 2114 Brisbane Calamvale ALERT 178
040791 2130 Brisbane Coopers Plain ALERT 174
040790 2138 Brisbane Mt Gravatt ALERT 218
540135 1833 Brisbane Holland Park ALERT 187
540134 1548 Brisbane Holland Park West ALERT 206
540133 1551 Brisbane Greenslopes ALERT 176
540132 1554 Brisbane East Brisbane ALERT 166
540125 1836 Brisbane Eight Mile Plains ALERT 239
540128 1706 Brisbane Carindale ALERT 175
540240 1596 Brisbane Camp Hill ALERT 167
540126 1830 Brisbane Mansfield ALERT 184
540103 2029 Brisbane Morningside ALERT 154
540198 2015 Brisbane Brisbane City ALERT 107
540284 1598 Brisbane Gordon Park ALERT 146
540130 1524 Brisbane Bowen Hills ALERT 128

540203 6763 Pine Petrie ALERT 144
540105 6769 Pine Drapers Crossing ALERT 137
540121 1712 Pine Bracken Ridge Road ALERT 177
540114 1572 Pine Everton Hills ALERT 187
540122 1566 Pine Aspley Resevoir ALERT 182
540136 1715 Pine Zillmere ALERT 171
040117 - Mooloolah Landsborough Daily 199
540222 6403 Maroochy Eudlo ALERT 197
040282 - Maroochy Nambour DPI Logger 195
540137 6425 Maroochy Nambour ALERT 148
540083 6418 Maroochy Nelsons ALERT 121
540136 6485 Maroochy Eerwah Vale ALERT 129
540084 6480 Maroochy Ball Lookout ALERT 218
040800 7104 Mary Cooroy TM 232
040806 7105 Mary Pomona TM 168
On the Gold Coast, the highest rainfall in the 24 hour period was recorded at the Carrara
ALERT station with a total of 176mm. Rainfall totals in excess of 150mm seemed to be in a
radius of about 5 kilometres around Carrara. Just 10 kilometres to the south and west of
Carrara, totals were less than 50mm.
While the highest totals were centred in the Beenleigh area, the area of rainfall in excess of 100
mm extended from the Pimpama River in the south to Burpengary in the north and covered a
strip up to 20 kilometres wide. In a line from Beenleigh to East Brisbane totals ranged from
over 300 to 150mm at the north extent of this area and covered the catchments of Slacks and
Scrubby Creeks, the upper reaches of Bulimba Creek and Norman and Stable Swamp Creeks.
In the north Brisbane suburbs, the highest totals were in the Everton Hills area where a total of
187mm was recorded. Totals in excess of 150mm were recorded in a 5 kilometre wide strip
between Everton Hills and Petrie.
Nearly 200 mm was recorded in a narrow band from Landsbrough to Nambour, while another
area centred on Cooroy recorded similar amounts.
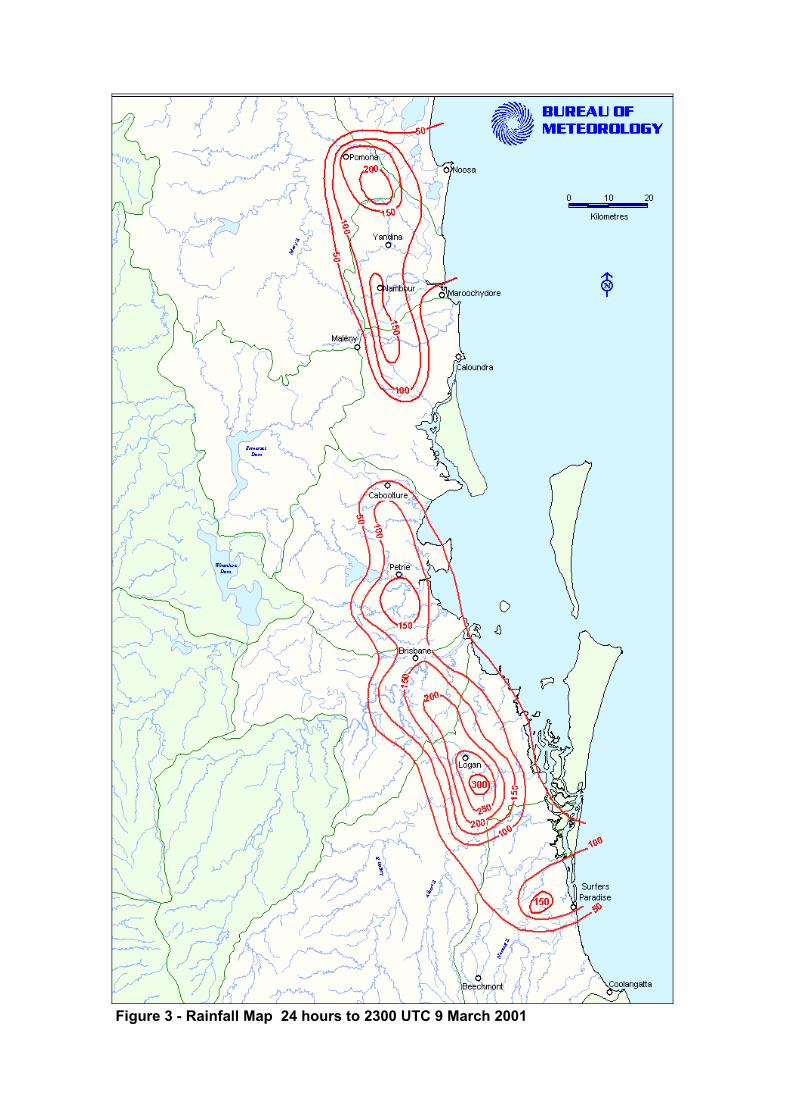
Figure 3 - Rainfall Map 24 hours to 2300 UTC 9 March 2001

2. Rainfall Temporal Patterns
Table 2 shows the hourly rainfalls recorded at selected stations from 0400 UTC to 1100 UTC,
9 March 2001. Some locally heavy falls were recorded in the first hour to 0500 UTC on the
Gold Coast and at Beenleigh. However, generally the heavier falls did not commence until
0500 UTC in Slacks and Scrubby Creeks, while for the Brisbane Creeks the heavier falls did
not commence until about 0630 UTC.
Table 2 - Hourly Rainfalls 9 March 2001 (mm in the hour to the time shown).
Bureau
No
Station 0500
UTC
0600
UTC
0700
UTC
0800
UTC
0900
UTC
1000
UTC
1100
UTC
540319 Carrara 22 33 108 0 1 3 0
540238 Loder Creek 13 66 40 0 1 2 0
040881 Air Sea Rescue 29 73 5 0 0 3 1
040345 Luscombe 25 24 76 51 6 0 0
040854 Wolffdene 4 31 96 106 17 1 0
040878 Waterford 7 56 67 35 41 6 0
540233 Millers Road Underwood 7 62 73 37 21 8 0
540079 Reserve Park Slacks
Creek
9 54 65 46 42 14 1
540078 First Avenue Marsden 21 92 70 28 30 9 0
540237 Bega Road 16 66 65 27 39 11 0
540091 Loganlea Rd Slacks
Creek
4 36 54 37 51 16 1
040854 Logan City WTP 9 11 80 75 7 1 0
040406 Beenleigh Bowls 42 11 114 90 38 5 0
040784 Calamvale 0 29 94 42 10 2 0
040791 Coopers Plain 0 10 94 56 13 0 1
040790 Mt Gravatt 0 17 70 91 32 5 2
540135 Holland Park 1 2 36 98 33 12 2
540134 Holland Park West 0 8 56 111 22 6 3
540133 Greenslopes 0 1 32 114 17 5 2
540132 East Brisbane 0 0 24 102 25 11 3
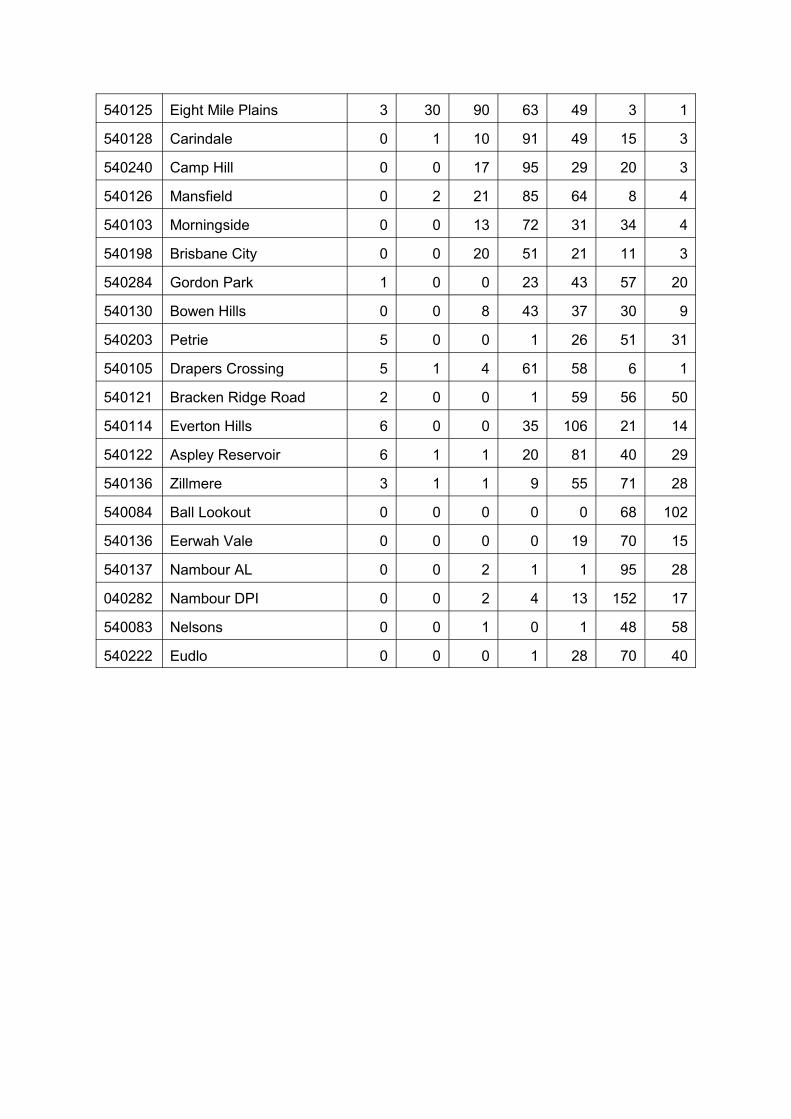
540125 Eight Mile Plains 3 30 90 63 49 3 1
540128 Carindale 0 1 10 91 49 15 3
540240 Camp Hill 0 0 17 95 29 20 3
540126 Mansfield 0 2 21 85 64 8 4
540103 Morningside 0 0 13 72 31 34 4
540198 Brisbane City 0 0 20 51 21 11 3
540284 Gordon Park 1 0 0 23 43 57 20
540130 Bowen Hills 0 0 8 43 37 30 9
540203 Petrie 5 0 0 1 26 51 31
540105 Drapers Crossing 5 1 4 61 58 6 1
540121 Bracken Ridge Road 2 0 0 1 59 56 50
540114 Everton Hills 6 0 0 35 106 21 14
540122 Aspley Reservoir 6 1 1 20 81 40 29
540136 Zillmere 3 1 1 9 55 71 28
540084 Ball Lookout 0 0 0 0 0 68 102
540136 Eerwah Vale 0 0 0 0 19 70 15
540137 Nambour AL 0 0 2 1 1 95 28
040282 Nambour DPI 0 0 2 4 13 152 17
540083 Nelsons 0 0 1 0 1 48 58
540222 Eudlo 0 0 0 1 28 70 40

(b) Temporal Rainfall Pattern for Marsden - 9 March 2001
0
10
20
30
40
50
60
4:15
4:30
4:45
5:00
5:15
5:30
5:45
6:00
6:15
6:30
6:45
7:00
7:15
7:30
7:45
8:00
8:15
8:30
8:45
9:00
9:15
9:30
9:45
10:0
0
10:1
5
10:3
0
10:4
5
11:0
0
Time (UTC)
Rai
nfal
l (m
m)
(a) Temporal Rainfall Pattern for Carrara - 9 March 2001
0
10
20
30
40
50
60
4:15
4:30
4:45
5:00
5:15
5:30
5:45
6:00
6:15
6:30
6:45
7:00
7:15
7:30
7:45
8:00
8:15
8:30
8:45
9:00
9:15
9:30
9:45
10:0
0
10:1
5
10:3
0
10:4
5
11:0
0
Time (UTC)
Rai
nfal
l (m
m)
Figure 4 - Temporal Rainfall Patterns for 9 March 2001 for (a) Carrara, (b) Marsden, (c)
Mt Gravatt and (d) Everton Hills. (Note that all times are in UTC).

(c) Temporal Rainfall Pattern for Mt Gravatt - 9 March 2001
0
10
20
30
40
50
60
4:15
4:30
4:45
5:00
5:15
5:30
5:45
6:00
6:15
6:30
6:45
7:00
7:15
7:30
7:45
8:00
8:15
8:30
8:45
9:00
9:15
9:30
9:45
10:0
0
10:1
5
10:3
0
10:4
5
11:0
0
Tiime (UTC)
Rai
nfal
l (m
m)
(d) Temporal Rainfall Pattern for Everton Hills - 9 March 2001
0
10
20
30
40
50
60
4:15
4:30
4:45
5:00
5:15
5:30
5:45
6:00
6:15
6:30
6:45
7:00
7:15
7:30
7:45
8:00
8:15
8:30
8:45
9:00
9:15
9:30
9:45
10:0
0
10:1
5
10:3
0
10:4
5
11:0
0
Time (UTC)
Rai
nfal
l (m
m)
Figure 4 continued - Temporal Rainfall Patterns for (c) Mt Gravatt and (d) Everton Hills.
3. Rainfall Frequencies
Intensity-frequency-duration (IFD) analyses of the rainfalls recorded at Carrara, Marsden, Mt
Gravatt and Everton Hills are summarised in Table 3 (a) - (d) and are shown diagrammatically
on the design IFD curves in Fig. 5(a)-(d). For a full description on the calculation of IFD design
rainfall curves, refer to The Institution of Engineers Australia, (1987).

Table 3 - Intensity-Frequency-Duration Analyses. (Note that the column ‘End Time’ is the
time in UTC on 9 March 2001. ARI is the Average Recurrence Interval).
(a) Carrara
Period Rainfall
(mm)
End
Time
ARI
(years)
5 min 20 0630 10-20
10 min 34 0630 20-50
15 min 50 0630 100
30 min 88 0635 >100
1 hr 122 0640 >100
2 hr 146 0645 >100
3 hr 165 0645 >100
6 hr 168 0950 20-50
12 hr 172 1105 5-10
(c) Mt Gravatt
Period Rainfall
(mm)
End
Time
ARI
(years)
5 min 13 0655 2-5
10 min 25 0655 5-10
15 min 37 0700 10-20
30 min 68 0710 50
1 hr 128 0735 >100
2 hr 171 0835 >100
3 hr 201 0840 >100
6 hr 216 1045 >100
12 hr 217 1050 20-50
(b) Marsden
Period Rainfall
(mm)
End
Time
ARI
(years)
5 min 11 0535 1-2
10 min 22 0540 2-5
15 min 32 0540 5-10
30 min 55 0540 20
1 hr 94 0545 50-100
2 hr 164 0655 >100
3 hr 207 0740 >100
6 hr 250 0930 >100
12 hr 251 1630 >100
(d) Everton Hills
Period Rainfall
(mm)
End
Time
ARI
(years)
5 min 13 0830 2-5
10 min 25 0835 5-10
15 min 37 0840 10-20
30 min 69 0840 20-50
1 hr 116 0845 >100
2 hr 153 0935 >100
3 hr 170 1035 >100
6 hr 177 1105 20-50
12 hr 187 1105 10-20

ALERT Id: 2345 Carrara
0.1
1.0
10.0
100.0
1000.0
0.1 1.0 10.0 100.0
Duration (hrs)
Ave
rage
Inte
nsity
(mm
/hr)
1 Year 2 Year 5 Year 10 Year 20 Year 50 Year 100 Year Mar-01
ALERT Id: 6215 Marsden
0
1
10
100
1000
0.1 1.0 10.0 100.0
Duration (hrs)
Ave
rage
Inte
nsity
(mm
/hr)
1 Year 2 Year 5 Year 10 Year 20 Year 50 Year 100 Year Mar-01
Figure 5 - IFD Curves for (a) Carrara, (b) Marsden, (c) Mt Gravatt and (d) Everton Hills.

ALERT Id: 2138 Mt Gravatt
0.1
1.0
10.0
100.0
1000.0
0.1 1.0 10.0 100.0
Duration (hrs)
Ave
rage
Inte
nsity
(mm
/hr)
1 Year 2 Year 5 Year 10 Year 20 Year 50 Year 100 Year Mar-01
ALERT Id: 1572 Everton Hills
0.1
1.0
10.0
100.0
1000.0
0.1 1.0 10.0 100.0
Duration (hrs)
Ave
rage
Inte
nsity
(mm
/hr)
1 Year 2 Year 5 Year 10 Year 20 Year 50 Year 100 Year Mar-01
Figure 5 continued - IFD Curves for (c) Mt Gravatt and (d) Everton Hills.

Mean Sea Level Analyses
On Sunday 4 March 2001, a low pressure system formed in the eastern Tasman Sea near
latitude 30 degrees south. The low moved northwest while deepening and by 2300 UTC 5
March was east of Brisbane. A large high in the Tasman Sea then moved east towards New
Zealand weakening the pressure gradient and the winds along the coast south of Brisbane.
Meanwhile the low continued to slowly deepen.
On 7 March 2001, the low slowed its movement towards the coast and was observed to
weaken.
(Refer to Fig. 6(a)-(b) for MSLP analyses at 1200 UTC on 6 and 7 March 2001).
The low began to accelerate and re-intensify on 8 March as it moved southwestward towards
the New South Wales coast. Later the same afternoon, the low peaked in intensity and began
a northwest track before crossing the New South Wales coast between Byron Bay and Ballina
the same evening. (See Fig. 6(c)).
By 2300 UTC 8 March 2001, the low was centred near Warwick with a central pressure of about
1005 hPa. A trough of low pressure extended from the low through Gayndah to Biloela. The
Brisbane region marked the location of low level confluent flow. To the north the flow was
predominantly north to northeasterly on the eastern flank of the surface trough, and to the south
there were fresh to strong easterly winds due to an intensifying high pressure system over the
Tasman Sea.
By 0200 UTC 9 March 2001, the low had moved further inland and was now centred just to the
northeast of Goondiwindi with a central pressure of about 1006 hPa. East to northeasterly winds
along the southeast coast of Queensland saw the dewpoints rise to be in the low- to mid-
twenties throughout the Southeast Coast district.
The low continued to track a little further to the west over the next 3 hours. At 0500 UTC, a
zone of low level convergence (confluence and deceleration) was evident over the Southeast
Coast district. In addition to this, dewpoints were as high as 24 to 25�C in places. (MSLP
analyses for 9 March 2001 are given in Fig. 7).
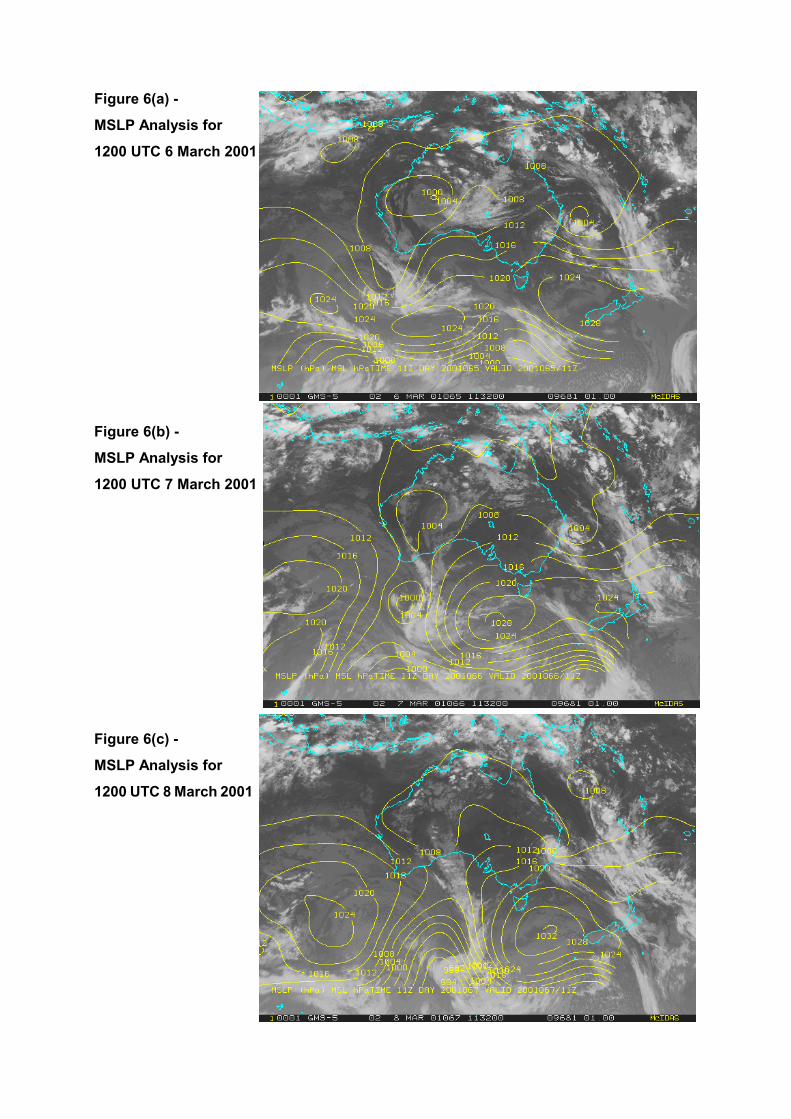
Figure 6(a) -
MSLP Analysis for
1200 UTC 6 March 2001
Figure 6(b) -
MSLP Analysis for
1200 UTC 7 March 2001
Figure 6(c) -
MSLP Analysis for
1200 UTC 8 March 2001

Figure 7 - MSLP analyses for Southeast Queensland (in 3 hourly time steps) for 2300 UTC
8 March 2001 to 1100 UTC 9 March 2001.

200 hPa Analyses
The Southeast Coast district was located to the east of a trough at the 200 hPa level. At 2300
UTC 8 March 2001, an upper level low was located to the southwest of the region. By 1100 UTC
9 March, a closed low was not detectable and the trough had relaxed slightly (i.e. the 200 hPa
geopotential heights over Queensland, in general, had increased). The 200 hPa analysis at
1100 UTC showed the Southeast Coast district to be in a zone of upper level divergence
(accelerating and diffluent flow), and it was therefore concluded that upper level divergence
developed/increased over the region of interest during the day.
Figure 8 - Wind Plots and Analyses of Geopotential Height at 200 hPa for (a) 2300 UTC
8 March 2001 and (b) 1100 UTC 9 March 2001.(Flag/barb/half barb denote 50/10/5 knots and height contours are in metres).
(a)
(b)

500 hPa Analyses
At 2300 UTC 8 March 2001, a 500 hPa trough was located over inland Queensland, with a low
to the southwest of Brisbane. (Refer to Fig. 9). The trough was orientated northwest-southeast.
By 1100 UTC 9 March, the low had moved a little further to the west-northwest, and as was the
case at 200 hPa, the trough had relaxed slightly. However, of greater significance was the
change in orientation of the trough axis. The 500 hPa wind at Coffs Harbour was from the north
at an estimated 10 ms-1 at 0500 UTC 9 March, but by 1100 UTC had become easterly at 2.5 ms-
1. During this period, the trough became orientated along a more west-to-east axis to the south
of Brisbane, which effectively saw a reduction in the northwesterly steering of the
thunderstorms. (Refer to Fig. 10).
Thermal analyses (temperatures and wind shears) were also considered. (Refer to Fig. 11). At
2300 UTC 8 March, a cold pool at 500 hPa was located to the west of Brisbane. By 1100 UTC,
the ‘cut-off’ pool of cold air was no-longer captured by the observation network. However, a
sharp thermal trough was analysed from Cape York Peninsula to the southeast coast of
Queensland, placing the area of interest to the east of the thermal trough. Also, the wind shears
(for the 600 hPa to 400 hPa layer) along the coast showed a marked increase in strength,
which was indicative of a strong tightening of the thermal gradient.
The tightening of the thermal gradient was considered indicative of the advection of Potential
Vorticity (PV) into the area, which disrupted the thermal balance of the atmosphere. (Refer
Hoskins et al., (1985) and Kepert). This in turn lead to the large scale vertical motion and
destabilisation over southeast Queensland.
The PV analyses at 345K and 350K were studied. (See Fig. 12 and Fig.13). At both levels, a
PV negative anomaly was seen to extend northward into the southeast Queensland area on 9
March, and in doing so ‘eroded’ a zone of positive PV. This was consistent with the advection
of PV across the Southeast Coast District. A sharpening of the isotherms was also noted from
the analyses, particularly for the 345K charts.

Figure 9 - Wind Plots and Analyses of Geopotential Height at 500 hPa for (a) 2300 UTC
8 March 2001 and (b) 1100 UTC 9 March 2001.(Flag/barb/half barb denote 50/10/5 knots and height contours are in metres).
(a)
(b)
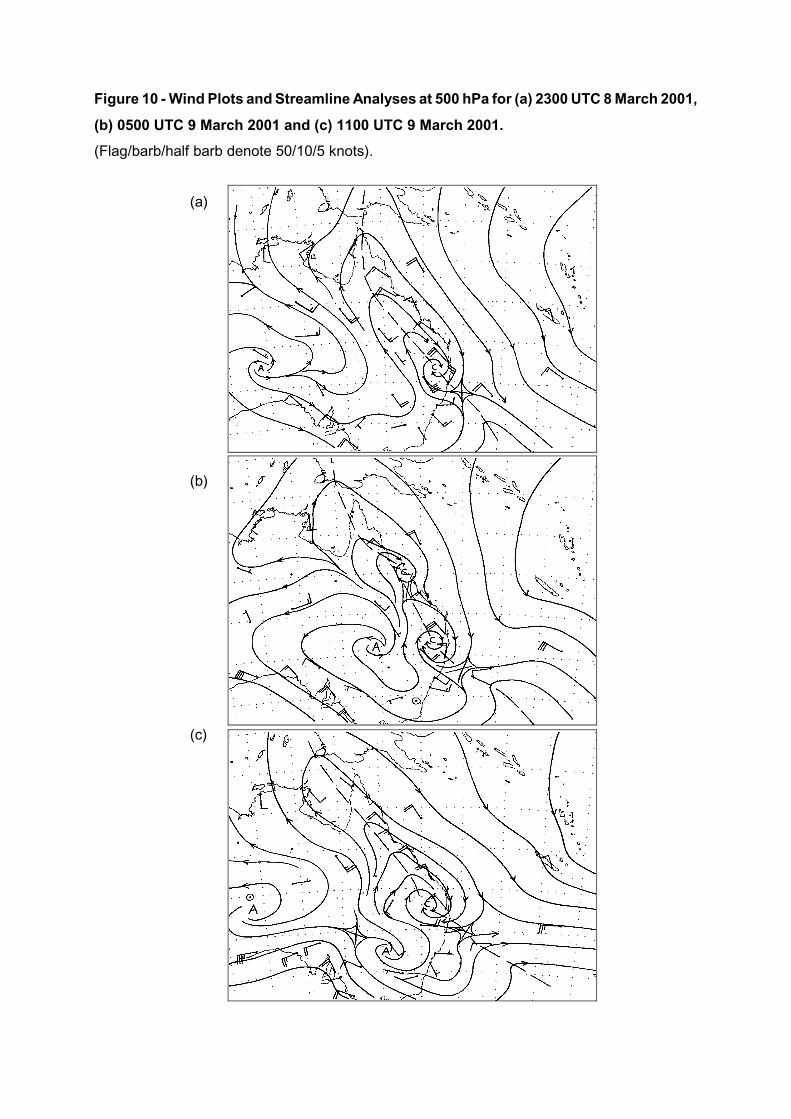
Figure 10 - Wind Plots and Streamline Analyses at 500 hPa for (a) 2300 UTC 8 March 2001,
(b) 0500 UTC 9 March 2001 and (c) 1100 UTC 9 March 2001. (Flag/barb/half barb denote 50/10/5 knots).
(a)
(b)
(c)
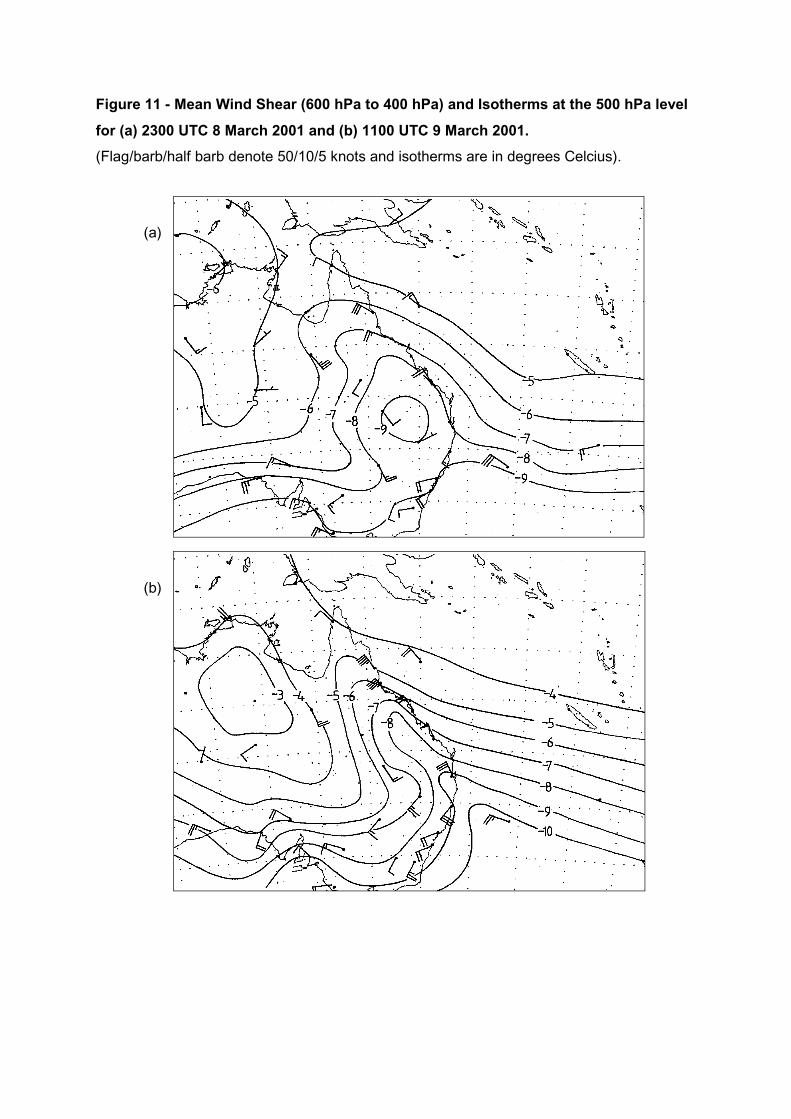
Figure 11 - Mean Wind Shear (600 hPa to 400 hPa) and Isotherms at the 500 hPa level
for (a) 2300 UTC 8 March 2001 and (b) 1100 UTC 9 March 2001.(Flag/barb/half barb denote 50/10/5 knots and isotherms are in degrees Celcius).
(a)
(b)

Figure 12 - Analyses of Potential Vorticity at 345K at (a) 2300 UTC 7 March 2001, (b)
1100 UTC 8 March 2001, (c) 2300 UTC 8 March 2001 and (d) 1100 UTC 9 March 2001.
(a) (b)
(c) (d)
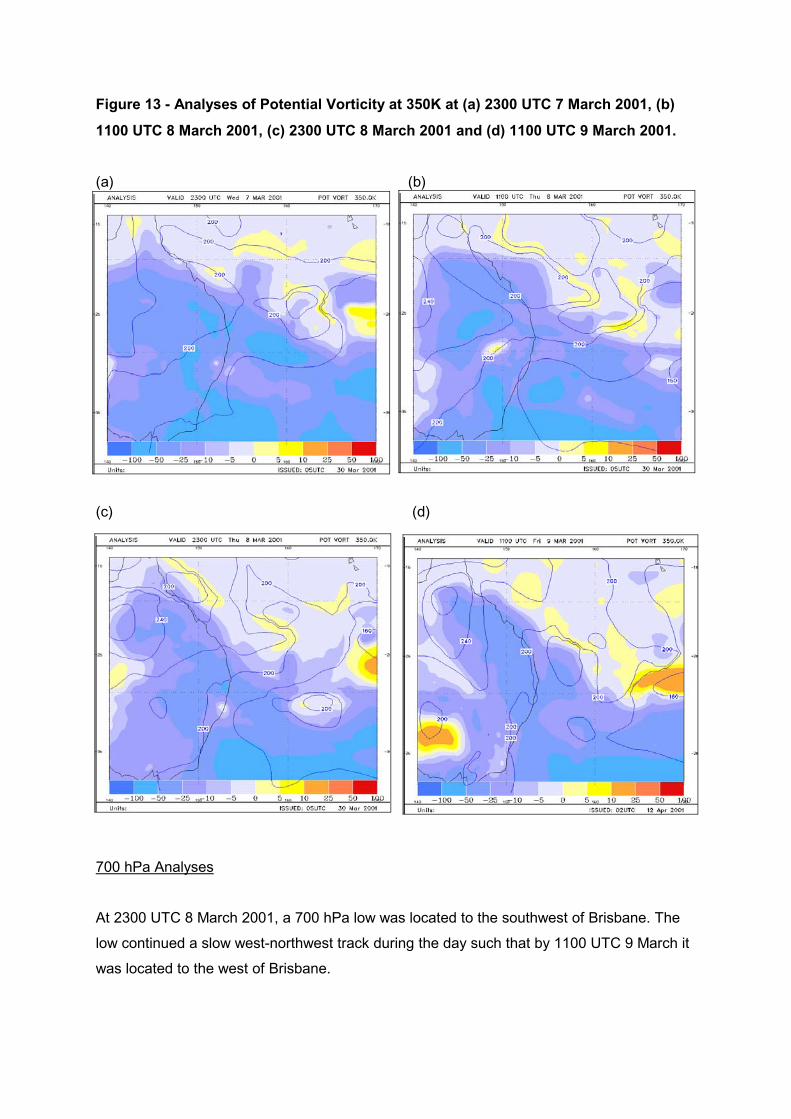
Figure 13 - Analyses of Potential Vorticity at 350K at (a) 2300 UTC 7 March 2001, (b)
1100 UTC 8 March 2001, (c) 2300 UTC 8 March 2001 and (d) 1100 UTC 9 March 2001.
(a) (b)
(c) (d)
700 hPa Analyses
At 2300 UTC 8 March 2001, a 700 hPa low was located to the southwest of Brisbane. The
low continued a slow west-northwest track during the day such that by 1100 UTC 9 March it
was located to the west of Brisbane.
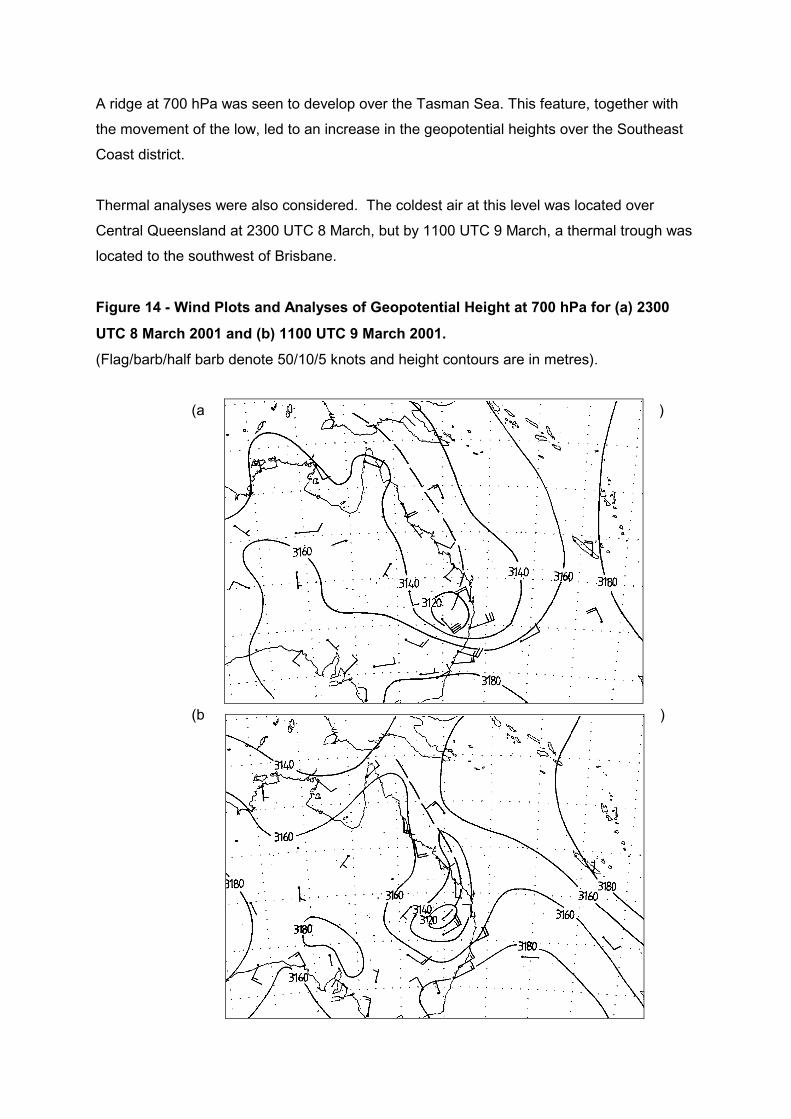
A ridge at 700 hPa was seen to develop over the Tasman Sea. This feature, together with
the movement of the low, led to an increase in the geopotential heights over the Southeast
Coast district.
Thermal analyses were also considered. The coldest air at this level was located over
Central Queensland at 2300 UTC 8 March, but by 1100 UTC 9 March, a thermal trough was
located to the southwest of Brisbane.
Figure 14 - Wind Plots and Analyses of Geopotential Height at 700 hPa for (a) 2300
UTC 8 March 2001 and (b) 1100 UTC 9 March 2001.(Flag/barb/half barb denote 50/10/5 knots and height contours are in metres).
(a )
(b )
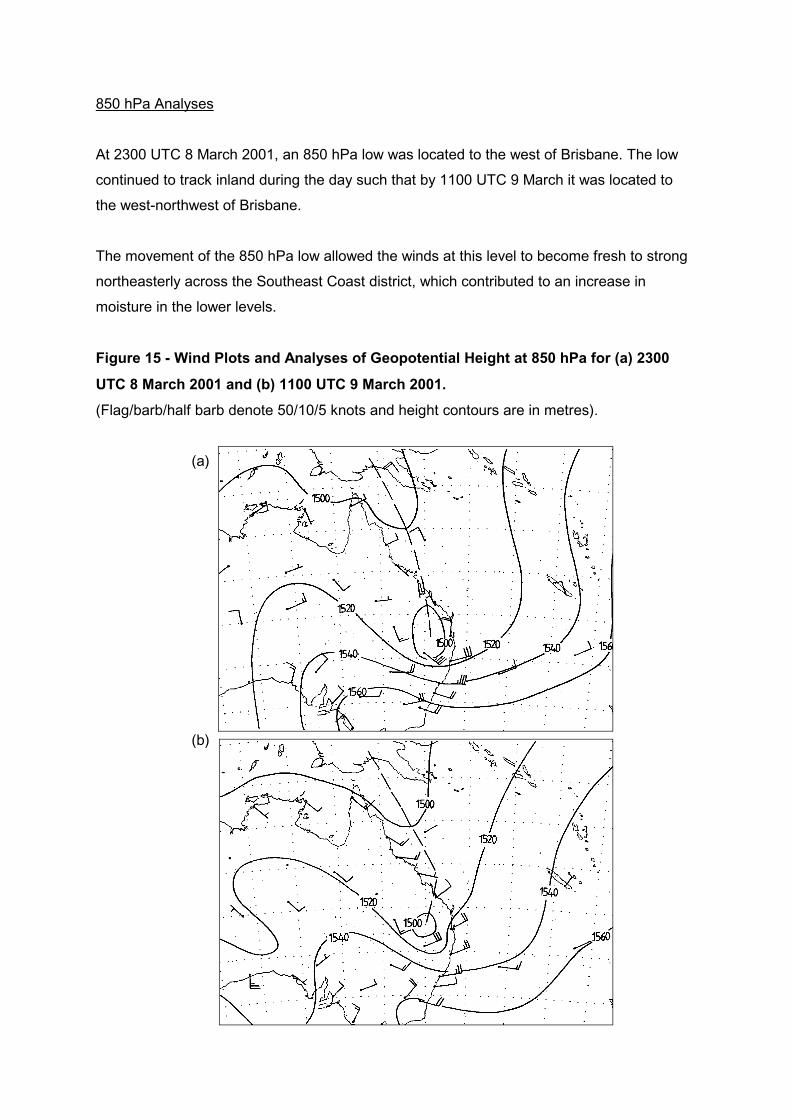
850 hPa Analyses
At 2300 UTC 8 March 2001, an 850 hPa low was located to the west of Brisbane. The low
continued to track inland during the day such that by 1100 UTC 9 March it was located to
the west-northwest of Brisbane.
The movement of the 850 hPa low allowed the winds at this level to become fresh to strong
northeasterly across the Southeast Coast district, which contributed to an increase in
moisture in the lower levels.
Figure 15 - Wind Plots and Analyses of Geopotential Height at 850 hPa for (a) 2300
UTC 8 March 2001 and (b) 1100 UTC 9 March 2001.(Flag/barb/half barb denote 50/10/5 knots and height contours are in metres).
(a)
(b)

Further Discussion on the Wind Profile
The wind profile for Brisbane Airport on 9 March 2001, at both 0100 UTC and 0500 UTC,
showed the winds to be backing with height. (Refer to Table 4). The winds in the low levels
were from the northeast quadrant, and gradually backed with height such that the middle
level winds (around 700 hPa and a little bit below) were from the north. Winds above 700
hPa were mostly from the northwest.
It is also noted here that winds below about the 700 hPa layer increased in strength
between 0100 and 0500 UTC 9 March.
Extreme heavy rainfall events in Queensland have in the past been found to be associated
with winds which back in direction with height. The direction from which these low level
winds blow from, is generally confined to the northeast quadrant.(Queensland Regional
Office - Bureau of Meteorology, 1998).
Table 4 - Observed Upper Winds for Brisbane Airport.(Note that the direction is in degrees and the wind speed is given in ms-1. For example 310-
21 is a wind from 310 degrees - a northwesterly wind - at 21 ms-1.)
Pressure
(hPa)
1700 UTC
8 March
0100 UTC
9 March
0500 UTC
9 March
1100 UTC
9 March
1700 UTC
9 March
200 310-21 325-21 315-23 325-26 310-19
300 335-08 350-13 320-18 330-25 320-15
400 325-11 335-14 285-12 330-21 340-16
500 335-19 335-16 320-16 310-08 335-10
600 320-17 330-12 320-11 290-08 295-07
700 315-16 335-10 340-09 355-06 015-03
850 330-18 345-11 360-09 060-10 090-06
925 310-12 005-06 020-11 070-09 090-04
943 310-11 015-05 025-11 070-10 095-03
1000 335-08 050-04 045-08 080-08 155-01
By 1100 UTC 9 March 2001, the low level winds were tending more east to southeasterly,

thereby losing the ‘typical’ heavy rain event wind profile. By 1700 UTC 9 March, the low level
winds were southeasterly.
The observed wind profiles were considered to be consistent with the most intense rainfall
occurring between about 0500 UTC and 1100 UTC.
Satellite Imagery
(Infared and Visible GMS imagery were studied).
At 2300 UTC 8 March 2001, the infrared image showed cloud bands to spiral into the low
pressure system. The more organised of the bands was located off the southeast
Queensland coast. This band contained embedded thunderstorms, and the cloud top
temperatures were determined to be around -40�C to -45�C.
By 0200 UTC 9 March 2001, the cloud band had moved onto the coast. Convective
elements were still evident within the cloud band. Further convection was increasing over
inland parts.
The 0500 UTC image showed the main cloud band to be over the Southeast Coast District.
By this time, further narrower bands of convection had developed over southeast
Queensland, to the east of the trough axis.
The banding features were evident throughout the afternoon and evening. Unfortunately
there were no infrared images available between 1200 UTC and 1530 UTC 9 March.
However, at 1530 UTC 9 March, the organised structure of the cloud bands was no longer
evident on the infrared image. Southeast Queensland was clear of any deep convection with
the coldest cloud tops measured to be around -30�C to -35�C (about 10�C warmer than
those observed during the morning and afternoon of 9 March).

Figure 16 - Infrared Satellite Images for (a) 0500 UTC 9 March 2001 and (b) 1100 UTC 9
March 2001.
(a)
(b)

Digital Radar Imagery
During the morning of 9 March 2001, a rain band, with embedded convection, was
detectable on radar off the Southeast Queensland coast. The embedded thunderstorms
moved in a southerly direction at about 35 kilometres per hour (9.7 ms-1).
At around 0100 UTC 9 March, isolated thunderstorms moved onto the Southeast
Queensland coast, maintaining the southerly movement.
At around 0230 UTC, thunderstorm cells started to form along a line parallelling the coast.
The line extended through the Wide Bay and Burnett and Southeast Coast districts. At the
same time, the rain band was seen to move onto the Southeast Queensland coast.
At 0315 UTC, the radar imagery showed a well defined line of thunderstorms extending
southward from the Wide Bay and Burnett district to Sandgate (north of Brisbane City), and
the rain band with embedded convection was located over the Southeast Coast district and
northern New South Wales.
At 0400 UTC, two separate areas of convection were evident. The first area, the line of
convection, extended from the Sunshine Coast to Brisbane. The second area, the broad
band of rain and thunderstorms, was located further to the south and over the Gold Coast
and Logan City.
Just after 0500 UTC, the movement of the thunderstorm cells slowed. Until this time, nearly
all cells had been steered towards the south at just under 10 ms-1. Furthermore, new
thunderstorms were seen to form towards the northern limit of the convective lines and then
move slowly southward along the same lines. This trend continued throughout the afternoon
and evening.
After 1000 UTC, the observed radar reflectivity was seen to decrease over the Brisbane and
Gold Coast areas, and the radar echoes in these parts began to clear to the east and move
off the coast. However, the convection over the Sunshine Coast was still quite active, and
remained so until about 1200 UTC. At this time, the radar reflectivity was seen to decrease
over the Sunshine Coast.
At 1300 UTC, radar showed a continuation of light (low reflectivity) rain to the north of

Brisbane, but the district was devoid of embedded deep convection.
Figure 17 - Digital Radar Image at 0720 UTC 9 March 2001, from Marburg radar.(Range rings are at 50 kilometre intervals and the radar elevation is 1.9 degrees).

Atmospheric Stability
The soundings for 2300 UTC 7 March 2001 and 0100 UTC 9 March 2001 were compared
and are included in Fig. 18. (It is noted here that the Sonde flight was conducted at 0100
UTC on 9 March, instead of at 2300 UTC 8 March, due to computer problems at Brisbane
Airport Meteorological Office). Also, the surface temperature and dewpoint for Brisbane City
at 0500 UTC 9 March was used to modify the latter of the aforementioned soundings. (See
Fig. 19). Various indices were calculated using Helindex*. The values are presented in
Table 5. Definitions of all listed indices and parameters are discussed in detail in Alford et
al., (1995).
Notably, and as was mentioned in an earlier section, the surface dewpoint (TD) rose
significantly on 9 March. The soundings also showed that the dewpoint of the layer below
600 hPa rose by 1 to 2°C between 2300 UTC 7 March and 0100 UTC 9 March. However, a
substantial drying of the mid-levels (above 580 hPa) was seen to occur during the same
period.
All soundings displayed instability. The Total Totals Index was about 45°C throughout the
period, alerting to possible thunderstorms. The Convective Available Potential Energy
(CAPE) increased to about 1600 J/Kg by 0100 UTC on 9 March, which according to Alford
et al., (1995), is an indication of moderately unstable conditions. The modified sounding for
0500 UTC 9 March gave a CAPE of nearly 4000 J/Kg, which is considered to be associated
with strongly unstable warm season convection. Values for the Convective Inhibition (CIN)
and the CAP strength also supported the occurrence of deep convection.
The Surface Lifted Index (SLI) to 500hPa hinted that severe thunderstorms, with possible
tornadoes, were likely. The Lifted Index indicated possible thunderstorms, not necessarily
severe. The Biltoft and Showalter indices only suggested that enhanced cumulus
development and shower activity was likely.
_________________________________________________________________________
* Helindex is a PC based application with real-time thunderstorm forecasting and research
capabilities. It is an interactive, Visual Basic tool, developed by the Severe Weather Section,
Bureau of Meteorology, Western Australia. The program can be used to diagnose
characteristics of the wind and temperature data. Features of the program include the ability
to calculate a range of instability indices, vertical wind shears and helicity values.
_________________________________________________________________________
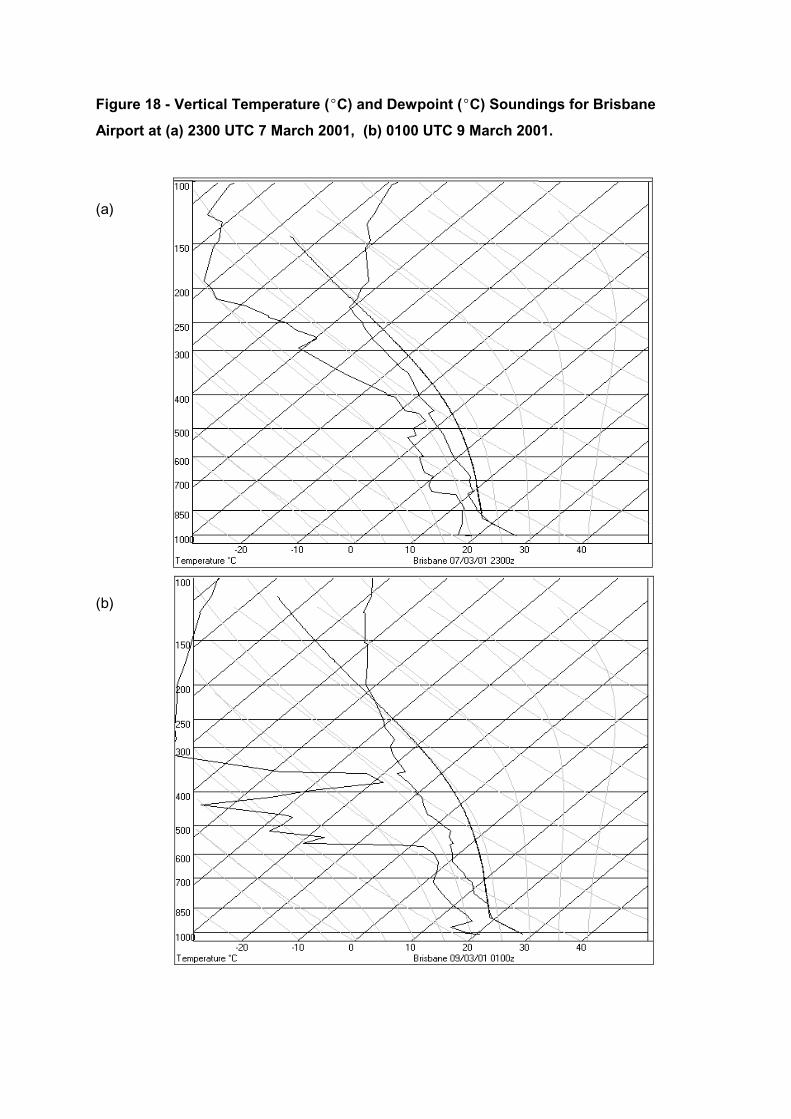
Figure 18 - Vertical Temperature (�C) and Dewpoint (�C) Soundings for Brisbane
Airport at (a) 2300 UTC 7 March 2001, (b) 0100 UTC 9 March 2001.
(a)
(b)

Figure 19 - Modified Vertical Temperature (�C) and Dewpoint (�C) Sounding for
Brisbane at 0500 UTC 9 March 2001.
The Adiabatic Liquid Water Content (ALWC) and Warm Cloud Depth can be used to
establish the likelihood of heavy rain and flash flooding. ALWCs in excess of 4 g/Kg are
usually needed for showers. Values greater than 15 g/Kg can, as stated in Alford et al.,
(1995), most often result in very heavy rainfall amounts. On 9 March, the ALWC for
Brisbane area was between 11 and 12 g/Kg, just short of the heavy rainfall threshold, but
still considered noteworthy. Also, the warm cloud depth was as high as 5322 metres at 0500
UTC 9 March. Usually, warm cloud depths greater than 3000 metres are believed to be
significant for flash flooding. Thus, it was concluded that these two parameters hinted at the
possibility of heavy rain and flash flooding in the Brisbane area on 9 March.

Table 5 - Various indices and parameters calculated from Brisbane Airport
Temperature and Wind data.
Index/Parameter
2300 UTC
7 March 2001
0100 UTC
9 March 2001
Modified for
0500 UTC
9 March 2001
Surface Data
T (�C) / TD (�C)
27.3/19.4 28.6/21.0 27.9/25.0
Total Totals (�C) 45 45 45
CAPE (J/Kg) 1017 1608 3928
DMAPE (J/Kg) 186 84 135
CIN (J/Kg) 6 5 0
CAP (�C) -0.7 -0.4 0
SLI to 500 hPa (�C) -3.4 -4.6 -8.5
Lifted (�C) -0.6 -0.6 -0.5
Biltoft (�C) 4.5 2.8 3
Showalter (�C) 1.9 2.6 2.6
WINDEX (knots/ms-1) 40/21 44/23 41/21
Warm Cloud Depth (m) 3598 4009 5322
ALWC (g/Kg) 11.3 12.4 11
Damaging Wind Indicators
To this point, the main focus of the report has been on the heavy rain and flash flooding
aspects of the storms of 9 March. Although not widespread, there were reports of wind
damage. (Recall from the list of impacts that a block of flats at Greenslopes had the roof
torn off and two homes at the Sunshine Coast were evacuated when it was believed that the
roofs could be blown off).
The strongest wind gusts, as recorded by the local Automatic Weather Station (AWS)
network, are listed in Table 6. None of the sites registered wind gusts greater than 25ms-1.
(Note that 25ms-1 is the Severe Weather threshold for damaging winds).

Table 6 - Summary of the Strongest Wind Gusts observed across the Southeast Coast
District on 9 March 2001.
Station Time of Report (UTC) Wind Gust (ms-1)
Gold Coast Seaway 0555 22
Cape Moreton 0700 18
Amberley 0429 16
Coolangatta 0425 13
Brisbane Airport 0625 & 0800 13
Brisbane 0724 13
Archerfield 0500 & 0700 12
Nambour 0947 8
Helicity values for Brisbane Airport at 0500 UTC were calculated using Helindex, and as
expected did not support the development of a meso-cyclone (i.e. supercell thunderstorm
growth) and/or tornadoes. The magnitude of the helicity over the lowest 3000 metres was
only about 44 m2s-2. It was therefore concluded that any wind damage was highly unlikely to
have been caused by a tornado. (This conclusion was supported by the absence of a
supercell thunderstorm on the 3D-Radar imagery).
A wet microburst (or downdraft) was considered to be the most likely producer of the
damaging wind gusts. According to Alford et al., (1995), a low cloud base and a dry slot in
the middle levels of the atmosphere, a weak vertical windshear environment and significant
precipitation at the surface, are features that are often observed with wet microbursts, and
were all observed on the afternoon of 9 March.
WINDEX, which can be used for predicting maximum surface winds gusts associated with
wet or dry microbursts (McCann, 1994), was calculated for Brisbane Airport. Values of 21 to
23 ms-1 were obtained for 9 March, (refer to Table 5) , which corresponded to the maximum
wind gusts observed during the event. (Note however, that only coastal stations reported
wind gusts in excess of 16 ms-1).
Values of the Downdraft Maximum Available Potential Energy (DMAPE), as calculated by
Helindex, were given in Table 5. According to Caracena and Maier, (1987), the DMAPE

represents the maximum possible kinetic energy obtainable by a downdraft parcel, just
before it reaches the surface. Thus,
DMAPE = Wmax2/2
Caracena and Maier (1987) also assumed that the maximum horizontal wind speed would
equal Wmax.
At 0500 UTC 9 March, the value of DMAPE for Brisbane was calculated to be about 135
J/Kg, which gave a Wmax of 16.4 ms-1.
Caracena and Maier (1987) state that precipitation drag will also add to the downdraft
speed, and about 10% should be added for a rain rate of 80 millimetres per hour. Therefore
for the Brisbane event, the maximum horizontal wind speed due to a wet microburst was
estimated to be about 18 ms-1.
(It should be noted that this wind speed is most likely an underestimation of downdraft
winds. The above method ignored the transport of momentum of middle level air down to
the surface by a downdraft.)
Numerical Model Rainfall Prediction
None of the available numerical models successfully forecast the amount and the intensity
of the rainfall that fell over the Southeast Coast district on 9 March.
The Australian Limited Area Prediction System (LAPS) prognosis, with base time 2300 UTC,
8 March 2001, centred the heaviest rain inland from Coffs Harbour, New South Wales. For
the 12 hour period between 2300 UTC 8 March and 1100 UTC 9 March, LAPS forecast just
over 90 millimetres of precipitation in the New England area, and only about 20 to 35
millimetres across the Southeast Coast district of Queensland. The heaviest rainfall for
Queensland was expected over the southern border ranges. The model indicated that very
little rain would be registered after 1100 UTC on 9 March. For the Southeast Coast District,
LAPS suggested rainfall intensity in the order of about 10 millimetres every 3 hours. It was
concluded that LAPS grossly underestimated the amount and intensity of the rainfall for the
Southeast Coast district, but was correct in indicating a tapering off of the rainfall after about
1100 UTC.
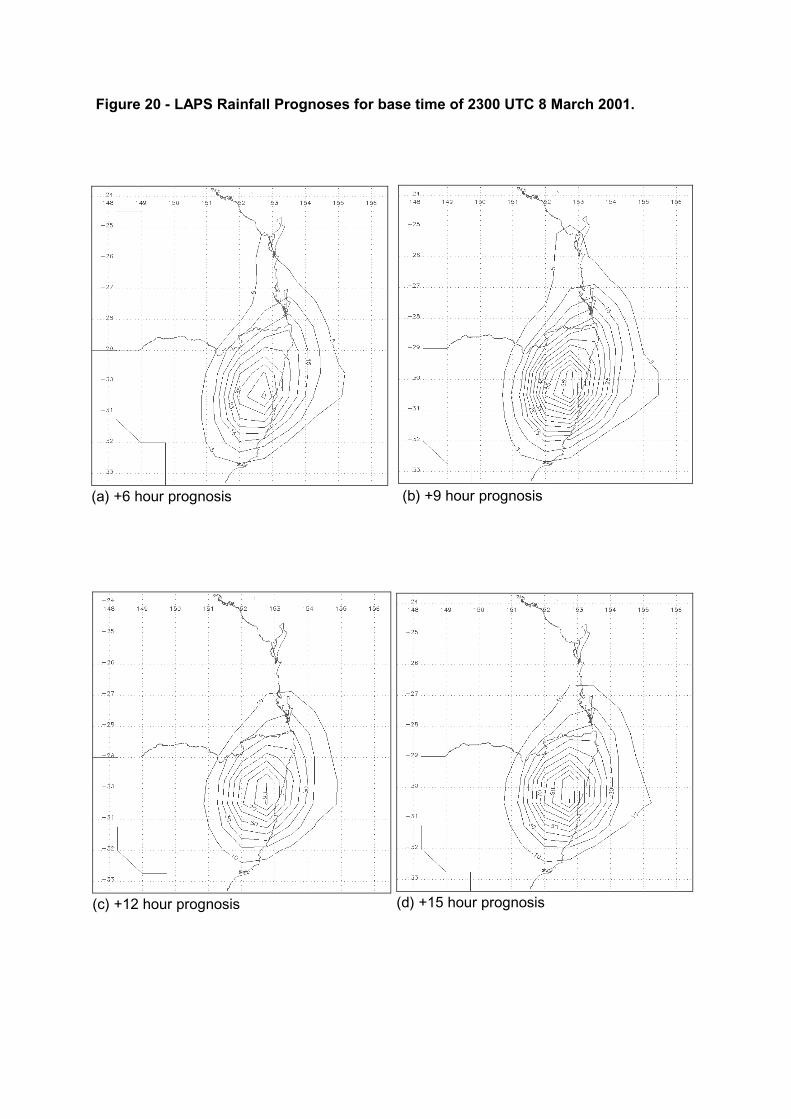
(a) +6 hour prognosis (b) +9 hour prognosis
(c) +12 hour prognosis (d) +15 hour prognosis
Figure 20 - LAPS Rainfall Prognoses for base time of 2300 UTC 8 March 2001.
The Global Assimilation Prognosis (GASP) model, with base time 1200 UTC, 8 March 2001,
also placed the heaviest rain over the New England area. For the 24 hour period to 1200
UTC on 9 March, the maximum rainfall was just over 60 millimetres. As little as 5 to 10
millimetres was forecast for the southern parts of Queensland.
The Japanese Meteorological Agency (JMA) model also grossly underestimated the rainfall
for Queensland’s Southeast Coast district. This model indicated the maximum rainfall to be
over the New England area, and suggested between 10 to 25 millimetres across the
Southeast Coast district.
The United States Aviation Model (USAVM) with base time 1200 UTC, 8 March 2001, also
failed to predict heavy rainfall for the Southeast Coast district, and was considered to be a
poorer performer than the LAPS. Between 1200 UTC 8 March and 0000 UTC 9 March, this
model kept the area of maximum precipitation off the east coast of New South Wales. For
the time step 0000 UTC 9 March to 0600 UTC 9 March, a maximum rainfall total of between
25 and 30 millimetres was forecast for the New South Wales coast near Kempsey. Only
about 5 millimetres was forecast for the same period over southeast Queensland. For the 6
hour period 0600 UTC to 1200 UTC 9 March, the area of forecast maximum rainfall was
centred over the New England region of New South Wales, but only about 5 millimetres was
forecast for Queensland’s southern border ranges.
The UK model rainfall was very similar to that of the USAVM. It too kept the maximum
rainfall south of the Queensland/New South Wales border, but didn’t forecast any significant
rain for the southeastern parts of Queensland on the afternoon and evening of 9 March.
Conclusion
The intense rainfall that resulted in local flash flooding across the Southeast Coast District
during the afternoon and evening of 9 March 2001, was produced by thunderstorms which
formed along convergent rain bands. The thunderstorms developed in a region of strong
dynamic forcing, increased low level moisture and strong instability. The storms became
almost stationary in a broken line parallelling the coast.
Numerical models failed to forecast the amount and the intensity of the rainfall. However,
several factors that were believed to have contributed to the intense rainfall were identified

during the post-analysis of the event. These included:
(1) Strong convergence in the low levels of the atmosphere, in the vicinity of Brisbane,
and increased moisture (high dewpoint air) in the same layer.
(2) An increased thermal gradient in the mid-levels (at 500 hPa) over Southeast
Queensland.
This was considered indicative of the advection of Potential Vorticity (PV) into the
area, which in turn disrupted the thermal balance, thereby creating vertical motion.
This was not apparent until after the receipt of the 1100 UTC Sonde flight data.
(3) The re-alignment of a trough in the mid-levels between 0500 and 1100 UTC on 9
March, which led to a decrease in the northwesterly steering of the convective
storms over the Southeast Coast district.
As was the case for (2), it was not evident until after 1100 UTC (i.e. when the wind
data became available), that it was this feature that caused the thunderstorms to
become almost stationary over the district.
(4) A backing in direction of the winds with height in the Brisbane area.
The post event analysis showed that the wind structure was consistent with the
heaviest rain being between 0500 and 1100 UTC.
(5) Increased upper level divergence over Southeast Queensland.
(6) An estimated warm cloud depth of greater than 5000 metres.
The modified Vertical Temperature and Dewpoint Sounding was strongly unstable
with a warm cloud depth indicative of heavy rainfall. Many other thunderstorm
indices/parameters as calculated from the soundings hinted at the possibility of
thunderstorms and heavy rain. However there were also several that did not.
References
Alford, P., Gill, J. and Ryan, C. 1995. Thunderstorms and Severe Thunderstorms - A
Forecasting Perspective (3rd Edition). Bureau of Meteorology Training Centre,
Australia.
Caracena, F. and Maier, M.W. 1987. Analysis of a Microburst in the FACE Meteorological
Mesonetwork in Southern Florida. Monthly Weather Review, Boston, MA, 115(5),
969-985.
Hoskins, B.J., McIntyre, M.E. and Robertson, A.W. 1985. On the Use and Significance of
Isentropic Potential Vorticity Maps. Quarterly Journal of the Royal Meteorological
Society, 111, 877-946.
Institution of Engineers Australia (The), 1987. Australian Rainfall and Runoff - A Guide to
Flood Estimation. The Institution of Engineers Australia, ACT, Australia.
Kepert, J. Isentropic Potential Vorticity Charts and their Interpretation - A Forecaster’s
Guide. Bureau of Meteorology Training Centre, Australia.
McCann, D.W. 1994. WINDEX - A New Index for Forecasting Microburst Potential. Weather
and Forecasting, Boston, MA, 9(4), 532-541.
Queensland Regional Office - Bureau of Meteorology. 1998. Severe Weather and Flooding -
North Queensland January 1998. Bureau of Meteorology, Queensland, Australia.

Appendix A - Severe Thunderstorm Warnings_________________________________________________________________________BUREAU OF METEOROLOGYQueensland RegionBrisbane Office
TOP PRIORITYSEVERE THUNDERSTORM WARNINGIssued by the Bureau of Meteorology, Brisbaneat 4:33pm EST on Friday the 9th of March 2001
For the Southeast Coast District
A line of slow moving thunderstorms currently extend south from Brisbane to the Gold Coastand may produce heavy rainfall and possible flash flooding.
Motorists are advised to take appropriate caution during the heavy rains.
The next warning will be issued at 5:30pm.**** NOT FOR BROADCAST AFTER 5:30pm ****
_________________________________________________________________________BUREAU OF METEOROLOGYQueensland RegionBrisbane Office
TOP PRIORITYSEVERE THUNDERSTORM WARNINGIssued by the Bureau of Meteorology, Brisbaneat 5:01pm EST on Friday the 9th of March 2001
For the Southeast Coast District
U P D A T E D W A R N I N G
A line of slow moving thunderstorms currently extend south from the Sunshine Coast to theGold Coast, producing heavy rainfall and localised flash flooding.
Reports of rainfall in excess of 100mm have already produced some flash flooding incoastal areas.
Motorists are advised to take appropriate caution during the heavy rains.
The next warning will be issued at 5:30pm.**** NOT FOR BROADCAST AFTER 5:30pm ****

_________________________________________________________________________BUREAU OF METEOROLOGYQueensland RegionBrisbane Office
TOP PRIORITYSEVERE THUNDERSTORM WARNINGIssued by the Bureau of Meteorology, Brisbaneat 5:24pm EST on Friday the 9th of March 2001
For the Southeast Coast District
Slow moving thunderstorms currently extend from the greater Brisbane area to the northernparts of the Gold Coast, producing heavy rainfall and localised flash flooding.
Reports of hourly rainfalls in excess of 100mm have already produced some flash floodingin coastal areas.
Motorists are advised to take appropriate caution during the heavy rains. The next warning will be issued at 6:00pm. **** NOT FOR BROADCAST AFTER 6:00pm ****
_________________________________________________________________________BUREAU OF METEOROLOGYQueensland RegionBrisbane Office
TOP PRIORITYSEVERE THUNDERSTORM WARNINGIssued by the Bureau of Meteorology, Brisbaneat 5:55pm EST on Friday the 9th of March 2001
For the Southeast Coast District
Slow moving thunderstorms currently extend from the Sunshine Coast Hinterland to thenorthern parts of the Gold Coast, producing heavy rainfall and localised flash flooding.
Reports of rainfalls in excess of 100mm have already produced some flash flooding incoastal areas.
Motorists are advised to take appropriate caution during the heavy rains.
The next warning will be issued at 6:30pm.**** NOT FOR BROADCAST AFTER 6:30pm ****

_________________________________________________________________________BUREAU OF METEOROLOGYQueensland RegionBrisbane Office
TOP PRIORITYSEVERE THUNDERSTORM WARNINGIssued by the Bureau of Meteorology, Brisbaneat 6:28pm EST on Friday the 9th of March 2001
For the Southeast Coast District
Slow moving thunderstorms currently extend from the Sunshine Coast Hinterland to thenorthern parts of the Gold Coast, producing heavy rainfall and localised flash flooding.
Reports of cumulative rainfall totals in excess of 200mm have already produced flashflooding in coastal areas. Recent hourly rainfalls in excess of 100mm have been reportedacross southeast Brisbane.
People in low lying areas and adjacent to streams should monitor rising water levels thisevening. Motorists should also proceed with caution.
The next warning will be issued at 7:00pm.**** NOT FOR BROADCAST AFTER 7:00pm ****
________________________________________________________________________BUREAU OF METEOROLOGYQueensland RegionBrisbane Office
TOP PRIORITYSEVERE THUNDERSTORM WARNINGIssued by the Bureau of Meteorology, Brisbaneat 6:52pm EST on Friday the 9th of March 2001
For the Southeast Coast District
Slow moving thunderstorms currently extend from the Sunshine Coast Hinterland to LoganCity, producing heavy rainfall and localised flash flooding.
Reports of cumulative rainfall totals in excess of 200mm have already produced flashflooding in coastal areas. Recent hourly rainfalls in excess of 100mm have been reportedacross southeast Brisbane.
People in low lying areas and adjacent to streams should monitor rising water levels thisevening. Motorists should also proceed with caution.

The next warning will be issued at 7:30pm.**** NOT FOR BROADCAST AFTER 7:30pm ****
_________________________________________________________________________BUREAU OF METEOROLOGYQueensland RegionBrisbane Office
TOP PRIORITYSEVERE THUNDERSTORM WARNINGIssued by the Bureau of Meteorology, Brisbaneat 7:23pm EST on Friday the 9th of March 2001
For the Southeast Coast District
Slow moving thunderstorms currently extend from the Sunshine Coast Hinterland to theGreater Brisbane area, producing heavy rainfall and localised flash flooding.
Reports of cumulative rainfall totals up to 250mm have already produced flash flooding incoastal areas. Recent hourly rainfalls in excess of 100mm have been reported acrossnorthern suburbs of Brisbane.
A Flood Warning is current for Brisbane Metropolitan Creeks.
People in low lying areas and adjacent to streams should monitor rising water levels thisevening. Motorists should also proceed with extreme caution.
The next Severe Thunderstorm Warning will be issued at 8:00pm.**** NOT FOR BROADCAST AFTER 8:00pm ****
_________________________________________________________________________BUREAU OF METEOROLOGYQueensland RegionBrisbane Office
TOP PRIORITYSEVERE THUNDERSTORM WARNINGIssued by the Bureau of Meteorology, Brisbaneat 7:54pm EST on Friday the 9th of March 2001
For the Southeast Coast District
Slow moving thunderstorms currently extend from the Sunshine Coast Hinterland to theGreater Brisbane area, producing heavy rainfall and localised flash flooding.
Reports of cumulative rainfall totals up to 250mm have already produced flash flooding in

coastal areas. Recent hourly rainfalls in excess of 100mm have been reported acrossnorthern suburbs of Brisbane.
A Flood Warning is current for Brisbane Metropolitan Creeks.
People in low lying areas and adjacent to streams should monitor rising water levels thisevening. Motorists should also proceed with extreme caution.
The next Severe Thunderstorm Warning will be issued at 8:30pm.**** NOT FOR BROADCAST AFTER 8:30pm ****
_________________________________________________________________________BUREAU OF METEOROLOGYQueensland RegionBrisbane Office
TOP PRIORITYSEVERE THUNDERSTORM WARNINGIssued by the Bureau of Meteorology, Brisbaneat 8:25pm EST on Friday the 9th of March 2001
For the Southeast Coast District
Slow moving thunderstorms currently extend from the Sunshine Coast to the northern partsof Brisbane, producing heavy rainfall and localised flash flooding.
Reports of cumulative rainfall totals up to 250mm have already produced flash flooding incoastal areas. Recent hourly rainfalls of about 100mm have been reported at the SunshineCoast.
A Flood Warning is current for Brisbane Metropolitan Creeks.
People in low lying areas and adjacent to streams should monitor rising water levels thisevening. Motorists should also proceed with extreme caution.
The next Severe Thunderstorm Warning will be issued at 9:00pm.**** NOT FOR BROADCAST AFTER 9:00pm ****
_________________________________________________________________________BUREAU OF METEOROLOGYQueensland RegionBrisbane Office
TOP PRIORITYSEVERE THUNDERSTORM WARNINGIssued by the Bureau of Meteorology, Brisbane

at 8:51pm EST on Friday the 9th of March 2001
For the Southeast Coast District
Slow moving thunderstorms continue on the Sunshine Coast, producing heavy rainfall andlocalised flash flooding.
Recent hourly rainfalls of up to 100mm have been reported at the Sunshine Coast.
People in low lying areas and adjacent to streams should monitor rising water levels thisevening. Motorists should also proceed with extreme caution.
The next Severe Thunderstorm Warning will be issued at 9:30pm.**** NOT FOR BROADCAST AFTER 9:30pm ****
_________________________________________________________________________BUREAU OF METEOROLOGYQueensland RegionBrisbane Office
TOP PRIORITYSEVERE THUNDERSTORM WARNINGIssued by the Bureau of Meteorology, Brisbaneat 9:27pm EST on Friday the 9th of March 2001
For the Southeast Coast District
Slow moving thunderstorms continue on the Sunshine Coast, producing heavy rainfall andlocalised flash flooding.
Recent hourly rainfalls of up to 90mm have been reported at the Sunshine Coast.
People in low lying areas and adjacent to streams should monitor rising water levels thisevening. Motorists should also proceed with extreme caution.
The next Severe Thunderstorm Warning will be issued at 10pm.**** NOT FOR BROADCAST AFTER 10pm ****
_________________________________________________________________________BUREAU OF METEOROLOGYQueensland RegionBrisbane Office
TOP PRIORITYSEVERE THUNDERSTORM WARNINGIssued by the Bureau of Meteorology, Brisbane

at 9:53pm EST on Friday the 9th of March 2001
For the Southeast Coast District
Heavy rainfall along the Sunshine Coast has eased over the past hour, and is expected tocontinue to ease over the next half hour.
Recent hourly rainfalls of up to 50mm have been reported at the Sunshine Coast.
People in low lying areas and adjacent to streams should monitor rising water levels thisevening. Motorists should also proceed with extreme caution.
This is the final Severe Thunderstorm Warning.**** NOT FOR BROADCAST AFTER 10.30pm ****_________________________________________________________________________
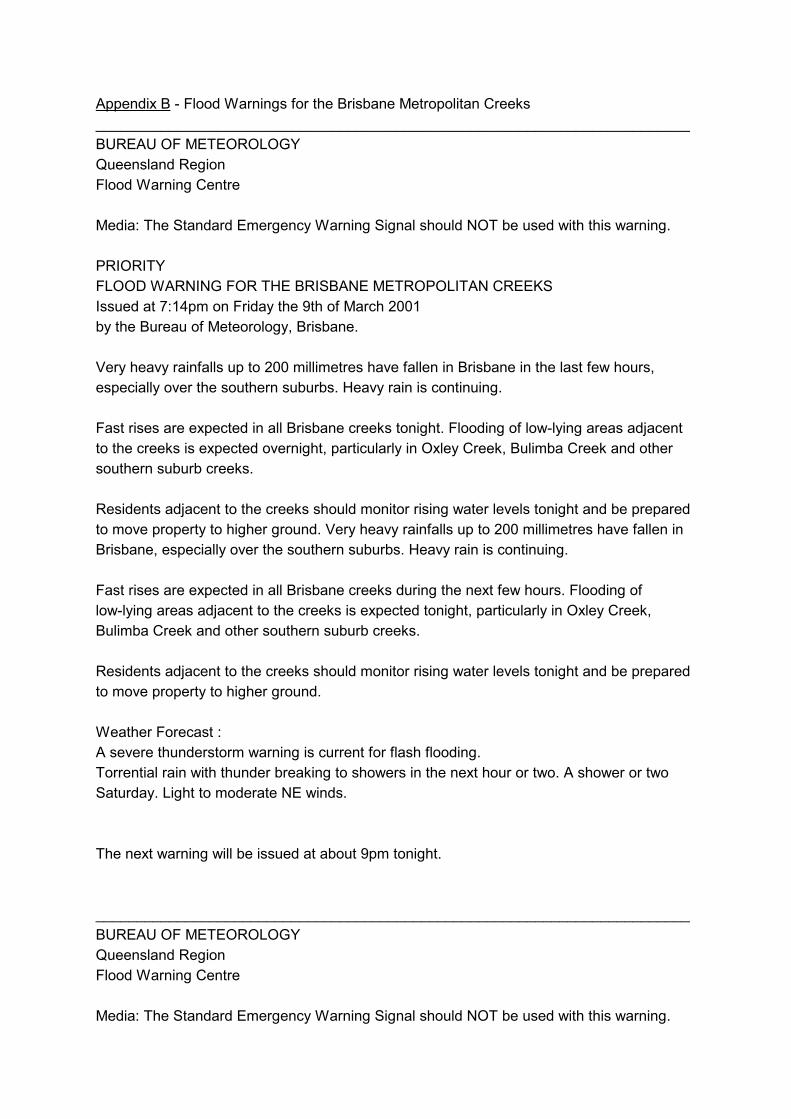
Appendix B - Flood Warnings for the Brisbane Metropolitan Creeks_________________________________________________________________________BUREAU OF METEOROLOGYQueensland RegionFlood Warning Centre
Media: The Standard Emergency Warning Signal should NOT be used with this warning.
PRIORITYFLOOD WARNING FOR THE BRISBANE METROPOLITAN CREEKSIssued at 7:14pm on Friday the 9th of March 2001by the Bureau of Meteorology, Brisbane.
Very heavy rainfalls up to 200 millimetres have fallen in Brisbane in the last few hours,especially over the southern suburbs. Heavy rain is continuing.
Fast rises are expected in all Brisbane creeks tonight. Flooding of low-lying areas adjacentto the creeks is expected overnight, particularly in Oxley Creek, Bulimba Creek and othersouthern suburb creeks.
Residents adjacent to the creeks should monitor rising water levels tonight and be preparedto move property to higher ground. Very heavy rainfalls up to 200 millimetres have fallen inBrisbane, especially over the southern suburbs. Heavy rain is continuing.
Fast rises are expected in all Brisbane creeks during the next few hours. Flooding oflow-lying areas adjacent to the creeks is expected tonight, particularly in Oxley Creek,Bulimba Creek and other southern suburb creeks.
Residents adjacent to the creeks should monitor rising water levels tonight and be preparedto move property to higher ground. Weather Forecast :A severe thunderstorm warning is current for flash flooding.Torrential rain with thunder breaking to showers in the next hour or two. A shower or twoSaturday. Light to moderate NE winds.
The next warning will be issued at about 9pm tonight.
_________________________________________________________________________BUREAU OF METEOROLOGYQueensland RegionFlood Warning Centre
Media: The Standard Emergency Warning Signal should NOT be used with this warning.

RENEWAL OF FLOOD WARNING FOR THE BRISBANE METROPOLITAN CREEKSIssued at 8:14pm on Friday the 9th of March 2001by the Bureau of Meteorology, Brisbane.
Very heavy rainfalls up to 200 millimetres have fallen in Brisbane in the last few hours.Heavy falls are continuing over the northern suburbs.
Fast rises are expected in all Brisbane creeks tonight. Flooding of low-lying areas adjacentto the creeks is expected overnight, particularly in Oxley Creek, Bulimba Creek and othersouthern suburb creeks.
Residents adjacent to the creeks should monitor rising water levels tonight and be preparedto move property to higher ground. Weather Forecast :A severe thunderstorm warning is current for flash flooding.Torrential rain with thunder breaking to showers in the next hour or two. A shower or twoSaturday. Light to moderate NE winds. The next warning will be issued at about 9pm tonight.
_________________________________________________________________________BUREAU OF METEOROLOGYQueensland RegionFlood Warning Centre
Media: The Standard Emergency Warning Signal should NOT be used with this warning. FINAL FLOOD WARNING FOR THE BRISBANE METROPOLITAN CREEKSIssued at 9:22pm on Friday the 9th of March 2001by the Bureau of Meteorology, Brisbane.
Rainfall has eased in the Brisbane metropolitan area.
Brisbane creeks have recorded fast rises, but are generally below minor flood level. Riseswill continue for the next few hours, mainly in the lower reaches of the creeks, but areexpected to peak at or below minor flood levels.
Weather Forecast :A little rain and local thunder clearing by early morning. Only a shower or two Saturday.Light to moderate NE winds.
No further warning will be issued for this event._________________________________________________________________________