Figure 15—Periodic annual increment (PAI) and gross mean ... · PDF fileshows the basal...
102
21 Figure 15—Periodic annual increment (PAI) and gross mean annual increment (MAI) in basal area per acre by treatments for (A) Skykomish treatments 1, 2, 4, and 7; (B) Skykomish treatments 3, 5, 6, and 8. Each bar shows the basal area cut plus mortality and the amount reserved (net); for controls, the mortality and net growth.
-
Upload
vuongnguyet -
Category
Documents
-
view
215 -
download
1
Transcript of Figure 15—Periodic annual increment (PAI) and gross mean ... · PDF fileshows the basal...

21
Figure 15—Periodic annual increment (PAI) and gross mean annual increment (MAI) in basal area per acre bytreatments for (A) Skykomish treatments 1, 2, 4, and 7; (B) Skykomish treatments 3, 5, 6, and 8. Each bar showsthe basal area cut plus mortality and the amount reserved (net); for controls, the mortality and net growth.

22
Figure 15 continued—Periodic annual increment (PAI) and gross mean annual increment (MAI) in basal area peracre by treatments for (C) Clemons treatments 1, 2, 4, and 7; (D) Clemons treatments 3, 5, 6, and 8. Each barshows the basal area cut plus mortality and the amount reserved (net); for controls, the mortality and net growth.

23
Total yield—The cumulative gross volume in cubic feet per acre was related to basalarea in a series of regressions representing successive growth periods. These relationswere based on the yield from all thinning regimes at periodic stand ages (figs. 16A and16B).
Gross volume includes initial volume at plot establishment plus the increase in reservevolume at each growth period plus the volume cut in thinnings and the volume of mortal-ity. Basal area per acre in the regressions are before thinning to correspond with grossyield. The length of each regression line indicates the total range in basal area at thegiven age. The first regressions were made at the end of the second thinning period.Earlier periods did not have a wide enough range in basal area to establish a meaningfulrelation. The lowest line on each chart, age 34 at Skykomish and 29 at Clemons, repre-sents early stages of stand development. At the time, the total range in growing stockwas only about 50 square feet per acre in each study area. During successive growthperiods, growing stock became a much more important factor in cumulative wood pro-duction. During the 22 years shown in figure 16A at Skykomish, growing stock attainedlevels of 120 to 240 square feet per acre, a range of 120 square feet or about 2.4 timesthe range at age 34. During the same period, wood production attained levels of 9,000to 13,500 cubic feet per acre, a range eight times as large as it was at age 34. Changesof about the same magnitude occurred at Clemons over the 21-year period from age 29to 50 years. Figures 16A and 16B show the wide range in growing stock and volumes ofwood produced from a single low level of growing stock (after preparatory thinning) fol-lowed by five thinnings in each regime and a holding period of 14 years. The amount ofwood produced for a given change in growing stock increased with advancing age. Thiswas a result of the increasing volume-basal area ratios produced by increasing treesize. This is illustrated in table 8 showing the increase in volume for each 10-square-foot addition in basal area on the regression lines in figures 16A and 16B.
These data illustrate the effect of a given increase or decrease in growing stock onproduction of wood over a wide range of stand ages and thinning regimes. For ex-ample, in the Skykomish study area, the indicated gain in volume was 327 cubicfeet per acre for every increase of 10 square feet of basal area at stand age 56 years.
Figure 16—Gross total stem volume production in relation to basal area by stand age for (A) Skykomish and (B) Clemons. Length ofregression lines corresponds with increasing growing stock as stands advanced in age.

24
Figure 17—Gross yield of total stem volume by stand age and treatment with net and gross yield of thecontrol for (A) Skykomish and (B) Clemons. Dots indicate time of thinning. Trend lines beyond last thinningshow yield during 14-year period after thinning. Net yield (less mortality) also is given for the controls.
Table 8—Increase in gross volume per acre for each 10-square-footincrease in basal area per acre by stand age (figures 16A and 16B)
Skykomish Clemons
Stand age Increase in volume Stand age Increase in volume
Years Ft3/acre Years Ft3/acre34 142 29 8838 191 32 11842 219 36 14946 244 40 17151 328 45 22756 327 50 326
These incremental gains in volume per acre illustrate the opportunities for producinghigher yields by managing stands at high levels of growing stock in this series of thin-ning regimes. Conversely, reduced growing stock resulted in less volume production.
The expanding range of gross volume per acre with successive thinnings is shownin the trends of yield in relation to stand age (figs. 17A and 17B). All regimes startedwith nearly the same volume at age 24 at Skykomish and 19 years at Clemons. Thefirst treatment thinnings at 28 and 22 years for Skykomish and Clemons, respectively,produced a narrow range of volumes when only four levels of growing stock werepresent. With successive thinnings and advancing age, yields became more divergent,

25
and regimes 1 and 7 were consistently lowest and highest. At age 56, regime 7 atSkykomish produced 56 percent more wood than regime 1. At age 50, regime 7 atClemons produced 43 percent more than regime 1.
Yield from thinnings—The volumes produced by thinnings were a substantial portionof total wood production and inversely related to levels of growing stock retained. Theproportions of gross yield in live growing stock, cut in thinning, and lost to mortality areshown in tables 9 and 10. At the lowest levels of growing stock (treatment 1), thinningscomposed 54 and 58 percent of the total yield at Skykomish and Clemons, respectively.At the highest level of growing stock, they were only 19 and 11 percent of the total
Table 9—Skykomish: Cumulative yield through lastthinning at age 42 with percentages in live stand, cut inthinning, and mortality
Total stem volume
Treatmenta Gross yield Live stand Cut Dead
Number Ft3/acre - - - - - - Percent - - - - - -1 5,660 46 54 <12 6,124 63 36 13 6,259 60 39 14 6,568 77 23 05 7,085 74 25 18 7,122 70 28 27 7,830 80 19 1a Listed according to severity of thinning based on prescribed amount ofbasal area retained in growing stock: 1, 10 percent; 2, 3, and 6 average30 percent; 4, 5, and 8 average 50 percent; 7, 70 percent (table 1).
Table 10—Clemons: Cumulative yield through lastthinning at age 36 with percentages in live stand, cut inthinning, and mortality
Total stem volume
Treatmenta Gross yield Live stand Cut Dead
Number Ft3/acre - - - - - - Percent - - - - - -1 3,691 41 58 12 4,018 60 37 33 4,185 59 40 16 4,515 56 43 14 4,276 72 22 65 4,431 71 25 48 4,517 73 24 37 4,816 86 11 3a Listed according to severity of thinning based on prescribed amount ofbasal area retained in growing stock: 1, 10 percent; 2, 3, and 6 average 30percent; 4, 5, and 8 average 50 percent; 7, 70 percent (table 1).

26
yield. Details of the volume lost to mortality are given in a subsequent section of thereport. The cumulative volumes of thinnings in relation to stand age are shown in figures18A and 18B. These trend lines are opposite to the basal area trends in figures 4A and4B. The constant percentage treatments 1, 3, 5, and 7 (table 1) produced consistentlyincreasing yields of thinnings. The variable treatments produced different trends of yieldin early and late thinnings. To illustrate these differences, thinnings yields were sum-marized for the first and last half of the thinning cycles for each treatment. The first,second, and one-half of the third thinning were included in the first half, the balance inthe last half. The percentages of thinning yields were similar within each group of treat-ments; i.e., constant (treatments 1, 3, 5, and 7), variable increasing (treatments 2 and4), and variable deceasing (treatment 6 and 8). Also these percentages were nearly thesame for comparable treatments at both Skykomish and Clemons. Consequently, theywere combined to show the approximate proportions of thinning yields as follows:
Percentage of thinning yield
Treatment First half of thinning period Last half of thinning period
1, 3, 5, and 7 44 562 and 4 64 366 and 8 31 69
These distributions of yield from thinnings have some important implications in standmanagement, not just because of differences in volume, but also the sizes of treesthat were cut in early and late thinnings. At Skykomish the average volume per treewas 4 to 11 cubic feet in the first half of the thinnings, and 9 to 28 in the last half. Anexception was treatment 1, which included one thinning with 52 cubic feet per treewhere extremely low stocking resulted in removal of large trees. In the younger standsat Clemons, the early and late thinnings averaged 2 to 9 and 7 to 17 cubic feet per tree,with one exception of 29. When wood production is a primary goal of stand manage-ment, the choice between 64 percent of thinnings in small trees, or 69 percent in largetrees, or a more even distribution of yields could be a major consideration in designinga silvicultural regime.
Gross volume increment—Gross PAI in cubic feet in relation to growing stock bystand age is shown in figures 19A and 19B. The first three growth periods were not in-cluded because of the narrow range in basal area and resulting short regression lines.Growth in all periods increased substantially with increases in grow-ing stock. The lasttwo periods when no thinning was done show irregular changes with increasing age: atSkykomish, growth rates were similar, but at Clemons growth was greater than duringprevious periods. These changes in growth rate are a response to termination of thethinning regimes. Volume increments during the last two periods were 60 to 90 percentmore in highest levels of growing stock than in the lowest levels.
Gross PAI and MAI—Gross PAI for each of the eight growth periods in each treatmentand control is shown in figures 20A through 20D in relation to stand age. Periodic incre-ments (gross PAI) are the average of three sample plots in each treatment, and consistof the change in volume reserved for growing stock (reserve PAI), cut in thinning, andmortality. Mortality is included with cut when thinning was done. These volumes corre-spond with similar patterns of basal area reserved as shown in figures 15A and 15B.

27
Figure 18—Cumulative total stem volume removed in thinning by stand age and treatment for (A) Skykomishand (B) Clemons. Dots indicate time of thinning.
Figure 19—Gross periodic annual increment (PAI) in total stem volume by growth period in relation to midperiod basal area for (A) Skykomishand (B) Clemons. Length of regression lines show range in basal area at each growth period.
Trend lines of gross MAI show steady increases in all treatments and controls throughthe entire period of study. During the last growth period of 5 years, the increase in MAIranged from 6 to 11 percent indicating that the maximum growth is several years away.Controls also increased about 7 percent, so currently there is no indication that growthof the managed stands will peak at a different age. The highly variable intensities ofthinning had no apparent adverse effect on the stability of gross MAI.

28
Figure 20—Periodic annual increment (PAI) and gross mean annual increment (MAI) in total stem volume per acre bytreatments for (A) Skykomish treatments 1, 2, 4, and 7; (B) Skykomish treatments 3, 5, 6, and 8. Allocation of cut andleave is shown for each thinning. Each bar shows the volume cut, plus mortality and the amount reserved (net); forcontrols, the mortality and net growth.

29
Figure 20 continued—Periodic annual increment (PAI) and gross mean annual increment (MAI) in total stem volumeper acre by treatments for (C) Clemons treatments 1, 2, 4, and 7; and (D) Clemons treatments 3, 5, 6, and 8.Allocation of cut and leave is shown for each thinning. Each bar shows the volume cut, plus mortality and theamount reserved (net); for controls, the mortality and net growth.

30
The second objective of the LOGS studies is to determine how the amount of growingstock in repeatedly thinned stands affects tree size. This analysis included tree size asquadratic mean d.b.h. and volume by d.b.h. classes. Figure 21 shows mean d.b.h. inrelation to basal area per acre for the last six growth periods. Earlier measurements didnot cover a sufficient range to establish relations. These regressions show consistentreductions in mean d.b.h. as growing stock increases across regimes. These trendsare illustrated in figure 22 where mean d.b.h. for each treatment is shown in relation tostand age. Some crossing of trend lines shows a change in relative position of meand.b.h. among treatments, but after the third thinning when all levels of growing stockwere developed, the different trends in tree size were well defined. Mean d.b.h. of thethinned stands showed increasing divergence from the unthinned stands.
The total change in quadratic mean d.b.h. for all regimes is given in table 11 for Sky-komish and table 12 for Clemons. At Skykomish after the preparatory thinning at age24, the mean d.b.h. ranged from 5.0 to 5.5 inches. After five thinnings and 32 years, thesmallest mean d.b.h. was 15.4 inches in treatments 5 and 8, and the largest was 21.0in treatment 1. At Clemons the initial d.b.h. ranged from 4.0 to 4.2 inches, and 31 yearslater, the smallest was 11.7 in treatment 8 and the largest was 18.1 in treatment 1.These increases in mean d.b.h. consist of the immediate change caused by reducingthe numbers of trees at each thinning, plus the net periodic growth; i.e., growth of survi-vors (Curtis and Marshall 1989). A small amount of mortality subtracted periodicallyfrom the stand had virtually no effect on mean d.b.h. The cumulative increase resultingfrom removal of trees in five thinnings at Skykomish ranged from 0.2 to 2.3 inches andzero to 1.7 inches at Clemons. About one-third of the thinnings did not change themean d.b.h. of the stands. This was the intended result of the marking guide, whichspecified that the mean d.b.h. of noncrop trees should be the same before and afterthinning (see section on stand treatments). Most thinnings were taken from the non-crop component of the stand, which represented virtually the entire range of diameters.About 70 percent of the thinnings had d/D ratios larger than 0.90, which produced smallchanges in mean d.b.h., but net periodic growth accounted for practically all of the in-crease in mean d.b.h. The range of mean annual growth rates among the eight regimeswas only 0.30 to 0.42 inch at Skykomish and 0.24 to 0.43 inch at Clemons. The cumu-lative result was a difference of 5.6 inches between the smallest and largest meand.b.h. at Skykomish, and 6.4 inches at Clemons.
The long-term effect of thinning on tree size is shown by the range of diameters ineach regime (app. tables 42 and 58) compared with the nonthinned stands. In theSkykomish study area, maximum diameters in thinned stands were larger than controlsin all regimes except treatment 2, which was 1 inch less than the largest in controls.This regime had a comparatively high proportion of hemlock with most of the trees inthe 12- to 18-inch d.b.h. classes. Across all regimes there was no apparent trend inmaximum size related to levels of growing stock. A narrower range of diameters wasproduced at Clemons, probably because the stand is younger than the stand atSkykomish. However, the largest trees in treatment 1 and treatment 2 at 25 inchesd.b.h. were equal to the largest in the unthinned stands.
The long-term effect of thinning on tree size is demonstrated further by the distributionof volume by d.b.h. class. The cubic volume per acre in the reserved stand in each re-gime is shown in figures 23A and 23B for d.b.h. classes 6 to 12 inches, 12 to 18inches, and 18 inches and larger. These were volumes of the live stands at the lastmeasurement, ages 56 and 50 for Skykomish and Clemons, respectively, and do notinclude thinnings. These charts also show the trends of increasing total volume with
Tree Size

31
Figure 21—Quadratic mean diameter at breast height (d.b.h.) by stand age in relation to basal area for (A) Skykomish and (B) Clemons.Length of regression line corresponds with range in basal area at each age.
Figure 22—Trends in quadratic mean diameter at breast height (d.b.h.) by treatment and stand age for (A)Skykomish and (B) Clemons. Trend lines beyond last thinning show increases in mean d.b.h. during 14-yearperiod after the last thinning. Dots indicate time of thinning.

32
Table 11—Skykomish: Increase in quadratic mean diameter at breast height (d.b.h.) in relation to basalarea during 32-year period from age 24 to 56 for LOGS treatments and control
Age 24 Age 56Increase 32-year Mean annual
Treatmenta Basal area Mean d.b.h.b Basal area Mean d.b.h.b from thinningc growthd growth
Number Ft2 Inches Ft2 - - - - - - - - - - - - - - - Inches - - - - - - - - - - - - - - - -1 51 5.3 119 21.0 2.3 13.4 0.422 50 5.0 160 16.8 .9 10.9 .346 51 5.0 168 18.3 1.9 11.4 .363 51 5.0 173 18.8 2.2 11.6 .368 51 5.1 196 15.4 .5 9.8 .314 51 5.5 199 17.8 1.4 10.9 .345 51 5.1 218 15.4 .6 9.7 .307 51 5.2 244 15.5 .2 10.1 .32Control 72 4.7 271 12.9 — 8.2 .26a Listed in order of increasing basal area per acre at age 56. Two groups of treatments (2, 6, 3 and 8, 4, 5) had converging basal areatrends in the fifth growth period (see fig. 4).b Mean d.b.h. is the quadratic mean d.b.h.c Cumulative change in quadratic mean d.b.h. resulting from cutting in five thinnings.d Increase in d.b.h. from age 24 to 56 minus change from cutting (i.e., net growth for 32 years).
Table 12—Clemons: Increase in quadratic mean diameter at breast height (d.b.h.) in relation to basal areaduring 31-year period from age 19 to 50 for LOGS treatments and control
Age 19 Age 50Increase 31-year Mean annual
Treatmenta Basal area Mean d.b.h.b Basal area Mean d.b.h.b from thinningc growthd growth
Number Ft2 Inches Ft2 - - - - - - - - - - - - - - - Inches - - - - - - - - - - - - - - -1 37 4.1 101 18.1 0.7 13.3 0.432 38 4.2 133 18.0 1.7 12.1 .393 36 4.1 142 16.1 1.2 10.8 .356 37 4.1 147 14.6 .4 10.1 .334 37 4.2 156 14.2 .0 10.0 .325 34 4.0 171 13.5 .2 9.3 .308 34 4.0 275 11.7 .2 7.5 .247 35 4.0 195 11.8 .1 7.7 .25Control 60 4.0 230 10.5 — 6.5 .21a Listed in order of increasing basal area per acre at age 50. Two groups of treatments (2, 6, 3 and 8, 4, 5) had converging basal areatrends in the fifth growth period (see fig. 4).b Mean d.b.h. is the quadratic mean d.b.h.c Cumulative change in quadratic mean d.b.h. resulting from cutting in five thinnings.d Increase in d.b.h. from age 19 to 50 minus change from cutting (i.e., net growth for 31 years).

33
increasing levels of growing stock. From the standpoint of wood production, however,the more important consideration is the distribution of volume by tree size that wouldbe available for harvest. At Skykomish (fig. 23A), volumes in trees 12 inches and largerincreased with increasing levels of growing stock, but in trees 18 inches and larger, thetrends were more erratic. Treatment 2 produced the lowest volume in trees 18 inchesand larger, which was about equal to the unthinned control. Other regimes produced upto nearly 2,400 cubic feet per acre more (about 50 percent) than the controls in thesame large-diameter class. Total volumes of trees in the 18-inch-and-larger class didnot show a consistent relation to levels of growing stock. Apparently they developedmore as a result of selection in thinning. When the volumes of 12- to 18-inch trees wereincluded, only one thinned stand produced more than the control. That was regime 7,which had the highest level of growing stock. Treatment 5 was close with about 1,000cubic feet per acre less (about 9 percent) than the unthinned stand. When the volumesof the 6- to 12-inch trees are included, the total live volume in the unthinned stand wasabout 1,700 cubic feet per acre greater (about 15 percent) than treatment 7. This extravolume in small trees probably is worth much less than the higher volumes in largertrees in the thinned stands. Thinned stands have the advantage of concentrating thevolume on fewer trees. Treatment 7 at Skykomish had 188 trees per acre vs. 304 in theunthinned stand (app. table 36).
The distribution of volume in the 18-inch-and-larger d.b.h. class shows different trendsin the two study areas. At Skykomish, the low levels of growing stock, treatments 1 and2, produced less volume than other thinned stands. Conversely, at Clemons the highlevels of growing stock, treatments 7 and 8, produced less volume in the 18-inch-and-larger d.b.h. class than other thinned stands (fig. 23B). The current stand structuresat Clemons appear to be at a stage of stand development that will become more likethe stands at Skykomish as more trees move into larger size classes. At the presentstand age of 50, the volume in trees 18 inches and larger shows a downward trend withincreasing growing stock. All regimes except treatments 7 and 8, however, have pro-duced more volume than the control in these large-diameter classes. When trees in the12- to 18-inch classes are included, the total volume increases with increased growingstock in a trend similar to that at Skykomish. Also, the volume in regime 7 is equal tothat of the unthinned control. When trees in the 6- to 12-inch classes are included, thetotal live volume per acre in the control stands exceeds treatment 7 by 1,300 cubic feet,or 16 percent, nearly the same percentage as Skykomish.
The distribution of tree sizes in the total net yield (remaining volume and thinnings) ofeach regime is shown in figures 24A and 24B for Skykomish and Clemons, respectively.The difference between these charts and those for live stand (figs. 23A and 23B) is theaddition of trees that were cut in thinnings.
In both study areas, the long-term effect of thinning on tree size has been a pronouncedrestructuring and high concentration of volume in large trees. All thinning regimes atSkykomish and six of the eight regimes at Clemons have produced as much or morevolume in 18-inch-diameter-and-larger trees than the unthinned controls in similar sizesof trees. In diameter classes of 12 inches and larger, regime 7 in both areas producedabout the same as the controls, but with about one-third fewer trees. With larger andfewer trees, the thinned stands in most regimes have the additional advantages of fastergrowth rates (figs. 20A and 20B) and less future loss from suppression mortality thanthe dense unthinned stands. The thinned stands have distinctly different structures andgrowth characteristics than the unthinned stands. Although started from the samestand, the present thinned and unthinned stands have developed into virtually different

34
populations of trees. The development of these thinned stands with a wide range inlevels of growing stock has demonstrated the opportunities for producing future standswith desired structures and yields for various management objectives.
The third major objective of the LOGS studies is to determine how the amount of grow-ing stock in repeatedly thinned stands affects growth-growing stock ratios. To examinethese relations, the growth-growing stock ratios were expressed as net growth percent-ages, which indicates the relative efficiency of the growing stock. The standard calcula-tion of growth percentages in LOGS is Pressler’s formula, the ratio of periodic annual
Growth-GrowingStock Ratios
Figure 23—Distribution of total stem volume by tree diameter at breast height (d.b.h.) and stand treatmentfor live stand for (A) Skykomish at age 56 and (B) Clemons at age 50.

35
volume growth to midperiod volume per acre where midperiod volume is estimatedby averaging volumes at the beginning and end of the growth period. (Chapman andMeyer 1949). By this method, growth percentage is less than compound interest byabout one percentage point for growth periods up to 5 years. Larger differences occurin longer periods. These growth percentages may be interpreted as periodic annualgrowth in cubic feet per 100 cubic feet of growing stock; i.e., growth per unit of growingstock. In this context these expressions of growth percentage also are a conservativeestimate of interest on capital invested in growing stock, which relates to Staebler’s(1967) management objectives.
Figure 24—Distribution of total stem volume by tree diameter at breast height (d.b.h.) and stand treatmentfor net yield (live stand plus thinnings) for (A) Skykomish at age 56 and (B) Clemons at age 50.

36
The relation of volume growth percentage to the amount of growing stock is shownby growth period in figures 25A and 25B. Two distinct trends are evident in all thinnedstands: (1) growth percentage was reduced by increases in growing stock in eachsuccessive growth period, and (2) growth percentage decreased rapidly with increasingage of stands. The continuous decline in growth percentage is displayed also in figures26A and 26B showing trends for thinned and unthinned stands. In thinned stands atSkykomish, growth percentage dropped from 17 percent to 4 percent over a period ofabout 30 years. At Clemons, the change was from about 24 percent to 5 percent. Bothtypes of stands followed nearly parallel trends with unthinned stands at lower levels ofgrowth percentage. These differences indicate that repeated thinning produced highergrowth-growing stock ratios by eliminating slower growing trees and releasing better
Figure 25—Total stem volume growth percentage by growth period in relation to midperiod basal area for (A) Skykomish and (B) Clemons.Regression lines span the range of basal area at each period of stand age.
Figure 26—Trends of periodic total stem volume growth percentage by stand age for thinned plots and controls for (A) Skykomish and(B) Clemons. Vertical lines show range of growth percentage for each category of stands.

37
trees for growth response. The trends of growth percentage in both types of standsillustrate the natural characteristic of stand development where periodic annual growth(PAI) slows as growing stock accumulates. The inevitable result is a gradual reductionin growth-growing stock ratios. Repeated thinning produced more efficient stands withconsistently higher ratios than unthinned stands but with similar declining trends.
Further comparisons of thinned and unthinned stands are given in table 13 showing thedistribution of growth percentage for a sample of individual trees from each regime. Thegrowth percentages were calculated for the fifth growth period, which was the last periodof thinning and the beginning of the postthinning holding period. This period was chosenbecause the cumulative result of five thinnings should have left reserve stands of thehighest quality and most vigorous trees that could be developed from the initial stands.Individual trees in these final stands survived the scrutiny of selection in five thinnings.Therefore they should have uniformly high growth rates and a narrow range of growthpercentage compared to the survivors in unthinned stands. These sample trees (table13) had been measured for total height (not estimated) and represent the range ofdiameters but not necessarily the frequency of diameters. The mean growth percentagefor trees in thinned stands was higher than for those in unthinned stands as shown infigure 26. However, the differences between high and low growth percentages, pluscomparatively high variability in thinned stands indicates that several trees with slowgrowth remained even after five thinnings. This is the unfortunate result of the method ofthinning that required a d/D ratio of 1 for both noncrop trees and cut trees evenly distrib-uted across diameter classes (see “Stand Treatments” section in this report). This pro-cedure resulted in uniformity of treatments, but it also restricted selection so that someof the better trees were cut and some poor growers were retained through the entirethinning cycle.
The range and variability of growth percentage (table 13) provides a basis for estimatingthe possible increase in mean growth percentage that could have been obtained if cur-rent growth had been a determining factor in selection of trees to be cut or retained. Theimportance of current growth of individual trees as a guideline for selection in thinning isillustrated in the following hypothetical example. With the existing difference betweenhigh and low growth percentages, an increase of two percentage points in mean growthpercentage appears reasonable and achievable over five thinnings. We assume growthpercentages in treatments 1, 3, 5, and 7 could have been two percentage points higherin the fifth period. At the same level of growing stock but different stand structures, theincrease in average PAI would have been about 86 cubic feet at Skykomish and 55cubic feet at Clemons. These improvements would have made 24 percent more woodper acre annually in each area during the fifth period. Smaller increases in yield couldhave occurred during earlier periods as well. An added benefit would have been a highergrowth rate during the postthinning holding period. The procedures followed in thesestudies produced substantial improvements in growth-growing stock ratios, but theyields might have been improved with different methods of thinning.
Thinning regimes were completed after 18 years at Skykomish and 17 years atClemons, which included five thinnings in each area. The reserved stands were held forcontinued measurements over a period of 14 years. During this postthinning holdingperiod, measurements were made at 4, 9, and 14 years. Including the thinning cycle,the total period of observation was 32 years at Skykomish and 31 years at Clemons.
PostthinningHolding Period

38
Table 13—Comparison of thinned and control stands based on total stemvolume growth percentage for individual trees in the fifth growth perioda
Volume growth
Study area Trees High Low Mean SDb CVc
Number - - - - - - - - - - - - - Percent - - - - - - - - - - - - -Skykomish:
Thinned 52 12.5 5.7 8.4 1.6 19Control 14 9.7 3.5 6.8 1.9 27
Clemons:Thinned 60 12.7 3.9 8.8 2.0 23Control 25 7.5 2.8 5.5 1.3 24
a Fifth growth period was the period of the last thinning; Skykomish stand age 38 to 42,Clemons stand age 32 to 36 years.b SD = standard deviation.c CV = coefficient of variation.
The stands that remained after the last thinning had survived through repeated selec-tions of trees to be cut in the preparatory and five subsequent thinnings. Consequently,these reserved trees should have been the highest quality that could be produced bythe LOGS prescriptions in the given initial stands. The long-term benefits of thinning aredemonstrated by development of these valuable stands during the postthinning holdingperiod. In both study areas, net PAI during the last 5 years was equal to or greater thancontrols in all regimes except treatment 1 at Clemons. The largest differences were intreatment 5 at Skykomish and treatment 6 at Clemons where net PAI in the thinnedstands exceeded controls by 166 and 57 cubic feet, respectively (figs. 20A and 20B).These excellent growth rates illustrate the advantages of holding these stands to accu-mulate high-quality wood for several years after thinning regimes are completed.
Stand volume increments were closely related to levels of growing stock that remainedafter the last thinning; i.e., at the beginning of the hold period. (fig. 27). For example,treatment 1 at Skykomish with 68 square feet of basal area produced 3,050 cubic feetper acre in 14 years. In the same period, treatment 7 with 167 square feet of basalarea produced 5,749 cubic feet, or 88 percent more gross increment in the higher levelof growing stock. Within each growth period, the volume increment increased with in-creasing growing stock. When those increments were expressed as percentages ofinitial volume, however, the percentage increase was virtually the same for all regimesin the first 4-year growth period. As the period of growth after thinning progressed, theamount of added volume in each regime was more variable, but the averages by periodprovide a close approximation for all regimes (table 14). A holding period of 4 yearswould have produced about 30 percent additional volume. Extending the holding periodto 9 years would have produced about 70 percent additional volume. If the holding periodwas continued to 14 years, these stands would have produced at least twice the stand-ing volume per acre present after the last thinning.
Although the lowest levels of growing stock produced the least volume during the post-thinning holding period, they produced the largest increases in average d.b.h. (fig. 28).At Skykomish, treatment 1 increased from 15.8 to 21 inches, a gain of 5.2 inches in

39
Figure 27—Gross total stem volume increment for 4, 9, and 14 years after the last thinning in relation to basal area after the last thinning for(A) Skykomish and (B) Clemons.
Table 14—Average percentage increase in gross total stemvolume per acre by period of growth after last thinninga
Skykomish Clemons
Growth Increase in Standard Increase in Standardperiod volume deviation volume deviation
Years Percent Percent4 32 2 31 49 69 5 80 13
14 108 10 134 22a Based on increase in gross total stem cubic-foot volume per acre in 8 regimes ineach study area.
quadratic mean d.b.h. in 14 years. In the same period, treatment 7 increased 3.4inches. At Clemons, comparable gains were 5.4 and 2.5 inches for treatment 1 andtreatment 7, respectively.
Along with increases in yield and tree diameters, the average volume per tree increasedin roughly the same proportions as volume per acre. The average volume per tree in allthinned stands at Skykomish were at 37 cubic feet at the beginning and 80 cubic feetat the end of the holding period (app. tables 36–39). Comparable volumes per tree atClemons were 21 and 50 cubic feet (app. tables 52 and 55). Comparisons with unthin-ned stands show the much larger gains in volumes per tree that resulted from thinning.During the 14-year holding period, average beginning and ending volumes per tree inunthinned stands at Skykomish were 18 and 44 cubic feet. At Clemons they were 11and 24 cubic feet. In each area the thinned stands produced average tree sizes abouttwice as large as those in unthinned stands. These differences in tree size could bedecisive factors in length of the holding period. Continued stability of the managedstand during the holding period was another long-term benefit of thinning.

40
Mortality in unthinned stands during the 14-year holding period was 35 and 31 percentof the trees at Skykomish and Clemons, respectively. In this same period, mortality ineach study area was only 6 percent in thinned stands. Among regimes, losses rangedfrom zero to 13.5 percent. Those with no mortality in 14 years were treatments 1 and5 at Skykomish and treatments 1, 2, and 6 at Clemons. The heaviest losses were intreatment 6 at Skykomish and treatment 4 at Clemons. With this erratic distribution ofmortality by regime, there was no apparent relation of stand stability to levels of growingstock. The total mortality, however, increased slightly as the holding period progressedthrough the three growth periods from 4 to 14 years. At Skykomish, the losses in suc-cessive periods were 1, 2, and 3 percent of the trees remaining after the last thinning.At Clemons, the successive losses were 2, 1, and 3 percent of the remaining trees.These minor increases and overall low mortality show high stand stability and virtuallyno added losses for up to 14 years after the last thinning.
The large increases in volume per acre and tree size have produced substantial in-creases in value of these stands. The extra yield enhanced by the high quality of thesemanaged stands makes the length of the holding period after thinning an importantfactor in scheduling the final harvest.
The volume of wood lost to mortality is summarized by stand treatment for the periodsof thinning and the postthinning holding periods in tables 15 and 16. The distribution ofmortality among thinning regimes shows no relation to levels of growing stock. The totalvolumes of mortality in thinned stands in each study area were less during the periodsof thinning than during the postthinning holding periods. Frequent thinnings and com-paratively small size of dead trees during the thinning periods resulted in smaller totallosses. Some mortality occurred in all thinned stands in each study area, but all re-gimes lost less than the unthinned controls. In six regimes at Skykomish and five atClemons, the volume losses were less than 20 percent of the losses in their respectivecontrols. In the other regimes, the losses ranged from 20 to 44 percent of the controlswith the highest in treatment 4 at Clemons.
Figure 28—Increase in quadratic mean diameter at breast height (d.b.h.) for 4, 9, and 14 years after the last thinning in relation to basal areaafter the last thinning for (A) Skykomish and (B) Clemons.
Mortality

41
Table 15—Skykomish: Cumulative mortality total stem volume per acre byperiod and treatment with percentage of total gross yield lost by age 56 years
Thinning period Holding period Totalvolume volume volume Gross
Treatmenta (age 24–43) (age 42–56) (age 24–56) yield
Number - - - - - - - - - - - - Ft3/acre - - - - - - - - - - - - Percent1 17 0 17 <12 50 195 245 23 46 12 58 16 185 202 387 34 0 307 307 35 50 0 50 <18 161 565 726 67 101 378 479 4Control 622 1,773 2,395 15a Listed according to severity of thinning based on prescribed amount of basal area retained ingrowing stock: 1, 10 percent; 2, 3, and 6 average 30 percent; 4, 5, and 8 average 50 percent;7, 70 percent (table 1).
Table 16—Clemons: Cumulative mortality total stem volume per acre by periodand treatment with percentage of total gross yield lost by age 50 years
Thinning period Holding period Totalvolume volume volume Gross
Treatmenta (age 19–36) (age 36–50) (age 19–50) yield
Number - - - - - - - - - - - - Ft3/acre - - - - - - - - - - - - Percent1 27 0 27 <12 132 0 132 23 30 11 41 16 50 0 50 14 236 393 629 85 189 284 473 68 117 33 150 27 148 310 458 5Control 289 1,149 1,438 13a Listed according to severity of thinning based on prescribed amount of basal area retained in growingstock: 1, 10 percent; 2, 3, and 6 average 30 percent; 4, 5, and 8 average 50 percent; 7, 70 percent(table 1).
The percentage of loss in cubic feet per acre by period and the cause of loss aresummarized in tables 17 and 18. The major cause of mortality in thinned stands wasdisease, predominately root rot, which was widely distributed among plots in bothstudy areas. Mortality from disease occurred on 11 thinned plots and 2 controls atSkykomish, and 8 thinned plots and 2 controls at Clemons. These plots representedseven regimes at Skykomish and five regimes at Clemons. At Skykomish only 1 to 6

42
trees per plot died during the 32 years of observation. The number of dead trees perplot was similar at Clemons except for one plot with 11 dead trees and another with14 during the 31 years of observation. These two concentrations of root rot appear tobe foci that probably will expand and result in larger losses as the stands get older.
Additional data on the impact of mortality on total wood production in thinned standsare presented in stand development tables (app. tables 27 to 35 and 43 to 51). Thevolume per acre lost in each thinning period with total volume and percentage of grossyield are given for each regime. The proportion of gross yield lost during 32 years atSkykomish ranged from none to 6 percent in thinned stands and 15 percent in controls.During 31 years of observation at Clemons, the range was none to 8 percent in thinnedstands and 13 percent in controls.
Virtually all the mortality from suppression occurred during the postthinning holdingperiods in both areas. The loss of suppressed trees was largely preventable. Thesehigh-risk trees could have been identified and removed in thinning before they died.This was not done because of the restrictive marking rules that were imposed to main-tain control of the stand structure and levels of growing stock. The method of thinningrequired a d/D ratio of 1 for noncrop trees with cut trees evenly distributed across diam-eter classes (see “Stand Treatments”). This resulted in leaving some small trees thatwere suppressed or would become suppressed during the next growth period. Treesin this category that remained after the last thinning were destined to die during thepostthinning holding period. To estimate the time that Douglas-fir survived in a sup-pressed condition, a sample of 44 trees were traced on successive periodic measure-ments from the time they were classified as suppressed until found dead. Within 4years, 30 percent were dead, 60 percent were dead in 8 years, and all were dead in
Table 17—Skykomish: Percentage of total stem volume lost to mortality byperiod and cause for all treatments
Period (stand age) Disease Weather Suppression Unknown Total
PercentThinning (24–42) 19 7 1 2 29Holding (42–56) 26 33 11 1 71Total (24–56) 45 40 12 3 100Unthinned control (24–56) 3 39 55 3 100
Table 18—Clemons: Percentage of total stem volume lost to mortality by period and cause forall treatments
Period (stand age) Disease Weather Animals Suppression Unknown Total
PercentThinning (19–36) 25 4 20 0 2 51Holding (36–50) 24 7 0 18 0 49Total (19–50) 49 11 20 18 2 100Unthinned control (19–50) 17 17 0 66 0 100

43
12 years. The early removal of suppressed trees has long been recognized as a highpriority in thinning Douglas-fir (Worthington and Staebler 1961). Although incompatiblewith recommended marking priorities, the procedures in LOGS were necessary toachieve uniform treatments. In application of the LOGS results, the removal of potentialmortality should be a high priority in selecting trees for thinning.
A component of 16 (80 per acre) well-formed, healthy dominant trees were marked ascrop trees on each sample plot. They were a common element of the stand in everylevel of growing stock. The various uses of crop trees and their influence on standdevelopment was a unique feature of the LOGS studies. Specific controls included(1) uniformity of initial stands—if suitable crop trees were not present on a sampleplot, the plot was rejected; (2) minimum tree size—the minimum d.b.h. of trees leftafter the calibration cut was one-half the quadratic mean d.b.h. of crop trees; (3) intervalof thinning—time between thinnings was based on an increase of 10 feet in averageheight of crop trees; (4) site index—a sample of crop trees was selected for measure-ment of site index; (5) all thinnings were taken from noncrop trees until only crop treesremained, then crop trees were cut only when necessary to comply with the prescribedlevels of growing stock; (6) distribution of d.b.h.—cut trees were distributed across thediameter range of noncrop trees so the average d.b.h. of cut trees was about equal tothe average d.b.h. of noncrop trees before thinning, i.e., d/D = 1 for noncrop trees. Moredetailed specifications for the uses of crop trees are given in previous sections of thisreport on “Plot Establishment and Stand Treatments.”
The division of stands into components of crop and noncrop trees provided (1) croptrees with a large proportion of the volume in every regime and (2) thinnings from thenoncrop trees such that growth of the total stand could be controlled while favoring thedevelopment of the crop trees. These complementary functions could proceed only aslong as enough noncrop trees were available to carry out the prescribed thinnings.Where all noncrop trees had been removed, the prescribed thinning was carried out byremoving crop trees (item 5 above). In that case, the regime could not be carried out asplanned without reducing the final harvest. This damaging condition prevailed in treat-ment 1 at both Skykomish and Clemons. This prescription removed all the noncroptrees plus 30 crop trees per acre at Skykomish and 27 at Clemons. These missingcrop trees would have produced about one-third of the total yield in the final stand. Thisexcessive thinning severely damaged the productivity of the stand. Consequently, treat-ment 1 must be designated a silvicultural failure. A borderline condition was produced intreatment 2 at Clemons where the stand was reduced to a total of 75 trees per acrewith 70 crop trees remaining. Some of the original crop trees were lost in all regimes,but generally suitable replacements were available from the noncrop component. Overthe span of 32 years at Skykomish and 31 years at Clemons, crop tree survival inthinned stands excluding treatment 1 was 82 and 77 percent, respectively. Survival inthe unthinned stands was 89 to 79 percent. The final allocation of numbers of trees andvolumes by crop and noncrop components for all regimes are given in tables 19 and 20.The listed numbers of crop trees are the survivors from the original selections. The pro-portion of volume per acre in crop trees is less in high levels of growing stock becauseof the larger numbers of noncrop trees in those regimes. Volumes in crop trees by re-gime varied from 53 to 88 percent at Skykomish and 43 to 96 percent at Clemons. Inthe unthinned stands, the crop trees accounted for only 38 and 19 percent of the vol-ume at Skykomish and Clemons, respectively. These large differences between thinned
Crop Trees
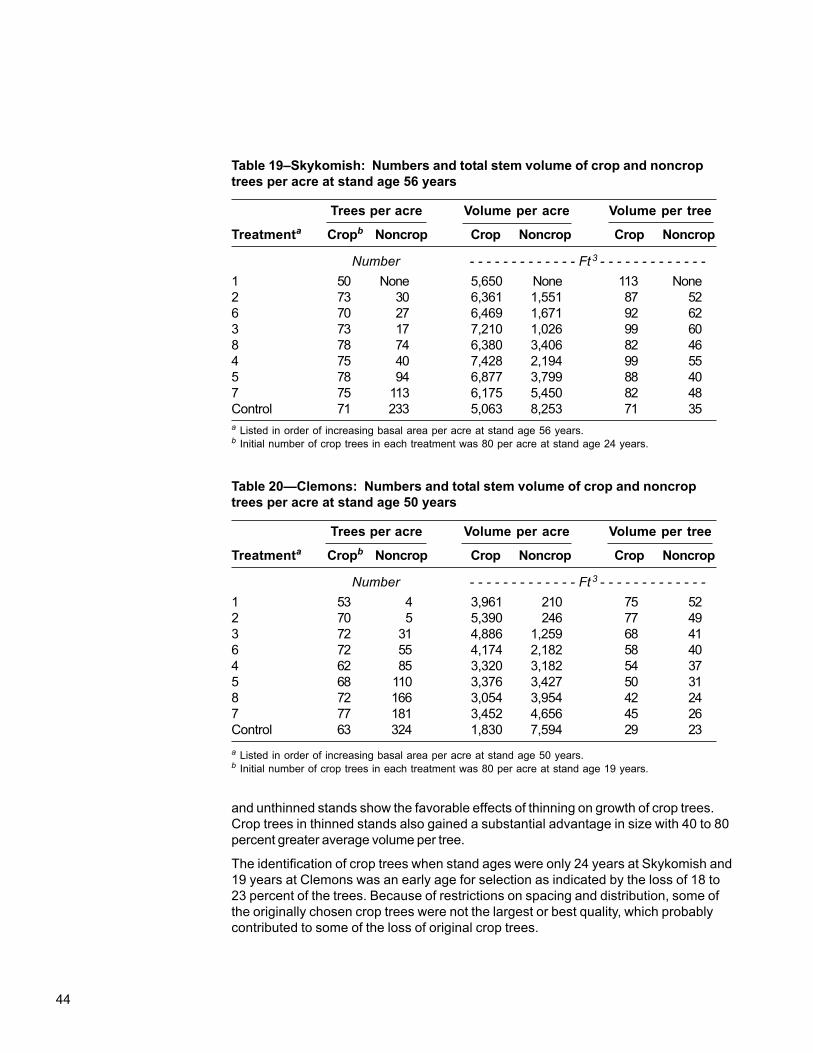
44
and unthinned stands show the favorable effects of thinning on growth of crop trees.Crop trees in thinned stands also gained a substantial advantage in size with 40 to 80percent greater average volume per tree.
The identification of crop trees when stand ages were only 24 years at Skykomish and19 years at Clemons was an early age for selection as indicated by the loss of 18 to23 percent of the trees. Because of restrictions on spacing and distribution, some ofthe originally chosen crop trees were not the largest or best quality, which probablycontributed to some of the loss of original crop trees.
Table 19–Skykomish: Numbers and total stem volume of crop and noncroptrees per acre at stand age 56 years
Trees per acre Volume per acre Volume per tree
Treatmenta Cropb Noncrop Crop Noncrop Crop Noncrop
Number - - - - - - - - - - - - - Ft 3 - - - - - - - - - - - - -1 50 None 5,650 None 113 None2 73 30 6,361 1,551 87 526 70 27 6,469 1,671 92 623 73 17 7,210 1,026 99 608 78 74 6,380 3,406 82 464 75 40 7,428 2,194 99 555 78 94 6,877 3,799 88 407 75 113 6,175 5,450 82 48Control 71 233 5,063 8,253 71 35a Listed in order of increasing basal area per acre at stand age 56 years.b Initial number of crop trees in each treatment was 80 per acre at stand age 24 years.
Table 20—Clemons: Numbers and total stem volume of crop and noncroptrees per acre at stand age 50 years
Trees per acre Volume per acre Volume per tree
Treatmenta Cropb Noncrop Crop Noncrop Crop Noncrop
Number - - - - - - - - - - - - - Ft 3 - - - - - - - - - - - - -1 53 4 3,961 210 75 522 70 5 5,390 246 77 493 72 31 4,886 1,259 68 416 72 55 4,174 2,182 58 404 62 85 3,320 3,182 54 375 68 110 3,376 3,427 50 318 72 166 3,054 3,954 42 247 77 181 3,452 4,656 45 26Control 63 324 1,830 7,594 29 23a Listed in order of increasing basal area per acre at stand age 50 years.b Initial number of crop trees in each treatment was 80 per acre at stand age 19 years.

45
The formidable task of carrying on the LOGS long-term experiments on nine region-wideinstallations, all coordinated by a single plan, has produced a superior collection of dataon Douglas-fir silviculture with many possible applications. The versatility of these datais indicated by the variety of applications that have been carried out by cooperators andassociates. The most extensive application was comparisons of the LOGS data withprojections of stand statistics by Curtis (1987). He used the LOGS data from all nineinstallations for projection periods of 6 to 18 years to compare actual data with esti-mates calculated by using his Douglas-fir stand simulator (DFSIM) (Curtis and others1981, 1982). These comparisons, combined with others, indicate some possible modifi-cations to the DFSIM.
Other comparisons of growth-growing stock relations with results of the Langsaeterhypothesis show that Douglas-fir in the LOGS studies does not conform with thathypothesis (Curtis and others 1997). The same conclusion is reported in severalprogress reports listed in the front of this report. Similar conclusions are evident in theSkykomish and Clemons study results. These repeated observations are substantialevidence that Langsaeter’s hypothesis was based on other kinds of stand conditions.
Stand data from the LOGS studies have provided an opportunity to demonstrate theuse of relative density as an alternative to basal area for a measure of growing stock.Relations of growth in volume, basal area, and d.b.h. and some guides for stand man-agement and other uses of relative density are shown by Curtis and Marshall (1986)and progress reports 7, 10, 11, 12, and 13 listed in the front of this report.
Stand data from the Hoskins installation has been used to identify stand managementimplications and financial aspects of thinning young Douglas-fir (Tappeiner and others1982). They found that “there is considerable flexibility in the timing, intensity, andgrade of thinning of young Douglas-fir stands on productive sites.” Estimated financialreturns indicate that thinning young, rapidly growing Douglas-fir can be profitable andcan increase returns compared to unthinned stands.
Eventually the combined data from all nine LOGS installations will provide a basisfor many more applications in stand management. In the interim, the data from theSkykomish and Clemons installations provide an opportunity and an obligation todevelop more applications for management of young stands of Douglas-fir. These stud-ies have produced eight new thinning regimes from 495 individual plot measurements.
Each regime was developed in two stand conditions: a 24-year-old natural stand ofDouglas-fir and western hemlock at Skykomish and a 19-year-old Douglas-fir plantationat Clemons. Because the first thinnings were at different ages, the basal area-age rela-tions and related parameters are different for a given regime in the two study areas. Thetrends, however, are essentially the same in both areas as shown in figures 3A and 3Band figures 4A and 4B. Any of these regimes may be applied directly in management ofyoung stands or modified to achieve a particular silvicultural objective as anticipated byStaebler (see “Objectives”). These regimes are designed for long-term applications. Anabbreviated or otherwise modified regime probably would achieve some benefits, but theoutcome would be conjectural. All regimes are defined by the quantitative descriptionsin stand development tables (apps. 2, 3, 4, and 5). Regime numbers in stand develop-ment tables correspond with treatment numbers in table 1. The key to identification ofeach regime is the level of growing stock expressed as basal area per acre after thin-ning at six control points; i.e., the initial stand plus five thinnings. In addition to showingbasal area after thinning, the stand development tables show related stand data. They
Applications

46
also are a guide for application of each regime and an estimate of stand conditions thatcan be produced. Data from other LOGS installations indicate that results from theClemons study may be conservative for midsite class II stands.
The principal controlling factor when applying these regimes (not including the calibra-tion cut) is basal area per acre after thinning in relation to stand age. This is consistentwith the use of basal area as the controlling factor when the regimes were developedaccording to the prescribed thinning schedules (table 1). The measurement of basalarea is a practical and efficient procedure for controlling growing stock in large areas.It also provides a sound basis for defining silvicultural objectives and estimating futureyields.
The rigid field procedures used to control regimes in the LOGS studies would not beneeded and usually would not be practical in operational thinnings. This does not pre-clude the application of these regimes if basic principles in the LOGS thinnings arefollowed. To achieve results comparable to the stand development tables, these thinningregimes should be restricted to stands of Douglas-fir on site class II. There are otherbasic requirements when applying these regimes: (1) The basal area per acre after eachthinning should average within 10 percent of the prescribed level at the given stand agefor the chosen regime. The prescribed level for ages not listed in the stand developmenttable may be determined by interpolation. (2) Promote the value and stability of thestand by maintaining d/D ratios that do not exceed 1.0. Higher ratios may be required,however, in an early thinning where removal of large, poor-quality trees (wolf trees) isdesirable to improve the structure and quality of stands. (3) Trees to be cut should beselected to prevent mortality in and to favor the best trees for the final crop. To controlthe quality of stands in these long-term regimes, marking of crop trees may be helpful.Marked trees provide continuity in selection procedures in successive thinnings. Experi-ence in operational thinnings including cable systems and feller-bunchers has shownthat distinct marking is needed to protect trees reserved for the final crop (Reiger 1985).(4) The interval and severity of successive thinnings may vary provided the prescribedbasal area per acre after thinning is maintained and the cut in a single thinning does notexceed 30 percent of the standing volume. This maximum cut is about equal to theproportion of volume removed in the last two thinnings of treatment 6, which was thehighest percentage cut of all regimes. These thinnings removed 32 percent and 29 per-cent of the standing volume in treatment 6 at Skykomish and Clemons, respectively. Ifthe last two thinnings had been combined, the interval would have been 8 years atSkykomish and 7 years at Clemons. A maximum of 30 percent removal in a single thin-ning provides flexibility in the thinning cycle that may be advantageous for economicfactors. For silvicultural purposes, it provides a controlled release of growing space withstability of the residual stand and continuous use of the site. These guidelines conformwith favorable experience in other thinning trials (Johnston and others 1967, King 1986,Reukema 1972).
To facilitate the selection of a regime for a particular application, a comparison of re-gimes is given in tables 21 through 26. These comparisons show items common to allregimes in three stages of stand development: (1) The initial stand—Basic stand dataafter the calibration cut are given to indicate the amount of growing stock from which theLOGS regimes were developed. LOGS prescriptions could be applied in stands withless initial stocking provided enough trees are present to complete the chosen thinningregime. (2) The stand after the last thinning—These data define the stands as they wereafter thinning regimes were completed. This perspective of a regime provides a target to
Regime Comparisons

47
be achieved in application. (3) Stand at end of 14-year holding period—The comparativeyields and sizes of trees produced in each regime indicate the potential to be expectedin applications.
The terminology pertaining to thinning schedules in the study plan and first progressreport (Williamson and Staebler 1971) is continued here to identify the types of regimes.The terms “constant, or fixed, variable increasing and variable decreasing” pertained tothe percentages of growth retained in treatment schedules (table 1). The same termsappear in tables 21 through 26. They do not indicate a specified characteristic of thecompleted regimes but indicate procedures followed in their development. Regimes with
Table 21—Skykomish: Comparison of regimes with constant 10, 30, 50, and70 percent of growth retained (table 1)
Treatment
1 (10%) 3 (30%) 5 (50%) 7 (70%)
Initial stand—24 yrs:Trees per acre 340 375 363 352Quadratic mean d.b.h. (in) 5.3 5.0 5.1 5.2Basal area per acre (ft2) 51 51 51 51Volume per acre (ft3) 981 931 939 964
After last thinning—42 yrs:Trees per acre 50 92 172 208Average spacing (ft) 30 22 16 14Quadratic mean d.b.h. (in) 15.8 14.3 12.1 12.1Basal area per acre (ft2) 68 101 134 167Volume per acre (ft3) 2,600 3,740 5,255 6,253
Crop trees per acre— 50 73 78 75Quadratic mean d.b.h. (in) 15.8 14.8 13.9 14.0Volume per acre (ft3) 2,600 3,249 3,265 3,030
Total thinning yield per acre (ft3)— 3,043 2,472 1,780 1,477Percent of gross yield 54 39 25 19
End of holding period—56 yrs:Trees per acre 50 90 172 188Quadratic mean d.b.h. (in) 21.0 18.8 15.4 15.5Basal area per acre (ft2) 119 173 218 244Volume per acre (ft3) 5,650 8,236 10,676 11,625Average volume per tree (ft3) 113 92 62 62PAI (14-yr holding period) (ft3) 218 321 387 384D.b.h. range (in) 15–31 10–30 8–28 9–30Net yield per acre (ft3) 8,693 10,708 12,456 13,101Mortality per acre (ft3) 17 58 50 478Gross yield per acre (ft3) 8,710 10,766 12,506 13,579

48
constant percentages of growth retained (treatments 1, 3, 5, and 7) are listed togetherin tables 21 and 24. Similarly, regimes with increasing, constant, and decreasing per-centages are in two groups: low levels of growing stock (treatments 2, 3, and 6) intables 22 and 25, and higher levels (treatments 4, 5, and 8) in tables 23 and 26. Theconstant treatment regimes 3 and 5 are included for comparisons of variable and con-stant regimes at similar levels of growing stock. The choice of a regime for applicationwould logically include consideration of both types. Following are some observationsand recommendations pertaining to specific regimes.
Constant regimes (treatments 1, 3, 5, and 7)—These regimes accumulated growingstock in the residual stands by about equal additions of basal area at each of the fivesuccessive thinnings (fig. 4). The average rate of accumulation in treatments 1, 3, 5,
Table 22—Skykomish: Comparison of regimes with average 30 percent of growthretained in increasing, constant, and decreasing prescriptions (table 1)
Treatment
2 increasing 3 constant 6 decreasing
Initial stand—24 yrs:Trees per acre 368 375 385Quadratic mean d.b.h. (in) 5.0 5.0 5.0Basal area per acre (ft2) 50 51 51Volume per acre (ft3) 887 931 963
After last thinning—42 yrs:Trees per acre 107 92 100Average spacing (ft) 20 22 21Quadratic mean d.b.h. (in) 13.1 14.3 13.8Basal area per acre (ft2) 99 101 99Volume per acre (ft3) 3,834 3,740 3,825
Crop trees per acre– 77 73 73Quadratic mean d.b.h. (in) 13.8 14.8 14.1Volume per acre (ft3) 3,080 3,249 3,042
Total thinning yield per acre (ft3)— 2,241 2,472 2,874Percent of gross yield 37 39 42
End of holding period—56 yrs:Trees per acre 103 90 97Quadratic mean d.b.h. (in) 16.8 18.8 18.3Basal area per acre (ft2) 160 173 168Volume per acre (ft3) 7,912 8,236 8,140Average volume per tree (ft3) 77 92 84PAI (14-yr holding period)(ft3) 291 321 308D.b.h. range (in) 11–25 10–30 8–31Net yield per acre (ft3) 10,152 10,708 11,014Mortality per acre (ft3) 245 58 388Gross yield per acre (ft3) 10,397 10,766 11,402

49
and 7 was 0.9, 2.8, 4.6, and 6.4 square feet annually at Skykomish. The rate of accu-mulation at Clemons was less than at Skykomish by a fraction of a square foot. Theinterval between successive regimes at the last thinning was 33 square feet of basalarea per acre at Skykomish with a low of 68 in treatment 1 and a high of 167 in treat-ment 7. At Clemons where the thinning cycle ended at stand age 36, 6 years youngerthan at Skykomish, the interval between regimes was 28 square feet per acre. The low-est regime, treatment 1, had only 49 square feet, and the highest, treatment 7, had 133square feet. These regimes provide a wide range of options for application. Their orderlyand gradual increases in residual growing stock would be more economical and easierto manage than the fluctuating levels in variable regimes.
Table 23—Skykomish: Comparison of regimes with average 50 percent of growth retainedin increasing, constant, and decreasing prescriptions (table 1)
Treatment
Control4 increasing 5 constant 8 decreasing unthinned
Initial stand—24 yrs:Trees per acre 315 363 360 594Quadratic mean d.b.h. (in) 5.5 5.1 5.1 4.7Basal area per acre (ft2) 51 51 51 72Volume per acre (ft3) 909 939 926 1,266
After last thinning—42 yrs:Trees per acre 122 172 173 470Average spacing (ft) 19 16 16 10Quadratic mean d.b.h. (in) 14.2 12.1 11.9 9.3Basal area per acre (ft2) 134 134 134 219Volume per acre (ft3) 5,049 5,255 4,990 8,352
Crop trees per acre— 78 78 80 79Quadratic mean d.b.h. (in) 15.4 13.9 13.6 12.2Volume per acre (ft3) 3,865 3,265 3,073 2,544
Total thinning yield per acre (ft3)— 1,519 1,780 1,971 nonePercent of gross yield 23 25 28 none
End of holding period—56 yrs:Trees per acre 115 172 152 304Quadratic mean d.b.h. (in) 17.8 15.4 15.4 12.9Basal area per acre (ft2) 199 218 196 271Volume per acre (ft3) 9,622 10,676 9,786 13,316Average volume per tree (ft3) 84 62 64 44PAI (14-yr holding period)(ft3) 327 387 343 354D.b.h. range (in) 8–28 8–28 7–27 5–26Net yield per acre (ft3) 11,142 12,456 11,756 13,316Mortality per acre (ft3) 307 50 726 2,395Gross yield per acre (ft3) 11,449 12,506 12,482 15,711
50
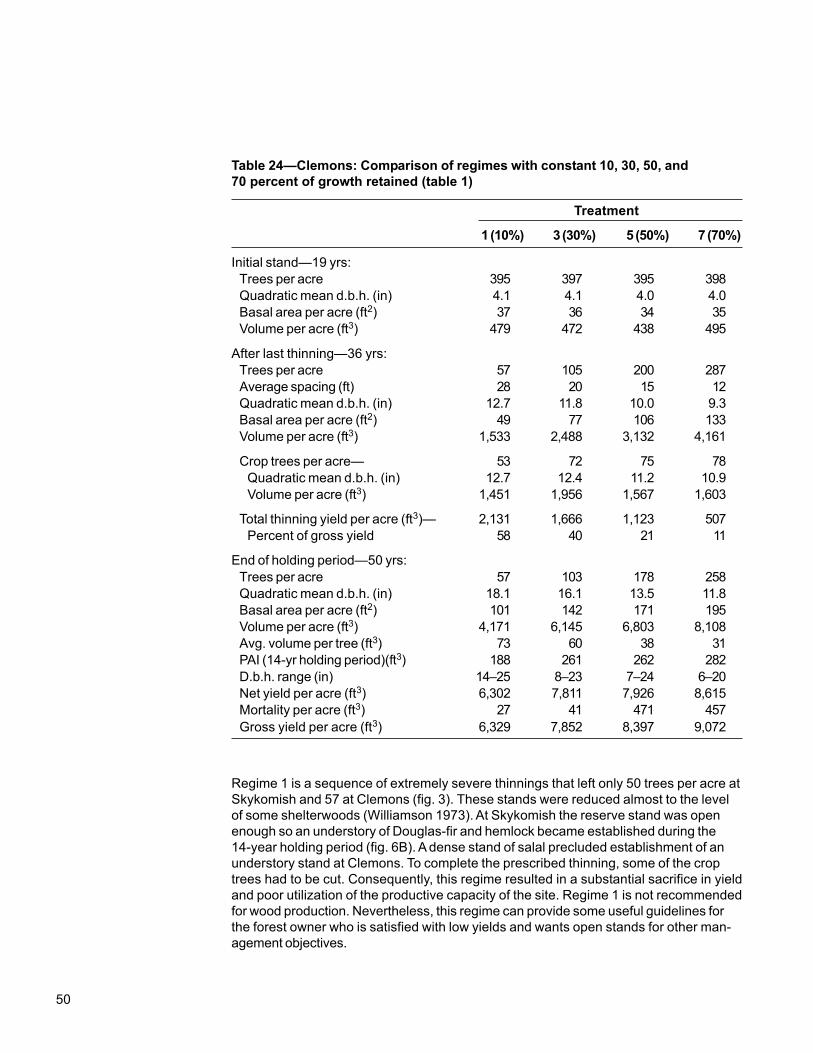
Regime 1 is a sequence of extremely severe thinnings that left only 50 trees per acre atSkykomish and 57 at Clemons (fig. 3). These stands were reduced almost to the levelof some shelterwoods (Williamson 1973). At Skykomish the reserve stand was openenough so an understory of Douglas-fir and hemlock became established during the14-year holding period (fig. 6B). A dense stand of salal precluded establishment of anunderstory stand at Clemons. To complete the prescribed thinning, some of the croptrees had to be cut. Consequently, this regime resulted in a substantial sacrifice in yieldand poor utilization of the productive capacity of the site. Regime 1 is not recommendedfor wood production. Nevertheless, this regime can provide some useful guidelines forthe forest owner who is satisfied with low yields and wants open stands for other man-agement objectives.
Table 24—Clemons: Comparison of regimes with constant 10, 30, 50, and70 percent of growth retained (table 1)
Treatment
1 (10%) 3 (30%) 5 (50%) 7 (70%)
Initial stand—19 yrs:Trees per acre 395 397 395 398Quadratic mean d.b.h. (in) 4.1 4.1 4.0 4.0Basal area per acre (ft2) 37 36 34 35Volume per acre (ft3) 479 472 438 495
After last thinning—36 yrs:Trees per acre 57 105 200 287Average spacing (ft) 28 20 15 12Quadratic mean d.b.h. (in) 12.7 11.8 10.0 9.3Basal area per acre (ft2) 49 77 106 133Volume per acre (ft3) 1,533 2,488 3,132 4,161
Crop trees per acre— 53 72 75 78Quadratic mean d.b.h. (in) 12.7 12.4 11.2 10.9Volume per acre (ft3) 1,451 1,956 1,567 1,603
Total thinning yield per acre (ft3)— 2,131 1,666 1,123 507Percent of gross yield 58 40 21 11
End of holding period—50 yrs:Trees per acre 57 103 178 258Quadratic mean d.b.h. (in) 18.1 16.1 13.5 11.8Basal area per acre (ft2) 101 142 171 195Volume per acre (ft3) 4,171 6,145 6,803 8,108Avg. volume per tree (ft3) 73 60 38 31PAI (14-yr holding period)(ft3) 188 261 262 282D.b.h. range (in) 14–25 8–23 7–24 6–20Net yield per acre (ft3) 6,302 7,811 7,926 8,615Mortality per acre (ft3) 27 41 471 457Gross yield per acre (ft3) 6,329 7,852 8,397 9,072

51
An important advantage of constant regimes (treatments 3, 5, and 7) is the high growthrates of the reserved stands. During the 14 years after thinning, treatments 5 and 7 atSkykomish and treatments 3, 5, and 7 at Clemons all produced higher PAI than theirrespective nonthinned stands. Except for treatment 1 where thinning was too severe,the constant regimes treatments 3, 5, and 7 are recommended for general applications.
Variable regimes (treatments 2, 4, 6, and 8)—Variable regimes are distinguishedby periodic changes in severity of thinning at each successive level. The sequence ofthinning intensities varied from heavy to light treatments 2 and 4. Conversely, treat-ments 6 and 8 varied from light to heavy. Variable regimes were developed at two aver-age levels of growing stock in each area according to percentages of growth retained in
Table 25—Clemons: Comparison of regimes with average 30 percent of growthretained in increasing, constant, and decreasing prescriptions (table 1)
Treatment
2 increasing 3 constant 6 decreasing
Initial stand—19 yrs:Trees per acre 395 397 397Quadratic mean d.b.h. (in) 4.2 4.1 4.1Basal area per acre (ft2) 38 36 37Volume per acre (ft3) 516 472 466
After last thinning—36 yrs:Trees per acre 75 105 127Average spacing (ft) 24 20 19Quadratic mean d.b.h. (in) 13.6 11.8 10.8Basal area per acre (ft2) 75 77 80Volume per acre (ft3) 2,410 2,488 2,528
Crop trees per acre— 70 72 72Quadratic mean d.b.h. (in) 13.7 12.4 11.5Volume per acre (ft3) 2,295 1,956 1,643
Total thinning yield per acre (ft3)— 1,475 1,666 1,938Percent of gross yield 37 40 43
End of holding period—50 yrs:Trees per acre 75 103 127Quadratic mean d.b.h. (in) 18.0 16.1 14.6Basal area per acre (ft2) 133 142 147Volume per acre (ft3) 5,636 6,145 6,356Avg. volume per tree (ft3) 75 60 50PAI (14-yr holding period)(ft3) 230 261 273D.b.h. range (in) 14–25 8–23 8–920Net yield per acre (ft3) 7,112 7,811 8,294Mortality per acre (ft3) 133 41 49Gross yield per acre (ft3) 7,245 7,852 8,343

52
the thinning schedule in table 1. The lower level (treatments 2 and 6) had an average of30 percent retained and the higher level (treatments 4 and 8) an average of 50 percentretained. A more detailed description is given in a previous section, “Levels of GrowingStock.” Comparisons of variable regimes along with constant regime treatments 3 and 5are given in tables 22 and 23 for Skykomish and tables 25 and 26 for Clemons. Thesesequences of variable thinning intensity produced different results that are important inchoosing a regime for application. Comparisons of treatment 2 with 6 and treatment4 with 8 show that (1) regimes 6 and 8 produced 15 to 31 percent more yield fromthinnings, (2) treatments 6 and 8 also produced 7 to 19 percent more total volumeincrement (including volume from thinnings but excluding negligible mortality volume)
Table 26–Clemons: Comparison of regimes with average 50 percent of growth retained inincreasing, constant, and decreasing prescriptions (table 1)
Treatment
Control4 increasing 5 constant 8 decreasing unthinned
Initial stand—19 yrs:Trees per acre 395 395 397 687Quadratic mean d.b.h. (in) 4.2 4.0 4.0 4.0Basal area per acre (ft2) 37 34 34 60Volu+me per acre (ft3) 498 438 470 852
After last thinning—36 yrs:Trees per acre 170 200 240 558Average spacing (ft) 16 15 13 9Quadratic mean d.b.h. (in) 10.8 10.0 9.1 7.9Basal area per acre (ft2) 102 106 108 188Volume per acre (ft3) 3,084 3,132 3,307 5,873
Crop trees per acre– 70 75 73 78Quadratic mean d.b.h. (in) 11.7 11.2 10.5 9.1Volume per acre (ft3) 1,597 1,567 1,396 1127
Total thinning yield per acre (ft3)— 955 1123 1,094 nonePercent of gross yield 22 21 24 none
End of holding period—50 yrs:Trees per acre 147 178 238 387Quadratic mean d.b.h. (in) 14.2 13.5 11.7 10.5Basal area per acre (ft2) 156 171 175 230Volume per acre (ft3) 6,502 6,803 7,008 9,424Avg. volume per tree (ft3) 44 38 29 24PAI (14-yr holding period)(ft3) 244 262 264 254D.b.h. range (in) 6–23 7–24 6–22 5–25Net yield per acre (ft3) 7,457 7926 8,103 9,424Mortality per acre (ft3) 629 471 148 1438Gross yield per acre (ft3) 8,086 8,397 8,251 10,862

53
during the thinning cycle (at the time of the last thinning), and (3) the same treatmentsproduced 2 to 15 percent more total gross yield than treatments 2 and 4 at the end ofthe postthinnning period.
In other characteristics, none of the variable regimes were consistently predominant.When growth of thinned stands was compared with the control stands, during the 14-year holding period only two of the variable regimes exceeded the nonthinned stands.These regimes were treatments 6 and 8 at Clemons, which produced 4 to 7 percentmore PAI than the nonthinned stand. The other variable regimes at Clemons (treatments2 and 4) and all variable regimes at Skykomish produced 3 to 18 percent less PAI thantheir respective controls. The largest average d.b.h. was produced by heavy/light re-gimes in three of the four comparisons (treatments 2 versus 6 and 4 versus 8 at bothinstallations), whereas the light/heavy (treatment 6) at Skykomish was larger than thecontrasting regime (treatment 2).
Comparisons of the two types of variable regimes show only one outstanding differencein terms of wood production: the higher yield from thinnings produced by the light/heavyregime treatments 6 and 8 (see discussion under ”Wood Production”). In application,the small differences in other characteristics probably would be obscured by variationsin quality control of operational thinnings. Consequently, a choice between the twotypes of variable regimes should be based on thinning yield or other factors pertaining tosome specific objectives of stand management. Comparisons between variable regimesand constant regimes show that constant regime treatments 3 and 5 are within 3 to16 percent of the light/heavy regime treatments 6 and 8 in both thinning yield and totalyield. Constant regimes are generally closer to the light/heavy regime treatments 6 and8 than to the contrasting heavy/light regime treatments 2 and 4. Except for slightlyhigher thinning yields in the light/heavy regimes, these comparisons show no outstand-ing advantages of variable regimes over constant regimes. Application of variable re-gimes would require detailed long-term inventory records for control of changing thinningintensities. These studies have shown no apparent reasons for using variable regimesthat would justify additional complications and costs in managing thinning operations.Therefore, the constant regime treatments 3, 5, and 7 are recommended for generalapplications.
The prescribed thinnings were completed at age 42 in the Skykomish study and age 36at Clemons. Beyond those ages the stands were free to grow in the postthinning hold-ing period. Data for these periods are given in stand development tables and in tablescomparing regimes (tables 21 through 26). The stand data after the last thinning showthat in most regimes the growing stock in noncrop trees was sufficient to make addi-tional thinnings. Where stand management objectives require later thinnings, these datacan provide the basis for planning extensions of the current regimes.
An inevitable result when the LOGS regimes are applied in stand management is thedifference in yields between the study areas and the managed stands. Differences inyield between research plots and managed forests were analyzed by Bruce (1977).Generally yields per acre in the managed forest are less than yields in research plots.These differences, which may be called “falldown,” cannot be forecast accurately be-cause of the many variables that affect yields. Some of the reasons for differences inyield that may apply to the LOGS studies follow:
1. The sample plots have uniform stands, whereas large areas include smallnonproductive areas such as streams and openings too small to excludein forest mapping.

54
2. Large areas are more variable than sample plots in stocking, stand structure,and stand composition.
3. Damaged trees are present throughout large stands but usually excluded fromexperimental plots.
4. There may be less quality control in operations.
5. Inadequate stand descriptions, particularly incorrect age classification, canresult in mismatched prescriptions and misleading yield calculations.
Bruce (1977) concluded that the scientist and the forest manager both have responsi-bilities in research applications. The scientist’s interpretations should include opinionsabout practical application. The manager should understand the research results and besufficiently familiar with the forest to apply new knowledge. These precautions regardingexpected yield should be observed when applying all LOGS regimes.
The original study plan was written by George R. Staebler (deceased), former Silvicul-turist and Director of Forestry Research, Weyerhaeuser Company. He also was theinitiator of the Pacific Northwest levels-of-growing-stock regional cooperative. RichardL. Williamson (deceased), former mensurationist, Pacific Northwest Research Station,was the first secretary of the LOGS committee, planned and supervised data process-ing, and coordinated standards and procedures. Members of the Weyerhaeuser Re-search staff who had primary responsibility for the Skykomish and Clemons studieswere William Webb, James N. Woodman, Robert L. Heninger, Marshall D. Murray, andRodney Meade. Joe Kraft, Olympia Forestry Sciences Laboratory, produced the graph-ics for this report.1 inch = 2.54 centimeters1 foot = 0.3048 meter1 acre = 0.405 hectare1 square foot = 0.09290 square meter1 cubic foot = 0.02832 cubic meter1 square foot per acre = 0.2293 square meter per hectare1 cubic foot per acre = 0.06997 cubic meter per hectare1 tree per acre = 2.471 trees per hectare
(°F-32)/1.8 = °C
Bruce, D. 1977. Yield differences between research plots and managed forests.Journal of Forestry. 75(1): 14–17.
Chapman, H.H.; Meyer, W.H. 1949. Forest mensuration. 1st ed. New York:McGraw-Hill Book Co. 522 p.
Curtis, R.O. 1987. Levels-of-growing-stock cooperative in Douglas-fir: report no. 9—Some comparisions of DFSIM estimates with growth in the levels-of-growing-stockstudy. Res. Pap. PNW-RP-376. Portland, OR: U.S. Department of Agriculture,Forest Service, Pacific Northwest Research Station. 34 p.
Curtis, R.O.; Clendenen, G.W.; DeMars, D.J. 1981. A new stand simulator for coastalDouglas-fir: DFSIM user’s guide. Gen. Tech. Rep. PNW-128. Portland, OR: U.S.Department of Agriculture, Forest Service, Pacific Northwest Forest and RangeExperiment Station. 79 p.
Acknowledgments
Metric Equivalents
Literature Cited

55
Curtis, R.O.; Clendenen, G.W.; Reukema, D.L.; DeMars, D.J. 1982. Yield tablesfor managed stands of coast Douglas-fir. Gen. Tech. Rep. PNW-135. Portland, OR:U.S. Department of Agriculture, Forest Service, Pacific Northwest Forest and RangeExperiment Station. 182 p.
Curtis, R.O.; Marshall, D.D. 1986. Levels-of-growing-stock cooperative in Douglas-fir:report no. 8—the LOGS study: twenty-year results. Res. Pap. PNW-356. Portland,OR: U.S. Department of Agriculture, Forest Service, Pacific Northwest ResearchStation. 113 p.
Curtis, R.O.; Marshall, D.D. 1989. On the definition of stand diameter growth forremeasured plots. Western Journal of Applied Forestry. 4(3): 102–103.
Curtis, R.O.; Marshall, D.D.; Bell, J.F. 1997. LOGS: a pioneering example ofsilvicultural research in coastal Douglas-fir. Journal of Forestry. 95(7): 19–25.
Duffield, J.W. 1956. Damage to western Washington forests from November 1955 coldwave. Res. Note 129. Portland, OR: U.S. Department of Agriculture, Forest Service,Pacific Northwest Forest and Range Experiment Station. 5 p.
Hawley, R.C.; Smith, D.M. 1954. The practice of silviculture. 6th ed. New York:John Wiley and Sons, Inc. 525 p.
Hummel, F.C. 1954. The definition of thinning treatments. In: Proceedings of the 11th
IUFRO Congress. Vienna, Austria: Forestry Commission (Great Britain): 582-588.
Joergenson, G. 1957. Thinning experiments. Tech. Pub. T. 45. Victoria, BC:Department of Lands and Forests, British Columbia Forest Service. 24 p.
Johnston, D.R.; Grayson, A.J.; Bradley, R.T. 1967. Forest planning. London:Faber and Faber Limited. 541 p.
King, J.E. 1966. Site index curves for Douglas-fir in the Pacific Northwest.Weyerhaeuser For. Pap. 8. Centralia, WA: Weyerhaeuser Forestry Research Center.49 p.
King, J.E. 1986. Review of Douglas-fir thinning trials. In: Douglas-fir stand managementfor the future. Institute of Forest Resources Contrib. 55. Seattle, WA: Universityof Washington, College of Forest Resources: 258–279.
Oliver, C.D.; Murray, M.D. 1983. Stand structure, thinning prescriptions, and densityindexes in a Douglas-fir thinning study, Western Washington, U.S.A. CanadianJournal of Forestry Research. 13: 126–136.
Reukema, D.L. 1964. Some effects of freeze injury on development of Douglas-fir.Northwest Science. 38(1): 14–17.
Reukema, D.L. 1972. Twenty-one-year development of Douglas-fir stands repeatedlythinned at varying intervals. Res. Pap. PNW-141. Portland, OR: U.S. Department ofAgriculture, Forest Service, Pacific Northwest Forest and Range Experiment Station.23 p.
Rieger, G. 1985. Crop-tree-aligned thinning and mechanized full-tree-harvesting insouthwest Germany. In: The influence of spacing and selectivity in thinning on standdevelopment, operations and economy. Proceedings of IUFRO Project Group. Dublin,Ireland: Forest and Wildlife Service: 62–71.

56
Smith, D.M. 1962. The practice of silviculture. 7th ed. New York: John Wiley and Sons.578 p.
Staebler, G.R. 1960. Optimum levels of growing stock for managed stands. In:Proceedings of the Society of American Foresters meeting, 1959. Washington, DC:Society of American Foresters: 110–113.
Staebler, G.R. 1967. The Pacific Northwest study in levels of growing stock. In:Proceedings of the Society of American Foresters meeting, 1966. Washington, DC:Society of American Foresters: 131–133.
Steinbrenner, E.C.; Duncan, S.H. 1969. Soil survey of the Clemons Tree Farm.Tacoma, WA: Weyerhaeuser Company. 106 p.
Tappeiner, J.C.; Bell, J.F.; Brodie, J.D. 1982. Response of young Douglas-fir to16 years of intensive thinning. Res. Bull. 38. Corvallis, OR: Oregon State University,Forest Research Laboratory. 17 p.
Vezina, P.E. 1963. Objective measures of thinning grades and methods. The ForestryChronicle. 39(3): 290–300.
Warrack, G.C. 1959. Forecast of yield in relation to thinning regimes in Douglas-fir.For. Serv. Tech. Pub. T. 51. Victoria, BC: Department of Lands and Forests, BritishColumbia Forest Service. 56 p.
Webster, S.R.; Steinbrenner, E.C. 1974. Soil survey of the Snoqualmie Falls TreeFarm. Tacoma, WA: Weyerhaeuser Company.
Wiley, K.N. 1978. Site index tables for western hemlock in the Pacific Northwest.Weyerhaeuser For. Pap. 17. Centralia, WA: Weyerhaeuser Forestry ResearchCenter. 28 p.
Williamson, R.L. 1973. Results of shelterwood harvesting of Douglas-fir in theCascades of western Oregon. Res. Pap. PNW-161. Portland, OR: U.S. Department ofAgriculture, Forest Service, Pacific Northwest Forest and Range Experiment Station.13 p.
Williamson, R.L.; Staebler, G.R. 1965. A cooperative levels-of-growing-stock study inDouglas-fir. Portland, OR: U.S. Department of Agriculture, Forest Service, PacificNorthwest Forest and Range Experiment Station. 12 p.
Williamson, R.L.; Staebler, G.R. 1971. Levels-of-growing-stock cooperative study inDouglas-fir: report no. 1. Res. Pap. PNW-111. Portland, OR: U.S. Department ofAgriculture, Forest Service, Pacific Northwest Forest and Range Experiment Station.12 p.
Worthington, N.P.; Staebler, G.R. 1961. Commercial thinning of Douglas-fir in thePacific Northwest. Tech. Bull. 1230. Washington, DC: U.S. Department of Agriculture,Forest Service. 124 p.

57
In 2002, the Pacific Northwest levels-of-growing-stock (LOGS) cooperative will be 40years old. All cooperators have faithfully maintained the project since 1962. The purposeof this note is to document the origin of the LOGS cooperative. A complete history ofthe project is planned in addition to a comprehensive technical analysis when all indi-vidual studies are complete.
Before initiation of the LOGS studies, an application of the thinning schedule was testedby Staebler in a commercial thinning study on the St. Helen’s Tree Farm of Weyer-haeuser Company (King 1986, Oliver and Murray 1983, Staebler 1967). This study wasstarted in 1959 in an area of 125 acres where a precommercial thinning study had beenestablished in 1953. In that thinning, the original stand was reduced to about 500 to 800trees per acre. The commercial thinning study included four regimes that were thesame as the treatment schedules prescribed later for the LOGS studies. They were theconstant or fixed thinning intensities where 10, 30, 50, and 70 percent of gross incre-ments on control plots were allowed to accumulate in the reserved stands. Controls ofthinning interval and selection of trees to cut were also the same as prescribed later forthe LOGS studies. Treatments with variable thinning intensities were added to theschedule when the LOGS project was started. These trials demonstrated the workabilityof the growing stock as the control factor for thinning in young stands of Douglas-fir.
In the same year, Staebler (1960) presented his views on the importance of desirablelevels of growing stock at the Society of American Foresters convention. His discussionincluded an example of the low growth per unit of growing stock in high-volume naturalstands, which would not be a satisfactory return if expressed as a percentage of thevalue of the growing stock. He suggested that “this undesirable situation probably ex-ists in most unmanaged stands from comparatively young ages.” In the context of aforest business, “growth is the return on the invested growing stock, and for good busi-ness much too much growing stock is commonly held for maximum or near maximumgrowth.” Staebler gave a conceptual illustration of growth with increasing levels of grow-ing stock by using the hypothetical relation postulated by Langsaeter (Hawley andSmith 1954, Smith 1962). There was no evidence that the Langsaeter curve is valid forDouglas-fir, but it was a reasonable basis for illustration of probable growth-growingstock relations. Staebler concluded that these hypothetical relations provide an encour-aging beginning, but the problem of achieving desirable levels of growing stock in standmanagement required a lot more research.
Appendix 1:Historical NoteOrigin of theLOGS studies1
1 Personal note by James E. King: This account of the origin ofthe LOGS studies is based on my recollections of working withGeorge Staebler, the project files, and his publications that relatedto levels of growing stock. We worked together at the Weyer-haeuser Forestry Research Center when he was responsible forthe silviculture project, and my responsibilities included growthand yield, and pilot management studies. The latter were small-scale operational trials of thinning. Because of the overlappingscope of our projects, we often discussed Douglas-fir silvicultureand the needs for new information in timber management.

58
The next major event leading to the LOGS cooperative project was the establishment ofthe Skykomish study in September 1961. The basic plan had been completed earlier,but experience with this installation provided some additional details.2 The first page ofthe plan (attached exhibit 1) provides a background to this study, which was a prototypefor the LOGS cooperative. Observations of this installation by foresters both inside andoutside of Weyerhaeuser Company indicated that Staebler’s experiment could producemuch-needed information and should be replicated on a wide range of sites. It was obvi-ous, however, that a long-term project of this size would require the cooperation of sev-eral research organizations, and to function efficiently, a central coordinating agencywould be necessary. The USDA Forest Service, Pacific Northwest (PNW) Forest andRange Experiment Station, accepted this responsibility. To explore the feasibility of aregional cooperative research project, George Meagher, representing the Station, andGeorge Staebler organized a meeting of foresters held at the Weyerhaeuser mill inEverett, Washington, on July 24, 1962. R.W. Cowlin, Director of the PNW Station, waschairman of the morning session, which was attended by 31 foresters representing 13organizations. A summary of this meeting in the original format with a list of the partici-pants is attached (exhibit 2). The afternoon session included a tour of the Skykomishstudy area with explanation by George Staebler. This ended with a summary by GeorgeAllen, Director of the Weyerhaeuser Forestry Research Center, in which he asked for anexpression of interest in a cooperative research project. Representatives of 11 agenciesgave a positive response. With this encouraging response, Meagher promised to form aworking committee to start the project. He named Richard L. Williamson as the Stationrepresentative on the working committee. Staebler and Williamson prepared a moredetailed work plan for these studies, which was never published in original format butwas described later in publications by Williamson and Staebler (1965, 1971). The origi-nal cooperators in the LOGS project were the USDA Forest Service, WeyerhaeuserCompany, Oregon State University, and the Washington State Department of NaturalResources. All had one or more installations completed in 1963. The Canadian ForestService became a cooperator with an installation in 1969. In 1970, the final installationwas established providing nine installations spread from southern Oregon to VancouverIsland. In 1999, the British Columbia Ministry of Forests became a member of the coop-erative to work with the Canadian Forest Service to ensure the two installations onVancouver Island were carried through the final treatment period.
Williamson was the first secretary of the LOGS committee and served in that positionuntil his retirement in 1983. Staebler was the first chairman of the committee and servedin that position until 1973.
LOGS is not only an acronym of levels of growing stock but as suggested by CharlesPeterson, PNW Research Station, it also stands for Legacy Of George Staebler.
2 Staebler, George R. 1962. Plan for a level of growing stock studyin Douglas-fir. Unpublished report. On file with: Forestry ResearchCenter, Weyerhaeuser Company, Tacoma, WA 98477.

59
EXHIBIT 1 3
July 9, 1962
Plan for a Level-of-Growing-Stock Study in Douglas-Fir
by George R. Staebler
Forestry Research Center, Weyerhaeuser Co.
Introduction
As forestry in the Douglas-fir region becomes more intensive, cultural and commercialthinnings are becoming commonplace practices on both public and private forest lands.Foresters, in turn, are seeking with increased urgency better information on (1) spacingguides and stocking schedules for optimum production, and (2) estimates of possibleyields in intensively managed stands. Some leads are available from older thinning,spacing, and yield studies, but definitive information of regionwide application is notavailable now nor will it be provided through existing studies.
New long-term field studies will apparently be required to provide such information.These will entail the periodic measurements of stands repeatedly thinned to a widerange of growing stock levels. The following plan has been prepared for an experiment inlevels of growing stock for Douglas-fir. One study has been established on theSkykomish Tree Farm, and the plan is believed adaptable to installations at other loca-tions and sites.
Briefly, young stands 20 to 40 feet tall will first be given a preparatory thinning to createstudy plots that are fairly uniform in numbers of crop trees, spacing, and tree density.Then following a calibration period, study plots will be thinned back periodically to sev-eral different levels of stocking. The study will be continued until the trees have reacheda height of 80 to 100 feet and the critical developmental period of the stand has beenpassed.
Two features of this plan merit introductory attention because they are original and havenot been used in levels-of-growing-stock studies in other regions or for other species:
1. Levels of growing stock to be tested will be based on the gross increment of theunthinned plots which are an integral part of the study but not one of the recognizedtreatments. In this way, the “levels” will be keyed to growth conditions on the studyarea and will not be dependent on yield tables or other artificial criteria.
2. The interval between thinnings will be based on height growth of the stand ratherthan on an arbitrary number of years. This seems biologically sound.
Objective
The objective is to determine how the amount of growing stock retained in repeatedlythinned stands of Douglas-fir affects cumulative wood production, tree size, and growth-growing stock ratios. The treatments are planned to cover a broad enough range ingrowing stock levels so that the findings will tell how to produce any combination offactors deemed optimum from a management standpoint.
3 Reproduced, as closely as possible, from the original.

60
EXHIBIT 2 4
Portland, Oregon
August 10, 1962
Résumé of Level-of-Growing-Stock Research Conference for Douglas-Fir
Everett, Washington, July 24, 1962
The meeting was opened at 8:30 a.m. in the conference room at Weyerhaeuser’s Mill“B.” A list of the 31 attendees is attached.
George Meagher introduced R.W. Cowlin who acted as chairman of the morning ses-sion. Cowlin stated the aim of the meeting was to explore needs for level-of-growing-stock information in Douglas-fir to meet increasing pressures for more intensivemanagement efforts. He indicated the group would attempt to determine these needsand the followup action that might be required to meet them. He characterizedStaebler’s study plan as a means of getting information on levels of growing stock andposed these questions:
1. What are the needs for this kind of information?
2. What kinds of study will obtain this information?
3. What are the opportunities for cooperative effort?
George Staebler discussed the background of the problem and defined “optimum grow-ing stock” as that which is developed through thinning to alter growth and yield, size oftree, or growth-percent. Any one or combinations of the three factors may be used byforesters to accomplish objectives necessary for a given operation according to theaims of management. Details of Staebler’s ensuing remarks are contained in the paperhe presented at the SAF meeting in San Francisco,5 copies of which were distributedat the conference.
Meagher then listed some reasons for interest in the type of study explained byStaebler. These included increasing demand for information on levels of growing stockfor use in planning regeneration, precommercial thinning and commercial thinningschedules, and in management planning (initial spacing of plantations, type of thinningregime, rotation age, products attainable by manipulation of the stand, and decisions forspecial-use areas).
Comments from the group were:
Hicks—National Forest administration requires such knowledge to use in calculatingallowable cut and establishing future production. Hopes also that such studies will coverlower sites as well as more productive lands.
Fety—Bureau of Land Management is beginning an intensive young-growth manage-ment program on 56,000 acres of site II and III land in Tillamook, Oregon, area.
Schroeder—Crown Zellerback Corporation is considering the possibility of early andcontinued crops to reduce capital investment costs. As much as 95 percent of basal
4 See footnote 3.5 Staebler, George R. 1959. Optimum levels of growing stock formanaged stands. Proceedings of the Society of AmericanForesters.

61
area might be cut, including dominants, to realize the earliest possible return on theminimum capital investment.
Warrack—Most research effort by the British Columbia Forest Service is in regenerationstudies. Thus, it is not certain this organization could cooperate in the proposed study.
Boe—In California, regeneration research is also the major effort. There is, however, aneed for thinning studies.
Dahms—The proposed study plan might be equally applicable to lodgepole pine andother species in central Oregon.
Scott—University of Washington is interested in fundamental aspects of growth. Con-trolled range of conditions and regimes will give valuable information. Is desirous of co-operating in such a study.
Smith—University of British Columbia does not have pure Douglas-fir stands in which towork but similar studies might be conducted in mixtures containing Douglas-fir. Feelswe already have information on maximum growth in open stands, especially in BritishColumbia where plantation stocking ranges between 200-600 trees per acre.
Cowlin next asked for expressions of opinion on whether short-term studies or perma-nent growth plots were the most effective method for developing the information weseek.
Staebler—Feels the single-tree approach is nebulous and that the sample plot tech-nique is most productive.
Smith—We can make progress with individual tree studies. Long-term studies are alsonecessary, but no work of this type is contemplated until single-tree studies involving200 stem analyses of three species are completed.
Reukema—Feels that single-tree studies should be supported by plot measurements.Crown development studies should give good preliminary information on what to expectafter thinning but even at 40 years of age, there is no very clear relation between crownand stem development.
Barnes—Expressed hesitation about becoming involved with long-term studies becauseobjectives may change and study plots might no longer serve our needs.
Scott—Believes stem analyses are valuable but that we cannot reproduce or interpretthe past environment of the tree.
Petzold—The aim of Staebler’s study is to provide basic information that can be appliedto individual situations.
Berg—Cautioned not to forget ecological aspects and questioned whether small plotsadequately reflect ecological conditions.
George Staebler then explained in some detail the plan he developed for levels-of-grow-ing-stock studies. He stressed that this is a test of thinning regimes rather than of athinning. Variables that determine growth were indicated as (1) frequency of thinning,(2) kind of thinning, and (3) amount of growing stock left on the ground. Size of tree wewish to work with in this type of study is 3–6 inches d.b.h. and 20–40 feet in height.Each person at the meeting was previously supplied with a copy of the study plan, sofurther details of Staebler’s presentation are omitted.

62
Floyd Johnson discussed the variables and methods of analysis. Jim King discussedmachine analysis of the data, explained three forms used for data recording and pro-cessing, and estimated costs of data processing.
After lunch, the group traveled to the Skykomish Tree Farm where an on-the-plotdiscussion was held for several hours. At the end of this part of the session, GeorgeAllen summarized briefly the day’s meeting and indicated again the desire of theWeyerhaeuser Company to cooperate with other organizations to further levels-of-growing-stock studies. He asked for an expression of interest in exploring further thepossibilities of cooperative installation of study plots similar to those developed byStaebler. Of 13 agencies or companies represented at the meeting, representativesfrom 8 expressed a probable interest and an additional 3 indicated a possible interest.
George Meagher promised he would contact interested agencies and companies soonwith the idea of developing a working committee to prepare plans for getting studiesunderway. He named Dick Williamson, mensurationist in the Douglas-fir silvicultureproject at Olympia, as the Station’s representative in the working committee and ascoordinator for future cooperative efforts.
PARTICIPANTS
British Columbia Forest ServiceGeorge Warrack
Bureau of Land ManagementRod Fety
Crown Zellerback CorporationGeorge Schroeder
Oregon State UniversityGeorge BarnesJohn BellAlan BergRudy Kangur
Port Blakely Mill Co.William Cummings
Simpson Timber CompanyAl Petzold
University of British ColumbiaHarry Smith
University of WashingtonDave Scott
USDA Forest Service, PacificNorthwest Forest & RangeExperiment Station
Dave Bruce, PortlandR.W. Cowlin, Portland
W. Dahms, BendFloyd Johnson, PortlandG.S. Meagher, PortlandD. Reukema, OlympiaBob Tarrant, PortlandR. Williamson, OlympiaN.P. Worthington, Olympia
USDA Forest Service, PacificSouthwest Forest & RangeExperiment Station
Ken Boe
USDA Forest Service, R-6Otto Hanell—Olympic N.F.Vern Hicks—R.O.Art Mason—Snoqualmie N.F.
Washington State Department ofNatural Resources
Gene Little
Weyerhaeuser CompanyGeorge AllenCarl GareyNels JeffersReid KenadyJim KingGeorge Staebler

63
1961 24 981 981 200 200 0.00 0.00 0.0 0.0 0 41 0 8 0 41 0 81965 28 2,112 2,116 837 837 .41 .41 9.0 9.0 283 75 159 30 284 76 159 301968 31 2,850 2,867 1,539 1,539 .46 .45 7.0 7.1 246 92 234 50 250 92 234 501971 34 3,620 3,637 2,323 2,323 .44 .44 6.3 6.3 257 106 262 68 257 107 262 681975 38 4,686 4,703 3,421 3,421 .50 .50 6.0 6.0 267 123 274 90 267 124 274 901979 42 5,643 5,660 4,369 4,369 .49 .49 4.8 4.8 239 134 237 104 239 135 237 1041983 46 6,511 6,528 5,217 5,217 .45 .45 4.1 4.1 217 142 212 113 217 142 212 1131988 51 7,486 7,503 6,164 6,164 .35 .35 3.6 3.6 195 147 189 121 195 147 189 1211993 56 8,693 8,709 7,328 7,328 .32 .32 3.5 3.5 241 155 233 131 241 156 233 131
1961 24 48 8.2 340 5.3 51.0 981 200 0 0.0 0.0 0 0 0.0 0.0 0.00 0 0.0 0.0 0 01965 28 63 10.4 185 7.4 53.8 1,325 613 153 6.3 33.2 786 225 5.1 3.4 .92 2 4.3 .2 4 01968 31 70 11.6 138 8.9 59.0 1,637 1,075 43 8.1 15.7 427 240 9.9 6.0 .94 3 5.4 .5 13 01971 34 79 13.1 93 11.0 60.6 1,885 1,545 45 8.4 17.4 522 314 11.6 7.0 .83 0 .0 .0 0 01975 38 90 15.2 62 13.8 63.7 2,236 2,052 32 11.0 20.9 715 591 22.3 18.5 .86 0 .0 .0 0 01979 42 100 17.0 50 15.8 67.7 2,600 2,444 12 15.5 15.3 593 556 49.4 46.3 .99 0 .0 .0 0 01983 46 107 18.3 50 17.6 84.1 3,468 3,292 0 .0 .0 0 0 .0 .0 .00 0 .0 .0 0 01988 51 115 20.2 50 19.4 101.9 4,443 4,239 0 .0 .0 0 0 .0 .0 .00 0 .0 .0 0 01993 56 127 21.9 50 21.0 119.4 5,650 5,403 0 .0 .0 0 0 .0 .0 .00 0 .0 .0 0 0
a Average height (ht) and diameter at breast height (d.b.h.) of the 40 largest trees per acre (estimated from d.b.h. and ht-d.b.h. curves).b Quadratic mean diameter at breast height.c All volumes are total stem cubic feet (CVTS) or merchantable cubic to a 6-inch top diameter inside bark (CV6).d Average d.b.h. cut/average d.b.h. before thinning.e Cumulative yield: net = standing + thinning; gross = standing + thinning + mortality; yield does not include any volume removed in a calibration cut. Volume (CVTS) removed inthinnings = 3,043 cubic feet (54 percent of the total gross yield at the time of the last thinning). Volume (CVTS) in mortality = 17 cubic feet (<1 percent of the total gross yield).f Net is QMD growth of trees alive at the start and end of the period; survivor is QMD growth of trees alive at the end of the period.g MAI = mean annual increment; PAI = periodic annual increment.
Ap
pen
dix 2: S
kykom
ish
YearStandage
Table 27—Skykomish: Stand development for treatment 1, per-acre basis (plots 6010, 6022, and 6034)
40 largesta
Ht D.b.h. QMDbTreesBasalarea CVTS d/Dd
After thinning Removed in thinning Mortality
Volumec Avg. volume
CV6 QMDbTreesBasalarea CVTS
Volume
CV6 QMDbTreesBasalarea CVTS
Volume
CV6
YearStandage
NetCVTS
GrossCVTS
GrossCV6
NetCV6 Net Survivor
CVTSPAI
Cumulative yielde
Net GrossCVTSPAI
CVTSMAI
CV6PAI
CV6MAI
CV6PAI
CVTSMAI
CV6MAI
Net volume growthg Gross volume growth
CVTS CV6
Years Ft Inches No. Ft 2 - - - - Ft 3 - - - - No. Ft 2 - - - - - - - - Ft 3 - - - - - - - - No. Ft 2 - - - Ft 3 - - -
Years - - - - - - - - - - - Ft 3 - - - - - - - - - - - - - Inches - - - - - - Ft 2 - - - - - - - - - - - - - - - - - - - - - - - - - - Ft 3 - - - - - - - - - - - - - - - - - - - - - - - -
QMD growthfBasal area
growth
Inches Inches Inches

64
a Average height (ht) and diameter at breast height (d.b.h.) of the 40 largest trees per acre (estimated from d.b.h. and ht-d.b.h. curves).b Quadratic mean diameter at breast height.c All volumes are total stem cubic feet (CVTS) or merchantable cubic to a 6-inch top diameter inside bark (CV6).d Average d.b.h. cut/average d.b.h. before thinning.e Cumulative yield: net = standing + thinning; gross = standing + thinning + mortality; yield does not include any volume removed in a calibration cut. Volume (CVTS) removed inthinnings = 2,241 cubic feet (37 percent of the total gross yield at the time of the last thinning). Volume (CVTS) in mortality = 245 cubic feet (2 percent of the total gross yield).f Net is QMD growth of trees alive at the start and end of the period; survivor is QMD growth of trees alive at the end of the period.g MAI = mean annual increment; PAI = periodic annual increment.
1961 24 47 7.4 368 5.0 50.3 887 114 0 0.0 0.0 0 0 0.0 0.0 0.00 0 0.0 0.0 0 01965 28 59 9.5 220 6.8 5.7 1,260 445 148 6.1 30.3 688 194 4.6 3.7 .94 0 .0 .0 0 01968 31 67 10.6 175 8.0 60.7 1,614 877 43 8.1 15.4 420 231 9.8 6.2 1.01 2 5.6 .3 7 01971 34 73 11.6 147 9.3 69.1 2,053 1,451 27 8.2 9.9 277 160 10.3 5.9 .90 2 9.0 .7 20 131975 38 87 13.7 123 11.3 85.7 3,043 2,568 22 9.8 11.3 387 288 17.6 13.1 .88 2 9.0 .7 23 161979 42 96 15.4 107 13.1 99.1 3,834 3,452 17 11.7 12.4 469 407 27.6 23.9 .91 0 .0 .0 0 01983 46 107 17.1 107 14.4 120.4 5,187 4,784 0 .0 .0 0 0 .0 .0 .00 0 .0 .0 0 01988 51 118 18.6 105 15.6 140.1 6,503 6,083 0 .0 .0 0 0 .0 .0 .00 2 17.0 2.6 119 1131993 56 127 20.1 103 16.8 159.8 7,912 7,464 0 .0 .0 0 0 .0 .0 .00 2 12.8 1.5 76 69
YearStandage
Table 28—Skykomish: Stand development for treatment 2, per-acre basis (plots 6005, 6012, and 6026)
40 largesta
Ht D.b.h. QMDbTreesBasalarea CVTS d/Dd
After thinning Removed in thinning Mortality
Volumec Avg. volume
CV6 QMDbTreesBasalarea CVTS
Volume
CV6 QMDbTreesBasalarea CVTS
Volume
CV6CVTS CV6
YearStandage
NetCVTS
GrossCVTS
GrossCV6
NetCV6 Net Survivor
CVTSPAI
Cumulative yielde
Net GrossCVTSPAI
CVTSMAI
CV6PAI
CV6MAI
CV6PAI
CVTSMAI
CV6MAI
Net volume growthg Gross volume growth
1961 24 887 887 114 114 0.00 0.00 0.0 0.0 0 37 0 5 0 37 0 51965 28 1,948 1,948 639 639 .37 .37 8.7 8.7 265 70 131 23 265 70 131 231968 31 2,722 2,729 1,301 1,301 .42 .41 7.2 7.3 258 88 221 42 261 88 221 421971 34 3,438 3,465 2,035 2,048 .39 .39 6.1 6.3 239 101 245 60 245 102 249 601975 38 4,815 4,865 3,440 3,469 .44 .44 7.0 7.2 344 127 351 91 350 128 355 911979 42 6,075 6,124 4,730 4,759 .40 .40 6.5 6.5 315 145 323 113 315 146 323 1131983 46 7,427 7,477 6,063 6,092 .33 .33 5.3 5.3 338 161 333 132 338 163 333 1321988 51 8,743 8,912 7,362 7,504 .25 .26 3.9 4.5 263 171 260 144 287 175 283 1471993 56 10,152 10,397 8,743 8,955 .24 .23 3.9 4.2 282 181 276 156 297 186 290 160
Years Ft Inches No. Ft2 - - - - Ft 3 - - - - No. Ft2 - - - - - - - - Ft 3 - - - - - - - - No. Ft 2 - - - Ft 3 - - -
Years - - - - - - - - - - - Ft 3 - - - - - - - - - - - - - Inches - - - - - - Ft 2 - - - - - - - - - - - - - - - - - - - - - - - - - - Ft 3 - - - - - - - - - - - - - - - - - - - - - - - -
QMD growthfBasal area
growth
Inches Inches Inches

65
a Average height (ht) and diameter at breast height (d.b.h.) of the 40 largest trees per acre (estimated from d.b.h. and ht-d.b.h. curves).b Quadratic mean diameter at breast height.c All volumes are total stem cubic feet (CVTS) or merchantable cubic to a 6-inch top diameter inside bark (CV6).d Average d.b.h. cut/average d.b.h. before thinning.e Cumulative yield: net = standing + thinning; gross = standing + thinning + mortality; yield does not include any volume removed in a calibration cut. Volume (CVTS) removed inthinnings = 2,472 cubic feet (39 percent of the total gross yield at the time of the last thinning). Volume (CVTS) in mortality = 58 cubic feet (1 percent of the total gross yield).f Net is QMD growth of trees alive at the start and end of the period; survivor is QMD growth of trees alive at the end of the period.g MAI = mean annual increment; PAI = periodic annual increment.
1961 24 47 8.1 375 5.0 50.7 931 161 0 0.0 0.0 0 0 0.0 0.0 0.00 0 0.0 0.0 0 01965 28 59 10.3 248 6.8 61.7 1,407 554 127 5.8 23.5 524 113 4.1 3.2 .90 0 .0 .0 0 01968 31 67 11.6 205 8.0 70.9 1,798 984 43 8.0 14.9 376 221 8.7 6.9 1.00 0 .0 .0 0 01971 34 75 12.8 165 9.4 79.4 2,321 1,643 40 7.7 13.0 362 177 9.1 4.8 .85 0 .0 .0 0 01975 38 88 14.9 120 11.8 91.0 3,065 2,629 45 9.1 0.2 657 453 14.6 10.1 .82 0 .0 .0 0 01979 42 97 16.9 92 14.3 100.8 3,740 3,434 27 10.2 15.1 553 432 20.5 16.0 .76 2 12.2 1.4 46 421983 46 106 18.7 92 15.8 124.3 4,964 4,639 0 .0 .0 0 0 .0 .0 .00 0 .0 .0 0 01988 51 119 20.5 90 17.5 149.5 6,572 6,213 0 .0 .0 0 0 .0 .0 .00 2 7.0 .4 12 41993 56 130 22.2 90 18.8 173.2 8,236 7,823 0 .0 .0 0 0 .0 .0 .00 0 .0 .0 0 0
YearStandage
Table 29—Skykomish: Stand development for treatment 3, per-acre basis (plots 6016, 6031, and 6036)
40 largesta
Ht D.b.h. QMDbTreesBasalarea CVTS d/Dd
After thinning Removed in thinning Mortality
Volumec Avg. volume
CV6 QMDbTreesBasalarea CVTS
Volume
CV6 QMDbTreesBasalarea CVTS
Volume
CV6CVTS CV6
1961 24 931 931 161 161 0.00 0.00 0.0 0.0 0 39 0 7 0 39 0 71965 28 1,932 1,932 667 667 .37 .37 8.6 8.6 250 69 127 24 250 69 127 241968 31 2,698 2,698 1,318 1,318 .40 .40 8.0 8.0 256 87 217 43 256 87 217 431971 34 3,583 3,583 2,153 2,153 .38 .38 7.2 7.2 295 105 279 63 295 105 279 631975 38 4,984 4,984 3,592 3,592 .43 .43 7.9 7.9 350 131 360 95 350 131 360 951979 42 6,213 6,259 4,829 4,871 .41 .41 6.2 6.6 307 148 309 115 319 149 320 1161983 46 7,436 7,483 6,034 6,075 .39 .39 5.9 5.9 306 162 301 131 306 163 301 1321988 51 9,044 9,103 7,608 7,653 .33 .31 5.0 5.1 322 177 315 149 324 178 316 1501993 56 10,708 10,767 9,218 9,263 .27 .27 4.7 4.7 333 191 322 165 333 192 322 165
YearStandage
NetCVTS
GrossCVTS
GrossCV6
NetCV6 Net Survivor
CVTSPAI
Cumulative yielde
Net GrossCVTSPAI
CVTSMAI
CV6PAI
CV6MAI
CV6PAI
CVTSMAI
CV6MAI
Net volume growthg Gross volume growth
Years Ft Inches No. Ft 2 - - - - Ft 3 - - - - No. Ft 2 - - - - - - - - Ft 3 - - - - - - - - No. Ft 2 - - - Ft 3 - - -
Years - - - - - - - - - - - Ft 3 - - - - - - - - - - - - - Inches - - - - - - Ft 2 - - - - - - - - - - - - - - - - - - - - - - - - - - Ft 3 - - - - - - - - - - - - - - - - - - - - - - - -
QMD growth fBasal area
growth
Inches Inches Inches

66
1961 24 48 8.5 315 5.5 51.2 909 226 0 0.0 0.0 0 0 0.0 0.0 0.00 0 0.0 0.0 0 01965 28 62 10.8 197 7.6 61.6 1,419 743 118 6.2 24.8 523 148 4.4 3.3 .87 0 .0 .0 0 01968 31 69 12.3 170 8.9 74.0 1,910 1,288 27 8.6 10.8 277 178 10.3 7.1 .97 0 .0 .0 0 01971 34 79 13.7 148 10.5 88.2 2,658 2,111 22 8.3 8.1 229 132 10.4 6.0 .81 0 .0 .0 0 01975 38 91 15.8 130 12.6 111.3 3,866 3,407 18 9.7 9.3 323 241 17.9 13.4 .79 0 .0 .0 0 01979 42 100 17.6 122 14.2 133.9 5,049 4,630 8 10.0 4.5 167 130 20.9 18.6 .71 0 .0 .0 0 01983 46 111 19.3 122 15.5 159.3 6,613 6,158 0 .0 .0 0 0 .0 .0 .00 0 .0 .0 0 01988 51 122 20.8 117 16.7 177.9 8,018 7,536 0 .0 .0 0 0 .0 .0 .00 5 14.6 5.8 251 2341993 56 132 22.1 113 17.7 194.9 9,437 8,914 0 .0 .0 0 0 .0 .0 .00 2 11.5 1.2 56 49
YearStandage
Table 30—Skykomish: Stand development for treatment 4, per-acre basis (plots 6001, 6023, and 6035)
40 largesta
Ht D.b.h. QMDbTreesBasalarea CVTS d/Dd
After thinning Removed in thinning Mortality
Volumec Avg. volume
CV6 QMDbTreesBasalarea CVTS
Volume
CV6 QMDbTreesBasalarea CVTS
Volume
CV6CVTS CV6
1961 24 909 909 226 226 0.00 0.00 0.0 0.0 0 38 0 9 0 38 0 91965 28 1,943 1,943 891 891 .41 .41 8.8 8.8 259 69 166 32 259 69 166 321968 31 2,711 2,711 1,614 1,614 .44 .44 7.7 7.7 256 87 241 52 256 87 241 521971 34 3,688 3,688 2,569 2,569 .42 .42 7.4 7.4 326 108 318 76 326 108 318 761975 38 5,218 5,218 4,106 4,106 .44 .44 8.1 8.1 383 137 384 108 383 137 384 1081979 42 6,568 6,568 5,459 5,459 .36 .36 6.8 6.8 338 156 338 130 338 156 338 1301983 46 8,132 8,132 6,987 6,987 .32 .32 6.3 6.3 391 177 382 152 391 177 382 1521988 51 9,538 9,789 8,364 8,598 .24 .24 3.7 4.9 281 187 276 164 331 192 322 1691993 56 10,957 11,264 9,743 10,025 .20 .19 3.4 3.6 284 196 276 174 295 201 285 179
YearStandage
NetCVTS
GrossCVTS
GrossCV6
NetCV6 Net Survivor
CVTSPAI
Cumulative yielde
Net GrossCVTSPAI
CVTSMAI
CV6PAI
CV6MAI
CV6PAI
CVTSMAI
CV6MAI
Net volume growthg Gross volume growth
a Average height (ht) and diameter at breast height (d.b.h.) of the 40 largest trees per acre (estimated from d.b.h. and ht-d.b.h. curves).b Quadratic mean diameter at breast height.c All volumes are total stem cubic feet (CVTS) or merchantable cubic to a 6-inch top diameter inside bark (CV6).d Average d.b.h. cut/average d.b.h. before thinning.e Cumulative yield: net = standing + thinning; gross = standing + thinning + mortality; yield does not include any volume removed in a calibration cut. Volume (CVTS) removed inthinnings = 1,519 cubic feet (23 percent of the total gross yield at the time of the last thinning). Volume (CVTS) in mortality = 307 cubic feet (3 percent of the total gross yield).f Net is QMD growth of trees alive at the start and end of the period; survivor is QMD growth of trees alive at the end of the period.g MAI = mean annual increment; PAI = periodic annual increment.
Years Ft Inches No. Ft2 - - - - Ft 3 - - - - No. Ft2 - - - - - - - - Ft 3 - - - - - - - - No. Ft2 - - - Ft 3 - - -
Years - - - - - - - - - - - Ft 3 - - - - - - - - - - - - - Inches - - - - - - Ft 2 - - - - - - - - - - - - - - - - - - - - - - - - - - Ft 3 - - - - - - - - - - - - - - - - - - - - - - - -
QMD growth fBasal area
growth
Inches Inches Inches

67
1961 24 48 7.9 363 5.1 51.3 939 163 0 0.0 0.0 0 0 0.0 0.0 0.00 0 0.0 0.0 0 01965 28 60 9.9 283 6.7 68.7 1,592 607 78 6.1 15.7 351 78 4.5 2.8 .93 2 3.5 .1 2 01968 31 68 11.3 253 7.9 84.9 2,270 1,212 25 7.4 7.4 195 99 7.8 6.6 .95 5 6.7 1.2 31 91971 34 76 12.5 227 9.0 98.2 2,953 1,956 25 7.9 8.5 249 130 10.0 5.7 .90 2 4.8 .2 5 01975 38 90 14.3 198 10.5 117.7 4,164 3,265 27 9.3 12.6 446 316 16.5 12.6 .90 2 6.4 .4 12 21979 42 100 16.1 172 12.1 133.9 5,255 4,493 27 9.7 13.7 539 405 20.0 15.0 .83 0 .0 .0 0 01983 46 110 17.8 172 13.3 161.5 6,904 6,125 0 .0 .0 0 0 .0 .0 .00 0 .0 .0 0 01988 51 120 19.6 172 14.4 190.6 8,646 7,862 0 .0 .0 0 0 .0 .0 .00 0 .0 .0 0 01993 56 131 21.2 172 15.4 218.5 10,676 9,841 0 .0 .0 0 0 .0 .0 .00 0 .0 .0 0 0
YearStandage
Table 31—Skykomish: Stand development for treatment 5, per-acre basis (plots 6009, 6011, and 6028)
40 largesta
Ht D.b.h. QMDbTreesBasalarea CVTS d/Dd
After thinning Removed in thinning Mortality
Volumec Avg. volume
CV6 QMDbTreesBasalarea CVTS
Volume
CV6 QMDbTreesBasalarea CVTS
Volume
CV6CVTS CV6
1961 24 939 939 163 163 0.00 0.00 0.0 0.0 0 39 0 7 0 39 0 71965 28 1,943 1,945 685 685 .36 .36 8.3 8.3 251 69 130 24 252 69 130 241968 31 2,816 2,850 1,389 1,398 .38 .38 7.9 8.3 291 91 235 45 302 92 238 451971 34 3,748 3,787 2,264 2,273 .33 .32 7.3 7.3 311 110 292 67 312 111 292 671975 38 5,406 5,456 3,888 3,899 .35 .35 8.0 8.1 414 142 406 102 417 144 406 1031979 42 7,035 7,085 5,521 5,532 .31 .31 7.5 7.5 407 167 408 131 407 169 408 1321983 46 8,684 8,734 7,153 7,164 .30 .30 6.9 6.9 412 189 408 156 412 190 408 1561988 51 10,426 10,476 8,891 8,901 .23 .23 5.8 5.8 348 204 347 174 348 205 347 1751993 56 12,456 12,507 10,869 10,880 .20 .20 5.6 5.6 406 222 396 194 406 223 396 194
YearStandage
NetCVTS
GrossCVTS
GrossCV6
NetCV6 Net Survivor
CVTSPAI
Cumulative yielde
Net GrossCVTSPAI
CVTSMAI
CV6PAI
CV6MAI
CV6PAI
CVTSMAI
CV6MAI
Net volume growthg Gross volume growth
a Average height (ht) and diameter at breast height (d.b.h.) of the 40 largest trees per acre (estimated from d.b.h. and ht-d.b.h. curves).b Quadratic mean diameter at breast height.c All volumes are total stem cubic feet (CVTS) or merchantable cubic to a 6-inch top diameter inside bark (CV6).d Average d.b.h. cut/average d.b.h. before thinning.e Cumulative yield: net = standing + thinning; gross = standing + thinning + mortality; yield does not include any volume removed in a calibration cut. Volume (CVTS) removed inthinnings = 1,780 cubic feet (25 percent of the total gross yield at the time of the last thinning). Volume (CVTS) in mortality = 50 cubic feet (<1 percent of the total gross yield).f Net is QMD growth of trees alive at the start and end of the period; survivor is QMD growth of trees alive at the end of the period.g MAI = mean annual increment; PAI = periodic annual increment.
Years Ft Inches No. Ft 2 - - - - Ft 3 - - - - No. Ft 2 - - - - - - - - Ft 3 - - - - - - - - No. Ft 2 - - - Ft 3 - - -
Years - - - - - - - - - - - Ft 3 - - - - - - - - - - - - - Inches - - - - - - Ft 2 - - - - - - - - - - - - - - - - - - - - - - - - - - Ft 3 - - - - - - - - - - - - - - - - - - - - - - - -
QMD growthfBasal area
growth
Inches Inches Inches

68
1961 24 49 7.7 385 5.0 51.1 963 170 0 0.0 0.0 0 0 0.0 0.0 0.00 0 0.0 0.0 0 01965 28 63 9.8 292 6.7 68.6 1,641 584 88 5.8 16.1 370 85 4.2 3.1 .90 5 5.2 .7 15 11968 31 70 11.2 247 7.9 81.9 2,199 1,164 38 7.7 12.5 341 175 9.0 5.8 .99 7 5.2 1.0 21 01971 34 77 12.5 200 9.3 89.8 2,729 1,856 42 7.5 12.7 376 175 9.0 5.0 .85 5 9.8 2.6 74 571975 38 90 14.6 143 11.4 97.4 3,365 2,795 53 9.2 24.8 838 592 15.8 11.4 .86 3 6.6 .8 23 71979 42 101 16.4 100 13.8 98.9 3,825 3,456 42 10.4 24.7 949 752 22.6 17.9 .82 2 12.0 1.3 52 461983 46 109 18.3 100 15.4 123.0 5,108 4,722 0 .0 .0 0 0 .0 .0 .00 0 .0 .0 0 01988 51 119 20.2 98 16.8 145.1 6,451 6,038 0 .0 .0 0 0 .0 .0 .00 2 18.4 3.1 136 1301993 56 132 22.0 97 18.3 167.9 8,140 7,679 0 .0 .0 0 0 .0 .0 .00 2 12.1 1.3 66 59
YearStandage
Table 32—Skykomish: Stand development for treatment 6, per-acre basis (plots 6007, 6015, and 6033)
40 largesta
Ht D.b.h. QMDbTreesBasalarea CVTS d/Dd
After thinning Removed in thinning Mortality
Volumec Avg. volume
CV6 QMDbTreesBasalarea CVTS
Volume
CV6 QMDbTreesBasalarea CVTS
Volume
CV6CVTS CV6
1961 24 963 963 170 170 0.00 0.00 0.0 0.0 0 40 0 7 0 40 0 71965 28 2,010 2,025 669 670 .37 .37 8.4 8.6 262 72 125 24 266 72 125 241968 31 2,909 2,945 1,424 1,424 .41 .40 8.6 8.9 300 94 252 46 307 95 252 461971 34 3,816 3,926 2,291 2,348 .34 .36 6.9 7.7 302 112 289 67 327 115 308 691975 38 5,289 5,423 3,822 3,887 .41 .40 8.1 8.3 368 139 383 101 374 143 385 1021979 42 6,699 6,884 5,235 5,346 .37 .38 6.6 6.9 352 160 353 125 365 164 365 1271983 46 7,983 8,168 6,501 6,612 .40 .40 6.0 6.0 321 174 317 141 321 178 317 1441988 51 9,325 9,646 7,817 8,058 .29 .30 4.4 5.0 268 183 263 153 296 189 289 1581993 56 11,014 11,402 9,458 9,758 .29 .27 4.6 4.8 338 197 328 169 351 204 340 174
YearStandage
NetCVTS
GrossCVTS
GrossCV6
NetCV6 Net Survivor
CVTSPAI
Cumulative yielde
Net GrossCVTSPAI
CVTSMAI
CV6PAI
CV6MAI
CV6PAI
CVTSMAI
CV6MAI
Net volume growthg Gross volume growth
a Average height (ht) and diameter at breast height (d.b.h.) of the 40 largest trees per acre (estimated from d.b.h. and ht-d.b.h. curves).b Quadratic mean diameter at breast height.c All volumes are total stem cubic feet (CVTS) or merchantable cubic to a 6-inch top diameter inside bark (CV6).d Average d.b.h. cut/average d.b.h. before thinning.e Cumulative yield: net = standing + thinning; gross = standing + thinning + mortality; yield does not include any volume removed in a calibration cut. Volume (CVTS) removed inthinnings = 2,874 cubic feet (42 percent of the total gross yield at the time of the last thinning). Volume (CVTS) in mortality = 388 cubic feet (3 percent of the total gross yield).f Net is QMD growth of trees alive at the start and end of the period; survivor is QMD growth of trees alive at the end of the period.g MAI = mean annual increment; PAI = periodic annual increment.
Years Ft Inches No. Ft2 - - - - Ft 3 - - - - No. Ft2 - - - - - - - - Ft 3 - - - - - - - - No. Ft2 - - - Ft 3 - - -
Years - - - - - - - - - - - Ft 3 - - - - - - - - - - - - - Inches - - - - - - Ft 2 - - - - - - - - - - - - - - - - - - - - - - - - - - Ft 3 - - - - - - - - - - - - - - - - - - - - - - - -
QMD growthfBasal area
growth
Inches Inches Inches

69
1961 24 48 8.1 352 5.2 51.1 964 175 0 0.0 0.0 0 0 0.0 0.0 0.00 0 0.0 0.0 0 01965 28 60 10.5 285 7.0 75.6 1,807 706 63 6.4 14.1 338 103 5.4 3.8 .93 3 5.4 .5 12 01968 31 68 12.0 267 8.2 98.0 2,637 1,492 17 8.3 6.3 176 105 10.4 8.1 1 .01 2 5.5 .3 7 01971 34 75 13.3 248 9.3 117.6 3,458 2,407 17 8.3 6.2 182 102 10.7 6.0 .89 2 9.2 .8 24 171975 38 87 15.3 227 10.8 144.5 4,863 3,939 20 9.8 10.4 346 260 17.3 13.0 .91 2 11.6 1.2 43 381979 42 98 17.1 208 12.1 166.9 6,253 5,405 17 11.1 11.2 433 366 25.5 21.5 .92 2 6.7 .4 15 31983 46 108 18.8 202 13.3 192.6 7,929 7,080 0 .0 .0 0 0 .0 .0 .00 7 9.0 3.0 111 771988 51 119 20.5 195 14.4 219.4 9,840 8,984 0 .0 .0 0 0 .0 .0 .00 7 8.6 2.7 103 651993 56 129 22.1 188 15.5 243.5 11,625 10,758 0 .0 .0 0 0 .0 .0 .00 7 9.7 3.4 164 123
YearStandage
Table 33—Skykomish: Stand development for treatment 7, per-acre basis (plots 6021, 6027, and 6030)
40 largesta
Ht D.b.h. QMDbTreesBasalarea CVTS d/Dd
After thinning Removed in thinning Mortality
Volumec Avg. volume
CV6 QMDbTreesBasalarea CVTS
Volume
CV6 QMDbTreesBasalarea CVTS
Volume
CV6CVTS CV6
1961 24 964 964 175 175 0.00 0.00 0.0 0.0 0 40 0 7 0 40 0 71965 28 2,146 2,158 809 809 .43 .43 9.7 9.8 295 77 158 29 298 77 158 291968 31 3,152 3,171 1,701 1,701 .41 .41 9.5 9.6 335 102 297 55 338 102 297 551971 34 4,154 4,197 2,718 2,734 .35 .35 8.6 8.9 334 122 339 80 342 123 344 801975 38 5,906 5,992 4,510 4,564 .35 .36 9.3 9.6 438 155 448 119 449 158 457 1201979 42 7,729 7,830 6,341 6,399 .31 .30 8.4 8.5 456 184 458 151 459 186 459 1521983 46 9,406 9,617 8,016 8,151 .28 .26 6.4 7.2 419 204 419 174 447 209 438 1771988 51 11,316 11,630 9,921 10,120 .23 .20 5.4 5.9 382 222 381 195 403 228 394 1981993 56 13,101 13,579 11,694 12,016 .21 .18 4.8 5.5 357 234 355 209 390 242 379 215
YearStandage
NetCVTS
GrossCVTS
GrossCV6
NetCV6 Net Survivor
CVTSPAI
Cumulative yielde
Net GrossCVTSPAI
CVTSMAI
CV6PAI
CV6MAI
CV6PAI
CVTSMAI
CV6MAI
Net volume growthg Gross volume growth
a Average height (ht) and diameter at breast height (d.b.h.) of the 40 largest trees per acre (estimated from d.b.h. and ht-d.b.h. curves).b Quadratic mean diameter at breast height.c All volumes are total stem cubic feet (CVTS) or merchantable cubic to a 6-inch top diameter inside bark (CV6).d Average d.b.h. cut/average d.b.h. before thinning.e Cumulative yield: net = standing + thinning; gross = standing + thinning + mortality; yield does not include any volume removed in a calibration cut. Volume (CVTS) removed inthinnings = 1,477 cubic feet (19 percent of the total gross yield at the time of the last thinning). Volume (CVTS) in mortality = 478 cubic feet (4 percent of the total gross yield).f Net is QMD growth of trees alive at the start and end of the period; survivor is QMD growth of trees alive at the end of the period.g MAI = mean annual increment; PAI = periodic annual increment.
Years Ft Inches No. Ft 2 - - - - Ft 3 - - - - No. Ft 2 - - - - - - - - Ft 3 - - - - - - - - No. Ft 2 - - - Ft 3 - - -
Years - - - - - - - - - - - Ft 3 - - - - - - - - - - - - - Inches - - - - - - Ft 2 - - - - - - - - - - - - - - - - - - - - - - - - - - Ft 3 - - - - - - - - - - - - - - - - - - - - - - - -
QMD growthfBasal area
growth
Inches Inches Inches

70
1961 24 46 8.2 360 5.1 51.2 926 169 0 0.0 0.0 0 0 0.0 0.0 0.00 0 0.0 0.0 0 01965 28 59 10.5 308 6.7 75.9 1,785 683 50 6.3 10.9 258 85 5.2 4.3 .95 2 3.6 .1 2 01968 31 70 11.7 280 7.9 94.4 2,542 1,401 23 7.4 7.0 184 84 8.0 4.9 .95 5 5.9 1.0 24 11971 34 76 12.9 252 8.9 108.8 3,221 2,131 20 8.4 7.8 228 136 11.4 7.6 .95 8 6.7 2.0 53 251975 38 90 14.7 210 10.4 124.2 4,329 3,403 35 9.3 16.7 576 418 16.5 13.1 .91 7 8.1 2.4 77 411979 42 98 16.4 173 11.9 133.7 4,990 4,278 35 10.2 19.8 725 571 20.7 16.3 .88 2 4.7 .2 5 01983 46 108 18.0 172 13.0 158.9 6,550 5,797 0 .0 .0 0 0 .0 .0 .00 2 6.2 .3 11 11988 51 122 19.6 168 14.2 185.0 8,382 7,624 0 .0 .0 0 0 .0 .0 .00 3 7.9 1.1 40 201993 56 135 20.8 152 15.4 196.3 9,786 9,047 0 .0 .0 0 0 .0 .0 .00 17 11.0 11.1 514 429
YearStandage
Table 34—Skykomish: Stand development for treatment 8, per-acre basis (plots 6008, 6025, and 6037)
40 largesta
Ht D.b.h. QMDbTreesBasalarea CVTS d/Dd
After thinning Removed in thinning Mortality
Volumec Avg. volume
CV6 QMDbTreesBasalarea CVTS
Volume
CV6 QMDbTreesBasalarea CVTS
Volume
CV6CVTS CV6
1961 24 926 926 169 169 0.00 0.00 0.0 0.0 0 39 0 7 0 39 0 71965 28 2,043 2,045 768 768 .39 .39 8.9 8.9 279 73 150 27 280 73 150 271968 31 2,984 3,011 1,570 1,571 .37 .37 8.5 8.8 314 96 267 51 322 97 268 511971 34 3,892 3,971 2,435 2,461 .34 .33 7.4 8.1 302 114 289 72 320 117 297 721975 38 5,575 5,731 4,125 4,193 .34 .34 8.0 8.6 421 147 422 109 440 151 433 1101979 42 6,961 7,122 5,571 5,638 .30 .29 7.3 7.4 346 166 361 133 348 170 361 1341983 46 8,521 8,694 7,090 7,158 .28 .27 6.3 6.4 390 185 380 154 393 189 380 1561988 51 10,353 10,565 8,917 9,005 .23 .22 5.2 5.4 366 203 365 175 374 207 369 1771993 56 11,756 12,482 10,339 10,856 .25 .18 2.3 4.5 281 210 285 185 383 223 370 194
YearStandage
NetCVTS
GrossCVTS
GrossCV6
NetCV6 Net Survivor
CVTSPAI
Cumulative yielde
Net GrossCVTSPAI
CVTSMAI
CV6PAI
CV6MAI
CV6PAI
CVTSMAI
CV6MAI
Net volume growthg Gross volume growth
a Average height (ht) and diameter at breast height (d.b.h.) of the 40 largest trees per acre (estimated from d.b.h. and ht-d.b.h. curves).b Quadratic mean diameter at breast height.c All volumes are total stem cubic feet (CVTS) or merchantable cubic to a 6-inch top diameter inside bark (CV6).d Average d.b.h. cut/average d.b.h. before thinning.e Cumulative yield: net = standing + thinning; gross = standing + thinning + mortality; yield does not include any volume removed in a calibration cut. Volume (CVTS) removed inthinnings = 1,971 cubic feet (28 percent of the total gross yield at the time of the last thinning). Volume (CVTS) in mortality = 726 cubic feet (6 percent of the total gross yield).f Net is QMD growth of trees alive at the start and end of the period; survivor is QMD growth of trees alive at the end of the period.g MAI = mean annual increment; PAI = periodic annual increment.
Years Ft Inches No. Ft2 - - - - Ft 3 - - - - No. Ft2 - - - - - - - - Ft 3 - - - - - - - - No. Ft2 - - - Ft 3 - - -
Years - - - - - - - - - - - Ft 3 - - - - - - - - - - - - - Inches - - - - - - Ft 2 - - - - - - - - - - - - - - - - - - - - - - - - - - Ft 3 - - - - - - - - - - - - - - - - - - - - - - - -
QMD growthfBasal area
growth
Inches Inches Inches

71
1961 24 45 8.1 594 4.7 72.5 1,266 177 0 0.0 0.0 0 0 0.0 0.0 0.00 0 0.0 0.0 0 01965 28 57 9.9 594 5.8 18.7 2,471 653 0 .0 .0 0 0 .0 .0 .00 0 .0 .0 0 01968 31 67 11.1 589 6.6 139.3 3,700 1,404 0 .0 .0 0 0 .0 .0 .00 5 5.0 .7 17 01971 34 77 12.2 581 7.3 166.7 5,051 2,415 0 .0 .0 0 0 .0 .0 .00 8 4.7 .9 24 31975 38 89 13.8 526 8.3 195.1 6,627 4,097 0 .0 .0 0 0 .0 .0 .00 55 5.7 9.7 293 851979 42 101 15.3 470 9.3 218.7 8,352 5,912 0 .0 .0 0 0 .0 .0 .00 56 5.4 8.9 288 441983 46 112 16.8 424 10.3 242.1 10,352 7,998 0 .0 .0 0 0 .0 .0 .00 46 5.7 8.3 301 391988 51 123 18.4 385 11.4 267.5 12,118 10,068 0 .0 .0 0 0 .0 .0 .00 39 6.5 8.9 324 951993 56 133 19.9 304 12.9 271.0 13,316 11,719 0 .0 .0 0 0 .0 .0 .00 81 7.8 27.0 1148 620
YearStandage
Table 35—Skykomish: Stand development for control, per-acre basis (plots 6002, 6014, 6038, and 6039)
40 largesta
Ht D.b.h. QMDbTreesBasalarea CVTS d/Dd
After thinning Removed in thinning Mortality
Volumec Avg. volume
CV6 QMDbTreesBasalarea CVTS
Volume
CV6 QMDbTreesBasalarea CVTS
Volume
CV6CVTS CV6
1961 24 1,266 1,266 177 177 0.00 0.00 0.0 0.0 0 53 0 7 0 53 0 71965 28 2,471 2,471 653 653 .27 .27 9.1 9.1 301 88 119 23 301 88 119 231968 31 3,700 3,717 1,404 1,404 .27 .27 10.2 10.4 410 119 251 45 415 120 251 451971 34 5,051 5,092 2,415 2,418 .22 .22 9.1 9.4 450 149 337 71 458 150 338 711975 38 6,627 6,961 4,097 4,184 .25 .22 7.1 9.5 394 174 420 108 467 183 442 1101979 42 8,352 8,975 5,912 6,043 .26 .18 5.9 8.2 431 199 454 141 504 214 465 1441983 46 10,352 11,276 7,998 8,169 .25 .18 5.8 7.9 500 225 522 174 575 245 531 1781988 51 12,118 13,365 10,068 10,334 .22 .15 5.1 6.9 353 238 414 197 418 262 433 2031993 56 13,316 15,711 11,719 12,605 .31 .15 .7 6.1 240 238 330 209 469 281 454 225
YearStandage
NetCVTS
GrossCVTS
GrossCV6
NetCV6 Net Survivor
CVTSPAI
Cumulative yielde
Net GrossCVTSPAI
CVTSMAI
CV6PAI
CV6MAI
CV6PAI
CVTSMAI
CV6MAI
Net volume growthg Gross volume growth
a Average height (ht) and diameter at breast height (d.b.h.) of the 40 largest trees per acre (estimated from d.b.h. and ht-d.b.h. curves).b Quadratic mean diameter at breast height.c All volumes are total stem cubic feet (CVTS) or merchantable cubic to a 6-inch top diameter inside bark (CV6).d Average d.b.h. cut/average d.b.h. before thinning.e Cumulative yield: net = standing + thinning; gross = standing + thinning + mortality; yield does not include any volume removed in a calibration cut. Volume (CVTS) in mortality =2,395 cubic feet (15 percent of the total gross yield).f Net is QMD growth of trees alive at the start and end of the period; survivor is QMD growth of trees alive at the end of the period.g MAI = mean annual increment; PAI = periodic annual increment.
Years Ft Inches No. Ft 2 - - - - Ft 3 - - - - No. Ft 2 - - - - - - - - Ft 3 - - - - - - - - No. Ft 2 - - - Ft 3 - - -
Years - - - - - - - - - - - Ft 3 - - - - - - - - - - - - - Inches - - - - - - Ft 2 - - - - - - - - - - - - - - - - - - - - - - - - - - Ft 3 - - - - - - - - - - - - - - - - - - - - - - - -
QMD growth fBasal area
growth
Inches Inches Inches

72 Table 36—Skykomish: Trees per acre, 1961–1993, by treatment, plot, and period
Calibrationperiod
1961–1965a
Age (years)
Treatment Plot 24 28
Treatmentperiod 1
1965–1968a
Age (years)
Treatmentperiod 2
1968–1971a
Age (years)
Treatmentperiod 3
1971–1975a
Age (years)
Treatmentperiod 4
1975–1979a
Age (years)
Treatmentperiod 5
1979–1983a
Age (years)
Treatmentperiod 6
1983–1988a
Age (years)
Treatmentperiod 7
1988–1993a
Age (years)
28 31 31 34 34 38 38 42 42 46 46 51 51 56
a Columns are measurements after treatment and just before next treatment.
1 6010 410 405 225 215 165 165 105 105 60 60 50 50 50 50 50 506022 290 290 160 160 120 120 75 75 55 55 45 45 45 45 45 456034 320 320 170 170 130 130 100 100 70 70 55 55 55 55 55 55
Avg. 340 338 185 182 138 138 93 93 62 62 50 50 50 50 50 50
2 6005 375 375 235 235 185 180 160 155 130 130 115 115 115 110 110 1056012 340 340 210 210 170 170 145 145 115 115 100 100 100 100 100 1006026 390 390 215 210 170 170 135 135 125 125 105 105 105 105 105 105
Avg. 368 368 220 218 175 173 147 145 123 123 107 107 107 105 105 103
3 6016 410 410 255 255 205 205 160 160 115 115 85 85 85 85 85 856031 340 340 215 215 185 185 150 150 110 105 85 85 85 85 85 856036 375 375 275 275 225 225 185 185 135 135 105 105 105 100 100 100
Avg. 375 375 248 248 205 205 165 165 120 118 92 92 92 90 90 90
4 6001 330 330 200 200 170 170 140 140 125 125 115 115 115 115 115 1156023 315 315 185 185 160 160 140 140 120 120 115 115 115 115 115 1156035 300 300 205 205 180 180 165 165 145 145 135 135 135 120 120 110
Avg. 315 315 197 197 170 170 148 148 130 130 122 122 122 117 117 113
5 6009 420 415 335 320 300 295 275 275 240 240 210 210 210 210 210 2106011 340 340 280 280 250 250 220 220 195 195 165 165 165 165 165 1656028 330 330 235 235 210 210 185 180 160 160 140 140 140 140 140 140
Avg. 363 362 283 278 253 252 227 225 198 198 172 172 172 172 172 172
6 6007 320 320 255 255 215 205 180 180 135 135 100 100 100 95 95 906015 350 345 250 245 200 200 155 150 105 105 70 70 70 70 70 706033 485 475 370 355 325 320 265 260 190 185 130 130 130 130 130 130
Avg. 385 380 292 285 247 242 200 197 143 142 100 100 100 98 98 97
7 6021 330 325 270 270 250 250 230 230 210 205 190 180 180 180 180 1706027 375 375 310 310 290 290 270 265 250 250 230 225 225 225 225 2156030 350 345 275 270 260 255 245 245 220 220 205 200 200 180 180 180
Avg. 352 348 285 283 267 265 248 247 227 225 208 202 202 195 195 188
8 6008 340 340 300 300 270 265 240 230 200 200 170 170 170 170 170 1706025 365 360 300 285 275 265 245 245 205 205 170 165 165 165 165 1406037 375 375 325 325 295 285 270 260 225 220 180 180 180 170 170 145
Avg. 360 358 308 303 280 272 252 245 210 208 173 172 172 168 168 152
Control 6002 785 785 785 775 775 755 755 655 655 585 585 515 515 470 470 3806014 530 530 530 530 530 520 520 515 515 455 455 415 415 395 395 3256038 425 425 425 425 425 425 425 375 375 330 330 315 315 280 280 2456039 635 635 635 625 625 625 625 560 560 510 510 450 450 395 395 265
Avg. 594 594 594 589 589 581 581 526 526 470 470 424 424 385 385 304
Number of trees per acre

73 a Columns are measurements after treatment and just before next treatment.
1 6010 51.1 89.3 53.9 75.7 59.5 81.0 60.6 86.3 62.9 83.3 67.6 85.1 85.1 104.0 104.0 119.66022 51.4 84.7 54.5 75.3 59.0 77.4 60.5 83.6 64.5 82.6 68.1 84.2 84.2 101.5 101.5 120.26034 50.6 86.9 52.9 72.9 58.4 75.6 60.6 83.9 63.8 83.3 67.5 83.0 83.0 100.2 100.2 118.5
Avg. 51.0 87.0 53.8 74.6 59.0 78.0 60.6 84.6 63.7 83.0 67.7 84.1 84.1 101.9 101.9 119.4
2 6005 49.9 80.0 55.3 76.3 60.3 75.8 69.4 96.3 84.7 111.9 101.0 123.7 123.7 138.3 138.3 157.76012 49.6 81.9 54.5 76.4 59.9 78.5 69.0 97.4 84.6 108.1 95.8 116.4 116.4 137.7 137.7 155.16026 51.3 93.2 54.3 75.8 62.0 82.6 69.0 97.4 87.8 114.5 100.5 121.3 121.3 144.3 144.3 166.5
Avg. 50.3 85.0 54.7 76.2 60.7 79.0 69.1 97.0 85.7 111.5 99.1 120.4 120.4 140.1 140.1 159.8
3 6016 50.0 89.7 61.9 88.7 71.3 93.0 79.4 110.9 90.6 116.8 101.0 123.9 123.9 149.0 149.0 172.96031 51.3 85.6 61.4 83.8 70.9 91.6 79.4 109.5 91.1 111.9 100.3 122.8 122.8 147.1 147.1 168.06036 50.8 80.3 61.9 85.0 70.4 92.8 79.4 113.2 91.3 119.1 101.1 126.3 126.3 152.3 152.3 178.7
Avg. 50.7 85.2 61.7 85.8 70.9 92.5 79.4 111.2 91.0 115.9 100.8 124.3 124.3 149.5 149.5 173.2
4 6001 51.4 85.8 61.6 85.2 74.3 97.0 88.1 118.8 111.2 140.0 134.5 159.9 159.9 185.7 185.7 208.76023 51.0 89.9 61.5 85.7 73.9 96.6 88.4 120.5 111.3 136.7 133.2 159.3 159.3 184.1 184.1 203.26035 51.2 83.5 61.8 83.7 73.9 95.3 88.2 122.4 111.3 138.5 133.9 158.6 158.6 163.8 163.8 172.9
Avg. 51.2 86.4 61.6 84.8 74.0 96.3 88.2 120.6 111.3 138.4 133.9 159.3 159.3 177.9 177.9 194.9
5 6009 49.7 82.2 68.4 89.7 84.7 105.8 98.4 131.6 117.7 147.8 133.8 161.6 161.6 190.9 190.9 219.06011 51.5 80.8 68.7 92.9 84.7 106.7 97.7 129.9 117.7 149.4 134.0 162.9 162.9 193.1 193.1 220.86028 52.6 89.9 68.8 94.5 85.3 107.7 98.4 129.4 117.6 145.3 133.9 160.0 160.0 187.9 187.9 215.8
Avg. 51.3 84.3 68.7 92.4 84.9 106.7 98.2 130.3 117.7 147.5 133.9 161.5 161.5 190.6 190.6 218.5
6 6007 51.4 82.0 69.0 95.3 81.6 97.4 89.7 120.9 97.7 124.1 100.9 123.1 123.1 136.0 136.0 152.96015 51.5 87.8 70.1 97.8 81.8 105.8 89.8 120.5 97.4 123.7 98.9 123.0 123.0 148.7 148.7 173.46033 50.4 84.3 66.8 90.2 82.4 104.2 89.8 125.2 97.0 123.0 97.0 123.0 123.0 150.4 150.4 177.4
Avg. 51.1 84.7 68.6 94.5 81.9 102.5 89.8 122.2 97.4 123.6 98.9 123.0 123.0 145.1 145.1 167.9
7 6021 51.4 90.7 75.8 106.3 98.7 125.9 117.5 156.4 144.6 178.1 166.7 189.9 189.9 221.3 221.3 245.86027 50.4 89.1 75.9 104.6 97.8 124.3 117.6 152.1 144.5 178.8 166.9 193.9 193.9 223.4 223.4 245.96030 51.4 89.4 75.1 101.8 97.4 121.1 117.6 156.2 144.4 177.3 167.0 194.0 194.0 213.5 213.5 238.9
Avg. 51.1 89.7 75.6 104.2 98.0 123.8 117.6 154.9 144.5 178.1 166.9 192.6 192.6 219.4 219.4 243.5
8 6008 52.1 86.9 76.1 104.1 95.1 117.3 108.8 142.6 124.3 154.3 133.6 158.9 158.9 184.4 184.4 209.26025 51.7 87.6 75.5 98.1 94.7 118.6 108.9 142.6 124.1 154.2 133.9 159.3 159.3 188.6 188.6 202.66037 49.7 85.9 76.0 102.0 93.2 113.8 108.8 137.5 124.2 151.9 133.5 158.4 158.4 181.9 181.9 177.3
Avg. 51.2 86.8 75.9 101.4 94.4 116.6 108.8 140.9 124.2 153.5 133.7 158.9 158.9 185.0 185.0 196.3
Control 6002 87.6 125.9 125.9 157.6 157.6 185.3 185.3 208.1 208.1 226.3 226.3 244.6 244.6 265.5 265.5 265.96014 62.4 99.1 99.1 129.4 129.4 155.2 155.2 190.3 190.3 214.5 214.5 233.5 233.5 260.1 260.1 269.66038 54.5 85.4 85.4 112.7 112.7 138.9 138.9 167.0 167.0 194.0 194.0 223.0 223.0 246.6 246.6 266.86039 85.5 124.6 124.6 157.7 157.7 187.3 187.3 215.0 215.0 240.1 240.1 267.5 267.5 297.9 297.9 281.5
Avg. 72.5 108.7 108.7 139.3 139.3 166.7 166.7 195.1 195.1 218.7 218.7 242.1 242.1 267.5 267.5 271.0
Square feet per acre
Table 37—Skykomish: Basal area per acre, 1961–1993, by treatment, plot, and period
Calibrationperiod
1961–1965a
Age (years)
Treatment Plot 24 28
Treatmentperiod 1
1965–1968a
Age (years)
Treatmentperiod 2
1968–1971a
Age (years)
Treatmentperiod 3
1971–1975a
Age (years)
Treatmentperiod 4
1975–1979a
Age (years)
Treatmentperiod 5
1979–1983a
Age (years)
Treatmentperiod 6
1983–1988a
Age (years)
Treatmentperiod 7
1988–1993a
Age (years)
28 31 31 34 34 38 38 42 42 46 46 51 51 56

74
a Columns are measurements after treatment and just before next treatment.
1 6010 4.8 6.4 6.6 8.0 8.1 9.5 10.3 12.3 13.9 16.0 15.7 17.7 17.7 19.5 19.5 20.96022 5.7 7.3 7.9 9.3 9.5 10.9 12.2 14.3 14.7 16.6 16.7 18.5 18.5 20.3 20.3 22.16034 5.4 7.1 7.6 8.9 9.1 10.3 10.5 12.4 12.9 14.8 15.0 16.6 16.6 18.3 18.3 19.9
Avg. 5.3 6.9 7.4 8.7 8.9 10.2 11.0 13.0 13.8 15.8 15.8 17.6 17.6 19.4 19.4 21.0
2 6005 4.9 6.3 6.6 7.7 7.7 8.8 8.9 10.7 10.9 12.6 12.7 14.0 14.0 15.2 15.2 16.66012 5.2 6.6 6.9 8.2 8.0 9.2 9.3 11.1 11.6 13.1 13.3 14.6 14.6 15.9 15.9 16.96026 4.9 6.6 6.8 8.1 8.2 9.4 9.7 11.5 11.3 13.0 13.2 14.6 14.6 15.9 15.9 17.1
Avg. 5.0 6.5 6.8 8.0 8.0 9.1 9.3 11.1 11.3 12.9 13.1 14.4 14.4 15.6 15.6 16.8
3 6016 4.7 6.3 6.7 8.0 8.0 9.1 9.5 11.3 12.0 13.6 14.8 16.3 16.3 17.9 17.9 19.36031 5.3 6.8 7.2 8.5 8.4 9.5 9.9 11.6 12.3 14.0 14.7 16.3 16.3 17.8 17.8 19.06036 5.0 6.3 6.4 7.5 7.6 8.7 8.9 10.6 11.1 12.7 13.3 14.9 14.9 16.7 16.7 18.1
Avg. 5.0 6.5 6.8 8.0 8.0 9.1 9.4 11.1 11.8 13.4 14.3 15.8 15.8 17.5 17.5 18.8
4 6001 5.3 6.9 7.5 8.8 9.0 10.2 10.7 12.5 12.8 14.3 14.6 16.0 16.0 17.2 17.2 18.26023 5.4 7.2 7.8 9.2 9.2 10.5 10.8 12.6 13.0 14.5 14.6 15.9 15.9 17.1 17.1 18.06035 5.6 7.1 7.4 8.7 8.7 9.9 9.9 11.7 11.9 13.2 13.5 14.7 14.7 15.8 15.8 17.0
Avg. 5.5 7.1 7.6 8.9 8.9 10.2 10.5 12.2 12.6 14.0 14.2 15.5 15.5 16.7 16.7 17.7
5 6009 4.7 6.0 6.1 7.2 7.2 8.1 8.1 9.4 9.5 10.6 10.8 11.9 11.9 12.9 12.9 13.86011 5.3 6.6 6.7 7.8 7.9 8.8 9.0 10.4 10.5 11.9 12.2 13.5 13.5 14.6 14.6 15.76028 5.4 7.1 7.3 8.6 8.6 9.7 9.9 11.5 11.6 12.9 13.2 14.5 14.5 15.7 15.7 16.8
Avg. 5.1 6.6 6.7 7.9 7.9 8.9 9.0 10.4 10.5 11.8 12.1 13.3 13.3 14.4 14.4 15.4
6 6007 5.4 6.9 7.0 8.3 8.3 9.3 9.6 11.1 11.5 13.0 13.6 15.0 15.0 16.2 16.2 17.76015 5.2 6.8 7.2 8.6 8.7 9.8 10.3 12.1 13.0 14.7 16.1 17.9 17.9 19.7 19.7 21.36033 4.4 5.7 5.8 6.8 6.8 7.7 7.9 9.4 9.7 11.0 11.7 13.2 13.2 14.6 14.6 15.8
Avg. 5.0 6.5 6.7 7.9 7.9 9.0 9.3 10.9 11.4 12.9 13.8 15.4 15.4 16.8 16.8 18.3
7 6021 5.3 7.2 7.2 8.5 8.5 9.6 9.7 11.2 11.2 12.6 12.7 13.9 13.9 15.0 15.0 16.36027 5.0 6.6 6.7 7.9 7.9 8.9 8.9 10.3 10.3 11.5 11.5 12.6 12.6 13.5 13.5 14.56030 5.2 6.9 7.1 8.3 8.3 9.3 9.4 10.8 11.0 12.2 12.2 13.3 13.3 14.7 14.7 15.6
Avg. 5.2 6.9 7.0 8.2 8.2 9.3 9.3 10.7 10.8 12.1 12.1 13.3 13.3 14.4 14.4 15.5
8 6008 5.3 6.8 6.8 8.0 8.0 9.0 9.1 10.7 10.7 11.9 12.0 13.1 13.1 14.1 14.1 15.06025 5.1 6.7 6.8 7.9 7.9 9.1 9.0 10.3 10.5 11.7 12.0 13.3 13.3 14.5 14.5 16.36037 4.9 6.5 6.5 7.6 7.6 8.6 8.6 9.8 10.1 11.3 11.7 12.7 12.7 14.0 14.0 15.0
Avg. 5.1 6.7 6.7 7.8 7.9 8.9 8.9 10.3 10.4 11.6 11.9 13.0 13.0 14.2 14.2 15.4
Control 6002 4.5 5.4 5.4 6.1 6.1 6.7 6.7 7.6 7.6 8.4 8.4 9.3 9.3 10.2 10.2 11.36014 4.6 5.9 5.9 6.7 6.7 7.4 7.4 8.2 8.2 9.3 9.3 10.2 10.2 11.0 11.0 12.36038 4.9 6.1 6.1 7.0 7.0 7.7 7.7 9.0 9.0 10.4 10.4 11.4 11.4 12.7 12.7 14.16039 5.0 6.0 6.0 6.8 6.8 7.4 7.4 8.4 8.4 9.3 9.3 10.4 10.4 11.8 11.8 14.0
Avg. 4.7 5.8 5.8 6.6 6.6 7.3 7.3 8.3 8.3 9.3 9.3 10.3 10.3 11.4 11.4 12.9
Inches
Table 38—Skykomish: Quadratic mean diameter, 1961–1993, by treatment, plot, and period
Calibrationperiod
1961–1965a
Age (years)
Treatment Plot 24 28
Treatmentperiod 1
1965–1968a
Age (years)
Treatmentperiod 2
1968–1971a
Age (years)
Treatmentperiod 3
1971–1975a
Age (years)
Treatmentperiod 4
1975–1979a
Age (years)
Treatmentperiod 5
1979–1983a
Age (years)
Treatmentperiod 6
1983–1988a
Age (years)
Treatmentperiod 7
1988–1993a
Age (years)
28 31 31 34 34 38 38 42 42 46 46 51 51 56

75 a Columns are measurements after treatment and just before next treatment.
1 6010 981 2,140 1,294 2,040 1,599 2,441 1,843 2,963 2,165 3,142 2,532 3,429 3,429 4,436 4,436 5,6066022 1,012 2,133 1,403 2,142 1,692 2,449 1,942 2,983 2,310 3,209 2,647 3,510 3,510 4,477 4,477 5,7046034 951 2,062 1,279 2,007 1,619 2,329 1,869 2,908 2,234 3,227 2,621 3,464 3,464 4,417 4,417 5,638
Avg. 981 2,112 1,325 2,063 1,637 2,406 1,885 2,951 2,236 3,193 2,600 3,468 3,468 4,443 4,443 5,650
2 6005 858 1,776 1,242 1,981 1,557 2,169 1,993 3,313 2,929 4,245 3,848 5,221 5,221 6,359 6,359 7,7416012 893 1,881 1,254 2,038 1,582 2,302 2,040 3,411 2,973 4,092 3,624 4,885 4,885 6,208 6,208 7,5246026 911 2,185 1,283 2,085 1,704 2,519 2,125 3,566 3,228 4,572 4,031 5,453 5,453 6,941 6,941 8,469
Avg. 887 1,948 1,260 2,034 1,614 2,330 2,053 3,430 3,043 4,303 3,834 5,187 5,187 6,503 6,503 7,912
3 6016 920 2,040 1,425 2,301 1,849 2,746 2,358 3,776 3,085 4,374 3,776 4,946 4,946 6,567 6,567 8,1706031 950 1,980 1,424 2,193 1,840 2,709 2,368 3,729 3,116 4,220 3,767 5,021 5,021 6,591 6,591 8,1606036 922 1,774 1,373 2,028 1,704 2,594 2,237 3,662 2,995 4,287 3,677 4,925 4,925 6,559 6,559 8,379
Avg. 931 1,932 1,407 2,174 1,798 2,683 2,321 3,722 3,065 4,294 3,740 4,964 4,964 6,572 6,572 8,236
4 6001 905 1,914 1,403 2,157 1,884 2,863 2,620 4,062 3,795 5,182 4,976 6,559 6,559 8,185 8,185 9,8646023 917 2,064 1,456 2,261 1,951 2,950 2,709 4,180 3,862 5,170 5,037 6,588 6,588 8,355 8,355 9,8766035 905 1,850 1,399 2,145 1,896 2,849 2,646 4,324 3,940 5,296 5,134 6,691 6,691 7,514 7,514 8,572
Avg. 909 1,943 1,419 2,188 1,910 2,887 2,658 4,188 3,866 5,216 5,049 6,613 6,613 8,018 8,018 9,437
5 6009 882 1,849 1,543 2,339 2,216 3,123 2,909 4,621 4,137 5,825 5,268 6,928 6,928 8,666 8,666 10,7466011 954 1,859 1,595 2,482 2,267 3,216 2,962 4,636 4,197 5,856 5,241 6,932 6,932 8,728 8,728 10,6896028 980 2,121 1,638 2,574 2,327 3,266 2,987 4,574 4,160 5,700 5,255 6,851 6,851 8,544 8,544 10,593
Avg. 939 1,943 1,592 2,465 2,270 3,202 2,953 4,610 4,164 5,794 5,255 6,904 6,904 8,646 8,646 10,676
6 6007 1,006 2,000 1,702 2,649 2,262 3,045 2,808 4,256 3,458 4,891 3,987 5,218 5,218 6,162 6,162 7,5576015 989 2,131 1,714 2,648 2,214 3,190 2,719 4,166 3,371 4,778 3,815 5,026 5,026 6,505 6,505 8,2566033 893 1,899 1,506 2,322 2,121 3,083 2,661 4,186 3,265 4,654 3,673 5,081 5,081 6,685 6,685 8,606
Avg. 963 2,010 1,641 2,540 2,199 3,106 2,729 4,203 3,365 4,774 3,825 5,108 5,108 6,451 6,451 8,140
7 6021 1,002 2,201 1,841 2,918 2,703 3,753 3,500 5,331 4,944 6,809 6,362 7,880 7,880 9,965 9,965 11,7616027 928 2,114 1,802 2,795 2,606 3,634 3,440 5,077 4,820 6,644 6,179 7,917 7,917 9,958 9,958 11,7186030 963 2,122 1,779 2,727 2,603 3,532 3,433 5,221 4,825 6,605 6,216 7,991 7,991 9,596 9,596 11,395
Avg. 964 2,146 1,807 2,813 2,637 3,640 3,458 5,210 4,863 6,686 6,253 7,929 7,929 9,840 9,840 11,625
8 6008 953 2,072 1,825 2,847 2,607 3,540 3,276 5,063 4,423 5,791 5,027 6,589 6,589 8,361 8,361 10,3976025 933 2,057 1,760 2,632 2,540 3,466 3,184 4,902 4,268 5,694 4,930 6,481 6,481 8,454 8,454 10,0936037 891 2,001 1,771 2,701 2,480 3,342 3,204 4,750 4,297 5,660 5,014 6,582 6,582 8,332 8,332 8,867
Avg. 926 2,043 1,785 2,727 2,542 3,449 3,221 4,905 4,329 5,715 4,990 6,550 6,550 8,382 8,382 9,786
Control 6002 1,533 2,886 2,886 4,188 4,188 5,654 5,654 7,039 7,039 8,671 8,671 10,622 10,622 12,042 12,042 13,0836014 1,080 2,253 2,253 3,445 3,445 4,703 4,703 6,454 6,454 8,187 8,187 9,960 9,960 11,725 11,725 13,1776038 938 1,897 1,897 2,957 2,957 4,156 4,156 5,686 5,686 7,393 7,393 9,400 9,400 11,149 11,149 13,0766039 1,513 2,847 2,847 4,209 4,209 5,690 5,690 7,328 7,328 9,159 9,159 11,427 11,427 13,555 13,555 13,929
Avg. 1,266 2,471 2,471 3,700 3,700 5,051 5,051 6,627 6,627 8,352 8,352 10,352 10,352 12,118 12,118 13,316
Cubic feet per acre
Table 39—Skykomish: Total stem volume per acre, 1961–1993, by treatment, plot, and period
Calibrationperiod
1961–1965a
Age (years)
Treatment Plot 24 28
Treatmentperiod 1
1965–1968a
Age (years)
Treatmentperiod 2
1968–1971a
Age (years)
Treatmentperiod 3
1971–1975a
Age (years)
Treatmentperiod 4
1975–1979a
Age (years)
Treatmentperiod 5
1979–1983a
Age (years)
Treatmentperiod 6
1983–1988a
Age (years)
Treatmentperiod 7
1988–1993a
Age (years)
28 31 31 34 34 38 38 42 42 46 46 51 51 56

76
a Columns are measurements after treatment and just before next treatment.
1 6010 95 562 409 1,094 880 1,736 1,429 2,593 1,985 2,956 2,377 3,255 3,255 4,234 4,234 5,3636022 319 1,027 808 1,514 1,229 1,991 1,697 2,753 2,146 3,032 2,500 3,338 3,338 4,274 4,274 5,4576034 186 923 621 1,335 1,115 1,851 1,509 2,583 2,023 3,011 2,455 3,283 3,283 4,209 4,209 5,389
Avg. 200 837 613 1,314 1,075 1,859 1,545 2,643 2,052 3,000 2,444 3,292 3,292 4,239 4,239 5,403
2 6005 112 535 429 1,000 796 1,412 1,327 2,675 2,404 3,753 3,410 4,776 4,776 5,913 5,913 7,2876012 164 675 497 1,150 864 1,597 1,440 2,832 2,542 3,684 3,271 4,504 4,504 5,799 5,799 7,0786026 66 706 409 1,172 969 1,823 1,585 3,062 2,758 4,138 3,674 5,072 5,072 6,537 6,537 8,028
Avg. 114 639 445 1,107 877 1,610 1,451 2,856 2,568 3,858 3,452 4,784 4,784 6,083 6,083 7,464
3 6016 131 703 563 1,271 1,013 1,854 1,686 3,140 2,662 3,962 3,506 4,660 4,660 6,237 6,237 7,7896031 226 766 653 1,328 1,094 1,936 1,751 3,152 2,719 3,840 3,477 4,709 4,709 6,236 6,236 7,7556036 127 533 447 1,014 845 1,669 1,492 2,952 2,505 3,797 3,320 4,548 4,548 6,165 6,165 7,925
Avg. 161 667 554 1,205 984 1,820 1,643 3,081 2,629 3,866 3,434 4,639 4,639 6,213 6,213 7,823
4 6001 228 816 719 1,417 1,264 2,207 2,109 3,557 3,358 4,743 4,583 6,122 6,122 7,703 7,703 9,3196023 249 998 803 1,577 1,355 2,340 2,187 3,664 3,441 4,746 4,631 6,142 6,142 7,857 7,857 9,3296035 201 858 707 1,405 1,246 2,182 2,036 3,721 3,422 4,792 4,677 6,210 6,210 7,047 7,047 8,095
Avg. 226 891 743 1,466 1,288 2,243 2,111 3,648 3,407 4,760 4,630 6,158 6,158 7,536 7,536 8,914
5 6009 113 506 461 1,031 958 1,745 1,624 3,225 2,933 4,634 4,239 5,904 5,904 7,676 7,676 9,7276011 184 656 603 1,293 1,208 2,111 2,000 3,653 3,333 4,996 4,530 6,188 6,188 7,964 7,964 9,8636028 193 891 756 1,609 1,470 2,404 2,245 3,862 3,528 5,063 4,709 6,283 6,283 7,947 7,947 9,933
Avg. 163 685 607 1,311 1,212 2,087 1,956 3,580 3,265 4,898 4,493 6,125 6,125 7,862 7,862 9,841
6 6007 249 821 712 1,563 1,345 2,147 2,045 3,539 2,953 4,390 3,637 4,850 4,850 5,782 5,782 7,1466015 254 902 815 1,643 1,401 2,356 2,094 3,604 3,004 4,386 3,590 4,771 4,771 6,203 6,203 7,8916033 8 284 226 812 744 1,589 1,428 3,018 2,428 3,848 3,140 4,544 4,544 6,128 6,128 7,999
Avg. 170 669 584 1,339 1,164 2,031 1,856 3,387 2,795 4,208 3,456 4,722 4,722 6,038 6,038 7,679
7 6021 209 949 782 1,778 1,652 2,710 2,551 4,409 4,103 5,987 5,594 7,133 7,133 9,172 9,172 10,9656027 132 688 616 1,447 1,341 2,362 2,266 3,951 3,759 5,593 5,218 6,936 6,936 8,940 8,940 10,7056030 185 790 720 1,568 1,484 2,455 2,404 4,236 3,954 5,731 5,403 7,171 7,171 8,841 8,841 10,603
Avg. 175 809 706 1,598 1,492 2,509 2,407 4,199 3,939 5,770 5,405 7,080 7,080 8,984 8,984 10,758
8 6008 199 865 729 1,596 1,486 2,356 2,216 4,042 3,523 4,950 4,312 5,823 5,823 7,567 7,567 9,5406025 139 750 692 1,502 1,454 2,363 2,167 3,856 3,399 4,881 4,268 5,795 5,795 7,739 7,739 9,4466037 170 688 628 1,357 1,264 2,081 2,011 3,565 3,287 4,716 4,255 5,775 5,775 7,565 7,565 8,154
Avg. 169 768 683 1,485 1,401 2,267 2,131 3,821 3,403 4,849 4,278 5,797 5,797 7,624 7,624 9,047
Control 6002 209 641 641 1,232 1,232 2,119 2,119 3,711 3,711 5,376 5,376 7,480 7,480 9,343 9,343 10,9316014 98 495 495 1,257 1,257 2,297 2,297 4,024 4,024 5,894 5,894 7,741 7,741 9,660 9,660 11,5196038 148 599 599 1,341 1,341 2,314 2,314 3,985 3,985 5,812 5,812 7,807 7,807 9,774 9,774 11,8446039 252 876 876 1,788 1,788 2,929 2,929 4,666 4,666 6,565 6,565 8,963 8,963 11,494 11,494 12,582
Avg. 177 653 653 1,404 1,404 2,415 2,415 4,097 4,097 5,912 5,912 7,998 7,998 10,068 10,068 11,719
Cubic feet to a 6-inch top per acre
Table 40—Skykomish: Merchantable volume per acre, 1961–1993, by treatment, plot, and period
Calibrationperiod
1961–1965a
Age (years)
Treatment Plot 24 28
Treatmentperiod 1
1965–1968a
Age (years)
Treatmentperiod 2
1968–1971a
Age (years)
Treatmentperiod 3
1971–1975a
Age (years)
Treatmentperiod 4
1975–1979a
Age (years)
Treatmentperiod 5
1979–1983a
Age (years)
Treatmentperiod 6
1983–1988a
Age (years)
Treatmentperiod 7
1988–1993a
Age (years)
28 31 31 34 34 38 38 42 42 46 46 51 51 56

77 a Columns are measurements after treatment and just before next treatment.
Scribner board feet per acre
1 6010 181 1,414 1,039 4,267 3,155 7,305 5,750 10,090 7,682 12,264 9,937 13,608 13,608 19,126 19,126 25,1366022 831 3,375 2,618 5,556 4,447 7,840 6,561 10,665 8,250 12,663 10,552 15,286 15,286 19,865 19,865 27,1516034 475 3,132 2,151 5,046 4,138 6,978 5,522 10,102 7,854 12,158 9,850 13,833 13,833 18,276 18,276 25,162
Avg. 495 2,640 1,936 4,956 3,913 7,374 5,944 10,286 7,929 12,362 10,113 14,242 14,242 19,089 19,089 25,816
2 6005 112 1,787 1,494 3,181 2,743 5,084 4,772 11,287 10,031 15,861 14,436 20,245 20,245 26,969 26,969 34,0346012 169 2,261 1,687 4,368 3,173 5,764 5,112 12,286 10,812 15,450 13,647 19,058 19,058 25,903 25,903 33,1446026 0 2,518 1,418 4,627 3,778 7,322 6,378 12,432 11,237 17,370 15,352 22,183 22,183 28,485 28,485 36,413
Avg. 94 2,189 1,533 4,059 3,231 6,057 5,421 12,002 10,693 16,227 14,478 20,495 20,495 27,119 27,119 34,530
3 6016 269 2,230 1,849 4,466 3,472 7,219 6,393 12,734 10,668 16,322 14,202 19,445 19,445 27,198 27,198 36,8676031 512 2,137 1,885 4,456 3,543 7,684 6,939 12,423 10,436 15,751 14,133 20,810 20,810 28,832 28,832 37,3536036 144 1,463 1,200 3,220 2,808 6,117 5,343 11,397 9,554 15,480 13,530 18,924 18,924 28,109 28,109 37,784
Avg. 308 1,943 1,645 4,047 3,274 7,007 6,225 12,185 10,219 15,851 13,955 19,726 19,726 28,046 28,046 37,335
4 6001 606 2,268 2,012 4,260 3,692 8,715 8,240 14,236 13,382 18,562 17,834 26,957 26,957 35,418 35,418 44,2806023 525 2,951 2,364 5,223 4,539 8,805 8,092 13,807 12,830 18,699 18,222 25,704 25,704 35,708 35,708 43,5046035 200 2,747 2,410 4,814 4,206 8,303 7,664 15,872 14,629 20,845 20,343 27,207 27,207 32,022 32,022 38,590
Avg. 443 2,655 2,262 4,766 4,146 8,608 7,999 14,638 13,614 19,369 18,800 26,623 26,623 34,383 34,383 42,125
5 6009 169 1,520 1,395 3,847 3,596 7,352 6,814 14,370 13,030 20,803 19,017 26,292 26,292 34,593 34,593 45,1606011 331 2,106 2,000 5,134 4,710 8,357 7,875 15,747 14,269 21,199 19,113 27,838 27,838 37,035 37,035 46,5676028 281 3,001 2,464 5,614 4,934 9,313 8,517 16,182 15,003 21,539 19,962 27,091 27,091 36,022 36,022 47,023
Avg. 260 2,209 1,953 4,865 4,413 8,341 7,735 15,433 14,101 21,181 19,364 27,074 27,074 35,883 35,883 46,250
6 6007 625 2,897 2,454 5,766 4,790 8,872 8,304 14,089 11,749 18,528 15,290 21,306 21,306 26,187 26,187 34,7476015 443 2,810 2,559 6,024 4,990 9,093 7,841 14,587 12,147 18,493 14,985 21,124 21,124 29,050 29,050 39,2526033 0 537 412 3,170 2,902 6,486 5,642 13,070 10,356 16,746 13,568 19,080 19,080 27,993 27,993 37,434
Avg. 356 2,081 1,808 4,987 4,227 8,150 7,262 13,915 11,417 17,922 14,614 20,504 20,504 27,743 27,743 37,144
7 6021 418 3,251 2,631 6,718 6,055 10,388 9,781 17,612 16,465 25,543 23,795 31,148 31,148 42,533 42,533 51,6126027 250 2,064 1,776 5,032 4,625 9,389 9,138 16,084 15,229 23,885 22,196 31,089 31,089 41,729 41,729 51,5196030 375 2,062 1,900 5,411 5,159 9,807 9,625 17,110 15,913 23,457 22,124 31,427 31,427 40,002 40,002 49,310
Avg. 348 2,459 2,103 5,720 5,280 9,861 9,515 16,935 15,869 24,295 22,705 31,221 31,221 41,421 41,421 50,814
8 6008 362 2,818 2,418 6,333 5,956 9,150 8,456 17,024 14,861 21,188 18,431 25,759 25,759 35,148 35,148 44,9676025 200 2,261 2,148 5,572 5,410 8,955 8,135 15,988 14,206 19,984 17,316 24,449 24,449 34,750 34,750 44,0166037 400 2,059 1,896 4,505 4,254 8,047 7,753 15,352 14,096 20,127 18,012 25,516 25,516 35,214 35,214 38,636
Avg. 321 2,379 2,154 5,470 5,207 8,717 8,115 16,121 14,388 20,433 17,920 25,241 25,241 35,037 35,037 42,540
Control 6002 343 2,075 2,075 4,491 4,491 8,264 8,264 16,807 16,807 24,567 24,567 36,320 36,320 45,339 45,339 52,3016014 0 1,343 1,343 4,405 4,405 9,277 9,277 18,191 18,191 27,067 27,067 36,974 36,974 45,618 45,618 54,7886038 262 1,531 1,531 4,714 4,714 9,033 9,033 16,899 16,899 24,769 24,769 36,732 36,732 46,259 46,259 57,4706039 112 2,785 2,785 6,670 6,670 10,749 10,749 20,703 20,703 30,068 30,068 41,545 41,545 54,410 54,410 59,549
Avg. 180 1,934 1,934 5,070 5,070 9,331 9,331 18,150 18,150 26,618 26,618 37,893 37,893 47,907 47,907 56,027
Table 41—Skykomish: Scribner board-foot volume (6-inch top and 32-foot logs) per acre, 1961–1993, by treatment, plot, and period
Calibrationperiod
1961–1965a
Age (years)
Treatment Plot 24 28
Treatmentperiod 1
1965–1968a
Age (years)
Treatmentperiod 2
1968–1971a
Age (years)
Treatmentperiod 3
1971–1975a
Age (years)
Treatmentperiod 4
1975–1979a
Age (years)
Treatmentperiod 5
1979–1983a
Age (years)
Treatmentperiod 6
1983–1988a
Age (years)
Treatmentperiod 7
1988–1993a
Age (years)
28 31 31 34 34 38 38 42 42 46 46 51 51 56

78 Table 42—Skykomish: Trees per acre by 1-inch diameter at breast height (d.b.h.) classes, after calibration (1961) and after thinnings
(1993), by treatment (age in parentheses)
Treatment 3
1961 1993(24 yr) (56 yr)
D.b.h.class
2 0 0 0 0 0 0 0 0 0 0 0 0 0 0 0 0 0 03 0 0 0 0 0 0 0 0 0 0 0 0 0 0 0 0 0 04 38 0 37 0 65 0 15 0 40 0 43 0 18 0 62 0 139 05 125 0 147 0 148 0 108 0 157 0 187 0 152 0 128 0 231 16 83 0 93 0 87 0 97 0 80 0 80 0 102 0 78 0 128 17 50 0 52 0 35 0 37 0 38 0 37 0 35 0 45 2 44 68 22 0 27 0 13 0 27 2 28 5 13 2 25 0 23 2 20 259 7 0 10 0 17 0 15 2 13 8 13 2 10 5 12 7 26 21
10 7 0 2 0 2 2 10 3 3 8 7 3 5 8 7 13 3 4111 3 0 0 2 8 2 5 3 0 17 5 2 2 18 3 12 4 4012 5 0 2 10 0 3 2 2 3 22 0 3 3 25 0 15 0 3413 0 0 0 3 0 2 0 5 0 17 0 5 0 15 2 10 0 2114 0 0 0 12 0 7 0 7 0 15 0 7 0 25 0 12 0 2115 0 2 0 10 0 3 0 15 0 5 0 8 0 20 0 7 0 1316 0 2 0 2 0 8 0 5 0 10 0 10 0 15 0 5 0 1917 0 3 0 15 0 0 0 5 0 3 0 7 0 7 0 10 0 1118 0 5 0 12 0 10 0 15 0 8 0 8 0 2 0 12 0 619 0 3 0 10 0 10 0 10 0 12 0 3 0 8 0 7 0 1320 0 10 0 8 0 7 0 3 0 7 0 8 0 7 0 17 0 1021 0 5 0 8 0 10 0 7 0 10 0 3 0 8 0 3 0 622 0 2 0 0 0 8 0 12 0 12 0 5 0 7 0 7 0 823 0 5 0 5 0 7 0 3 0 5 0 5 0 5 0 8 0 324 0 2 0 5 0 3 0 3 0 3 0 8 0 3 0 2 0 325 0 5 0 2 0 3 0 3 0 2 0 2 0 0 0 0 0 026 0 2 0 0 0 0 0 3 0 0 0 0 0 3 0 0 0 127 0 0 0 0 0 2 0 2 0 2 0 0 0 3 0 3 0 028 0 0 0 0 0 0 0 3 0 2 0 0 0 2 0 0 0 029 0 3 0 0 0 2 0 0 0 0 0 2 0 0 0 0 0 030 0 0 0 0 0 2 0 0 0 0 0 2 0 2 0 0 0 031 0 2 0 0 0 0 0 0 0 0 0 2 0 0 0 0 0 0
Total 340 50 368 103 375 90 315 113 363 172 385 97 352 188 360 152 594 304
Trees per acre
Treatment 1
1961 1993(24 yr) (56 yr)
Treatment 7
1961 1993(24 yr) (56 yr)
Treatment 5
1961 1993(24 yr) (56 yr)
Treatment 4
1961 1993(24 yr) (56 yr)
Treatment 2
1961 1993(24 yr) (56 yr)
Treatment 8
1961 1993(24 yr) (56 yr)
Treatment 6
1961 1993(24 yr) (56 yr)
Control
1961 1993(24 yr) (56 yr)

79
1963 19 479 479 3 3 0.00 0.00 0.0 0.0 0 25 0 0 0 25 0 01966 22 1,035 1,035 120 120 .41 .41 8.4 8.4 185 47 39 5 185 47 39 51970 26 1,757 1,773 606 607 .42 .42 6.4 6.6 180 68 122 23 185 68 122 231973 29 2,334 2,350 1,168 1,168 .47 .47 6.0 6.0 192 80 187 40 192 81 187 401976 32 2,920 2,947 1,799 1,802 .54 .53 5.6 5.8 196 91 211 56 199 92 211 561980 36 3,664 3,691 2,565 2,568 .47 .47 4.5 4.5 186 102 191 71 186 103 191 711984 40 4,257 4,284 3,161 3,164 .41 .41 3.4 3.4 148 106 149 79 148 107 149 791989 45 5,213 5,240 4,100 4,103 .40 .40 3.8 3.8 191 116 188 91 191 116 188 911994 50 6,302 6,329 5,158 5,161 .35 .35 3.8 3.8 218 126 212 103 218 127 212 103
1963 19 31 5.8 395 4.1 36.6 479 3 0 0.0 0.0 0 0 0.0 0.0 0.00 0 0.0 0.0 0 01966 22 42 7.4 242 5.4 38.8 651 68 153 5.3 23.2 384 52 2.5 1.2 .98 0 .0 .0 0 01970 26 54 9.1 150 7.2 42.2 901 374 85 6.9 22.3 471 181 5.5 3.3 .98 7 4.9 .9 17 11973 29 62 10.4 105 8.9 44.8 1,107 731 45 7.9 15.3 371 204 8.2 5.5 .92 0 .0 .0 0 01976 32 70 12.1 75 10.8 47.5 1,305 1,077 28 9.6 14.2 388 286 13.9 10.2 .92 2 6.6 .4 10 21980 36 80 13.8 57 12.7 49.4 1,533 1,380 18 12.7 16.3 516 462 28.7 25.7 1.01 0 .0 .0 0 01984 40 87 15.0 57 14.3 63.2 2,126 1,976 0 0 0 0 0 .0 .0 0 0 .0 .0 0 01989 45 99 17.2 57 16.3 82.0 3,082 2,915 0 0 0 0 0 .0 .0 0 0 .0 .0 0 01994 50 111 19.1 57 18.1 100.9 4,171 3,973 0 0 .0 0 0 .0 .0 0 0 .0 .0 0 0
a Average height (ht) and diameter at breast height (d.b.h.) of the 40 largest trees per acre (estimated from d.b.h. and ht-d.b.h. curves).b Quadratic mean diameter at breast height.c All volumes are total stem cubic feet (CVTS) or merchantable cubic to a 6-inch top diameter inside bark (CV6).d Average d.b.h. cut/average d.b.h. before thinning.e Cumulative yield: net = standing + thinning; gross = standing + thinning + mortality; yield does not include any volume removed in a calibration cut. Volume (CVTS) removed inthinnings = 2,131 cubic feet (58 percent of the total gross yield at the time of the last thinning). Volume (CVTS) in mortality = 27 cubic feet (< 1 percent of the total gross yield).f Net is QMD growth of trees alive at the start and end of the period; survivor is QMD growth of trees alive at the end of the period.g MAI = mean annual increment; PAI = periodic annual increment.
Ap
pen
dix 3: C
lemo
ns
YearStandage
Table 43—Clemons: Stand development for treatment 1, per-acre basis (plots 63, 64, and 69)
40 largesta
Ht D.b.h. QMDbTreesBasalarea CVTS d/Dd
After thinning Removed in thinning Mortality
Volumec Avg. volume
CV6 QMDbTreesBasalarea CVTS
Volume
CV6 QMDbTreesBasalarea CVTS
Volume
CV6
Years Ft Inches No. Ft2 - - - - Ft3 - - - - No. Ft2 - - - - - - - - Ft3 - - - - - - - - No. Ft2 - - - Ft3 - - -
YearStandage
NetCVTS
GrossCVTS
GrossCV6
NetCV6 Net Survivor
CVTSPAI
Cumulative yielde
Net GrossCVTSPAI
CVTSMAI
CV6PAI
CV6MAI
CV6PAI
CVTSMAI
CV6MAI
Net volume growthg Gross volume growth
Years - - - - - - - - - - - Ft 3 - - - - - - - - - - - - - Inches - - - - - - Ft 2 - - - - - - - - - - - - - - - - - - - - - - - - - - Ft3 - - - - - - - - - - - - - - - - - - - - - - - -
CVTS CV6
QMD growthfBasal area
growth
Inches Inches Inches

80
a Average height (ht) and diameter at breast height (d.b.h.) of the 40 largest trees per acre (estimated from d.b.h. and ht-d.b.h. curves).b Quadratic mean diameter at breast height.c All volumes are total stem cubic feet (CVTS) or merchantable cubic to a 6-inch top diameter inside bark (CV6).d Average d.b.h. cut/average d.b.h. before thinning.e Cumulative yield: net = standing + thinning; gross = standing + thinning + mortality; yield does not include any volume removed in a calibration cut. Volume (CVTS) removed inthinnings = 1,475 cubic feet (37 percent of the total gross yield at the time of the last thinning). Volume (CVTS) in mortality = 133 cubic feet (2 percent of the total gross yield).f Net is QMD growth of trees alive at the start and end of the period; survivor is QMD growth of trees alive at the end of the period.g MAI = mean annual increment; PAI = periodic annual increment.
1963 19 35 5.9 395 4.2 38.4 516 9 0 0.0 0.0 0 0 0.0 0.0 0.00 0 0.0 0.0 0 01966 22 45 7.6 213 5.8 38.4 669 119 180 5.3 27.4 469 49 2.6 1.1 .95 2 6.3 .4 6 11970 26 56 9.7 137 7.9 45.8 1,000 531 73 7.0 19.8 430 171 5.9 3.6 .93 3 7.2 1.0 21 121973 29 65 11.4 105 9.7 53.4 1,347 1,002 30 8.0 10.5 264 144 8.8 5.3 .86 2 6.7 .4 11 21976 32 72 13.1 87 11.6 63.1 1,747 1,499 17 8.4 6.5 171 106 10.1 7.1 .76 2 11.8 1.3 35 311980 36 83 14.9 75 13.6 75.2 2,410 2,208 10 8.7 4.2 142 92 14.2 9.2 .67 2 13.5 1.7 59 541984 40 91 16.4 75 15.0 91.2 3,141 2,936 0 0 .0 0 0 .0 .0 .00 0 .0 .0 0 01989 45 104 18.2 75 16.6 112.7 4,347 4,115 0 .0 .0 0 0 .0 .0 .00 0 .0 .0 0 01994 50 115 19.8 75 18.0 132.8 5,636 5,365 0 .0 .0 0 0 .0 .0 .00 0 .0 .0 0 0
YearStandage
Table 44—Clemons: Stand development for treatment 2, per-acre basis (plots 81, 87, and 90)
40 largesta
Ht D.b.h. QMDbTreesBasalarea CVTS d/Dd
After thinning Removed in thinning Mortality
Volumec Avg. volume
CV6 QMDbTreesBasalarea CVTS
Volume
CV6 QMDbTreesBasalarea CVTS
Volume
CV6CVTS CV6
YearStandage
NetCVTS
GrossCVTS
GrossCV6
NetCV6 Net Survivor
CVTSPAI
Cumulative yielde
Net GrossCVTSPAI
CVTSMAI
CV6PAI
CV6MAI
CV6PAI
CVTSMAI
CV6MAI
Net volume growthg Gross volume growth
1963 19 516 516 9 9 0.00 0.00 0.0 0.0 0 27 0 0 0 27 0 01966 22 1,139 1,145 168 168 .44 .44 9.1 9.2 208 52 53 8 210 52 53 81970 26 1,899 1,926 750 763 .46 .46 6.8 7.0 190 73 146 29 195 74 149 291973 29 2,509 2,548 1,365 1,380 .49 .49 6.0 6.2 204 87 205 47 207 88 206 481976 32 3,081 3,154 1,968 2,014 .49 .50 5.4 5.8 190 96 201 62 202 99 211 631980 36 3,885 4,018 2,769 2,870 .39 .40 4.1 4.5 201 108 200 77 216 112 214 801984 40 4,617 4,749 3,497 3,598 .34 .34 4.0 4.0 183 115 182 87 183 119 182 901989 45 5,822 5,954 4,675 4,776 .33 .33 4.3 4.3 241 129 236 104 241 132 236 1061994 50 7,112 7,244 5,926 6,027 .28 .28 4.0 4.0 258 142 250 119 258 145 250 121
Years Ft Inches No. Ft2 - - - - Ft3 - - - - No. Ft2 - - - - - - - - Ft3 - - - - - - - - No. Ft2 - - - Ft3 - - -
Years - - - - - - - - - - - Ft 3 - - - - - - - - - - - - - Inches - - - - - - Ft 2 - - - - - - - - - - - - - - - - - - - - - - - - - - Ft3 - - - - - - - - - - - - - - - - - - - - - - - -
QMD growthfBasal area
growth
Inches Inches Inches

81
a Average height (ht) and diameter at breast height (d.b.h.) of the 40 largest trees per acre (estimated from d.b.h. and ht-d.b.h. curves).b Quadratic mean diameter at breast height.c All volumes are total stem cubic feet (CVTS) or merchantable cubic to a 6-inch top diameter inside bark (CV6).d Average d.b.h. cut/average d.b.h. before thinning.e Cumulative yield: net = standing + thinning; gross = standing + thinning + mortality; yield does not include any volume removed in a calibration cut. Volume (CVTS) removed inthinnings = 1,666 cubic feet (40 percent of the total gross yield at the time of the last thinning). Volume (CVTS) in mortality = 41 cubic feet (1 percent of the total gross yield).f Net is QMD growth of trees alive at the start and end of the period; survivor is QMD growth of trees alive at the end of the period.g MAI = mean annual increment; PAI = periodic annual increment.
1963 19 33 5.7 397 4.1 35.9 472 4 0 0.0 0.0 0 0 0.0 0.0 0.00 0 0.0 0.0 0 01966 22 44 7.1 282 5.4 43.6 739 83 115 5.1 16.3 273 28 2.4 1.1 .97 0 .0 .0 0 01970 26 54 8.9 208 7.0 55.4 1,176 496 73 6.5 16.7 347 109 4.8 2.6 .94 0 .0 .0 0 01973 29 64 10.3 165 8.5 63.0 1,575 968 43 7.2 12.4 296 148 6.9 5.5 .89 0 .0 .0 0 01976 32 75 11.7 132 10.0 70.2 2,031 1,562 32 8.2 11.7 319 190 10.0 6.8 .86 2 10.6 1.0 30 251980 36 83 13.4 105 11.8 77.4 2,488 2,146 27 9.8 14.1 431 327 16.0 12.1 .87 0 .0 .0 0 01984 40 92 14.9 105 13.1 94.8 3,325 2,984 0 .0 .0 0 0 .0 .0 .00 0 .0 .0 0 01989 45 104 16.9 105 14.7 119.5 4,680 4,326 0 .0 .0 0 0 .0 .0 .00 0 .0 .0 0 01994 50 118 18.4 103 16.1 141.6 6,145 5,772 0 .0 .0 0 0 .0 .0 .00 2 6.6 .4 11 2
YearStandage
Table 45—Clemons: Stand development for treatment 3, per-acre basis (plots 67, 71, and 78)
40 largesta
Ht D.b.h. QMDbTreesBasalarea CVTS d/Dd
After thinning Removed in thinning Mortality
Volumec Avg. volume
CV6 QMDbTreesBasalarea CVTS
Volume
CV6 QMDbTreesBasalarea CVTS
Volume
CV6CVTS CV6
1963 19 472 472 4 4 0.00 0.00 0.0 0.0 0 25 0 0 0 25 0 01966 22 1,012 1,012 111 111 .39 .39 8.0 8.0 180 46 36 5 180 46 36 51970 26 1,796 1,796 633 633 .39 .39 7.1 7.1 196 69 130 24 196 69 130 241973 29 2,491 2,491 1,253 1,253 .39 .39 6.7 6.7 231 86 207 43 231 86 207 431976 32 3,266 3,296 2,037 2,062 .41 .42 6.3 6.6 258 102 261 64 269 103 270 641980 36 4,154 4,185 2,948 2,973 .35 .35 5.3 5.3 222 115 228 82 222 116 228 831984 40 4,991 5,021 3,786 3,811 .32 .32 4.4 4.4 209 125 210 95 209 126 210 951989 45 6,346 6,377 5,128 5,153 .32 .32 4.9 4.9 271 141 268 114 271 142 268 1151994 50 7,811 7,852 6,574 6,601 .28 .27 4.4 4.5 293 156 289 131 295 157 290 132
YearStandage
NetCVTS
GrossCVTS
GrossCV6
NetCV6 Net Survivor
CVTSPAI
Cumulative yielde
Net GrossCVTSPAI
CVTSMAI
CV6PAI
CV6MAI
CV6PAI
CVTSMAI
CV6MAI
Net volume growthg Gross volume growth
Years Ft Inches No. Ft2 - - - - Ft3 - - - - No. Ft2 - - - - - - - - Ft3 - - - - - - - - No. Ft2 - - - Ft3 - - -
Years - - - - - - - - - - - Ft 3 - - - - - - - - - - - - - Inches - - - - - - Ft 2 - - - - - - - - - - - - - - - - - - - - - - - - - - Ft3 - - - - - - - - - - - - - - - - - - - - - - - -
QMD growthfBasal area
growth
Inches Inches Inches

82
1963 19 34 6.0 395 4.2 37.4 498 12 0 0.0 0.0 0 0 0.0 0.0 0.00 0 0.0 0.0 0 01966 22 45 7.5 283 5.4 44.7 767 97 110 5.4 17.4 298 44 2.7 1.9 1.00 2 5.6 .3 5 01970 26 55 9.2 223 7.1 59.0 1,244 499 53 7.0 14.1 295 125 5.6 3.8 1.00 7 4.9 .9 16 01973 29 64 10.4 198 8.3 71.2 1,729 1,008 20 8.0 7.0 171 102 8.6 6.8 .99 5 7.8 1.7 41 261976 32 72 11.8 180 9.5 84.5 2,309 1,647 7 8.9 2.9 77 51 11.0 7.3 .96 12 8.6 4.7 131 861980 36 81 13.3 170 10.8 102.1 3,084 2,484 7 10.2 3.8 114 90 16.3 12.9 .97 3 9.2 1.5 43 301984 40 88 14.6 162 11.9 117.4 3,904 3,325 0 .0 .0 0 0 .0 .0 .00 8 9.0 3.7 111 761989 45 101 16.2 157 13.1 139.3 5,204 4,637 0 .0 .0 0 0 .0 .0 .00 5 9.0 2.2 71 491994 50 113 17.7 147 14.2 156.4 6,502 5,946 0 .0 .0 0 0 .0 .0 .00 10 10.0 5.5 211 165
YearStandage
Table 46—Clemons: Stand development for treatment 4, per-acre basis (plots 66, 74, and 91)
40 largesta
Ht D.b.h. QMDbTreesBasalarea CVTS d/Dd
After thinning Removed in thinning Mortality
Volumec Avg. volume
CV6 QMDbTreesBasalarea CVTS
Volume
CV6 QMDbTreesBasalarea CVTS
Volume
CV6CVTS CV6
1963 19 498 498 12 12 0.00 0.00 0.0 0.0 0 26 0 1 0 26 0 11966 22 1,064 1,069 141 141 .40 .40 8.2 8.3 189 48 43 6 190 49 43 61970 26 1,836 1,858 668 668 .41 .40 7.1 7.3 193 71 132 26 197 71 132 261973 29 2,493 2,555 1,279 1,305 .39 .40 6.4 6.9 219 86 204 44 232 88 212 451976 32 3,150 3,343 1,969 2,081 .40 .41 5.4 7.0 219 98 230 62 263 104 259 651980 36 4,039 4,276 2,897 3,039 .30 .31 5.3 5.7 222 112 232 80 233 119 239 841984 40 4,859 5,206 3,738 3,955 .27 .25 3.8 4.7 205 121 210 93 233 130 229 991989 45 6,160 6,577 5,050 5,317 .24 .24 4.4 4.8 260 137 263 112 274 146 272 1181994 50 7,457 8,086 6,359 6,790 .23 .21 3.4 4.5 260 149 262 127 302 162 295 136
YearStandage
NetCVTS
GrossCVTS
GrossCV6
NetCV6 Net Survivor
CVTSPAI
Cumulative yielde
Net GrossCVTSPAI
CVTSMAI
CV6PAI
CV6MAI
CV6PAI
CVTSMAI
CV6MAI
Net volume growthg Gross volume growth
a Average height (ht) and diameter at breast height (d.b.h.) of the 40 largest trees per acre (estimated from d.b.h. and ht-d.b.h. curves).b Quadratic mean diameter at breast height.c All volumes are total stem cubic feet (CVTS) or merchantable cubic to a 6-inch top diameter inside bark (CV6).d Average d.b.h. cut/average d.b.h. before thinning.e Cumulative yield: net = standing + thinning; gross = standing + thinning + mortality; yield does not include any volume removed in a calibration cut. Volume (CVTS) removed inthinnings = 955 cubic feet (22 percent of the total gross yield at the time of the last thinning). Volume (CVTS) in mortality = 629 cubic feet (8 percent of the total gross yield).f Net is QMD growth of trees alive at the start and end of the period; survivor is QMD growth of trees alive at the end of the period.g MAI = mean annual increment; PAI = periodic annual increment.
Years Ft Inches No. Ft2 - - - - Ft3 - - - - No. Ft2 - - - - - - - - Ft3 - - - - - - - - No. Ft2 - - - Ft3 - - -
Years - - - - - - - - - - - Ft 3 - - - - - - - - - - - - - Inches - - - - - - Ft 2 - - - - - - - - - - - - - - - - - - - - - - - - - - Ft3 - - - - - - - - - - - - - - - - - - - - - - - -
QMD growthfBasal area
growth
Inches Inches Inches

83
1963 19 34 5.7 395 4.0 34.1 438 7 0 0.0 0.0 0 0 0.0 0.0 0.00 0 0.0 0.0 0 01966 22 44 7.2 350 5.2 50.5 831 83 43 5.0 5.8 94 7 2.2 .9 .97 2 3.8 .1 2 01970 26 54 9.1 295 6.6 68.5 1,402 462 37 6.8 9.2 189 69 5.1 2.8 1.03 18 5.6 3.1 61 51973 29 61 10.3 257 7.7 81.4 1,912 978 33 7.7 10.7 253 131 7.7 5.2 1.01 5 4.4 .5 10 01976 32 70 11.7 227 8.7 91.6 2,452 1,584 23 8.7 9.6 256 165 11.1 7.5 1.01 7 9.1 3.0 81 561980 36 79 13.1 200 10.0 105.5 3,132 2,379 22 9.5 10.6 319 236 14.5 13.1 .97 5 6.9 1.3 35 131984 40 85 14.4 187 11.1 120.5 3,856 3,175 2 7.0 .4 13 4 6.5 2.0 .65 12 9.1 5.3 159 1081989 45 96 16.0 185 12.3 148.0 5,341 4,656 0 .0 .0 0 0 .0 .0 .00 2 8.7 .7 20 131994 50 107 17.4 178 13.5 171.4 6,803 6,126 0 .0 .0 0 0 .0 .0 .00 7 8.9 2.9 105 80
YearStandage
Table 47—Clemons: Stand development for treatment 5, per-acre basis (plots 60, 61, and 70)
40 largesta
Ht D.b.h. QMDbTreesBasalarea CVTS d/Dd
After thinning Removed in thinning Mortality
Volumec Avg. volume
CV6 QMDbTreesBasalarea CVTS
Volume
CV6 QMDbTreesBasalarea CVTS
Volume
CV6CVTS CV6
1963 19 438 438 7 7 0.00 0.00 0.0 0.0 0 23 0 0 0 23 0 01966 22 925 927 90 90 .38 .38 7.4 7.4 162 42 28 4 163 42 28 41970 26 1,685 1,748 538 543 .36 .36 6.8 7.6 190 65 112 21 205 67 113 211973 29 2,448 2,520 1,185 1,190 .37 .36 7.8 8.0 254 84 216 41 258 87 216 411976 32 3,244 3,398 1,955 2,017 .34 .35 6.6 7.6 265 101 257 61 293 106 275 631980 36 4,243 4,431 2,986 3,060 .30 .29 6.1 6.5 250 118 258 83 258 123 261 851984 40 4,979 5,326 3,786 3,968 .27 .25 3.9 5.2 184 124 200 95 224 133 227 991989 45 6,464 6,831 5,267 5,462 .25 .25 5.5 5.6 297 144 296 117 301 152 299 1211994 50 7,926 8,398 6,737 7,012 .23 .22 4.7 5.3 292 159 294 135 313 168 310 140
YearStandage
NetCVTS
GrossCVTS
GrossCV6
NetCV6 Net Survivor
CVTSPAI
Cumulative yielde
Net GrossCVTSPAI
CVTSMAI
CV6PAI
CV6MAI
CV6PAI
CVTSMAI
CV6MAI
Net volume growthg Gross volume growth
a Average height (ht) and diameter at breast height (d.b.h.) of the 40 largest trees per acre (estimated from d.b.h. and ht-d.b.h. curves).b Quadratic mean diameter at breast height.c All volumes are total stem cubic feet (CVTS) or merchantable cubic to a 6-inch top diameter inside bark (CV6).d Average d.b.h. cut/average d.b.h. before thinning.e Cumulative yield: net = standing + thinning; gross = standing + thinning + mortality; yield does not include any volume removed in a calibration cut. Volume (CVTS) removed inthinnings = 1,123 cubic feet (21 percent of the total gross yield at the time of the last thinning). Volume (CVTS) in mortality = 471 cubic feet (6 percent of the total gross yield).f Net is QMD growth of trees alive at the start and end of the period; survivor is QMD growth of trees alive at the end of the period.g MAI = mean annual increment; PAI = periodic annual increment.
Years Ft Inches No. Ft2 - - - - Ft3 - - - - No. Ft2 - - - - - - - - Ft3 - - - - - - - - No. Ft2 - - - Ft3 - - -
Years - - - - - - - - - - - Ft 3 - - - - - - - - - - - - - Inches - - - - - - Ft 2 - - - - - - - - - - - - - - - - - - - - - - - - - - Ft3 - - - - - - - - - - - - - - - - - - - - - - - -
QMD growthfBasal area
growth
Inches Inches Inches

84
1963 19 34 5.7 397 4.1 36.6 466 4 0 0.0 0.0 0 0 0.0 0.0 0.00 0 0.0 0.0 0 01966 22 45 7.3 330 5.4 51.3 867 98 65 5.2 9.7 164 16 2.5 1.3 .98 2 3.6 .1 2 01970 26 56 9.1 253 6.9 65.5 ,386 522 72 6.8 18.1 382 147 5.3 3.3 .99 5 4.7 .6 11 01973 29 66 10.4 205 8.1 73.4 1,869 1,079 45 7.7 14.4 361 182 8.0 4.9 .95 3 6.0 .7 15 21976 32 70 11.6 163 9.4 77.4 2,085 1,496 40 8.9 17.1 454 302 11.4 7.9 .96 2 4.2 .2 3 01980 36 81 13.0 127 10.8 80.0 2,528 2,076 35 9.8 18.5 579 435 16.5 13.6 .93 2 9.0 .7 19 131984 40 90 14.1 127 11.9 97.6 3,389 2,952 0 .0 .0 0 0 .0 .0 .00 0 .0 .0 0 01989 45 103 16.0 127 13.4 122.6 4,776 4,335 0 .0 .0 0 0 .0 .0 .00 0 .0 .0 0 01994 50 116 17.7 127 14.6 147.4 6,356 5,886 0 .0 .0 0 0 .0 .0 .00 0 .0 .0 0 0
YearStandage
Table 48—Clemons: Stand development for treatment 6, per-acre basis (plots 62, 85, and 88)
40 largesta
Ht D.b.h. QMDbTreesBasalarea CVTS d/Dd
After thinning Removed in thinning Mortality
Volumec Avg. volume
CV6 QMDbTreesBasalarea CVTS
Volume
CV6 QMDbTreesBasalarea CVTS
Volume
CV6CVTS CV6
1963 19 466 466 4 4 0.00 0.00 0.0 0.0 0 25 0 0 0 25 0 01966 22 1,031 1,032 114 114 .40 .40 8.1 8.2 188 47 37 5 189 47 37 51970 26 1,931 1,944 685 685 .38 .38 8.1 8.2 225 74 143 26 228 75 143 261973 29 2,775 2,803 1,425 1,427 .38 .38 7.4 7.6 281 96 247 49 286 97 247 491976 32 3,445 3,475 2,143 2,145 .38 .37 7.0 7.1 223 108 239 67 224 109 239 671980 36 4,466 4,515 3,158 3,173 .31 .31 5.3 5.5 255 124 254 88 260 125 257 881984 40 5,327 5,376 4,034 4,049 .28 .28 4.4 4.4 215 133 219 101 215 134 219 1011989 45 6,714 6,763 5,417 5,433 .29 .29 5.0 5.0 277 149 277 120 277 150 277 1211994 50 8,294 8,343 6,968 6,984 .26 .26 5.0 5.0 316 166 310 139 316 167 310 140
YearStandage
NetCVTS
GrossCVTS
GrossCV6
NetCV6 Net Survivor
CVTSPAI
Cumulative yielde
Net GrossCVTSPAI
CVTSMAI
CV6PAI
CV6MAI
CV6PAI
CVTSMAI
CV6MAI
Net volume growthg Gross volume growth
a Average height (ht) and diameter at breast height (d.b.h.) of the 40 largest trees per acre (estimated from d.b.h. and ht-d.b.h. curves).b Quadratic mean diameter at breast height.c All volumes are total stem cubic feet (CVTS) or merchantable cubic to a 6-inch top diameter inside bark (CV6).d Average d.b.h. cut/average d.b.h. before thinning.e Cumulative yield: net = standing + thinning; gross = standing + thinning + mortality; yield does not include any volume removed in a calibration cut. Volume (CVTS) removed inthinnings = 1,938 cubic feet (43 percent of the total gross yield at the time of the last thinning). Volume (CVTS) in mortality = 49 cubic feet (1 percent of the total gross yield).f Net is QMD growth of trees alive at the start and end of the period; survivor is QMD growth of trees alive at the end of the period.g MAI = mean annual increment; PAI = periodic annual increment.
Years Ft Inches No. Ft2 - - - - Ft3 - - - - No. Ft2 - - - - - - - - Ft3 - - - - - - - - No. Ft2 - - - Ft3 - - -
Years - - - - - - - - - - - Ft 3 - - - - - - - - - - - - - Inches - - - - - - Ft 2 - - - - - - - - - - - - - - - - - - - - - - - - - - Ft3 - - - - - - - - - - - - - - - - - - - - - - - -
QMD growth fBasal area
growth
Inches Inches Inches

85
1963 19 36 5.7 398 4.0 35.4 495 8 0 0.0 0.0 0 0 0.0 0.0 0.00 0 0.0 0.0 0 01966 22 46 7.2 373 5.2 55.3 986 89 25 5.2 3.7 67 20 2.7 4.0 1.00 0 .0 .0 0 01970 26 58 8.8 347 6.6 80.7 1,800 580 22 6.5 4.9 109 33 5.0 2.8 .99 5 5.6 .9 18 11973 29 67 10.1 322 7.5 98.1 2,513 1,238 17 7.4 5.0 128 67 7.5 5.6 .99 8 6.2 1.7 41 141976 32 73 11.2 303 8.5 115.9 3,313 2,047 10 6.7 2.4 65 19 6.5 3.8 .80 8 5.3 1.3 32 01980 36 80 12.4 287 9.3 132.8 4,161 2,951 12 8.4 4.5 139 89 11.6 8.9 .91 5 8.2 1.9 57 371984 40 90 13.4 283 10.0 150.4 5,196 3,988 0 .0 .0 0 0 .0 .0 .00 3 6.2 .7 21 71989 45 101 14.6 275 10.9 174.2 6,617 5,452 0 .0 .0 0 0 .0 .0 .00 8 7.3 2.4 81 441994 50 111 15.9 258 11.8 194.6 8,108 6,999 0 .0 .0 0 0 .0 .0 .00 17 7.9 5.6 208 122
YearStandage
Table 49—Clemons: Stand development for treatment 7, per-acre basis (plots 75, 82, and 86)
40 largesta
Ht D.b.h. QMDbTreesBasalarea CVTS d/Dd
After thinning Removed in thinning Mortality
Volumec Avg. volume
CV6 QMDbTreesBasalarea CVTS
Volume
CV6 QMDbTreesBasalarea CVTS
Volume
CV6CVTS CV6
1963 19 495 495 8 8 0.00 0.00 0.0 0.0 0 26 0 0 0 26 0 01966 22 1,054 1,054 108 108 .39 .39 7.8 7.8 186 48 33 5 186 48 33 51970 26 1,976 1,994 632 633 .33 .33 7.6 7.8 231 76 131 24 235 77 131 241973 29 2,816 2,875 1,358 1,372 .31 .31 7.4 8.0 280 97 242 47 294 99 246 471976 32 3,681 3,772 2,186 2,200 .29 .27 6.7 7.2 288 115 276 68 299 118 276 691980 36 4,668 4,816 3,179 3,230 .21 .21 5.3 5.8 247 130 248 88 261 134 258 901984 40 5,703 5,872 4,215 4,274 .16 .16 4.4 4.6 259 143 259 105 264 147 261 1071989 45 7,124 7,374 5,680 5,782 .18 .17 4.8 5.2 284 158 293 126 300 164 302 1281994 50 8,615 9,072 7,227 7,452 .19 .16 4.1 5.2 298 172 309 145 340 181 334 149
YearStandage
NetCVTS
GrossCVTS
GrossCV6
NetCV6 Net Survivor
CVTSPAI
Cumulative yielde
Net GrossCVTSPAI
CVTSMAI
CV6PAI
CV6MAI
CV6PAI
CVTSMAI
CV6MAI
Net volume growthg Gross volume growth
a Average height (ht) and diameter at breast height (d.b.h.) of the 40 largest trees per acre (estimated from d.b.h. and ht-d.b.h. curves).b Quadratic mean diameter at breast height.c All volumes are total stem cubic feet (CVTS) or merchantable cubic to a 6-inch top diameter inside bark (CV6).d Average d.b.h. cut/average d.b.h. before thinning.e Cumulative yield: net = standing + thinning; gross = standing + thinning + mortality; yield does not include any volume removed in a calibration cut. Volume (CVTS) removed inthinnings = 507 cubic feet (11 percent of the total gross yield at the time of the last thinning). Volume (CVTS) in mortality = 457 cubic feet (5 percent of the total gross yield).f Net is QMD growth of trees alive at the start and end of the period; survivor is QMD growth of trees alive at the end of the period.g MAI = mean annual increment; PAI = periodic annual increment.
Years Ft Inches No. Ft2 - - - - Ft3 - - - - No. Ft2 - - - - - - - - Ft3 - - - - - - - - No. Ft2 - - - Ft3 - - -
Years - - - - - - - - - - - Ft 3 - - - - - - - - - - - - - Inches - - - - - - Ft 2 - - - - - - - - - - - - - - - - - - - - - - - - - - Ft3 - - - - - - - - - - - - - - - - - - - - - - - -
QMD growthfBasal area
growth
Inches Inches Inches

86
1963 19 36 5.7 397 4.0 34.1 470 5 0 0.0 0.0 0 0 0.0 0.0 0.00 0 0.0 0.0 0 01966 22 45 7.1 387 5.1 54.3 936 83 10 4.6 1.2 19 0 1.9 .0 .91 0 .0 .0 0 01970 26 57 8.8 360 6.3 78.1 1,677 474 23 6.5 5.4 117 35 5.1 2.7 1.03 3 4.3 .3 6 01973 29 67 10.0 318 7.3 90.8 2,264 1,024 32 6.9 8.2 202 84 6.3 3.7 .95 10 6.4 2.2 54 161976 32 73 11.1 280 8.2 100.6 2,785 1,630 37 7.6 11.6 312 148 8.4 4.6 .95 2 7.9 .6 16 81980 36 82 12.4 240 9.1 107.6 3,307 2,290 32 9.1 14.4 445 315 13.9 12.6 1.01 8 5.8 1.6 41 81984 40 90 13.3 240 9.9 126.0 4,235 3,216 0 .0 .0 0 0 .0 .0 .00 0 .0 .0 0 01989 45 101 14.8 238 10.9 150.6 5,557 4,551 0 .0 .0 0 0 .0 .0 .00 2 10.0 .9 33 261994 50 111 16.1 238 11.7 174.8 7,008 5,991 0 .0 .0 0 0 .0 .0 .00 0 .0 .0 0 0
YearStandage
Table 50—Clemons: Stand development for treatment 8, per-acre basis (plots 59, 72, and 73)
40 largesta
Ht D.b.h. QMDbTreesBasalarea CVTS d/Dd
After thinning Removed in thinning Mortality
Volumec Avg. volume
CV6 QMDbTreesBasalarea CVTS
Volume
CV6 QMDbTreesBasalarea CVTS
Volume
CV6CVTS CV6
1963 19 470 470 5 5 0.00 0.00 0.0 0.0 0 25 0 0 0 25 0 01966 22 955 955 83 83 .36 .36 7.1 7.1 161 43 26 4 161 43 26 41970 26 1,813 1,819 510 510 .31 .31 7.3 7.4 215 70 107 20 216 70 107 201973 29 2,601 2,660 1,144 1,160 .30 .30 7.0 7.7 263 90 211 39 280 92 217 401976 32 3,434 3,509 1,899 1,923 .28 .28 7.1 7.3 278 107 252 59 283 110 254 601980 36 4,402 4,517 2,873 2,906 .25 .23 5.4 5.8 242 122 244 80 252 125 246 811984 40 5,330 5,445 3,799 3,831 .19 .19 4.6 4.6 232 133 231 95 232 136 231 961989 45 6,652 6,800 5,134 5,192 .19 .19 4.9 5.1 264 148 267 114 271 151 272 1151994 50 8,103 8,251 6,574 6,632 .17 .17 4.8 4.8 290 162 288 131 290 165 288 133
YearStandage
NetCVTS
GrossCVTS
GrossCV6
NetCV6 Net Survivor
CVTSPAI
Cumulative yielde
Net GrossCVTSPAI
CVTSMAI
CV6PAI
CV6MAI
CV6PAI
CVTSMAI
CV6MAI
Net volume growthg Gross volume growth
a Average height (ht) and diameter at breast height (d.b.h.) of the 40 largest trees per acre (estimated from d.b.h. and ht-d.b.h. curves).b Quadratic mean diameter at breast height.c All volumes are total stem cubic feet (CVTS) or merchantable cubic to a 6-inch top diameter inside bark (CV6).d Average d.b.h. cut/average d.b.h. before thinning.e Cumulative yield: net = standing + thinning; gross = standing + thinning + mortality; yield does not include any volume removed in a calibration cut. Volume (CVTS) removed inthinnings = 1,094 cubic feet (24 percent of the total gross yield at the time of the last thinning). Volume (CVTS) in mortality = 148 cubic feet (2 percent of the total gross yield).f Net is QMD growth of trees alive at the start and end of the period; survivor is QMD growth of trees alive at the end of the period.g MAI = mean annual increment; PAI = periodic annual increment.
Years Ft Inches No. Ft2 - - - - Ft3 - - - - No. Ft2 - - - - - - - - Ft3 - - - - - - - - No. Ft2 - - - Ft3 - - -
Years - - - - - - - - - - - Ft 3 - - - - - - - - - - - - - Inches - - - - - - Ft 2 - - - - - - - - - - - - - - - - - - - - - - - - - - Ft3 - - - - - - - - - - - - - - - - - - - - - - - -
QMD growth fBasal area
growth
Inches Inches Inches

87
1963 19 39 7.7 687 4.0 59.8 852 107 0 0.0 0.0 0 0 0.0 0.0 0.00 0 0.0 0.0 0 01966 22 49 9.1 683 4.9 89.5 1,594 323 0 .0 .0 0 0 .0 .0 .00 3 3.4 .2 3 01970 26 61 10.7 662 5.9 124.8 2,759 906 0 .0 .0 0 0 .0 .0 .00 22 2.5 .8 11 01973 29 70 11.8 643 6.6 150.1 3,855 1,653 0 .0 .0 0 0 .0 .0 .00 18 3.3 1.1 20 01976 32 78 12.8 607 7.2 169.0 4,826 2,507 0 .0 .0 0 0 .0 .0 .00 37 5.0 5.0 127 211980 36 86 13.8 558 7.9 187.8 5,873 3,564 0 .0 .0 0 0 .0 .0 .00 48 4.4 5.0 128 51984 40 94 14.7 500 8.6 198.2 6,820 4,570 0 .0 .0 0 0 .0 .0 .00 58 5.6 9.9 306 1401989 45 105 15.9 433 9.6 215.2 8,127 6,088 0 .0 .0 0 0 .0 .0 .00 67 5.8 12.2 378 1441994 50 114 17.0 387 10.5 230.4 9,424 7,588 0 .0 .0 0 0 .0 .0 .00 47 7.1 12.9 465 215
YearStandage
Table 51—Clemons: Stand development for control, per-acre basis (plots 58, 83, and 89)
40 largesta
Ht D.b.h. QMDbTreesBasalarea CVTS d/Dd
After thinning Removed in thinning Mortality
Volumec Avg. volume
CV6 QMDbTreesBasalarea CVTS
Volume
CV6 QMDbTreesBasalarea CVTS
Volume
CV6CVTS CV6
1963 19 852 852 107 107 0.00 0.00 0.0 0.0 0 45 0 6 0 45 0 61966 22 1,594 1,598 323 323 .30 .30 9.9 10.0 247 72 72 15 249 73 72 151970 26 2,759 2,773 906 906 .24 .23 8.8 9.0 291 106 146 35 294 107 146 351973 29 3,855 3,888 1,653 1,653 .22 .20 8.4 8.8 365 133 249 57 372 134 249 571976 32 4,826 4,987 2,507 2,528 .21 .17 6.3 8.0 324 151 285 78 366 156 292 791980 36 5,873 6,163 3,564 3,591 .18 .13 4.7 6.0 262 163 264 99 294 171 266 1001984 40 6,820 7,415 4,570 4,736 .17 .11 2.6 5.1 237 170 252 114 313 185 286 1181989 45 8,127 9,101 6,088 6,398 .21 .14 3.4 5.8 262 181 304 135 337 202 332 1421994 50 9,424 10,862 7,588 8,113 .19 .13 3.0 5.6 259 188 300 152 352 217 343 162
YearStandage
NetCVTS
GrossCVTS
GrossCV6
NetCV6 Net Survivor
CVTSPAI
Cumulative yielde
Net GrossCVTSPAI
CVTSMAI
CV6PAI
CV6MAI
CV6PAI
CVTSMAI
CV6MAI
Net volume growthg Gross volume growth
a Average height (ht) and diameter at breast height (d.b.h.) of the 40 largest trees per acre (estimated from d.b.h. and ht-d.b.h. curves).b Quadratic mean diameter at breast height.c All volumes are total stem cubic feet (CVTS) or merchantable cubic to a 6-inch top diameter inside bark (CV6).d Average d.b.h. cut/average d.b.h. before thinning.e Cumulative yield: net = standing + thinning; gross = standing + thinning + mortality; yield does not include any volume removed in a calibration cut. Volume (CVTS) in mortality =1,438 cubic feet (13 percent of the total gross yield).f Net is QMD growth of trees alive at the start and end of the period; survivor is QMD growth of trees alive at the end of the period.g MAI = mean annual increment; PAI = periodic annual increment.
Years Ft Inches No. Ft2 - - - - Ft3 - - - - No. Ft2 - - - - - - - - Ft3 - - - - - - - - No. Ft2 - - - Ft3 - - -
Years - - - - - - - - - - - Ft 3 - - - - - - - - - - - - - Inches - - - - - - Ft 2 - - - - - - - - - - - - - - - - - - - - - - - - - - Ft3 - - - - - - - - - - - - - - - - - - - - - - - -
QMD growthfBasal area
growth
Inches Inches Inches

88 Table 52—Clemons: Trees per acre, 1963–1994, by treatment, plot, and period
Calibrationperiod
1963–1966a
Age (years)
Treatment Plot 19 22
Treatmentperiod 1
1966–1970a
Age (years)
Treatmentperiod 2
1970–1973a
Age (years)
Treatmentperiod 3
1973–1976a
Age (years)
Treatmentperiod 4
1976–1980a
Age (years)
Treatmentperiod 5
1980–1984a
Age (years)
Treatmentperiod 6
1984–1989a
Age (years)
Treatmentperiod 7
1989–1994a
Age (years)
22 26 26 29 29 32 32 36 36 40 40 45 45 50
a Columns are measurements after treatment and just before next treatment.
1 63 395 395 210 205 130 130 90 90 70 70 55 55 55 55 55 5564 395 395 245 240 155 155 110 110 80 80 60 60 60 60 60 6069 395 395 270 260 165 165 115 110 75 75 55 55 55 55 55 55
Avg. 395 395 242 235 150 150 105 103 75 75 57 57 57 57 57 57
2 81 395 395 245 245 155 155 115 115 95 95 80 80 80 80 80 8087 395 390 205 195 140 135 110 110 90 90 75 75 75 75 75 7590 395 395 190 190 115 115 90 85 75 70 70 70 70 70 70 70
Avg. 395 393 213 210 137 135 105 103 87 85 75 75 75 75 75 75
3 67 400 400 280 280 205 205 165 160 135 135 105 105 105 105 105 10071 395 395 325 325 250 250 200 200 160 160 130 130 130 130 130 13078 395 395 240 240 170 170 130 130 100 100 80 80 80 80 80 80
Avg. 397 397 282 282 208 208 165 163 132 132 105 105 105 105 105 103
4 66 395 395 295 280 235 235 210 205 185 185 170 170 170 170 170 16574 395 390 335 335 275 265 250 235 235 225 225 210 210 195 195 17091 395 395 220 215 160 155 135 120 120 120 115 105 105 105 105 105
Avg. 395 393 283 277 223 218 198 187 180 177 170 162 162 157 157 147
5 60 395 390 360 310 300 290 255 240 220 210 195 160 160 155 155 14561 395 395 305 300 245 245 210 205 185 185 155 155 155 155 155 15570 395 395 385 385 340 335 305 305 275 270 250 250 245 245 245 235
Avg. 395 393 350 332 295 290 257 250 227 222 200 188 187 185 185 178
6 62 395 390 345 330 265 260 215 215 175 170 135 135 135 135 135 13585 395 395 350 350 275 270 220 220 175 175 135 135 135 135 135 13588 400 400 295 295 220 220 180 175 140 140 110 110 110 110 110 110
Avg. 397 395 330 325 253 250 205 203 163 162 127 127 127 127 127 127
7 75 405 405 405 390 390 365 365 360 355 355 335 335 335 325 325 30582 395 395 390 390 355 355 330 325 315 310 300 290 290 280 280 25086 395 395 325 325 295 295 270 255 240 230 225 225 225 220 220 220
Avg. 398 398 373 368 347 338 322 313 303 298 287 283 283 275 275 258
8 59 395 395 365 360 315 290 275 270 240 225 200 200 200 195 195 19572 400 400 400 400 395 390 355 355 320 310 280 280 280 280 280 28073 395 395 395 390 370 370 325 325 280 280 240 240 240 240 240 240
Avg. 397 397 387 383 360 350 318 317 280 272 240 240 240 238 238 238
Control 58 585 585 585 585 585 575 575 565 565 530 530 495 495 425 425 39583 720 710 710 655 655 615 615 530 530 460 460 410 410 355 355 30089 755 755 755 745 745 740 740 725 725 685 685 595 595 520 520 465
Avg. 687 683 683 662 662 643 643 607 607 558 558 500 500 433 433 387
Number of trees per acre

89 a Columns are measurements after treatment and just before next treatment.
1 63 41.5 70.1 38.2 65.2 42.2 61.3 44.8 61.5 47.3 65.8 49.2 63.6 63.6 84.3 84.3 105.864 35.1 60.9 39.0 64.9 42.1 60.3 44.5 62.1 47.5 66.0 49.5 63.4 63.4 82.0 82.0 100.569 33.2 54.9 39.1 63.2 42.2 58.5 45.0 61.6 47.6 65.2 49.6 62.6 62.6 79.8 79.8 96.4
Avg. 36.6 61.9 38.8 64.4 42.2 60.0 44.8 61.7 47.5 65.7 49.4 63.2 63.2 82.0 82.0 100.9
2 81 32.2 57.5 38.6 67.3 45.8 65.1 53.4 71.3 63.2 81.4 74.9 91.1 91.1 114.0 114.0 136.387 42.7 68.5 38.5 60.5 45.8 62.0 53.2 69.1 63.3 80.0 74.1 89.1 89.1 110.3 110.3 130.390 40.4 71.4 38.3 69.0 45.8 64.5 53.5 68.3 62.8 76.8 76.8 93.5 93.5 113.9 113.9 131.9
Avg. 38.4 65.8 38.4 65.6 45.8 63.9 53.4 69.6 63.1 79.4 75.2 91.2 91.2 112.7 112.7 132.8
3 67 37.8 61.6 44.4 71.5 55.3 74.6 63.0 78.5 70.3 91.4 77.4 94.3 94.3 118.1 118.1 138.771 32.5 53.5 44.4 70.8 55.4 75.6 63.0 84.4 70.0 92.2 77.2 94.9 94.9 119.3 119.3 143.478 37.5 64.5 41.8 73.9 55.4 76.0 63.0 82.8 70.3 90.6 77.5 95.3 95.3 121.1 121.1 142.6
Avg. 35.9 59.9 43.6 72.1 55.4 75.4 63.0 81.9 70.2 91.4 77.4 94.8 94.8 119.5 119.5 141.6
4 66 35.3 59.5 44.4 71.0 59.0 79.7 71.5 94.4 85.9 111.0 102.8 121.6 121.6 147.1 147.1 167.474 34.0 51.6 45.2 70.2 59.0 74.3 70.7 85.0 85.0 101.6 101.6 115.3 115.3 132.1 132.1 141.291 42.8 74.9 44.4 78.1 59.1 80.4 71.3 82.7 82.7 105.0 101.8 115.2 115.2 138.7 138.7 160.6
Avg. 37.4 62.0 44.7 73.1 59.0 78.1 71.2 87.4 84.5 105.9 102.1 117.4 117.4 139.3 139.3 156.4
5 60 32.8 54.3 50.3 71.7 68.5 92.7 81.4 98.6 88.3 111.2 105.1 109.2 109.2 134.4 134.4 152.061 36.6 62.7 50.5 84.1 68.5 94.0 81.4 102.7 93.3 122.9 105.0 129.5 129.5 162.0 162.0 192.370 33.0 51.8 50.5 77.2 68.6 89.5 81.3 102.2 93.2 114.3 106.4 124.3 122.9 147.6 147.6 170.0
Avg. 34.1 56.3 50.5 77.7 68.5 92.1 81.4 101.2 91.6 116.1 105.5 121.0 120.5 148.0 148.0 171.4
6 62 34.2 56.6 50.8 81.6 65.0 86.9 72.7 94.5 77.4 101.1 79.5 99.0 99.0 126.2 126.2 154.485 32.8 56.3 50.6 81.7 64.9 86.4 72.6 95.2 77.1 98.6 79.4 96.5 96.5 120.2 120.2 144.288 42.8 70.1 52.5 87.4 66.6 90.1 75.0 93.7 77.6 95.6 80.9 97.2 97.2 121.5 121.5 143.5
Avg. 36.6 61.0 51.3 83.6 65.5 87.8 73.4 94.5 77.4 98.4 80.0 97.6 97.6 122.6 122.6 147.4
7 75 34.1 54.7 54.7 78.8 78.8 95.3 95.3 116.1 115.3 139.3 132.7 150.8 150.8 173.4 173.4 188.882 32.5 55.5 54.6 88.8 81.7 106.0 99.5 119.4 116.2 137.7 132.8 147.8 147.8 172.3 172.3 190.586 39.8 66.7 56.5 89.5 81.7 107.8 99.4 119.3 116.1 134.9 132.9 152.6 152.6 177.0 177.0 204.5
Avg. 35.4 59.0 55.3 85.7 80.7 103.0 98.1 118.3 115.9 137.3 132.8 150.4 150.4 174.2 174.2 194.6
8 59 36.0 60.2 56.7 89.2 78.1 95.6 90.9 111.5 100.4 122.6 108.0 127.9 127.9 152.2 152.2 178.772 33.8 52.6 52.6 79.3 78.1 99.6 90.8 111.2 100.7 121.0 107.5 124.6 124.6 149.8 149.8 172.873 32.5 53.5 53.5 82.0 78.1 101.9 90.8 113.9 100.6 122.6 107.4 125.6 125.6 149.7 149.7 172.9
Avg. 34.1 55.4 54.3 83.5 78.1 99.0 90.8 112.2 100.6 122.1 107.6 126.0 126.0 150.6 150.6 174.8
Control 58 59.9 87.4 87.4 120.4 120.4 144.8 144.8 166.6 166.6 187.2 187.2 196.0 196.0 205.8 205.8 221.683 65.7 96.3 96.3 132.3 132.3 154.7 154.7 162.1 162.1 173.0 173.0 185.1 185.1 205.0 205.0 217.089 54.0 84.8 84.8 121.6 121.6 150.7 150.7 178.3 178.3 203.1 203.1 213.4 213.4 234.9 234.9 252.5
Avg. 59.8 89.5 89.5 124.8 124.8 150.1 150.1 169.0 169.0 187.8 187.8 198.2 198.2 215.2 215.2 230.4
Square feet per acre
Table 53—Clemons: Basal area per acre, 1963–1994, by treatment, plot, and period
Calibrationperiod
1963–1966a
Age (years)
Treatment Plot 19 22
Treatmentperiod 1
1966–1970a
Age (years)
Treatmentperiod 2
1970–1973a
Age (years)
Treatmentperiod 3
1973–1976a
Age (years)
Treatmentperiod 4
1976–1980a
Age (years)
Treatmentperiod 5
1980–1984a
Age (years)
Treatmentperiod 6
1984–1989a
Age (years)
Treatmentperiod 7
1989–1994a
Age (years)
22 26 26 29 29 32 32 36 36 40 40 45 45 50

90 Table 54—Clemons: Quadratic mean diameter, 1963–1994, by treatment, plot, and period
Calibrationperiod
1963–1966a
Age (years)
Treatment Plot 19 22
Treatmentperiod 1
1966–1970a
Age (years)
Treatmentperiod 2
1970–1973a
Age (years)
Treatmentperiod 3
1973–1976a
Age (years)
Treatmentperiod 4
1976–1980a
Age (years)
Treatmentperiod 5
1980–1984a
Age (years)
Treatmentperiod 6
1984–1989a
Age (years)
Treatmentperiod 7
1989–1994a
Age (years)
22 26 26 29 29 32 32 36 36 40 40 45 45 50
a Columns are measurements after treatment and just before next treatment.
1 63 4.4 5.7 5.8 7.6 7.7 9.3 9.6 11.2 11.1 13.1 12.8 14.6 14.6 16.8 16.8 18.864 4.0 5.3 5.4 7.0 7.1 8.4 8.6 10.2 10.4 12.3 12.3 13.9 13.9 15.8 15.8 17.569 3.9 5.0 5.2 6.7 6.8 8.1 8.5 10.1 10.8 12.6 12.9 14.4 14.4 16.3 16.3 17.9
Avg. 4.1 5.4 5.4 7.1 7.2 8.6 8.9 10.5 10.8 12.7 12.7 14.3 14.3 16.3 16.3 18.1
2 81 3.9 5.2 5.4 7.1 7.4 8.8 9.2 10.7 11.0 12.5 13.1 14.5 14.5 16.2 16.2 17.787 4.5 5.7 5.9 7.5 7.7 9.2 9.4 10.7 11.4 12.8 13.5 14.8 14.8 16.4 16.4 17.890 4.3 5.8 6.1 8.2 8.5 10.1 10.4 12.1 12.4 14.2 14.2 15.6 15.6 17.3 17.3 18.6
Avg. 4.2 5.5 5.8 7.6 7.9 9.4 9.7 11.2 11.6 13.2 13.6 15.0 15.0 16.6 16.6 18.0
3 67 4.2 5.3 5.4 6.8 7.0 8.2 8.4 9.5 9.8 11.1 11.6 12.8 12.8 14.4 14.4 15.971 3.9 5.0 5.0 6.3 6.4 7.4 7.6 8.8 9.0 10.3 10.4 11.6 11.6 13.0 13.0 14.278 4.2 5.5 5.7 7.5 7.7 9.1 9.4 10.8 11.3 12.9 13.3 14.8 14.8 16.7 16.7 18.1
Avg. 4.1 5.3 5.4 6.9 7.0 8.2 8.5 9.7 10.0 11.4 11.8 13.1 13.1 14.7 14.7 16.1
4 66 4.1 5.3 5.3 6.8 6.8 7.9 7.9 9.2 9.2 10.5 10.5 11.5 11.5 12.6 12.6 13.674 4.0 4.9 5.0 6.2 6.3 7.2 7.2 8.1 8.1 9.1 9.1 10.0 10.0 11.1 11.1 12.391 4.5 5.9 6.1 8.2 8.2 9.8 9.8 11.2 11.2 12.7 12.7 14.2 14.2 15.6 15.6 16.7
Avg. 4.2 5.4 5.4 7.1 7.1 8.3 8.3 9.5 9.5 10.8 10.8 11.9 11.9 13.1 13.1 14.2
5 60 3.9 5.1 5.1 6.5 6.5 7.7 7.7 8.7 8.6 9.9 9.9 11.2 11.2 12.6 12.6 13.961 4.1 5.4 5.5 7.2 7.2 8.4 8.4 9.6 9.6 11.0 11.1 12.4 12.4 13.8 13.8 15.170 3.9 4.9 4.9 6.1 6.1 7.0 7.0 7.8 7.9 8.8 8.8 9.5 9.6 10.5 10.5 11.5
Avg. 4.0 5.1 5.2 6.6 6.6 7.7 7.7 8.7 8.7 9.9 10.0 11.0 11.1 12.3 12.3 13.5
6 62 4.0 5.2 5.2 6.7 6.7 7.8 7.9 9.0 9.0 10.4 10.4 11.6 11.6 13.1 13.1 14.585 3.9 5.1 5.1 6.5 6.6 7.7 7.8 8.9 9.0 10.2 10.4 11.4 11.4 12.8 12.8 14.088 4.4 5.7 5.7 7.4 7.5 8.7 8.7 9.9 10.1 11.2 11.6 12.7 12.7 14.2 14.2 15.5
Avg. 4.1 5.3 5.4 6.9 6.9 8.1 8.1 9.3 9.4 10.6 10.8 11.9 11.9 13.4 13.4 14.6
7 75 3.9 5.0 5.0 6.1 6.1 6.9 6.9 7.7 7.7 8.5 8.5 9.1 9.1 9.9 9.9 10.782 3.9 5.1 5.1 6.5 6.5 7.4 7.4 8.2 8.2 9.0 9.0 9.7 9.7 10.6 10.6 11.886 4.3 5.6 5.6 7.1 7.1 8.2 8.2 9.3 9.4 10.4 10.4 11.2 11.2 12.1 12.1 13.1
Avg. 4.0 5.2 5.2 6.6 6.6 7.5 7.5 8.4 8.5 9.3 9.3 10.0 10.0 10.9 10.9 11.8
8 59 4.1 5.3 5.3 6.7 6.7 7.8 7.8 8.7 8.8 10.0 9.9 10.8 10.8 12.0 12.0 13.072 3.9 4.9 4.9 6.0 6.0 6.8 6.8 7.6 7.6 8.5 8.4 9.0 9.0 9.9 9.9 10.673 3.9 5.0 5.0 6.2 6.2 7.1 7.2 8.0 8.1 9.0 9.1 9.8 9.8 10.7 10.7 11.5
Avg. 4.0 5.1 5.1 6.3 6.3 7.2 7.3 8.1 8.2 9.1 9.1 9.9 9.9 10.9 10.9 11.7
Control 58 4.3 5.2 5.2 6.1 6.1 6.8 6.8 7.4 7.4 8.0 8.0 8.5 8.5 9.4 9.4 10.183 4.1 5.0 5.0 6.1 6.1 6.8 6.8 7.5 7.5 8.3 8.3 9.1 9.1 10.3 10.3 11.589 3.6 4.5 4.5 5.5 5.5 6.1 6.1 6.7 6.7 7.4 7.4 8.1 8.1 9.1 9.1 10.0
Avg. 4.0 4.9 4.9 5.9 5.9 6.6 6.6 7.2 7.2 7.9 7.9 8.6 8.6 9.6 9.6 10.5
Inches

91 a Columns are measurements after treatment and just before next treatment.
11 63 544 1,188 650 1,411 919 1,533 1,121 1,711 1,304 2,071 1,546 2,169 2,169 3,198 3,198 4,49264 460 1,014 656 1,384 897 1,478 1,097 1,700 1,312 2,066 1,535 2,130 2,130 3,086 3,086 4,15469 434 903 646 1,322 888 1,424 1,102 1,669 1,299 2,011 1,519 2,078 2,078 2,962 2,962 3,867
Avg. 479 1,035 651 1,372 901 1,478 1,107 1,693 1,305 2,049 1,533 2,126 2,126 3,082 3,082 4,171
2 81 412 963 650 1,453 995 1,627 1,337 1,947 1,731 2,623 2,403 3,185 3,185 4,415 4,415 5,78687 595 1,214 691 1,341 1,021 1,601 1,380 1,972 1,813 2,655 2,450 3,153 3,153 4,391 4,391 5,69090 540 1,239 667 1,494 983 1,603 1,322 1,835 1,697 2,377 2,377 3,085 3,085 4,234 4,234 5,433
Avg. 516 1,139 669 1,429 1,000 1,610 1,347 1,918 1,747 2,552 2,410 3,141 3,141 4,347 4,347 5,636
3 67 504 1,050 762 1,520 1,187 1,870 1,587 2,253 2,039 2,942 2,515 3,319 3,319 4,653 4,653 6,12071 418 883 733 1,459 1,143 1,826 1,534 2,348 1,959 2,883 2,430 3,285 3,285 4,597 4,597 6,00278 495 1,103 722 1,591 1,198 1,916 1,603 2,450 2,096 2,932 2,520 3,371 3,371 4,790 4,790 6,313
Avg. 472 1,012 739 1,523 1,176 1,871 1,575 2,350 2,031 2,919 2,488 3,325 3,325 4,680 4,680 6,145
4 66 469 1,015 758 1,495 1,247 1,949 1,750 2,621 2,389 3,413 3,166 4,123 4,123 5,597 5,597 7,00974 444 851 748 1,421 1,197 1,728 1,647 2,230 2,230 2,927 2,927 3,722 3,722 4,729 4,729 5,64391 582 1,328 793 1,700 1,287 2,023 1,790 2,307 2,307 3,255 3,160 3,865 3,865 5,287 5,287 6,855
Avg. 498 1,064 767 1,539 1,244 1,900 1,729 2,386 2,309 3,198 3,084 3,904 3,904 5,204 5,204 6,502
5 60 411 871 806 1,434 1,366 2,127 1,861 2,562 2,282 3,202 3,026 3,402 3,402 4,748 4,748 5,95661 478 1,056 858 1,774 1,447 2,281 1,983 2,842 2,586 3,787 3,237 4,280 4,280 6,030 6,030 7,88770 425 848 827 1,565 1,392 2,086 1,892 2,720 2,488 3,363 3,133 3,924 3,886 5,245 5,245 6,566
Avg. 438 925 831 1,591 1,402 2,164 1,912 2,708 2,452 3,451 3,132 3,869 3,856 5,341 5,341 6,803
6 62 422 938 844 1,707 1,353 2,179 1,820 2,509 2,052 3,181 2,507 3,412 3,412 4,841 4,841 6,55485 408 932 841 1,696 1,349 2,161 1,826 2,530 2,061 3,096 2,493 3,339 3,339 4,648 4,648 6,20788 568 1,222 916 1,900 1,455 2,351 1,961 2,576 2,142 3,042 2,582 3,416 3,416 4,837 4,837 6,308
Avg. 466 1,031 867 1,768 1,386 2,230 1,869 2,538 2,085 3,106 2,528 3,389 3,389 4,776 4,776 6,356
7 75 468 949 949 1,694 1,694 2,349 2,349 3,212 3,193 4,270 4,074 5,053 5,053 6,354 6,354 7,59582 445 978 961 1,964 1,815 2,699 2,535 3,394 3,304 4,280 4,125 5,091 5,091 6,529 6,529 7,94586 573 1,234 1,049 2,068 1,891 2,874 2,654 3,527 3,441 4,349 4,285 5,445 5,445 6,968 6,968 8,783
Avg. 495 1,054 986 1,909 1,800 2,641 2,513 3,378 3,313 4,300 4,161 5,196 5,196 6,617 6,617 8,108
8 59 501 1,051 993 1,959 1,716 2,436 2,313 3,123 2,825 3,848 3,382 4,399 4,399 5,754 5,754 7,33972 470 908 908 1,685 1,661 2,447 2,231 3,038 2,755 3,669 3,252 4,109 4,109 5,422 5,422 6,78973 440 906 906 1,738 1,655 2,513 2,246 3,129 2,774 3,741 3,287 4,198 4,198 5,495 5,495 6,897
Avg. 470 955 936 1,794 1,677 2,465 2,264 3,096 2,785 3,752 3,307 4,235 4,235 5,557 5,557 7,008
Control 58 864 1,572 1,572 2,676 2,676 3,735 3,735 4,764 4,764 5,861 5,861 6,731 6,731 7,747 7,747 9,00483 958 1,758 1,758 3,001 3,001 4,065 4,065 4,749 4,749 5,551 5,551 6,542 6,542 7,987 7,987 9,12589 734 1,452 1,452 2,600 2,600 3,764 3,764 4,964 4,964 6,208 6,208 7,187 7,187 8,648 8,648 10,142
Avg. 852 1,594 1,594 2,759 2,759 3,855 3,855 4,826 4,826 5,873 5,873 6,820 6,820 8,127 8,127 9,424
Cubic feet per acre
Table 55—Clemons: Total stem volume per acre, 1963–1994, by treatment, plot, and period
Calibrationperiod
1963–1966a
Age (years)
Treatment Plot 19 22
Treatmentperiod 1
1966–1970a
Age (years)
Treatmentperiod 2
1970–1973a
Age (years)
Treatmentperiod 3
1973–1976a
Age (years)
Treatmentperiod 4
1976–1980a
Age (years)
Treatmentperiod 5
1980–1984a
Age (years)
Treatmentperiod 6
1984–1989a
Age (years)
Treatmentperiod 7
1989–1994a
Age (years)
22 26 26 29 29 32 32 36 36 40 40 45 45 50

92 Table 56—Clemons: Merchantable volume per acre, 1963–1994, by treatment, plot, and period
Calibrationperiod
1963–1966a
Age (years)
Treatment Plot 19 22
Treatmentperiod 1
1966–1970a
Age (years)
Treatmentperiod 2
1970–1973a
Age (years)
Treatmentperiod 3
1973–1976a
Age (years)
Treatmentperiod 4
1976–1980a
Age (years)
Treatmentperiod 5
1980–1984a
Age (years)
Treatmentperiod 6
1984–1989a
Age (years)
Treatmentperiod 7
1989–1994a
Age (years)
22 26 26 29 29 32 32 36 36 40 40 45 45 50
a Columns are measurements after treatment and just before next treatment.
1 63 8 183 92 686 448 1093 825 1,449 1,098 1,883 1,396 2,022 2,022 3,030 3,030 4,28664 2 121 70 529 351 909 690 1,332 1,056 1,835 1,367 1,969 1,969 2,911 2,911 3,95269 0 56 42 448 322 803 678 1,307 1,076 1,809 1,378 1,937 1,937 2,804 2,804 3,683
Avg. 3 120 68 554 374 935 731 1,363 1,077 1,842 1,380 1,976 1,976 2,915 2,915 3,973
2 81 0 82 73 608 450 1,060 938 1,584 1,448 2,331 2,182 2,962 2,962 4,171 4,171 5,50487 24 235 146 630 522 1,113 995 1,604 1,532 2,363 2,236 2,940 2,940 4,152 4,152 5,41490 2 186 138 867 620 1,264 1,073 1,627 1,518 2,207 2,207 2,907 2,907 4,021 4,021 5,177
Avg. 9 168 119 702 531 1,146 1,002 1,605 1,499 2,300 2,208 2,936 2,936 4,115 4,115 5,365
3 67 1 147 105 634 545 1,155 996 1,667 1,557 2,478 2,174 2,980 2,980 4,298 4,298 5,76171 9 51 42 376 295 844 741 1,566 1,339 2,297 1,960 2,828 2,828 4,150 4,150 5,54978 3 136 101 803 647 1,349 1,167 2,023 1,789 2,642 2,303 3,145 3,145 4,532 4,532 6,007
Avg. 4 111 83 604 496 1,116 968 1,752 1,562 2,472 2,146 2,984 2,984 4,326 4,326 5,772
4 66 8 96 70 522 420 1,057 935 1,843 1,689 2,758 2,566 3,526 3,526 4,995 4,995 6,40274 12 72 72 382 331 749 728 1,299 1,299 2,051 2,051 2,881 2,881 3,963 3,963 4,96491 16 256 150 968 746 1,524 1,362 1,953 1,953 2,915 2,836 3,568 3,568 4,954 4,954 6,472
Avg. 12 141 97 624 499 1,110 1,008 1,698 1,647 2,574 2,484 3,325 3,325 4,637 4,637 5,946
5 60 0 69 64 452 421 1,074 942 1,646 1,440 2,417 2,299 2,834 2,834 4,194 4,194 5,41461 4 118 104 737 615 1,385 1,212 2,098 1,919 3,166 2,724 3,791 3,791 5,529 5,529 7,35270 17 82 82 404 350 870 781 1,501 1,392 2,261 2,113 2,911 2,899 4,246 4,246 5,613
Avg. 7 90 83 531 462 1,109 978 1,748 1,584 2,615 2,379 3,179 3,175 4,656 4,656 6,126
6 62 1 84 84 558 417 1,116 943 1,694 1,392 2,548 2,006 2,938 2,938 4,377 4,377 6,06985 4 74 72 554 433 1,109 975 1,712 1,416 2,421 1,989 2,845 2,845 4,152 4,152 5,67888 7 184 138 895 716 1,560 1,320 1,988 1,681 2,564 2,232 3,071 3,071 4,476 4,476 5,911
Avg. 4 114 98 669 522 1,262 1,079 1,798 1,496 2,511 2,076 2,952 2,952 4,335 4,335 5,886
7 75 6 62 62 386 386 918 918 1,670 1,670 2,702 2,588 3,557 3,557 4,922 4,922 6,23882 0 56 56 577 551 1,287 1,214 2,028 1,985 2,958 2,843 3,828 3,828 5,309 5,309 6,84686 19 208 149 876 802 1,710 1,582 2,499 2,486 3,461 3,422 4,578 4,578 6,125 6,125 7,913
Avg. 8 108 89 613 580 1,305 1,238 2,066 2,047 3,041 2,951 3,988 3,988 5,452 5,452 6,999
8 59 1 88 87 702 625 1,336 1,264 2,069 1,899 2,987 2,613 3,630 3,630 5,001 5,001 6,56272 13 113 113 426 422 959 855 1,514 1,384 2,276 1,981 2,828 2,828 4,155 4,155 5,51873 2 48 48 399 374 1,029 951 1,754 1,609 2,552 2,277 3,189 3,189 4,497 4,497 5,893
Avg. 5 83 83 509 474 1,108 1,024 1,779 1,630 2,605 2,290 3,216 3,216 4,551 4,551 5,991
Control 58 112 388 388 1,031 1,031 1,803 1,803 2,650 2,650 3,716 3,716 4,602 4,602 5,856 5,856 7,22083 145 411 411 1,135 1,135 1,915 1,915 2,697 2,697 3,629 3,629 4,678 4,678 6,309 6,309 7,67589 65 169 169 551 551 1,240 1,240 2,175 2,175 3,347 3,347 4,431 4,431 6,100 6,100 7,868
Avg. 107 323 323 906 906 1,653 1,653 2,507 2,507 3,564 3,564 4,570 4,570 6,088 6,088 7,588
Cubic feet to a 6-inch top per acre

93 a Columns are measurements after treatment and just before next treatment.
Scribner board feet per acre
Table 57—Clemons: Scribner board foot volume (6-inch top in 32-foot logs) per acre, 1963–1994, by treatment, plot, and period
Calibrationperiod
1963–1966a
Age (years)
Treatment Plot 19 22
Treatmentperiod 1
1966–1970a
Age (years)
Treatmentperiod 2
1970–1973a
Age (years)
Treatmentperiod 3
1973–1976a
Age (years)
Treatmentperiod 4
1976–1980a
Age (years)
Treatmentperiod 5
1980–1984a
Age (years)
Treatmentperiod 6
1984–1989a
Age (years)
Treatmentperiod 7
1989–1994a
Age (years)
22 26 26 29 29 32 32 36 36 40 40 45 45 50
1 63 0 0 0 1,268 718 3,962 2,963 4,946 3,825 6,741 5,021 7,716 7,716 12,469 12,469 19,32464 0 0 0 1,561 1,074 3,120 2,295 4,567 3,634 6,429 4,604 7,528 7,528 11,713 11,713 17,54369 0 0 0 837 606 2,768 2,481 4,650 3,737 6,285 4,686 7,501 7,501 11,384 11,384 15,827
Avg. 0 0 0 1,222 799 3,284 2,579 4,721 3,732 6,485 4,771 7,582 7,582 11,855 11,855 17,565
2 81 0 0 0 1,699 1,286 3,626 3,276 5,134 4,628 8,673 7,977 12,185 12,185 16,890 16,890 24,76387 0 225 100 1,580 1,455 3,705 3,299 5,399 5,031 9,245 8,606 11,879 11,879 17,563 17,563 24,90290 0 0 0 2,492 1,717 4,340 3,614 4,961 4,591 8,049 8,049 10,651 10,651 15,913 15,913 22,909
Avg. 0 75 33 1,923 1,486 3,890 3,396 5,165 4,750 8,656 8,210 11,572 11,572 16,789 16,789 24,191
3 67 0 0 0 1,873 1,742 4,300 3,724 5,843 5,486 9,416 8,207 12,378 12,378 18,205 18,205 26,18571 0 100 100 387 225 2,768 2,393 5,780 4,891 9,288 7,902 11,465 11,465 17,730 17,730 24,92778 0 0 0 2,392 1,998 4,732 4,107 6,892 6,122 9,911 8,639 12,588 12,588 18,767 18,767 27,612
Avg. 0 33 33 1,551 1,322 3,933 3,408 6,172 5,500 9,538 8,249 12,144 12,144 18,234 18,234 26,241
4 66 0 106 106 1,124 943 3,569 3,082 6,881 6,311 9,955 9,352 14,591 14,591 21,230 21,230 28,03074 0 106 106 781 674 2,520 2,520 4,382 4,382 7,587 7,587 11,408 11,408 16,797 16,797 22,08791 0 119 0 2,879 2,217 5,248 4,703 6,408 6,408 10,634 10,346 13,685 13,685 19,809 19,809 29,629
Avg. 0 110 71 1,595 1,278 3,779 3,435 5,890 5,700 9,392 9,095 13,228 13,228 19,278 19,278 26,582
5 60 0 0 0 874 874 3,269 2,832 5,496 4,726 8,211 7,729 10,380 10,380 17,098 17,098 23,17461 0 100 100 1,936 1,811 4,336 3,805 7,404 6,889 12,135 10,500 14,632 14,632 22,726 22,726 32,12770 0 125 125 681 531 2,767 2,480 5,913 5,449 8,460 7,921 11,485 11,485 18,037 18,037 24,866
Avg. 0 75 75 1,164 1,072 3,457 3,039 6,271 5,688 9,602 8,717 12,166 12,166 19,287 19,287 26,723
6 62 0 0 0 1,493 1,087 3,451 2,769 6,388 5,276 9,752 7,651 11,898 11,898 18,824 18,824 27,39785 0 0 0 1,062 806 3,897 3,472 6,318 5,216 9,127 7,302 11,795 11,795 17,933 17,933 25,55388 0 0 0 2,966 2,348 5,660 4,759 6,697 5,644 9,853 8,505 12,590 12,590 19,349 19,349 27,381
Avg. 0 0 0 1,840 1,413 4,336 3,667 6,468 5,379 9,577 7,819 12,094 12,094 18,702 18,702 26,777
7 75 0 0 0 862 862 3,130 3,130 6,768 6,768 10,255 9,817 15,164 15,164 22,500 22,500 28,79782 0 0 0 1,349 1,349 4,556 4,305 7,655 7,493 11,583 11,081 16,569 16,569 23,239 23,239 30,82786 0 131 0 2,692 2,398 6,650 6,124 9,530 9,530 13,020 12,826 19,379 19,379 26,813 26,813 35,953
Avg. 0 44 0 1,634 1,536 4,779 4,520 7,984 7,930 11,620 11,241 17,038 17,038 24,184 24,184 31,859
8 59 0 0 0 1,592 1,374 4,855 4,604 7,861 7,192 11,314 9,979 14,770 14,770 22,163 22,163 29,38872 0 0 0 1,237 1,237 2,884 2,483 5,314 4,876 9,219 8,210 11,965 11,965 18,378 18,378 24,85773 0 0 0 649 649 3,383 3,383 6,769 6,426 10,004 9,083 13,329 13,329 19,763 19,763 26,731
Avg. 0 0 0 1,159 1,087 3,707 3,490 6,648 6,164 10,179 9,091 13,355 13,355 20,101 20,101 26,992
Control 58 0 737 737 3,125 3,125 6,179 6,179 9,762 9,762 14,849 14,849 20,141 20,141 26,804 26,804 33,24983 250 924 924 2,930 2,930 6,442 6,442 10,464 10,464 14,658 14,658 20,164 20,164 29,007 29,007 35,85789 119 356 356 1,175 1,175 3,307 3,307 7,951 7,951 13,849 13,849 19,654 19,654 27,306 27,306 36,394
Avg. 123 672 672 2,410 2,410 5,309 5,309 9,393 9,393 14,452 14,452 19,987 19,987 27,706 27,706 35,167

94 Table 58—Clemons: Trees per acre by 1-inch diameter at breast height (d.b.h.) classes, after calibration (1963) and after thinning
(1994), by treatment (age in parentheses)
Treatment 3
1963 1994(19 yr) (50 yr)
D.b.h.class
2 0 0 0 0 0 0 0 0 0 0 0 0 0 0 0 0 0 0
3 12 0 7 0 12 0 10 0 17 0 12 0 15 0 13 0 128 0
4 132 0 118 0 132 0 125 0 143 0 118 0 137 0 142 0 233 0
5 143 0 140 0 143 0 152 0 143 0 160 0 150 0 163 0 192 15
6 77 0 100 0 85 0 83 2 77 0 78 0 75 5 58 3 65 23
7 30 0 25 0 22 0 18 0 10 5 25 0 17 10 17 12 37 25
8 2 0 3 0 3 3 7 0 3 8 3 2 3 15 3 15 17 38
9 0 0 2 0 0 0 0 10 2 7 0 2 2 20 0 28 7 47
10 0 0 0 0 0 0 0 8 0 15 0 5 0 23 0 28 5 62
11 0 0 0 0 0 3 0 15 0 20 0 10 0 37 0 20 2 30
12 0 0 0 0 0 2 0 10 0 18 0 10 0 30 0 30 2 40
13 0 0 0 0 0 13 0 12 0 12 0 8 0 25 0 25 0 32
14 0 3 0 3 0 3 0 17 0 18 0 13 0 18 0 25 0 25
15 0 0 0 3 0 15 0 18 0 25 0 10 0 37 0 17 0 15
16 0 7 0 10 0 7 0 10 0 10 0 22 0 18 0 17 0 12
17 0 3 0 8 0 12 0 17 0 8 0 15 0 10 0 5 0 3
18 0 8 0 12 0 15 0 7 0 13 0 8 0 3 0 5 0 10
19 0 15 0 10 0 13 0 10 0 7 0 10 0 3 0 3 0 0
20 0 5 0 7 0 5 0 5 0 8 0 12 0 3 0 2 0 3
21 0 10 0 10 0 7 0 2 0 0 0 0 0 0 0 2 0 2
22 0 3 0 7 0 3 0 3 0 2 0 0 0 0 0 2 0 2
23 0 0 0 3 0 2 0 2 0 0 0 0 0 0 0 0 0 2
24 0 0 0 0 0 0 0 0 0 2 0 0 0 0 0 0 0 0
25 0 2 0 2 0 0 0 0 0 0 0 0 0 0 0 0 0 2
Total 395 57 395 75 397 103 395 147 395 178 397 127 398 258 397 238 687 387
Trees per acre
Treatment 1
1963 1994(19 yr) (50 yr)
Treatment 7
1963 1994(19 yr) (50 yr)
Treatment 5
1963 1994(19 yr) (50 yr)
Treatment 4
1963 1994(19 yr) (50 yr)
Treatment 2
1963 1994(19 yr) (50 yr)
Treatment 8
1963 1994(19 yr) (50 yr)
Treatment 6
1963 1994(19 yr) (50 yr)
Control
1963 1994(19 yr) (50 yr)

95
1961 24 68.6 68.6 14.0 14.0 0.00 0.00 0.0 0.0 0.0 2.9 0.0 0.6 0.0 2.9 0.0 0.61965 28 147.8 148.0 58.6 58.6 1.03 1.03 2.1 2.1 19.8 5.3 11.1 2.1 19.8 5.3 11.1 2.11968 31 199.4 200.6 107.7 107.7 1.16 1.14 1.6 1.6 17.2 6.4 16.4 3.5 17.5 6.5 16.4 3.51971 34 253.3 254.5 162.6 162.6 1.13 1.13 1.5 1.5 18.0 7.4 18.3 4.8 18.0 7.5 18.3 4.81975 38 327.9 329.1 239.4 239.4 1.27 1.27 1.4 1.4 18.7 8.6 19.2 6.3 18.7 8.7 19.2 6.31979 42 394.9 396.0 305.7 305.7 1.24 1.24 1.1 1.1 16.7 9.4 16.6 7.3 16.7 9.4 16.6 7.31983 46 455.6 456.7 365.0 365.0 1.15 1.15 .9 .9 15.2 9.9 14.8 7.9 15.2 9.9 14.8 7.91988 51 523.8 525.0 431.3 431.3 .90 .90 .8 .8 13.6 10.3 13.2 8.5 13.6 10.3 13.2 8.51993 56 608.2 609.4 512.8 512.8 .82 .82 .8 .8 16.9 10.9 16.3 9.2 16.9 10.9 16.3 9.2
1961 24 14.8 20.9 840 13.4 11.7 68.6 14.0 0 0.0 0.0 0.0 0.0 0.0 0.0 0.0 0 0.0 0.0 0.0 0.01965 28 19.1 26.3 457 18.7 12.3 92.7 42.9 379 16.0 7.6 55.0 15.7 .1 .1 .92 4 10.9 0 .3 .01968 31 21.5 29.5 342 22.6 13.5 114.5 75.2 107 20.7 3.6 29.9 16.8 .3 .2 .94 8 13.8 .1 9 .01971 34 24.0 33.2 231 27.9 13.9 131.9 108.1 111 21.4 4.0 36.5 22.0 .3 .2 .83 0 .0 .0 .0 .01975 38 27.4 38.7 152 35.1 14.6 156.5 143.5 78 27.9 4.8 50.0 41.4 .6 .5 .85 0 .0 .0 .0 .01979 42 30.5 43.2 124 40.1 15.6 181.9 171.0 29 39.4 3.5 41.5 38.9 1.4 1.3 .99 0 .0 .0 .0 .01983 46 32.5 46.6 124 44.7 19.3 242.7 230.3 0 .0 .0 .0 .0 .0 .0 .00 0 .0 .0 .0 .01988 51 35.0 51.3 124 49.2 23.4 310.9 296.6 0 .0 .0 .0 .0 .0 .0 .00 0 .0 .0 .0 .01993 56 38.7 55.7 124 53.3 27.4 395.3 378.1 .0 .0 .0 .0 .0 .0 .0 .00 0 .0 .0 .0 .0
a Average height (ht) and diameter at breast height (d.b.h.) of the 100 largest trees per hectare (estimated from d.b.h. and ht-d.b.h. curves).b Quadratic mean diameter at breast height.c All volumes are total stem cubic meters (CVTS) or merchantable cubic to a 15.25-cm top diameter inside bark (CV6).d Average d.b.h. cut/average d.b.h. before thinning.e Cumulative yield: net = standing + thinning; gross = standing + thinning + mortality; yield does not include any volume removed in a calibration cut. Volume (CVTS) removed inthinnings = 212.9 cubic meters (54 percent of the total gross yield at the time of the last thinning). Volume (CVTS) in mortality = 1.2 cubic meters (< 1 percent of the total grossyield).f Net is QMD growth of trees alive at the start and end of the period; survivor is QMD growth of trees alive at the end of the period.g MAI = mean annual increment; PAI = periodic annual increment.
Ap
pen
dix 4: S
kykom
ish M
etric Tables
YearStandage
Table 59—Skykomish: Stand development for treatment 1, per-hectare basis (plots 6010, 6022, and 6034)
100 largesta
Ht D.b.h. QMDbTreesBasalarea CVTS d/Dd
After thinning Removed in thinning Mortality
Volumec Avg. volume
CV6 QMDbTreesBasalarea CVTS
Volume
CV6 QMDbTreesBasalarea CVTS
Volume
CV6
Years m Cm No. Cm m 2 - - - - m 3 - - - - No. Cm m 2 - - - - - - - - m 3 - - - - - - - --
No. Cm m 2 - - - m 3 - - -
YearStandage
NetCVTS
GrossCVTS
GrossCV6
NetCV6 Net Survivor
CVTSPAI
Cumulative yielde
QMD growth f
Net GrossCVTS
PAICVTSMAI
CV6PAI
CV6MAI
CV6PAI
CVTSMAI
CV6MAI
Net volume growthg Gross volume growth
Years - - - - - - - - - - - m 3 - - - - - - - - - - - - - - Cm - - - - - - - m 2 - - - - - - - - - - - - - - - - - - - - - - - - - m 3 - - - - - - - - - - - - - - - - - - - - - - - - -
CVTS CV6
Basal areagrowth

96
a Average height (ht) and diameter at breast height (d.b.h.) of the 100 largest trees per hectare (estimated from d.b.h. and ht-d.b.h. curves).b Quadratic mean diameter at breast height.c All volumes are total stem cubic meters (CVTS) or merchantable cubic to a 15.25-cm top diameter inside bark (CV6).d Average d.b.h. cut/average d.b.h. before thinning.e Cumulative yield: net = standing + thinning; gross = standing + thinning + mortality; yield does not include any volume removed in a calibration cut. Volume (CVTS) removed inthinnings = 156.8 cubic meters (37 percent of the total gross yield at the time of the last thinning). Volume (CVTS) in mortality = 17.1 cubic meters (2 percent of the total grossyield).f Net is QMD growth of trees alive at the start and end of the period; survivor is QMD growth of trees alive at the end of the period.g MAI = mean annual increment; PAI = periodic annual increment.
YearStandage
Table 60—Skykomish: Stand development for treatment 1, per-hectare basis (plots 6010, 6022, and 6034)
100 largesta
Ht D.b.h. QMDbTreesBasalarea CVTS d/Dd
After thinning Removed in thinning Mortality
Volumec Avg. volume
CV6 QMDbTreesBasalarea CVTS
Volume
CV6 QMDbTreesBasalarea CVTS
Volume
CV6
Years m Cm No. Cm m2 - - - - m3 - - - - No. Cm m2 - - - - - - - - m3 - - - - - - - - - No. Cm m2 - - - m3 - - -
YearStandage
NetCVTS
GrossCVTS
GrossCV6
NetCV6 Net Survivor
CVTSPAI
Cumulative yielde
Net GrossCVTSPAI
CVTSMAI
CV6PAI
CV6MAI
CV6PAI
CVTSMAI
CV6MAI
Net volume growthg Gross volume growth
Years - - - - - - - - - - - m3 - - - - - - - - - - - - - - Cm - - - - - - - m2 - - - - - - - - - - - - - - - - - - - - - - - - - m3 - - - - - - - - - - - - - - - - - - - - - - - - -
CVTS CV6
1961 24 14.3 18.9 910 12.7 11.5 62.1 8.0 0 0.0 0.0 0.0 0.0 0.0 0.0 0.00 0 0.0 0.0 0.0 0.01965 28 18.1 24.1 543 17.2 12.6 88.2 31.1 366 15.6 7.0 48.1 13.6 .1 .1 .94 0 .0 .0 .0 .01968 31 20.4 26.8 432 20.3 13.9 113.0 61.3 107 20.5 3.5 29.4 16.2 .3 .2 1.01 4 14.3 .1 .5 .01971 34 22.3 29.5 362 23.7 15.9 143.7 101.5 66 21.0 2.3 19.4 11.2 .3 .2 .90 4 22.9 .2 1.4 .91975 38 26.7 34.8 305 28.7 19.7 213.0 179.7 54 24.9 2.6 27.1 20.1 .5 .4 .88 4 22.9 .2 1.6 1.11979 42 29.2 39.1 263 33.2 22.8 268.3 241.5 41 29.7 2.9 32.8 28.5 .8 .7 .91 0 .0 .0 .0 .01983 46 32.6 43.3 263 36.6 27.7 362.9 334.7 0 .0 .0 .0 .0 .0 .0 .00 0 .0 .0 .0 .01988 51 35.8 47.2 259 39.8 32.2 455.0 425.6 0 .0 .0 .0 .0 .0 .0 .00 4 43.2 .6 8.3 7.91993 56 38.9 50.9 255 42.8 36.7 553.6 522.3 0 .0 .0 .0 .0 .0 .0 .00 4 32.5 .3 5.3 4.8
1961 24 62.1 62.1 8.0 8.0 0.00 0.00 0.0 0.0 0.0 2.6 0.0 .3 0.0 2.6 0.0 .31965 28 136.3 136.3 44.7 44.7 .95 .95 2.0 2.0 18.6 4.9 9.2 1.6 18.6 4.9 9.2 1.61968 31 190.5 191.0 91.0 91.0 1.06 1.05 1.6 1.7 18.1 6.1 15.5 2.9 18.2 6.2 15.5 2.91971 34 240.6 242.4 142.4 143.3 .98 .99 1.4 1.5 16.7 7.1 17.1 4.2 17.1 7.1 17.4 4.21975 38 336.9 340.4 240.7 242.8 1.13 1.13 1.6 1.6 24.1 8.9 24.6 6.3 24.5 9.0 24.9 6.41979 42 425.1 428.5 331.0 333.0 1.01 1.01 1.5 1.5 22.0 10.1 22.6 7.9 22.0 10.2 22.6 7.91983 46 519.7 523.2 424.2 426.2 .85 .85 1.2 1.2 23.7 11.3 23.3 9.2 23.7 11.4 23.3 9.31988 51 611.8 623.6 515.1 525.1 .63 .66 .9 1.0 18.4 12.0 18.2 10.1 20.1 12.2 19.8 10.31993 56 710.4 727.5 611.8 626.6 .60 .59 .9 1.0 19.7 12.7 19.3 10.9 20.8 13.0 20.3 11.2
QMD growthfBasal area
growth

97
a Average height (ht) and diameter at breast height (d.b.h.) of the 100 largest trees per hectare (estimated from d.b.h. and ht-d.b.h. curves).b Quadratic mean diameter at breast height.c All volumes are total stem cubic meters (CVTS) or merchantable cubic to a 15.25-cm top diameter inside bark (CV6).d Average d.b.h. cut/average d.b.h. before thinning.e Cumulative yield: net = standing + thinning; gross = standing + thinning + mortality; yield does not include any volume removed in a calibration cut. Volume (CVTS) removed inthinnings = 173.0 cubic meters (39 percent of the total gross yield at the time of the last thinning). Volume (CVTS) in mortality = 4.1 cubic meters (1 percent of the total gross yield).f Net is QMD growth of trees alive at the start and end of the period; survivor is QMD growth of trees alive at the end of the period.g MAI = mean annual increment; PAI = periodic annual increment.
YearStandage
Table 61—Skykomish: Stand development for treatment 3, per-hectare basis (plots 6016, 6031, and 6036)
100 largesta
Ht D.b.h. QMDbTreesBasalarea CVTS d/Dd
After thinning Removed in thinning Mortality
Volumec Avg. volume
CV6 QMDbTreesBasalarea CVTS
Volume
CV6 QMDbTreesBasalarea CVTS
Volume
CV6
Years m Cm No. Cm m2 - - - - m3 - - - - No. Cm m2 - - - - - - - - m3 - - - - - - - - - No. Cm m2 - - - m3 - - -
YearStandage
NetCVTS
GrossCVTS
GrossCV6
NetCV6 Net Survivor
CVTSPAI
Cumulative yielde
Net GrossCVTS
PAICVTSMAI
CV6PAI
CV6MAI
CV6PAI
CVTSMAI
CV6MAI
Net volume growthg Gross volume growth
Years - - - - - - - - - - - m3 - - - - - - - - - - - - - - Cm - - - - - - - m2 - - - - - - - - - - - - - - - - - - - - - - - - - m3 - - - - - - - - - - - - - - - - - - - - - - - - -
CVTS CV6
1961 24 14.2 20.6 926 12.7 11.6 65.1 11.3 0 0.0 0.0 0.0 0.0 0.0 0.0 0.00 0 0.0 0.0 0.0 0.01965 28 18.0 26.0 613 17.2 14.2 98.5 38.8 313 14.8 5.4 36.7 7.9 .1 .1 .90 0 .0 .0 .0 .01968 31 20.3 29.6 506 20.3 16.3 125.8 68.8 107 20.2 3.4 26.3 15.4 .2 .2 1.00 0 .0 .0 .0 .01971 34 23.0 32.4 408 23.9 18.2 162.4 115.0 99 19.6 3.0 25.3 12.4 .3 .1 .85 0 .0 .0 .0 .01975 38 26.8 37.9 296 30.0 20.9 214.5 183.9 111 23.1 4.6 46.0 31.7 .4 .3 .82 0 .0 .0 .0 .01979 42 29.7 43.0 226 36.2 23.1 261.7 240.3 66 25.9 3.5 38.7 30.2 .6 .5 .76 4 31.0 .3 3.3 2.91983 46 32.2 47.5 226 40.2 28.5 347.4 324.6 0 .0 .0 .0 .0 .0 .0 .00 0 .0 .0 .0 .01988 51 36.3 52.2 222 44.4 34.3 459.9 434.7 0 .0 .0 .0 .0 .0 .0 .00 4 17.8 .1 .8 .31993 56 39.6 56.4 222 47.8 39.8 576.3 547.4 0 .0 .0 .0 .0 .0 .0 .00 0 .0 .0 .0 .0
1961 24 65.1 65.1 11.3 11.3 0.00 0.00 0.0 0.0 0.0 2.7 0.0 0.5 0.0 2.7 0.0 0.51965 28 135.2 135.2 46.7 46.7 .94 .94 2.0 2.0 17.5 4.8 8.9 1.7 17.5 4.8 8.9 1.71968 31 188.8 188.8 92.2 92.2 1.03 1.03 1.8 1.8 17.9 6.1 15.2 3.0 17.9 6.1 15.2 3.01971 34 250.7 250.7 150.7 150.7 .96 .96 1.7 1.7 20.6 7.4 19.5 4.4 20.6 7.4 19.5 4.41975 38 348.8 348.8 251.3 251.3 1.09 1.09 1.8 1.8 24.5 9.2 25.2 6.6 24.5 9.2 25.2 6.61979 42 434.7 438.0 337.9 340.8 1.03 1.03 1.4 1.5 21.5 10.4 21.6 8.0 22.3 10.4 22.4 8.11983 46 520.3 523.6 422.2 425.1 1.00 1.00 1.4 1.4 21.4 11.3 21.1 9.2 21.4 11.4 21.1 9.21988 51 632.9 636.9 532.3 535.5 .84 .79 1.2 1.2 22.5 12.4 22.0 10.4 22.7 12.5 22.1 10.51993 56 749.3 753.4 645.0 648.2 .68 .68 1.1 1.1 23.3 13.4 22.5 11.5 23.3 13.5 22.5 11.6
QMD growth fBasal area
growth

98
a Average height (ht) and diameter at breast height (d.b.h.) of the 100 largest trees per hectare (estimated from d.b.h. and ht-d.b.h. curves).b Quadratic mean diameter at breast height.c All volumes are total stem cubic meters (CVTS) or merchantable cubic to a 15.25-cm top diameter inside bark (CV6).d Average d.b.h. cut/average d.b.h. before thinning.e
Cumulative yield: net = standing + thinning; gross = standing + thinning + mortality; yield does not include any volume removed in a calibration cut. Volume (CVTS) removed inthinnings = 106.3 cubic meters (23 percent of the total gross yield at the time of the last thinning). Volume (CVTS) in mortality = 21.5 cubic meters (3 percent of the total grossyield).f Net is QMD growth of trees alive at the start and end of the period; survivor is QMD growth of trees alive at the end of the period.g MAI = mean annual increment; PAI = periodic annual increment.
YearStandage
Table 62—Stand development for treatment 4, per-hectare basis (plots 6001, 6023, and 6035)
100 largesta
Ht D.b.h. QMDbTreesBasalarea CVTS d/Dd
After thinning Removed in thinning Mortality
Volumec Avg. volume
CV6 QMDbTreesBasalarea CVTS
Volume
CV6 QMDbTreesBasalarea CVTS
Volume
CV6
Years m Cm No. Cm m2 - - - - m3 - - - - No. Cm m2 - - - - - - - - m3 - - - - - - - - - No. Cm m2 - - - m3 - - -
YearStandage
NetCVTS
GrossCVTS
GrossCV6
NetCV6 Net Survivor
CVTSPAI
Cumulative yielde
Net GrossCVTSPAI
CVTSMAI
CV6PAI
CV6MAI
CV6PAI
CVTSMAI
CV6MAI
Net volume growthg Gross volume growth
Years - - - - - - - - - - - m3 - - - - - - - - - - - - - - Cm - - - - - - - m2 - - - - - - - - - - - - - - - - - - - - - - - - - m3 - - - - - - - - - - - - - - - - - - - - - - - - -
CVTS CV6
1961 24 14.5 21.7 778 13.9 11.8 63.6 15.8 0 0.0 0.0 0.0 0.0 0.0 0.0 0.00 0 0.0 0.0 0.0 0.01965 28 18.8 27.4 486 19.3 14.1 99.3 52.0 292 15.8 5.7 36.6 10.4 .1 .1 .87 0 .0 .0 .0 .01968 31 20.9 31.2 420 22.7 17.0 133.7 90.2 66 21.9 2.5 19.4 12.4 .3 .2 .97 0 .0 .0 .0 .01971 34 24.0 34.8 366 26.6 20.3 186.0 147.7 54 21.0 1.9 16.0 9.2 .3 .2 .81 0 .0 .0 .0 .01975 38 27.9 40.3 321 31.9 25.5 270.5 238.4 45 24.6 2.1 22.6 16.8 .5 .4 .79 0 .0 .0 .0 .01979 42 30.4 44.6 301 36.2 30.7 353.3 324.0 21 25.3 1.0 11.7 9.1 .6 .6 .71 0 .0 .0 .0 .01983 46 33.9 49.0 301 39.4 36.6 462.7 430.9 0.0 .0 .0 .0 .0 .0 .0 0 0 .0 .0 .0 .01988 51 37.2 53.0 288 42.5 40.8 561.0 527.3 0 .0 .0 .0 .0 .0 .0 .00 12 37.1 1.3 17.6 16.31993 56 40.3 56.3 280 45.1 44.8 660.3 623.8 0 .0 .0 .0 .0 .0 .0 .00 4 29.2 .3 3.9 3.4
1961 24 63.6 63.6 15.8 15.8 0.00 0.00 0.0 0.0 0.0 2.6 0.0 0.7 0.0 2.6 0.0 0.71965 28 135.9 135.9 62.3 62.3 1.04 1.04 2.0 2.0 18.1 4.9 11.6 2.2 18.1 4.9 11.6 2.21968 31 189.7 189.7 113.0 113.0 1.12 1.12 1.8 1.8 17.9 6.1 16.9 3.6 17.9 6.1 16.9 3.61971 34 258.0 258.0 179.8 179.8 1.07 1.07 1.7 1.7 22.8 7.6 22.3 5.3 22.8 7.6 22.3 5.31975 38 365.1 365.1 287.3 287.3 1.12 1.12 1.9 1.9 26.8 9.6 26.9 7.6 26.8 9.6 26.9 7.61979 42 459.6 459.6 382.0 382.0 .92 .92 1.6 1.6 23.6 10.9 23.7 9.1 23.6 10.9 23.7 9.11983 46 569.0 569.0 488.9 488.9 .82 .82 1.5 1.5 27.4 12.4 26.7 10.6 27.4 12.4 26.7 10.61988 51 667.4 684.9 585.3 601.6 .61 .61 .9 1.1 19.7 13.1 19.3 11.5 23.2 13.4 22.5 11.81993 56 766.7 788.2 681.7 701.5 .52 .49 .8 .8 19.9 13.7 19.3 12.2 20.6 14.1 20.0 12.5
QMD growth fBasal area
growth

99
a Average height (ht) and diameter at breast height (d.b.h.) of the 100 largest trees per hectare (estimated from d.b.h. and ht-d.b.h. curves).b Quadratic mean diameter at breast height.c All volumes are total stem cubic meters (CVTS) or merchantable cubic to a 15.25-cm top diameter inside bark (CV6).d Average d.b.h. cut/average d.b.h. before thinning.e
Cumulative yield: net = standing + thinning; gross = standing + thinning + mortality; yield does not include any volume removed in a calibration cut. Volume (CVTS) removed inthinnings = 124.6 cubic meters (25 percent of the total gross yield at the time of the last thinning). Volume (CVTS) in mortality = 3.5 cubic meters (< 1 percent of the total grossyield).f Net is QMD growth of trees alive at the start and end of the period; survivor is QMD growth of trees alive at the end of the period.g MAI = mean annual increment; PAI = periodic annual increment.
YearStandage
Table 63—Skykomish: Stand development for treatment 5, per-hectare basis (plots 6009, 6011, and 6028)
100 largesta
Ht D.b.h. QMDbTreesBasalarea CVTS d/Dd
After thinning Removed in thinning Mortality
Volumec Avg. volume
CV6 QMDbTreesBasalarea CVTS
Volume
CV6 QMDbTreesBasalarea CVTS
Volume
CV6
Years m Cm No. Cm m2 - - - - m3 - - - - No. Cm m2 - - - - - - - - m3 - - - - - - - - - No. Cm m2 - - - m3 - - -
YearStandage
NetCVTS
GrossCVTS
GrossCV6
NetCV6 Net Survivor
CVTSPAI
Cumulative yielde
Net GrossCVTS
PAICVTSMAI
CV6PAI
CV6MAI
CV6PAI
CVTSMAI
CV6MAI
Net volume growthg Gross volume growth
Years - - - - - - - - - - - m3 - - - - - - - - - - - - - - Cm - - - - - - - m2 - - - - - - - - - - - - - - - - - - - - - - - - - m3 - - - - - - - - - - - - - - - - - - - - - - - - -
CVTS CV6
1961 24 14.6 20.0 897 13.0 11.8 65.7 11.4 0 0.0 0.0 0.0 0.0 0.0 0.0 0.00 0 0.0 0.0 0.0 0.01965 28 18.2 25.2 700 17.1 15.8 111.4 42.4 193 15.4 3.6 24.6 5.5 .1 .1 .93 4 8.8 .0 .1 .01968 31 20.8 28.8 626 20.1 19.5 158.8 84.8 62 18.8 1.7 13.7 6.9 .2 .2 .95 12 16.9 .3 2.2 .61971 34 23.3 31.8 560 22.9 22.5 206.6 136.9 62 20.1 2.0 17.4 9.1 .3 .2 .90 4 12.2 .0 .4 .01975 38 27.6 36.4 490 26.8 27.0 291.4 228.4 66 23.7 2.9 31.2 22.1 .5 .4 .90 4 16.3 .1 .8 .11979 42 30.4 40.9 424 30.7 30.7 367.7 314.3 66 24.6 3.1 37.7 28.4 .6 .4 .83 0 .0 .0 .0 .01983 46 33.5 45.3 424 33.7 37.1 483.1 428.6 0 .0 .0 .0 .0 .0 .0 .00 0 .0 .0 .0 .01988 51 36.5 49.7 424 36.6 43.8 605.0 550.1 0 .0 .0 .0 .0 .0 .0 .00 0 .0 .0 .0 .01993 56 40.0 53.8 424 39.2 50.2 747.0 688.6 0 .0 .0 .0 .0 .0 .0 .00 0 .0 .0 .0 .0
1961 24 65.7 65.7 11.4 11.4 0.00 0.00 0.0 0.0 0.0 2.7 0.0 0.5 0.0 2.7 0.0 0.51965 28 136.0 136.1 47.9 47.9 .92 .92 1.9 1.9 17.6 4.9 9.1 1.7 17.6 4.9 9.1 1.71968 31 197.1 199.4 97.2 97.8 .96 .97 1.8 1.9 20.4 6.4 16.4 3.1 21.1 6.4 16.6 3.21971 34 262.2 265.0 158.4 159.0 .83 .82 1.7 1.7 21.7 7.7 20.4 4.7 21.8 7.8 20.4 4.71975 38 378.2 381.8 272.1 272.8 .90 .88 1.8 1.9 29.0 10.0 28.4 7.2 29.2 10.0 28.4 7.21979 42 492.2 495.8 386.3 387.1 .80 .80 1.7 1.7 28.5 11.7 28.6 9.2 28.5 11.8 28.6 9.21983 46 607.6 611.1 500.5 501.3 .75 .75 1.6 1.6 28.8 13.2 28.6 10.9 28.8 13.3 28.6 10.91988 51 729.5 733.0 622.1 622.8 .58 .58 1.3 1.3 24.4 14.3 24.3 12.2 24.4 14.4 24.3 12.21993 56 871.6 875.1 760.5 761.3 .52 .52 1.3 1.3 28.4 15.6 27.7 13.6 28.4 15.6 27.7 13.6
QMD growthfBasal area
growth

100
a Average height (ht) and diameter at breast height (d.b.h.) of the 100 largest trees per hectare (estimated from d.b.h. and ht-d.b.h. curves).b Quadratic mean diameter at breast height.c All volumes are total stem cubic meters (CVTS) or merchantable cubic to a 15.25-cm top diameter inside bark (CV6).d Average d.b.h. cut/average d.b.h. before thinning.e
Cumulative yield: net = standing + thinning; gross = standing + thinning + mortality; yield does not include any volume removed in a calibration cut. Volume (CVTS) removed inthinnings = 201.1 cubic meters (42 percent of the total gross yield at the time of the last thinning). Volume (CVTS) in mortality = 27.1 cubic meters (3 percent of the total grossyield).f Net is QMD growth of trees alive at the start and end of the period; survivor is QMD growth of trees alive at the end of the period.g MAI = mean annual increment; PAI = periodic annual increment.
YearStandage
Table 64—Skykomish: Stand development for treatment 6, per-hectare basis (plots 6007, 6015, and 6033)
100 largesta
Ht D.b.h. QMDbTreesBasalarea CVTS d/Dd
After thinning Removed in thinning Mortality
Volumec Avg. volume
CV6 QMDbTreesBasalarea CVTS
Volume
CV6 QMDbTreesBasalarea CVTS
Volume
CV6
Years m Cm No. Cm m2 - - - - m3 - - - - No. Cm m2 - - - - - - - - m3 - - - - - - - - - No. Cm m2 - - - m3 - - -
YearStandage
NetCVTS
GrossCVTS
GrossCV6
NetCV6 Net Survivor
CVTSPAINet Gross
CVTSPAI
CVTSMAI
CV6PAI
CV6MAI
CV6PAI
CVTSMAI
CV6MAI
Net volume growthg Gross volume growth
Years - - - - - - - - - - - m3 - - - - - - - - - - - - - - Cm - - - - - - - m2 - - - - - - - - - - - - - - - - - - - - - - - - - m3 - - - - - - - - - - - - - - - - - - - - - - - - -
CVTS CV6
1961 24 15.0 19.6 951 12.7 11.7 67.4 11.9 0 0.0 0.0 0.0 0.0 0.0 0.0 0.00 0 0.0 0.0 0.0 0.01965 28 19.1 24.8 720 16.9 15.8 114.8 40.9 218 14.7 3.7 25.9 5.9 .1 .1 .90 12 13.2 .2 1.0 .01968 31 21.2 28.5 609 20.2 18.8 153.9 81.4 95 19.7 2.9 23.9 12.3 .3 .2 .99 16 13.1 .2 1.5 .01971 34 23.4 31.7 494 23.5 20.6 191.0 129.8 103 19.0 2.9 26.3 12.3 .3 .1 .85 12 24.8 .6 5.2 4.01975 38 27.3 37.1 354 29.0 22.4 235.4 195.6 132 23.5 5.7 58.6 41.4 .4 .3 .87 8 16.9 .2 1.6 .51979 42 30.8 41.8 247 35.1 22.7 267.6 241.8 103 26.5 5.7 66.4 52.6 .6 .5 .82 4 30.5 .3 3.6 3.21983 46 33.2 46.6 247 39.1 28.2 357.4 330.4 0 .0 .0 .0 .0 .0 .0 .00 0 .0 .0 .0 .01988 51 36.2 51.2 243 42.8 33.3 451.4 422.5 0 .0 .0 .0 .0 .0 .0 .00 4 46.7 .7 9.6 9.11993 56 40.2 55.8 239 46.4 38.6 569.5 537.3 0 .0 .0 .0 .0 .0 .0 .00 4 30.7 .3 4.6 4.1
1961 24 67.4 67.4 11.9 11.9 0.00 0.00 0.0 0.0 0.0 2.8 0.0 0.5 0.0 2.8 0.0 0.51965 28 140.6 141.7 46.8 46.8 .93 .94 1.9 2.0 18.3 5.0 8.7 1.7 18.6 5.1 8.7 1.71968 31 203.6 206.1 99.6 99.7 1.04 1.03 2.0 2.1 21.0 6.6 17.6 3.2 21.5 6.6 17.6 3.21971 34 267.0 274.7 160.3 164.3 .87 .91 1.6 1.8 21.2 7.9 20.2 4.7 22.9 8.1 21.5 4.81975 38 370.1 379.4 267.5 272.0 1.03 1.01 1.9 1.9 25.8 9.7 26.8 7.0 26.2 10.0 26.9 7.21979 42 468.8 481.7 366.3 374.0 .95 .97 1.5 1.6 24.7 11.2 24.7 8.7 25.6 11.5 25.5 8.91983 46 558.6 571.5 454.9 462.6 1.01 1.01 1.4 1.4 22.5 12.1 22.1 9.9 22.5 12.4 22.1 10.11988 51 652.5 675.0 547.0 563.8 .74 .77 1.0 1.2 18.8 12.8 18.4 10.7 20.7 13.2 20.2 11.11993 56 770.7 797.8 661.8 682.8 .72 .69 1.1 1.1 23.6 13.8 23.0 11.8 24.6 14.2 23.8 12.2
Cumulative yielde
QMD growthfBasal area
growth

101
a Average height (ht) and diameter at breast height (d.b.h.) of the 100 largest trees per hectare (estimated from d.b.h. and ht-d.b.h. curves).b Quadratic mean diameter at breast height.c All volumes are total stem cubic meters (CVTS) or merchantable cubic to a 15.25-cm top diameter inside bark (CV6).d Average d.b.h. cut/average d.b.h. before thinning.e
Cumulative yield: net = standing + thinning; gross = standing + thinning + mortality; yield does not include any volume removed in a calibration cut. Volume (CVTS) removed inthinnings = 103.3 cubic meters (19 percent of the total gross yield at the time of the last thinning). Volume (CVTS) in mortality = 33.4 cubic meters (4 percent of the total grossyield).f Net is QMD growth of trees alive at the start and end of the period; survivor is QMD growth of trees alive at the end of the period.g MAI = mean annual increment; PAI = periodic annual increment.
YearStandage
Table 65—Skykomish: Stand development for treatment 6, per-hectare basis (plots 6007, 6015, and 6033)
100 largesta
Ht D.b.h. QMDbTreesBasalarea CVTS d/Dd
After thinning Removed in thinning Mortality
Volumec Avg. volume
CV6 QMDbTreesBasalarea CVTS
Volume
CV6 QMDbTreesBasalarea CVTS
Volume
CV6
Years m Cm No. Cm m2 - - - - m3 - - - - No. Cm m2 - - - - - - - - m3 - - - - - - - - - No. Cm m2 - - - m3 - - -
YearStandage
NetCVTS
GrossCVTS
GrossCV6
NetCV6 Net Survivor
CVTSPAINet Gross
CVTSPAI
CVTSMAI
CV6PAI
CV6MAI
CV6PAI
CVTSMAI
CV6MAI
Net volume growthg Gross volume growth
Years - - - - - - - - - - - m3 - - - - - - - - - - - - - - Cm - - - - - - - m2 - - - - - - - - - - - - - - - - - - - - - - - - - m3 - - - - - - - - - - - - - - - - - - - - - - - - -
CVTS CV6
1961 24 14.7 20.6 869 13.1 11.7 67.5 12.3 0 0.0 0.0 0.0 0.0 0.0 0.0 0.00 0 0.0 0.0 0.0 0.01965 28 18.3 26.8 704 17.7 17.4 126.5 49.4 156 16.3 3.2 23.7 7.2 .2 .1 .93 8 13.8 .1 .8 .01968 31 20.8 30.5 659 20.9 22.5 184.5 104.4 41 21.1 1.4 12.3 7.4 .3 .2 1.01 4 13.9 .1 .5 .01971 34 22.8 33.9 613 23.7 27.0 241.9 168.4 41 21.0 1.4 12.7 7.2 .3 .2 .89 4 23.4 .2 1.6 1.21975 38 26.5 38.8 560 27.5 33.2 340.3 275.6 49 24.8 2.4 24.2 18.2 .5 .4 .91 4 29.5 .3 3.0 2.61979 42 29.9 43.4 515 30.9 38.3 437.5 378.2 41 28.2 2.6 30.3 25.6 .7 .6 .92 4 17.0 .1 1.0 .21983 46 33.0 47.8 498 33.7 44.2 554.8 495.4 0 .0 .0 .0 .0 .0 .0 .00 16 22.9 .7 7.7 5.41988 51 36.3 52.0 482 36.6 50.4 688.5 628.7 0 .0 .0 .0 .0 .0 .0 .00 16 21.9 .6 7.2 4.51993 56 39.4 56.0 465 39.3 55.9 813.4 752.7 0 .0 .0 .0 .0 .0 .0 .00 16 24.7 .8 11.5 8.6
1961 24 67.5 67.5 12.3 12.3 0.00 0.00 0.0 0.0 0.0 2.8 0.0 0.5 0.0 2.8 0.0 0.51965 28 150.1 151.0 56.6 56.6 1.09 1.09 2.2 2.2 20.7 5.4 11.1 2.0 20.9 5.4 11.1 2.01968 31 220.5 221.9 119.0 119.0 1.05 1.04 2.2 2.2 23.5 7.1 20.8 3.8 23.6 7.2 20.8 3.81971 34 290.7 293.7 190.2 191.3 .89 .89 2.0 2.0 23.4 8.5 23.7 5.6 23.9 8.6 24.1 5.61975 38 413.3 419.3 315.5 319.3 .90 .91 2.1 2.2 30.6 10.9 31.3 8.3 31.4 11.0 32.0 8.41979 42 540.8 547.9 443.7 447.7 .79 .77 1.9 2.0 31.9 12.9 32.0 10.6 32.1 13.0 32.1 10.71983 46 658.1 672.9 560.9 570.3 .71 .65 1.5 1.6 29.3 14.3 29.3 12.2 31.3 14.6 30.6 12.41988 51 791.8 813.8 694.2 708.1 .58 .51 1.2 1.4 26.7 15.5 26.7 13.6 28.2 16.0 27.6 13.91993 56 916.7 950.2 818.3 840.8 .53 .46 1.1 1.3 25.0 16.4 24.8 14.6 27.3 17.0 26.5 15.0
Cumulative yielde
QMD growthfBasal area
growth

102
a Average height (ht) and diameter at breast height (d.b.h.) of the 100 largest trees per hectare (estimated from d.b.h. and ht-d.b.h. curves).b Quadratic mean diameter at breast height.c All volumes are total stem cubic meters (CVTS) or merchantable cubic to a 15.25-cm top diameter inside bark (CV6).d Average d.b.h. cut/average d.b.h. before thinning.e
Cumulative yield: net = standing + thinning; gross = standing + thinning + mortality; yield does not include any volume removed in a calibration cut. Volume (CVTS) removed inthinnings = 137.9 cubic meters (28 percent of the total gross yield at the time of the last thinning). Volume (CVTS) in mortality = 50.8 cubic meters (6 percent of the total grossyield).f Net is QMD growth of trees alive at the start and end of the period; survivor is QMD growth of trees alive at the end of the period.g MAI = mean annual increment; PAI = periodic annual increment.
YearStandage
Table 66—Skykomish: Stand development for treatment 8, per-hectare basis (plots 6008, 6025, and 6037)
100 largesta
Ht D.b.h. QMDbTreesBasalarea CVTS d/Dd
After thinning Removed in thinning Mortality
Volumec Avg. volume
CV6 QMDbTreesBasalarea CVTS
Volume
CV6 QMDbTreesBasalarea CVTS
Volume
CV6
Years m Cm No. Cm m2 - - - - m3 - - - - No. Cm m2 - - - - - - - - m3 - - - - - - - - - No. Cm m2 - - - m3 - - -
YearStandage
NetCVTS
GrossCVTS
GrossCV6
NetCV6 Net Survivor
CVTSPAINet Gross
CVTSPAI
CVTSMAI
CV6PAI
CV6MAI
CV6PAI
CVTSMAI
CV6MAI
Net volume growthg Gross volume growth
Years - - - - - - - - - - - m3 - - - - - - - - - - - - - - Cm - - - - - - - m2 - - - - - - - - - - - - - - - - - - - - - - - - - m3 - - - - - - - - - - - - - - - - - - - - - - - - -
CVTS CV6
1961 24 14.0 20.7 889 13.0 11.8 64.8 11.9 0 0.0 0.0 0.0 0.0 0.0 0.0 0.00 0 0.0 0.0 0.0 0.01965 28 18.0 26.6 762 17.1 17.4 124.9 47.8 124 16.1 2.5 18.0 5.9 .1 .1 .95 4 9.1 .0 .2 .01968 31 21.3 29.7 692 20.0 21.7 177.9 98.1 58 18.9 1.6 12.9 5.9 .2 .1 .95 12 15.1 .2 1.7 .11971 34 23.0 32.8 622 22.6 25.0 225.4 149.1 49 21.4 1.8 16.0 9.5 .3 .2 .95 21 17.0 .5 3.7 1.71975 38 27.5 37.4 519 26.5 28.5 302.9 238.1 86 23.8 3.8 40.3 29.2 .5 .4 .91 16 20.5 .5 5.4 2.91979 42 30.0 41.6 428 30.2 30.7 349.2 299.4 86 25.9 4.5 50.7 39.9 .6 .5 .88 4 11.9 .0 .4 .01983 46 32.8 45.6 424 33.1 36.5 458.3 405.7 0 .0 .0 .0 .0 .0 .0 .00 4 15.8 .1 .8 .11988 51 37.3 49.8 416 36.1 42.5 586.5 533.5 0 .0 .0 .0 .0 .0 .0 .00 8 20.0 .3 2.8 1.41993 56 41.2 52.9 375 39.2 45.1 684.7 633.0 0 .0 .0 .0 .0 .0 .0 .00 41 28.1 2.5 35.9 30.0
1961 24 64.8 64.8 11.9 11.9 0.00 0.00 0.0 0.0 0.0 2.7 0.0 0.5 0.0 2.7 0.0 0.51965 28 143.0 143.1 53.7 53.7 .99 .99 2.0 2.1 19.5 5.1 10.5 1.9 19.6 5.1 10.5 1.91968 31 208.8 210.7 109.8 109.9 .94 .93 2.0 2.0 21.9 6.7 18.7 3.5 22.5 6.8 18.7 3.51971 34 272.3 277.9 170.4 172.2 .86 .83 1.7 1.9 21.2 8.0 20.2 5.0 22.4 8.2 20.8 5.11975 38 390.1 401.0 288.6 293.4 .87 .85 1.8 2.0 29.5 10.3 29.6 7.6 30.8 10.6 30.3 7.71979 42 487.1 498.4 389.8 394.5 .77 .75 1.7 1.7 24.2 11.6 25.3 9.3 24.3 11.9 25.3 9.41983 46 596.2 608.3 496.1 500.9 .72 .70 1.4 1.5 27.3 13.0 26.6 10.8 27.5 13.2 26.6 10.91988 51 724.4 739.3 623.9 630.1 .59 .55 1.2 1.2 25.6 14.2 25.6 12.2 26.2 14.5 25.8 12.41993 56 822.6 873.4 723.5 759.6 .63 .46 .5 1.0 19.6 14.7 19.9 12.9 26.8 15.6 25.9 13.6
Cumulative yielde
QMD growthfBasal area
growth

103
a Average height (ht) and diameter at breast height (d.b.h.) of the 100 largest trees per hectare (estimated from d.b.h. and ht-d.b.h. curves).b Quadratic mean diameter at breast height.c All volumes are total stem cubic meters (CVTS) or merchantable cubic to a 15.25-cm top diameter inside bark (CV6).d Average d.b.h. cut/average d.b.h. before thinning.e
Cumulative yield: net = standing + thinning; gross = standing + thinning + mortality; yield does not include any volume removed in a calibration cut. Volume (CVTS) in mortality =167.6 cubic meters (15 percent of the total gross yield).f Net is QMD growth of trees alive at the start and end of the period; survivor is QMD growth of trees alive at the end of the period.g MAI = mean annual increment; PAI = periodic annual increment.
YearStandage
Table 67—Skykomish: Stand development for control, per-hectare basis (plots 6002, 6014, 6038, and 6039)
100 largesta
Ht D.b.h. QMDbTreesBasalarea CVTS d/Dd
After thinning Removed in thinning Mortality
Volumec Avg. volume
CV6 QMDbTreesBasalarea CVTS
Volume
CV6 QMDbTreesBasalarea CVTS
Volume
CV6
Years m Cm No. Cm m2 - - - - m3 - - - - No. Cm m2 - - - - - - - - m3 - - - - - - - - - No. Cm m2 - - - m3 - - -
YearStandage
NetCVTS
GrossCVTS
GrossCV6
NetCV6 Net Survivor
CVTSPAINet Gross
CVTSPAI
CVTSMAI
CV6PAI
CV6MAI
CV6PAI
CVTSMAI
CV6MAI
Net volume growthg Gross volume growth
Years - - - - - - - - - - - m3 - - - - - - - - - - - - - - Cm - - - - - - - m2 - - - - - - - - - - - - - - - - - - - - - - - - - m3 - - - - - - - - - - - - - - - - - - - - - - - - -
CVTS CV6
1961 24 13.8 20.5 1467 12.1 16.6 88.6 12.4 0 0.0 0.0 0.0 0.0 0.0 0.0 0.00 0 0.0 0.0 0.0 0.01965 28 17.5 25.1 1467 14.8 25.0 172.9 45.7 0 .0 .0 .0 .0 .0 .0 .00 0 .0 .0 .0 .01968 31 20.5 28.3 1454 16.9 32.0 258.9 98.3 0 .0 .0 .0 .0 .0 .0 .00 12 12.8 .2 1.2 .01971 34 23.3 31.1 1436 18.6 38.3 353.4 169.0 0 .0 .0 .0 .0 .0 .0 .00 19 11.9 .2 1.7 .21975 38 27.1 35.0 1300 21.1 44.8 463.7 286.7 0 .0 .0 .0 .0 .0 .0 .00 136 14.4 2.2 20.5 5.91979 42 30.8 38.8 1161 23.8 50.2 584.4 413.7 0 .0 .0 .0 .0 .0 .0 .00 139 13.7 2.1 20.2 3.11983 46 34.0 42.7 1047 26.2 55.6 724.4 559.6 0 .0 .0 .0 .0 .0 .0 .00 114 14.6 1.9 21.1 2.71988 51 37.3 46.8 951 29.0 61.4 847.9 704.5 0 .0 .0 .0 .0 .0 .0 .00 96 16.5 2.0 22.7 6.71993 56 40.7 50.4 750 32.9 62.2 931.8 820.0 0 .0 .0 .0 .0 .0 .0 .00 201 19.8 6.2 80.3 43.4
1961 24 88.6 88.6 12.4 12.4 0.00 0.00 0.0 0.0 0.0 3.7 0.0 0.5 0.0 3.7 0.0 0.51965 28 172.9 172.9 45.7 45.7 .69 .69 2.1 2.1 21.1 6.2 8.3 1.6 21.1 6.2 8.3 1.61968 31 258.9 260.1 98.3 98.3 .68 .68 2.3 2.4 28.7 8.4 17.5 3.2 29.1 8.4 17.5 3.21971 34 353.4 356.3 169.0 169.2 .57 .56 2.1 2.2 31.5 10.4 23.6 5.0 32.1 10.5 23.6 5.01975 38 463.7 487.1 286.7 292.8 .64 .55 1.6 2.2 27.6 12.2 29.4 7.5 32.7 12.8 30.9 7.71979 42 584.4 628.0 413.7 422.9 .65 .47 1.4 1.9 30.2 13.9 31.8 9.8 35.2 15.0 32.5 10.11983 46 724.4 789.0 559.6 571.6 .62 .45 1.3 1.8 35.0 15.7 36.5 12.2 40.2 17.2 37.2 12.41988 51 847.9 935.2 704.5 723.1 .55 .39 1.2 1.6 24.7 16.6 29.0 13.8 29.2 18.3 30.3 14.21993 56 931.8 1099.4 820.0 882.0 .78 .38 .2 1.4 16.8 16.6 23.1 14.6 32.8 19.6 31.8 15.7
Cumulative yielde
QMD growth fBasal area
growth

104 Table 68—Skykomish: Trees per hectare, 1961–1993, by treatment, plot, and period
Calibrationperiod
1961–1965a
Age (years)
Treatment Plot 24 28
Treatmentperiod 1
1965–1968a
Age (years)
Treatmentperiod 2
1968–1971a
Age (years)
Treatmentperiod 3
1971–1975a
Age (years)
Treatmentperiod 4
1975–1979a
Age (years)
Treatmentperiod 5
1979–1983a
Age (years)
Treatmentperiod 6
1983–1988a
Age (years)
Treatmentperiod 7
1988–1993a
Age (years)
28 31 31 34 34 38 38 42 42 46 46 51 51 56
a Columns are measurements after treatment and just before next treatment.
1 6010 1,013 1,000 556 531 408 408 259 259 148 148 124 124 124 124 124 1246022 716 716 395 395 296 296 185 185 136 136 111 111 111 111 111 1116034 790 790 420 420 321 321 247 247 173 173 136 136 136 136 136 136
Avg. 840 836 457 449 342 342 231 231 152 152 124 124 124 124 124 124
2 6005 926 926 580 580 457 445 395 383 321 321 284 284 284 272 272 2596012 840 840 519 519 420 420 358 358 284 284 247 247 247 247 247 2476026 963 963 531 519 420 420 333 333 309 309 259 259 259 259 259 259
Avg. 910 910 543 539 432 428 362 358 305 305 263 263 263 259 259 255
3 6016 1,013 1,013 630 630 506 506 395 395 284 284 210 210 210 210 210 2106031 840 840 531 531 457 457 371 371 272 259 210 210 210 210 210 2106036 926 926 679 679 556 556 457 457 333 333 259 259 259 247 247 247
Avg. 926 926 613 613 506 506 408 408 296 292 226 226 226 222 222 222
4 6001 815 815 494 494 420 420 346 346 309 309 284 284 284 284 284 2846023 778 778 457 457 395 395 346 346 296 296 284 284 284 284 284 2846035 741 741 506 506 445 445 408 408 358 358 333 333 333 296 296 272
Avg. 778 778 486 486 420 420 366 366 321 321 301 301 301 288 288 280
5 6009 1,037 1,025 827 790 741 729 679 679 593 593 519 519 519 519 519 5196011 840 840 692 692 618 618 543 543 482 482 408 408 408 408 408 4086028 815 815 580 580 519 519 457 445 395 395 346 346 346 346 346 346
Avg. 897 893 700 687 626 622 560 556 490 490 424 424 424 424 424 424
6 6007 790 790 630 630 531 506 445 445 333 333 247 247 247 235 235 2226015 865 852 618 605 494 494 383 371 259 259 173 173 173 173 173 1736033 1,198 1,173 914 877 803 790 655 642 469 457 321 321 321 321 321 321
Avg. 951 939 720 704 609 597 494 486 354 350 247 247 247 243 243 239
7 6021 815 803 667 667 618 618 568 568 519 506 469 445 445 445 445 4206027 926 926 766 766 716 716 667 655 618 618 568 556 556 556 556 5316030 865 852 679 667 642 630 605 605 543 543 506 494 494 445 445 445
Avg. 869 860 704 700 659 655 613 609 560 556 515 498 498 482 482 465
8 6008 840 840 741 741 667 655 593 568 494 494 420 420 420 420 420 4206025 902 889 741 704 679 655 605 605 506 506 420 408 408 408 408 3466037 926 926 803 803 729 704 667 642 556 543 445 445 445 420 420 358
Avg. 889 885 762 749 692 671 622 605 519 515 428 424 424 416 416 375
Control 6002 1,939 1,939 1,939 1,914 1,914 1,865 1,865 1,618 1,618 1,445 1,445 1,272 1272 1,161 1,161 9396014 1,309 1,309 1,309 1,309 1,309 1,284 1,284 1,272 1,272 1,124 1,124 1,025 1,025 976 976 8036038 1,050 1,050 1,050 1,050 1,050 1,050 1,050 926 926 815 815 778 778 692 692 6056039 1,568 1,568 1,568 1,544 1,544 1,544 1,544 1,383 1,383 1,260 1,260 1,112 1,112 976 976 655
Avg. 1,467 1,467 1,467 1,454 1,454 1,436 1,436 1,300 1,300 1,161 1,161 1,047 1,047 951 951 750
Number of trees per hectare

105
Table 69—Skykomish: Basal area per hectare, 1961–1993, by treatment, plot, and period
Calibrationperiod
1961–1965a
Age (years)
Treatment Plot 24 28
Treatmentperiod 1
1965–1968a
Age (years)
Treatmentperiod 2
1968–1971a
Age (years)
Treatmentperiod 3
1971–1975a
Age (years)
Treatmentperiod 4
1975–1979a
Age (years)
Treatmentperiod 5
1979–1983a
Age (years)
Treatmentperiod 6
1983–1988a
Age (years)
Treatmentperiod 7
1988–1993a
Age (years)
28 31 31 34 34 38 38 42 42 46 46 51 51 56
a Columns are measurements after treatment and just before next treatment.
1 6010 11.8 20.5 12.4 17.4 13.7 18.6 13.9 19.9 14.5 19.2 15.6 19.6 19.6 23.9 23.9 27.56022 11.8 19.5 12.5 17.3 13.6 17.8 13.9 19.2 14.8 19.0 15.7 19.4 19.4 23.3 23.3 27.66034 11.6 20.0 12.2 16.8 13.4 17.4 13.9 19.3 14.7 19.1 15.5 19.1 19.1 23.0 23.0 27.3
Avg. 11.7 20.0 12.4 17.2 13.6 17.9 13.9 19.5 14.7 19.1 15.6 19.3 19.3 23.4 23.4 27.5
2 6005 11.5 18.4 12.7 17.6 13.9 17.4 16.0 22.1 19.5 25.7 23.2 28.4 28.4 31.8 31.8 36.36012 11.4 18.8 12.5 17.6 13.8 18.1 15.9 22.4 19.5 24.9 22.0 26.8 26.8 31.7 31.7 35.76026 11.8 21.4 12.5 17.4 14.3 19.0 15.9 22.4 20.2 26.3 23.1 27.9 27.9 33.2 33.2 38.3
Avg. 11.6 19.6 12.6 17.5 14.0 18.2 15.9 22.3 19.7 25.6 22.8 27.7 27.7 32.2 32.2 36.7
3 6016 11.5 20.6 14.2 20.4 16.4 21.4 18.3 25.5 20.8 26.9 23.2 28.5 28.5 34.3 34.3 39.86031 11.8 19.7 14.1 19.3 16.3 21.1 18.3 25.2 20.9 25.7 23.1 28.2 28.2 33.8 33.8 38.66036 11.7 18.5 14.2 19.5 16.2 21.3 18.3 26.0 21.0 27.4 23.3 29.1 29.1 35.0 35.0 41.1
Avg. 11.7 19.6 14.2 19.7 16.3 21.3 18.3 25.6 20.9 26.7 23.2 28.6 28.6 34.4 34.4 39.8
4 6001 11.8 19.7 14.2 19.6 17.1 22.3 20.3 27.3 25.6 32.2 30.9 36.8 36.8 42.7 42.7 48.06023 11.7 20.7 14.1 19.7 17.0 22.2 20.3 27.7 25.6 31.4 30.6 36.6 36.6 42.3 42.3 46.76035 11.8 19.2 14.2 19.2 17.0 21.9 20.3 28.2 25.6 31.9 30.8 36.5 36.5 37.7 37.7 39.8
Avg. 11.8 19.9 14.2 19.5 17.0 22.1 20.3 27.7 25.6 31.8 30.8 36.6 36.6 40.9 40.9 44.8
5 6009 11.4 18.9 15.7 20.6 19.5 24.3 22.6 30.3 27.1 34.0 30.8 37.2 37.2 43.9 43.9 50.46011 11.8 18.6 15.8 21.4 19.5 24.5 22.5 29.9 27.1 34.4 30.8 37.5 37.5 44.4 44.4 50.86028 12.1 20.7 15.8 21.7 19.6 24.8 22.6 29.8 27.1 33.4 30.8 36.8 36.8 43.2 43.2 49.6
Avg. 11.8 19.4 15.8 21.2 19.5 24.5 22.6 30.0 27.1 33.9 30.8 37.1 37.1 43.8 43.8 50.3
6 6007 11.8 18.9 15.9 21.9 18.8 22.4 20.6 27.8 22.5 28.5 23.2 28.3 28.3 31.3 31.3 35.26015 11.9 20.2 16.1 22.5 18.8 24.3 20.7 27.7 22.4 28.5 22.7 28.3 28.3 34.2 34.2 39.96033 11.6 19.4 15.4 20.7 18.9 24.0 20.7 28.8 22.3 28.3 22.3 28.3 28.3 34.6 34.6 40.8
Avg. 11.8 19.5 15.8 21.7 18.8 23.6 20.7 28.1 22.4 28.4 22.8 28.3 28.3 33.4 33.4 38.6
7 6021 11.8 20.9 17.4 24.4 22.7 29.0 27.0 36.0 33.3 41.0 38.3 43.7 43.7 50.9 50.9 56.56027 11.6 20.5 17.5 24.1 22.5 28.6 27.0 35.0 33.2 41.1 38.4 44.6 44.6 51.4 51.4 56.66030 11.8 20.6 17.3 23.4 22.4 27.8 27.1 35.9 33.2 40.8 38.4 44.6 44.6 49.1 49.1 55.0
Avg. 11.7 20.6 17.4 24.0 22.5 28.5 27.0 35.6 33.2 41.0 38.4 44.3 44.3 50.5 50.5 56.0
8 6008 12.0 20.0 17.5 23.9 21.9 27.0 25.0 32.8 28.6 35.5 30.7 36.6 36.6 42.4 42.4 48.16025 11.9 20.2 17.4 22.6 21.8 27.3 25.0 32.8 28.5 35.5 30.8 36.6 36.6 43.4 43.4 46.66037 11.4 19.8 17.5 23.5 21.4 26.2 25.0 31.6 28.6 34.9 30.7 36.4 36.4 41.8 41.8 40.8
Avg. 11.8 20.0 17.4 23.3 21.7 26.8 25.0 32.4 28.6 35.3 30.7 36.5 36.5 42.5 42.5 45.2
Control 6002 20.1 29.0 29.0 36.2 36.2 42.6 42.6 47.9 47.9 52.1 52.1 56.3 56.3 61.1 61.1 61.26014 14.4 22.8 22.8 29.8 29.8 35.7 35.7 43.8 43.8 49.3 49.3 53.7 53.7 59.8 59.8 62.06038 12.5 19.6 19.6 25.9 25.9 31.9 31.9 38.4 38.4 44.6 44.6 51.3 51.3 56.7 56.7 61.46039 19.7 28.6 28.6 36.3 36.3 43.1 43.1 49.4 49.4 55.2 55.2 61.5 61.5 68.5 68.5 64.7
Avg. 16.7 25.0 25.0 32.0 32.0 38.3 38.3 44.9 44.9 50.3 50.3 55.7 55.7 61.5 61.5 62.3
Square meters per hectare

106 Table 70—Skykomish: Quadratic mean diameter, 1961–1993, by treatment, plot, and period
Calibrationperiod
1961–1965a
Age (years)
Treatment Plot 24 28
Treatmentperiod 1
1965–1968a
Age (years)
Treatmentperiod 2
1968–1971a
Age (years)
Treatmentperiod 3
1971–1975a
Age (years)
Treatmentperiod 4
1975–1979a
Age (years)
Treatmentperiod 5
1979–1983a
Age (years)
Treatmentperiod 6
1983–1988a
Age (years)
Treatmentperiod 7
1988–1993a
Age (years)
28 31 31 34 34 38 38 42 42 46 46 51 51 56
a Columns are measurements after treatment and just before next treatment.
1 6010 12.2 16.2 16.9 20.4 20.7 24.1 26.2 31.2 35.3 40.6 40.0 44.9 44.9 49.7 49.7 53.36022 14.5 18.6 20.1 23.6 24.1 27.6 30.9 36.4 37.3 42.2 42.4 47.1 47.1 51.7 51.7 56.36034 13.7 17.9 19.2 22.5 23.1 26.3 26.8 31.5 32.9 37.6 38.1 42.3 42.3 46.5 46.5 50.6
Avg. 13.4 17.6 18.7 22.2 22.6 26.0 28.0 33.0 35.1 40.1 40.2 44.8 44.8 49.3 49.3 53.4
2 6005 12.6 15.9 16.7 19.6 19.7 22.3 22.7 27.1 27.8 32.0 32.3 35.7 35.7 38.6 38.6 42.26012 13.1 16.9 17.5 20.8 20.4 23.4 23.8 28.2 29.5 33.4 33.7 37.1 37.1 40.4 40.4 42.96026 12.5 16.8 17.3 20.7 20.8 24.0 24.6 29.2 28.9 33.0 33.7 37.0 37.0 40.4 40.4 43.4
Avg. 12.7 16.5 17.2 20.4 20.3 23.3 23.7 28.2 28.7 32.8 33.2 36.6 36.6 39.8 39.8 42.8
3 6016 12.0 16.1 17.0 20.3 20.3 23.2 24.3 28.7 30.6 34.7 37.5 41.6 41.6 45.6 45.6 49.16031 13.4 17.3 18.4 21.5 21.3 24.2 25.1 29.4 31.3 35.6 37.4 41.4 41.4 45.3 45.3 48.46036 12.7 15.9 16.3 19.1 19.3 22.1 22.6 26.9 28.3 32.3 33.8 37.8 37.8 42.5 42.5 46.0
Avg. 12.7 16.4 17.2 20.3 20.3 23.2 24.0 28.3 30.1 34.2 36.2 40.2 40.2 44.5 44.5 47.8
4 6001 13.6 17.6 19.1 22.5 22.8 26.0 27.3 31.7 32.5 36.4 37.2 40.6 40.6 43.8 43.8 46.46023 13.9 18.4 19.8 23.4 23.4 26.8 27.4 31.9 33.2 36.7 37.1 40.5 40.5 43.6 43.6 45.86035 14.2 18.2 18.9 22.0 22.1 25.1 25.2 29.7 30.2 33.7 34.3 37.3 37.3 40.2 40.2 43.2
Avg. 13.9 18.0 19.3 22.6 22.7 25.9 26.6 31.1 31.9 35.6 36.2 39.5 39.5 42.5 42.5 45.1
5 6009 11.8 15.3 15.6 18.2 18.3 20.6 20.6 23.8 24.1 27.0 27.5 30.2 30.2 32.8 32.8 35.26011 13.4 16.8 17.1 19.8 20.0 22.5 22.9 26.5 26.7 30.1 31.0 34.2 34.2 37.2 37.2 39.86028 13.7 18.0 18.6 21.8 22.0 24.7 25.1 29.2 29.5 32.8 33.7 36.8 36.8 39.9 39.9 42.7
Avg. 13.0 16.7 17.1 20.0 20.1 22.6 22.9 26.5 26.8 30.0 30.7 33.7 33.7 36.7 36.7 39.2
6 6007 13.8 17.4 17.9 21.1 21.2 23.7 24.3 28.2 29.3 33.0 34.6 38.2 38.2 41.2 41.2 44.96015 13.2 17.4 18.2 21.8 22.0 25.0 26.2 30.9 33.2 37.4 40.9 45.6 45.6 50.2 50.2 54.26033 11.1 14.5 14.6 17.4 17.3 19.6 20.0 23.9 24.6 28.1 29.7 33.5 33.5 37.0 37.0 40.2
Avg. 12.7 16.4 16.9 20.1 20.2 22.8 23.5 27.7 29.0 32.8 35.1 39.1 39.1 42.8 42.8 46.4
7 6021 13.6 18.2 18.2 21.6 21.6 24.4 24.6 28.4 28.6 32.1 32.3 35.4 35.4 38.2 38.2 41.46027 12.6 16.8 17.0 20.0 20.0 22.5 22.7 26.1 26.2 29.1 29.3 32.0 32.0 34.3 34.3 36.86030 13.2 17.5 18.0 21.1 21.1 23.7 23.9 27.5 27.9 30.9 31.1 33.9 33.9 37.5 37.5 39.7
Avg. 13.1 17.5 17.8 20.9 20.9 23.6 23.7 27.3 27.6 30.7 30.9 33.7 33.7 36.7 36.7 39.3
8 6008 13.5 17.4 17.3 20.3 20.4 22.9 23.2 27.1 27.1 30.2 30.5 33.3 33.3 35.9 35.9 38.26025 13.0 17.0 17.3 20.2 20.2 23.0 23.0 26.3 26.8 29.9 30.6 33.8 33.8 36.8 36.8 41.46037 12.5 16.5 16.6 19.3 19.4 21.8 21.9 25.0 25.6 28.6 29.7 32.3 32.3 35.6 35.6 38.1
Avg. 13.0 17.0 17.1 19.9 20.0 22.6 22.7 26.1 26.5 29.6 30.2 33.1 33.1 36.1 36.1 39.2
Control 6002 11.5 13.8 13.8 15.5 15.5 17.1 17.1 19.4 19.4 21.4 21.4 23.7 23.7 25.9 25.9 28.86014 11.8 14.9 14.9 17.0 17.0 18.8 18.8 20.9 20.9 23.6 23.6 25.8 25.8 27.9 27.9 31.46038 12.3 15.4 15.4 17.7 17.7 19.7 19.7 23.0 23.0 26.4 26.4 29.0 29.0 32.3 32.3 35.96039 12.6 15.3 15.3 17.3 17.3 18.9 18.9 21.3 21.3 23.6 23.6 26.5 26.5 29.9 29.9 35.5
Avg. 12.1 14.8 14.8 16.9 16.9 18.6 18.6 21.2 21.2 23.8 23.8 26.3 26.3 29.0 29.0 32.9
Centimeters

107
Table 71—Skykomish: Total stem volume per hectare, 1961–1993, by treatment, plot, and period
Calibrationperiod
1961–1965a
Age (years)
Treatment Plot 24 28
Treatmentperiod 1
1965–1968a
Age (years)
Treatmentperiod 2
1968–1971a
Age (years)
Treatmentperiod 3
1971–1975a
Age (years)
Treatmentperiod 4
1975–1979a
Age (years)
Treatmentperiod 5
1979–1983a
Age (years)
Treatmentperiod 6
1983–1988a
Age (years)
Treatmentperiod 7
1988–1993a
Age (years)
28 31 31 34 34 38 38 42 42 46 46 51 51 56
a Columns are measurements after treatment and just before next treatment.
1 6010 69 150 91 143 112 171 129 207 152 220 177 240 240 311 311 3926022 71 149 98 150 118 171 136 209 162 225 185 246 246 313 313 3996034 67 144 90 141 113 163 131 204 156 226 183 242 242 309 309 395
Avg. 69 148 93 144 115 168 132 207 157 224 182 243 243 311 311 395
2 6005 60 124 87 139 109 152 140 232 205 297 269 366 366 445 445 5426012 63 132 88 143 111 161 143 239 208 286 254 342 342 435 435 5276026 64 153 90 146 119 176 149 250 226 320 282 382 382 486 486 593
Avg. 62 136 88 142 113 163 144 240 213 301 268 363 363 455 455 554
3 6016 64 143 100 161 129 192 165 264 216 306 264 346 346 460 460 5726031 66 139 100 154 129 190 166 261 218 295 264 351 351 461 461 5716036 65 124 96 142 119 182 157 256 210 300 257 345 345 459 459 587
Avg. 65 135 99 152 126 188 162 261 215 301 262 347 347 460 460 577
4 6001 63 134 98 151 132 200 183 284 266 363 348 459 459 573 573 6906023 64 144 102 158 137 206 190 293 270 362 353 461 461 585 585 6916035 63 130 98 150 133 199 185 303 276 371 359 468 468 526 526 600
Avg. 64 136 99 153 134 202 186 293 271 365 353 463 463 561 561 661
5 6009 62 129 108 164 155 219 204 324 290 408 369 485 485 607 607 7526011 67 130 112 174 159 225 207 325 294 410 367 485 485 611 611 7486028 69 148 115 180 163 229 209 320 291 399 368 480 480 598 598 742
Avg. 66 136 111 173 159 224 207 323 292 406 368 483 483 605 605 747
6 6007 70 140 119 185 158 213 197 298 242 342 279 365 365 431 431 5296015 69 149 120 185 155 223 190 292 236 334 267 352 352 455 455 5786033 63 133 105 163 148 216 186 293 229 326 257 356 356 468 468 602
Avg. 67 141 115 178 154 217 191 294 236 334 268 358 358 452 452 570
7 6021 70 154 129 204 189 263 245 373 346 477 445 552 552 698 698 8236027 65 148 126 196 182 254 241 355 337 465 433 554 554 697 697 8206030 67 149 125 191 182 247 240 365 338 462 435 559 559 672 672 798
Avg. 67 150 127 197 185 255 242 365 340 468 438 555 555 689 689 814
8 6008 67 145 128 199 182 248 229 354 310 405 352 461 461 585 585 7286025 65 144 123 184 178 243 223 343 299 399 345 454 454 592 592 7076037 62 140 124 189 174 234 224 333 301 396 351 461 461 583 583 621
Avg. 65 143 125 191 178 241 225 343 303 400 349 459 459 587 587 685
Control 6002 107 202 202 293 293 396 396 493 493 607 607 744 744 843 843 9166014 76 158 158 241 241 329 329 452 452 573 573 697 697 821 821 9226038 66 133 133 207 207 291 291 398 398 518 518 658 658 780 780 9156039 106 199 199 295 295 398 398 513 513 641 641 800 800 949 949 975
Avg. 89 173 173 259 259 354 354 464 464 585 585 725 725 848 848 932
Cubic meters per hectare

108
1963 19 33.5 33.5 0.2 0.2 0.00 0.00 0.0 0.0 0.0 1.8 0.0 0.0 0.0 1.8 0.0 0.01966 22 72.4 72.4 8.4 8.4 1.05 1.05 1.9 1.9 13.0 3.3 2.7 .4 13.0 3.3 2.7 .41970 26 122.9 124.1 42.4 42.5 1.06 1.06 1.5 1.5 12.6 4.7 8.5 1.6 12.9 4.8 8.5 1.61973 29 163.3 164.5 81.7 81.8 1.18 1.18 1.4 1.4 13.5 5.6 13.1 2.8 13.5 5.7 13.1 2.81976 32 204.3 206.2 125.9 126.1 1.37 1.35 1.3 1.3 13.7 6.4 14.7 3.9 13.9 6.4 14.8 3.91980 36 256.4 258.3 179.5 179.7 1.21 1.21 1.0 1.0 13.0 7.1 13.4 5.0 13.0 7.2 13.4 5.01984 40 297.9 299.7 221.2 221.4 1.05 1.05 .8 .8 10.4 7.4 10.4 5.5 10.4 7.5 10.4 5.51989 45 364.8 366.6 286.9 287.1 1.01 1.01 .9 .9 13.4 8.1 13.1 6.4 13.4 8.1 13.1 6.41994 50 441.0 442.8 360.9 361.1 .90 .90 .9 .9 15.2 8.8 14.8 7.2 15.2 8.9 14.8 7.2
1963 19 9.6 14.6 976 10.5 8.4 33.5 0.2 0 0.0 0.0 0.0 0.0 0.0 0.0 0.00 0 0.0 0.0 0.0 0.01966 22 12.7 18.7 597 13.8 8.9 45.5 4.7 379 13.4 5.3 26.9 3.7 .1 .0 .98 0 .0 .0 .0 .01970 26 16.3 23.1 371 18.3 9.7 63.1 26.1 210 17.6 5.1 33.0 12.6 .2 .1 .98 16 12.5 .2 1.2 .11973 29 19.0 26.4 259 22.6 10.3 77.4 51.1 111 20.0 3.5 26.0 14.3 .2 .2 .92 0 .0 .0 .0 .01976 32 21.2 30.6 185 27.4 10.9 91.3 75.3 70 24.4 3.3 27.2 20.0 .4 .3 .92 4 16.8 .1 .7 .11980 36 24.3 35.1 140 32.1 11.3 107.3 96.6 45 32.4 3.7 36.1 32.3 .8 .7 1.01 0 .0 .0 .0 .01984 40 26.5 38.1 140 36.4 14.5 148.8 138.3 0 .0 .0 .0 .0 .0 .0 .00 0 .0 .0 .0 .01989 45 30.3 43.6 140 41.4 18.8 215.6 204.0 0 .0 .0 .0 .0 .0 .0 .00 0 .0 .0 .0 .01994 50 34.0 48.5 140 45.9 23.2 291.9 278.0 0 .0 .0 .0 .0 .0 .0 .00 0 .0 .0 .0 .0
a Average height (ht) and diameter at breast height (d.b.h.) of the 100 largest trees per hectare (estimated from d.b.h. and ht-d.b.h. curves).b Quadratic mean diameter at breast height.c All volumes are total stem cubic meters (CVTS) or merchantable cubic to a 15.25-cm top diameter inside bark (CV6).d Average d.b.h. cut/average d.b.h. before thinning.e Cumulative yield: net = standing + thinning; gross = standing + thinning + mortality; yield does not include any volume removed in a calibration cut. Volume (CVTS) removed inthinnings = 149.1 cubic meters (58 percent of the total gross yield at the time of the last thinning). Volume (CVTS) in mortality = 1.9 cubic meters (<1 percent of the total grossyield).f Net is QMD growth of trees alive at the start and end of the period; survivor is QMD growth of trees alive at the end of the period.g MAI = mean annual increment; PAI = periodic annual increment.
Ap
pen
dix 5: C
lemo
ns M
etric Tables
YearStandage
Table 72—Clemons: Stand development for treatment 1, per-hectare basis (plots 63, 64, and 69)
100 largesta
Ht D.b.h. QMDbTreesBasalarea CVTS d/Dd
After thinning Removed in thinning Mortality
Volumec Avg. volume
CV6 QMDbTreesBasalarea CVTS
Volume
CV6 QMDbTreesBasalarea CVTS
Volume
CV6
Years m Cm No. Cm m2 - - - - m3 - - - - No. Cm m2 - - - - - - - - m3 - - - - - - - - - No. Cm m2 - - - m3 - - -
YearStandage
NetCVTS
GrossCVTS
GrossCV6
NetCV6 Net Survivor
CVTSPAINet Gross
CVTSPAI
CVTSMAI
CV6PAI
CV6MAI
CV6PAI
CVTSMAI
CV6MAI
Net volume growthg Gross volume growth
Years - - - - - - - - - - - m3 - - - - - - - - - - - - - - Cm - - - - - - - m2 - - - - - - - - - - - - - - - - - - - - - - - - - m3 - - - - - - - - - - - - - - - - - - - - - - - - -
CVTS CV6
Cumulative yielde
QMD growthfBasal area
growth

109
a Average height (ht) and diameter at breast height (d.b.h.) of the 100 largest trees per hectare (estimated from d.b.h. and ht-d.b.h. curves).b Quadratic mean diameter at breast height.c All volumes are total stem cubic meters (CVTS) or merchantable cubic to a 15.25-cm top diameter inside bark (CV6).d Average d.b.h. cut/average d.b.h. before thinning.e Cumulative yield: net = standing + thinning; gross = standing + thinning + mortality; yield does not include any volume removed in a calibration cut. Volume (CVTS) removed inthinnings = 103.2 cubic meters (37 percent of the total gross yield at the time of the last thinning). Volume (CVTS) in mortality = 9.3 cubic meters (2 percent of the total gross yield).f Net is QMD growth of trees alive at the start and end of the period; survivor is QMD growth of trees alive at the end of the period.g MAI = mean annual increment; PAI = periodic annual increment.
YearStandage
Table 73—Clemons: Stand development for treatment 2, per-hectare basis (plots 81, 87, and 90)
100 largesta
Ht D.b.h. QMDbTreesBasalarea CVTS d/Dd
After thinning Removed in thinning Mortality
Volumec Avg. volume
CV6 QMDbTreesBasalarea CVTS
Volume
CV6 QMDbTreesBasalarea CVTS
Volume
CV6
Years m Cm No. Cm m2 - - - - m3 - - - - No. Cm m2 - - - - - - - - m3 - - - - - - - - - No. Cm m2 - - - m3 - - -
YearStandage
NetCVTS
GrossCVTS
GrossCV6
NetCV6 Net Survivor
CVTSPAINet Gross
CVTSPAI
CVTSMAI
CV6PAI
CV6MAI
CV6PAI
CVTSMAI
CV6MAI
Net volume growthg Gross volume growth
Years - - - - - - - - - - - m3 - - - - - - - - - - - - - - Cm - - - - - - - m2 - - - - - - - - - - - - - - - - - - - - - - - - - m3 - - - - - - - - - - - - - - - - - - - - - - - - -
CVTS CV6
1963 19 10.6 14.9 976 10.7 8.8 36.1 0.6 0 0.0 0.0 0.0 0.0 0.0 0.0 0.00 0 0.0 0.0 0.0 0.01966 22 13.6 19.4 527 14.7 8.8 46.8 8.3 445 13.4 6.3 32.8 3.4 .1 .0 .95 4 16.0 .1 .5 .01970 26 17.0 24.6 338 20.0 10.5 69.9 37.2 181 17.9 4.6 30.1 11.9 .2 .1 .93 8 18.4 .2 1.5 .81973 29 19.8 28.9 259 24.6 12.3 94.2 70.1 74 20.4 2.4 18.5 10.1 .2 .2 .86 4 17.0 .1 .8 .21976 32 22.0 33.4 214 29.5 14.5 122.2 104.9 41 21.4 1.5 12.0 7.4 .3 .2 .76 4 30.0 .3 2.5 2.21980 36 25.3 37.8 185 34.5 17.3 168.6 154.5 25 22.2 1.0 9.9 6.4 .4 .2 .67 4 34.3 .4 4.1 3.81984 40 27.8 41.6 185 38.0 20.9 219.8 205.5 0 .0 .0 .0 .0 .0 .0 .00 0 .0 .0 .0 .01989 45 31.7 46.2 185 42.2 25.9 304.1 287.9 0 .0 .0 .0 .0 .0 .0 .00 0 .0 .0 .0 .01994 50 35.0 50.3 185 45.8 30.5 394.4 375.4 0 .0 .0 .0 .0 .0 .0 .00 0 .0 .0 .0 .0
1963 19 36.1 36.1 0.6 0.6 0.00 0.00 0.0 0.0 0.0 1.9 0.0 0.0 0.0 1.9 0.0 0.01966 22 79.7 80.1 11.7 11.8 1.12 1.12 2.1 2.1 14.5 3.6 3.7 .5 14.7 3.6 3.7 .51970 26 132.8 134.7 52.5 53.4 1.16 1.18 1.6 1.6 13.3 5.1 10.2 2.0 13.7 5.2 10.4 2.11973 29 175.6 178.3 95.5 96.6 1.26 1.25 1.4 1.4 14.2 6.1 14.3 3.3 14.5 6.1 14.4 3.31976 32 215.6 220.7 137.7 141.0 1.25 1.28 1.2 1.3 13.3 6.7 14.1 4.3 14.1 6.9 14.8 4.41980 36 271.9 281.1 193.8 200.8 .99 1.01 .9 1.0 14.1 7.6 14.0 5.4 15.1 7.8 15.0 5.61984 40 323.0 332.3 244.7 251.7 .87 .87 .9 .9 12.8 8.1 12.7 6.1 12.8 8.3 12.7 6.31989 45 407.4 416.6 327.1 334.2 .85 .85 1.0 1.0 16.9 9.1 16.5 7.3 16.9 9.3 16.5 7.41994 50 497.6 506.9 414.7 421.7 .72 .72 .9 .9 18.0 10.0 17.5 8.3 18.0 10.1 17.5 8.4
Cumulative yielde
QMD growthfBasal area
growth

110
a Average height (ht) and diameter at breast height (d.b.h.) of the 100 largest trees per hectare (estimated from d.b.h. and ht-d.b.h. curves).b Quadratic mean diameter at breast height.c All volumes are total stem cubic meters (CVTS) or merchantable cubic to a 15.25-cm top diameter inside bark (CV6).d Average d.b.h. cut/average d.b.h. before thinning.e Cumulative yield: net = standing + thinning; gross = standing + thinning + mortality; yield does not include any volume removed in a calibration cut. Volume (CVTS) removed inthinnings = 116.6 cubic meters (40 percent of the total gross yield at the time of the last thinning). Volume (CVTS) in mortality = 2.9 cubic meters (1 percent of the total gross yield).f Net is QMD growth of trees alive at the start and end of the period; survivor is QMD growth of trees alive at the end of the period.g MAI = mean annual increment; PAI = periodic annual increment.
YearStandage
Table74—Clemons: Stand development for treatment 3, per-hectare basis (plots 67, 71, and 78)
100 largesta
Ht D.b.h. QMDbTreesBasalarea CVTS d/Dd
After thinning Removed in thinning Mortality
Volumec Avg. volume
CV6 QMDbTreesBasalarea CVTS
Volume
CV6 QMDbTreesBasalarea CVTS
Volume
CV6
Years m Cm No. Cm m2 - - - - m3 - - - - No. Cm m2 - - - - - - - - m3 - - - - - - - - - No. Cm m2 - - - m3 - - -
YearStandage
NetCVTS
GrossCVTS
GrossCV6
NetCV6 Net Survivor
CVTSPAINet Gross
CVTSPAI
CVTSMAI
CV6PAI
CV6MAI
CV6PAI
CVTSMAI
CV6MAI
Net volume growthg Gross volume growth
Years - - - - - - - - - - - m3 - - - - - - - - - - - - - - Cm - - - - - - - m2 - - - - - - - - - - - - - - - - - - - - - - - - - m3 - - - - - - - - - - - - - - - - - - - - - - - - -
CVTS CV6
1963 19 10.2 14.4 980 10.3 8.2 33.0 0.3 0 0.0 0.0 0.0 0.0 0.0 0.0 0.00 0 0.0 0.0 0.0 0.01966 22 13.3 18.1 696 13.6 10.0 51.7 5.8 284 13.0 3.7 19.1 2.0 .1 .0 .97 0 .0 .0 .0 .01970 26 16.6 22.7 515 17.9 12.7 82.3 34.7 181 16.4 3.8 24.3 7.6 .1 .1 .94 0 .0 .0 .0 .01973 29 19.5 26.1 408 21.5 14.5 110.2 67.7 107 18.4 2.8 20.7 10.3 .2 .2 .89 0 .0 .0 .0 .01976 32 22.8 29.8 325 25.5 16.1 142.1 109.3 78 20.9 2.7 22.3 13.3 .3 .2 .86 4 26.9 .2 2.1 1.71980 36 25.2 34.1 259 30.0 17.8 174.1 150.1 66 25.0 3.2 30.2 22.8 .5 .3 .87 0 .0 .0 .0 .01984 40 27.9 37.9 259 33.2 21.8 232.6 208.8 0 .0 .0 .0 .0 .0 .0 .00 0 .0 .0 .0 .01989 45 31.7 42.8 259 37.3 27.4 327.5 302.7 0 .0 .0 .0 .0 .0 .0 .00 0 .0 .0 .0 .01994 50 35.9 46.8 255 40.9 32.5 430.0 403.9 0 .0 .0 .0 .0 .0 .0 .00 4 16.8 .1 .7 .1
1963 19 33.0 33.0 0.3 0.3 0.00 0.00 0.0 0.0 0.0 1.7 0.0 0.0 0.0 1.7 0.0 0.01966 22 70.8 70.8 7.8 7.8 1.00 1.00 1.8 1.8 12.6 3.2 2.5 .4 12.6 3.2 2.5 .41970 26 125.7 125.7 44.3 44.3 .98 .98 1.6 1.6 13.7 4.8 9.1 1.7 13.7 4.8 9.1 1.71973 29 174.3 174.3 87.7 87.7 1.00 1.00 1.5 1.5 16.2 6.0 14.5 3.0 16.2 6.0 14.5 3.01976 32 228.5 230.7 142.5 144.3 1.04 1.06 1.4 1.5 18.1 7.1 18.3 4.5 18.8 7.2 18.9 4.51980 36 290.7 292.8 206.3 208.0 .90 .90 1.2 1.2 15.5 8.1 15.9 5.7 15.5 8.1 15.9 5.81984 40 349.2 351.3 264.9 266.7 .80 .80 1.0 1.0 14.6 8.7 14.7 6.6 14.6 8.8 14.7 6.71989 45 444.1 446.2 358.8 360.6 .81 .81 1.1 1.1 19.0 9.9 18.8 8.0 19.0 9.9 18.8 8.01994 50 546.6 549.4 460.0 461.9 .72 .67 1.0 1.0 20.5 10.9 20.2 9.2 20.6 11.0 20.3 9.2
Cumulative yielde
QMD growthfBasal area
growth

111
a Average height (ht) and diameter at breast height (d.b.h.) of the 100 largest trees per hectare (estimated from d.b.h. and ht-d.b.h. curves).b Quadratic mean diameter at breast height.c All volumes are total stem cubic meters (CVTS) or merchantable cubic to a 15.25-cm top diameter inside bark (CV6).d Average d.b.h. cut/average d.b.h. before thinning.e Cumulative yield: net = standing + thinning; gross = standing + thinning + mortality; yield does not include any volume removed in a calibration cut. Volume (CVTS) removed inthinnings = 66.8 cubic meters (22 percent of the total gross yield at the time of the last thinning). Volume (CVTS) in mortality = 44.0 cubic meters (8 percent of the total gross yield).f Net is QMD growth of trees alive at the start and end of the period; survivor is QMD growth of trees alive at the end of the period.g MAI = mean annual increment; PAI = periodic annual increment.
YearStandage
Table 75—Clemons: Stand development for treatment 5, per-hectare basis (plots 60, 61, and 70)
100 largesta
Ht D.b.h. QMDbTreesBasalarea CVTS d/Dd
After thinning Removed in thinning Mortality
Volumec Avg. volume
CV6 QMDbTreesBasalarea CVTS
Volume
CV6 QMDbTreesBasalarea CVTS
Volume
CV6
Years m Cm No. Cm m2 - - - - m3 - - - - No. Cm m2 - - - - - - - - m3 - - - - - - - - - No. Cm m2 - - - m3 - - -
YearStandage
NetCVTS
GrossCVTS
GrossCV6
NetCV6 Net Survivor
CVTSPAINet Gross
CVTSPAI
CVTSMAI
CV6PAI
CV6MAI
CV6PAI
CVTSMAI
CV6MAI
Net volume growthg Gross volume growth
Years - - - - - - - - - - - m3 - - - - - - - - - - - - - - Cm - - - - - - - m2 - - - - - - - - - - - - - - - - - - - - - - - - - m3 - - - - - - - - - - - - - - - - - - - - - - - - -
CVTS CV6
1963 19 34.9 34.9 0.9 0.9 0.00 0.00 0.0 0.0 0.0 1.8 0.0 0.0 0.0 1.8 0.0 0.01966 22 74.5 74.8 9.9 9.9 1.02 1.02 1.9 1.9 13.2 3.4 3.0 .4 13.3 3.4 3.0 .41970 26 128.5 130.0 46.8 46.8 1.03 1.02 1.6 1.7 13.5 4.9 9.2 1.8 13.8 5.0 9.2 1.81973 29 174.4 178.8 89.5 91.3 1.00 1.02 1.5 1.6 15.3 6.0 14.3 3.1 16.3 6.2 14.9 3.11976 32 220.4 233.9 137.8 145.6 1.03 1.04 1.2 1.6 15.3 6.9 16.1 4.3 18.4 7.3 18.1 4.51980 36 282.6 299.2 202.7 212.6 .77 .78 1.2 1.3 15.6 7.9 16.2 5.6 16.3 8.3 16.8 5.91984 40 340.0 364.3 261.5 276.7 .70 .64 .9 1.1 14.3 8.5 14.7 6.5 16.3 9.1 16.0 6.91989 45 431.0 460.2 353.4 372.0 .62 .60 1.0 1.1 18.2 9.6 18.4 7.9 19.2 10.2 19.1 8.31994 50 521.8 565.8 445.0 475.1 .58 .54 .8 1.0 18.2 10.4 18.3 8.9 21.1 11.3 20.6 9.5
1963 19 10.5 15.1 976 10.6 8.6 34.9 0.9 0 0.0 0.0 0.0 0.0 0.0 0.0 0.00 0 0.0 0.0 0.0 0.01966 22 13.7 18.9 700 13.8 10.3 53.6 6.8 272 13.7 4.0 20.8 3.1 .1 .1 1.00 4 14.3 .1 .3 .01970 26 16.7 23.3 552 18.0 13.5 87.0 34.9 132 17.7 3.2 20.6 8.8 .2 .1 1.00 16 12.6 .2 1.2 .01973 29 19.4 26.4 490 21.1 16.3 121.0 70.5 49 20.3 1.6 12.0 7.1 .2 .2 .99 12 19.9 .4 2.9 1.81976 32 21.8 30.0 445 24.2 19.4 161.5 115.2 16 22.5 .7 5.4 3.6 .3 .3 .96 29 21.9 1.1 9.2 6.01980 36 24.6 33.7 420 27.4 23.4 215.8 173.8 16 25.9 .9 8.0 6.3 .5 .4 .97 8 23.4 .4 3.0 2.11984 40 26.9 37.1 399 30.2 26.9 273.1 232.6 0 .0 .0 .0 .0 .0 .0 .00 21 22.8 .8 7.8 5.31989 45 30.8 41.2 387 33.3 32.0 364.2 324.5 0 .0 .0 .0 .0 .0 .0 .00 12 22.9 .5 4.9 3.41994 50 34.4 45.0 362 36.2 35.9 455.0 416.1 0 .0 .0 .0 .0 .0 .0 .00 25 25.5 1.3 14.8 11.5
Cumulative yielde
QMD growthfBasal area
growth

112
a Average height (ht) and diameter at breast height (d.b.h.) of the 100 largest trees per hectare (estimated from d.b.h. and ht-d.b.h. curves).b Quadratic mean diameter at breast height.c All volumes are total stem cubic meters (CVTS) or merchantable cubic to a 15.25-cm top diameter inside bark (CV6).d Average d.b.h. cut/average d.b.h. before thinning.e Cumulative yield: net = standing + thinning; gross = standing + thinning + mortality; yield does not include any volume removed in a calibration cut. Volume (CVTS) removed inthinnings = 78.6 cubic meters (21 percent of the total gross yield at the time of the last thinning). Volume (CVTS) in mortality = 33.0 cubic meters (6 percent of the total gross yield).f Net is QMD growth of trees alive at the start and end of the period; survivor is QMD growth of trees alive at the end of the period.g MAI = mean annual increment; PAI = periodic annual increment.
YearStandage
Table 76—Clemons: Stand development for treatment 5, per-hectare basis (plots 60, 61, and 70)
100 largesta
Ht D.b.h. QMDbTreesBasalarea CVTS d/Dd
After thinning Removed in thinning Mortality
Volumec Avg. volume
CV6 QMDbTreesBasalarea CVTS
Volume
CV6 QMDbTreesBasalarea CVTS
Volume
CV6
Years m Cm No. Cm m2 - - - - m3 - - - - No. Cm m2 - - - - - - - - m3 - - - - - - - - - No. Cm m2 - - - m3 - - -
YearStandage
NetCVTS
GrossCVTS
GrossCV6
NetCV6 Net Survivor
CVTSPAINet Gross
CVTSPAI
CVTSMAI
CV6PAI
CV6MAI
CV6PAI
CVTSMAI
CV6MAI
Net volume growthg Gross volume growth
Years - - - - - - - - - - - m3 - - - - - - - - - - - - - - Cm - - - - - - - m2 - - - - - - - - - - - - - - - - - - - - - - - - - m3 - - - - - - - - - - - - - - - - - - - - - - - - -
CVTS CV6
1963 19 10.3 14.4 976 10.1 7.8 30.6 0.5 0 0.0 0.0 0.0 0.0 0.0 0.0 0.00 0 0.0 0.0 0.0 0.01966 22 13.3 18.3 865 13.1 11.6 58.1 5.8 107 12.6 1.3 6.6 .5 .1 .0 .97 4 9.6 .0 .1 .01970 26 16.4 23.0 729 16.7 15.7 98.1 32.3 91 17.2 2.1 13.2 4.8 .1 .1 1.03 45 14.2 .7 4.2 .41973 29 18.7 26.3 634 19.5 18.7 133.8 68.4 82 19.5 2.5 17.7 9.2 .2 .1 1.00 12 11.3 .1 .7 .01976 32 21.4 29.7 560 22.1 21.0 171.6 110.8 58 22.0 2.2 17.9 11.5 .3 .2 1.01 16 23.1 .7 5.7 3.91980 36 24.1 33.2 494 25.3 24.2 219.1 166.4 54 24.1 2.4 22.3 16.5 .4 .4 .97 12 17.4 .3 2.4 .91984 40 25.9 36.5 461 28.1 27.7 269.8 222.2 4 17.8 .1 .9 .3 .3 .0 .65 29 23.1 1.2 11.1 7.61989 45 29.4 40.6 457 31.3 34.0 373.7 325.8 0 .0 .0 .0 .0 .0 .0 .00 4 22.1 .2 1.4 .91994 50 32.7 44.3 440 34.3 39.4 476.0 428.7 0 .0 .0 .0 .0 .0 .0 .00 16 22.6 .7 7.3 5.6
1963 19 30.6 30.6 0.5 0.5 0.00 0.00 0.0 0.0 0 1.6 0.0 0.0 0.0 1.6 0.0 0.01966 22 64.7 64.8 6.3 6.3 .96 .96 1.7 1.7 11.4 2.9 1.9 .3 11.4 2.9 1.9 .31970 26 117.9 122.3 37.6 38.0 .90 .92 1.6 1.7 13.3 4.5 7.8 1.4 14.4 4.7 7.9 1.51973 29 171.3 176.4 82.9 83.3 .94 .92 1.8 1.8 17.8 5.9 15.1 2.9 18.0 6.1 15.1 2.91976 32 227.0 237.8 136.8 141.1 .86 .89 1.5 1.7 18.6 7.1 18.0 4.3 20.5 7.4 19.3 4.41980 36 296.9 310.0 208.9 214.1 .77 .75 1.4 1.5 17.5 8.2 18.0 5.8 18.1 8.6 18.3 5.91984 40 348.4 372.7 264.9 277.7 .68 .64 .9 1.2 12.9 8.7 14.0 6.6 15.7 9.3 15.9 6.91989 45 452.3 478.0 368.6 382.2 .64 .63 1.3 1.3 20.8 10.1 20.7 8.2 21.1 10.6 20.9 8.51994 50 554.6 587.6 471.4 490.7 .59 .55 1.1 1.2 20.5 11.1 20.6 9.4 21.9 11.8 21.7 9.8
Cumulative yielde
QMD growthfBasal area
growth

113
a Average height (ht) and diameter at breast height (d.b.h.) of the 100 largest trees per hectare (estimated from d.b.h. and ht-d.b.h. curves).b Quadratic mean diameter at breast height.c All volumes are total stem cubic meters (CVTS) or merchantable cubic to a 15.25-cm top diameter inside bark (CV6).d Average d.b.h. cut/average d.b.h. before thinning.e Cumulative yield: net = standing + thinning; gross = standing + thinning + mortality; yield does not include any volume removed in a calibration cut. Volume (CVTS) removed inthinnings = 135.6 cubic meters (43 percent of the total gross yield at the time of the last thinning). Volume (CVTS) in mortality = 3.4 cubic meters (1 percent of the total gross yield).f Net is QMD growth of trees alive at the start and end of the period; survivor is QMD growth of trees alive at the end of the period.g MAI = mean annual increment; PAI = periodic annual increment.
YearStandage
Table 77—Clemons: Stand development for treatment 6, per-hectare basis (plots 62, 85, and 88)
100 largesta
Ht D.b.h. QMDbTreesBasalarea CVTS d/Dd
After thinning Removed in thinning Mortality
Volumec Avg. volume
CV6 QMDbTreesBasalarea CVTS
Volume
CV6 QMDbTreesBasalarea CVTS
Volume
CV6
Years m Cm No. Cm m2 - - - - m3 - - - - No. Cm m2 - - - - - - - - m3 - - - - - - - - - No. Cm m2 - - - m3 - - -
YearStandage
NetCVTS
GrossCVTS
GrossCV6
NetCV6 Net Survivor
CVTSPAINet Gross
CVTSPAI
CVTSMAI
CV6PAI
CV6MAI
CV6PAI
CVTSMAI
CV6MAI
Net volume growthg Gross volume growth
CVTS CV6
1963 19 10.4 14.5 980 10.4 8.4 32.6 0.3 0 0.0 0.0 0.0 0.0 0.0 0.0 0.00 0 0.0 0.0 0.0 0.01966 22 13.6 18.4 815 13.6 11.8 60.7 6.8 161 13.3 2.2 11.4 1.1 .1 .0 .98 4 9.1 .0 .1 .01970 26 16.9 23.2 626 17.6 15.0 97.0 36.5 177 17.3 4.1 26.7 10.3 .2 .1 .99 12 11.9 .1 .7 .01973 29 20.0 26.3 506 20.7 16.9 130.8 75.5 111 19.5 3.3 25.3 12.7 .2 .1 .95 8 15.2 .2 1.0 .21976 32 21.3 29.6 403 23.8 17.8 145.9 104.7 99 22.5 3.9 31.7 21.1 .3 .2 .96 4 10.7 .0 .2 .01980 36 24.7 33.0 313 27.4 18.4 176.9 145.2 86 25.0 4.2 40.5 30.5 .5 .4 .93 4 22.9 .2 1.3 .91984 40 27.4 35.8 313 30.3 22.4 237.1 206.5 0 .0 .0 .0 .0 .0 .0 .00 0 .0 .0 .0 .01989 45 31.3 40.6 313 34.0 28.2 334.2 303.3 0 .0 .0 .0 .0 .0 .0 .00 0 .0 .0 .0 .01994 50 35.2 45.0 313 37.2 33.8 444.7 411.9 0 .0 .0 .0 .0 .0 .0 .00 0 .0 .0 .0 .0
1963 19 32.6 32.6 0.3 0.3 0.00 0.00 0.0 0.0 0.0 1.7 0.0 0.0 0.0 1.7 0.0 0.01966 22 72.1 72.2 8.0 8.0 1.02 1.02 1.9 1.9 13.2 3.3 2.6 .4 13.2 3.3 2.6 .41970 26 135.1 136.0 47.9 47.9 .97 .97 1.9 1.9 15.8 5.2 10.0 1.8 15.9 5.2 10.0 1.81973 29 194.2 196.1 99.7 99.8 .97 .96 1.7 1.8 19.7 6.7 17.3 3.4 20.0 6.8 17.3 3.41976 32 241.0 243.1 150.0 150.1 .96 .93 1.6 1.6 15.6 7.5 16.8 4.7 15.7 7.6 16.8 4.71980 36 312.5 315.9 221.0 222.0 .79 .79 1.2 1.3 17.9 8.7 17.8 6.1 18.2 8.8 18.0 6.21984 40 372.8 376.2 282.3 283.3 .72 .72 1.0 1.0 15.1 9.3 15.3 7.1 15.1 9.4 15.3 7.11989 45 469.8 473.2 379.1 380.1 .73 .73 1.1 1.1 19.4 10.4 19.4 8.4 19.4 10.5 19.4 8.41994 50 580.4 583.8 487.6 488.7 .65 .65 1.1 1.1 22.1 11.6 21.7 9.8 22.1 11.7 21.7 9.8
Years - - - - - - - - - - - m3 - - - - - - - - - - - - - - Cm - - - - - - - m2 - - - - - - - - - - - - - - - - - - - - - - - - - m3 - - - - - - - - - - - - - - - - - - - - - - - - -
Cumulative yielde
QMD growthfBasal area
growth

114
a Average height (ht) and diameter at breast height (d.b.h.) of the 100 largest trees per hectare (estimated from d.b.h. and ht-d.b.h. curves).b Quadratic mean diameter at breast height.c All volumes are total stem cubic meters (CVTS) or merchantable cubic to a 15.25-cm top diameter inside bark (CV6).d Average d.b.h. cut/average d.b.h. before thinning.e Cumulative yield: net = standing + thinning; gross = standing + thinning + mortality; yield does not include any volume removed in a calibration cut. Volume (CVTS) removed inthinnings = 35.5 cubic meters (11 percent of the total gross yield at the time of the last thinning). Volume (CVTS) in mortality = 32.0 cubic meters (5 percent of the total gross yield).f Net is QMD growth of trees alive at the start and end of the period; survivor is QMD growth of trees alive at the end of the period.g MAI = mean annual increment; PAI = periodic annual increment.
YearStandage
Table 78—Clemons: Stand development for treatment 7, per-hectare basis (plots 75, 82, and 86)
100 largesta
Ht D.b.h. QMDbTreesBasalarea CVTS d/Dd
After thinning Removed in thinning Mortality
Volumec Avg. volume
CV6 QMDbTreesBasalarea CVTS
Volume
CV6 QMDbTreesBasalarea CVTS
Volume
CV6
Years m Cm No. Cm m2 - - - - m3 - - - - No. Cm m2 - - - - - - - - m3 - - - - - - - - - No. Cm m2 - - - m3 - - -
YearStandage
NetCVTS
GrossCVTS
GrossCV6
NetCV6 Net Survivor
CVTSPAINet Gross
CVTSPAI
CVTSMAI
CV6PAI
CV6MAI
CV6PAI
CVTSMAI
CV6MAI
Net volume growthg Gross volume growth
Years - - - - - - - - - - - m3 - - - - - - - - - - - - - - Cm - - - - - - - m2 - - - - - - - - - - - - - - - - - - - - - - - - - m3 - - - - - - - - - - - - - - - - - - - - - - - - -
CVTS CV6
1963 19 10.9 14.4 984 10.3 8.1 34.7 0.6 0 0.0 0.0 0.0 0.0 0.0 0.0 0.00 0 0.0 0.0 0.0 0.01966 22 14.1 18.3 922 13.3 12.7 69.0 6.2 62 13.3 .9 4.7 1.4 .1 .1 1.00 0 .0 .0 .0 .01970 26 17.6 22.4 856 16.7 18.5 126.0 40.6 54 16.4 1.1 7.6 2.3 .1 .1 .99 12 14.2 .2 1.3 .11973 29 20.4 25.6 795 19.1 22.5 175.8 86.6 41 18.8 1.1 8.9 4.7 .2 .2 .99 21 15.7 .4 2.9 .91976 32 22.3 28.3 749 21.5 26.6 231.8 143.2 25 16.9 .6 4.5 1.3 .2 .1 .80 21 13.4 .3 2.2 .01980 36 24.4 31.5 708 23.7 30.5 291.2 206.5 29 21.3 1.0 9.7 6.3 .3 .2 .91 12 20.9 .4 4.0 2.61984 40 27.5 34.0 700 25.3 34.5 363.6 279.0 0 .0 .0 .0 .0 .0 .0 .00 8 15.7 .2 1.4 .51989 45 30.7 37.2 679 27.7 40.0 463.0 381.5 0 .0 .0 .0 .0 .0 .0 .00 21 18.5 .6 5.7 3.11994 50 33.9 40.3 638 30.1 44.7 567.3 489.7 0 .0 .0 .0 .0 .0 .0 .00 41 20.0 1.3 14.5 8.5
1963 19 34.7 34.7 0.6 0.6 0.00 0.00 0.0 0.0 0.0 1.8 0.0 0.0 0.0 1.8 0.0 0.01966 22 73.7 73.7 7.6 7.6 .99 .99 1.8 1.8 13.0 3.4 2.3 .3 13.0 3.4 2.3 .31970 26 138.3 139.5 44.2 44.3 .84 .84 1.7 1.8 16.1 5.3 9.2 1.7 16.4 5.4 9.2 1.71973 29 197.1 201.2 95.0 96.0 .79 .79 1.7 1.8 19.6 6.8 16.9 3.3 20.6 6.9 17.2 3.31976 32 257.6 263.9 152.9 153.9 .73 .68 1.5 1.6 20.2 8.0 19.3 4.8 20.9 8.2 19.3 4.81980 36 326.6 337.0 222.4 226.0 .53 .52 1.2 1.3 17.3 9.1 17.4 6.2 18.3 9.4 18.0 6.31984 40 399.1 410.9 295.0 299.1 .42 .40 1.0 1.0 18.1 10.0 18.1 7.4 18.5 10.3 18.3 7.51989 45 498.5 516.0 397.4 404.6 .47 .43 1.1 1.2 19.9 11.1 20.5 8.8 21.0 11.5 21.1 9.01994 50 602.8 634.8 505.7 521.4 .49 .42 .9 1.2 20.9 12.1 21.7 10.1 23.8 12.7 23.4 10.4
Cumulative yielde
QMD growthfBasal area
growth

115
a Average height (ht) and diameter at breast height (d.b.h.) of the 100 largest trees per hectare (estimated from d.b.h. and ht-d.b.h. curves).b Quadratic mean diameter at breast height.c All volumes are total stem cubic meters (CVTS) or merchantable cubic to a 15.25-cm top diameter inside bark (CV6).d Average d.b.h. cut/average d.b.h. before thinning.e Cumulative yield: net = standing + thinning; gross = standing + thinning + mortality; yield does not include any volume removed in a calibration cut. Volume (CVTS) removed inthinnings = 76.6 cubic meters (24 percent of the total gross yield at the time of the last thinning). Volume (CVTS) in mortality = 10.4 cubic meters (2 percent of the total gross yield).f Net is QMD growth of trees alive at the start and end of the period; survivor is QMD growth of trees alive at the end of the period.g MAI = mean annual increment; PAI = periodic annual increment.
YearStandage
Table 79—Clemons: Stand development for treatment 8, per-hectare basis (plots 59, 72, and 73)
100 largesta
Ht D.b.h. QMDbTreesBasalarea CVTS d/Dd
After thinning Removed in thinning Mortality
Volumec Avg. volume
CV6 QMDbTreesBasalarea CVTS
Volume
CV6 QMDbTreesBasalarea CVTS
Volume
CV6
Years m Cm No. Cm m2 - - - - m3 - - - - No. Cm m2 - - - - - - - - m3 - - - - - - - - - No. Cm m2 - - - m3 - - -
YearStandage
NetCVTS
GrossCVTS
GrossCV6
NetCV6 Net Survivor
CVTSPAINet Gross
CVTSPAI
CVTSMAI
CV6PAI
CV6MAI
CV6PAI
CVTSMAI
CV6MAI
Net volume growthg Gross volume growth
Years - - - - - - - - - - - m3 - - - - - - - - - - - - - - Cm - - - - - - - m2 - - - - - - - - - - - - - - - - - - - - - - - - - m3 - - - - - - - - - - - - - - - - - - - - - - - - -
CVTS CV6
1963 19 10.8 14.4 980 10.1 7.8 32.9 0.4 0 0.0 0.0 0.0 0.0 0.0 0.0 0.00 0 0.0 0.0 0.0 0.01966 22 13.8 18.1 955 12.9 12.5 65.5 5.8 25 11.7 .3 1.3 .0 .0 .0 .91 0 .0 .0 .0 .01970 26 17.4 22.3 889 16.1 17.9 117.4 33.2 58 16.5 1.2 8.2 2.5 .1 .1 1.03 8 10.8 .1 .4 .01973 29 20.4 25.4 786 18.5 20.9 158.4 71.6 78 17.5 1.9 14.1 5.9 .2 .1 .95 25 16.3 .5 3.7 1.21976 32 22.3 28.3 692 20.7 23.1 194.8 114.1 91 19.4 2.7 21.8 10.4 .2 .1 .95 4 20.1 .1 1.1 .61980 36 25.0 31.5 593 23.2 24.7 231.4 160.3 78 23.2 3.3 31.2 22.0 .4 .4 1.01 21 14.9 .4 2.8 .61984 40 27.5 33.9 593 25.1 28.9 296.4 225.0 0 .0 .0 .0 .0 .0 .0 .00 0 .0 .0 .0 .01989 45 30.7 37.5 589 27.6 34.6 388.9 318.4 0 .0 .0 .0 .0 .0 .0 .00 4 25.4 .2 2.3 1.81994 50 33.7 41.0 589 29.7 40.1 490.4 419.2 0 .0 .0 .0 .0 .0 .0 .00 0 .0 .0 .0 .0
1963 19 32.9 32.9 0.4 0.4 0.00 0.00 0.0 0.0 0.0 1.7 0.0 0.0 0.0 1.7 0.0 0.01966 22 66.8 66.8 5.8 5.8 .92 .92 1.6 1.6 11.3 3.0 1.8 .3 11.3 3.0 1.8 .31970 26 126.9 127.3 35.7 35.7 .79 .79 1.7 1.7 15.0 4.9 7.5 1.4 15.1 4.9 7.5 1.41973 29 182.0 186.1 80.0 81.2 .77 .77 1.6 1.8 18.4 6.3 14.8 2.8 19.6 6.4 15.2 2.81976 32 240.3 245.5 132.9 134.6 .71 .71 1.6 1.7 19.4 7.5 17.6 4.2 19.8 7.7 17.8 4.21980 36 308.0 316.1 201.0 203.3 .62 .58 1.2 1.3 16.9 8.6 17.0 5.6 17.6 8.8 17.2 5.61984 40 372.9 381.0 265.8 268.1 .48 .48 1.1 1.1 16.2 9.3 16.2 6.6 16.2 9.5 16.2 6.71989 45 465.4 475.8 359.2 363.3 .49 .49 1.1 1.2 18.5 10.3 18.7 8.0 19.0 10.6 19.0 8.11994 50 567.0 577.3 460.0 464.1 .43 .43 1.1 1.1 20.3 11.3 20.2 9.2 20.3 11.5 20.2 9.3
Cumulative yielde
QMD growthfBasal area
growth

116
a Average height (ht) and diameter at breast height (d.b.h.) of the 100 largest trees per hectare (estimated from d.b.h. and ht-d.b.h. curves).b Quadratic mean diameter at breast height.c All volumes are total stem cubic meters (CVTS) or merchantable cubic to a 15.25-cm top diameter inside bark (CV6).c Average d.b.h. cut/average d.b.h. before thinning.e Cumulative yield: net = standing + thinning; gross = standing + thinning + mortality; yield does not include any volume removed in a calibration cut. Volume (CVTS) removed inthinnings = 149.1 cubic meters (58 percent of the total gross yield at the time of the last thinning). Volume (CVTS) in mortality = 100.6 cubic meters (13 percent of the total grossyield).f Net is QMD growth of trees alive at the start and end of the period; survivor is QMD growth of trees alive at the end of the period.g
MAI = mean annual increment; PAI = periodic annual increment.
YearStandage
Table 80—Clemons: Stand development table for control, per-hectare basis (plots 58, 83, and 89)
100 largesta
Ht D.b.h. QMDbTreesBasalarea CVTS d/Dd
After thinning Removed in thinning Mortality
Volumec Avg. volume
CV6 QMDbTreesBasalarea CVTS
Volume
CV6 QMDbTreesBasalarea CVTS
Volume
CV6
Years m Cm No. Cm m2 - - - - m3 - - - - No. Cm m2 - - - - - - - - m3 - - - - - - - - - No. Cm m2 - - - m3 - - -
YearStandage
NetCVTS
GrossCVTS
GrossCV6
NetCV6 Net Survivor
CVTSPAINet Gross
CVTSPAI
CVTSMAI
CV6PAI
CV6MAI
CV6PAI
CVTSMAI
CV6MAI
Net volume growthg Gross volume growth
Years - - - - - - - - - - - m3 - - - - - - - - - - - - - - Cm - - - - - - - m2 - - - - - - - - - - - - - - - - - - - - - - - - - m3 - - - - - - - - - - - - - - - - - - - - - - - - -
CVTS CV6
1963 19 11.9 19.5 1696 10.2 13.7 59.6 7.5 0 0.0 0.0 0.0 0.0 0.0 0.0 0.00 0 0.0 0.0 0.0 0.01966 22 14.9 23.1 1688 12.5 20.5 111.6 22.6 0 .0 .0 .0 .0 .0 .0 .00 8 8.7 .0 .2 .01970 26 18.5 27.2 1634 15.0 28.6 193.1 63.4 0 .0 .0 .0 .0 .0 .0 .00 54 6.4 .2 .7 .01973 29 21.3 30.0 1589 16.7 34.5 269.7 115.6 0 .0 .0 .0 .0 .0 .0 .00 45 8.3 .2 1.4 .01976 32 23.8 32.5 1498 18.3 38.8 337.7 175.4 0 .0 .0 .0 .0 .0 .0 .00 91 12.7 1.1 8.9 1.51980 36 26.1 35.1 1379 20.1 43.1 411.0 249.4 0 .0 .0 .0 .0 .0 .0 .00 119 11.1 1.2 9.0 .41984 40 28.8 37.4 1235 21.8 45.5 477.2 319.8 0 .0 .0 .0 .0 .0 .0 .00 144 14.2 2.3 21.4 9.81989 45 32.0 40.3 1070 24.4 49.4 568.7 426.0 0 .0 .0 .0 .0 .0 .0 .00 165 14.7 2.8 26.4 10.11994 50 34.7 43.3 955 26.8 52.9 659.4 530.9 0 .0 .0 .0 .0 .0 .0 .00 115 18.1 3.0 32.5 15.0
1963 19 59.6 59.6 7.5 7.5 0.00 0.00 0.0 0.0 0.0 3.1 0.0 0.4 0.0 3.1 0.0 0.41966 22 111.6 111.8 22.6 22.6 .77 .76 2.3 2.3 17.3 5.1 5.0 1.0 17.4 5.1 5.0 1.01970 26 193.1 194.0 63.4 63.4 .62 .59 2.0 2.1 20.4 7.4 10.2 2.4 20.6 7.5 10.2 2.41973 29 269.7 272.1 115.6 115.6 .56 .51 1.9 2.0 25.6 9.3 17.4 4.0 26.0 9.4 17.4 4.01976 32 337.7 348.9 175.4 176.9 .53 .44 1.4 1.8 22.6 10.6 19.9 5.5 25.6 10.9 20.4 5.51980 36 411.0 431.2 249.4 251.2 .46 .33 1.1 1.4 18.3 11.4 18.5 6.9 20.6 12.0 18.6 7.01984 40 477.2 518.9 319.8 331.4 .42 .29 .6 1.2 16.6 11.9 17.6 8.0 21.9 13.0 20.0 8.31989 45 568.7 636.8 426.0 447.7 .52 .34 .8 1.3 18.3 12.6 21.2 9.5 23.6 14.2 23.3 9.91994 50 659.4 760.0 530.9 567.7 .48 .34 .7 1.3 18.1 13.2 21.0 10.6 24.6 15.2 24.0 11.4
Cumulative yielde
QMD growthfBasal area
growth

117
Table 81—Clemons: Trees per hectare, 1963–1994, by treatment, plot, and period
Calibrationperiod
1963–1966a
Age (years)
Treatment Plot 19 22
Treatmentperiod 1
1966–1970a
Age (years)
Treatmentperiod 2
1970–1973a
Age (years)
Treatmentperiod 3
1973–1976a
Age (years)
Treatmentperiod 4
1976–1980a
Age (years)
Treatmentperiod 5
1980–1984a
Age (years)
Treatmentperiod 6
1984–1989a
Age (years)
Treatmentperiod 7
1989–1994a
Age (years)
22 26 26 29 29 32 32 36 36 40 40 45 45 50
a Columns are measurements after treatment and just before next treatment.
Number of trees per hectare
1 63 976 976 519 506 321 321 222 222 173 173 136 136 136 136 136 13664 976 976 605 593 383 383 272 272 198 198 148 148 148 148 148 14869 976 976 667 642 408 408 284 272 185 185 136 136 136 136 136 136
Avg. 976 976 597 580 371 371 259 255 185 185 140 140 140 140 140 140
2 81 976 976 605 605 383 383 284 284 235 235 198 198 198 198 198 19887 976 963 506 482 346 333 272 272 222 222 185 185 185 185 185 18590 976 976 469 469 284 284 222 210 185 173 173 173 173 173 173 173
Avg. 976 972 527 519 338 333 259 255 214 210 185 185 185 185 185 185
3 67 988 988 692 692 506 506 408 395 333 333 259 259 259 259 259 24771 976 976 803 803 618 618 494 494 395 395 321 321 321 321 321 32178 976 976 593 593 420 420 321 321 247 247 198 198 198 198 198 198
Avg. 980 980 696 696 515 515 408 403 325 325 259 259 259 259 259 255
4 66 976 976 729 692 580 580 519 506 457 457 420 420 420 420 420 40874 976 963 827 827 679 655 618 580 580 556 556 519 519 482 482 42091 976 976 543 531 395 383 333 296 296 296 284 259 259 259 259 259
Avg. 976 972 700 683 552 539 490 461 445 436 420 399 399 387 387 362
5 60 976 963 889 766 741 716 630 593 543 519 482 395 395 383 383 35861 976 976 753 741 605 605 519 506 457 457 383 383 383 383 383 38370 976 976 951 951 840 827 753 753 679 667 618 618 605 605 605 580
Avg. 976 972 865 819 729 716 634 618 560 548 494 465 461 457 457 440
6 62 976 963 852 815 655 642 531 531 432 420 333 333 333 333 333 33385 976 976 865 865 679 667 543 543 432 432 333 333 333 333 333 33388 988 988 729 729 543 543 445 432 346 346 272 272 272 272 272 272
Avg. 980 976 815 803 626 618 506 502 403 399 313 313 313 313 313 313
7 75 1,000 1,000 1,000 963 963 902 902 889 877 877 827 827 827 803 803 75382 976 976 963 963 877 877 815 803 778 766 741 716 716 692 692 61886 976 976 803 803 729 729 667 630 593 568 556 556 556 543 543 543
Avg. 984 984 922 910 856 836 795 774 749 737 708 700 700 679 679 638
8 59 976 976 902 889 778 716 679 667 593 556 494 494 494 482 482 48272 988 988 988 988 976 963 877 877 790 766 692 692 692 692 692 69273 976 976 976 963 914 914 803 803 692 692 593 593 593 593 593 593
Avg. 980 980 955 947 889 865 786 782 692 671 593 593 593 589 589 589
Control 58 1,445 1,445 1,445 1,445 1,445 1,420 1,420 1,396 1,396 1,309 1,309 1,223 1,223 1,050 1,050 97683 1,778 1,754 1,754 1,618 1,618 1,519 1,519 1,309 1,309 1,136 1,136 1,013 1,013 877 877 74189 1,865 1,865 1,865 1,840 1,840 1,828 1,828 1,791 1,791 1,692 1,692 1,470 1,470 1,284 1,284 1,149
Avg. 1,696 1,688 1,688 1,634 1,634 1,589 1,589 1,498 1,498 1,379 1,379 1,235 1,235 1,070 1,070 955

118 Table 82—Clemons: Basal area per hectare, 1963–1994, by treatment, plot, and period
Treatment Plot
a Columns are measurements after treatment and just before next treatment.
1 63 9.6 16.1 8.8 15.0 9.7 14.1 10.3 14.1 10.9 15.1 11.3 14.6 14.6 19.4 19.4 24.364 8.1 14.0 9.0 14.9 9.7 13.9 10.2 14.3 10.9 15.2 11.4 14.6 14.6 18.9 18.9 23.169 7.6 12.6 9.0 14.5 9.7 13.5 10.4 14.2 11.0 15.0 11.4 14.4 14.4 18.4 18.4 22.2
Avg. 8.4 14.2 8.9 14.8 9.7 13.8 10.3 14.2 10.9 15.1 11.4 14.5 14.5 18.9 18.9 23.2
2 81 7.4 13.2 8.9 15.5 10.5 15.0 12.3 16.4 14.5 18.7 17.2 21.0 21.0 26.2 26.2 31.487 9.8 15.8 8.9 13.9 10.5 14.3 12.2 15.9 14.5 18.4 17.0 20.5 20.5 25.4 25.4 30.090 9.3 16.4 8.8 15.9 10.5 14.8 12.3 15.7 14.5 17.7 17.7 21.5 21.5 26.2 26.2 30.3
Avg. 8.8 15.1 8.8 15.1 10.5 14.7 12.3 16.0 14.5 18.3 17.3 21.0 21.0 25.9 25.9 30.6
3 67 8.7 14.2 10.2 16.4 12.7 17.2 14.5 18.0 16.2 21.0 17.8 21.7 21.7 27.2 27.2 31.971 7.5 12.3 10.2 16.3 12.7 17.4 14.5 19.4 16.1 21.2 17.8 21.8 21.8 27.4 27.4 33.078 8.6 14.8 9.6 17.0 12.7 17.5 14.5 19.0 16.2 20.8 17.8 21.9 21.9 27.9 27.9 32.8
Avg. 8.3 13.8 10.0 16.6 12.7 17.3 14.5 18.8 16.1 21.0 17.8 21.8 21.8 27.5 27.5 32.6
4 66 8.1 13.7 10.2 16.3 13.6 18.3 16.5 21.7 19.7 25.5 23.6 28.0 28.0 33.8 33.8 38.574 7.8 11.9 10.4 16.1 13.6 17.1 16.3 19.6 19.6 23.4 23.4 26.5 26.5 30.4 30.4 32.591 9.9 17.2 10.2 18.0 13.6 18.5 16.4 19.0 19.0 24.1 23.4 26.5 26.5 31.9 31.9 36.9
Avg. 8.6 14.3 10.3 16.8 13.6 18.0 16.4 20.1 19.4 24.3 23.5 27.0 27.0 32.0 32.0 36.0
5 60 7.5 12.5 11.6 16.5 15.8 21.3 18.7 22.7 20.3 25.6 24.2 25.1 25.1 30.9 30.9 35.061 8.4 14.4 11.6 19.4 15.7 21.6 18.7 23.6 21.5 28.3 24.2 29.8 29.8 37.3 37.3 44.270 7.6 11.9 11.6 17.8 15.8 20.6 18.7 23.5 21.4 26.3 24.5 28.6 28.3 34.0 34.0 39.1
Avg. 7.8 12.9 11.6 17.9 15.8 21.2 18.7 23.3 21.1 26.7 24.3 27.8 27.7 34.0 34.0 39.4
6 62 7.9 13.0 11.7 18.8 14.9 20.0 16.7 21.7 17.8 23.3 18.3 22.8 22.8 29.0 29.0 35.585 7.5 12.9 11.6 18.8 14.9 19.9 16.7 21.9 17.7 22.7 18.3 22.2 22.2 27.6 27.6 33.288 9.8 16.1 12.1 20.1 15.3 20.7 17.2 21.6 17.8 22.0 18.6 22.4 22.4 27.9 27.9 33.0
Avg. 8.4 14.0 11.8 19.2 15.1 20.2 16.9 21.7 17.8 22.6 18.4 22.4 22.4 28.2 28.2 33.9
7 75 7.8 12.6 12.6 18.1 18.1 21.9 21.9 26.7 26.5 32.0 30.5 34.7 34.7 39.9 39.9 43.482 7.5 12.8 12.6 20.4 18.8 24.4 22.9 27.5 26.7 31.7 30.5 34.0 34.0 39.6 39.6 43.886 9.1 15.3 13.0 20.6 18.8 24.8 22.9 27.5 26.7 31.0 30.6 35.1 35.1 40.7 40.7 47.0
Avg. 8.2 13.6 12.7 19.7 18.6 23.7 22.6 27.2 26.7 31.6 30.5 34.6 34.6 40.1 40.1 44.8
8 59 8.3 13.8 13.0 20.5 18.0 22.0 20.9 25.7 23.1 28.2 24.8 29.4 29.4 35.0 35.0 41.172 7.8 12.1 12.1 18.2 18.0 22.9 20.9 25.6 23.2 27.8 24.7 28.6 28.6 34.5 34.5 39.773 7.5 12.3 12.3 18.9 18.0 23.4 20.9 26.2 23.1 28.2 24.7 28.9 28.9 34.4 34.4 39.8
Avg. 7.8 12.7 12.5 19.2 18.0 22.8 20.9 25.8 23.1 28.1 24.8 29.0 29.0 34.6 34.6 40.2
Control 58 13.8 20.1 20.1 27.7 27.7 33.3 33.3 38.3 38.3 43.1 43.1 45.1 45.1 47.3 47.3 51.083 15.1 22.1 22.1 30.4 30.4 35.6 35.6 37.3 37.3 39.8 39.8 42.6 42.6 47.1 47.1 49.989 12.4 19.5 19.5 28.0 28.0 34.7 34.7 41.0 41.0 46.7 46.7 49.1 49.1 54.0 54.0 58.1
Avg. 13.8 20.6 20.6 28.7 28.7 34.5 34.5 38.9 38.9 43.2 43.2 45.6 45.6 49.5 49.5 53.0
Square meters per hectare
Calibrationperiod
1963–1966a
Age (years)
19 22
Treatmentperiod 1
1966–1970a
Age (years)
Treatmentperiod 2
1970–1973a
Age (years)
Treatmentperiod 3
1973–1976a
Age (years)
Treatmentperiod 4
1976–1980a
Age (years)
Treatmentperiod 5
1980–1984a
Age (years)
Treatmentperiod 6
1984–1989a
Age (years)
Treatmentperiod 7
1989–1994a
Age (years)
22 26 26 29 29 32 32 36 36 40 40 45 45 50

119 a Columns are measurements after treatment and just before next treatment.
1 63 11.2 14.5 14.7 19.4 19.6 23.7 24.3 28.5 28.3 33.4 32.6 37.0 37.0 42.6 42.6 47.764 10.3 13.5 13.7 17.9 18.0 21.5 21.9 25.9 26.5 31.3 31.3 35.4 35.4 40.2 40.2 44.669 10.0 12.8 13.1 17.0 17.4 20.5 21.5 25.8 27.4 32.1 32.7 36.7 36.7 41.5 41.5 45.6
Avg. 10.5 13.6 13.8 18.1 18.3 21.9 22.6 26.7 27.4 32.3 32.2 36.4 36.4 41.5 41.5 46.0
2 81 9.8 13.1 13.7 18.0 18.7 22.3 23.5 27.1 28.1 31.9 33.3 36.7 36.7 41.1 41.1 44.987 11.3 14.4 14.9 19.2 19.7 23.3 24.0 27.3 28.9 32.5 34.2 37.5 37.5 41.8 41.8 45.490 11.0 14.6 15.5 20.8 21.7 25.8 26.6 30.9 31.5 36.1 36.1 39.8 39.8 43.9 43.9 47.3
Avg. 10.7 14.1 14.7 19.3 20.0 23.8 24.7 28.4 29.5 33.5 34.5 38.0 38.0 42.3 42.3 45.9
3 67 10.6 13.5 13.7 17.4 17.9 20.8 21.3 24.1 24.9 28.3 29.6 32.6 32.6 36.5 36.5 40.671 9.9 12.7 12.7 16.1 16.2 18.9 19.3 22.4 22.8 26.1 26.5 29.4 29.4 33.0 33.0 36.278 10.6 13.9 14.4 19.1 19.6 23.0 24.0 27.5 28.9 32.8 33.9 37.6 37.6 42.4 42.4 46.0
Avg. 10.4 13.4 13.6 17.5 17.9 20.9 21.5 24.7 25.5 29.1 30.0 33.2 33.2 37.3 37.3 40.9
4 66 10.3 13.4 13.4 17.3 17.2 20.1 20.1 23.4 23.5 26.7 26.8 29.1 29.1 32.0 32.0 34.774 10.1 12.5 12.7 15.8 15.9 18.2 18.3 20.7 20.7 23.1 23.1 25.5 25.5 28.3 28.3 31.491 11.3 15.0 15.5 20.7 20.9 24.8 25.0 28.6 28.6 32.2 32.4 36.1 36.1 39.6 39.6 42.6
Avg. 10.6 13.6 13.8 17.9 18.0 21.0 21.1 24.2 24.3 27.3 27.4 30.2 30.2 33.3 33.3 36.2
5 60 9.9 12.9 12.9 16.6 16.5 19.5 19.5 22.1 21.8 25.1 25.3 28.4 28.4 32.1 32.1 35.361 10.5 13.7 14.0 18.2 18.2 21.3 21.4 24.4 24.5 28.1 28.3 31.5 31.5 35.2 35.2 38.470 9.9 12.5 12.5 15.4 15.5 17.8 17.8 19.9 20.0 22.4 22.5 24.3 24.4 26.7 26.7 29.3
Avg. 10.1 13.0 13.1 16.7 16.7 19.5 19.6 22.1 22.1 25.2 25.4 28.1 28.1 31.3 31.3 34.3
6 62 10.1 13.1 13.2 17.1 17.0 19.9 20.0 22.8 22.9 26.6 26.4 29.5 29.5 33.3 33.3 36.885 9.9 13.0 13.1 16.6 16.7 19.5 19.8 22.7 22.9 25.8 26.4 29.1 29.1 32.5 32.5 35.688 11.3 14.4 14.5 18.7 18.9 22.0 22.2 25.2 25.6 28.4 29.5 32.4 32.4 36.2 36.2 39.3
Avg. 10.4 13.5 13.6 17.5 17.6 20.5 20.7 23.6 23.8 27.0 27.5 30.3 30.3 34.0 34.0 37.2
7 75 10.0 12.7 12.7 15.5 15.5 17.6 17.6 19.6 19.6 21.6 21.7 23.1 23.1 25.2 25.2 27.182 9.9 12.9 12.9 16.4 16.5 18.8 18.9 20.9 20.9 22.9 22.9 24.6 24.6 27.0 27.0 30.186 10.9 14.1 14.4 18.1 18.1 20.8 20.9 23.6 23.9 26.4 26.5 28.4 28.4 30.9 30.9 33.2
Avg. 10.3 13.2 13.3 16.7 16.7 19.1 19.1 21.3 21.5 23.6 23.7 25.3 25.3 27.7 27.7 30.1
8 59 10.4 13.4 13.6 17.1 17.1 19.8 19.8 22.1 22.3 25.4 25.3 27.5 27.5 30.4 30.4 33.072 10.0 12.5 12.5 15.3 15.3 17.4 17.4 19.3 19.3 21.5 21.3 23.0 23.0 25.2 25.2 27.073 9.9 12.7 12.7 15.8 15.8 18.1 18.2 20.4 20.6 22.8 23.0 24.9 24.9 27.2 27.2 29.2
Avg. 10.1 12.9 12.9 16.1 16.1 18.4 18.5 20.6 20.7 23.2 23.2 25.1 25.1 27.6 27.6 29.7
Control 58 11.0 13.3 13.3 15.6 15.6 17.3 17.3 18.7 18.7 20.5 20.5 21.7 21.7 24.0 24.0 25.883 10.4 12.7 12.7 15.5 15.5 17.3 17.3 19.0 19.0 21.1 21.1 23.1 23.1 26.2 26.2 29.389 9.2 11.5 11.5 13.9 13.9 15.5 15.5 17.1 17.1 18.7 18.7 20.6 20.6 23.1 23.1 25.4
Avg. 10.2 12.5 12.5 15.0 15.0 16.7 16.7 18.3 18.3 20.1 20.1 21.8 21.8 24.4 24.4 26.8
Table 83—Clemons: Quadratic mean diameter, 1963–1994, by treatment, plot, and period (age in parentheses)
Treatment Plot
Centimeters
Calibrationperiod
1963–1966a
Age (years)
19 22
Treatmentperiod 1
1966–1970a
Age (years)
Treatmentperiod 2
1970–1973a
Age (years)
Treatmentperiod 3
1973–1976a
Age (years)
Treatmentperiod 4
1976–1980a
Age (years)
Treatmentperiod 5
1980–1984a
Age (years)
Treatmentperiod 6
1984–1989a
Age (years)
Treatmentperiod 7
1989–1994a
Age (years)
22 26 26 29 29 32 32 36 36 40 40 45 45 50

120 Table 84—Clemons: Total stem volume per hectare, 1963–1994, by treatment, plot, and period
Treatment Plot
a Columns are measurements after treatment and just before next treatment.
11 63 38 83 45 99 64 107 78 120 91 145 108 152 152 224 224 31464 32 71 46 97 63 103 77 119 92 145 107 149 149 216 216 29169 30 63 45 93 62 100 77 117 91 141 106 145 145 207 207 271
Avg. 34 72 46 96 63 103 77 119 91 143 107 149 149 216 216 292
2 81 29 67 46 102 70 114 94 136 121 184 168 223 223 309 309 40587 42 85 48 94 71 112 97 138 127 186 172 221 221 307 307 39890 38 87 47 105 69 112 93 128 119 166 166 216 216 296 296 380
Avg. 36 80 47 100 70 113 94 134 122 179 169 220 220 304 304 395
3 67 35 74 53 106 83 131 111 158 143 206 176 232 232 326 326 42871 29 62 51 102 80 128 107 164 137 202 170 230 230 322 322 42078 35 77 51 111 84 134 112 171 147 205 176 236 236 335 335 442
Avg. 33 71 52 107 82 131 110 165 142 204 174 233 233 328 328 430
4 66 33 71 53 105 87 136 123 183 167 239 222 289 289 392 392 49174 31 60 52 99 84 121 115 156 156 205 205 261 261 331 331 39591 41 93 56 119 90 142 125 161 161 228 221 271 271 370 370 480
Avg. 35 75 54 108 87 133 121 167 162 224 216 273 273 364 364 455
5 60 29 61 56 100 96 149 130 179 160 224 212 238 238 332 332 41761 33 74 60 124 101 160 139 199 181 265 227 300 300 422 422 55270 30 59 58 110 97 146 132 190 174 235 219 275 272 367 367 460
Avg. 31 65 58 111 98 152 134 190 172 242 219 271 270 374 374 476
6 62 30 66 59 120 95 153 127 176 144 223 176 239 239 339 339 45985 29 65 59 119 94 151 128 177 144 217 175 234 234 325 325 43488 40 86 64 133 102 165 137 180 150 213 181 239 239 339 339 442
Avg. 33 72 61 124 97 156 131 178 146 217 177 237 237 334 334 445
7 75 33 66 66 119 119 164 164 225 224 299 285 354 354 445 445 53282 31 68 67 137 127 189 177 238 231 300 289 356 356 457 457 55686 40 86 73 145 132 201 186 247 241 304 300 381 381 488 488 615
Avg. 35 74 69 134 126 185 176 236 232 301 291 364 364 463 463 568
8 59 35 74 70 137 120 170 162 219 198 269 237 308 308 403 403 51472 33 64 64 118 116 171 156 213 193 257 228 288 288 380 380 47573 31 63 63 122 116 176 157 219 194 262 230 294 294 385 385 483
Avg. 33 67 65 126 117 173 158 217 195 263 232 296 296 389 389 491
Control 58 61 110 110 187 187 261 261 333 333 410 410 471 471 542 542 63083 67 123 123 210 210 285 285 332 332 389 389 458 458 559 559 63989 51 102 102 182 182 263 263 347 347 435 435 503 503 605 605 710
Avg. 60 112 112 193 193 270 270 338 338 411 411 477 477 569 569 660
Cubic meters per hectare
Calibrationperiod
1963–1966a
Age (years)
19 22
Treatmentperiod 1
1966–1970a
Age (years)
Treatmentperiod 2
1970–1973a
Age (years)
Treatmentperiod 3
1973–1976a
Age (years)
Treatmentperiod 4
1976–1980a
Age (years)
Treatmentperiod 5
1980–1984a
Age (years)
Treatmentperiod 6
1984–1989a
Age (years)
Treatmentperiod 7
1989–1994a
Age (years)
22 26 26 29 29 32 32 36 36 40 40 45 45 50

The Forest Service of the U.S. Department of Agriculture is dedicated to the principleof multiple use management of the Nation’s forest resources for sustained yields ofwood, water, forage, wildlife, and recreation. Through forestry research, cooperationwith the States and private forest owners, and management of the National Forests andNational Grasslands, it strives—as directed by Congress—to provide increasinglygreater service to a growing Nation.
The U.S. Department of Agriculture (USDA) prohibits discrimination in all its programsand activities on the basis of race, color, national origin, gender, religion, age, disability,political beliefs, sexual orientation, or marital or family status. (Not all prohibited basesapply to all programs.) Persons with disabilities who require alternative means forcommunication of program information (Braille, large print, audiotape, etc.) shouldcontact USDA’s TARGET Center at (202) 720-2600 (voice and TDD).
To file a complaint of discrimination, write USDA, Director, Office of Civil Rights, Room326-W, Whitten Building, 14th and Independence Avenue, SW, Washington, DC20250-9410 or call (202) 720-5964 (voice and TDD). USDA is an equal opportunityprovider and employer.
Pacific Northwest Research Station
Web site http://www.fs.fed.us/pnwTelephone (503) 808-2592Publication requests (503) 808-2138FAX (503) 808-2130E-mail [email protected] address Publications Distribution
Pacific Northwest Research StationP.O. Box 3890Portland, OR 97208-3890

U.S. Department of AgriculturePacific Northwest Research Station333 S.W. First AvenueP.O. Box 3890Portland, OR 97208-3890
Official BusinessPenalty for Private Use, $300


![Brainf*ck Lexical Analysis - GitHub Pages€¦ · Brainf*ck Lexical Analysis Program: ++[>+[+]]. Program Tokens: INCREMENT INCREMENT LOOP_HEADER MOVE_RIGHT INCREMENT LOOP_HEADER INCREMENT](https://static.fdocuments.in/doc/165x107/5f98faba31b4de6080596e95/brainfck-lexical-analysis-github-pages-brainfck-lexical-analysis-program-.jpg)