FIGURE 15-1 Simplified cross section developed from site and subsurface characterization.
41
FIGURE 15-1 Simplified cross section developed from site and subsurface characterization.
-
date post
20-Dec-2015 -
Category
Documents
-
view
216 -
download
0
Transcript of FIGURE 15-1 Simplified cross section developed from site and subsurface characterization.

FIGURE 15-1
Simplified cross section developed from site and subsurface characterization.

FIGURE 15-2
Early geophysicist (or modern diviner).

FIGURE 15-3
Interpretation of a historic air photo of a landfill.

FIGURE 15-4
Workers in Level C protective equipment
sampling a tank truck.

FIGURE 15-5
Schematic of seismic survey.

FIGURE 15-6
Schematic of resistivity survey.

FIGURE 15-7
Terrain conductivity contours.

FIGURE 15-8
Ground-penetrating radar.

FIGURE 15-9
Magnetometer survey results.
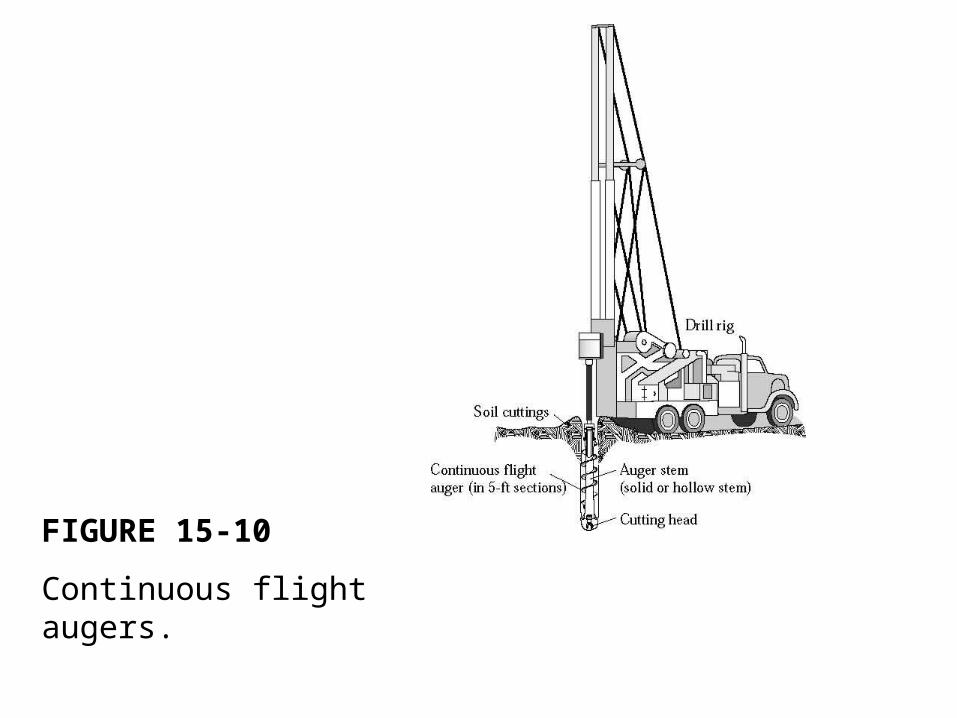
FIGURE 15-10
Continuous flight augers.

FIGURE 15-11
Solid- and hollow-stem augers.

FIGURE 15-12
Mud rotary drilling.

FIGURE 15-13
Standard penetration test.

FIGURE 15-15
Vane shear testing.

FIGURE 15-16
Correction to vane shear test results.

FIGURE 15-17
Dilatometer testing.

FIGURE 15-18
Water level measurement.

FIGURE 15-20
Thin-wall samplers.

FIGURE 15-20
Thin-wall samplers.

FIGURE 15-21
Rock coring equipment.

FIGURE 15-22
Typical monitoring well.

FIGURE 15-23
Perched water table.

FIGURE 15-24
Piezometer cluster in unconfined/confined aquifer system.

FIGURE 15-25
Piezometers in confined aquifer.

FIGURE 15-26
Multiple and nested wells.

FIGURE 15-27
Monitoring rock formations.

FIGURE 15-28
Multilayer aquifer system.

FIGURE 15-29
Drilling through contaminated aquifer.

FIGURE 15-30
Principle of soil gas surveys.

FIGURE 15-31
Mobile laboratory used for soil analysis.

FIGURE 15-32
Interior of mobile laboratory.

FIGURE 15-33
Site map.

FIGURE 15-34
GIS representation of contaminated
soil (Scenario II).

FIGURE 15-35
GIS representation of contaminated soil (Scenario V).

FIGURE 15-36
Contour map.

FIGURE 15-37
Three-dimensional representation of site topography.

FIGURE 15-38
Typical boring log.

FIGURE 15-39
Geologic profile.

FIGURE 15-40
Structural contour.

FIGURE 15-41
Isopac map.

November 8, 2000 13:51 lag93656_ch15 Sheet number 64 Page number 975 black
975
SECTION15-9
Case Study
.
FIGURE 15-43
Groundwater contours.