Redway_Elementary Physical Geography and Outline of Physiography (1900)

i
Contents
Contents ............................................................................................................................................. i
List of Figures.................................................................................................................................. iii
List of Tables ................................................................................................................................... iv
1. .................................................................................................................... 1 INTRODUCTION
1.1 Background to the project........................................................................................................ 1
1.2 Objectives ................................................................................................................................ 2
1.3 The project area........................................................................................................................ 3
1.3.1 Location, Topography and Accessibility .......................................................................... 3
1.3.2 Physiography and Climate ................................................................................................ 4
1.3.3 Regional setting ................................................................................................................ 8
1.4 Methodology, Data, Materials and Software used................................................................. 10
1.4.1 Methodology................................................................................................................... 10
1.4.2 Data and Material Used .................................................................................................. 11
1.4.3 Software used.................................................................................................................. 11
2. REMOTE SENSING AND GIS ANALYSIS .......................................................................... 13
2.1 Remote Sensing Analysis ...................................................................................................... 13
2.1.1 Drainage and Catchments Extraction.............................................................................. 13
2.1.2 Image processing and Interpretation............................................................................... 15
2.2 GIS Analysis .......................................................................................................................... 17
3. INTEGRATION OF REMOTE SENSING AND GIS ........................................................... 17
3.1. Introduction........................................................................................................................... 17
3.2 Factors Controlling Groundwater Occurrence in the Project Area........................................ 18
3.2.1 Drainage density ............................................................................................................. 18
3.2.2 Slope Steepness............................................................................................................... 22
3.2.4 Land Use/Land Cover ................................................................................................... 24
3.2.6 ....................................................................................................................... 27 Structure
3.2.7 Geomorphology .............................................................................................................. 32
3.2.8 Geology........................................................................................................................... 38
4. INTEGRATED ANALYSIS IN GIS ENVIRONMENT ........................................................ 51
4.2 GIS Modeling......................................................................................................................... 52
4.3 Weighting............................................................................................................................... 52

ii
5. RESULT..................................................................................................................................... 54
6. CONCLUSIONS AND RECOMMENDATION..................................................................... 58
6.1 Conclusion ............................................................................................................................. 58
6.2 Recommendation ................................................................................................................... 59
REFERENCES............................................................................................................................... 60

iii
List of Figures
FIGURE 1.1. LOCATION MAP OF THE PROJECT AREA........................................................................................................ 3
FIGURE 1.2 TOPOGRAPHIC MAP OF THE PROJECT AREA.................................................................................................. 4
FIGURE 1.3 MEAN ANNUAL RAINFALL CHART OF MEGA STATION .................................................................................. 5
FIGURE 1.4 MEAN ANNUAL RAINFALL CHART OF MOYALE STATION STATION................................................................ 6
FIGURE 2.1 ARC HYDRO DEMHYDROPROSESSING PROCESSES FOR DRAINAGE EXTRACTION ....................................... 14
FIGURE 2.2 PROJECT AREA IMAGES OF YEAR 2000 G. C., FALSE COLOR COMPOSITE OF BANDS 432 ........................... 16
FIGURE 2.3 PROJECT AREA IMAGE OF YEAR 2000 G. C., BAND RATIO OF BAND 4 AND 3.............................................. 16
FIGURE 3.1 DRAINAGE NETWORK OF THE PROJECT AREA ............................................................................................. 19
FIGURE 3.2 COMPARISON OF DRAINAGE AND LINEAMENT ORIENTATION ................................................................... 20
FIGURE 3.3 DRAINAGE DENSITY OF THE PROJECT AREA ................................................................................................ 20
FIGURE 3.4 RECLASSIFIED DRAINAGE DENSITY MAP...................................................................................................... 21
FIGURE 3.5 SLOPE MAP OF THE PROJECT AREA ............................................................................................................. 22
FIGURE 3.6 RECLASSIFIED SLOPE MAP OF THE PROJECT AREA ...................................................................................... 24
FIGURE 3.7 LAND USE/COVER MAP OF THE PROJECT AREA........................................................................................... 26
FIGURE 3.8 RECLASSIFIED LAND USE/COVER MAP OF THE PROJECT AREA.................................................................... 27
FIGURE 3.9 EDGE ENHANCEMENT OF PANCHROMATIC IMAGE (A) MAGNIFIED LINEAMENTS (B) DIGITIZED
LINEAMENTS ......................................................................................................................................................... 28
FIGURE 3.10 STRUCTURAL MAP OF THE PROJECT AREA ................................................................................................ 28
FIGURE 3.11 PROXIMITY TO GEOLOGICAL STRUCTURE MAP......................................................................................... 31
FIGURE 3.12 GEOMORPHOLOGY MAP OF THE PROJECT AREA ...................................................................................... 33
FIGURE 3.13 RECLASSIFIED GEOMORPHOLOGIC MAP OF THE PROJECT AREA .............................................................. 37
FIGURE 3.14 GEOLOGICAL MAP OF THE PROJECT AREA ................................................................................................ 38
FIGURE 3.15 RECLASSIFIED GEOLOGICAL MAP OF THE PROJECT AREA ......................................................................... 50
FIGURE 5.1 GROUND WATER POTENTIAL ZONES ANALYZED ON THE BASIS OF STRUCTURE, GEOLOGY, SLOPE,
GEOMORPHOLOGY, DRAINAGE AND LAND USE/COVER ...................................................................................... 54
FIGURE 5.2 DISTRIBUTION OF BOREHOLES IN GROUND WATER POTENTIAL ZONES..................................................... 56

iv
List of Tables
TABLE 1.1 SUMMARY OF MEAN RAINFALL DATA OF MEGA STATION, YEAR 1985‐2005 ................................................. 5
TABLE 1.2 SUMMARY OF MEAN RAINFALL DATA OF MOYALE STATION, YEAR 1986‐2005 ............................................. 5
TABLE 1.3 MEAN MONTHLY TEMPERATURE OF MEGA STATION..................................................................................... 6
TABLE 1.4 MEAN MONTHLY TEMPERATURE OF MOYALE STATION ................................................................................. 6
TABLE 3.1 THE CONTINUOUS RATING SCALE DEVELOPED BY SAATY (1977).................................................................. 18
TABLE 3.2 WEIGHT FOR DRAINAGE DENSITY.................................................................................................................. 21
TABLE 3.3 SLOPE AMOUNT CLASS IN THE PROJECT AREA.............................................................................................. 23
TABLE 3.4 WEIGHT FOR SLOPE THE PROJECT AREA ....................................................................................................... 23
TABLE 3.5 ARIAL EXTENT OF VARIOUS LAND USE/COVER CATEGORIES......................................................................... 25
TABLE 3.6 WEIGHT FOR LAND USE/COVER MAP............................................................................................................ 26
TABLE 3.7 WEIGHT FOR PROXIMITY TO GEOLOGICAL STRUCTURE MAP ....................................................................... 31
TABLE 3.8 WEIGHT FOR GEOMORPHOLOGY OF THE PROJECT AREA ............................................................................. 37
TABLE 3.9 GEOLOGIC UNITS GROUPED BASED ON THEIR GROUND WATER IMPORTANCE........................................... 49
TABLE 3.10 WEIGHT FOR GEOLOGY OF THE PROJECT AREA .......................................................................................... 50
TABLE 4.1 WEIGHT FOR ALL FACTOR MAPS ................................................................................................................... 53
TABLE 5.1 BOREHOLE DATA FROM DIFFERENT LOCALITIES OF THE PROJECT AREA ...................................................... 55

GROUNDWATER POTENTIAL ZONE MAPPING USING GIS AND REMOTE SENSING - MOYALE-TELTELE SUB BASIN -
DIRE, ARERO, YABELO AND TELTELE WOREDAS, BORENA ZONE OF OROMIA REGIONAL STATE
MAB CONSULT – CONSULTING HYDROGEOLOGISTS AND ENGINEERS 1 LAY VOLUNTEERS INTERNATIONAL ASSOCIATION (LVIA)
1. INTRODUCTION
1.1 Background to the project
Consultancy service contract agreement for the research in groundwater resource mapping using
Remote sensing and GIS Multi-Criteria decision technique in Moyale-Teltele sub basin at Dire,
Arero,Yabelo and Teltele Woredas, Borena Zone of Oromia Regional State was signed on April,
15 2009 between MAB Consult – Consulting Hydrogeologist and Engineers and LAY Volunteers
International Association. The project started the study activities as per the work program of the
Contract Agreement and vehicles were timely assigned for the project by the Client, collection of
previous data and reconnaissance fieldwork into the project area was undertaken.
Review of previous studies and field visit to the project area shows that a few studies have been
conducted in groundwater resource assessments using GIS and Remote Sensing Technique.
Previous works includes by (Getachew A. 2007), Integration of Remote Sensing and GIS for
Groundwater Resources Assessment in Moyale-Teltele Sub-basin, South Ethiopia
In Moyale-Teltele Groundwater Potential Assessment Project, due emphases was given in
investigation of different groundwater controlling factors. These factors were carefully analyzed
and integrated to produce groundwater potential map of the project area. The parameters used in
this project were:
i. Drainage Density
ii. Slope Steepness
iii. Land use/Land cover
iv. Geological Structures/Lineaments
v. Landforms/Geomorphology
vi. Lithology/Geology
Remotely Sensed data by its wide area coverage and multispectral nature has helped in
identification and mapping of most of the above factors with selective ground checks in a cost-
effective manner. An integrated analysis of these factors together with the available well and
ancillary data in the GIS environment was carried out in identifying the potential groundwater

GROUNDWATER POTENTIAL ZONE MAPPING USING GIS AND REMOTE SENSING - MOYALE-TELTELE SUB BASIN -
DIRE, ARERO, YABELO AND TELTELE WOREDAS, BORENA ZONE OF OROMIA REGIONAL STATE
MAB CONSULT – CONSULTING HYDROGEOLOGISTS AND ENGINEERS 2 LAY VOLUNTEERS INTERNATIONAL ASSOCIATION (LVIA)
zones. Target areas for conducting detailed hydrogeological and geophysical surveys on the
ground are narrowed to locate the site for drilling.
1.2 Objectives
General objective:
To delineate groundwater potential areas, in Yabelo, Arero and Teltele woredas (Moyale-Teletele
Sub Basin). Systematic groundwater studies utilizing Remote Sensing, field studies, Digital
Elevation Models (DEM) and Geographic Information Systems (GIS).
The specific objectives:
Prepare thematic maps of the area such as lithology, lineaments, landforms and slopes from
remotely sensed data and other data sources like DEM.
Assess groundwater controlling features by combining remote sensing, field studies and
DEM.
Identify and delineate groundwater potential zones through integration of various thematic
maps with GIS techniques.
Validate the result using secondary hydrogeological data
Recommendations for future work and provide guidelines for groundwater prospecting.
GROUNDWATER POTENTIAL ZONE MAPPING USING GIS AND REMOTE SENSING - MOYALE-TELTELE SUB BASIN -
DIRE, ARERO, YABELO AND TELTELE WOREDAS, BORENA ZONE OF OROMIA REGIONAL STATE
1.3 The project area
1.3.1 Location, Topography and Accessibility
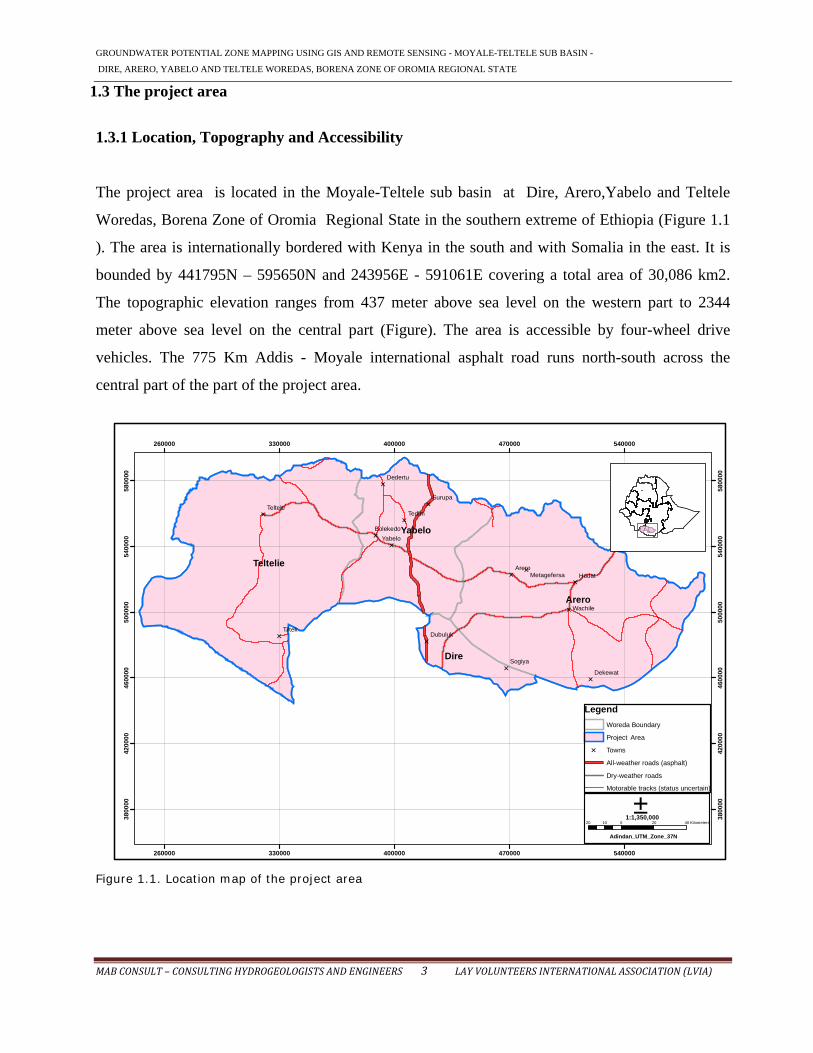
The project area is located in the Moyale-Teltele sub basin at Dire, Arero,Yabelo and Teltele
Woredas, Borena Zone of Oromia Regional State in the southern extreme of Ethiopia (Figure 1.1
). The area is internationally bordered with Kenya in the south and with Somalia in the east. It is
bounded by 441795N – 595650N and 243956E - 591061E covering a total area of 30,086 km2.
The topographic elevation ranges from 437 meter above sea level on the western part to 2344
meter above sea level on the central part (Figure). The area is accessible by four-wheel drive
vehicles. The 775 Km Addis - Moyale international asphalt road runs north-south across the
central part of the part of the project area.
××
××
×
×× ×
××
××
×
×
Arero
Teltelie
Yabelo
Dire
Tedim
AreroHudat
Surupa
Yabelo
Tiltek
Sogiya
Dedertu
Teltele
Wachile
Dubuluk
Dekewat
Bolekedo
Metagefersa
260000
260000
330000
330000
400000
400000
470000
470000
540000
540000
380
000
380
000
4200
00
4200
00
460
000
460
000
500
000
500
000
54
000
0
54
000
0
580
000
580
000
Legend
Woreda Boundary
Project Area
× Towns
All-weather roads (asphalt)
Dry-weather roads
Motorable tracks (status uncertain)
±20 0 20 4010 Kilometers
1:1,350,000
Adindan_UTM_Zone_37N
Figure 1.1. Location map of the project area
MAB CONSULT – CONSULTING HYDROGEOLOGISTS AND ENGINEERS 3 LAY VOLUNTEERS INTERNATIONAL ASSOCIATION (LVIA)

GROUNDWATER POTENTIAL ZONE MAPPING USING GIS AND REMOTE SENSING - MOYALE-TELTELE SUB BASIN -
DIRE, ARERO, YABELO AND TELTELE WOREDAS, BORENA ZONE OF OROMIA REGIONAL STATE
MAB CONSULT – CONSULTING HYDROGEOLOGISTS AND ENGINEERS 4 LAY VOLUNTEERS INTERNATIONAL ASSOCIATION (LVIA)
××
××
×
×× ×
××
××
×
×
Arero
Teltelie
Yabelo
Dire
o
Tedim
AreroHudat
Surupa
Yabelo
Tiltek
Sogiya
Dedertu
Teltele
Wachile
Dubuluk
Dekewat
Boleked
Metagefersa
270000
270000
300000
300000
330000
330000
360000
360000
390000
390000
420000
420000
450000
450000
480000
480000
510000
510000
540000
540000
570000
570000
390
000
390
000
42
000
0
42
000
0
45
000
0
45
000
0
48
000
0
48
000
0
51
000
0
51
000
0
54
000
0
54
000
0
57
000
0
57
000
0
60
000
0
60
000
0
±
Legend
Project Area
× Towns
20 0 20 4010 Kilometers1:1,350,000
Adindan_UTM_Zone_37N
Woreda Boundary
Elevation
Value in m
High : 2344.84
Low : 473.122
Figure 1.2 Topographic map of the project area
1.3.2 Physiography and Climate
The project area is included in the Moyale, Dire, Arero, and Teltele Woredas, Borena Zone of
Oromia Administrative Regional State and Moyale Woreda, Liben Zone of Somali Administrative
Regional State (Figure 1.1 ). The area is characterized by hot semi-arid climate experiencing high-
temperature, low rain fall and high evapotranspiration. This climatic condition is favorable to
sustain grasses and acacia trees. (Zenaw et al, 2000).
In the project area, there are two meteorological stations, which are located in Mega (38020'E,
4005'N) and Moyale (39004'E, 3031'N) 21 years of rainfall data was collected from the National

GROUNDWATER POTENTIAL ZONE MAPPING USING GIS AND REMOTE SENSING - MOYALE-TELTELE SUB BASIN -
DIRE, ARERO, YABELO AND TELTELE WOREDAS, BORENA ZONE OF OROMIA REGIONAL STATE
Meteorological Agency for the stations from 1985 to 2005. Summary of the mean rainfall
(mm/month) data is given in the table 1.1 and 1.2 below.
Table 1.1 Summary of mean rainfall data of Mega station, year 1985-2005
Month Jan Feb Mar April May June July Aug Sept Oct Nov Dec Total
Rainfall 16.7 41.3 80.6 142 74.7 17.1 14.7 5.0 7.3 74.5 57.9 41 572.8
Table 1.2 Summary of mean rainfall data of Moyale station, year 1986-2005
Month Jan Feb Mar April May June July Aug Sept Oct Nov Dec Total
Rainfall 17.5 22 42 148.9 65.6 13.4 7.4 4.9 13.5 83.5 82.2 30.2 531.1
From the rainfall data of the stations two short rainy seasons are observed in the project area. The
first rainy period lasts from March to May. The second rainy period lasts from October to
November, which is torrential in October. The main cause of the rainfall in this region is the
southward migrating Inter Tropical Convergence Zone (ITCZ) and westward propagating
disturbance from the Indian Ocean (Zenaw et al, 2000).
Rainfall in Mega Station
0.00
20.00
40.00
60.00
80.00
100.00
120.00
140.00
160.00
1 2 3 4 5 6 7 8 9 10 11 12
Time (Month)
Rainfall
Figure 1.3 Mean annual rainfall chart of Mega station
MAB CONSULT – CONSULTING HYDROGEOLOGISTS AND ENGINEERS 5 LAY VOLUNTEERS INTERNATIONAL ASSOCIATION (LVIA)

GROUNDWATER POTENTIAL ZONE MAPPING USING GIS AND REMOTE SENSING - MOYALE-TELTELE SUB BASIN -
DIRE, ARERO, YABELO AND TELTELE WOREDAS, BORENA ZONE OF OROMIA REGIONAL STATE
Rainfall in Moyale Station
0.00
20.00
40.00
60.00
80.00
100.00
120.00
140.00
160.00
1 2 3 4 5 6 7 8 9 10 11 12
Time (Month)
Rainfall
Figure 1.4 Mean annual rainfall chart of Moyale station Station
The above charts clearly show that the area has uniform rainfall pattern which is relatively low.
Since there is no variation in the mean annual rainfall of the two stations, it is not possible to
consider rainfall as input factor layer for the analysis.
ii) Temperature
The temperature of the project area is typical of tropical monsoon lands. In most cases the mean
monthly temperature exceeds 20oC. The daily average minimum temperature registered is 11.4oC
in the month of July in Mega Station and the daily average maximum temperature is 35.3oC
registered in Moyale Station. The hottest season extends from December to late March.
The summary of mean monthly air temperature of the stations is given below.
Table 1.3 Mean monthly temperature of Mega station
Month Jan Feb Mar April May June July Aug Sept Oct Nov Dec
T (oC) 20.6 21.0 20.3 19.5 18.3 16.8 16.1 16.9 18.3 18.9 19.2 19.8
Table 1.4 Mean monthly temperature of Moyale station
Month Jan Feb Mar April May June July Aug Sept Oct Nov Dec
T (oC) 24.9 25.5 25.0 23.0 21.8 20.6 19.9 20.5 21.6 22.0 22.5 24.9
MAB CONSULT – CONSULTING HYDROGEOLOGISTS AND ENGINEERS 6 LAY VOLUNTEERS INTERNATIONAL ASSOCIATION (LVIA)

GROUNDWATER POTENTIAL ZONE MAPPING USING GIS AND REMOTE SENSING - MOYALE-TELTELE SUB BASIN -
DIRE, ARERO, YABELO AND TELTELE WOREDAS, BORENA ZONE OF OROMIA REGIONAL STATE
MAB CONSULT – CONSULTING HYDROGEOLOGISTS AND ENGINEERS 7 LAY VOLUNTEERS INTERNATIONAL ASSOCIATION (LVIA)
ii) Potential Evapotranspiration
In tropical regions, where there is little change in temperature or duration of sunlight, potential
evapotranspiration is likely to be constant through out the year. The peneplained part of the area is
characterized by tall savannah grass with shrubs acacia and thorn bushes. The southern rugged
terrain bordering Kenya is composed of continuous dense shrubs with scattered small trees. The
vegetation cover over some part of the project area has contributed to increasing
evapotranspiration.
The average evapotranspiration of the project area is 1633 mm/yr at 1000 m.a.s.l. (Zenaw et al,
2000). In this report, the evapotranspiration has been estimated according to penman method. High
potential evapotranspiration values known in the lowlands exceed 1500mm/year (up to 2300
mm/year) with no water surplus throughout the area. The moisture deficits in the area reach
1047mm.

GROUNDWATER POTENTIAL ZONE MAPPING USING GIS AND REMOTE SENSING - MOYALE-TELTELE SUB BASIN -
DIRE, ARERO, YABELO AND TELTELE WOREDAS, BORENA ZONE OF OROMIA REGIONAL STATE
MAB CONSULT – CONSULTING HYDROGEOLOGISTS AND ENGINEERS 8 LAY VOLUNTEERS INTERNATIONAL ASSOCIATION (LVIA)
1.3.3 Regional setting
In southern Ethiopia, three major chrnostratigraphic units are known to occur namely Precambrian
crystalline basement, Mesozoic sediments, Cenozoic volcanics with sporadic sediments and
superficial deposits (Kazmin 1972; Merla 1973; Davidson 1983; and Teffera et al., 1996). The
metamorphic complex and associated plutonic rocks makeup the crystalline basement which are
the northern and southern continuation of the Mozambique belt (MB) and the Arabian Nubian
Shield (ANS), respectively (Kazmin, 1978; Chewaka and de Wit, 1981). The extensive
sedimentary rocks are result of marine transgression and regression of the Indian Ocean during
Mesozoic era (Purcel, 1981; Mohr 1986). The voluminous volcanic rocks with subordinate
lacustrine and fluviatile sediments overlying unconformably the crystalline basement are resulted
from extensional tectonics responsible for the formation of the East African Rift (Davidson, 1983;
Mohr, 1986; WoldeGebriel, 1987; and Ebinger, et al., 2000). Although three major time
stratigraphic units are known in southern Ethiopia, sedimentary rocks are virtually absent in the
area. The confine of the project area is partly within the East African Orogen, fossil fragments of a
Neoproterozoic Wilson cycle, (Stern, 1994) and partly at the southwestern ''broad rift zone''
(Davidson, 1983) of East African Rift system .
The Precambrian crystalline rocks of southern Ethiopia exhibit similar lithological associations and
structural features characteristic to both Mozambique belt and Arabian Nubian Shield to the south
and north, respectively. However, lithological association belonging to Mozambique belt, which
forms the local basement by far, exceeds the discontinuous lens like bodies of Arabian Nubian
Shield. Therefore, this region is situated in the transitional zone, where both are inter-fingering
mainly with imprints of Pan-African tectnothermal events (Vail, 1976; Kazmin et al., 1978;
Davidson, 1983). The Mozambique belt consists of high-grade, poly-deformed, metamorphosed
gneisses, and migmatites, psammo-pellitic schists and amphibolites that are commonly intruded by
felsic to mafic intrusions.
The high grade gneisses are juxtaposed with the low grade metavolcano-sedimentary rocks
suggesting a tectonic contact where considerable vertical movements took place, which are
commonly referred as orogen parallel shear zones (Abdelsalam and Stern, 1996; Worku, 1996). In

GROUNDWATER POTENTIAL ZONE MAPPING USING GIS AND REMOTE SENSING - MOYALE-TELTELE SUB BASIN -
DIRE, ARERO, YABELO AND TELTELE WOREDAS, BORENA ZONE OF OROMIA REGIONAL STATE
MAB CONSULT – CONSULTING HYDROGEOLOGISTS AND ENGINEERS 9 LAY VOLUNTEERS INTERNATIONAL ASSOCIATION (LVIA)
general, the low-grade rocks of southern Ethiopia defining linear belt plunge under Cenozoic
volcanics in the north and continue as discontinuous lenses southward up to the Ethio-Kenyan
boarder.
Granitoids ranging in composition from intermediate to acidic are widespread in southern Ethiopia,
especially in the gneissic terrain ranging in shape from elliptical to circular. It is worth mentioning
the outstanding en echelon arranged plutonic bodies of Gariboro, Ranu, and Arero represented by
distinct massif having considerable aerial coverage. Based on field relationships and geochemical
criteria, they are subdivided into pre-, syn-, and post- collisional (Worku, 1996; Woldehaimanot
and Brehmann, 1995; Piccerillo et al., 1998).
In the sector between the Ethiopian and Kenyan domal uplifts, the East African Rift system is
represented by more than 300 Km ''broad rift'' zone (Davidson and Rex, 1980; Davidson, 1983;
Woldegebriel and Aronson, 1987). It is characterized by overlapping either north-south, northeast-
southwest, and northwest-southeast trending two or more rift systems which is more than three
times the breadth of the Main Ethiopian Rift or Gregory Rift away from the zone of overlap. These
rift systems in southwestern Ethiopia mainly encompass the branches of Turkana rift in the west,
Chew Bahir rift, Ririba rift (Davidson, 1983; Woldegebriel, 1987) at the center, and Mega rift in
the east (this study).
The surface expression of the northeast trending Main Ethiopian Rift splays into north-south
trending Chamo and Segan basins separated from the narrow Gelana basin by Amaro horst. Until
recently, the southern terminus of the main Ethiopian Rift was considered to be a few Km south of
Amaro horst, around 5ºN latitude (Zanetten et al., 1978; Davidson, 1983; Woldegebriel et al.,
1991; Ebinger, 1993). However, both field mapping and satellite image interpretation
unequivocally demonstrated the Main Ethiopian Rift continue southward to join the Ririba rift.
Moreover, around Mega a series of northwest-southeast trending high scarp steep normal faults
with considerable strike length defining outstanding horsts and graben were recognized for the first
time in this study. Unlike the MER, which is characterized by north south trending faults, the
northwest southeast trending define the Mega rift in the broadly rifted zone of southern Ethiopia.
Proceeding further southeast in Kenya and northwest in southern Sudan Anza graben (Ebinger and
Ibrahim, 1994; Reeves et al., 1987; Hetzel and Strcker, 1993) and White Nile rift (Ebinger and
Ibrahim1994) are situated on same strike line, respectively.

GROUNDWATER POTENTIAL ZONE MAPPING USING GIS AND REMOTE SENSING - MOYALE-TELTELE SUB BASIN -
DIRE, ARERO, YABELO AND TELTELE WOREDAS, BORENA ZONE OF OROMIA REGIONAL STATE
MAB CONSULT – CONSULTING HYDROGEOLOGISTS AND ENGINEERS 10 LAY VOLUNTEERS INTERNATIONAL ASSOCIATION (LVIA)
Most sections exposed along the Rift margins of the Main Ethiopian Rift and southwestern
Ethiopian Rift are predominantly Tertiary and Quaternary volcanic rocks (Davidson, 1983;
Woldegebriel, 1987; Woldegebriel et al., 1991; Genzebu et al., 1994), except few localities where
crystalline basement is unconformably overlain by Mesozoic sedimentary and/or Tertiary volcanic
rocks (Woldegebriel, 1987). The Tertiary-Quaternary volcanic rocks are subdivided into two broad
categories based on whether erupted before or after the rifting. The presence of lacustrine and
fluviatile sediments intimately associated with basalt sheets of Miocene age overlying the tilted
blocks of pre-rift volcanics suggested the development of rift related basin during Early to Mid-
Miocene (Woldegebriel et al., 1991; Davidson, 1983). Therefore, volcanic rocks around and/or
within the rift are classified based on absolute age determinations, their spatial distribution, and
association with rift related sediments in to pre rift- and post rift succession. Thus basalt, salic
flows, pyroclastic rocks as well as hypabysal intrusions represent the Pre-rift successions. Where
as: rapidly built volcanic piles erupted from chains of vents controlled by fractures, widely spread
flood basalt sheets, cluster of vents and collapse caldera with much ejected material and little build
up of volcanic edifices, salic pyroclastic material incorporated into sediments as airborne tuffs
represent post-rift successions (Davidson, 1983).
1.4 Methodology, Data, Materials and Software used
1.4.1 Methodology
The research in groundwater resources was undertaken by well-programmed and integrated
approach set up on reliable methodology for data collection and review, carrying out field survey,
identification, selection and evaluation of well data it was completed in three phases:
1. Data collection and review of previous work
2. Data Analysis and Interpretation
3. Validation of results
Methodology for the investigation and study is summarized in flow chart (Fig. 1.5). It involves
catchment and drainage extraction using ARCHYDROG module, digital image processing for the
extraction of geomorphology, lithological, linear features, land use/cover etc... The field studies

GROUNDWATER POTENTIAL ZONE MAPPING USING GIS AND REMOTE SENSING - MOYALE-TELTELE SUB BASIN -
DIRE, ARERO, YABELO AND TELTELE WOREDAS, BORENA ZONE OF OROMIA REGIONAL STATE
MAB CONSULT – CONSULTING HYDROGEOLOGISTS AND ENGINEERS 11 LAY VOLUNTEERS INTERNATIONAL ASSOCIATION (LVIA)
were comprised of hydrogeological, structural and geomorphological investigations. DEM, which
is produced from SRTM, was used to extract lineaments and for landform mapping. All data were
integrated in a Geographic Information System (GIS) and analyzed to assess the groundwater
controlling features. Finally groundwater potential map was prepared based on GIS analysis.
1.4.2 Data and Material Used
The remote sensing data used for the study are Landsat Thematic Mapper (ETM+) (28.5 m.
resolution), Year 2000 with 7 bands and orthorectified. Primary data derived were land cover/use,
geomorphology, drainage density, lineaments and slope. Secondary data, which was modified and
used was lithology. GPS for point and rout data collection was used.
1.4.3 Software used
ARCHydro module was used for catchments delineation and drainage extraction.
Arcview 3.2a, Mapinfo 7 and ArcGis9 were used for GIS analysis.
ERDAS Imagine 8.6 and ENVI 4.2 were used for georeferencing, image analysis and coordinate
transformation of all the data used in to UTM 37 Zone, Adindan Datum.
DNRGARMIN, which is extension of arcview 3.2a, was used for transferring GPS data in to
computer.
Globalmapper 8 was used for analysis of landforms/Geomorphology,
IDRISI 32 for calculation of weight.

GROUNDWATER POTENTIAL ZONE MAPPING IN MOYALE-TELTELE SUB BASIN AT DIRE, ARERO, YABELO AND TELTELE WOREDAS, BORENA ZONE OF OROMIA REGIONAL STATE USING GIS AND
REMOTE SENSING
MAB CONSULT – CONSULTING HYDROGEOLOGISTS AND ENGINEERS 12 LAY VOLUNTEERS INTERNATIONAL ASSOCAITION
DEM
Thematic Maps Derived
GROUNDWATER
POTENTIAL MAP
GIS ANALYSIS
(Spatial Analysis)
DEMHYDROPROCESSING
SRTM V-3
SATELLITE DATA
Land sat ETM+)
Digital image
Processing
Interpretation of lithology,
Lineament, Land Use Land Cover
TOPO MAP
Hydrogeology
Well logs
Pump tests
Site information
FIELD STUDIES and AUXILLARY
DATA
SRTM
Drainage and Catchments Extraction
GIS Processing
(Building Database)
Drainage
Density
Slope
Steepness
Land Use/Cover Lineaments Geomorphology Geology
Interpretation of
Geomorphology
Figure 1.5 Flow chart showing data and methods employed for the study.

GROUNDWATER POTENTIAL ZONE MAPPING IN MOYALE-TELTELE SUB BASIN AT DIRE, ARERO, YABELO AND TELTELE WOREDAS, BORENA
ZONE OF OROMIA REGIONAL STATE USING GIS AND REMOTE SENSING
MAB CONSULT – CONSULTING HYDROGEOLOGISTS AND ENGINEERS 13 LAY VOLUNTEERS INTERNATIONAL ASSOCIATION (LVIA)
2. REMOTE SENSING AND GIS ANALYSIS
2.1 Remote Sensing Analysis
2.1.1 Drainage and Catchments Extraction
Drainage and catchments were extracted using ARC HYDRO module after eight consecutive
processes (Fig 2.1) on 4 SRTM data, which are described below:
IMPORTING of DEM derived from in to SRTM ArcGIS:
INTEPOLATION of the raster map in kriging methods to fill sinks (areas with no data) for
the undefined values, which are weighted average values, similar to a moving average
operation.
FLOW DIRECTION determination to determine into which neighboring pixel any water in
a central pixel will flow naturally.
FLOW ACCUMULATION that performs a cumulative count of the number of pixels that
naturally drains into outlets. The operation can be used to find the drainage pattern of a
terrain.
DRAINAGE NETWORK EXTRACTION of drainage based on user defined drainage length.
DRAINAGE ORDERING for assigning drainage order for each drainage line.
CATCHMENT MERGING for the extraction of catchments.

GROUNDWATER POTENTIAL ZONE MAPPING IN MOYALE-TELTELE SUB BASIN AT DIRE, ARERO, YABELO AND TELTELE WOREDAS, BORENA
ZONE OF OROMIA REGIONAL STATE USING GIS AND REMOTE SENSING
Raw DEM Catchments Definition
Fill Sink Catchments Extraction
Flow Direction Drainage Extraction
Figure 2.1 Arc Hydro DEMHYDROPROSESSING processes for drainage extraction
MAB CONSULT – CONSULTING HYDROGEOLOGISTS AND ENGINEERS 14 LAY VOLUNTEERS INTERNATIONAL ASSOCIATION (LVIA)

GROUNDWATER POTENTIAL ZONE MAPPING IN MOYALE-TELTELE SUB BASIN AT DIRE, ARERO, YABELO AND TELTELE WOREDAS, BORENA
ZONE OF OROMIA REGIONAL STATE USING GIS AND REMOTE SENSING
MAB CONSULT – CONSULTING HYDROGEOLOGISTS AND ENGINEERS 15 LAY VOLUNTEERS INTERNATIONAL ASSOCIATION (LVIA)
2.1.2 Image processing and Interpretation
i ) Pre-Processing
Satellite image of Landsat 7 sensor ETM with a map projection of UTM zone 37, spheroid and
datum WGS 84) has been used for most of the processing and mapping activities after re-
projection into Adindan datum, directional filter was done in order to digitize the existing
geological structures and the result was compared with the previous structural map of the area.
Printouts of different band combinations were used to identify features during field survey.
Digital elevation model (DEM) was derived from SRTM where slope data layer were produced.
Pre-processing of satellite images was done to correct distorted or degraded image data to create
a more faithful representation of the original scene and geometric distortion was calibrated using
this technique.
ii) Processing
Image enhancement such as contrast stretching, density slicing, edge enhancement, and spatial
filtering were done to enhance linear features and subdue other features extract more detail
information such like for visual interpretation
Image Transformation
Image transformation is done in order to differentiate between the various brightness values,
which are obtained from identical surfaces due to topographic slope and aspect, shadows, or
seasonal changes in sunlight illumination angle, and intensity.
For vegetation discrimination in land use/cover mapping band ratio of 4 to 3 band and false color
combinations in RGB order of bands 432 for Landsat 7 of ETM+ image was done. In the ration
image vegetation cover has shown light color where as in false color composite open forest has
brown to red color (Fig. 2.2).

GROUNDWATER POTENTIAL ZONE MAPPING IN MOYALE-TELTELE SUB BASIN AT DIRE, ARERO, YABELO AND TELTELE WOREDAS, BORENA
ZONE OF OROMIA REGIONAL STATE USING GIS AND REMOTE SENSING
MAB CONSULT – CONSULTING HYDROGEOLOGISTS AND ENGINEERS 16 LAY VOLUNTEERS INTERNATIONAL ASSOCIATION (LVIA)
240000
240000
270000
270000
300000
300000
330000
330000
360000
360000
390000
390000
420000
420000
450000
450000
480000
480000
510000
510000
540000
540000
570000
570000
390
000
390
000
4200
00
4200
00
4500
00
4500
00
480
000
480
000
5100
00
5100
00
5400
00
5400
00
570
000
570
000
6000
00
6000
00
±
20 0 20 4010 Kilometers1:1,350,000
Adindan_UTM_Zone_37N
Figure 2.2 Project area images of year 2000 G. C., false color composite of bands 432 240000
240000
270000
270000
300000
300000
330000
330000
360000
360000
390000
390000
420000
420000
450000
450000
480000
480000
510000
510000
540000
540000
570000
570000
390
000
390
000
420
000
420
000
450
000
450
000
48
000
0
48
000
0
510
000
510
000
540
000
540
000
570
000
570
000
600
000
600
000
±20 0 2010
1:1,350,000
Adindan_UTM_Zone_37N 40 Kilometers
Figure 2.3 Project area image of year 2000 G. C., band ratio of band 4 and 3

GROUNDWATER POTENTIAL ZONE MAPPING IN MOYALE-TELTELE SUB BASIN AT DIRE, ARERO, YABELO AND TELTELE WOREDAS, BORENA
ZONE OF OROMIA REGIONAL STATE USING GIS AND REMOTE SENSING
MAB CONSULT – CONSULTING HYDROGEOLOGISTS AND ENGINEERS 17 LAY VOLUNTEERS INTERNATIONAL ASSOCIATION (LVIA)
Image Classification
Image classification that involves the analysis of multispectral image data and the application of
statistically based decision rules for determining the land cover identification of each pixel in an
image. Unsupervised classification was performed in order to have a general idea of the area.
Supervised classification was performed for final land use/cover mapping.
2.2 GIS Analysis
The different inputs taken for GIS analysis were from topographic maps, different available
maps, Landsat satellite images and SRTM data. GIS analyses such as distance from geologic
structures, density of drainage, interpolation of rainfall point data, derivation of slope from
SRTM and overlay analysis for producing the groundwater potential area were done; moreover
weights and multi-criteria evaluation were done for analysis of the different parameters that
control groundwater occurrences.
All data layers derived were converted to raster data sets having the same pixel size. Each data
sets in a single map were given weight by pair-wise comparison in addition the factor maps were
compared each other in pair-wise comparison. Reclassification of each map was done based on
the weights produced. To produce groundwater potential zone map multi-criteria evaluation was
used.
3. INTEGRATION OF REMOTE SENSING AND GIS
3.1. Introduction
The present study has attempted to apply integrated remote sensing and GIS for generating new
thematic data layers as well existing data for delineating potential groundwater zone in Dire,
Arero, Yabelo and Teltele Woredas, Borena Zone of Oromia Regional State. The six thematic
layers taken for the determination of potential groundwater were drainage density, slope
steepness, land cover/use and distance from lineaments, geomorphology and lithology.

GROUNDWATER POTENTIAL ZONE MAPPING IN MOYALE-TELTELE SUB BASIN AT DIRE, ARERO, YABELO AND TELTELE WOREDAS, BORENA
ZONE OF OROMIA REGIONAL STATE USING GIS AND REMOTE SENSING
MAB CONSULT – CONSULTING HYDROGEOLOGISTS AND ENGINEERS 18 LAY VOLUNTEERS INTERNATIONAL ASSOCIATION (LVIA)
Prior to integration of the data sets, individual class weights and map scores were assessed based
on Satty’s Analytic Hierarchy Process (AHP) (Table 3.1); in this method the relative importance
of each individual class with in the same map were compared by each other by pair-wise and
eight importance matrices were prepared for assigning weight to each class.
Table 3.1 The continuous rating scale developed by Saaty (1977)
1/9
1/7
1/5
1/3
1
3
5
7
9
Extremely Very
strongly
Strongly Moderately Equally Moderately Strongly Very
strongly
Extremely
Less Important More Important
3.2 Factors Controlling Groundwater Occurrence in the Project Area
Factors that have significant influence in groundwater distribution and occurrence that are used
for integration to demarcate potential groundwater zones are:
3.2.1 Drainage density
The drainage network of the project area was derived from SRTM data and on screen digitization
from topographic map, the major rivers present in the project area Segen river which runs from
west to east, also the drainage is more denser in western part.
All the small river and large rivers, which are found in the project area drain from central part to
east and west direction.
Comparison of the drainage system of the area and structure has shown that the drainage system
of the area is structurally controlled following lineaments directions. Dendritic and parallel
drainage pattern are recognized, which are indicative of the presence of structures that act as
conduits or storage for sub-surface water. Structurally controlled drainage patterns are observed
in western and eastern part of the project area.

GROUNDWATER POTENTIAL ZONE MAPPING IN MOYALE-TELTELE SUB BASIN AT DIRE, ARERO, YABELO AND TELTELE WOREDAS, BORENA
ZONE OF OROMIA REGIONAL STATE USING GIS AND REMOTE SENSING
Arero
Teltelie
Yabelo
Dire
270000
270000
300000
300000
330000
330000
360000
360000
390000
390000
420000
420000
450000
450000
480000
480000
510000
510000
540000
540000
570000
570000
3900
00
3900
00
4200
00
4200
00
450
000
450
000
480
000
480
000
510
000
510
000
5400
00
5400
00
5700
00
5700
00
600
000
600
000
Legend
DraiageLine
Project Area
Woreda Boundary
±20 0 20 4010 Kilometers
1:1,350,000
Adindan_UTM_Zone_37N
Figure 3.1 Drainage network of the project area
The drainage density was calculated directly in Arcmap using spatial analyst extension. In the
project area, mainly 4 drainage density categories have been identified and mapped as shown in
(Fig.3.3). Very high drainage density is found in the western, eastern and northeastern part of the
project area whereas high drainage density is found scattered in allm parts of the project area.
Moderate and low drainage density concentrates in the southern and central part of the project
area.
MAB CONSULT – CONSULTING HYDROGEOLOGISTS AND ENGINEERS 19 LAY VOLUNTEERS INTERNATIONAL ASSOCIATION (LVIA)

GROUNDWATER POTENTIAL ZONE MAPPING IN MOYALE-TELTELE SUB BASIN AT DIRE, ARERO, YABELO AND TELTELE WOREDAS, BORENA
ZONE OF OROMIA REGIONAL STATE USING GIS AND REMOTE SENSING
Arero
Teltelie
Yabelo
Dire
270000
270000
300000
300000
330000
330000
360000
360000
390000
390000
420000
420000
450000
450000
480000
480000
510000
510000
540000
540000
570000
570000
39
0000
39
0000
42
000
0
42
000
0
45
000
0
45
000
0
48
000
0
48
000
0
5100
00
5100
00
5400
00
5400
00
570
000
570
000
600
000
600
000
Legend
DraiageLine
Geologic Structure
Project Area
Woreda Boundary
±20 0 20 4010 Kilometers
1:1,350,000
Adindan_UTM_Zone_37N
Figure 3.2 Comparison of drainage and lineament orientation
270000
270000
300000
300000
330000
330000
360000
360000
390000
390000
420000
420000
450000
450000
480000
480000
510000
510000
540000
540000
570000
570000
3900
00
3900
00
420
000
420
000
450
000
450
000
48
0000
48
0000
510
000
510
000
540
000
540
000
57
0000
57
0000
6000
00
6000
00
Legend
Project Area
Drainage Density
0 - 0.1
0.1 - 0.2
0.2 - 0.4
0.4 - 0.8
±20 0 20 4010 Kilometers
1:1,350,000
Adindan_UTM_Zone_37N
Figure 3.3 Drainage density of the project area
MAB CONSULT – CONSULTING HYDROGEOLOGISTS AND ENGINEERS 20 LAY VOLUNTEERS INTERNATIONAL ASSOCIATION (LVIA)

GROUNDWATER POTENTIAL ZONE MAPPING IN MOYALE-TELTELE SUB BASIN AT DIRE, ARERO, YABELO AND TELTELE WOREDAS, BORENA
ZONE OF OROMIA REGIONAL STATE USING GIS AND REMOTE SENSING
With respect to groundwater occurrences the higher drainage density is related to less infiltration
of water to the ground, which in turn leads to higher run off and vice versa. The pair-wise
comparison done based on this fact has shown that for areas with low drainage density higher
weight was calculated (Table 2) and vice versa and the reclassified map of drainage density
(Fig.3.3) was produced based on these weight.
Table 3.2 Weight for drainage density
(Km/Km2) Very
High
High Moder
ate
Low Weight
Weight
*
MAB CONSULT – CONSULTING HYDROGEOLOGISTS AND ENGINEERS 21 LAY VOLUNTEERS INTERNATIONAL ASSOCIATION (LVIA)
270000
270000
300000
300000
330000
330000
360000
360000
390000
390000
420000
420000
450000
450000
480000
480000
510000
510000
540000
540000
570000
570000
3900
00
3900
00
4200
00
4200
00
4500
00
4500
00
480
000
480
000
510
000
510
000
5400
00
5400
00
570
000
570
000
6000
00
6000
00
Legend
Project Area
6
12
30
52
±20 0 2010 Kilometers
1:1,350,000
Adindan_UTM_Zone_37N
100
Low 1 0.5232 52 Moderate 1/3 1 0.2976
30
High 1/7 1/3 1 0.1222 12
Very
High 1/9 1/7 1/3 1 0.0570 6
Consistency ratio = 0.03
Figure 3.4 Reclassified drainage density map

GROUNDWATER POTENTIAL ZONE MAPPING IN MOYALE-TELTELE SUB BASIN AT DIRE, ARERO, YABELO AND TELTELE WOREDAS, BORENA
ZONE OF OROMIA REGIONAL STATE USING GIS AND REMOTE SENSING
3.2.2 Slope Steepness
Slope Analysis
The slope amount map has been prepared using contours produced from SRTM 90m data and. In
relation to groundwater flat areas where the slope amount is low are capable of holding rainfall,
which in turn facilitates recharge whereas in elevated areas where the slope amount is high, there
will be high run-off and low infiltration. The method of producing the slope amount map is
described below
Method
Steps followed to prepare the slope amount of the project area are described below:
i. Derive DEM from SRTM.
ii. Importing in to ArcGIS
iii. Derivation of Slope Amount using Spatial Analysis and reclassification in to appropriate
classes.
MAB CONSULT – CONSULTING HYDROGEOLOGISTS AND ENGINEERS 22 LAY VOLUNTEERS INTERNATIONAL ASSOCIATION (LVIA)
270000
270000
300000
300000
330000
330000
360000
360000
390000
390000
420000
420000
450000
450000
480000
480000
510000
510000
540000
540000
570000
570000
390
000
390
000
420
000
420
000
4500
00
4500
00
480
000
480
000
510
000
510
000
5400
00
5400
00
5700
00
5700
00
600
000
600
000
Legend
Project Area
Value in Degree
0 - 2
2 - 6
6 - 13
13 - 21
21 - 55
± 20 0 20 4010 Kilometers
1:1,350,000
Adindan_UTM_Zone_37N
Figure 3.5 Slope map of the project area

GROUNDWATER POTENTIAL ZONE MAPPING IN MOYALE-TELTELE SUB BASIN AT DIRE, ARERO, YABELO AND TELTELE WOREDAS, BORENA
ZONE OF OROMIA REGIONAL STATE USING GIS AND REMOTE SENSING
The slope amount derived have shown that elevation is low in SE and Eastern part
Table 3.3 Slope amount class in the project area
Slope Class Slope in Degree
1 (0-2)
2 (2-6)
3 (6-13) 4 (13-21) 5 (21-55)
The mountain located on both side of Yabelo in the central part has an elevation which ranges
from 2249 m.a.s.l to 2344 m.a.s.l with slopes from 21% to 55%. The SE and SW part is
characterized by flat generally the area has high elevation in the NE central and NW which can
as well be confirmed by the drainage system flow direction. The slope amount map classified in
to five classes (Fig 3.6) has been prepared.
Pair-wise comparison done and the weight calculated (Table 3.4) for slope angle was based on
the fact that the flatter the topography (low slope angle) is the better are the chances for
groundwater accumulation. The reclassified map was produced based on the weight calculated
(Fig. 3.4).
Table 3.4 Weight for slope the project area
Flat
Gentle
Moderate
Steep
Very
Steep
Weight Weight
*
100
Flat 1 0.4978 50
Gentle 1/3 1 0.2680 27
Moderate 1/4 1/3 1 0.1362 14
Steep 1/7 1/5 1/3 1 0.0642 6
Very
Steep
1/9 1/7 1/5 1/3 1 0.0337
3
Consistency ratio = 0.05
MAB CONSULT – CONSULTING HYDROGEOLOGISTS AND ENGINEERS 23 LAY VOLUNTEERS INTERNATIONAL ASSOCIATION (LVIA)

GROUNDWATER POTENTIAL ZONE MAPPING IN MOYALE-TELTELE SUB BASIN AT DIRE, ARERO, YABELO AND TELTELE WOREDAS, BORENA
ZONE OF OROMIA REGIONAL STATE USING GIS AND REMOTE SENSING
270000
270000
300000
300000
330000
330000
360000
360000
390000
390000
420000
420000
450000
450000
480000
480000
510000
510000
540000
540000
570000
570000
39
00
00
39
00
00
42
000
0
42
000
0
45
00
00
45
00
00
48
000
0
48
000
0
51
00
00
51
00
00
540
00
0
540
00
0
57
00
00
57
00
00
600
00
0
600
00
0
Legend
Project Area
3
6
14
27
50
±20 0 20 4010 Kilometers
1:1,350,000
Adindan_UTM_Zone_37N
Figure 3.6 Reclassified slope map of the project area
3.2.4 Land Use/Land Cover
One of the parameters that influence the occurrence of sub-surface groundwater occurrence is
the present condition of land cover and land use of the area. The effect of land use / cover
is manifested either by reducing runoff and facilitating, or by trapping water on their leaf.
Water droplets trapped in this way go down to recharge groundwater. Land use/cover may also
affect groundwater negatively by evapotranspiration, assuming interception to be constant.
The land use/cover map of the area was readily interpreted from Landsat image by using
visual interpretation, unsupervised classification, supervised classification and print outs of
band 453,432 543 in RGB combinations.
For identification of vegetation cover band ration of band 4 to band 3 was done. After detailed
analysis the result was compared and corrected by data collected from different locations of
MAB CONSULT – CONSULTING HYDROGEOLOGISTS AND ENGINEERS 24 LAY VOLUNTEERS INTERNATIONAL ASSOCIATION (LVIA)

GROUNDWATER POTENTIAL ZONE MAPPING IN MOYALE-TELTELE SUB BASIN AT DIRE, ARERO, YABELO AND TELTELE WOREDAS, BORENA
ZONE OF OROMIA REGIONAL STATE USING GIS AND REMOTE SENSING
the area. Spot map with spatial resolution of 5m was also used to digitize settlements.
Comparison of Landsat image and topographic map of year 1975 has shown that there
is remarkable expansion of settlements since 1974, which negatively affect the groundwater
recharge of the area. The original vegetation is more preserved in area far from the main road .
This is due to the fact that people had made the natural forest to disappear on the flat lands near
to the main road and cultivate the land.
Classification of land use/cover for analysis was done based on their character to infiltrate water
in to the ground and to hold water on the ground. Generally settlements are found to be the least
suitable for infiltration and after pair-wise comparison of each class weight for each class was
calculated (Table 3.5). Reclassified map was produced based on the weight calculated (Fig. 3.8).
Table 3.5 Arial extent of various land use/cover categories
LandUC AreaSize
1 Water Body 236944301
2 Swamps 403955793
3 Sand Surface 85233691 4 Dense forest 172040954
5 Dense Bushland 7257709447
6 Open Bushland 312547789
7 Bush Shrub Grass Land 11015492699
8 Wood Grass land 1630677836
9 Agriculture Land 502752844
10 Open GrassLand 8312474247
11 Rock Surface 96827220
12 Settlements 5725396
Total 30,032,382,217
MAB CONSULT – CONSULTING HYDROGEOLOGISTS AND ENGINEERS 25 LAY VOLUNTEERS INTERNATIONAL ASSOCIATION (LVIA)

GROUNDWATER POTENTIAL ZONE MAPPING IN MOYALE-TELTELE SUB BASIN AT DIRE, ARERO, YABELO AND TELTELE WOREDAS, BORENA
ZONE OF OROMIA REGIONAL STATE USING GIS AND REMOTE SENSING
270000
270000
300000
300000
330000
330000
360000
360000
390000
390000
420000
420000
450000
450000
480000
480000
510000
510000
540000
540000
570000
570000
390
000
390
000
420
000
420
000
450
000
450
000
4800
00
4800
00
5100
00
5100
00
540
000
540
000
570
000
570
000
600
000
600
000
±20 0 20 4010 Kilometers
1:1,350,000
Adindan_UTM_Zone_37N
Legend
Water Body
Swamps
Sand Surface
Dense forest
Dense Bushland
Open Bushland
Bush Shrub Grass Land
Wood Grass land
Agriculture Land
Open GrassLand
Rock Surface
Settlements
Figure 3.7 Land use/cover map of the project area
Table 3.6 Weight for land use/cover map
Water
Body
Swamps
Sand
Surface
Dense
forest
Dense
Bushland
Open
Bushland
Bush
Shrub
Grass
Land
Wood
Grass
land
Agriculture
Land
Open
Grass
Land
Rock
Surface
Settle
ments
Weight Weight
*
100
Water Body 1 0.2411 24
Swamps 0.9 1 0.1926 19
Sand Surface 1/2 0.9 1 0.1488 15
Dense forest 1/3 1/2 0.9 1 0.1130 11
Dense
Bushland
1/4 1/3 1/2 0.9 1 0.0849 8
Open
Bushland
1/5 1/4 1/3 1/2 0.9 1 0.0633 6
Bush Shrub
Grass Land
1/6 1/5 1/4 1/3 1/2 0.9 1 0.0470 5
Wood Grass
land
1/7 1/6 1/5 1/4 1/3 1/2 0.9 1 0.0349 4
Agriculture
Land
1/8 1/7 1/6 1/5 1/4 1/3 1/2 0.9 1 0.0261 3
Open
GrassLand
1/9 1/8 1/7 1/6 1/5 1/4 1/3 1/2 0.9 1 0.0198 2
Rock Surface 1/10 1/9 1/8 1/7 1/6 1/5 1/4 1/3 1/2 0.9 1 0.0156 2
Settlements 1/11 1/10 1/9 1/8 1/7 1/6 1/5 1/4 1/3 1/2 0.9 1 0.0129 1
Consistency ratio = 0.02
MAB CONSULT – CONSULTING HYDROGEOLOGISTS AND ENGINEERS 26 LAY VOLUNTEERS INTERNATIONAL ASSOCIATION (LVIA)

GROUNDWATER POTENTIAL ZONE MAPPING IN MOYALE-TELTELE SUB BASIN AT DIRE, ARERO, YABELO AND TELTELE WOREDAS, BORENA
ZONE OF OROMIA REGIONAL STATE USING GIS AND REMOTE SENSING
270000
270000
300000
300000
330000
330000
360000
360000
390000
390000
420000
420000
450000
450000
480000
480000
510000
510000
540000
540000
570000
570000
3900
00
3900
00
4200
00
4200
00
4500
00
4500
00
4800
00
4800
00
5100
00
5100
00
5400
00
5400
00
5700
00
5700
00
6000
00
6000
00
±20 0 20 4010 Kilometers
1:1,350,000
Adindan_UTM_Zone_37N
Legend
1
2
3
4
5
8
11
15
19
24
Figure 3.8 Reclassified land use/cover map of the project area
3.2.6 Structure
Mapping of lineaments in the project area was done by visual interpretation of various digitally
enhanced single band (Fig.3.9) and multi band images that involves standard band combinations,
principal component analysis and directional filtering, since lineaments are the results of faults
and fractures they infer that they are the zone of increased porosity and permeability, which in
turn has greater significance in groundwater studies occurrence and distribution. Structural
features were interpreted from satellite imagery. In the imagery they were identified on the basis
of break of slope, truncation of terraces knick points, abrupt change in stream course, lithology,
vegetation, texture, drainage density etc.
The lineaments were identified by visual interpretation and interactive digitization (Fig.3.16c) in
the images. A final lineaments map was constructed from the digital enhancement of individual
single band and multiband images together with previous work.
MAB CONSULT – CONSULTING HYDROGEOLOGISTS AND ENGINEERS 27 LAY VOLUNTEERS INTERNATIONAL ASSOCIATION (LVIA)

GROUNDWATER POTENTIAL ZONE MAPPING IN MOYALE-TELTELE SUB BASIN AT DIRE, ARERO, YABELO AND TELTELE WOREDAS, BORENA
ZONE OF OROMIA REGIONAL STATE USING GIS AND REMOTE SENSING
MAB CONSULT – CONSULTING HYDROGEOLOGISTS AND ENGINEERS 28 LAY VOLUNTEERS INTERNATIONAL ASSOCIATION (LVIA)
270000
270000
300000
300000
330000
330000
360000
360000
390000
390000
420000
420000
450000
450000
480000
480000
510000
510000
540000
540000
570000
570000
3900
00
3900
00
42
0000
42
0000
450
000
450
000
4800
00
4800
00
510
000
510
000
540
000
540
000
5700
00
5700
00
6000
00
6000
00
±20 0 2010 Kilometers
1:1,350,000
Adindan_UTM_Zone_37N
Legend
Lineaments
a b
Figure 3.9 Edge enhancement of panchromatic image (a) magnified lineaments (b) digitized
lineaments
Rocks of the map sheet record major tectonic activities distinctly separated in space and time: the
first one is deformation accompanied by metamorphism in the Precambrian rocks while the
second was extensional tectonics with volcanism responsible for the formation of the rift.
Figure 3.10 Structural map of the project area

GROUNDWATER POTENTIAL ZONE MAPPING IN MOYALE-TELTELE SUB BASIN AT DIRE, ARERO, YABELO AND TELTELE WOREDAS, BORENA
ZONE OF OROMIA REGIONAL STATE USING GIS AND REMOTE SENSING
MAB CONSULT – CONSULTING HYDROGEOLOGISTS AND ENGINEERS 29 LAY VOLUNTEERS INTERNATIONAL ASSOCIATION (LVIA)
In the project area, the basement rocks are subjected to poly-phase deformation events including
folding, thrusting, and sheering, which impart a pervasive north south oriented regional and local
structures (Genzebu et al., 1994; Worku 1996; Yihunie and Tesfaye 1998 and reference therein).
The various structural elements including foliations, folds, lineations, shear zones, faults, and
lineaments characterizing the metamorphic rocks are merely the result of deformation and/or
metamorphism. The variations in size, shape, and orientation of these structural elements are
mainly attributed to style, nature of deformation, and rheological behavior of the rocks.
Cenozoic structures due to extensional tectonics in the rift valley terrain are largely primary
layering, flow direction, normal faults of variable magnitude, orientation, and strike length.
While the associated morpho-tectonic features predominantly comprise alluvial fans,
escarpments, triangular facets, and fabulous volcanic vents (i.e., crater, cinder-, spatter cones,
maars, and volcanic ramparts).
Primary layering ranging from few centimeters up to few meters are nicely represented in the
pre-rift succession of Jirarsa uplands and pyroclastic surge deposit of post rift volcanics. Both
textural and compositional inhomogeneuity define the primary layering, which can be readily
identified from aerial photographs as physiographic break. Besides, the pyroclastic surge deposit
commonly exposed at the crater rims and surroundings exhibit primary layering, which gradually
thins and dies out away from the crater mouth. Weather the disposition of this surge deposit is
symmetrical or directional could not be established due to absence of available section. It is
poorly sorted containing principally angular fragments of various rock types. The beds measures
up to few centimeters and differential weathering gave rise the pile a saw-and-tooth appearance
while holes are noted where rock fragments are released. In areas covered by recent lava, flow
directions depending upon the paleomorphology are readily discerned from aerial photographs
and satellite imagery.
Low- and high scarp faults with north south, northwest southeast, and northeast southwest trends
are exhibited in the volcanic terrain, despite the prevalence of low scarp faults over high scarp
faults. In the northwestern corner of the project area, the westerly tilted (up to 30°) Jirarsa
uplands with a strike length of 30 km in the map sheet is the southern continuation of Teltele
plateau. Triangular facets and alluvial fans indicatives of neo-tectonics decorate this westerly

GROUNDWATER POTENTIAL ZONE MAPPING IN MOYALE-TELTELE SUB BASIN AT DIRE, ARERO, YABELO AND TELTELE WOREDAS, BORENA
ZONE OF OROMIA REGIONAL STATE USING GIS AND REMOTE SENSING
MAB CONSULT – CONSULTING HYDROGEOLOGISTS AND ENGINEERS 30 LAY VOLUNTEERS INTERNATIONAL ASSOCIATION (LVIA)
tilted block covered by pre-rift succession standing more than 1000 m from the floor. Moreover,
the wide Arbala graben is situated south of the Sagan basin. It is worth noting the strong linear
trend of Ririba stream in the southwestern corner of the project area is due to low scarp fault
extending south in to Kenya beyond the map sheet. The wide Arbala graben covered by Tertiary
Bulal basalt is largely affected by north south and seldom by NNE-SSW trending low scarp
normal faults, which continue and merge with low scarp faults defining the Ririba Rift. The
pyroclastic surge deposits overlying the Bulal basalt commonly interrupt the strike continuation
of most of these low scarp normal faults. Moreover, the recent lava flow southwest of Goraye
village presumably of Quaternary age is impeded by low scarp fault at the southwestern corner
of the project area. The faulting has affected the Bulal basalt of probable Pliocene age (Davidson
1983) suggesting recent volcanism and continued tectonic activity. Unlike the surface expression
of the MER, which is characterized by north south trending high scarp steep faults, a series of
northwest southeast principal normal faults gave rise to a series of horst and graben morpho-
tectonic features around Mega. These northwest southeast trending high scarp steep faults have
considerable strike length in excess of 100 km defining the Mega Rift in the broadly rifted zone.
The spatial distribution of majority of the volcanic vents (that is, craters, maars, scoria-, and
spatter cones) appear to be controlled both by these low- and high scarp faults as most volcanic
centers are situated close and/or on these faults. A striking feature of the post rift volcanic
products is the presence of mantle nodules, essentially composed of pyroxene and olivine, of
variable size blanketed by thin aphyric basalt. It can be thus concluded that most of the normal
faults have considerable depth extension reaching at least up to upper mantle.
For analysis of lineaments in relation to groundwater prospective zones, distance analyses were
carried out and 4 classes were produced (Fig 3.17). Reclassified map of lineament (Fig.3.18) was
then produced based on the weight calculated (Table 11) after a pair-wise comparison done
based on the fact that areas closer to lineaments are the highest zone of increased porosity and
permeability which in tern have greater chance of accumulating groundwater.

GROUNDWATER POTENTIAL ZONE MAPPING IN MOYALE-TELTELE SUB BASIN AT DIRE, ARERO, YABELO AND TELTELE WOREDAS, BORENA
ZONE OF OROMIA REGIONAL STATE USING GIS AND REMOTE SENSING
MAB CONSULT – CONSULTING HYDROGEOLOGISTS AND ENGINEERS 31 LAY VOLUNTEERS INTERNATIONAL ASSOCIATION (LVIA)
270000
270000
300000
300000
330000
330000
360000
360000
390000
390000
420000
420000
450000
450000
480000
480000
510000
510000
540000
540000
570000
570000
3900
00
3900
00
4200
00
4200
00
4500
00
4500
00
480
000
480
000
5100
00
5100
00
540
000
540
000
570
000
570
000
6000
00
6000
00
±20 0 20 4010 Kilometers
1:1,350,000
Adindan_UTM_Zone_37N
Legend
4
12
26
58
Figure 3.11 Proximity to geological structure map
Table 3.7 Weight for proximity to geological structure map
Distance Very
Close
Close
Far
Very
Far
Weight
Weight
*
100
Very
Close
1 0.5812 58
Close 1/3 1 0.2599 26
Far 1/6 1/3 1 0.1195 12
Very
Far
1/9 1/7 1/5 1 0.0394 4
Consistency ratio = 0.07

GROUNDWATER POTENTIAL ZONE MAPPING IN MOYALE-TELTELE SUB BASIN AT DIRE, ARERO, YABELO AND TELTELE WOREDAS, BORENA
ZONE OF OROMIA REGIONAL STATE USING GIS AND REMOTE SENSING
MAB CONSULT – CONSULTING HYDROGEOLOGISTS AND ENGINEERS 32 LAY VOLUNTEERS INTERNATIONAL ASSOCIATION (LVIA)
3.2.7 Geomorphology
About half of the project area is situated in the ''broad rift zone'' of southwestern Ethiopia and the
remaining half to southeastern plateau. In this sector of the ''broad rift zone'' of southern
Ethiopia, north south trending low scarp faults characterize the Ririba rift presumably the
southern extension of the Main Ethiopian Rift. Whereas the transverse northwest-southeast
trending high scarp, steep faults around Mega resulted a series of outstanding horst and subdued
grabens due to abundant volcanic vents and accumulation of their products. Precambrian
crystalline rocks dominate the region falling in the southeastern plateau and granitic rocks
present outstanding physiographic features. In general elevation declines from north to south
except the Gamadu- and Mega ranges where step faults uplifted more than 1000 meters
crystalline rocks and gave rise to the highest known elevation in the map sheet. The lowest and
highest elevations are 740 and 2495 meters above sea level, respectively. Two main drainage
systems characterize the area, the Dawa and Ririba catchements. Tributaries of Dawa river drain
the eastern part, whereas the western part including the Rift valley terrain belongs to the Ririba
catchement.
The physiographic expressions of the area reflect type and structure of the bed rock, accordingly
physiographic forms vary greatly in bed rock type and structure: for example, between basalts
and acidic intrusive rocks and notably between Precambrian crystalline rocks and Cenozoic
block faulted mountain ranges. Contrasting landforms are noted on volcanic rocks of different
ages, for example basalt platform with stony soils overlying unconformably the metamorphic
rocks and recent aa type lava flows devoid of soil and vegetation. Moreover, the various volcanic
landforms (such as craters, cinder- spatter cones, maars, and volcanic ramparts) exhibit
spectacular physiographic expressions. Owing to these variations, the area is subdivided into
seven physiographic regions and presented from west to east as follows (Fig. 4).
i. Rift valley terrain
ii. Yabelo massif
iii. Rolling topography
iv. Alona plain
v. Ridge and valley terrain
vi. Arero massif
vii. Southern lowlands and associated inselbergs

GROUNDWATER POTENTIAL ZONE MAPPING IN MOYALE-TELTELE SUB BASIN AT DIRE, ARERO, YABELO AND TELTELE WOREDAS, BORENA
ZONE OF OROMIA REGIONAL STATE USING GIS AND REMOTE SENSING
270000
270000
300000
300000
330000
330000
360000
360000
390000
390000
420000
420000
450000
450000
480000
480000
510000
510000
540000
540000
570000
570000
39
00
00
39
00
00
420
00
0
420
00
0
45
00
00
45
00
00
48
000
0
48
000
0
51
000
0
51
000
0
54
000
0
54
000
0
57
000
0
57
000
0
600
00
0
600
00
0
±20 0 20 4010 Kilometers
1:1,350,000
Adindan_UTM_Zone_37N
Legend
Study_Area
Rift valley terrain
Yabelo massif
Rolling topography
Alona plain
Ridge and valley terrain
Arero massif
Southern lowlands and associated inselbergs
Figure 3.12 Geomorphology map of the project area
i) Rift valley terrain
In this subdivision a combination of type and structure of the rocks discern spectacular
physiographic expressions. The Rift valley terrain encompasses west of a line passing through
Soda crater and western flank of Yabelo massif. The rocks characterizing the wide physiographic
expressions are mainly horizontally piled up pre-Rift volcanic rocks, post-Rift sheets of basaltic
flows, and cluster of vents as well as craters with ejected material and edifices, Precambrian
crystalline basement. While, the structures are essentially boundary or subsidiary normal faults
which are often steep high scarp faults and rarely low scarp normal faults.
MAB CONSULT – CONSULTING HYDROGEOLOGISTS AND ENGINEERS 33 LAY VOLUNTEERS INTERNATIONAL ASSOCIATION (LVIA)

GROUNDWATER POTENTIAL ZONE MAPPING IN MOYALE-TELTELE SUB BASIN AT DIRE, ARERO, YABELO AND TELTELE WOREDAS, BORENA
ZONE OF OROMIA REGIONAL STATE USING GIS AND REMOTE SENSING
MAB CONSULT – CONSULTING HYDROGEOLOGISTS AND ENGINEERS 34 LAY VOLUNTEERS INTERNATIONAL ASSOCIATION (LVIA)
In the north western corner of this physiographic sub-division Jirarsa upland made up of
horizontally piled up pre-Rift volcanic rocks rises above 2100 meters above sea level standing
over 1000 meters from the surrounding plain. Principal normal fault on the eastern part gave rise
to westerly tilted block with triangular facets. The eastern boundary fault passing through
western flank of Yabelo massif and Soda crater is a low scarp normal fault, thus defining half
graben like structure. Further south north of Dilo this steep high scarp fault splays in to an array
of low scarp faults resulting typical steps. Around Mega a series of NNW-SSE trending steep
high scarp faults gave rise to basin-and-range like province of crystalline basement rocks.
Surface elevation in the horst blocks increases markedly westward giving rise to steep mountain
ranges and highlands. For instance, Gamedu mountain range stands over 1000 meters from the
floor and with strike length in excess of sixty Km. These horst blocks continue southward, while
to the northwest it abut intermittently into the rock floored and sediment filled half graben. Apart
from these outstanding mountain ranges, there are isolated elongated ridges and inselbergs with
erosinally-modified escarpment. The grabens in this basin-and-range like region are relatively
narrow 2-8 Km wide and subdued due to cluster of volcanic vents and accumulation of their
products mainly pyroclastic material.
The rocks exposed in the grabens are predominantly volcanic, except basement inselbergs. The
base of these horst blocks is commonly decorated by cone shaped colluvium and alluvial fans at
the mouth of main streams emanating from these physiographic features. Pysiographic features
in this part of the Rift owe their origin to be controlled both by rock types and structures i. e.,
faults associated with rifting.
Apart from the aforementioned physiographic feature, the various volcanic vents (i. e., cinder-,
spatter cones, craters, and maars) present notable landforms mainly situated on and/or close to
these normal faults. Most craters are single and circular, however, there are overlapping craters
such as Tinshu Dilo and Goraye craters, where a number of subsidiary collapsed vents define
swarm of craters. The size of cinder- and spatter cones varies markedly from few tens of meters
to few hundreds of meters. The shape varies from circular to elliptical either convex upward or
downward and breached to intact.
The Ririba low scarp fault controls the Ririba stream to flow almost in straight course of
considerable length for more than fifty Km. Most of the intermittent stream emerging from the
horsts disappear after draining shortly in the grabens or form temporary swamps.

GROUNDWATER POTENTIAL ZONE MAPPING IN MOYALE-TELTELE SUB BASIN AT DIRE, ARERO, YABELO AND TELTELE WOREDAS, BORENA
ZONE OF OROMIA REGIONAL STATE USING GIS AND REMOTE SENSING
MAB CONSULT – CONSULTING HYDROGEOLOGISTS AND ENGINEERS 35 LAY VOLUNTEERS INTERNATIONAL ASSOCIATION (LVIA)
ii) Yabelo massif
The Yabelo massif is a northwesterly southeasterly-aligned elliptical mountain mass with rugged
topography with maximum elevation rising up 2300 meters rising above sea level with forty and
eighteen Km in the longest and shortest dimensions, respectively. In the south the massif dies out
intermittently by isolated hills and ridges in the flat lying area. Whereas, in the north it is
characterized by deeply incised valleys with terraced morphological features and anomalously
high standing peaks. In this mountain range rare high standing widely jointed blocky rock
masses devoid of vegetation forming steep cliff are noted. Incorporation of older crustal material
within this massif is evident from the localized flat lying topography and deeply incised valleys.
It is worth mentioning the plain where the town of Yabelo is situated, where older crystalline
rocks are exposed.
iii) Rolling topography
West of the ridge and valley terrain gently sloping relatively small chain of ridges and broad
immature river courses characterize this physiographic feature. Topographically, these small
chains of ridge gradually slope southward and merge with the low lands and associated
inselbergs. This physiograpjic subdivision has developed partly on crystalline basement rock and
partly on stocks of acidic intrusive rocks.
iv) Alona plain
The Alona plain is characteristically a flat lying plain with stony soil capping the crystalline rock
covering considerable area and extends north into Agermariam sheet. The flat nature of this plain
is presumed to be a function of the horizontal attitude of the underlying Tertiary flow. The
thickness of this flow might not exceed a few meters as erosion exposed the underlying
crystalline rock at some localities as windows to look through older material.

GROUNDWATER POTENTIAL ZONE MAPPING IN MOYALE-TELTELE SUB BASIN AT DIRE, ARERO, YABELO AND TELTELE WOREDAS, BORENA
ZONE OF OROMIA REGIONAL STATE USING GIS AND REMOTE SENSING
MAB CONSULT – CONSULTING HYDROGEOLOGISTS AND ENGINEERS 36 LAY VOLUNTEERS INTERNATIONAL ASSOCIATION (LVIA)
v) Ridge and valley terrain
The ridge and valley terrain stretches linearly across the map sheet represented mainly by deeply
dissected “V” or “U” shaped valleys and continuous chains of mountains and erosinal remnants
of discontinuous ridges in the north and south, respectively. Whereas in the north. Most of the
isolated hills and elongated mountain chains in the southern and northern sector of this
physiographic sub-division exhibit smooth textures on aerial photographs and satellite imageries
attributed to grass cover and absence of trees. Unlike other physiograhic sub-divisions of the area
streams in the northern sector of ridge and valley terrain have matured courses and drains
northeasterly to join Dawa river.
vi) Arero massif
A striking landform is provided by Arero plutonic body in the northeastern part of the map sheet,
rising above 1800 meters above sea level. This north south aligned elliptical body with strike
length of more than sixty km. and breadth of 20 km. terminates gradually in the flat lying
lowlands in the south, whereas it continues to Ageremariam (NA37-10) sheet in the north. This
mountain range is characteristically rugged with deeply dissected narrow valleys whose eastern
and western flanks are moderately dipping. In the eastern part high outstanding peaks
characterized by widely spaced joints, blocky rock masses forming cliff and devoid of vegetation
are noted. Convex sheeting, that is, progressive rounding as successive sheets, another form of
exfoliation weathering, is noted in the western flank. Two outstanding post-tectonic granites
situated with in Arero massif exhibit circular physiographic features with central depression and
craggy peripheral part. Stream courses in this physiographic subdivision are commonly "V"-
shaped characterized by radial convergent or divergent drainage pattern draining at different
direction to join Dawa river.
vi) Southern lowlands and associated inselbergs
This physiographic subdivision covers vast area next to Rift valley terrain and predominantly
characterized by extensive flat lying plain with thick soil cover except ubiquitous steep sided
inselbergs and hills. In general elevation in this physiographic subdivision decreases southward

GROUNDWATER POTENTIAL ZONE MAPPING IN MOYALE-TELTELE SUB BASIN AT DIRE, ARERO, YABELO AND TELTELE WOREDAS, BORENA
ZONE OF OROMIA REGIONAL STATE USING GIS AND REMOTE SENSING
with an average elevation 1350 and 1800 meters above sea level for the plain and ubiquitous
inselbergs, respectively. Stream courses in this physiographic sub-division are broad and mostly
disappear shortly in the flat lying plain.
Table 3.8 Weight for geomorphology of the project area
Rift
valley
terrain
Southern
lowlands and
associated
inselbergs
Rolling
topography
Alona
plain
Ridge
and
valley
terrain
Arero
massif
Yabelo
massif
Weight
Weight
*
100
Rift valley terrain 1
0.3722
37
Southern
lowlands and
associated
inselbergs
1/2 1
0.2410
24
Rolling
topography
1/3 1/2 1
0.1534
15
Alona plain 1/4 1/3 1/2 1
0.0999
9
Ridge and valley
terrain
1/5 1/4 1/3 1/2 1
0.0652
7
Arero massif 1/8 1/5 1/4 1/3 1/2 1
0.0406
4
Yabelo massif 1/9 1/8 1/5 1/4 1/3 1/2 1
0.0276
3
Consistency ratio = 0.02
MAB CONSULT – CONSULTING HYDROGEOLOGISTS AND ENGINEERS 37 LAY VOLUNTEERS INTERNATIONAL ASSOCIATION (LVIA)
270000
270000
300000
300000
330000
330000
360000
360000
390000
390000
420000
420000
450000
450000
480000
480000
510000
510000
540000
540000
570000
570000
3900
00
3900
00
420
000
420
000
4500
00
4500
00
480
000
480
000
5100
00
5100
00
5400
00
5400
00
5700
00
5700
00
6000
00
6000
00
±20 0 20 4010 Kilometers
1:1,350,000
Adindan_UTM_Zone_37N
Legend
3
4
7
9
15
24
37
Figure 3.13 Reclassified geomorphologic map of the project area

GROUNDWATER POTENTIAL ZONE MAPPING IN MOYALE-TELTELE SUB BASIN AT DIRE, ARERO, YABELO AND TELTELE WOREDAS, BORENA
ZONE OF OROMIA REGIONAL STATE USING GIS AND REMOTE SENSING
3.2.8 Geology
The project area comprises two major litho-stratigraphic units ranging in age from Precambrian
to Quaternary, that is, Precambrian crystalline rocks and associated intrusives, Tertiary to
Quaternary volcano-sedimentary rocks and Quaternary superficial deposit.
270000
270000
300000
300000
330000
330000
360000
360000
390000
390000
420000
420000
450000
450000
480000
480000
510000
510000
540000
540000
570000
5700003600
00
3600
00
3900
00
3900
00
420
000
420
000
450
000
450
000
480
000
480
000
510
000
510
000
54
0000
54
0000
57
0000
57
0000
±20 0 20 4010 Kilometers
1:1,350,000
Adindan_UTM_Zone_37N
Legend
Banded gneiss (Pbg)
Augen granitic gneiss (Pagng)
Biotite bearing quartzofeldspatic gneiss (Pbqfg)
Graphite bearing marble and amphibolite (Pgms)
Undifferentiated mafic-ultramafic (Pmus)
Amphibole gneiss (Pag)
Megacrystic granite (Pmgt)
Granite (Pgt2)
Monzonite (Pmo)
Granodiorite (Pgd)
Arero granitoid (PAgt)
Weakly to distinictly foliated granite (Pgt1)
Bulale basalt (QBb)
Pyroclastic deposit (Qps)
Scoriaceous basalt (Tsc)
Undifferentiated volcanic rocks (Tuv)
Olivenphyric basalt (Tob)
Alluvial soil (Qa)
Elluvial soil (Qe)
Calcrite (Qcf)
Limestone (Jh)
Figure 3.14 Geological map of the project area
i) Precambrian crystalline rocks
The Precambrian crystalline rocks of the area comprise high-grade gneisses, schists, weakly to
moderately metamorphosed sedimentary-, basic volcanic- and mafic-ultramafic rocks. The
Precambrian crystalline rocks mostly occupy the eastern part of the project area, that is, west of
the line passing through Soda crater and western flank of Yabelo massif.
Exposures are often extensive and continuous in the mountain ranges, blocky and fragmental in
the ridges and hills, whereas patchy and discontinuous in the flat lying areas.
MAB CONSULT – CONSULTING HYDROGEOLOGISTS AND ENGINEERS 38 LAY VOLUNTEERS INTERNATIONAL ASSOCIATION (LVIA)

GROUNDWATER POTENTIAL ZONE MAPPING IN MOYALE-TELTELE SUB BASIN AT DIRE, ARERO, YABELO AND TELTELE WOREDAS, BORENA
ZONE OF OROMIA REGIONAL STATE USING GIS AND REMOTE SENSING
MAB CONSULT – CONSULTING HYDROGEOLOGISTS AND ENGINEERS 39 LAY VOLUNTEERS INTERNATIONAL ASSOCIATION (LVIA)
Banded gneiss intercalated with sporadic undifferentiated schists and marble (Pbg)
Banded gneiss and associated undifferentiated schists are the most wide spread crystalline
basement rocks in the project area. It is mainly exposed in the southwestern part of the project
area. Continuous and extensive outcrop is common in the horsts while in the inselbergs outcrop
is mainly discontinuous and patchy.
The fundamental feature of this map unit is compositional and textural heterogeneous lithologies
(which are evident even on outcrop scale) comprising mainly a suite of quartzofeldspathic rocks
that are variably interlayered with mafic gneisses, and intercalated with sporadic schists. The
compositional layering/banding ranges from few mm to some tens of meters, which virtually
appears a preferred orientation (i. e., foliation) on aerial photographs as well as on the outcrops.
Wide textural variation from massive through weakly foliated to distinctly foliated and from
medium grained to coarse-grained variety is common on outcrop scale. Differential weathering
gives the rock a typical saw-and-tooth appearance, which is distinct from far distance, and
ellipsoidal cavities up to 50 cm deep. In general the thickness and intensity of these mafic layers
decrease towards east. The rock unconformably underlies the Cenozoic volcanic rocks and has
concealed contact with other crystalline rocks due to soil cover. Closely spaced vertical and
horizontal presumably tensional joints gave the rock (especially the quartzofeldspathic
component) a slaby appearance. Moreover, sporadic concordant and/or discordant late stage very
coarse grained (1cm), pink pegmatite veins ranging in thickness from few tens of millimeters to
few meters intrude this unit.
Augen granitic gneiss (Pagng)
This map unit defines strike parallel lens like north west trending prominent ridges characterized
by craggy outcrop pattern at the top part. It is buff pink, medium to coarse grained, with
accentuated foliation, and with blocky outcrop pattern characterized by two sets of joint i., e.,
parallel and perpendicular to the foliation.
Biotite bearing quartzofeldspathic gneiss (Pbqfg)
A large part of the crystalline basement in the project area mainly consists of quartzofeldspathic
rock with variable modal abundance of biotite and amphibole as well as development of
layering. That is, at places the modal abundance of biotite predominates over the amphibole

GROUNDWATER POTENTIAL ZONE MAPPING IN MOYALE-TELTELE SUB BASIN AT DIRE, ARERO, YABELO AND TELTELE WOREDAS, BORENA
ZONE OF OROMIA REGIONAL STATE USING GIS AND REMOTE SENSING
MAB CONSULT – CONSULTING HYDROGEOLOGISTS AND ENGINEERS 40 LAY VOLUNTEERS INTERNATIONAL ASSOCIATION (LVIA)
content and vice versa, however, systematic variation can not be outlined. In the northern part of
the domain, elas (water wells), road cuts as well as river sections where exposures are
continuous much of this unit is relatively uniform and poorly layered. Whereas, in the south
where outcrop is scanty, differential weathering and erosion preferentially expose the leucocratic
layer which may mistake with deformed intrusive, particularly granite. The rock is exhumed by
pre- to syn tectonic granitoids especially along the contact with the low-grade rocks and in the
northern part of the domain and unconformably overlain by Cenozoic volcanic at places. In the
south its contact is not observed and clearly understood due to thick soil cover. The unit is
invariably intruded by pegmatite and quartz veins of variable dimension (1-10 cm thick) with
different orientation, mostly exhibiting pinch-and-swell structure. Unlike to the banded gneiss,
pegmatite veins intruding this litho unit contain hydrous minerals such as amphiboles and biotite.
The rock is pinkish gray to buff gray, medium grained, distinctly foliated defined by parallel
alignment of the mafic constituents.
Graphite bearing marble, talc-tremolite schist, and amphibolite (Pgms)
These intimately associated discontinuous patchy litho-units are exposed in the Rift valley
terrain mantled by eluvial cover and its relation with the nearby high-grade rock is neither
observed nor understood. The marble is grayish white to dirty white, coarse grained, with
compositional layering defined by alternating color variation i. e., felsic and mafic minerals
dominated layer gave the rock a banded appearance ranging from 1 to 3 cm thick. Talc-
tremolite-actinolite schist is dark green, fine to medium grained and massive to weakly foliated
with occasional sulfide bearing quartz veins and veinlets. The amphibolite is dark green, fine to
medium grained and with accentuated foliation, exhibiting compositional banding defined by
felsic- and mafic rich constituents.
Undifferentiated mafic-ultramafic rocks (Pmus)
Undifferentiated mafic-ultramafic rocks are persistently exposed through out the low-grade belt
across the sheet, despite its discontinuous outcrop pattern in the southern part of the belt.
Extensive and continuous outcrop of undifferentiated mafic-ultramafic rocks are exposed on the
eastern part of the belt, however, separate small lenses are found on the western part of the belt
and ubiquitously within the metavolcano-sedimentary assemblage. Repetitions of this mafic-
ultramafic lithounit across the belt might have some tectonic implication despite the absence of

GROUNDWATER POTENTIAL ZONE MAPPING IN MOYALE-TELTELE SUB BASIN AT DIRE, ARERO, YABELO AND TELTELE WOREDAS, BORENA
ZONE OF OROMIA REGIONAL STATE USING GIS AND REMOTE SENSING
MAB CONSULT – CONSULTING HYDROGEOLOGISTS AND ENGINEERS 41 LAY VOLUNTEERS INTERNATIONAL ASSOCIATION (LVIA)
systematic documentation to unravel it. Generally it forms strike parallel outstanding chains of
mountains in the northern part of the belt whereas as small discrete lenses in the southern part of
the belt, which in most cases is characterized by smooth topography at the top part attributed to
alteration. It’s peculiar photo-characteristic, that is, smooth texture due to grass cover, and
absence of trees makes their identification very easy on aerial photographs.
Compositionally this unit comprises:
a. talc-chlorite-tremolite schist
b. chlorite-talc schist
c. silicified ultramafic (birbirite)
and separation into mappable units at this scale impossible. Undifferentiated mafic-ultramafic
rocks exhibit variegated colors (i. e., silvery gray, grayish green, light green, yellowish brown),
and are fine to medium grained.
a) talc-chlorite-tremolite schist: This litho-unit make up the second largest rock type of the
undifferentiated mafic-ultramafic rocks. It is grayish gray, fine to medium grained, feels soapy
when touched with hands.
b) chlorite-talc schist: It occurs as lens like small patchy intercalation within the
metasediment. It is greenish gray to silvery gray, fine to medium grained and weekly foliated.
c) silicified ultramafic (birbirite): This litho-unit is often ridge forming exhibiting blocky out
crop pattern and commonly found at the top part. Its peculiar photo- characteristic, (i. e., smooth
texture, due to grass cover, and absence of trees) makes its identification very easy on aerial
photographs. It is yellowish brown, cryptocrystalline rock essentially oxidized and silicified
mafic-ultramafic rocks with box work/mesh like structure resulted from criss croosing quartz-
and magnesite veinlets. These mesh like structures are filled by reddish brown clayey material
and disseminated fibrous light green serpentine. Magnesite veins ranging from few centimeters
up to tens of centimeters have been encountered in most places. Rarely large crystals of
vermiculite have been noted associated with the serpentinite. In association with this altered
ultramafic, serpentinite is commonly found characterized by greenish green color, fine grained,
massive to weakly foliated.
Amphibole gneiss (Pag)
This unit commonly exposed as discontinuous small ridges and rarely as patchy discontinuous in
the flat lying area in the southern part of the eastern gneissic domain. Its contact is concealed
with thick soil cover and thus not understood. The rock is gray green to dark green, medium

GROUNDWATER POTENTIAL ZONE MAPPING IN MOYALE-TELTELE SUB BASIN AT DIRE, ARERO, YABELO AND TELTELE WOREDAS, BORENA
ZONE OF OROMIA REGIONAL STATE USING GIS AND REMOTE SENSING
MAB CONSULT – CONSULTING HYDROGEOLOGISTS AND ENGINEERS 42 LAY VOLUNTEERS INTERNATIONAL ASSOCIATION (LVIA)
grained, massive to distinctly foliated, and silicified at places expressed as stringers parallel to
the foliation containing sulfide mineralization.
Megacrystic biotite granite (PMgt)
It occurs two plutonic bodies in the northeastern part of the project area. These plutonic bodies
are bowl shape with a depression at the central part while the peripheral part is represented by
continuous craggy and mountainous topography. This circular pervasive planar fabric cut across
the main regional fabric trending meridional to submeridional.
The contact of this megacrystic granite with the country rock is highly tectonized and distinctly
foliated dipping steeply inwards. The intensity of the deformation decreases towards the center
of the intrusion, which gradually gets massive and characterized by blocky and sheet like outcrop
pattern. The rock is pink to buff pink, coarse to very coarse grained, massive, with randomly
oriented abundant large K-feldspar crystals (up to 50 mm long), which gave the rock
pegmatoidal appearance. Biotite and amphibole (hornblende) are the common mafic minerals in
the rock. Pegmatite veinlets and veins intrude the unit.
Granite (Pgt2)
This litho unit is exposed ubiquitously in the project area occurring as small inselbergs standing
high against the flat lying plain. These stocks like bodies commonly exhibit circular to sub-
circular outcrop pattern widely jointed with blocky rock masses forming steep cliff devoid of
vegetation and with steep contacts with the host rock as deduced from the outcrop pattern. The
top parts of these bodies are commonly cliff forming, while the foothill is commonly weathered
and kaolinized at places showing spheroidal weathering. Pegmatitic and quartz veins of variable
size and strike length have been noted. Rare xenoliths of the country rock are encountered in
some of these intrusions.
The rock is buff pink to pink, coarse grained to very coarse grained (at places porphyritic with
crystals up to 4 cm long), massive, textural and compositional variation is evident among
different bodies.
Monzonite (Pmo)
This elliptical intrusion is exposed west of Das village with longest dimension (10 km) across the
regional planar fabric. It crops out in Sidola and Kormanjeli hills while the former is elliptical
and the latter is circular exhibiting blocky outcrop pattern. The rock is light grey to buff pink,

GROUNDWATER POTENTIAL ZONE MAPPING IN MOYALE-TELTELE SUB BASIN AT DIRE, ARERO, YABELO AND TELTELE WOREDAS, BORENA
ZONE OF OROMIA REGIONAL STATE USING GIS AND REMOTE SENSING
MAB CONSULT – CONSULTING HYDROGEOLOGISTS AND ENGINEERS 43 LAY VOLUNTEERS INTERNATIONAL ASSOCIATION (LVIA)
coarse to very coarse grained (at places pegmatoidal with grain size reaching up to 1cm),
sometimes porphyritic with feldspar phenocrysts, and massive with no sign of deformation.
Exfoliation weathering is characteristics of this unit. One set of joints trending NW-SE and
dipping moderately to SW is observed.
Granodiorite (Pgd)
This intrusion is exposed in the northeastern part of the Map Sheet in the western gneissic terrain
and half of the body extends into Ageremariam Map Sheet. The metavolcano-sedimentary,
gneisses and pre-rift basalt to the east, west, and south flank this sub-circular intrusion,
respectively. It has a bowl shape with smooth topographic expression and outcrops are
commonly found as patches and big blocks.
The rock is buff grey to grayish white, medium grained, massive, with internal (color, textural,
and compositional) variations but not as diverse as larger intrusions, and at places exfoliated.
Arero granitoid (PAgt)
This plutonic body is named after a small village Arero, situated on the southern terminus of the
intrusion. This north south stretched concordant (i. e., parallel to the regional fabric) body is
elliptical in shape with twenty by forty kilometer in diameter represents an outstanding massif.
Although the contact of this map unit with adjacent enclosing units is covered with soil it is
presumably moderate as deduced from the outcrop pattern. It is worth noting that this plutonic
body represent the southern most intrusion of the three en echelon arranged prominent plutons in
the Adola area of southern Ethiopia, namely Gariboro, Ranu and Arero (Kozyrev et al., 1985;
Awoke and Meshesha 1993).
In general, the intrusive form very rugged topography dissected by deeply incised valleys giving
rise to commonly ''V'' and rarely ''U'' shaped valleys, at places with towering rocky blocks
forming steep cliffs devoid of vegetation. This plutonic body exhibit convex sheeting structure,
that is, progressive rounding of the intrusion as successive thin sheets (another form of
exfoliation) with no pervasive internal fabric which mistaken with foliation. This intrusion
exhibits wide textural and compositional variations even at the same outcrop. In general, the rock
grades from gneissose variety at the periphery to massive variety at the center of the body,
however, ubiquitous pods of purely undeformed massive porphyritic granites are common.
Although systematic compositional variation cannot be established the intrusion exhibit wide
compositional variations ranging from granodiorite through granites to alkali feldspar granite.

GROUNDWATER POTENTIAL ZONE MAPPING IN MOYALE-TELTELE SUB BASIN AT DIRE, ARERO, YABELO AND TELTELE WOREDAS, BORENA
ZONE OF OROMIA REGIONAL STATE USING GIS AND REMOTE SENSING
MAB CONSULT – CONSULTING HYDROGEOLOGISTS AND ENGINEERS 44 LAY VOLUNTEERS INTERNATIONAL ASSOCIATION (LVIA)
The rock is pink, buff pink, medium to coarse grained, massive to gneissose, widely jointed (i. e.,
sub-horizontal and vertical). The ubiquitous towering blocks are commonly pink, coarse to very
coarse grained, widely jointed, rich in K feldspar, and relatively fresh. At places it is intensely
weathered giving rise to kaolin, which is used for painting houses locally, it is only quartz that
can be identified from this weathered rock. It is leucocratic with color index 1 to 10, and with
varying proportion of mafic constituents.
Granite (Pgt1)
This map unit is mainly exposed as elliptical, sub-circular small discrete bodies concordant to the
regional fabric close and/or in contact to the low-grade rocks. Moreover, ubiquitous exposures of
this map unit are encountered through out the area. These intrusions are believed to consume the
low-grade rocks as evidenced by the presence of xenoliths, roof pendants and enclaves of the
low-grade rocks within it and pegmatitic veins in the ultramafic rocks. Apart from this, lensoidal
or chocolate shaped xenoliths of mafic gneisses are common in this unit exposed in the Rift
valley terrain. Those intrusions found close and/or in contact with the ultramafic exhibit
continuous closely spaced fractures, which are readily recognizable on aerial photographs giving
rise the rock slaby appearance. In general, this map unit is weathered except the top part, which
is characterized by blocky and relatively fresh outcrop. Both concordant and discordant
pegmatitic and quartz veins with variable thickness and strike length are common in this unit.
The rock is grayish pink to buff pink, medium to coarse grained, often weakly- to distinctly
foliated defined by alignment of mafic constituents stretched felsic constituents.
ii) Cenozoic volcanic rocks
Western part of the project area, that is, west of a line passing through Soda crater, Dubuluk
village, and western flank of Yabelo massif belongs to the broadly rifted zone of southwestern
Ethiopia and predominantly covered by Cenozoic volcanic rocks. Volcanic rocks in the area are
due to both central and fissural eruptions the former include large number of volcanic cones and
craters producing volcanic rocks mainly consisting of pyroclastic fall deposit and vesicular to
scoriaceous basalt, while the latter is represented by widespread bimodal sheet flows (Fig.3.14).
The craters/maars has variable size and shape ranging from few meters to few tens of meters in
diameter and nearly from circular to overlapping swarm of vents, respectively (Fig.3.14).
Similarly the shape of the volcanic cones (i. e., cinder- and spatter cones) varies from circular to
elliptical despite the presence of both breached and intact variety. Commonly their diameter is in

GROUNDWATER POTENTIAL ZONE MAPPING IN MOYALE-TELTELE SUB BASIN AT DIRE, ARERO, YABELO AND TELTELE WOREDAS, BORENA
ZONE OF OROMIA REGIONAL STATE USING GIS AND REMOTE SENSING
MAB CONSULT – CONSULTING HYDROGEOLOGISTS AND ENGINEERS 45 LAY VOLUNTEERS INTERNATIONAL ASSOCIATION (LVIA)
the order of few tens of meters and convex- upward and downward varieties are encountered. It
is worth noting most of the aforementioned volcanic vents are situated on and/or near the
principal boundary- or subsidiary normal faults.
The Cenozoic volcanic rocks are subdivided into two broad categories based on whether erupted
before or after rifting, namely pre rift- and post rift volcanics. The pre rift succession, whose
earliest flow range in age from mid to late Eocene (Davidson 1983), is represented by sub-
horizontally piled up basaltic, and salic (trachyte and trachybasalt) rocks overlying fault bounded
tilted blocks. It occupies predominantly the uplands of Jirarsa, Sarite, and Werersu mountain
chains in the northwestern corner of the project area The post rift succession comprises
widespread sheet of basaltic flows with variable textural attribute and pyoroclastic deposit. These
rocks are mainly exposed in the grabens, in the flat lying topography in the southwestern sector
of the project area.
Bulal basalt (QBb)
This litho-unit is the most widespread post rift volcanic rock in the project area occupying the
flat lying Arbala plain extending further south beyond Dilo and Goraye villages to adjacent
Sololo map sheet. This informal lithostratigraphic unit was introduced first by Davidson, (1983)
after a vast plain northwest of the map sheet known as Bulal extending to the map sheet. This
map unit lapse up against the westerly tilted Jirarsa, Sarite, and Werersu uplands covered by pre-
rift Miocene (Davidson 1983) salic volcanics in the western part of the project area, and thus has
an unconformable relationship with these rocks. While the base of this unit is not exposed
anywhere and nothing can be said about the contact nature with underlying unit. It is not possible
to know the exact thickness of the unit as there is no available section, however, it is estimated
not more than 20m as calculated from the 1:50000 topographic map. The rock occupies
commonly flat lying topography and faulted blocks with stony soil outcrop pattern and rarely as
horizontally layered continuous sheet. The unit essentially comprises a wide variety of texturally
inhomogeneous basic rocks namely: aphanitic basalt, vesicular basalt, and amygdaloidal basalt
whose separation into mapable units at this scale impossible.
The aphanitic basalt is mainly exposed as rounded subrounded boulders/blocks with brownish
gray weathering rinds enclosingblack to dark gray fresh core and rarely as patchy sheet. Locally,
flow lamination defined by colour variation with thickness ranging from 0.5-1.5 mm is noted.
The rock is black to dark gray, fine to medium grained, massive, locally with minor vesicles

GROUNDWATER POTENTIAL ZONE MAPPING IN MOYALE-TELTELE SUB BASIN AT DIRE, ARERO, YABELO AND TELTELE WOREDAS, BORENA
ZONE OF OROMIA REGIONAL STATE USING GIS AND REMOTE SENSING
MAB CONSULT – CONSULTING HYDROGEOLOGISTS AND ENGINEERS 46 LAY VOLUNTEERS INTERNATIONAL ASSOCIATION (LVIA)
ranging in diameter from 1 mm to 4 mm. At places, these vesicles are filled with calcite and
zeolite amygdale.
Pyroclastic and Scoria deposits (Qps)
Pyroclastic and scoria deposits are mainly crop out in the southwestern sector of the project area.
The former is commonly found occupying flat lying areas surrounding the rim of most notable
craters and maars ( Soda, and Goray) with maximum thickness at the crater rim gradually dying
out away from the crater. While the later crops out intermittently at cinder-, spatter cones,
volcanic ramparts and few meters down slope, at places the scoria and pyroclastic deposit
intermingle each other and separation of these unit is difficult at this scale, however, detailed
description of each lithounit is provided.
Generally it is gray, grayish white, grayish brown, poorly sorted, with distinct primary layering
(exhibits graded bedding, cross bedding structures) ranging in thickness from few mm up to
thirty cm. It essentially consists of rock fragments of banded gneiss, granite, basalt, and mantle
nodules. The size of these rock fragments range from few cm by cm to 1m by 0.5 m, that is, from
lapilli to blocks and bombs. The shape varies from angular to subangular. At places these rock
fragments are released and gave rise the map unit a jig-saw appearance. Ash fall deposit, lapilli
tuff, and agglomerate are the predominant type of pyroclastic deposits in the area, which in some
cases are interlayered. Commonly the thickness of this unit is maximum at the crater rim (up to
50 m) gradually dying out away from the crater, however, west of Mega town in a deeply
dissected narrow stream the thickness of the ash deposit is beyond the limit of observation (>100
m). This litho-unit has sharp contact with the other volcanic units and sometimes
unconformablly overlies the crystalline rock (e. g., Soda crater).
The scoria is reddish brown, grayish black and is formed of loosely packed/agglutinated cobble,
gravel, or lapilli sized cinder, which in some cases show graded bedding.
iii) Pre Rift volcanics
Scoriaceous basalt (Tsc)
This stratigraphically higher unit covers the upper most section (greater than 1500m elevation) of
jirarsa, Sarite, and Werersu uplands in the northwestern part of the project area overlying the
undifferentiated volcanic rocks.

GROUNDWATER POTENTIAL ZONE MAPPING IN MOYALE-TELTELE SUB BASIN AT DIRE, ARERO, YABELO AND TELTELE WOREDAS, BORENA
ZONE OF OROMIA REGIONAL STATE USING GIS AND REMOTE SENSING
MAB CONSULT – CONSULTING HYDROGEOLOGISTS AND ENGINEERS 47 LAY VOLUNTEERS INTERNATIONAL ASSOCIATION (LVIA)
The scoriaceous basalt exhibits a prominent horizontal layering with topographic break readily
seen on aerial photographs overlying the undifferentiated volcanic rocks. It is not more than 40m
thick. Although thin section from this unit is not available the texture ranges from aphyric to
scoriaceous, through mildly porphyritic, and amygdaloidal. The color varies from light gray to
brownish gray through light greenish green. The vesicles are some times filled with zeolites and
calcite amygdales.
Undifferentiated volcanic rocks (Tuv)
In the western part of the project area up to 500m thick undifferentiated volcanic rocks of pre-rift
succession make up the Jirarsa, Sarite, and Werersu uplands which is tilted approximately 30º
towards westerly. It essentially comprises of basalt and subordinate trachyte/trachybasalt with
wide textural attributes at places separated by different thin (up to 70cm) backed zones.
There are at least four observable basaltic flows separated by backed zones, which at places
reach up to 70cm in thickness. The number and thickness of flows differ from place to place and
there exists considerable variation in texture among the different flows (i. e., aphyric,
porphyritic, layered, amygdaloidal, and scoriaceous). The salic (trachyte/trachybasalt) volcanic
rocks exhibit wide range of textural and compositional attributes, that is, from aphyric to
porphyritic, massive, through flow banded and glassy (with devitrified glass in some sections).
Compositional variation from trachyte to trachybasalt through volcanic ash and tuff are noted in
this package. The trachyte is light gray to gray and greenish gray on fresh outcrops, with flow
banding structure, and at places silicified and brecciated.
Olivine phyric basalt (Tob)
This litho unit overlies unconformablly the Precambrian crystalline rocks in the northern part of
the area. It is designated as Lower Basalt and radiometric age dating from this unit ranges from
36.7 to 44.9 Ma (Woldegebriel et al., 1994) despite samples were taken from similar map units
far from the olivine phyric basalt is exposed. This unit covers flat lying area with sub-horizontal
layering, with stony soil outcrop pattern. They weather characteristically to rounded boulder with
thin grayish brown weathering rinds enclosing dark gray fresh core. Some granitic hills stand
fairly above the basalt sheet in the western part of this flow. The rock is dark gray, porphyritic,
rarely vesicular and vesicles are filled by calcite amygdale.

GROUNDWATER POTENTIAL ZONE MAPPING IN MOYALE-TELTELE SUB BASIN AT DIRE, ARERO, YABELO AND TELTELE WOREDAS, BORENA
ZONE OF OROMIA REGIONAL STATE USING GIS AND REMOTE SENSING
MAB CONSULT – CONSULTING HYDROGEOLOGISTS AND ENGINEERS 48 LAY VOLUNTEERS INTERNATIONAL ASSOCIATION (LVIA)
iv) Superficial Deposits
Considerable part of the project area (i. e., 57%) was covered by superficial deposits occupying
the flat lying areas which are broadly subdivided into three namely alluvium, elluvium, and
calcrete with subordinate ferricrete.
Alluvium (Qa)
Alluvial deposit occupies streambeds, flood plains, stream banks, and rarely defines alluvial fans
at the mouth of some rivers. It mainly consists of sand, silt, clay in various proportions with
some pebbles and cobles and the color varies from grayish white through reddish brown to black.
The constituent minerals of the sand and silt are chiefly quartz, feldspar, rounded to subrounded
rock fragments, and subordinate magnetite, biotite, and white micas. Near Web village very thick
unconsolidated loose sand with thin layer of calcrete ranging in thickness from 15 to 20 meters
were noted in a water well (Ela) probably representing a paleochanel. In the rift valley terrain
some of the streams ended up in alluvial fans.
Elluvium (Qe)
This unit comprises of residual and transported soils occupying flat lying and gentle topography
represented by sand, silt, clay, and gravels in various proportions. The color varies mainly from
black, through reddish brown sometimes to grayish white and constituent minerals mainly
quartz, feldspar, rock fragments with subordinate biotite and magnetite and white micas. The
thickness of this unit is unknown as the base can be seen.
Calcrete (Qcf)
This lithounit is exposed ubiquitously in the project area occupying ridge tops, flat lying areas
and flood plains as thin sheets (few meters thick), lenticular, and elongated. It is chiefly grayish
white to buff white rarely with yellowish brown and reddish brown varieties, fine grained to
cryptocrystalline, with some clasts of rock fragments. Although this unit is mapped as calcrete
there are subordinate ferricrete and silcrete, which are characterized by reddish brown and buff
white color, respectively. They are chiefly composed of fine cryptocrystalline carbonate with
subordinate minerals and rock fragments of gravel and pebble size. At places they exhibit
horizontal layering readily recognizable from aerial photographs. Moreover, laminations defined
by color variation and convolute folding suggesting their deposition under sub aerial
environment.

GROUNDWATER POTENTIAL ZONE MAPPING IN MOYALE-TELTELE SUB BASIN AT DIRE, ARERO, YABELO AND TELTELE WOREDAS, BORENA
ZONE OF OROMIA REGIONAL STATE USING GIS AND REMOTE SENSING
Table 3.9 Geologic units grouped based on their ground water importance
lithology Rank Group Importance
MAB CONSULT – CONSULTING HYDROGEOLOGISTS AND ENGINEERS 49 LAY VOLUNTEERS INTERNATIONAL ASSOCIATION (LVIA)
Calcrite (Qcf) 1
Alluvial soil (Qa) 1
Group1
Elluvial soil (Qe) 2
Group2
Pyroclastic deposit (Qps) 3
Group3
Limestone (Jh) 4
Group4
Scoriaceous basalt (Tsc) 5
Group5
Olivenphyric basalt (Tob) 6
Undifferentiated volcanic rocks (Tuv) 6
Bulale basalt (QBb) 6
Group6
Biotite bearing quartzofeldspatic gneiss
(Pbqfg) 7
Granite (Pgt2) 7
Augen granitic gneiss (Pagng) 7
Graphite bearing marble and amphibolite
(Pgms) 7
Granodiorite (Pgd) 7
Megacrystic granite (Pmgt) 7
Decreasing
Importance
Weakly to distinictly foliated granite
(Pgt1) 7
Banded gneiss (Pbg) 7
Monzonite (Pmo) 7
Amphibole gneiss (Pag) 7
Arero granitoid (PAgt) 7
Group7
Undifferentiated mafic-ultramafic (Pmus) 7

GROUNDWATER POTENTIAL ZONE MAPPING IN MOYALE-TELTELE SUB BASIN AT DIRE, ARERO, YABELO AND TELTELE WOREDAS, BORENA
ZONE OF OROMIA REGIONAL STATE USING GIS AND REMOTE SENSING
Table 3.10 Weight for geology of the project area
Group1
Group2
Group3
Group4
G4roup5
Group6
Group7
Weight
Weight
*
100
Group1 1 0.3728 37
Group2 1/2 1 0.2442 24
Group3 1/3 1/2 1 0.1553 16
Group4 1/4 1/3 1/2 1 0.0986 10
Group5 1/6 1/4 1/3 1/2 1 0.0627
6
Group6 1/8 1/6 1/4 1/3 1/2 1 0.0398 4
Group7 1/9 1/8 1/6 1/4 1/3 1/2 1 0.0267
3
Consistency ratio = 0.02
270000
270000
300000
300000
330000
330000
360000
360000
390000
390000
420000
420000
450000
450000
480000
480000
510000
510000
540000
540000
570000
570000
3900
00
3900
00
420
000
420
000
450
000
450
000
4800
00
4800
00
5100
00
5100
00
540
000
540
000
570
000
570
000
6000
00
6000
00
±20 0 20 4010 Kilometers
1:1,350,000
Adindan_UTM_Zone_37N
Legend
3
4
6
10
16
24
37
Figure 3.15 Reclassified geological map of the project area
MAB CONSULT – CONSULTING HYDROGEOLOGISTS AND ENGINEERS 50 LAY VOLUNTEERS INTERNATIONAL ASSOCIATION (LVIA)

GROUNDWATER POTENTIAL ZONE MAPPING IN MOYALE-TELTELE SUB BASIN AT DIRE, ARERO, YABELO AND TELTELE WOREDAS, BORENA
ZONE OF OROMIA REGIONAL STATE USING GIS AND REMOTE SENSING
MAB CONSULT – CONSULTING HYDROGEOLOGISTS AND ENGINEERS 51 LAY VOLUNTEERS INTERNATIONAL ASSOCIATION (LVIA)
4. INTEGRATED ANALYSIS IN GIS ENVIRONMENT
The main objective of the study is to generate groundwater potential zone of the based on
different thematic maps by considering their relevance to groundwater occurrence. In order to
produce the potential groundwater zone map detailed GIS analysis of eight thematic maps was
conducted. A groundwater model was constructed using ArgGIS model builder engine (Fig 4.1).
Using the model all maps were rasterized, reclassified and given appropriate weight in order to
integrate them for multi criteria evaluation (MCE).
The following steps have been followed to produce groundwater potential zone:
i. Selection of data for an input based on their groundwater controlling parameters.
ii. Using the model personal geodatabse and feature dataset was prepared and each data set
that was produced from previous work, remote sensing imagery, digital elevation model
(DEM), topographic maps and field observation were imported into geodatabase to have
the same spatial reference.
iii. All the data sets were then converted into raster grid in the model in order to perform
different GIS analysis between data layers such as overlay analysis.
iv. All the data sets were reclassified based on their importance to groundwater potentiality
(availability).
v. Prior to integration of the data sets, individual class weights and map scores were
assessed based on Satty’s Analytic Hierarchy Process (AHP) (Table 1); in this method
the relative importance of each individual class with in the same map and factor maps are
compared each other and important matrices are produced with calculated weight using
WEIGHT module of IDRSIS32. The matrices have consistence known as consistency
ratio (CR). Satty recommends that matrices with CR rating greater than 0.1 should be re-
evaluated. The weights derived from this method were normalized after multiplying them

GROUNDWATER POTENTIAL ZONE MAPPING IN MOYALE-TELTELE SUB BASIN AT DIRE, ARERO, YABELO AND TELTELE WOREDAS, BORENA
ZONE OF OROMIA REGIONAL STATE USING GIS AND REMOTE SENSING
MAB CONSULT – CONSULTING HYDROGEOLOGISTS AND ENGINEERS 52 LAY VOLUNTEERS INTERNATIONAL ASSOCIATION (LVIA)
by 100 and rounded to integer value to avoid complexities of computation in further
analysis.
vi. Eight matrices for pair-wise comparison of each data set in a single map with calculated
weight of each data set was produced and the factor maps were reclassified based on the
weight calculated.
vii. After a pair-wise comparison of each factor maps based on their influence to groundwater
occurrence a single matrix (Table 14) with calculated weight of each factor map was
produced.
4.2 GIS Modeling
In order to delineate potential groundwater site in the projec area , all the data sets were
integrated using the model constructed in ArcGIS model builder engine (Fig 4.1). The final map
was produced by Weighted Linear Combination (WLC) where each class individual’s weight
was multiplied by the map scores and then adding the results:
S = Wi Xi
Where S = Suitability
Wi = Weight for each map score
Xi = Individual map
4.3 Weighting
In order to apply multi-criteria evaluation (MCE), a set of relative weights was assigned for each
map using WEIGHT module of IDRISI 32. The procedure mentioned in section 5.1 step vii was
followed using continuous rating scale developed by Satty (1977) (Table 1). The weights
calculated for each factor map were the results of pair-wise comparisons of each factor map
based on their relative importance to groundwater accumulation.

GROUNDWATER POTENTIAL ZONE MAPPING IN MOYALE-TELTELE SUB BASIN AT DIRE, ARERO, YABELO AND TELTELE WOREDAS,
BORENA ZONE OF OROMIA REGIONAL STATE USING GIS AND REMOTE SENSING
Table 4.1 Weight for all factor maps
Lineament
Distance
Geolog
y
Slope
Steepness
Geomor
phology
Drainage
Density
Land
use/Cover
Weight
Weight
*
100
Lineament
Distance
1 0.4046 40
Geology 1/2 1 0.2468 25
Slope
Steepness
1/3 1/2 1 0.1647
16
Geomorphology 1/5 1/3 1/3 1 0.0984
10
Drainage
Density
1/8 1/5 1/3 1/4 1 0.0583 6
Land Use
/Cover
1/9 1/8 1/6 1/3 1/5 1 0.0273
Consistency ratio = 0.07
3
MAB CONSULT – CONSULTING HYDROGEOLOGISTS AND ENGINEERS 53 LAY VOLUNTEERS INTERNATIONAL ASSOCIATION (LVIA)

GROUNDWATER POTENTIAL ZONE MAPPING IN MOYALE-TELTELE SUB BASIN AT DIRE, ARERO, YABELO AND TELTELE WOREDAS,
BORENA ZONE OF OROMIA REGIONAL STATE USING GIS AND REMOTE SENSING
5. RESULT
The delineation of groundwater potential zones by reclassifying into different potential zones;
Very Good, Good, Moderate, Fair and Poor (fig 5.1) was made by utilizing the model designed
using ARCGIS model builder engine. The map produced has shown that the groundwater
potential of the project area is related mainly to lineaments, geology and slope.
Arero
Teltelie
Yabelo
Dire
240000
240000
270000
270000
300000
300000
330000
330000
360000
360000
390000
390000
420000
420000
450000
450000
480000
480000
510000
510000
540000
540000
570000
570000
390
000
420
000
420
000
450
000
450
000
4800
00
4800
00
5100
00
5100
00
540
000
540
000
570
000
570
000
6000
00
6000
00
±20 0 20 4010 Kilometers
1:1,350,000
Adindan_UTM_Zone_37N
Legend
Groundwater Potential
Poor
Fair
Moderate
Good
Very Good
Figure 5.1 Ground water potential zones analyzed on the basis of structure, geology, slope,
geomorphology, drainage and land use/cover
The validity of the model developed was tested against the borehole data, where out of 40 with
yield borehole data collected from the study area 21 are on very good and good zones, 12 on
moderate zones, 5 on fair and 1 on poor zones (Fig. 5.2).
MAB CONSULT – CONSULTING HYDROGEOLOGISTS AND ENGINEERS 54 LAY VOLUNTEERS INTERNATIONAL ASSOCIATION (LVIA)

GROUNDWATER POTENTIAL ZONE MAPPING IN MOYALE-TELTELE SUB BASIN AT DIRE, ARERO, YABELO AND TELTELE WOREDAS,
BORENA ZONE OF OROMIA REGIONAL STATE USING GIS AND REMOTE SENSING
Table 5.1 Borehole data from different localities of the project area
NO NAME Easting Northing Discharge(L/S) Potential
1 Dhaka Kalla 320975 552429 1 Poor
2 Birindar 350065 566262 4 Fair
3 Ghendile 313937 545560 4 Fair
4 Chilanko 389737 541642 0.5 Fair
5 YABELO ETH/027 400211 543067 0.2 Fair
6 DAS ETH/041 468462 465848 0.5 Fair
7 Nekayo/Mermero 305786 513683 7.2 Moderate
8 Harodimtu 478665 525964 1 Moderate
9 Mermero 305774 514001 7.2 Moderate
10 Metagefersa 478665 525964 1 Moderate
11 Millemi 321643 559592 0.62 Moderate
12 Surupha 423502 567889 0.45 Moderate
13 Dololo Merkala1 378646 539472 0.66 Moderate
14 El-leh 400413 524294 1 Moderate
15 WACHILE ETH/005 507209 502191 0.1 Moderate
16 Y ABELO ETH/026 404255 539723 6.5 Moderate
17 Sarite/Giwesa 346964 545325 3.25 Moderate
18 Utalo 389294 520566 2 Moderate
19 kello 314774 565086 3.5 Good
20 Afura 412109 550665 1.25 Good
21 Billa 317086 550869 5.5 Good
22 Did hara 429402 532064 0.5 Good
23 Horbate 338110 523280 5.8 Good
24 QA-GOFA ETH/042 433479 470795 1 Good
25 Horbate/Ambo 338052 523061 5.8 Good
26 Haro wayu 1 398981 516768 1.6 Very Good
27 Hoboq 306254 505927 7.5 Very Good
28 walenso 496909 498110 3.2 Very Good
29 Mormora 349378 538949 2 Very Good
30 Orbati1 347744 535635 2.17 Very Good
31 ANOLE ETH/024 439801 476795 0.3 Very Good
32 DUBLUK ETH/025 420030 482730 0.5 Very Good
33 GAYU EHT/BH5 448327 466494 0.7 Very Good
MAB CONSULT – CONSULTING HYDROGEOLOGISTS AND ENGINEERS 55 LAY VOLUNTEERS INTERNATIONAL ASSOCIATION (LVIA)

GROUNDWATER POTENTIAL ZONE MAPPING IN MOYALE-TELTELE SUB BASIN AT DIRE, ARERO, YABELO AND TELTELE WOREDAS,
BORENA ZONE OF OROMIA REGIONAL STATE USING GIS AND REMOTE SENSING
34 UDET ETH/BH4 526727 525631 1.5 Very Good
35 Dubluk Town 420112 482697 6 Very Good
36 Adegelchet 378395 533283 0.66 Very Good
37 Goray/Melka Sedeka 338000 454149 4 Very Good
38 Harewayu 398972 516763 9 Very Good
39 Dubluk area 425179 477832 0.5 Very Good
40 Dubluk Town 419909 482961 0.5 Very Good
Arero
Teltelie
Yabelo
Dire
240000
240000
270000
270000
300000
300000
330000
330000
360000
360000
390000
390000
420000
420000
450000
450000
480000
480000
510000
510000
540000
540000
570000
570000
390
000
420
000
420
000
450
000
450
000
4800
00
4800
00
5100
00
5100
00
540
000
540
000
570
000
570
000
6000
00
6000
00
±20 0 20 4010 Kilometers
1:1,350,000
Adindan_UTM_Zone_37N
Legend
Discharg L/sGroundwaterPotential
Poor
Fair
Moderate
Good
Very Good
0.10 - 1.00
1.01 - 2.17
2.18 - 4.00
4.01 - 6.50
6.51 - 9.00
Figure 5.2 Distribution of boreholes in ground water potential zones
Moreover out of 40 bore holes (with yield data), bore holes with yield between 4 l/s to 9 l/s
are on the very good and good zones which reflects the actual groundwater potential (Fig. 5.2).
Although some wells exist in all groundwater potential zones, the best yielding wells lie in the
very good and good groundwater prospect zone.
The model generated will help as a guideline for designing a suitable groundwater exploration
plan in the future. The spatial distributions of the various groundwater potential zones obtained
MAB CONSULT – CONSULTING HYDROGEOLOGISTS AND ENGINEERS 56 LAY VOLUNTEERS INTERNATIONAL ASSOCIATION (LVIA)

GROUNDWATER POTENTIAL ZONE MAPPING IN MOYALE-TELTELE SUB BASIN AT DIRE, ARERO, YABELO AND TELTELE WOREDAS,
BORENA ZONE OF OROMIA REGIONAL STATE USING GIS AND REMOTE SENSING
from the model generally show regional patterns of lineaments, drainage, landform and
lithology.
Spatially the very good and good categories are distributed along areas near to lineaments and
less drainage density and where the lithology is affected by secondary structure and having
interconnected pore spaces. This highlights importance of lineaments, geology and
hydrogeomorphological parameters in the project area.
Areas with moderate groundwater prospects are attributed to contributions from combinations
of the land use/cover, lithology, slope and landform. The low to poor categories of
groundwater potential zones are spatially distributed mainly along ridges where slope class is
very high, the lithology is compact/massive and far from lineaments.
MAB CONSULT – CONSULTING HYDROGEOLOGISTS AND ENGINEERS 57 LAY VOLUNTEERS INTERNATIONAL ASSOCIATION (LVIA)

GROUNDWATER POTENTIAL ZONE MAPPING IN MOYALE-TELTELE SUB BASIN AT DIRE, ARERO, YABELO AND TELTELE WOREDAS,
BORENA ZONE OF OROMIA REGIONAL STATE USING GIS AND REMOTE SENSING
6. CONCLUSIONS AND RECOMMENDATION
6.1 Conclusion
The main objective of this project is to use GIS and Remote sensing technique for the
assessment, evaluation and analysis of spatial distribution of ground water potential zones with
in an area of 30,086 km2. Ground water potential zone map have been produced using eight
thematic maps from satellites images, exiting data and field data. Produced ground water
potential zone map were compared and validated by existing discharge data obtained from
different localities of the project area. The result showed fairly significant correlation or
agreement with the discharge data.
This study has shown that large spatial variability of ground water potential. This variability
closely followed variability in the structure, geology, geomorphology and land use/cover in the
project area. The most promising potential zone in the area is related to volcanic rock of which
is affected, by secondary structure and having interconnected pore spaces, with plain
geomorphic feature and less drainage density. Most of the zones with fair to poor groundwater
potential lie in the massive basements unit which is far from lineaments.
This study generally demonstrates that GIS and Remote sensing techniques in combination
with field data could be used for the assessments of ground water potential zones in an area
with little primary porosity and low bedrock hydraulic conductivity and where hydrogeological
properties are mainly determined by secondary factors fracture zones and associated
weathering. It can be considered as a time and cost-effective tool for delineations and
identification of high ground water potential target area.
MAB CONSULT – CONSULTING HYDROGEOLOGISTS AND ENGINEERS 58 LAY VOLUNTEERS INTERNATIONAL ASSOCIATION (LVIA)

GROUNDWATER POTENTIAL ZONE MAPPING IN MOYALE-TELTELE SUB BASIN AT DIRE, ARERO, YABELO AND TELTELE WOREDAS,
BORENA ZONE OF OROMIA REGIONAL STATE USING GIS AND REMOTE SENSING
6.2 Recommendation
Remote sensing data are powerful tools to improve our understanding of groundwater systems.
Despite unable to measure hydrogeological properties directly, they provide continuous
detailed terrain information and allow the mapping of features significant to groundwater
development there fore it is important to incorporate them in the data collection stage of
groundwater exploration works.
Despite various satellite data with different spectral and spatial resolutions coupled with digital
image processing techniques help to produce detailed maps, ground verification is crucial to
increase the accuracy of the interpretation results. The result obtained from this study should
be supported by subsurface data obtained from geophysical study.
Since geology, geomorphology and lineament mainly control the distribution occurrence and
flow of groundwater, analysis of these parameters should be supported by high-resolution
terrain data and satellite imagery.
MAB CONSULT – CONSULTING HYDROGEOLOGISTS AND ENGINEERS 59 LAY VOLUNTEERS INTERNATIONAL ASSOCIATION (LVIA)

GROUNDWATER POTENTIAL ZONE MAPPING IN MOYALE-TELTELE SUB BASIN AT DIRE, ARERO, YABELO AND TELTELE WOREDAS,
BORENA ZONE OF OROMIA REGIONAL STATE USING GIS AND REMOTE SENSING
REFERENCES
Abdelsalam, M. G., and Stern, R. J., 1996. Sutures and shear zones in the Arabian-Nubian
Shield. Jour. Afri. Earth Sci. 23, 289-310.
Awoke, H., and Meshesha, S., 1993. The Geology and Structure Afleta area, (S. Ethiopia).
Ethiopian Institute of Geological Surveys, Note No. 380, Addis Ababa, pp. 1-30.
Davidson, A., and Rex, D. C., 1980. Age of volcanism and rifting in southwestern Ethiopia.
Nature 283, 657-658.
Davidson, A., (Compiler) 1983. Reconnaissance geology and geochemistry of parts of
Ilubabor, Kefa, Gemu Gofa, and Sidamo, Ethiopia. The Omo river Project.
Ethiopian Institute of Geological Surveys, Addis Ababa, Bull. No. 2, pp. 1-129.
de Wit, M., J., and Chewaka, S., 1981. Plate tectonic evolution of Ethiopia and the origin of its
mineral deposits. In Chewaka S., and de Wit, M., J., (editors): Plate tectonics and
metallogenesis: Some guidelines to Ethiopian mineral deposits. Ethiopian Institute of
Geological Surveys, Addis Ababa, Bulletin no. 2, pp. 115-129.
Ebinger, C. J., Yemane, T., Genzzebu, W., Aronson, J. L., and Walter, R.C., 1993. Late
Eocene recent volcanism and faulting in the southern main Ethiopian rift. Jour. Geol.
Soc. London 150, 99-108.
Ebinger, C. J. and Ibrahim, A., 1994. Multiple episodes of rifting in Central and East Africa: A
re-evaluation of gravity data. Geol. Rundsch. 83, 689-702.
Genzebu, W., Hassen, N., and Yemane, T., 1994. Geology of the Ageremariam area (NB37-
10). Ethiopian Institute of Geological Surveys, Addis Ababa, (Memoir 8), pp. 1-112.
MAB CONSULT – CONSULTING HYDROGEOLOGISTS AND ENGINEERS 60 LAY VOLUNTEERS INTERNATIONAL ASSOCIATION (LVIA)

GROUNDWATER POTENTIAL ZONE MAPPING IN MOYALE-TELTELE SUB BASIN AT DIRE, ARERO, YABELO AND TELTELE WOREDAS,
BORENA ZONE OF OROMIA REGIONAL STATE USING GIS AND REMOTE SENSING
Genzebu, W., Yemane, T., Suwa, G., White, T., and Asfaw, B., 1995. Age of volcanism and
rifting in the Burji-Soyoma area, Amaro Horst, southern Main Ethiopian Rift: geo-and
biochronological data. Jour. Afri. Earth Sci. 21, 459-476.
Kazmin, V., 1972. Geology of Ethiopia. Explanatory note to the geological map of Ethiopia
(1:2,000,000) Ethiopian Institute of Geological Surveys, Addis Ababa, pp. 1-208.
Kazmin, V., Shifferaw, A., and Balcha, T., 1978. The Ethiopian Basement : stratigraphy and
possible manner of evolution. Geol. Rundsch. 67, 531-546.
Kozyrov, V., Kebede, G., Safonov, Y., W/Michael B., Gurbanovich, G., Tekle, T., Kaitukov,
M., Kuznetsov, J., Tuliankin, U., and Arijapov, A., 1985. Regional Geological and
exploration work for gold and other minerals in the Adola gold fields. Ethiopian
Mineral Exploration Development Corporation Bulletin, Vol. 2, Addis Ababa, pp. 1-
260.
Merla, G., Abbate, E., Canuti, P., Sagri, M., and Taconi, P., 1973. Geological map of Ethiopia
and Somalia (1:2,000,000). Consigo Nazionale Della Ricerche, Florence, Italy.
Piccerillo, A., Belaineh, M., Gerra, S., Gobena, H., Hussien B., Kebede, T., 1998. The
Precambrian rocks from southern Ethiopia: petrology, geochemistry and their
interaction with the Recent volcanism from the Ethiopian Rift Valley. Neus. Jahr Buch
Mineralogische Abhandlungen 173, 237-262.
Reeves, C. V., Karanja, F. M., and MacLeod, 1987. Geophysical evidence for a failed Jurrasic
rift and triple junction in Kenya. Earth Planetary Science Letters 81, 229-311.
Stern, R. J., 1994. Arc assembly and continental collision in the Neoproterozoic East African
Orogen: implications for consolidation of Gondwanaland. Annual Reviews Earth and
Planetary Sciences 22, 319-351.
MAB CONSULT – CONSULTING HYDROGEOLOGISTS AND ENGINEERS 61 LAY VOLUNTEERS INTERNATIONAL ASSOCIATION (LVIA)

GROUNDWATER POTENTIAL ZONE MAPPING IN MOYALE-TELTELE SUB BASIN AT DIRE, ARERO, YABELO AND TELTELE WOREDAS,
BORENA ZONE OF OROMIA REGIONAL STATE USING GIS AND REMOTE SENSING
MAB CONSULT – CONSULTING HYDROGEOLOGISTS AND ENGINEERS 62 LAY VOLUNTEERS INTERNATIONAL ASSOCIATION (LVIA)
Teffera, M., Cherinet, T., Haro, W., 1996. Geological map of Ethiopia, 2nd edition
(1:2,000,000). Ethiopian Institute of Geological Surveys, Addis Ababa.
Woldegebriel, G., and Aronson, J. L., 1987. The Chow Bahir Rift: A "failed" rift in Southern
Ethiopia. Geology 15, 430-433.
Woldehaimanot, B. and Brehman, J. H., 1995a. A study of metabasites and metagranite
chemistry in the Adola region (south Ethiopia): implications for the evolution of the
East African Orogen. Jour. Afri. Earth Sci. 21, 459-476.
Worku, H., 1996. Geodynamic development of the Adola Belt (southern Ethiopia) in the
Neoproterozoic and its control on gold mineralization. Ph. D. thesis, Technical
University of Berlin, Wissenscaftliche Schriftenereihe Geologie und Bergbau, Band 5,
pp. 1-156.
Yihunie, T. and Tesfaye, M., 1998. Geology of the Negele area (NB37-11). Ethiopian
Institute of Geological Surveys, Addis Ababa, Memoir.
Zanetten, B., Justin-Visentin, E., Nicoletti, M., and Petrucciani, C., 1978. The evolution of the
Chencha escarpment and the Ganjuli graben (Lake Abaya) in the southern Ethiopian
rift. N. Jb. Geol. Palaont. Mh. 8, 473-490.
Zenaw Tessema, Fedlu Hassen, Gedefaw Jemberu; Hydrogeological, and Engineering
Geological Investigation of Moyale Sheet (NA 37-3); Geological Survey of Ethiopa;
Addis Ababa.; August 2000