Figure 1: ABrAcAdABrA - LIDAR...
6
BY BILL GUTELIUS L IDAR News recently took advan- tage of the opportunity to test and evaluate the novel Zeb1 Hand- held Mobile Mapping System distributed by 3D Laser Mapping. We put it through its paces, scanning various indoor and outdoor environments and objects. An analysis of the output data was performed and we likewise tried our hands at explor- ing the data in a couple of free and open source point-cloud software packages (recommended by the vendor). Finally, we compared the data quality of the Zeb1 to that of a high-accuracy, high-fidelity static scanning system. Background e Zeb1 was developed and patented in Australia by the Commonwealth Scientific and Industrial Research Organisation (CSIRO). e device was originally named the “Zebedee” after a jack-in-the-box character on a BBC children’s show from the 1970’s. CSIRO sought to find a simple way to rapidly scan complex, GPS-denied environments and areas that are normally inaccessible to wheeled or static-scanning systems. e Zeb1 employs a proprietary Simultaneous Localization and Mapping (SLAM) algorithm to register the points ABRACADABRA A Wave of a Magic LIDAR Wand FAST FACTS ⦁ Sub $25k US list price ⦁ Uses SLAM processing ⦁ Class I eye-safe laser ⦁ Rapid processing (1:1) ⦁ Capture data in small spaces ⦁ < 1 hour to scan interior of 56,000ft 2 building QUICK SPECS ⦁ 43,200 points/second ⦁ 270° field-of-view ⦁ 1.5cm accuracy ⦁ 30m range ⦁ 905nm wavelength ⦁ 700g weight Figure 1: Zeb1 Displayed with permission • LiDAR Magazine • Vol. 4 No. 1 • Copyright 2014 Spatial Media • www.lidarnews.com
Transcript of Figure 1: ABrAcAdABrA - LIDAR...

By Bill Gutelius
L IDAR News recently took advan-tage of the opportunity to test and evaluate the novel Zeb1 Hand-
held Mobile Mapping System distributed by 3D Laser Mapping. We put it through its paces, scanning various indoor and outdoor environments and objects. An analysis of the output data was performed and we likewise tried our hands at explor-ing the data in a couple of free and open source point-cloud software packages (recommended by the vendor). Finally, we compared the data quality of the Zeb1 to that of a high-accuracy, high-fidelity static scanning system.
BackgroundThe Zeb1 was developed and patented in Australia by the Commonwealth Scientific and Industrial Research Organisation (CSIRO). The device was originally named the “Zebedee” after a jack-in-the-box character on a BBC children’s show from the 1970’s. CSIRO sought to find a simple way to rapidly scan complex, GPS-denied environments and areas that are normally inaccessible to wheeled or static-scanning systems.
The Zeb1 employs a proprietary Simultaneous Localization and Mapping (SLAM) algorithm to register the points
ABrAcAdABrAA Wave of a Magic LIDAR Wand
FAST FAcTS ⦁ Sub $25k US list price
⦁ Uses SLAM processing
⦁ Class I eye-safe laser
⦁ Rapid processing (1:1)
⦁ Capture data in small spaces
⦁ < 1 hour to scan interior of 56,000ft2 building
QUIcK SPEcS ⦁ 43,200 points/second
⦁ 270° field-of-view
⦁ 1.5cm accuracy
⦁ 30m range
⦁ 905nm wavelength
⦁ 700g weight
Figure 1: Zeb1
Displayed with permission • LiDAR Magazine • Vol. 4 No. 1 • Copyright 2014 Spatial Media • www.lidarnews.com
to one another and thereby escape reli-ance on geo-position data for the sensor.
The researchers wanted a mapping solution for places like mine shafts, stairwells and occluded areas which would otherwise necessitate costly and onerous set-ups of traditional scanning systems. Areas such as these have, in the past, presented significant impediments to cost-effective collection of 3D data.
The SystemThe Zeb1 consists of a hand-held “wand” topped by an eye-safe 2D infra-red laser scanner which in-turn is coupled to an inertial measurement unit (IMU). The laser and IMU “block” are connected to the handle-grip by a moderately stiff spring. The wand is waved in a compound, rocking motion. Using this oscillating/swaying motion, typically back and forth with a period of about ½ second, effectively distributes the points from the 2D scanner laser through a 3D space. Imagine holding a can of spray paint with a 270° spray radius, and then sweeping it up and down. This is the resulting distribution of laser points.
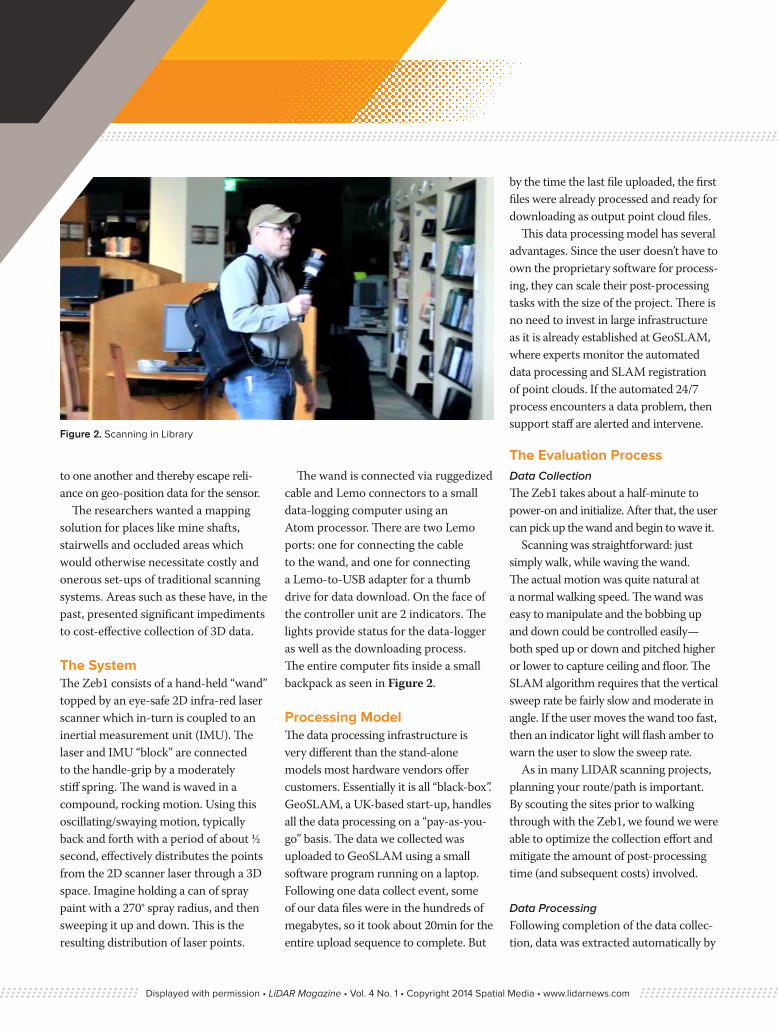
The wand is connected via ruggedized cable and Lemo connectors to a small data-logging computer using an Atom processor. There are two Lemo ports: one for connecting the cable to the wand, and one for connecting a Lemo-to-USB adapter for a thumb drive for data download. On the face of the controller unit are 2 indicators. The lights provide status for the data-logger as well as the downloading process. The entire computer fits inside a small backpack as seen in Figure 2.
Processing ModelThe data processing infrastructure is very different than the stand-alone models most hardware vendors offer customers. Essentially it is all “black-box”. GeoSLAM, a UK-based start-up, handles all the data processing on a “pay-as-you-go” basis. The data we collected was uploaded to GeoSLAM using a small software program running on a laptop. Following one data collect event, some of our data files were in the hundreds of megabytes, so it took about 20min for the entire upload sequence to complete. But
by the time the last file uploaded, the first files were already processed and ready for downloading as output point cloud files.
This data processing model has several advantages. Since the user doesn’t have to own the proprietary software for process-ing, they can scale their post-processing tasks with the size of the project. There is no need to invest in large infrastructure as it is already established at GeoSLAM, where experts monitor the automated data processing and SLAM registration of point clouds. If the automated 24/7 process encounters a data problem, then support staff are alerted and intervene.
The Evaluation ProcessData CollectionThe Zeb1 takes about a half-minute to power-on and initialize. After that, the user can pick up the wand and begin to wave it.
Scanning was straightforward: just simply walk, while waving the wand. The actual motion was quite natural at a normal walking speed. The wand was easy to manipulate and the bobbing up and down could be controlled easily—both sped up or down and pitched higher or lower to capture ceiling and floor. The SLAM algorithm requires that the vertical sweep rate be fairly slow and moderate in angle. If the user moves the wand too fast, then an indicator light will flash amber to warn the user to slow the sweep rate.
As in many LIDAR scanning projects, planning your route/path is important. By scouting the sites prior to walking through with the Zeb1, we found we were able to optimize the collection effort and mitigate the amount of post-processing time (and subsequent costs) involved.
Data ProcessingFollowing completion of the data collec-tion, data was extracted automatically by
Figure 2. Scanning in Library
Displayed with permission • LiDAR Magazine • Vol. 4 No. 1 • Copyright 2014 Spatial Media • www.lidarnews.com

connecting a USB drive to the data log-ger. The data were then uploaded from the USB drive to the processing center at GeoSLAM using a desktop application which handles file management.
Data returned are in (industry standard) .laz and .ply format. The .laz files contain all the return values, while the .ply files have a decimated number of points.
Scan SitesPublic LibraryThe largest area chosen for testing was a local public library. The building is approximately 56,000 square feet in size and contains multiple stairways, stair wells, alcoves and many hallways spread across two main stories. We selected the library for testing because it provides a uniquely “complex” environment. The many objects inside a typical, large library present a problem for static scanning systems. As seen in Figures 3 and 4 there are rows of book shelves (“stacks”) and numerous tables, furniture and tall “carrels” for private work. The Zeb1 enabled us to walk up and down the aisles of the book stacks, seating areas and rows of carrels. To acquire data for these areas convention-ally (with a static scanner) would have necessitated many set-ups. For the exterior, it was easy to walk around the perimeter to capture the building facades (Figure 5).
Figure 3: Library Second Floor
Figure 4: Library First Floor
Figure 5: Public Library Facade
Displayed with permission • LiDAR Magazine • Vol. 4 No. 1 • Copyright 2014 Spatial Media • www.lidarnews.com

Bridge/CanalWe next chose a unique outdoor struc-ture, which was small enough to allow collecting data within the 30m range limits of the scanner. The structure is known as a “Whipple Bridge”, a common sight over the old Erie Canal in New York. The bridge presented an interesting challenge owing to the complex layout of trusses and walk-way supports. It has a very recogniz-able profile that stands out against the background (Figure 6). In only 2 separate scans in less than 7 minutes, the entire bridge, both approaches, and the sur-rounding park and woods were scanned.
Residential Building & WoodsWe selected a residential site (~ ½ acre) with a small copse of trees in the backyard. The time to scan the entire exterior (including walking through and around the first floor of the house), the small wooded area and the front yard was approximately 8 minutes (Figure 7).
Office Building (target comparison site)Lastly, by enlisting the help of a local engineering survey firm, we compared the
point cloud generated from the Zeb1 to that from a Trimble TX5. We used target-ing spheres as the Zeb1 doesn’t record intensity values, so we looked for the distinct shapes of the spheres within the point cloud. We did a quick walk around and through part of their office building and then scanned a small area where the spheres were located near an entrance. The scanning experts at the engineering survey company were surprised at how
well the Zeb1 data registered to the output from a static scanner. Running the data through a utility in Trimble Realworks produced a combined 3D fitting error of only about 1cm (Figure 8).
Other ApplicationsPower line catenaries—As a byproduct of scanning the iron truss bridge, we ended-up collecting returns from power-lines and phone poles. There were enough points available to discern the points-of-attachment (POAs). In the case of our scanning wooded areas, the resolution on the tree trunks was high enough to be able to extract diameter-at-breast height (DBH). It is possible that Zeb1 data could also be used for filling in data in dense under growth to augment aerial LIDAR data.
Analyzing the dataAccuracy—overall we found the Zeb1 to be well within the accuracy specifica-tions. Natively, the laser scanner has a 3cm error bound. With the application of noise filtering algorithms, the relative accuracy of the Zeb1 is listed as ±5mm.
Figure 6: Whipple Bridge Over Erie Canal
Figure 7: Residential Site & Woods
Displayed with permission • LiDAR Magazine • Vol. 4 No. 1 • Copyright 2014 Spatial Media • www.lidarnews.com

In our interrogation of the point clouds, we observed accuracies at this level or better. For example, by slicing perpen-dicularly through clouds of walls and other flat surfaces, the “noise” or error spread was within ±15mm.
The returned point clouds were interrogated and inspected using Cloud Compare and Meshlab (recommended by 3D Laser Mapping). Also recom-mended was 3DReshaper, but this is not free like the other two packages.
We did not perform very rigorous checks of the dimensions of objects and buildings. Rather we just used a simple tape measure to see if the point cloud derived dimensions corresponded to the accuracy limits provided by the manufacturer. In all cases we were satis-fied. In the case of the more in-depth evaluation (by comparing Zeb1 data with that of the Trimble TX5), we were satisfied that the specifications were easily achieved (Figure 8).
Yes, there is discernible noise, but we were surprised that it was quite minimal. This device is not designed as a “survey grade” scanner. It compensates for higher shot-to-shot noise by being small, easy to use, inexpensive and incredibly portable.
conclusionDuring several hours of use across a week of testing, the only real glitch encoun-tered was a wonky thumb drive that corrupted a few files. Luckily, since the files are retained on the Zeb1 computer (64GB SSD) until manually removed, we were able to re-download them to a new drive and everything was recovered.
In the final analysis, it comes down to a classic situation: you can have 2 of 3 things: fast, accurate or cheap. With the Zeb1 you can easily achieve speed and very cost-effective results, but this occurs with a trade-off of the enhanced accuracy and range normally associated with high-rep-rate scanners.
Overall we were quite impressed with this new type of mobile mapping
Figure 8: 3D Fit Report and Point Cloud Compare
COST ACCURACY
SPEED
Displayed with permission • LiDAR Magazine • Vol. 4 No. 1 • Copyright 2014 Spatial Media • www.lidarnews.com

system. It remains to be seen whether it will be the game-changer it has been described as in several recent news articles. Certainly it is revolutionary and is very unorthodox, especially to those of us who have been involved with LIDAR for a long time. In fact, it almost seems down-right goofy, walking around a building with the little scanner bobbing back and forth, just like a jack-in-the-box. However, upon visualizing the final data and when factoring the ease-of-use, ability to reach otherwise inaccessible areas and the very low cost, the Zeb1 is an incredibly valuable tool and will no doubt become a sensor of choice for many applications.
Special thanks to: ⦁ Michael Koterba at MJ Engineering & Land Survey, PC
⦁ John Arnold IV, V.P.—North America , 3D Laser Mapping LLC.
Bill Gutelius is the President and co-founder of Active Imaging Systems (AIS). In 2007 he formed AIS where he consults for commercial and government clients on active and passive imaging technologies and their applications.
THEIMAGING & GEOSPATIALINFORMATION SOCIETY
D. Hodgson
F. Kelly
C. Begley
7_25x4_75.indd 1 1/6/2014 3:53:47 PM
Area/Facility Scanned duration of collection Number of Points
Public Library Building & Grounds ~26 minutes ~67 million
Iron Truss Bridge ~7 minutes ~18 million
Residential Dwelling & Woods ~8 minutes ~21 million
Commercial Building & Test Site ~6 minutes ~16 million
Advantages Limitations
Very rapid data collection No intensity values
Able to reach difficult areas Reduced accuracy
Very low-cost (under $25k USD) Lower point density (43kHz PRF)
Very easy to use Limited range (max 30m)
Very fast & scalable data processing (1:1) Requires feature-rich environment (for SLAM)
Displayed with permission • LiDAR Magazine • Vol. 4 No. 1 • Copyright 2014 Spatial Media • www.lidarnews.com