Fig. S1: Hourly temperature (˚C) and broadband sound ...
1
Supplement to Mackiewicz et al. (2021) – Mar Ecol Prog Ser 622:115-124 – https://doi.org/10.3354/meps13634 1 Fig. S1: Hourly temperature (˚C) and broadband sound pressure level between 0.01 and12 kHz (mean of all four hydrophones) for the two deployment periods: 15 June to 22 July 2017 (top) and 10 June to 21 July 2018 (bottom) Fig. S2: Speaker playback (black) and RV engine (grey) power spectra comparison between 0.05 and12 kHz a b c d
Transcript of Fig. S1: Hourly temperature (˚C) and broadband sound ...
SupplementtoMackiewiczetal.(2021)–MarEcolProgSer622:115-124–https://doi.org/10.3354/meps13634
1
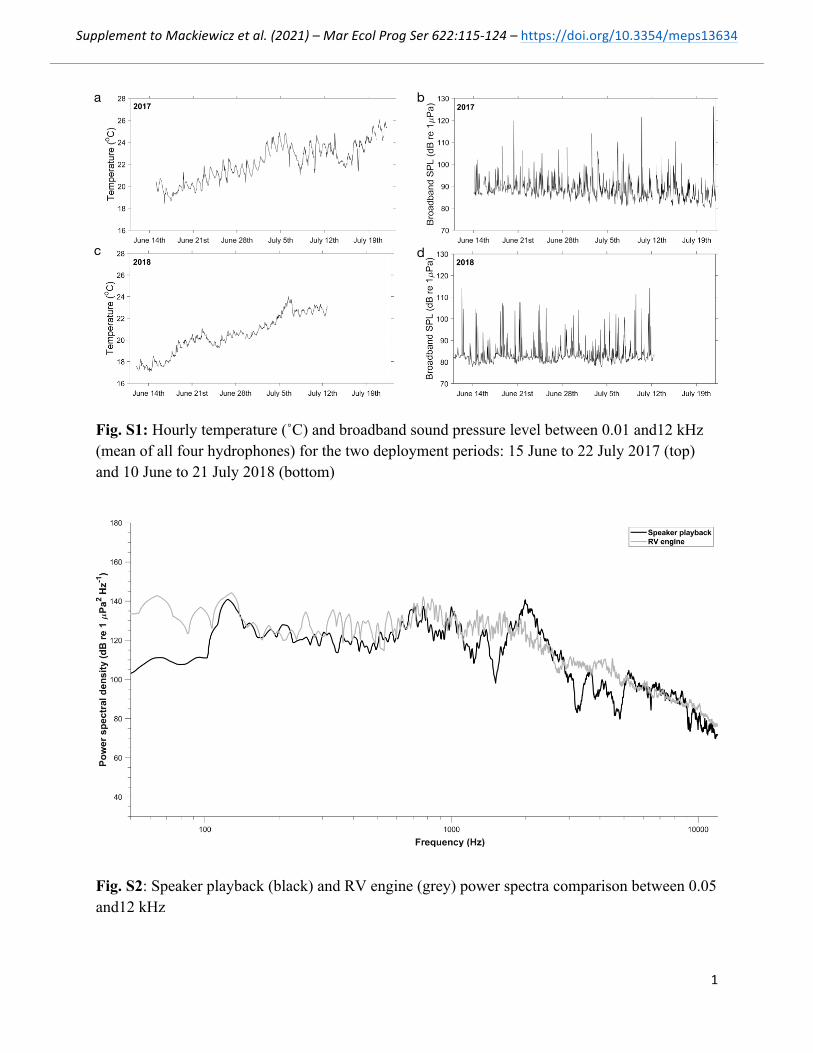
Fig. S1: Hourly temperature (˚C) and broadband sound pressure level between 0.01 and12 kHz (mean of all four hydrophones) for the two deployment periods: 15 June to 22 July 2017 (top) and 10 June to 21 July 2018 (bottom)
Fig. S2: Speaker playback (black) and RV engine (grey) power spectra comparison between 0.05 and12 kHz
a b
c d