Fig. 12-CO, p. 315. Fig. 12-1a, p. 317 Post-Glacial Sea Level Rise 0 0 75 20 150 60 40 225 80 300...
81
Fig. 12-CO, p. 315
-
Upload
karin-goodwin -
Category
Documents
-
view
214 -
download
0
Transcript of Fig. 12-CO, p. 315. Fig. 12-1a, p. 317 Post-Glacial Sea Level Rise 0 0 75 20 150 60 40 225 80 300...
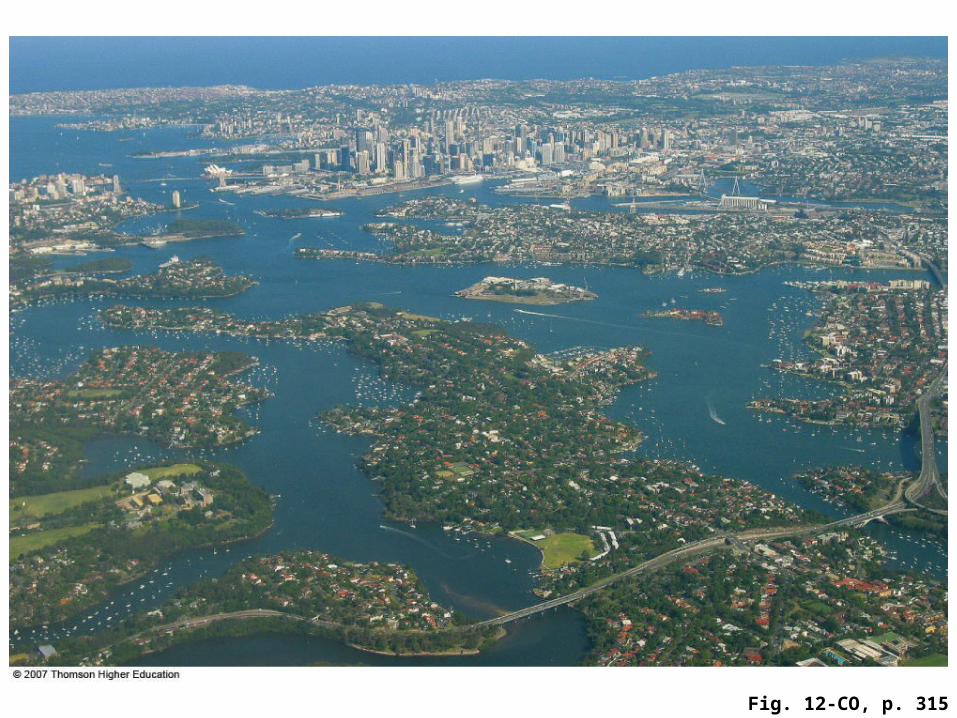
Fig. 12-CO, p. 315
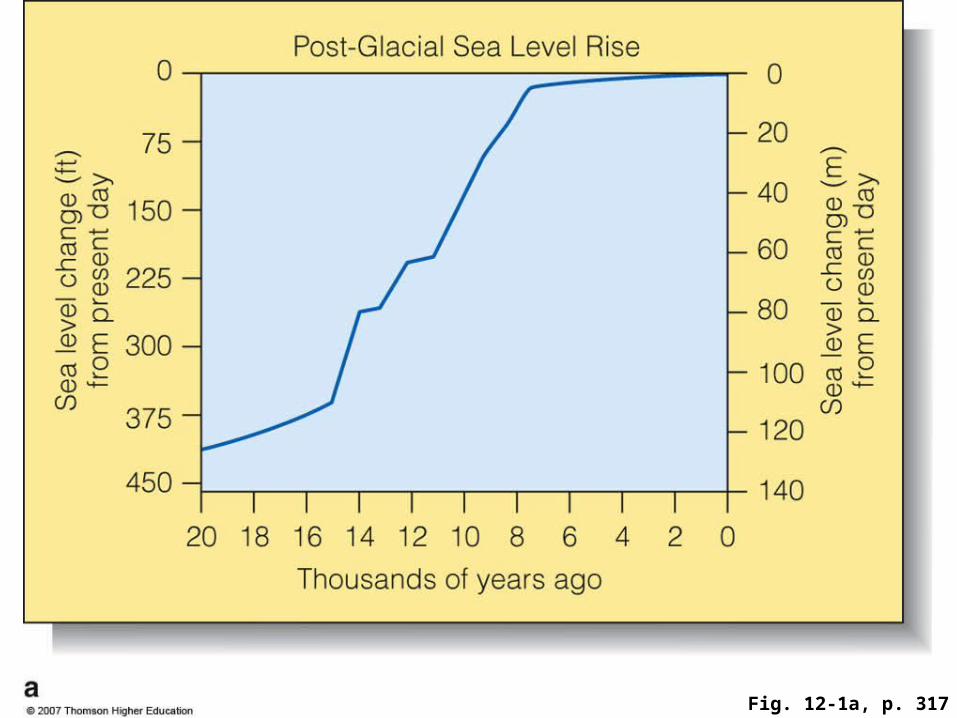
Fig. 12-1a, p. 317
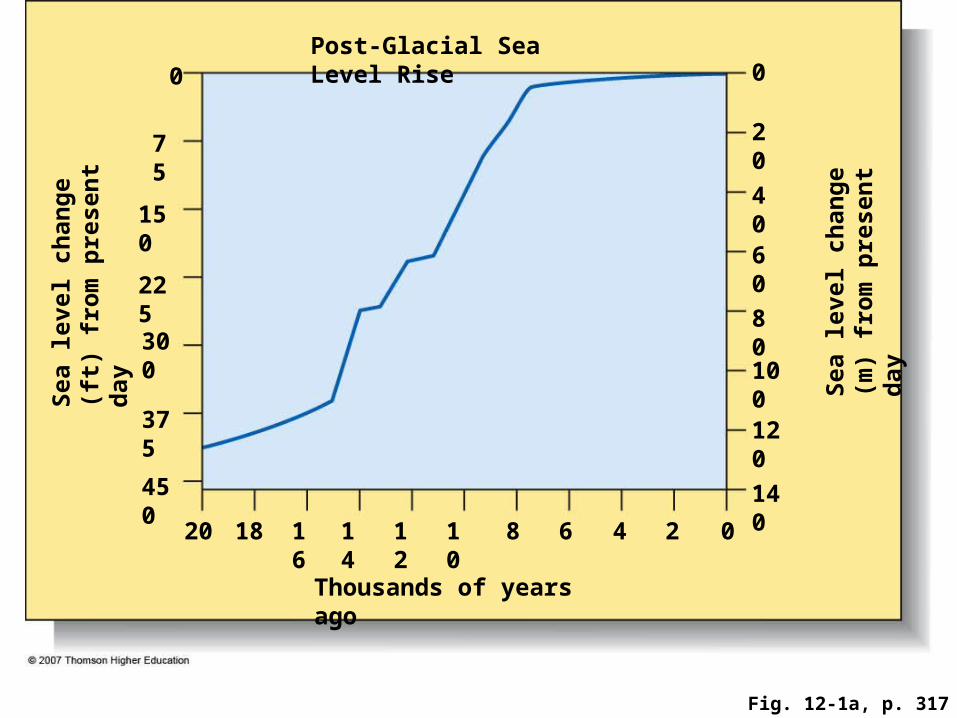
Fig. 12-1a, p. 317
Post-Glacial Sea Level Rise0 0
75 20
150
60
40
22580
300100
Sea
lev
el c
han
ge
(ft)
fr
om
pre
sen
t d
ay
375 120
450 140
18 16 14 12 10 8 6 4 2 0
Thousands of years ago
Sea
lev
el c
han
ge
(m)
fro
m p
rese
nt
day
20

Fig. 12-1b, p. 317

Fig. 12-1b, p. 317
Sea Level Projections
30 80
7025
60
20
15
1030
20 Sea
lev
el r
ise
(cm
)
40
50
Sea
lev
el r
ise
(in
ch)
5 10
−5 −10
0Observations
0
1950 1975 2000 2025 2050 2075 2100
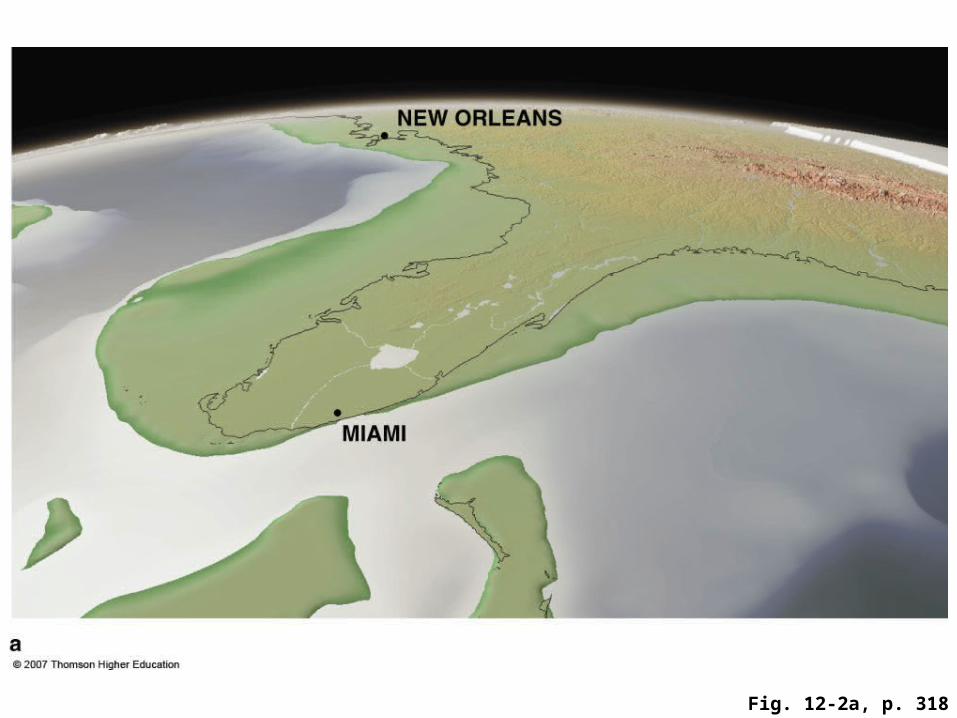
Fig. 12-2a, p. 318

Fig. 12-2b, p. 318
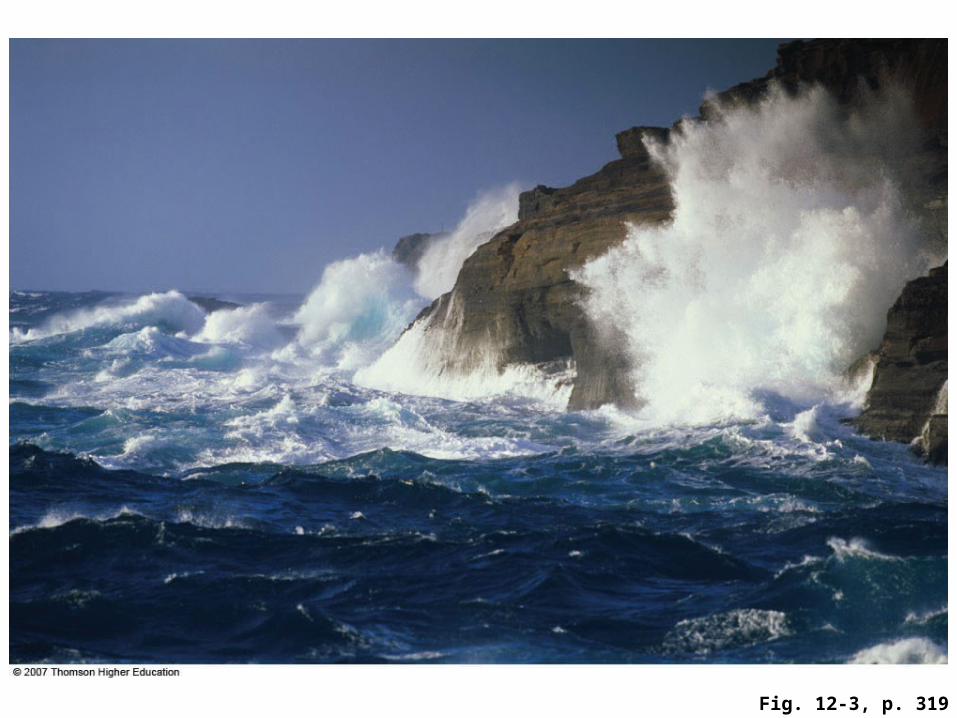
Fig. 12-3, p. 319
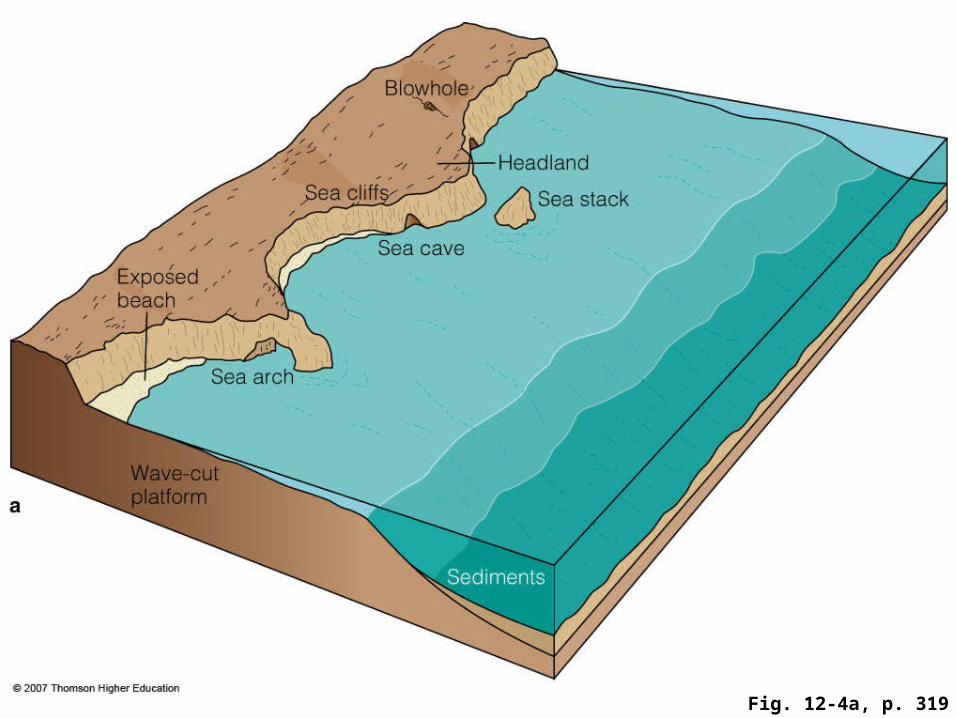
Fig. 12-4a, p. 319

Fig. 12-4a, p. 319
Blowhole
HeadlandSea cliffs Sea stack
Sea caveExposed beach
Sea arch
Wave-cut platform
Sediments
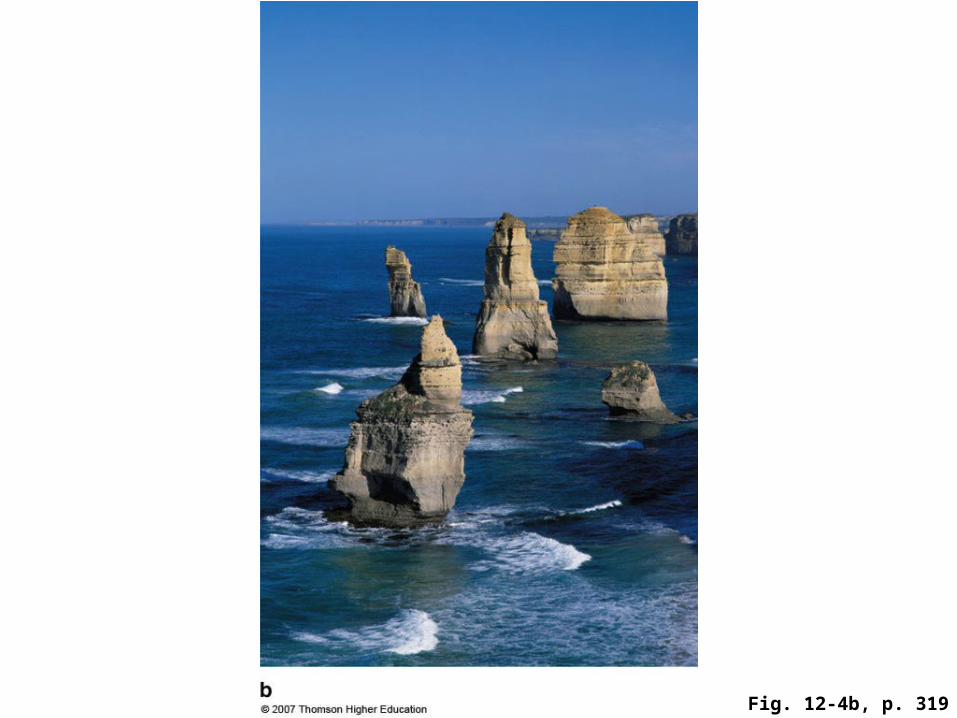
Fig. 12-4b, p. 319
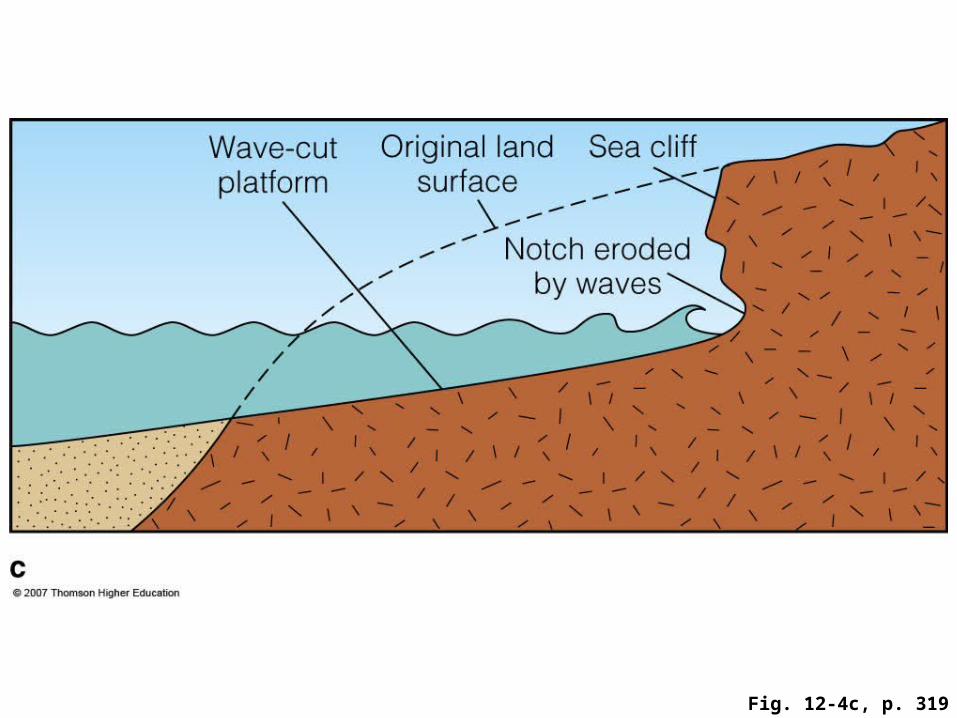
Fig. 12-4c, p. 319
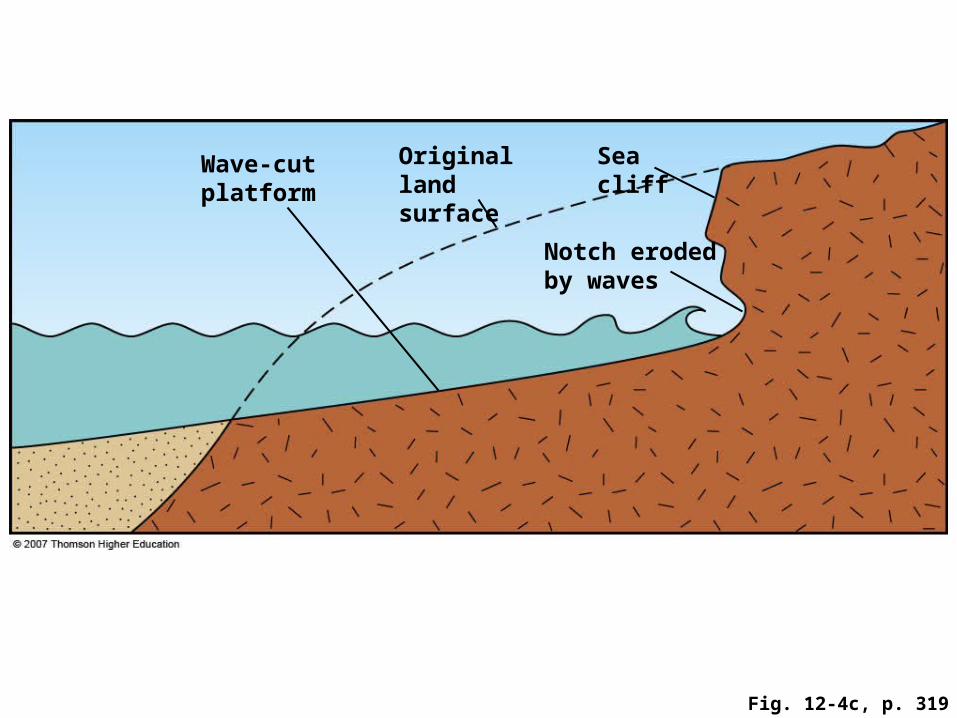
Fig. 12-4c, p. 319
Wave-cut platform
Original land surface
Sea cliff
Notch eroded by waves
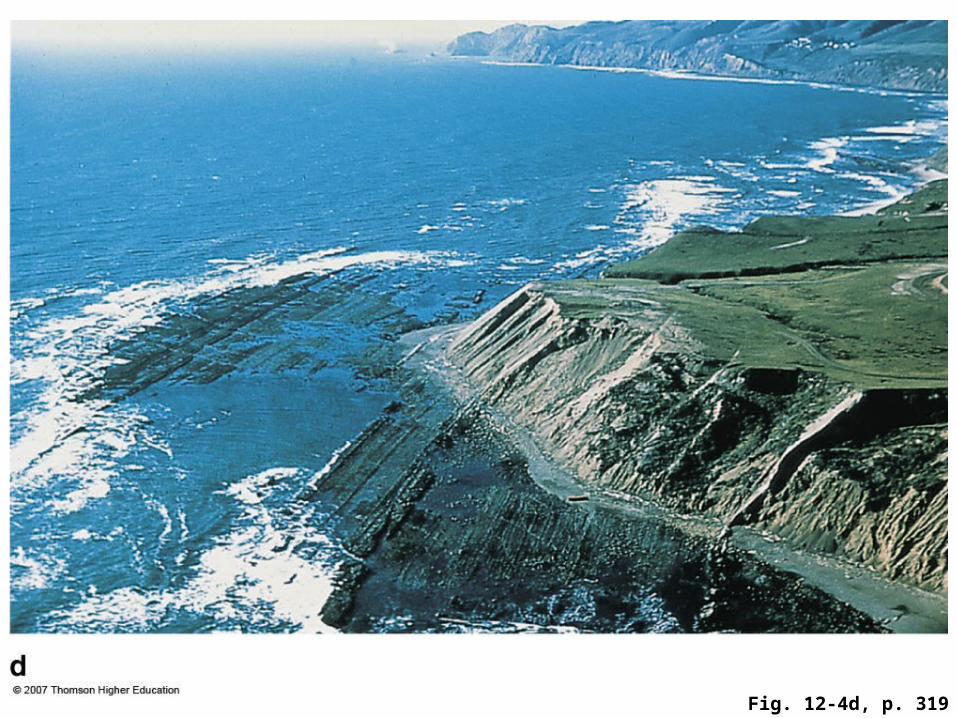
Fig. 12-4d, p. 319
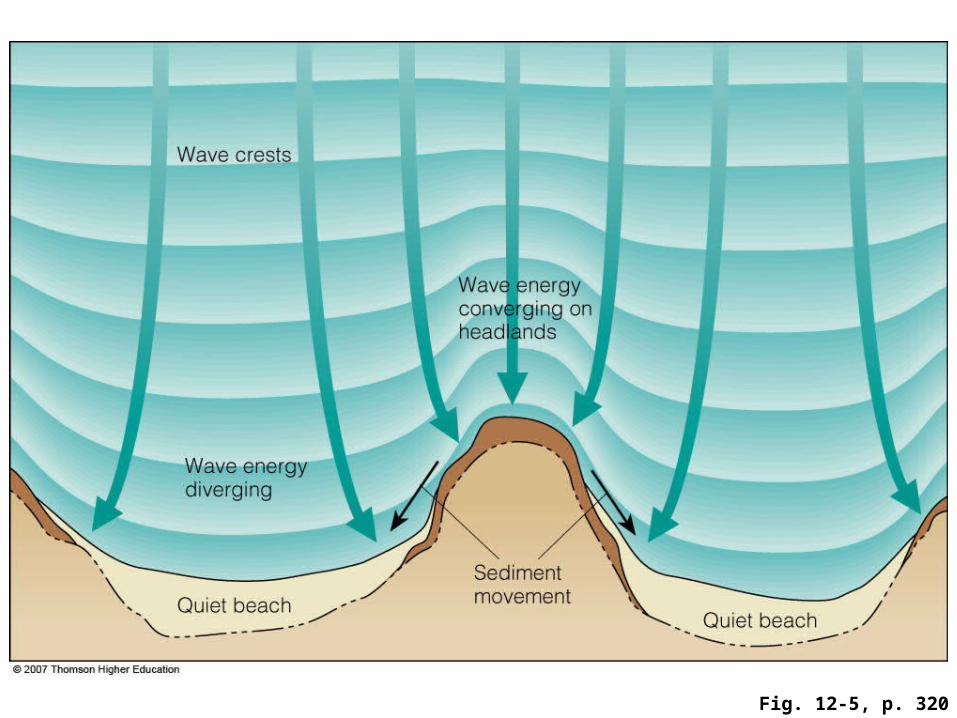
Fig. 12-5, p. 320
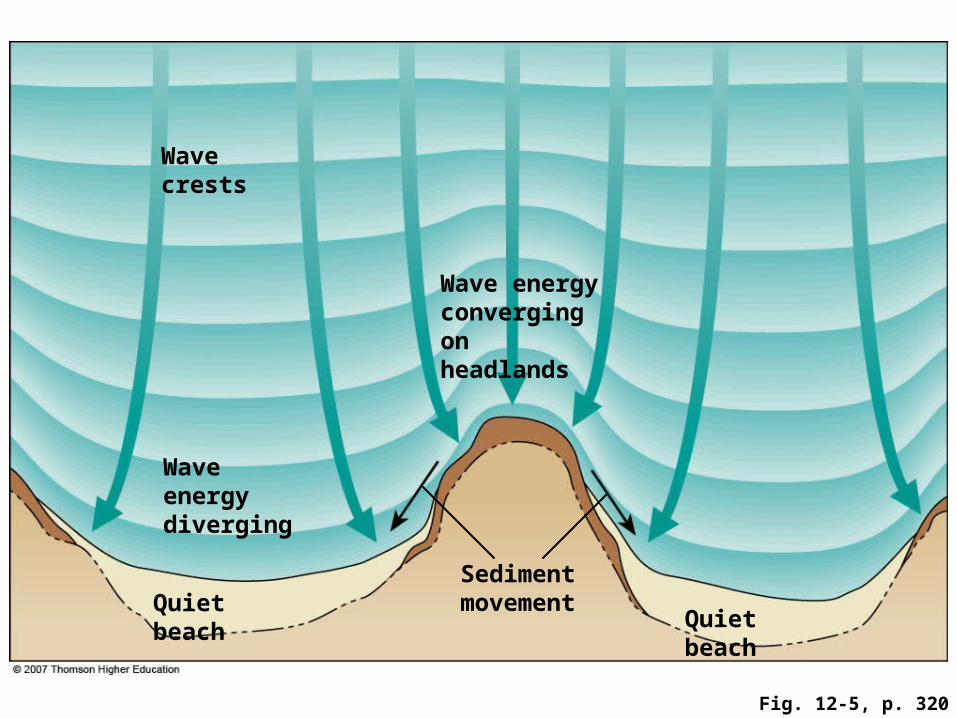
Fig. 12-5, p. 320
Wave crests
Wave energy converging on headlands
Wave energy diverging
Sediment movementQuiet beach
Quiet beach
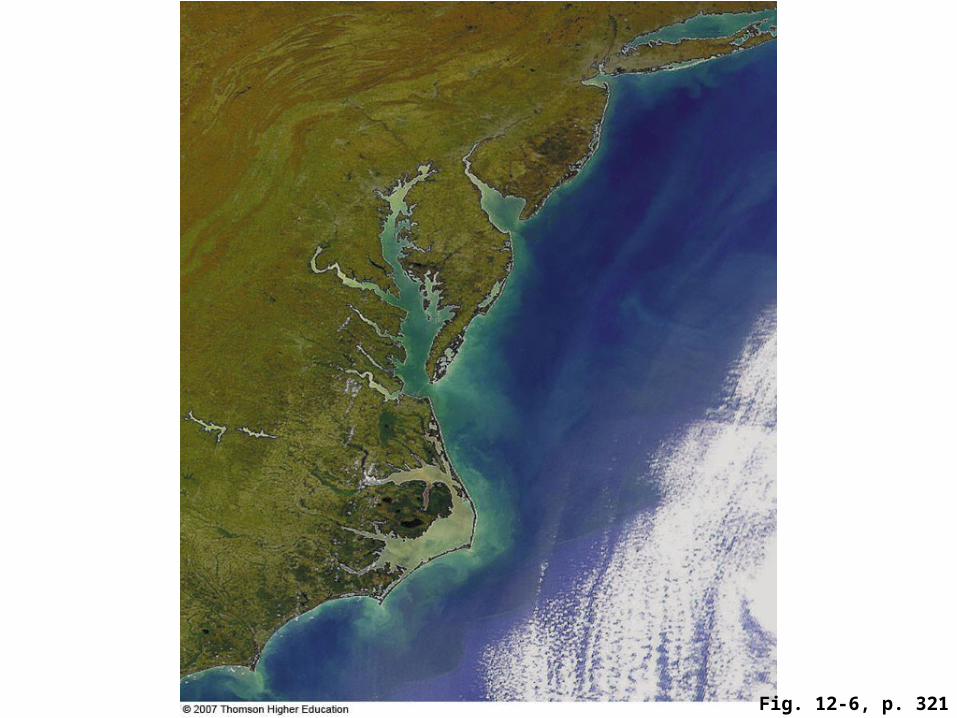
Fig. 12-6, p. 321
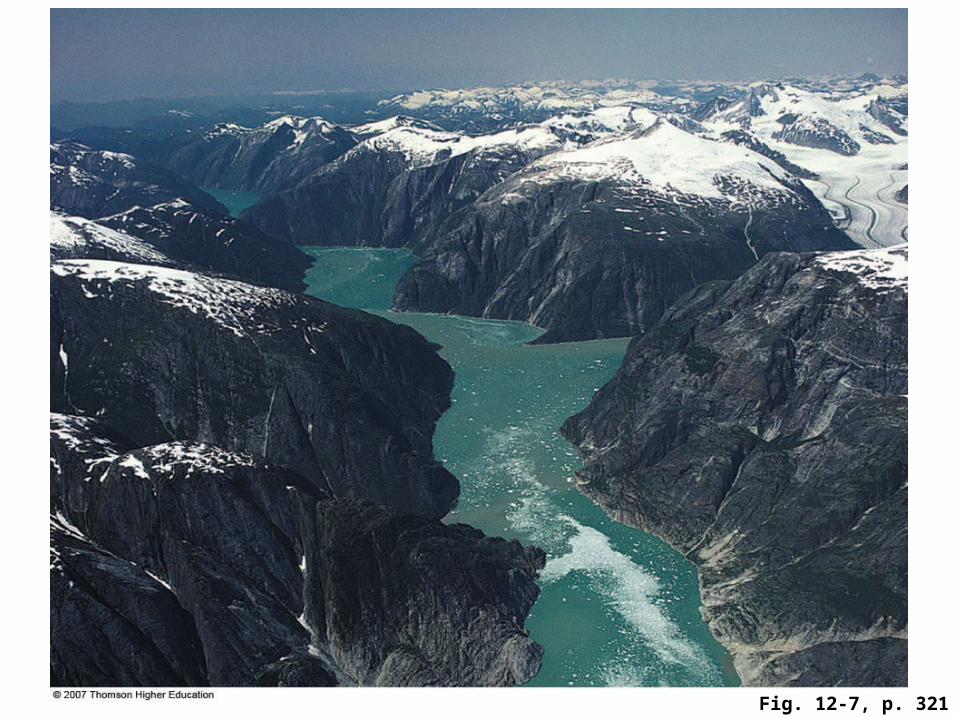
Fig. 12-7, p. 321
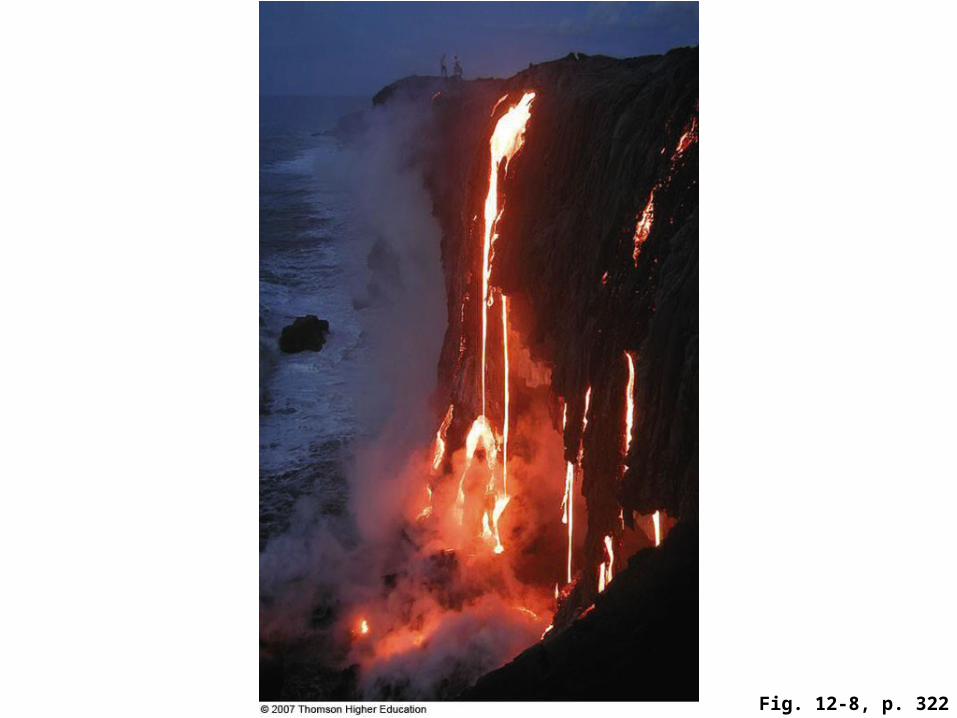
Fig. 12-8, p. 322
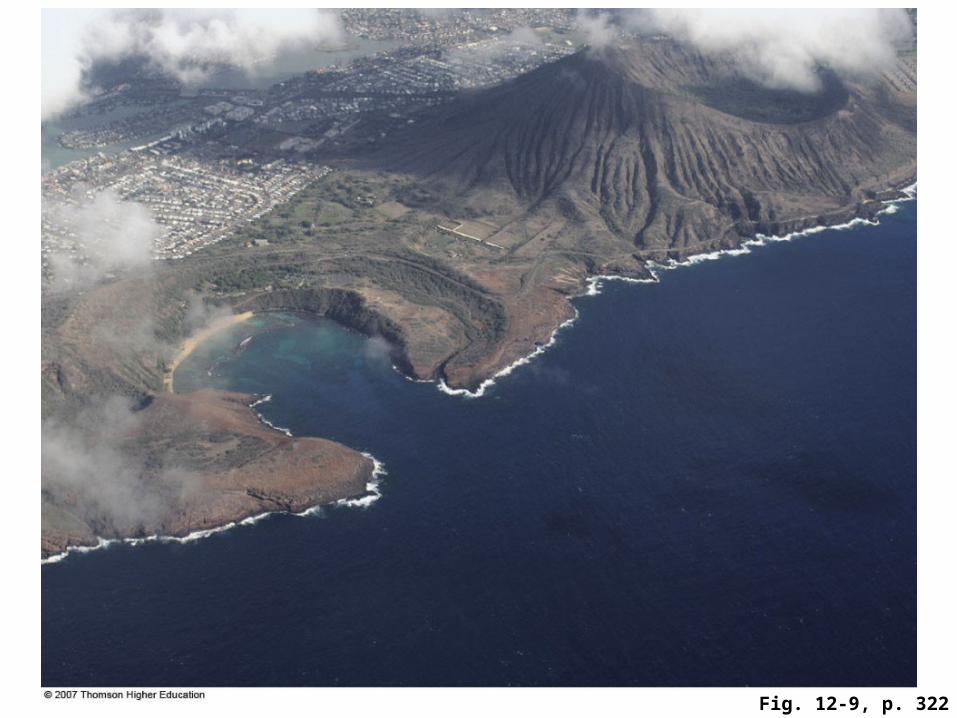
Fig. 12-9, p. 322
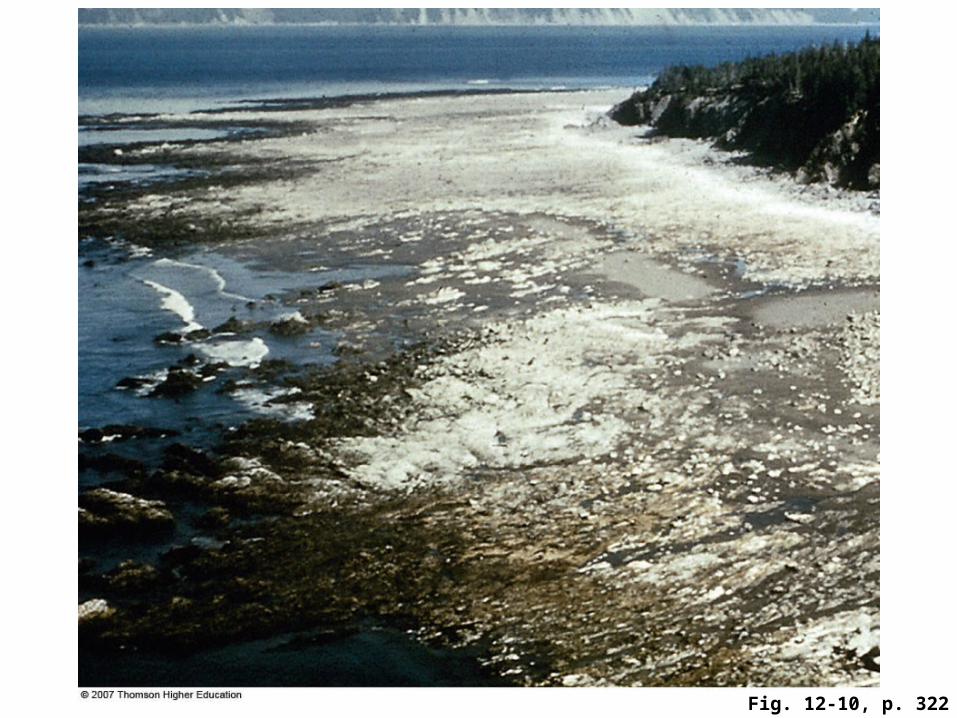
Fig. 12-10, p. 322
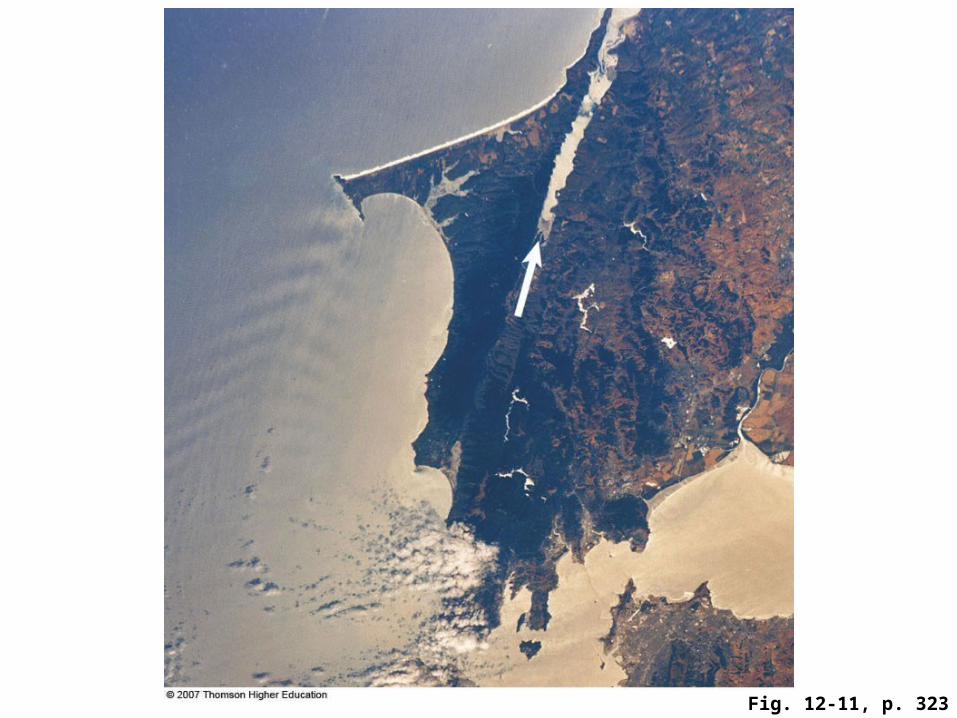
Fig. 12-11, p. 323
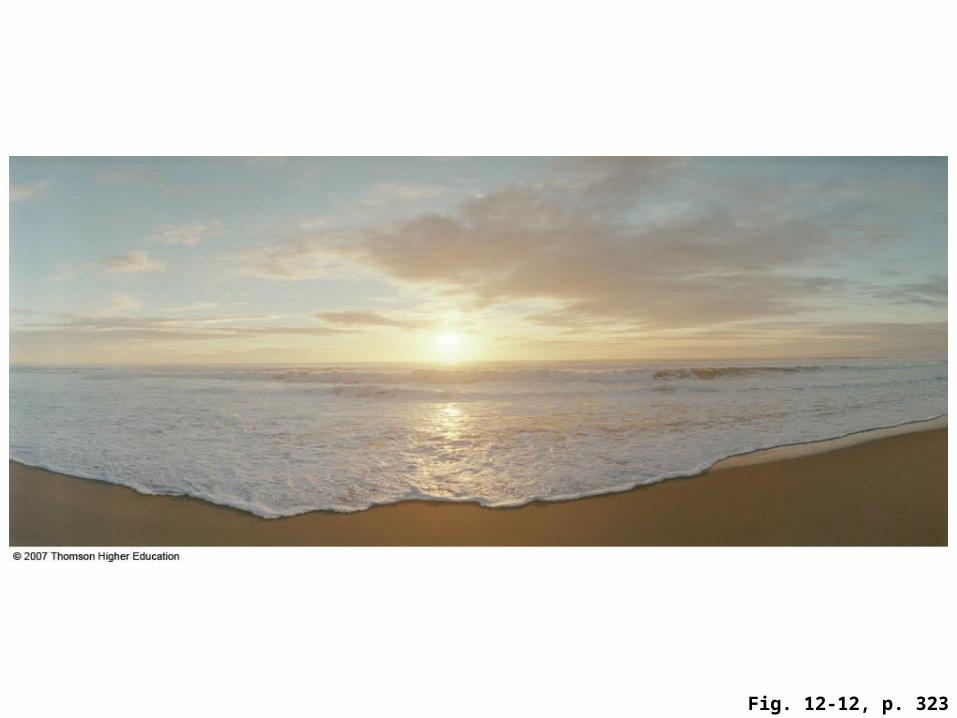
Fig. 12-12, p. 323
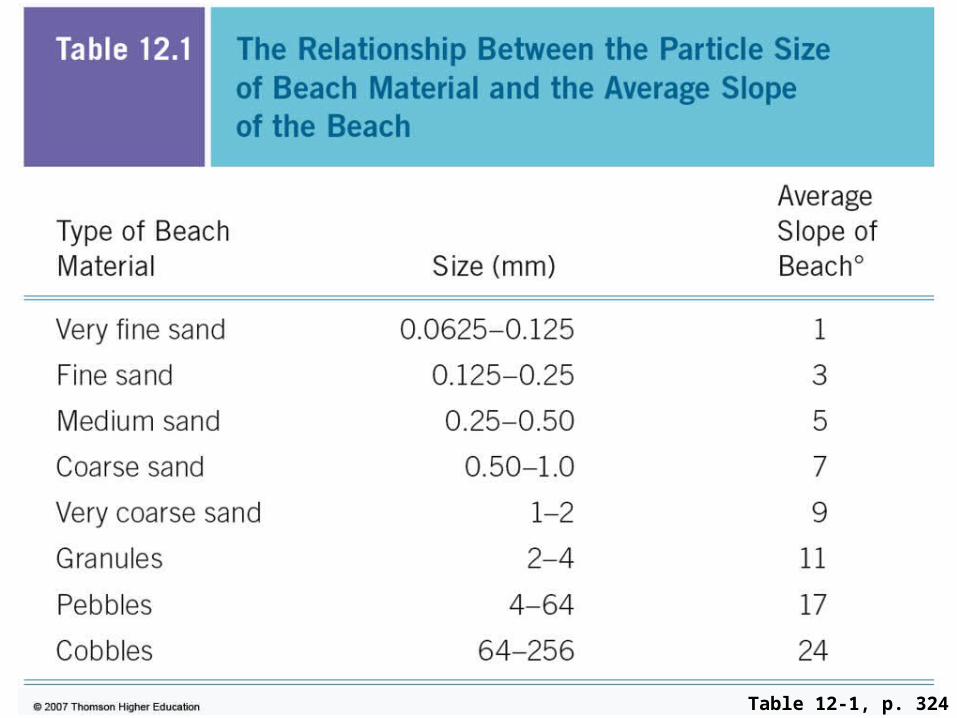
Table 12-1, p. 324
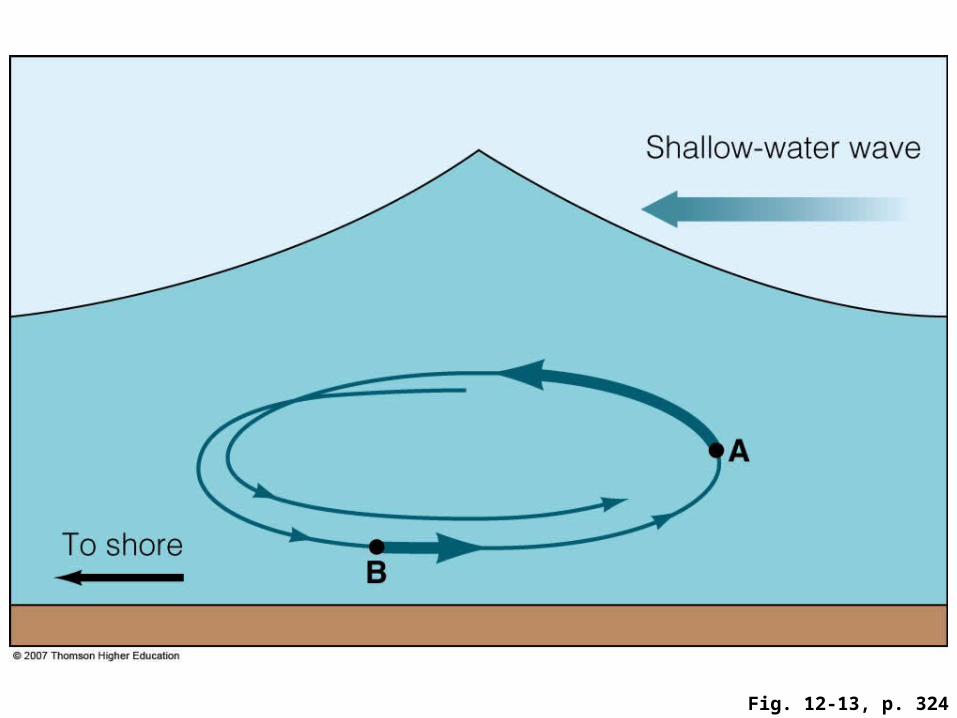
Fig. 12-13, p. 324
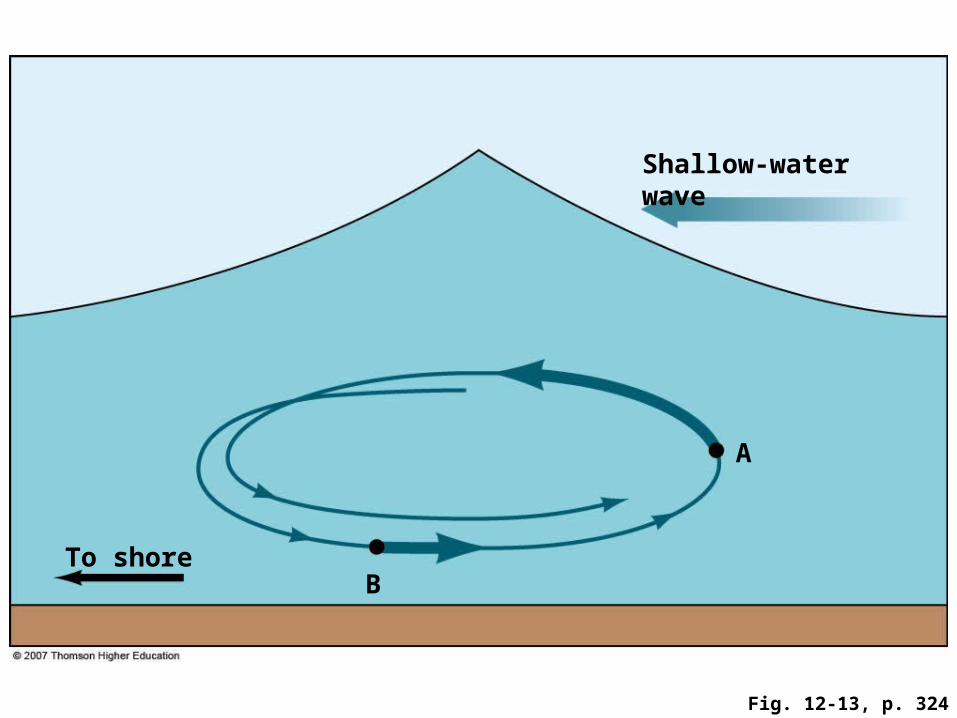
Fig. 12-13, p. 324
Shallow-water wave
A
To shoreB

Fig. 12-14, p. 325
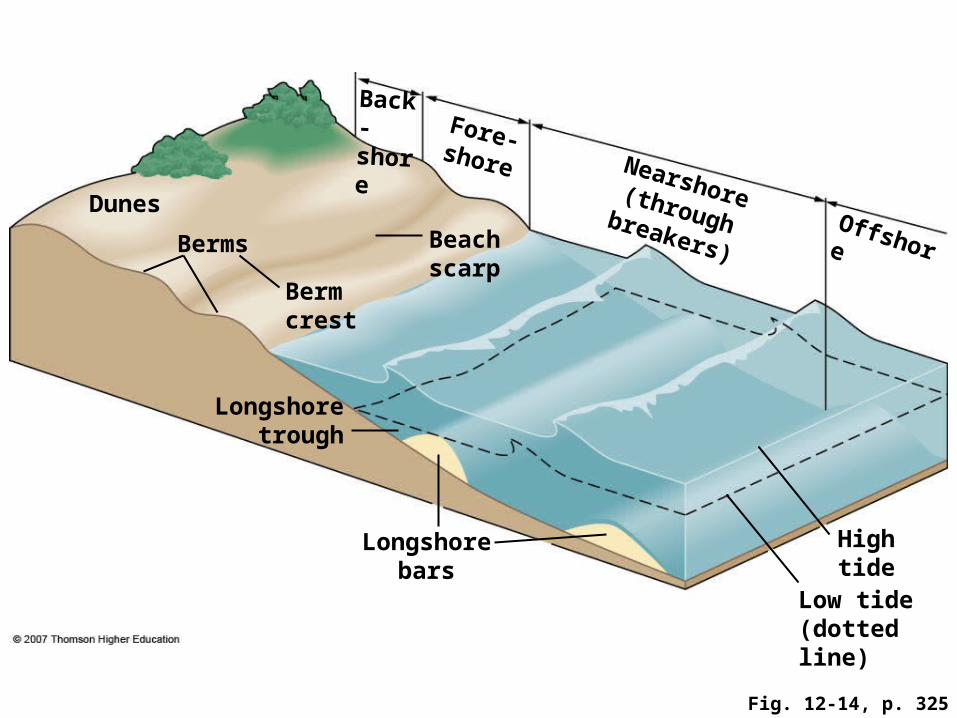
Fig. 12-14, p. 325
Back-shore Fore-
shore Nearshore (through breakers)
Dunes
Berms Beach scarp
Offshore
Berm crest
Longshore trough
Longshore bars
High tide
Low tide (dotted line)

Fig. 12-15a, p. 325

Fig. 12-15b, p. 325

Fig. 12-16a, p. 326

Fig. 12-16a, p. 326
Upper limit of wave actionSurf
zone
Longshore current
Path followed by sand grains
Direction of wave approach
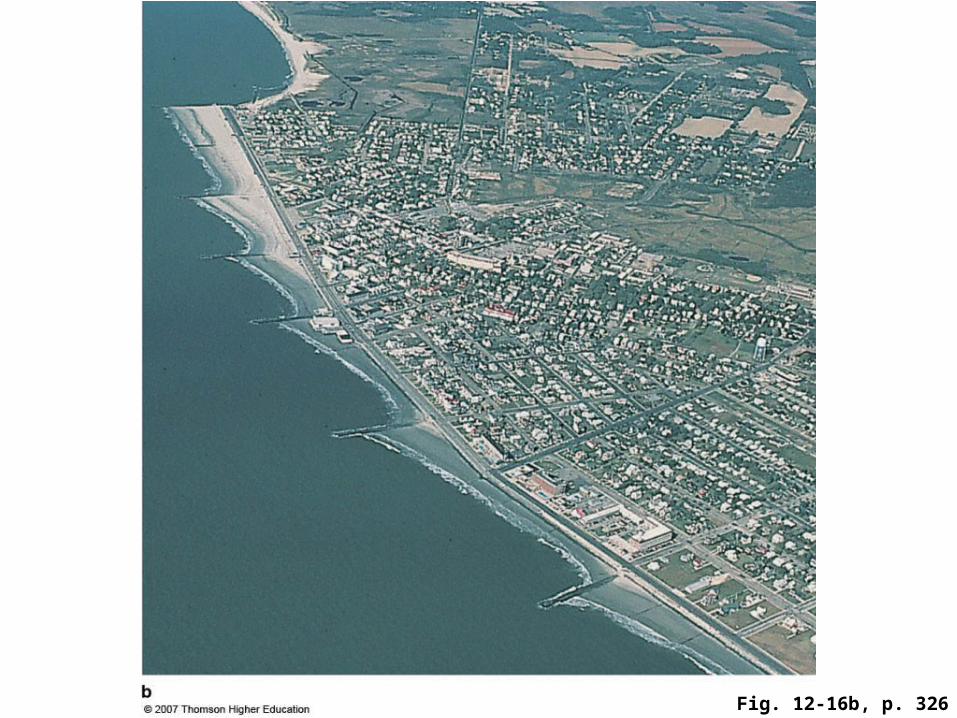
Fig. 12-16b, p. 326

Fig. 12-17, p. 327
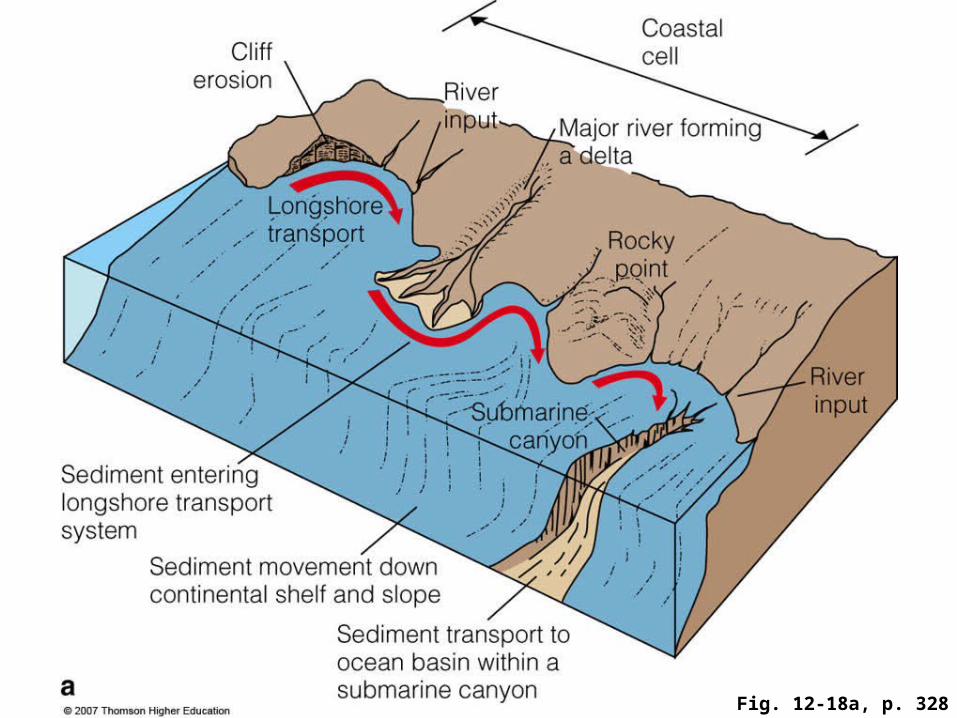
Fig. 12-18a, p. 328
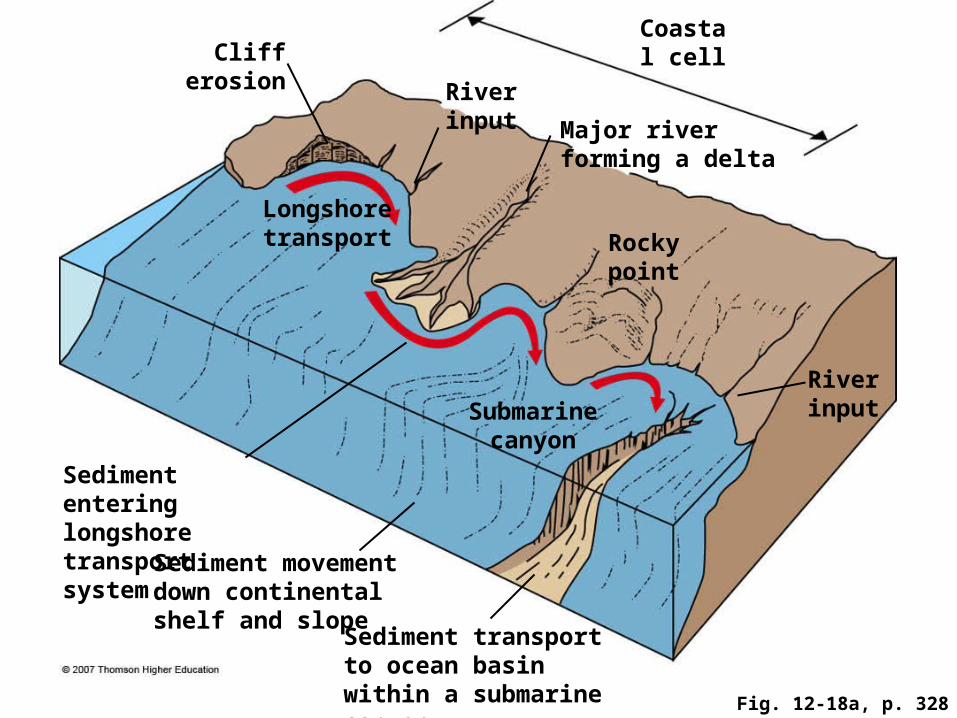
Fig. 12-18a, p. 328
Coastal cellCliff
erosion River input Major river forming
a delta
Longshore transport Rocky
point
River inputSubmarine
canyon
Sediment entering longshore transport system
Sediment movement down continental shelf and slope
Sediment transport to ocean basin within a submarine canyon

Fig. 12-18b, p. 328
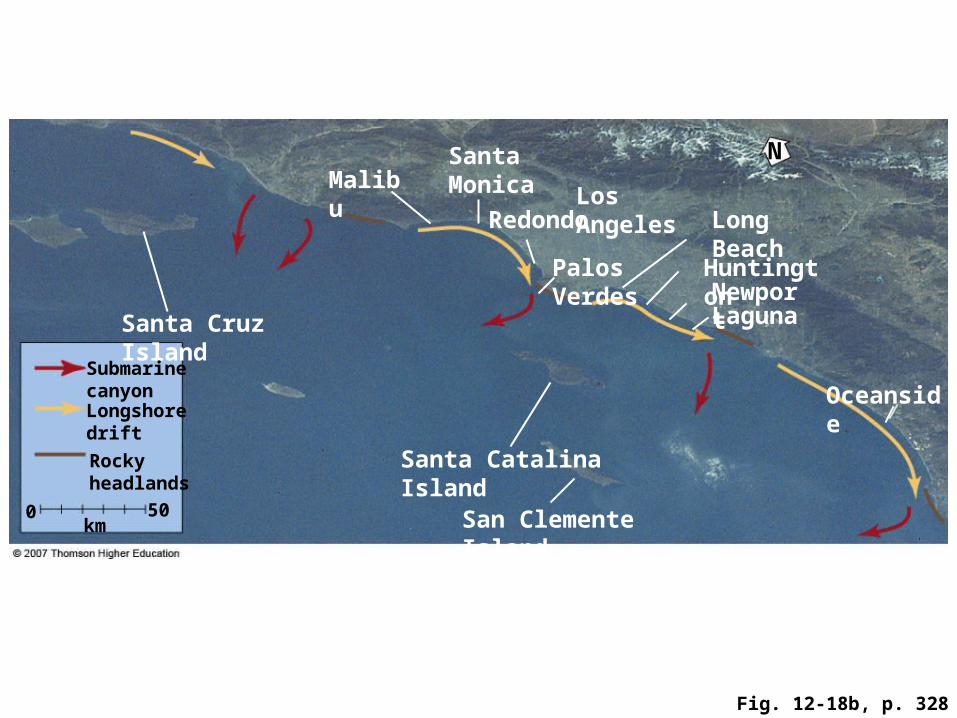
Fig. 12-18b, p. 328
Santa Monica
NMalibu
RedondoLos Angeles
Long Beach
Palos Verdes
HuntingtonNewport
Santa Cruz Island
Submarine canyon OceansideLongshore drift
Santa Catalina IslandRocky headlands
0 50 San Clemente Island
Laguna
km

Fig. 12-18c (1), p. 328
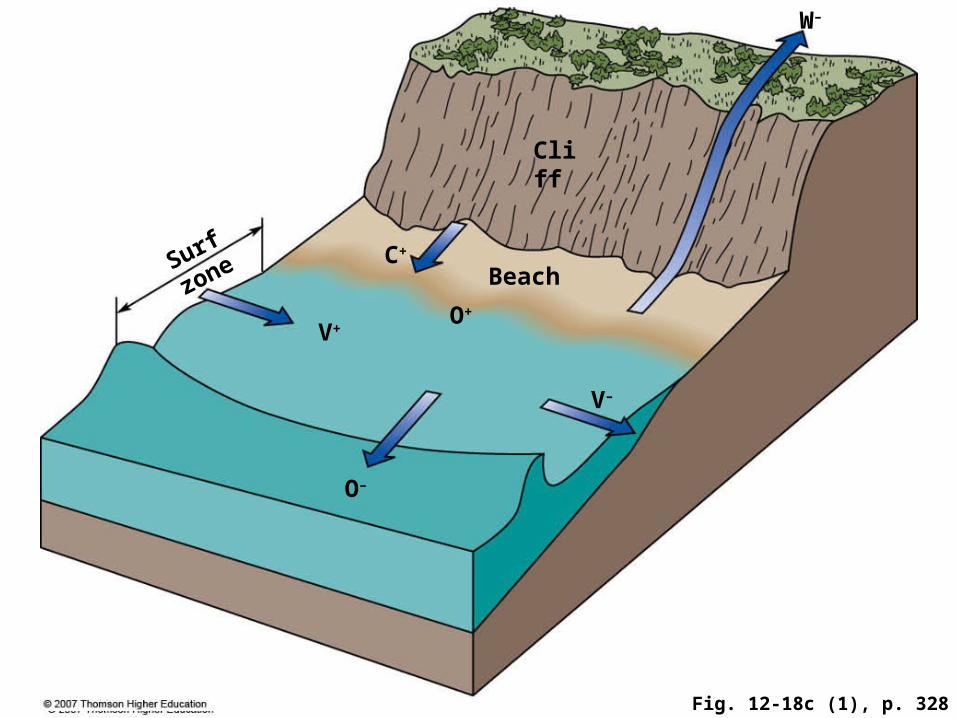
Fig. 12-18c (1), p. 328
W–
Cliff
C+Surf
zone
V+O+
Beach
V–
O–

Fig. 12-18c (2), p. 328

Fig. 12-19, p. 329
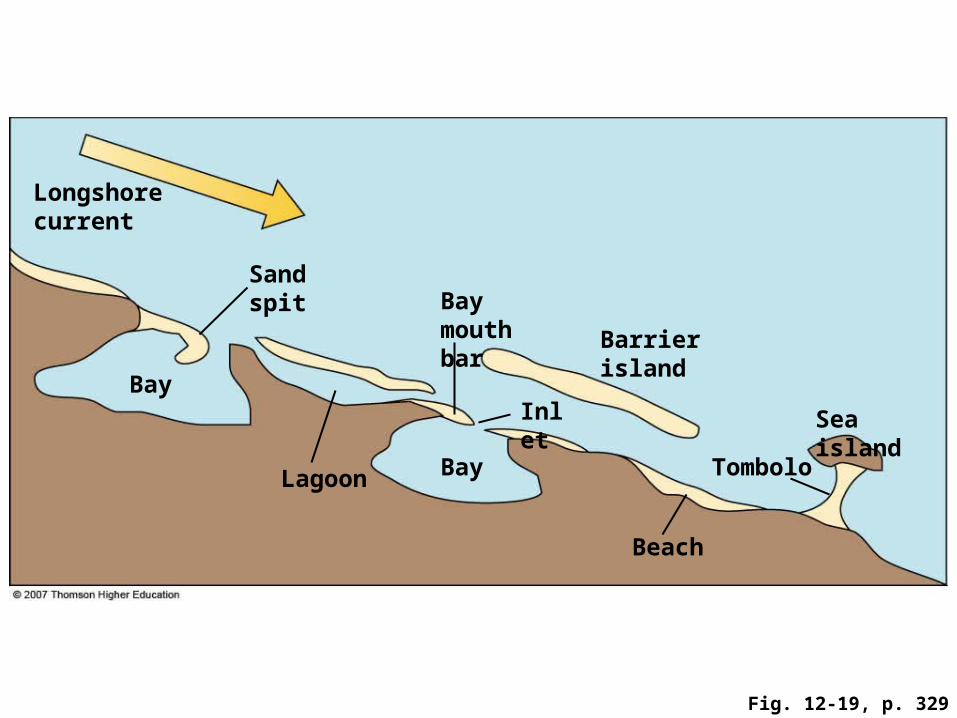
Fig. 12-19, p. 329
Longshore current
Sand spitBay mouth bar Barrier
islandBay
Inlet Sea island
Lagoon Bay Tombolo
Beach
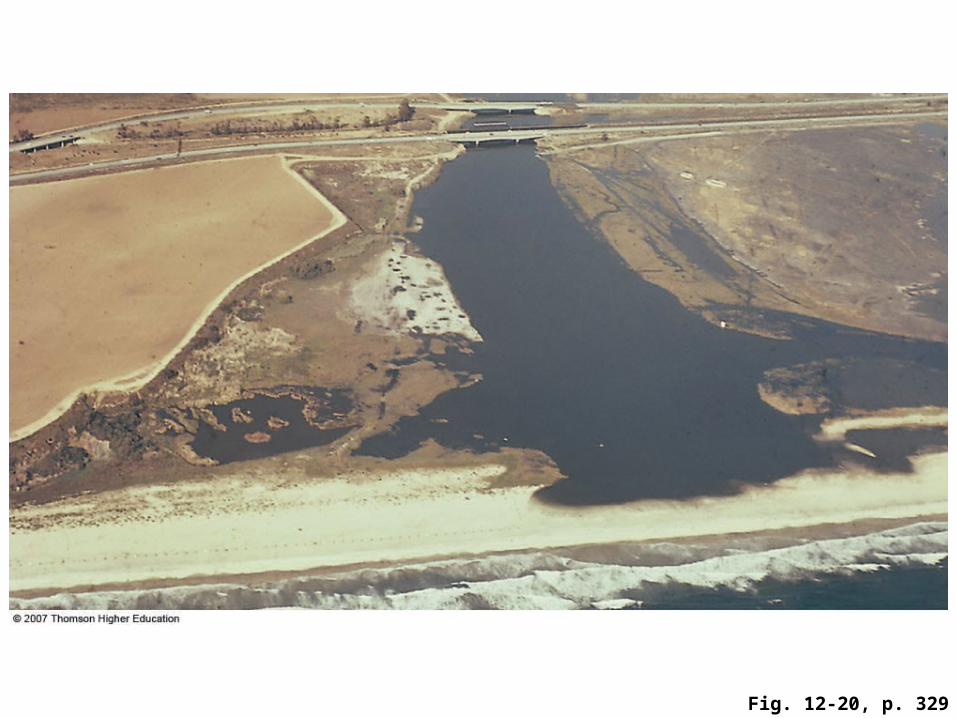
Fig. 12-20, p. 329
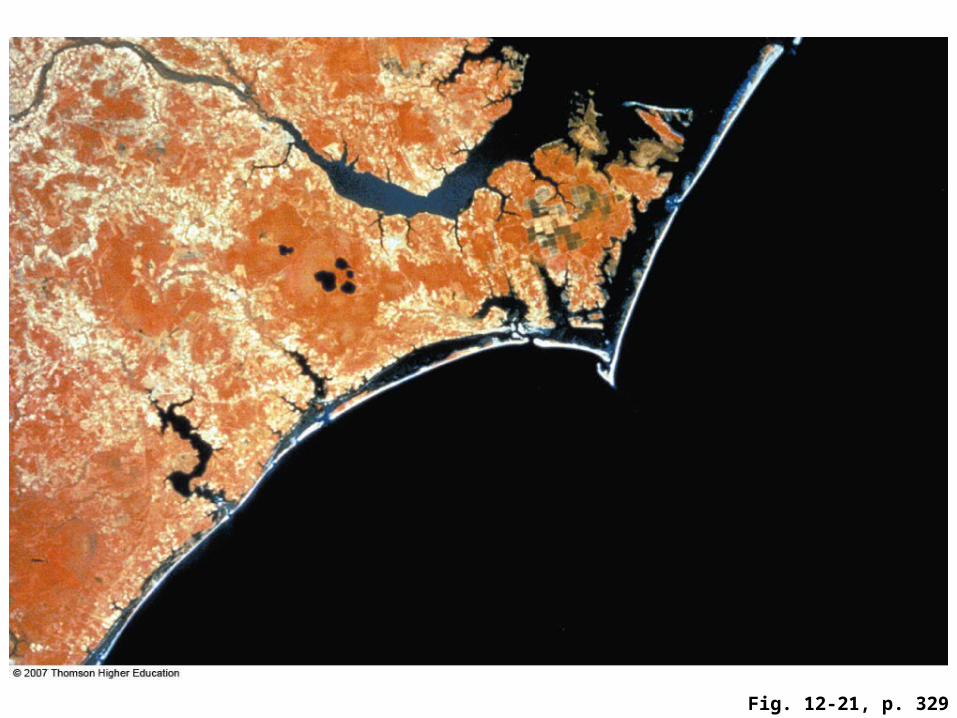
Fig. 12-21, p. 329
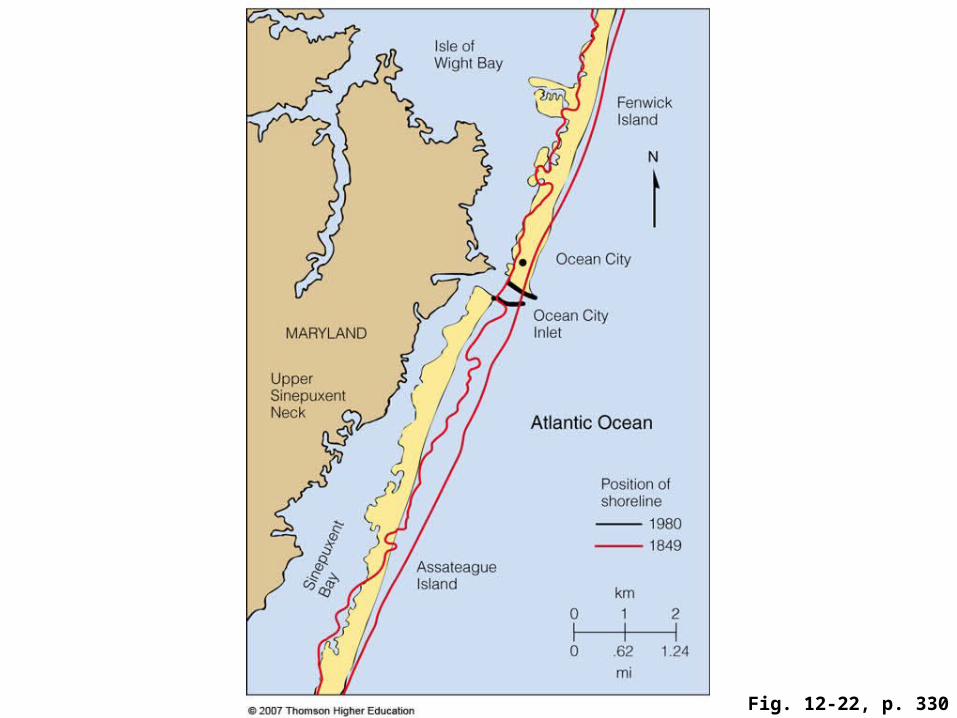
Fig. 12-22, p. 330

Fig. 12-22, p. 330
Isle of Wight Bay
Fenwick Island
N
Ocean City
Ocean City InletMARYLAND
Upper Sinepuxent Neck Atlantic Ocean
Position of shoreline
19801849Assateague
Island
Sin
epux
ent B
ay
km0 1 2
0 .62 1.24mi
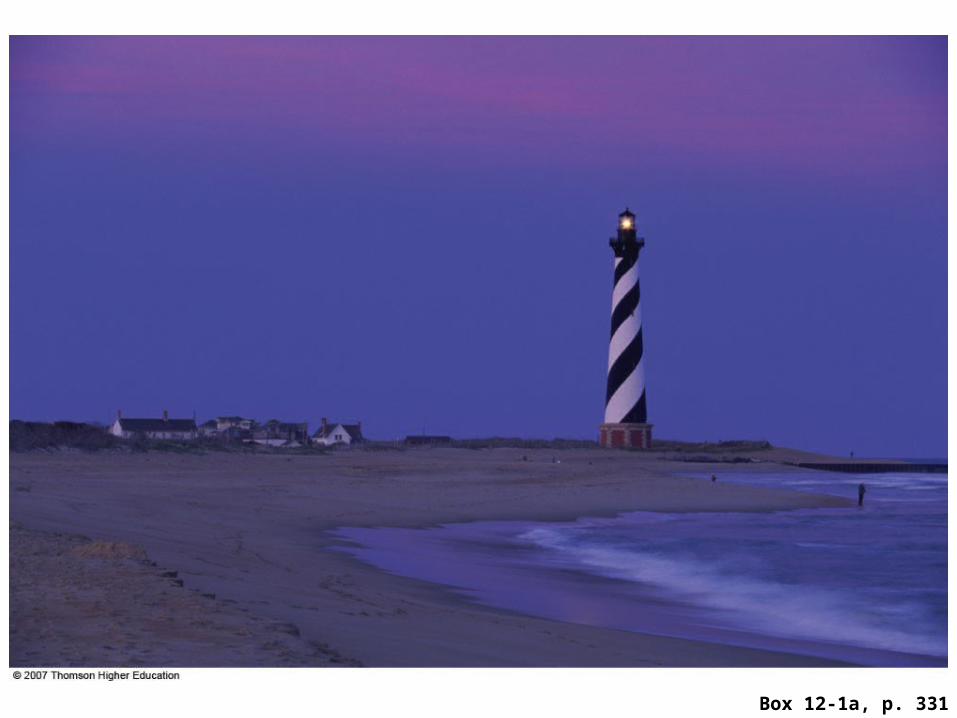
Box 12-1a, p. 331

Box 12-1b, p. 331
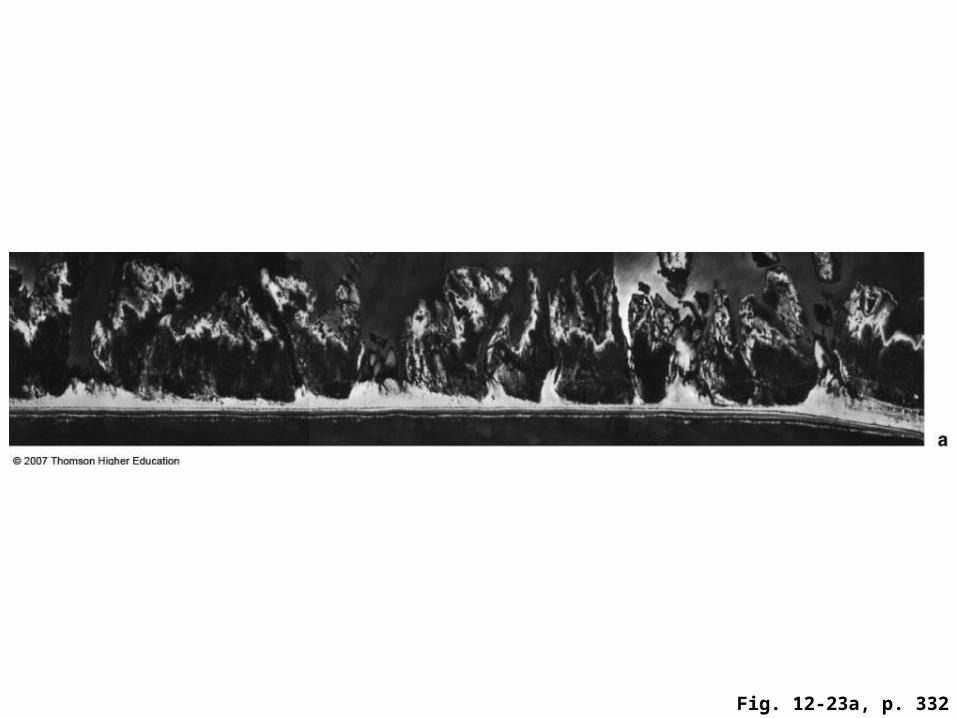
Fig. 12-23a, p. 332

Fig. 12-23b, p. 332
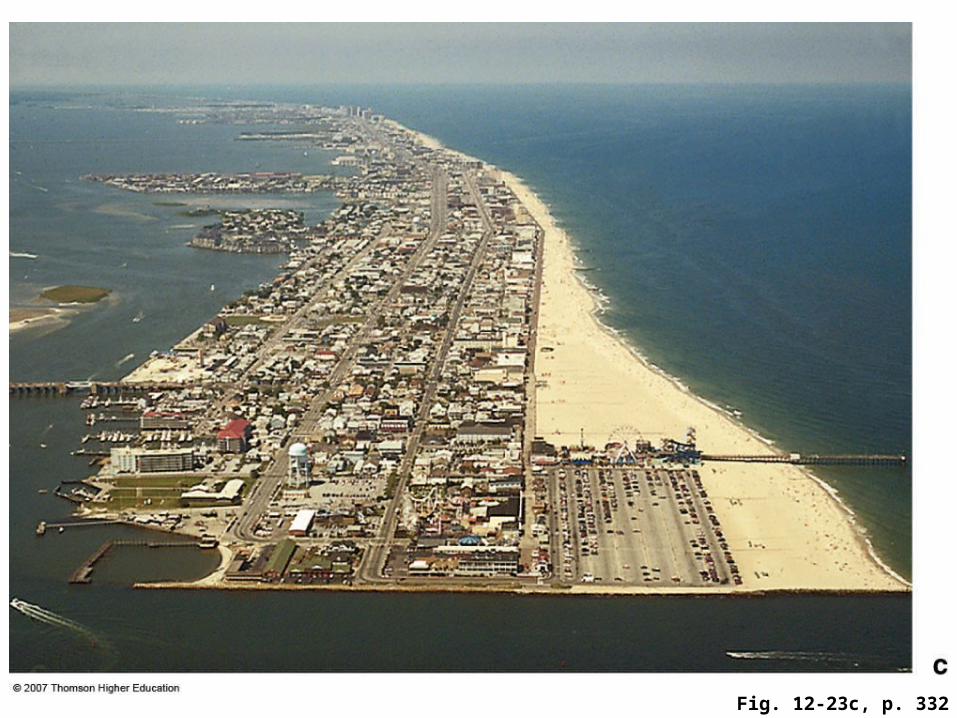
Fig. 12-23c, p. 332

Fig. 12-24a, p. 333

Fig. 12-24b, p. 333
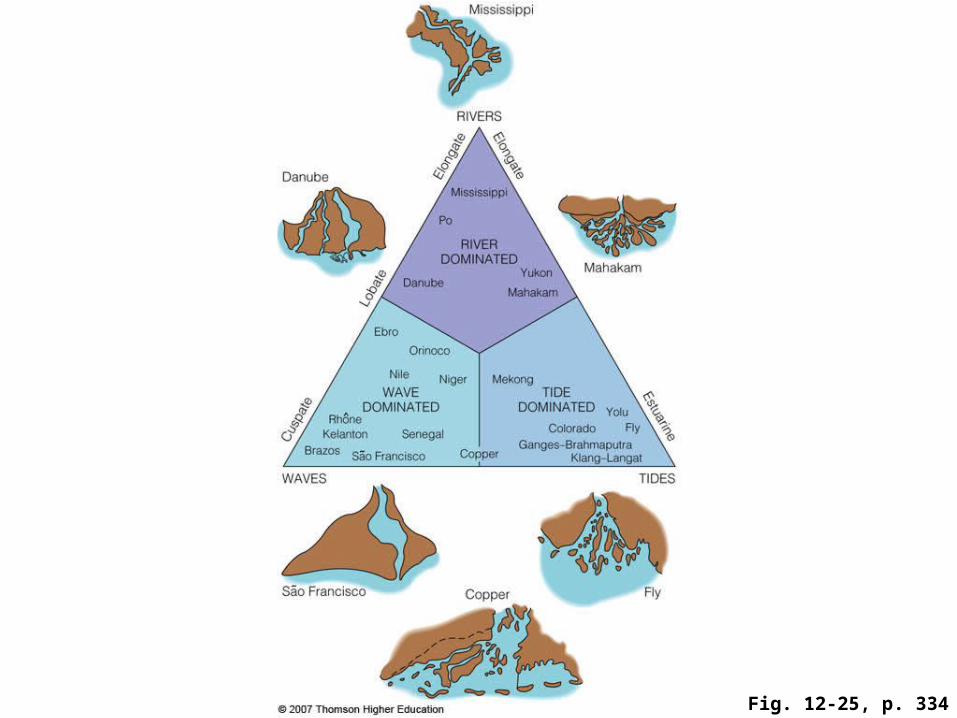
Fig. 12-25, p. 334

Fig. 12-26, p. 334
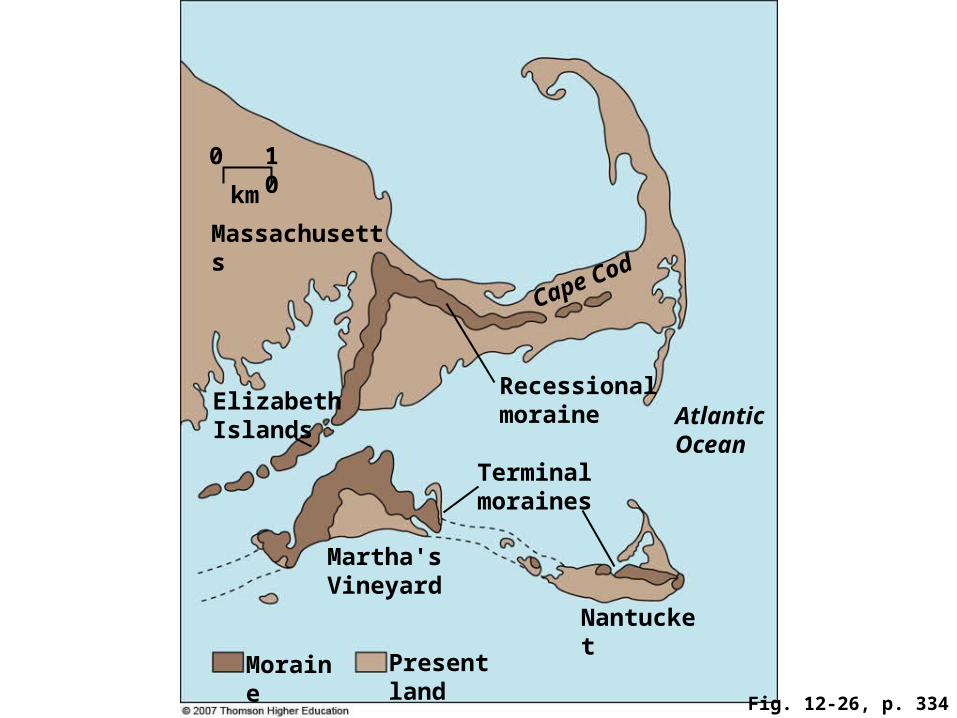
Fig. 12-26, p. 334
0 10
km
Massachusetts
Elizabeth Islands
Recessional moraine Atlantic
OceanTerminal moraines
Martha's Vineyard
Moraine Present land
Nantucket
Cape Cod
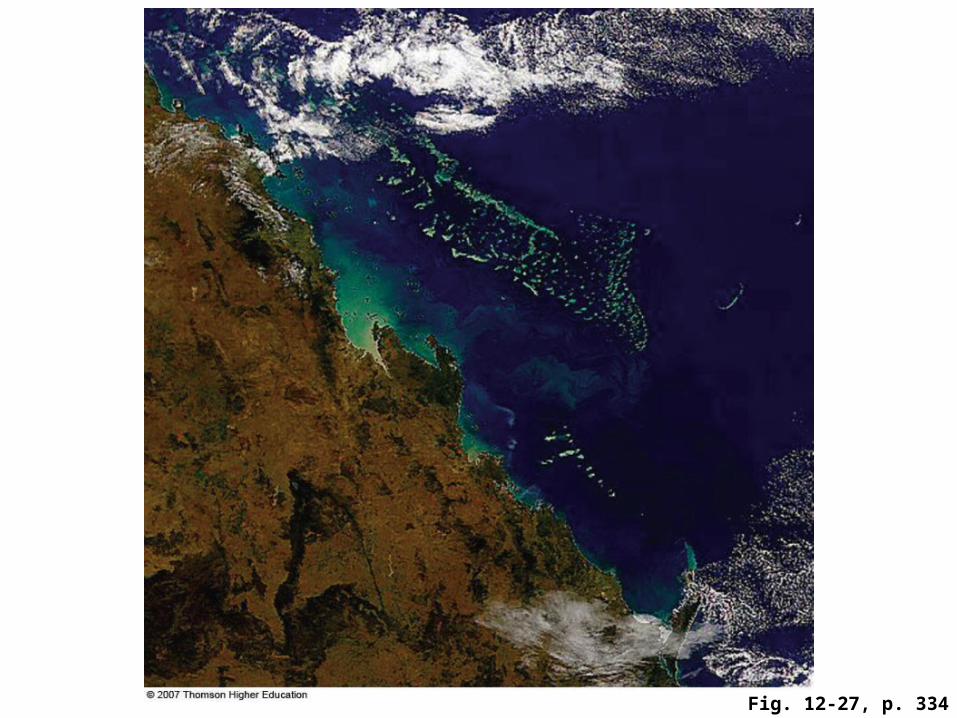
Fig. 12-27, p. 334
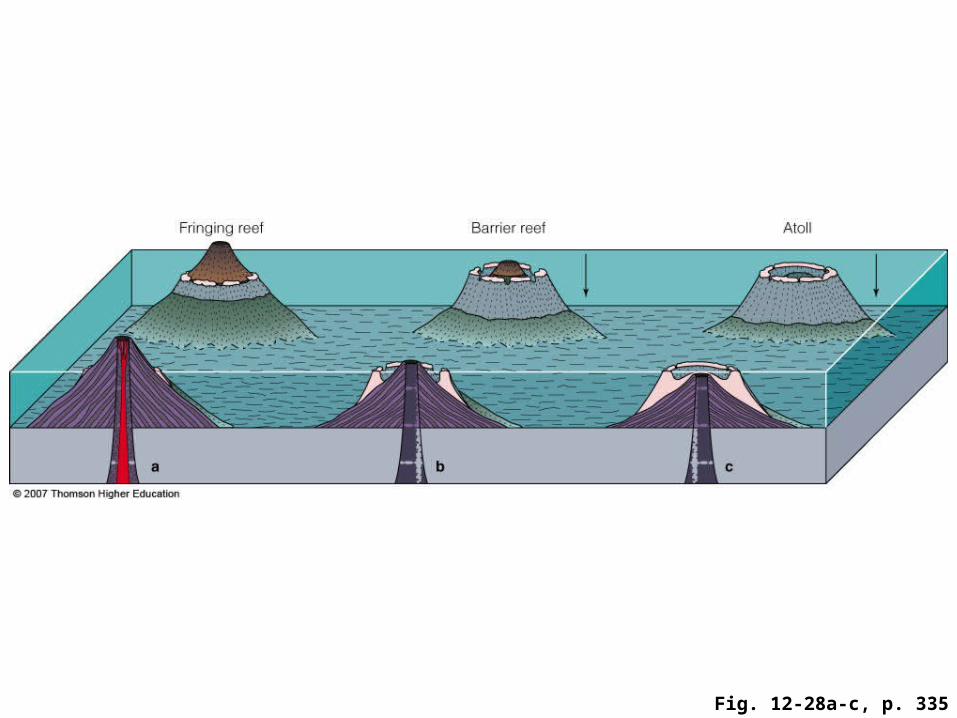
Fig. 12-28a-c, p. 335
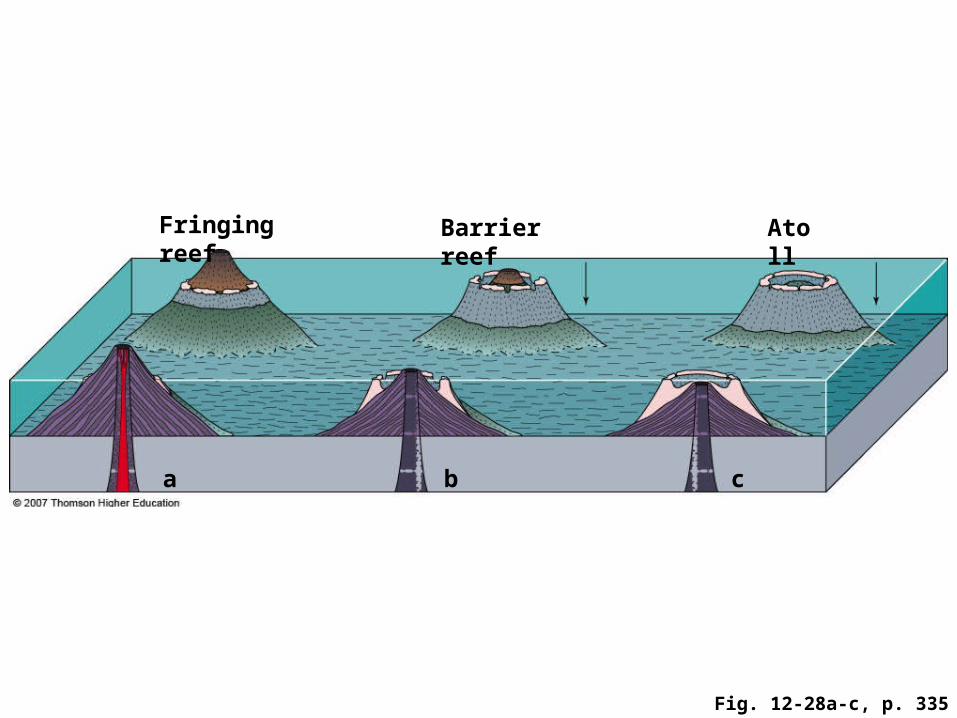
Fig. 12-28a-c, p. 335
Fringing reef Barrier reef Atoll
a b c

Fig. 12-28d, p. 335
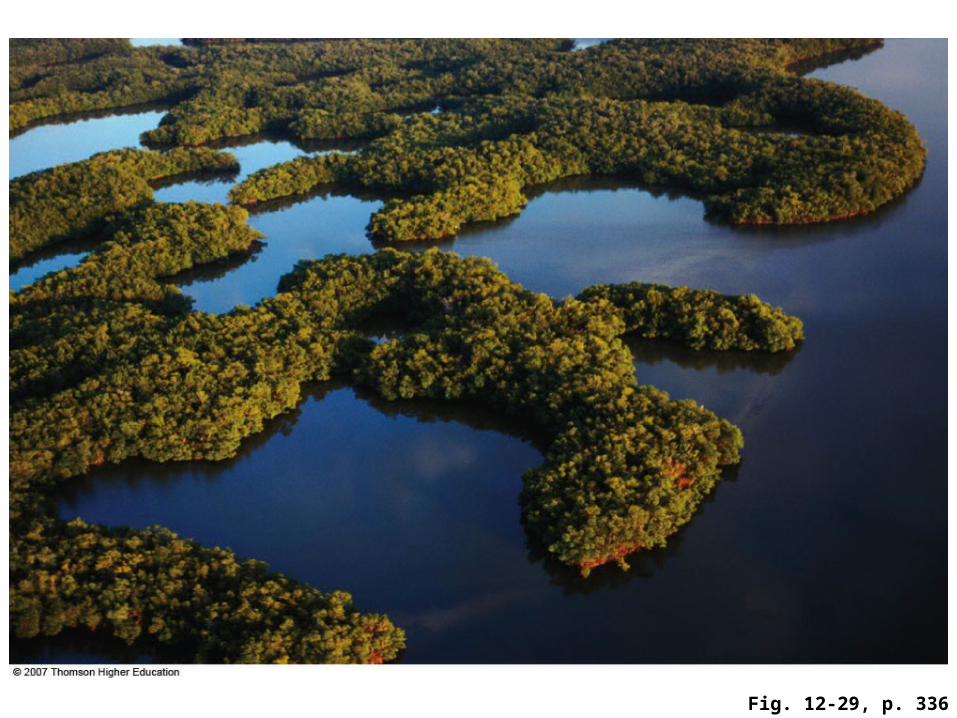
Fig. 12-29, p. 336
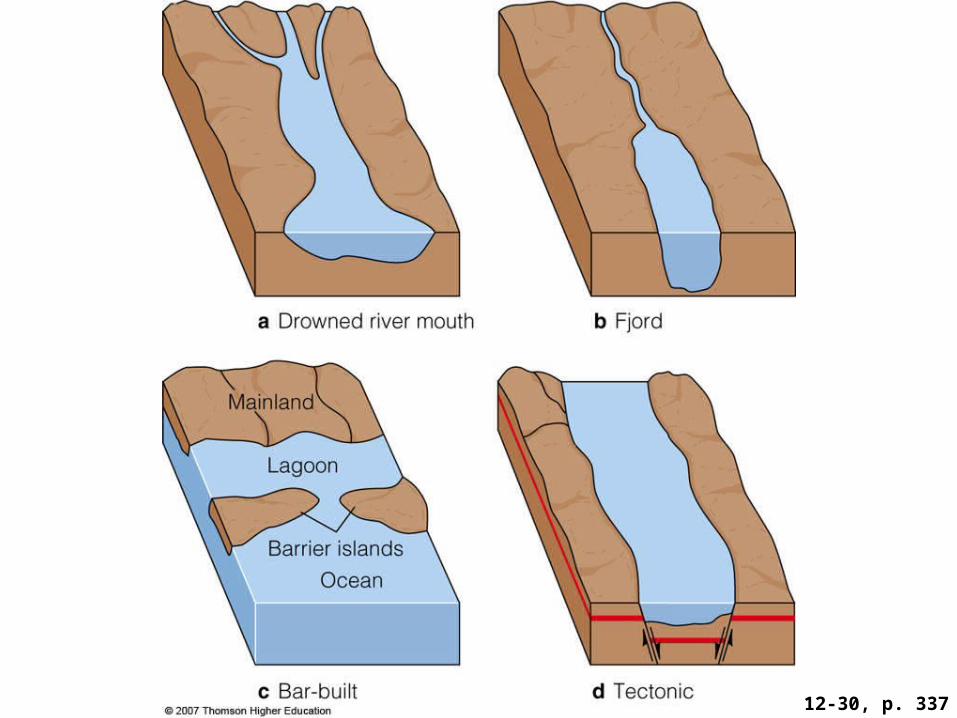
Fig. 12-30, p. 337
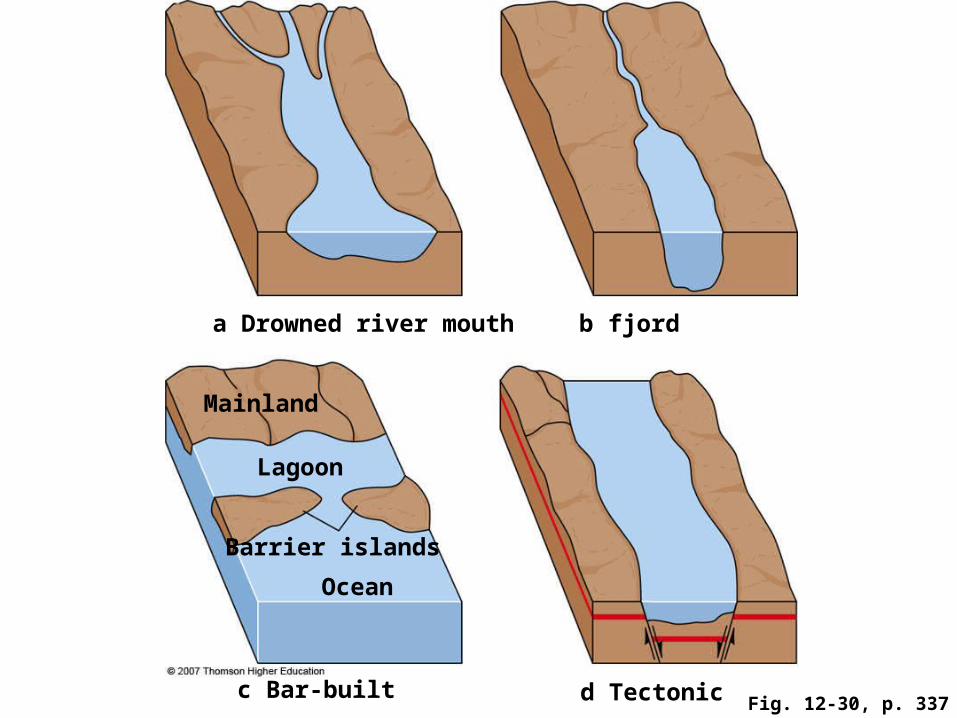
Fig. 12-30, p. 337
a Drowned river mouth b fjord
c Bar-built d Tectonic
Mainland
Lagoon
Barrier islands
Ocean

Fig. 12-31, p. 338
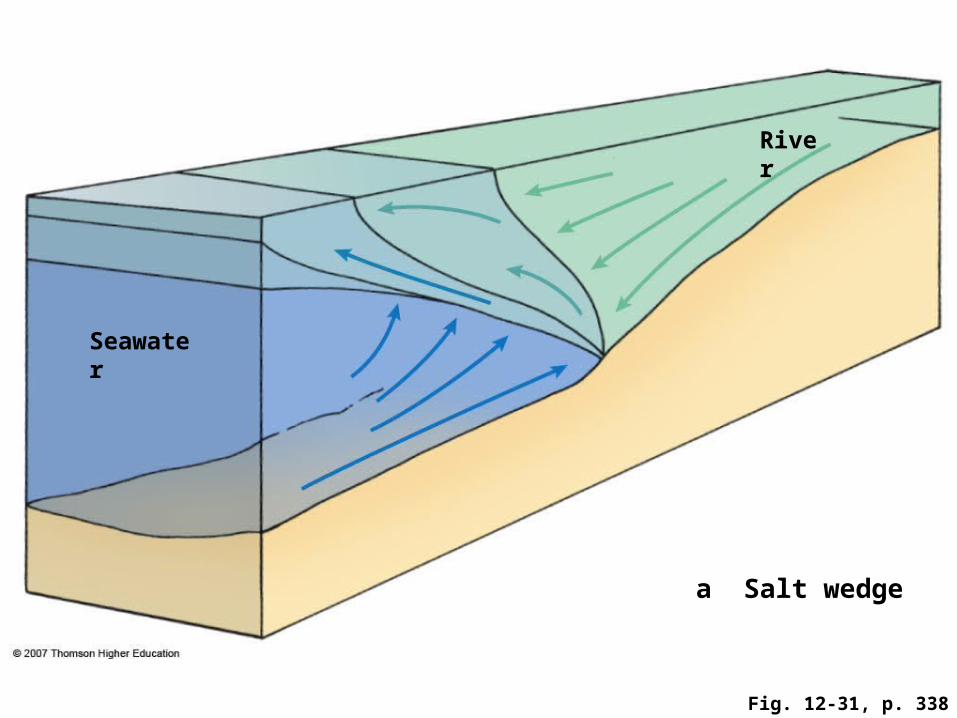
Fig. 12-31, p. 338
River
Seawater
a Salt wedge

Fig. 12-31, p. 338
River
Seawater
b Well-mixed
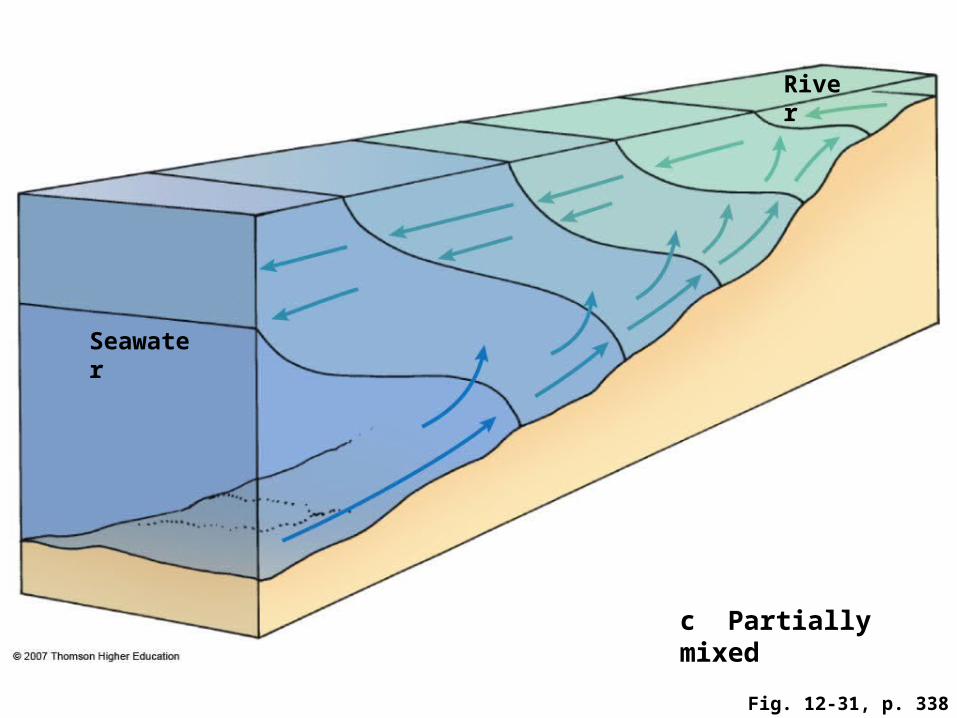
Fig. 12-31, p. 338
River
Seawater
c Partially mixed

Fig. 12-31, p. 338
River
Seawater
d Fjord

Fig. 12-32, p. 338

Fig. 12-32, p. 338
Lat
itu
de
38.0 24.00
0.00
Longitude–76.0
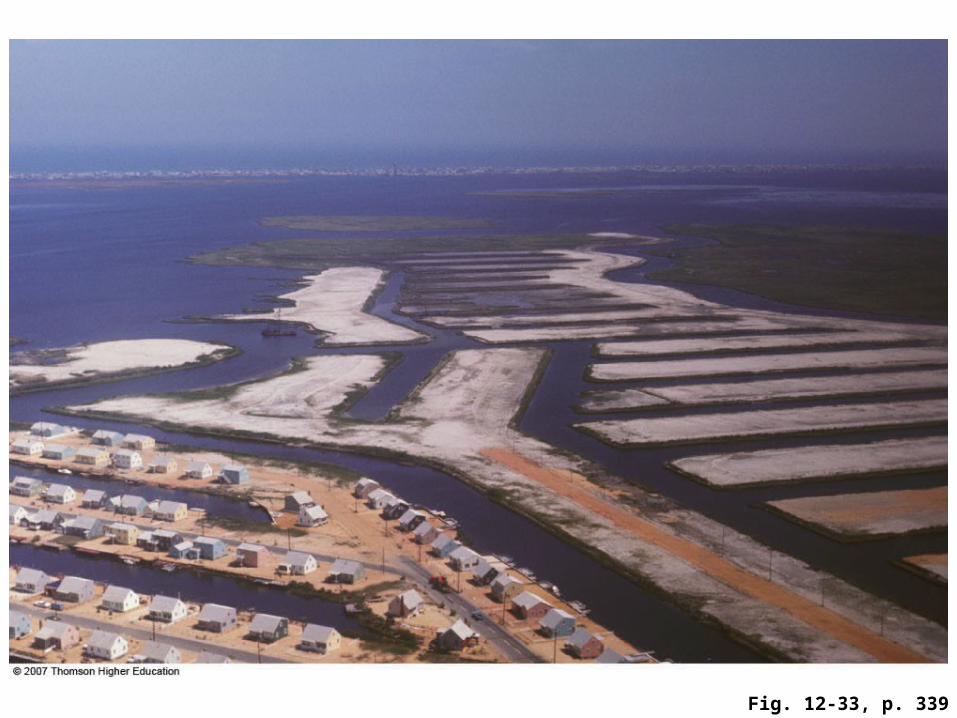
Fig. 12-33, p. 339
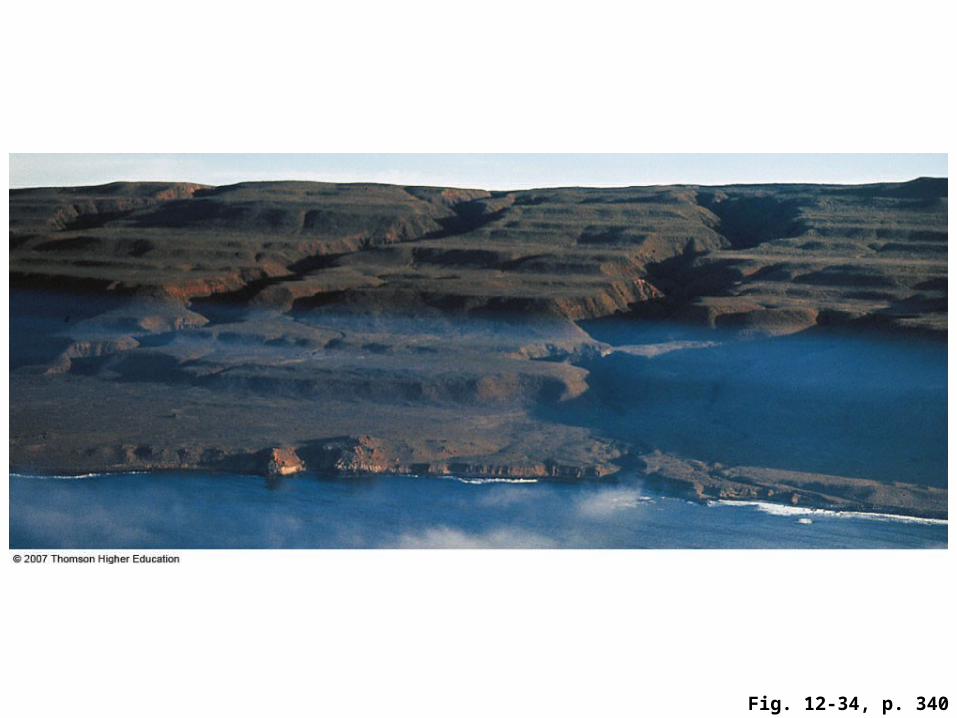
Fig. 12-34, p. 340

Fig. 12-35a, p. 341

Fig. 12-35b, p. 341
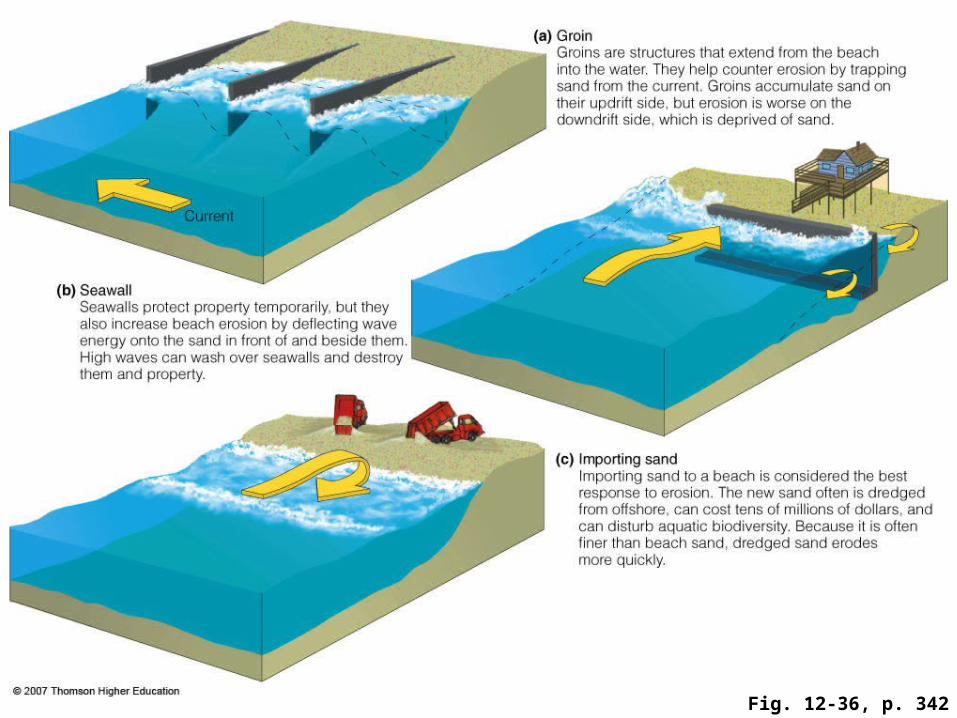
Fig. 12-36, p. 342

Fig. 12-36, p. 342
(a) Groin Groins are structures that extend from the beach into the water. They help counter erosion by trapping sand from the current. Groins accumulate sand on their updrift side, but erosion is worse on the downdrift side, which is deprived of sand.
Current
(b) Seawall Seawalls protect property temporarily, but they also increase beach erosion by deflecting wave energy onto the sand in front of and beside them. High waves can wash over seawalls and destroy them and property.
(c) Importing sand Importing sand to a beach is considered the best response to erosion. The new sand often is dredged from offshore, can cost tens of millions of dollars, and can disturb aquatic biodiversity. Because it is often finer than beach sand, dredged sand erodes more quickly.
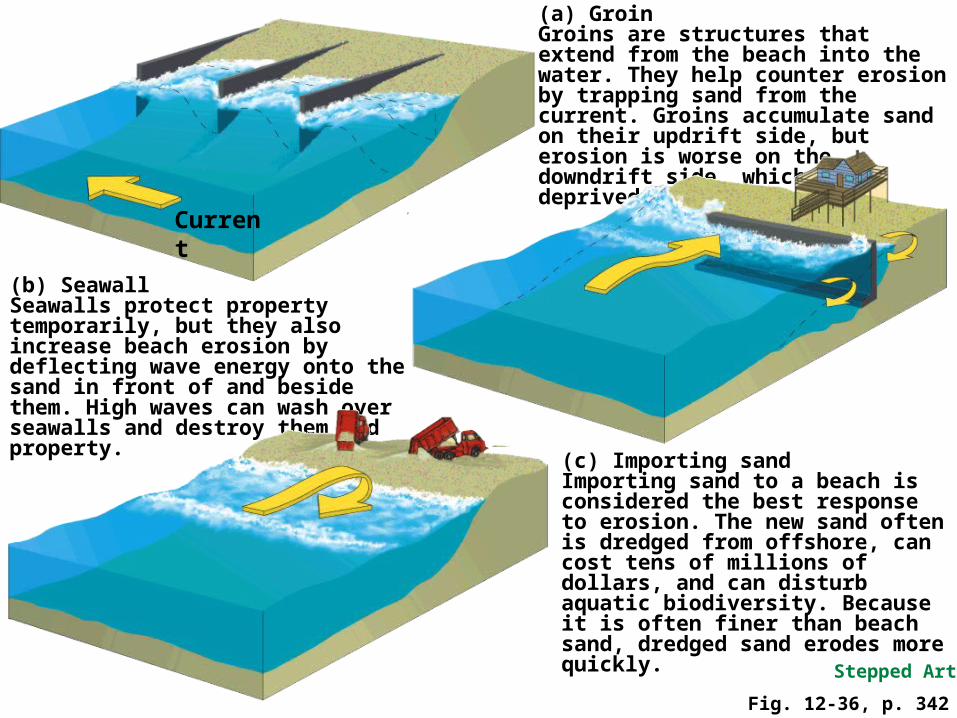
Stepped Art
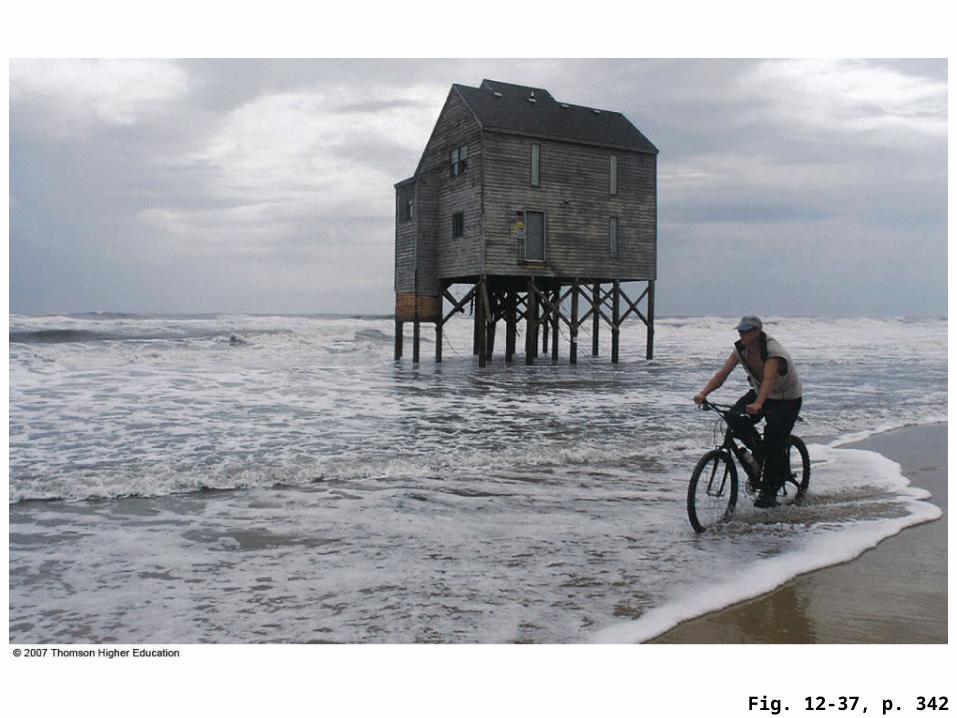
Fig. 12-37, p. 342
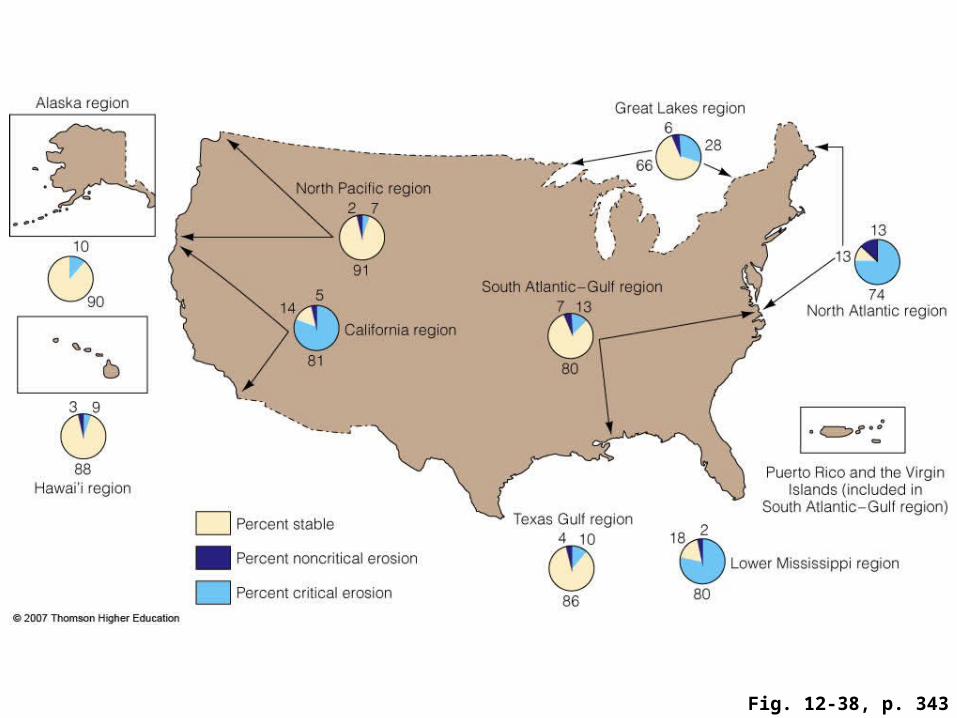
Fig. 12-38, p. 343
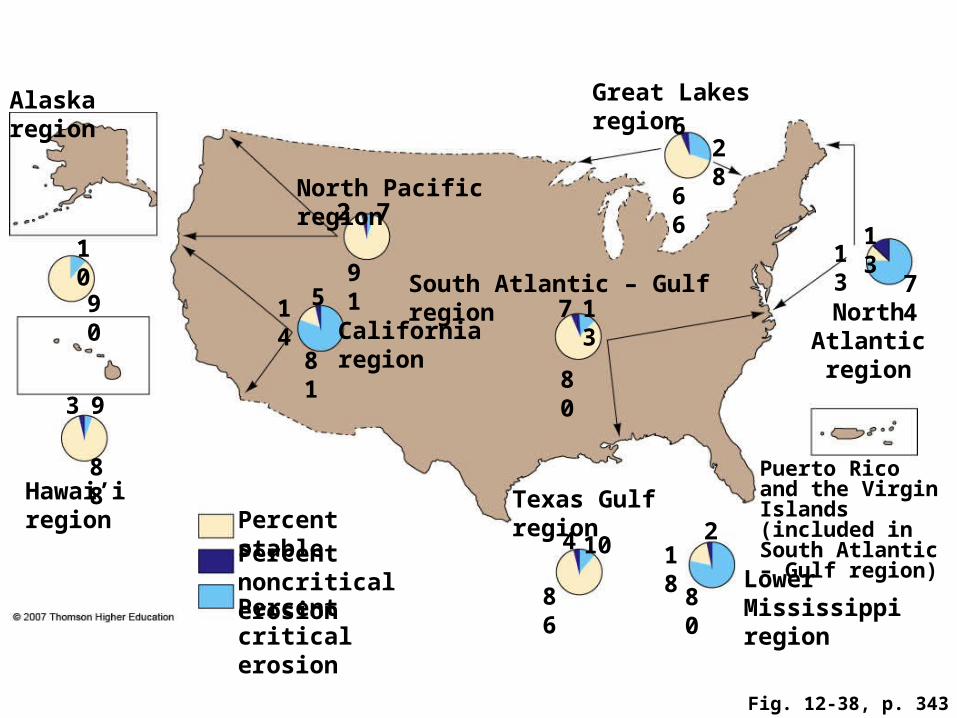
Fig. 12-38, p. 343
Alaska region Great Lakes region
28
66North Pacific region
1310 1391
14 North Atlantic region
5 7 1390California region
8180
3 9
Hawai’i regionPuerto Rico and the Virgin Islands (included in South Atlantic – Gulf region)
Percent stableTexas Gulf region
182
Percent noncritical erosion Lower
Mississippi region
Percent critical erosion
86 80
South Atlantic – Gulf region
6
74
88
72
104