FIFTH NATIONAL COMMUNICATION of the Republic of Latvia to ...
169
MINISTRY OF THE ENVIRONMENT OF THE REPUBLIC OF LATVIA FIFTH NATIONAL COMMUNICATION of the Republic of Latvia to the United Nations Framework Convention on Climate Change RĪGA, 2009
Transcript of FIFTH NATIONAL COMMUNICATION of the Republic of Latvia to ...
MINISTRY OF THE ENVIRONMENT OF THE REPUBLIC OF LATVIA
FIFTH NATIONAL COMMUNICATION
of the Republic of Latvia
to the United Nations Framework Convention on Climate Change
RĪGA, 2009
FIFTH NATIONAL COMMUNICATION OF THE REPUBLIC OF LATVIA TO THE UNITED NATIONS FRAMEWORK CONVENTION ON CLIMATE CHANGE
2
Contact Information: Ministry of the Environment of the Republic of Latvia Climate Policy and Technology Department Peldu 25, Riga, LV 1494, Latvia Phone: (+371) 67026567 Fax: (+371) 67820442 E-mail: [email protected] Webpage: http://www.vidm.gov.lv Publisher: Ministry of the Environment of the Republic of Latvia

FIFTH NATIONAL COMMUNICATION OF THE REPUBLIC OF LATVIA TO THE UNITED NATIONS FRAMEWORK CONVENTION ON CLIMATE CHANGE
3
TABLE OF CONTENTS INTRODUCTION ............................................................................................................................................................. 6 1. SUMMARY ............................................................................................................................................................. 7
1.1. General Information about the Republic of Latvia ........................................................................................ 8 1.2. GHG Inventory Report ................................................................................................................................. 10 1.3. Policies and Measures ................................................................................................................................. 11 1.4. Joint Impact of Projections, Policies and Measures and the Mechanisms of the Kyoto Protocol .............. 13 1.5. Climate Change Impact, Vulnerability Assessment and Adaptation Measures .......................................... 15 1.6. Research and Systematic Observations ...................................................................................................... 16 1.7. Education, Training and Raising of Public Awareness ................................................................................. 16
2. GENERAL INFORMATION ABOUT THE REPUBLIC OF LATVIA ............................................................................... 18 2.1. Geographical Profile and Climate ................................................................................................................ 19 2.2. National Political System ............................................................................................................................. 21 2.3. Social Development .................................................................................................................................... 23 2.4. Economic Development .............................................................................................................................. 26
3. GREENHOUSE GAS INVENTORY INFORMATION .................................................................................................. 46 3.1. Summary on GHG Emission Time Series ..................................................................................................... 47 3.2. National System .......................................................................................................................................... 52 3.3. Main greenhouse gases............................................................................................................................... 55 3.4. Indirect GHG Emissions ............................................................................................................................... 61 3.5. Accuracy/Inaccuracy of Data ....................................................................................................................... 63 3.6. Changes after Publication of the Fourth National Communication ............................................................ 63 3.7. National Registry of GHG Emissions ............................................................................................................ 64
4. POLICIES AND MEASURES ................................................................................................................................... 73 4.1. Policy Development Process ....................................................................................................................... 74 4.2. National and Regional Programs ................................................................................................................. 75 4.3. Policies, Measures and their Impact ........................................................................................................... 80 4.4. Policies and Measures in Compliance with Article 2 of the Kyoto Protocol ............................................... 99
5. PROJECTIONS, TOTAL IMPACT OF POLICIES AND MEASURES AND THE KYOTO PROTOCOL MECHANISMS ..... 100 5.1. Projections ................................................................................................................................................ 101 5.2. Assumptions of the Total Impact of Policies and Measures ..................................................................... 109 5.3. Mechanisms of Articles 6, 12 and 17 of the Kyoto Protocol ..................................................................... 109 5.4. Methodology ............................................................................................................................................. 110
6. CLIMATE CHANGE IMPACT, VULNERABILITY ASSESSMENT AND ADAPTATION MEASURES ............................. 120 6.1. Vulnerability and Threat Assessment ............................................................................................................. 121 6.2. Projected Impact of Climate Change .............................................................................................................. 126 6.3. Adaptation Policies and Measures ................................................................................................................. 128
7. FINANCIAL RESOURCES AND TRANSFER OF TECHNOLOGY, INCLUDING INFORMATION UNDER ARTICLES 10 AND 11, OF THE KYOTO PROTOCOL .......................................................................................................................... 132 8. RESEARCH AND SYSTEMATIC OBSERVATIONS .................................................................................................. 133
8.1. Scientific Research .................................................................................................................................... 134 8.2. Systematic Observations ........................................................................................................................... 136
9. EDUCATION, TRAINING AND RAISING OF PUBLIC AWARENESS ON ENVIRONMENTAL ISSUES ........................ 140 9.1. Political Tools ............................................................................................................................................ 141 9.2. Educational Establishments ...................................................................................................................... 143 9.3. Involvement of NGO’s and Public Organisations ........................................................................................... 145 9.4. Community Information Measures ................................................................................................................ 147 9.5. Participation in International Projects ........................................................................................................... 150
ANNEXES ................................................................................................................................................................... 151 Annex 1. GHG Emission Inventory and Summary Tables, 2007 ............................................................................ 152 Annex 2. Measures for the Implementation of the European Community Legislation and Policy ....................... 162 Annex 3. Summary on additional reporting in the framework of Article 7(2) of the Kyoto Protocol ................... 167 Annex 4. List of projection indicators ................................................................................................................... 168
FIFTH NATIONAL COMMUNICATION OF THE REPUBLIC OF LATVIA TO THE UNITED NATIONS FRAMEWORK CONVENTION ON CLIMATE CHANGE
4
ABBREVIATIONS
RES Renewable Energy Sources UN United Nations CITL Community Independent Transaction Log CRF Common Reporting Format CSB Central Statistical Bureau of the Republic of Latvia ECMWF European Centre for Medium-Range Weather Forecasts ECOMET Economic Interest Grouping of the National Meteorological Services of the
European Economic Area ERAF European Regional Development Fund EU European Union ETR Emissions Trading Registry ETS Emission Trading System EUMETNET Network of European Meteorological Services EUMETSAT European Organization for the Exploitation of Meteorological Satellites EUROSTAT Statistical Office of the European Union HPP Hydropower plant GDP Gross Domestic Product ISO International Organization for Standardization ISPA Instrument for Structural Policies for Pre-Accession ITL International Transaction Log JI Joint Implementation GAP Good Agricultural Practices BAT Best Available Techniques LR Republic of Latvia LEGMA Latvian Environment, Geology and Meteorology Agency LEGMC Latvian Environment, Geology and Meteorology Centre CM Cabinet of Ministers NA Not applicable NE Not estimated NO Not occurring NVA State Employment Agency PFC Perflurocarbons PHARE Poland and Hungary: Assistance for the Restructuring of the Economy WTO World Trade Organization SAPARD Special Accession Programme for Agriculture and Rural Development GHG Greenhouse gas IET International Emissions Trading LLC Limited Liability Company CDM Clean Development Mechanism UNDP United Nations Development Programme
FIFTH NATIONAL COMMUNICATION OF THE REPUBLIC OF LATVIA TO THE UNITED NATIONS FRAMEWORK CONVENTION ON CLIMATE CHANGE
5
MoE Ministry of the Environment SLLC State Limited Liability Company VZIP Latvian Council of Environmental Science and Education LULUCF Land Use, Land-Use Change and Forestry CHEMICAL FORMULAS CH4 methane CO2 carbon dioxide HFC hydrofluorocarbons NMVOC non-methane volatile organic compounds N2O nitrous oxide NOX nitric oxide SF6 sulphur hexafluoride SO2 sulphur dioxide UNITS OF MEASUREMENT kg kilogram (103 grams) t ton (106 grams) kt kiloton (103 ton) Gg gigagram (109 grams) mm millimetre (10-3 meters) km kilometre (103 meters) ha hectare (104 m2) MW megawatt (106 wat) GWh gigawatthour (109 watt-hours) TJ terajoule (1012 joules) PJ petajoule (1015 joules) EUR euro LVL lat (0.70284 EUR)
FIFTH NATIONAL COMMUNICATION OF THE REPUBLIC OF LATVIA TO THE UNITED NATIONS FRAMEWORK CONVENTION ON CLIMATE CHANGE
6
INTRODUCTION
On 1992 in Rio de Janeiro UN Conference on Environment and Development Latvia alongside with more than 190 other countries of the world signed the United Nations Framework Convention on Climate Change (hereinafter - the Convention). The Convention was ratified by the Parliament (the Saeima) of the Republic of Latvia on 23 February 1995. In 1997 the Convention was supplemented with the Kyoto Protocol which was ratified by the Republic of Latvia on 30 May 2002.
The Fifth National Communication of the Republic of Latvia to the United Nations Framework Convention on Climate Change was elaborated in accordance with the Convention, Article 12, the Kyoto Protocol, Article 7 and by also having regard of the „Annotated Outline for Fifth National Communications of Annex I Parties under the UNFCCC, including Reporting Elements under the Kyoto Protocol”. The Communication outlines principal information on the main events and Latvia’s achievements in the time period from adoption of the Climate Change Mitigation Programme for 2005 - 2010 till elaboration of the Fourth National Communication of the Republic of Latvia to the United Nations Framework Convention on Climate Change, including 2007 GHG emission inventory and material information pertaining to climate changes for the time period up to 2009.
Latvia actively participates in fulfilment of the obligations set forth in the Convention and in the Kyoto Protocol, by implementing both national and EU climate policies. The GHG emission accounting and reporting system and a functioning emission trading system have been implemented. Application of the International Emissions Trading System in Latvia has been successfully launched. The scopes and aims of climate change mitigation are included in national and regional planning documents of Latvia. Public awareness and the understanding of state administration about climate issues have materially increased.
In accordance with the Kyoto Protocol Latvia individually or acting jointly with some other country has to reduce the total anthropogenic emissions of carbon dioxide (CO2), methane (CH4), nitrous oxide (N2O), hydro fluorocarbons (HFC) and sulphur hexafluoride (SF6) by 8% in the period 2008 - 2012 as compared to the emissions level of 1990, thus the average annual GHG emission in the listed period of time cannot exceed 23.323 Gg CO2 equivalent. Currently the GHG emission of Latvia is considerably below the target of the Kyoto Protocol - the total amount of GHG emission in 2007 was 12 082.67 Gg CO2 eq. (50.69% from the target amount) what serves as a confirmation that Latvia will be able to achieve the set target.
FIFTH NATIONAL COMMUNICATION OF THE REPUBLIC OF LATVIA TO THE UNITED NATIONS FRAMEWORK CONVENTION ON CLIMATE CHANGE
7
1. SUMMARY
FIFTH NATIONAL COMMUNICATION OF THE REPUBLIC OF LATVIA TO THE UNITED NATIONS FRAMEWORK CONVENTION ON CLIMATE CHANGE
8
1.1. General Information about the Republic of Latvia Latvia comprises an area of 64.559 km2. Since the beginning of the previous century the forest area of Latvia has almost doubled and currently occupies more than 51% of the total territory of the country. Latvia lies in the temperate climate zone having typical features of the sea climate. The cyclones account for high nebulosity (in average 160 – 180 cloudy days per year). The total average annual precipitation in the time period from 2004 - 2007 complied the norm (658 mm), the average wind speed was 2.9 – 3.2 what was below the set norm. The earth entrails contain multiform mineral deposits, such as dolomite, limestone, clay, gypsum, sand and gravel. The swamps are rich in peat beds. Latvia is an independent democratic parliamentary republic. The President of the State is elected by the national Parliament (the Saeima) for the term of four years who accordingly nominates the Prime Minister and invites him/her to form the Cabinet of Ministers to be approved by the Saeima. There are 14 branch ministries assisting the Cabinet of Ministers to implement state administrative functions.
Till 2009 the administrative territorial structure of Latvia consisted of two types of municipalities - local (city, parish and district municipalities) and regional municipalities. For a long period of time there were quite a number of economically and administratively weak municipalities. The municipalities were merged into 26 districts with more than 500 average level municipalities. The administrative - territorial reform whose scope was to establish local municipalities able to undergo economic development was completed in 2009 and the new administrative division came into force on 1 July and encompass 9 cities and 109 districts.
Beginning 2007 the total population of Latvia was 2281.3 thousand people, 722.4 thousand thereof living in the capital city Riga. There are 77 cities in Latvia, wherefrom 23 with the total population above 10000. The average population density in the country was 35.3 persons per square meter. Demographic statistics show that under the influence of various factors the total population of Latvia is still declining.
The strong economic growth of 2004 – 2007 had favourably affected the income of population, however the GDP per capita in 2008 measured in terms of purchasing power parity was 52.6% from the EU-27 average. For several years Latvia enjoyed the most rapid economic growth in EU – in the time period 2005-2007 the average annual GDP growth was 10.4%, what to a certain extent was a prerequisite for "overheating economy". In 2006 the balance of payment current account deficit underwent sharp increase by reaching 21.1% from the GDP. The main component thereof was the explicitly negative balance of trade. Since second half of 2007 the economy of Latvia is experiencing recession.
EU is the main trade partner of Latvia. After regaining of independence, the amount of foreign trade with the Member States of the EU was constantly increasing and reached 77% in 2007. After accession of the Republic of Latvia to the European Union, the foreign trade with the neighbouring countries Lithuania and Estonia was also continuing to expand. As compared to 2003, the foreign trade with the neighbouring countries has gone up threefold and as for today is making up 30% from the total foreign trade with EU Member States.
Accession of the Republic of Latvia to the European Union became an important factor for acceleration of investment flow.
FIFTH NATIONAL COMMUNICATION OF THE REPUBLIC OF LATVIA TO THE UNITED NATIONS FRAMEWORK CONVENTION ON CLIMATE CHANGE
9
In the time period from 2004–2007 the amount of investments in the national economy of Latvia increased almost twice. Such swift investment dynamics (22% per year in average) was mainly based upon availability of cheap resources due to excessive foreign capital inflow and improvement of the financial condition of enterprises made possible because of the relatively small tax burden and high domestic demand.
Economic growth in the time period from 2004-2007, mostly due to former demand stimulus, had transformed the structure of the national economy, making a decline towards service industry – sale, transport and also construction. The proportion of manufacturing industry still remains low and lacks behind EU average.
Latvia is among the countries heavily depending on imported energy sources (natural gas, oil products, coal and electrical energy). The main local energy sources are pulp, hydro-energy and peat. The import of electrical energy from other countries, such as Russia, Estonia and Lithuania is also of crucial importance. In 2007 the state joint stock company AS Latvenergo produced 53% from the necessary amount of electrical energy 39% – were supplied by other countries 8% – were purchased from small power plants. Besides, the proportion of the renewable energy sources in production of electrical energy is also considerable - 46%.
The favourable geographical position - the crossroads of important international roads at the Baltic Sea and the ice-free seaports of Ventspils and Liepaja, railway and road networks together with gas and oil pipelines create good preconditions for development of the transport system of Latvia. Transport is among the fastest growing sectors of Latvia. Transit and international transport constitute the major part of cargo transport in Latvia. The number of transport vehicles, especially personal vehicles is rapidly growing. Within the last decade the annual increase of the number of personal vehicles has been 4 -6%.
The growth rate of the manufacturing industry in the time period from 2004 – 2007 was slower than that of the national economy in average. The proportion of the output volume of the manufacturing industry in the national economy was smaller than in the majority of EU Member States and in 2007 amounted merely to 9.54% The manufacturing industry has been experiencing constant reduction since 2000. Although within the last eight years (1999 – 2007) the manufacturing industry was facing stable production increase – 8.7% a year in average, however the manufacturing speed has been going down since 2007 and was already 1% below the indicators of the previous year. The most rapid growth was experienced by the metal working industry, production of electrical and optical appliances, woodworking and the food processing industry. In recent years construction has been among the most dynamically developing sectors of the national economy of Latvia. The total added value of construction has increased from 5.6% in 2001 to 6.8% in 2006. In comparison to 2006, in 2007 the construction rate (calculated in reference prices) has gone up by 21.3% or 157.6 million LVL.
Residential and public buildings are the main consumers of thermal energy, accounting for more than 70% from the total produced amount of thermal energy. In 2006 there were 342.9 thousand residential buildings with 1018 thousand housing units, whereas the total area of the residential fund end 2007 exceeded 60.1 million m². The share of private sector in the residential segment has increased from 76% end 2000 to 87% end 2007.
FIFTH NATIONAL COMMUNICATION OF THE REPUBLIC OF LATVIA TO THE UNITED NATIONS FRAMEWORK CONVENTION ON CLIMATE CHANGE
10
Agriculture is an important sector of the national economy of Latvia not only in terms of production, but has a significant impact upon the quality of the surrounding environment, rural landscape and is also the lifestyle of a considerable share of the local proportion. Around 82.6 thousand or 7.4% from the total number of people employed in the country were working in the sector of agriculture in 2007. The importance of agriculture in the GDP is reducing each year, what can be explained with higher increase of the added value of other spheres of the national economy. In 2007 the added value of agriculture and hunting accounted for 1.8% of the GDP.
Forests and wood resources constitute the main national wealth. The total amount of growing stock in Latvia has been constantly increasing by amounting to 648 million m3 in 2007. The amount of wood processing remains constant already since 2002, i.e. 10 -12 million cubic meters timber is cut annually.
The strong economic growth and increasing domestic demand since 2004 has also accounted for increase of amount of produced, collected and recycled waste. The amount of waste in 2007 was 377.0 kg per capita. Since the capacity of waste processing and recycling plants is insufficient, the majority of waste created per annum (53% in average) is still deposited in dumpsites and landfills. Two landfills in the vicinity of Riga and Liepaja operate biogas collection facilities and the power units are used for production of electrical energy.
1.2. GHG Inventory Report
The GHG inventory report submitted to the UNFCCC Secretariat on 15 April 2009 contains information on Latvia’s direct (carbon dioxide (CO2); methane (CH4), nitrous oxide (N2O), hydrofluorocarbons (HFC), sulphur hexafluoride (SF6)) and indirect – nitric oxide (NOx), sulphur dioxide (SO2), non-methane volatile organic compounds (NMVOC), carbon oxide (CO) GHG emissions and also a summary on the estimated net emissions of carbon dioxide (CO2) for the time period 1990 – 2007 and also on the national GHG Inventory System and the National Emission Trading Registry (ETR).
The total GHG emission, excluding Land Use, Land-Use Change and Forestry (LULUCF) sector in the time period from 1990-2007 had reduced by 55%. The main GHG emission in 2007 excluding LULUCF sector was CO2 (8 608 thousand tons), causing 71.5% from the total emission, accordingly CH4 amounted to 15%, N2O – 13%, and fluorinated gas – 0.5% from total emissions. The energy sector constitutes 73% from the total GHG emissions, agriculture - 17%, waste management – 6.9%, manufacturing – 2.6% and use of solvents and other products – 0.5%.
The main source of carbon dioxide CO2 emission in 2007 was burning of fossil fuels – 96.5% (including, energy sector – 23.6%; manufacturing industry and construction – 14.8%; transport sector – 45.1%; and other sectors – household, agriculture, forestry etc - 16.5%). Other CO2 emission sources were manufacturing – 2.9%, use of solvents and other products – 0.6% and waste management (burning) – 0.01%.
The total CO2 removal exceeded the annual GHG emission – in 2007 the net CO2 removal from LULUCF sector was – 32018.9 Gg.
FIFTH NATIONAL COMMUNICATION OF THE REPUBLIC OF LATVIA TO THE UNITED NATIONS FRAMEWORK CONVENTION ON CLIMATE CHANGE
11
The second most important GHG is CH4 (both with/without LULUCF sector). In 2007 as compared to 1999 CH4 emission had gone down by around 49%. The main CH4 emission sources are solid household waste landfills, farm animal (gut) fermentation processes and natural gas pipeline system leakage.
In comparison to 1990 the total N2O emission (both with/without LULUCF sector) has reduced by circa 58%. The main source of N2O emissions was agricultural lands accounting for 88% (both with/without LULUCF) from N2O emissions of 2007. Less important N2O emission sources are transport, biomass burning, waste management (composting) and processing of wastewater.
In the time period from 1990 – 2000 the amount of indirect GHG emissions has reduced. The replacement of the main fuels has resulted in considerable reduction of SO2 emissions, because the currently prevailing types of fuel, such as natural gas and biomass practically contain no sulphur.
The energy sector was the main source of indirect GHG and SO2 in 2007 constituting accordingly 91.3% (NOx); 95.5% (CO); 57.3% (NMVOC); 92.6%(SO2) from the total emission of the respective gases. Transportation vehicles account for the highest NOx emission – 60% from the total NOx emissions, whereas the household sector created the largest CO emission (58.2%), and the energy sector - NMVOC (57.3%).
After publication of the „Fourth National Communication of the Republic of Latvia to the United Nations Framework Convention on Climate Change” improvements have been introduced to the GHG inventory that has also affected emission time series.
The GHG inventories submitted to the Convention Secretariat and meeting the requirements of the Kyoto Protocol are based upon the national system for evaluation of GHG. Establishment of the national system was completed in 2009. The main institutions involved in preparation of GHG inventory are outlined in figure 3.2.
The annual inventory on anthropogenic greenhouse gas emissions and removals is prepared by the Latvian Environment, Geology and Meteorology Agency (hereinafter – LEGMA) in cooperation with other institutions. The GHG Inventory is approved with the ministries of other sectors – including the Ministry of the Environment (MoE), in charge of approval of the GHG Inventory and filling thereof with the Convention Secretariat. The institutions involved in GHG Inventory have to comply with the quality control requirements set forth in the Intergovernmental Panel on Climate Change (IPCC) Guidelines for National Greenhouse Gas Inventories.
The Emission Trading Registry (ETR) of the Republic of Latvia is maintained and developed by the LEGMC (before 01.08.2009. the state agency of the Latvian Environment Geology and Meteorology Agency). The ETR operates in accordance with the requirements of EU laws regulating GHG emission trading and ensures implementation of the obligations stipulated in the Conference of the Parties serving as the meeting of the Parties to the Kyoto Protocol, decisions (13/CMP.1 and 15/CMP.1).
1.3. Policies and Measures Climate change mitigation policy has been among the priorities of Latvia of the recent years. The climate policy of Latvia is based upon the EU climate policy, the basic principles of which are set down in several political documents, i.e. „Climate Change Mitigation Program 2005 –
FIFTH NATIONAL COMMUNICATION OF THE REPUBLIC OF LATVIA TO THE UNITED NATIONS FRAMEWORK CONVENTION ON CLIMATE CHANGE
12
2010”, „Strategy for Use of Renewable Energy Sources for 2006-2010”, „The Climate and Energy Package”, „Environmental Policy Guidelines 2009-2015”.
In order Latvia would achieve the target of the Kyoto Protocol, it is necessary to implement the following climate change mitigation policy directions:
• Increase the share of renewable energy sources in the energy balance; • Increase efficient and rational use of energy sources; • Develop an environmentally friendly transport system; • Promote implementation of the best available techniques, environmentally friendly
technologies and cleaner production; • Facilitate implementation of nature–conserving and direct GHG emission reducing
agricultural practice; • Increase CO2 removals in forestry; • Establish a contemporary municipal waste management system, ensuring collection of
biogas from municipal waste landfills; • Participate in the EU emissions trading system and the flexible mechanisms of the
Kyoto Protocol; • Promote implementation of the environmental management system.
The fifth national communication provides more detailed analyses of the measures to be implemented for enforcement of the climate policy:
• Support for energy generation in small hydropower plants; • Support for wind power production; • Support for energy production in biogas plants from agricultural waste and waste
landfills; • Support for energy production in cogeneration stations from renewable energy sources; • Support for projects improving energy performance of buildings; • Defining of the maximally allowed emission limits for different air polluting substances
(emission „ceiling”); • Large-scale burning plant emission control; • Promotion of use of biofuel and other renewable energy sources in transport sector; • CO2 emission limits for personal vehicles; • Implementation of the Best Available Techniques (BAT) and cleaner production in
manufacturing industry; • Promotion of control of fluorinated greenhouse gases; • Development of environmentally friendly agriculture and promotion of Good
Agricultural Practice (GAP); • Implementation of the Directive 91/676/EEC concerning the protection of waters
against pollution caused by nitrates from agricultural sources; • Sustainable use of agricultural resources; • Increase of forest stand productivity; • Afforestation of unmanaged agricultural land; • Development of regional landfills according to the requirements of the Council Directive
1999/31/EC “On the landfill of waste”; • Processing of biologically degradable waste;
FIFTH NATIONAL COMMUNICATION OF THE REPUBLIC OF LATVIA TO THE UNITED NATIONS FRAMEWORK CONVENTION ON CLIMATE CHANGE
13
• Restoration of small municipal dumpsites not meeting environmental requirements. Latvia is implementing such cross-sectoral climate change mitigation policies and measures that affect several sectors of the national economy simultaneously. Such cross-sectoral policies include implementation of the EU greenhouse gas emission allowance trading scheme, participation in the flexible mechanisms of the Kyoto Protocol, control and reduction of polluting emissions.
For effective implementation of the Climate change mitigation policy and to reach the set GHG emission reduction targets Latvia applies a wide range of political (environmental impact assessment procedures, integrated permit regulations, prohibitions and standards) and economic (natural resources tax, excise tax for energy resources, users’ charges – tariffs) instruments. Increasing importance is paid to communication with general public – raising of public awareness and education on climate issues.
Latvia continues implementation of the policies and measures specified in the „Fourth National Communication of the Republic of Latvia to the United Nations Framework Convention on Climate Change”.
The analyses given in the Report confirm that no additional measures or cooperation with other countries is necessary to achieve the GHG emission level set in the Kyoto Protocol.
1.4. Joint Impact of Projections, Policies and Measures and the Mechanisms of the Kyoto Protocol
The projections were made end 2007 when the country was facing only the first signs of economic stagnation and are based upon long term macroeconomic projection scenario. Latvia has made projections for 2010, 2015 and 2020 by taking 2005 as the base year and by taking into consideration the inventory information for the time period from 1990-2005. Emission projections include „scenario with measures”. By taking into consideration that the planned policy and measures ensure fulfilment of Latvia’s international GHG emission reduction obligations imposed by the Kyoto Protocol (the total GHG emission after 2008 would not exceed 92% from the emission amount of 1990) the scenario "with additional measures” was not elaborated.
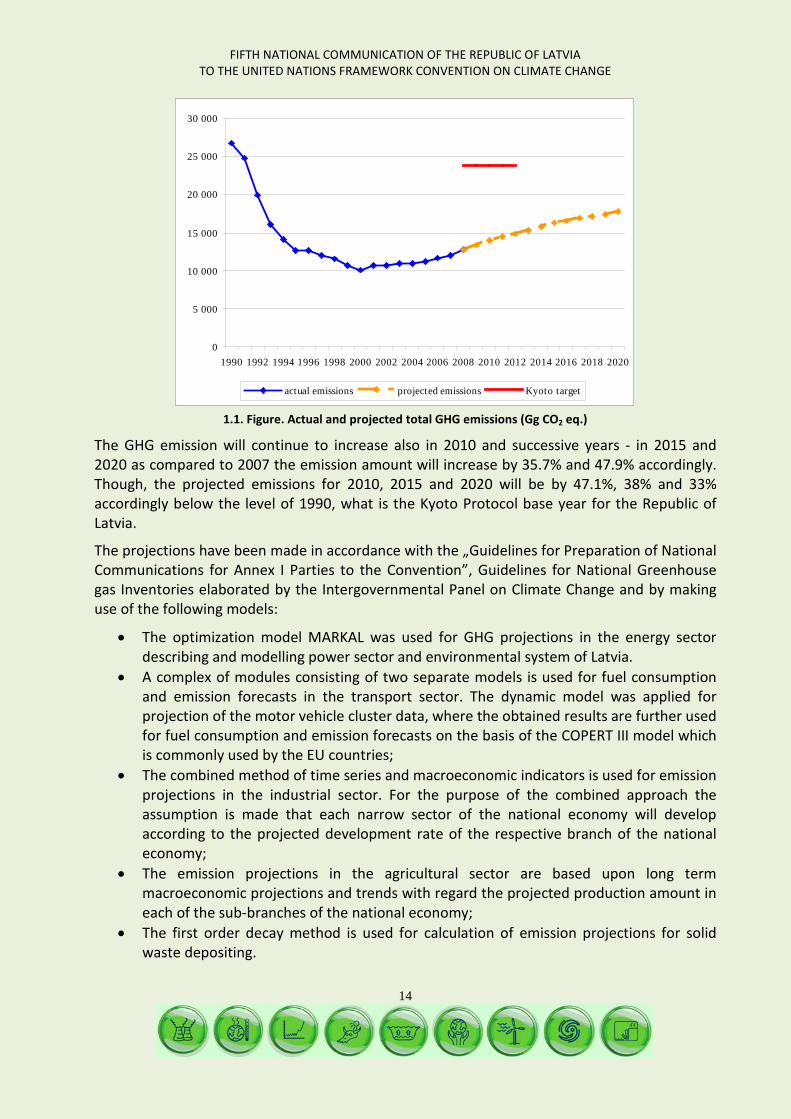
According to the projections, the total average GHG emission value in the time period from 2008-2012 will not exceed 53% from the level of 1990. (see figure 1.1).
FIFTH NATIONAL COMMUNICATION OF THE REPUBLIC OF LATVIA TO THE UNITED NATIONS FRAMEWORK CONVENTION ON CLIMATE CHANGE
14
0
5 000
10 000
15 000
20 000
25 000
30 000
1990 1992 1994 1996 1998 2000 2002 2004 2006 2008 2010 2012 2014 2016 2018 2020
actual emissions projected emissions Kyoto target
1.1. Figure. Actual and projected total GHG emissions (Gg CO2 eq.)
The GHG emission will continue to increase also in 2010 and successive years - in 2015 and 2020 as compared to 2007 the emission amount will increase by 35.7% and 47.9% accordingly. Though, the projected emissions for 2010, 2015 and 2020 will be by 47.1%, 38% and 33% accordingly below the level of 1990, what is the Kyoto Protocol base year for the Republic of Latvia.
The projections have been made in accordance with the „Guidelines for Preparation of National Communications for Annex I Parties to the Convention”, Guidelines for National Greenhouse gas Inventories elaborated by the Intergovernmental Panel on Climate Change and by making use of the following models:
• The optimization model MARKAL was used for GHG projections in the energy sector describing and modelling power sector and environmental system of Latvia.
• A complex of modules consisting of two separate models is used for fuel consumption and emission forecasts in the transport sector. The dynamic model was applied for projection of the motor vehicle cluster data, where the obtained results are further used for fuel consumption and emission forecasts on the basis of the COPERT III model which is commonly used by the EU countries;
• The combined method of time series and macroeconomic indicators is used for emission projections in the industrial sector. For the purpose of the combined approach the assumption is made that each narrow sector of the national economy will develop according to the projected development rate of the respective branch of the national economy;
• The emission projections in the agricultural sector are based upon long term macroeconomic projections and trends with regard the projected production amount in each of the sub-branches of the national economy;
• The first order decay method is used for calculation of emission projections for solid waste depositing.
FIFTH NATIONAL COMMUNICATION OF THE REPUBLIC OF LATVIA TO THE UNITED NATIONS FRAMEWORK CONVENTION ON CLIMATE CHANGE
15
According to the projections made Latvia will be able to fulfil the GHG emission reduction obligations laid down in the Kyoto Protocol, provided the climate change mitigation policy as outlined in paragraph 4 of this communication will be duly implemented.
1.5. Climate Change Impact, Vulnerability Assessment and Adaptation Measures
The prevailing air temperatures in the area of Latvia are determined by the received solar radiance, atmospheric circulation and the impact of the Baltic Sea, Riga Sea Gulf and the terrain. Essential is also the city environment impact. Within the last 50 years the air temperature and the total annual precipitation is inclined towards increase, what is proven by observations made by all main meteorological observation stations in Latvia. The average air temperature in Latvia over the last hundred of years has increased by 0.5ºC and around 1ºC – in Riga.
Climate changes affect the hydrological regime of over ground and subterranean waters. The increasing amount of precipitation accounts for increased river runoff, whereas the growing temperatures, on its turn, affect evaporation processes and therewith also facilitate decrease in river runoff and reduction in the water level in lakes. The minimum river flow in Latvia has increased, whereas the maximum – decreased. Overgrowing of rivers is a crucial issue.
Observations pertaining to the Baltic Sea and the Gulf of Riga evidence that freeze-up time and ice distribution are reducing. The saltiness of the water in the Baltic Sea and in the Gulf of Riga has reduced within the last 30 years, whereas the intensified costal erosion facilitated also by the technical reconstruction of the port aquatorium adversely affects the costal biotopes. Within the last 70 years storms have washed away 50 – 200 m from the costal zone thereby making the area of the Republic of Latvia by 1000 ha smaller. It is anticipated that the growing frequency and strength of storms and lack of ice will cause more explicit costal erosion in the future.
The projections pertaining to the eventual air temperature changes in Latvia evidence that the average annual temperature will increase by around 2.6°C - 4°C, whereas the annual amount of precipitation could increase by 4-11%. The runoff of rivers in winter will considerably increase and high water will be observed in spring much earlier. Within the successive 15 years Latvia will lose around 310 ha (20 ha per year in average) from the costal dune protection belt forests, the grey dune and meadows, built up residential areas, roads along the coast and other infrastructure objects. The erosion will affect more than 258 km or 51.5% from the total length of the costal line.
The institutions involved in the scientific research of issues pertaining to climate changes and environmental impact in Latvia are the University of Latvia, Faculty of Geography and Earth Sciences, Faculty of Biology, Institute of Biology, Latvian State Forestry Research Institute „Silava” and other researcher centres. The adaptation policy has been developed in close cooperation with scientists acting within the framework of the national research program „Climate Change Impact on Water Environment in Latvia”.
What concerns elaboration of the adaptation policy on international level, Latvia has taken part in the expert working groups of the European Commission and EU Presidency likewise in the

FIFTH NATIONAL COMMUNICATION OF THE REPUBLIC OF LATVIA TO THE UNITED NATIONS FRAMEWORK CONVENTION ON CLIMATE CHANGE
16
European Environment Agency Member State expert working group on climate change impact, threats and adaptation. Latvia has elaborated and submitted to the Convention Secretariat information concerning Nairobi work program on impacts, vulnerability and adaptation and has elaborated a procedure for participation in the work of the European Space Agency to, inter alia, promote cooperation in research of climate system and prevention of natural disasters.
1.6. Research and Systematic Observations
As from 2005 the scientific priorities of Latvia are defined and from 2007 the scientific priorities of Latvia till 2010 have been completely implemented in the funding mechanisms – state research programs. The Cabinet of Ministers has approved nine priority scientific directions for 2006 – 2009 that also include research in the sphere of climate changes.
National scientific programmes covering climate changes (application of alternative energy sources and new technologies, increase of energy efficiency and technological solutions) involve scientific and research institutes, universities, ministries and subordinated institutions. Research under particular projects is also carried out by environmental consultancy companies and non-governmental institutions.
As from 2005 the funding allocated to research of climate changes from the state budgetary resources has considerably increased. Funding for research is also provided by the Latvian Environmental Protection Fund, National Investment Programme and international programmes and projects. Besides, funding in the form of loans for various projects is allocated also by the private sector, including commercial banks of Latvia.
Latvia is characterized by good climate research traditions and a history of meteorological observations of more than 200 years. The international cooperation in the sphere of meteorology is continuing to expand (participation in such organizations as EUMETSAT, EUMETNET, ECMWF, ECOMET).
Hydro meteorological information and data exchange with the respective services of the neighbouring countries Lithuania, Belarus and Russia is organized on regular basis and so is the cooperation under international programs and projects.
1.7. Education, Training and Raising of Public Awareness
The long-term policy of Latvia on development of a knowledge - based economy anticipates increase of the number of students in engineering, environmental sciences and medicine study programmes. Redistribution of state financed budget study places among the directions of education has taken place. The funding of EU structural funds is attracted more to the engineering and natural sciences education programs. The Environmental Protection Fund is rendering material financial support for education, training and public awareness raising events on annual basis.
In the circumstances of economic crisis and insufficient funding one of the eventual financial sources could be the proceeds from sale of GHG emission units, including, emission quota auctions. The amount of such income for Latvia could reach 45 million euro a year, to be used for implementation of the national climate change policy and measures.
FIFTH NATIONAL COMMUNICATION OF THE REPUBLIC OF LATVIA TO THE UNITED NATIONS FRAMEWORK CONVENTION ON CLIMATE CHANGE
17
The Latvian Council of Environmental Science and Education (CESE) was established in May 2004, with the objective to coordinate and promote cooperation among institutions in charge of development of environmental science and education. Climate change and technology based knowledge can be obtained in several establishments of higher education – the University of Latvia (LU), Riga Technical University (RTU) and Latvia University of Agriculture (LLU). The annual scientific conferences organized by LU and RTU are very popular.
Public and non-governmental organizations also take active involvement in solution of climate change based issues in Latvia, to name the most active ones – the Baltic Environmental Forum, Environmental Protection Club, WWF Latvia Branch „Zaļā brīvība”. The Climate Change Financial Instrument Consultative Council and the Co-operative Council for Environmental Technology accordingly promote economic and environmental protection efficiency of disposition of funding with regard implementation of climate change financial instrument and also information exchange and cooperation among professional associations operating in the sphere of climate technologies.
Annual international conferences on various topics are organized on regular basis for raising of public awareness on environmental science and education, e.g. „Education and Science for Mitigation of Climate Changes”, “Save energy – help the climate!”, „Use of Alternative Energy Sources, the Model and Action Plan for Increase of Energy Efficiency”, „Education for Changes: from Theory to Practice” etc. The Ministry of Economics has supported publication of several books on biofuel (bioethanol and biogas) application options. An informative book for general public "Climate Changes and Global Warming" has been published with the support of the national research program „Climate Change Impact on Water Environment in Latvia”.
In the time period from 2005-2007 Latvia participated in the Baltic sea region project within the framework of the program INTERREG IIIB co-financed by the EU „Development of Policies and Adaptation Strategies to Climate Change in the Baltic Region” and in 2009 participation in the international project "Baltic Climate Change: Impacts, Costs and Adaptation in the Baltic Sea Region" was launched, which is a continuation project of the afore mentioned INTERREG IIIB program.
Starting with 2007 Latvia participates in the project „Climate Change Research Coordination for a Larger Europe” or CIRCLE ERA-NET in the Central and Eastern European States group promoting exchange of scientific conclusions and political solutions among countries.
FIFTH NATIONAL COMMUNICATION OF THE REPUBLIC OF LATVIA TO THE UNITED NATIONS FRAMEWORK CONVENTION ON CLIMATE CHANGE
18
2. GENERAL INFORMATION ABOUT THE REPUBLIC OF LATVIA
FIFTH NATIONAL COMMUNICATION OF THE REPUBLIC OF LATVIA TO THE UNITED NATIONS FRAMEWORK CONVENTION ON CLIMATE CHANGE
19
2.1. Geographical Profile and Climate
Latvia is situated on the edge of the Eastern European Plain near the Baltic Sea between 55o40' and 58o05' Northern latitude and between 20o58' and 28o14' Eastern longitude. The total length of the border of Latvia amounts to 1368 km on land and 498 km along the coast. Latvia borders with Estonia in the North, with Lithuania and Belarus - in the South and with Russia - in the East.
The territory covers an area of 64 559 km2 in total. Its length in the North – South direction is 210 km, and the width in the West – East direction – 450 km. Latvia is a typical lowland country and its terrain is characterized by flat, low areas and hilly elevations. The average height above sea level is 87 m and the highest peak is Gaizinkalns (311.6 m above sea level)1
The territory of Latvia is located in the mild climate zone. Under the impact of the climate of Latvia, its geographical position and the plain terrain of the area allows for inflow of different type of air masses. Maritime climate is prevailing in Latvia – small mean temperature range between January and July, increased precipitation and inconsistent weather conditions. Cyclones account for high nebulosity - in average 160 - 180 cloudy days a year.
.
Average temperature fluctuations in the territory of the country are rather small. The highest annual average temperature is costal areas (+6.5°C), and in the Eastern part of Latvia +5°C, whereas the lowest – in Vidzeme highland (+4.1°C). The average temperature of the coldest month - January in the costal areas is -3°C, in the middle country -5°C, whereas in the east -7°C. The average temperature of the warmest month of the year – July ranges from +16°C in costal areas to +17.5°C in the eastern part of the country. The four years of 2004 – 2007 have been warmer than average (5.7oC) and have promoted increase of the average annual temperature in the country. Till 2003 the average air temperature in Latvia in the previous 100 years had increased by 1.1oC, whereas end 2007 the increase was already close to 1.3oC. The total precipitation in 2004 – 2007 complied with the set norms (658 mm), the average wind speed was 2.9-3.2 m/s, what is below the set norm.2
1 CSB, “Statistical Yearbook of Latvia, 2007”
2 „National Report on Environment”, LEGMA, 2009. http://www.meteo.lv/public/27240.html
FIFTH NATIONAL COMMUNICATION OF THE REPUBLIC OF LATVIA TO THE UNITED NATIONS FRAMEWORK CONVENTION ON CLIMATE CHANGE
20
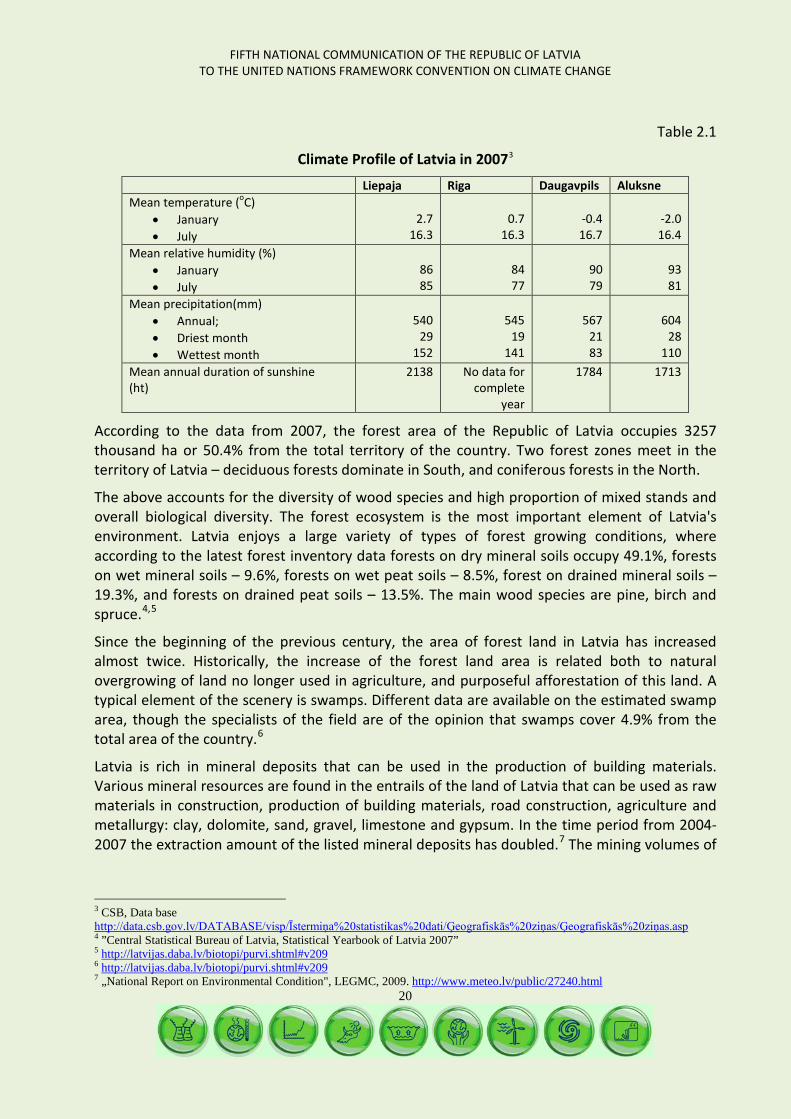
Table 2.1
Climate Profile of Latvia in 20073
Liepaja Riga Daugavpils Aluksne Mean temperature (oC)
• January • July
2.7
16.3
0.7
16.3
-0.4 16.7
-2.0 16.4
Mean relative humidity (%) • January • July
86 85
84 77
90 79
93 81
Mean precipitation(mm) • Annual; • Driest month • Wettest month
540
29 152
545
19 141
567
21 83
604
28 110
Mean annual duration of sunshine (ht)
2138 No data for complete
year
1784 1713
According to the data from 2007, the forest area of the Republic of Latvia occupies 3257 thousand ha or 50.4% from the total territory of the country. Two forest zones meet in the territory of Latvia – deciduous forests dominate in South, and coniferous forests in the North.
The above accounts for the diversity of wood species and high proportion of mixed stands and overall biological diversity. The forest ecosystem is the most important element of Latvia's environment. Latvia enjoys a large variety of types of forest growing conditions, where according to the latest forest inventory data forests on dry mineral soils occupy 49.1%, forests on wet mineral soils – 9.6%, forests on wet peat soils – 8.5%, forest on drained mineral soils – 19.3%, and forests on drained peat soils – 13.5%. The main wood species are pine, birch and spruce.4,5
Since the beginning of the previous century, the area of forest land in Latvia has increased almost twice. Historically, the increase of the forest land area is related both to natural overgrowing of land no longer used in agriculture, and purposeful afforestation of this land. A typical element of the scenery is swamps. Different data are available on the estimated swamp area, though the specialists of the field are of the opinion that swamps cover 4.9% from the total area of the country.
6
Latvia is rich in mineral deposits that can be used in the production of building materials. Various mineral resources are found in the entrails of the land of Latvia that can be used as raw materials in construction, production of building materials, road construction, agriculture and metallurgy: clay, dolomite, sand, gravel, limestone and gypsum. In the time period from 2004-2007 the extraction amount of the listed mineral deposits has doubled.
7
3 CSB, Data base
The mining volumes of
http://data.csb.gov.lv/DATABASE/visp/Īstermiņa%20statistikas%20dati/Ģeografiskās%20ziņas/Ģeografiskās%20ziņas.asp 4 ”Central Statistical Bureau of Latvia, Statistical Yearbook of Latvia 2007” 5 http://latvijas.daba.lv/biotopi/purvi.shtml#v209 6 http://latvijas.daba.lv/biotopi/purvi.shtml#v209 7 „National Report on Environmental Condition", LEGMC, 2009. http://www.meteo.lv/public/27240.html
FIFTH NATIONAL COMMUNICATION OF THE REPUBLIC OF LATVIA TO THE UNITED NATIONS FRAMEWORK CONVENTION ON CLIMATE CHANGE
21
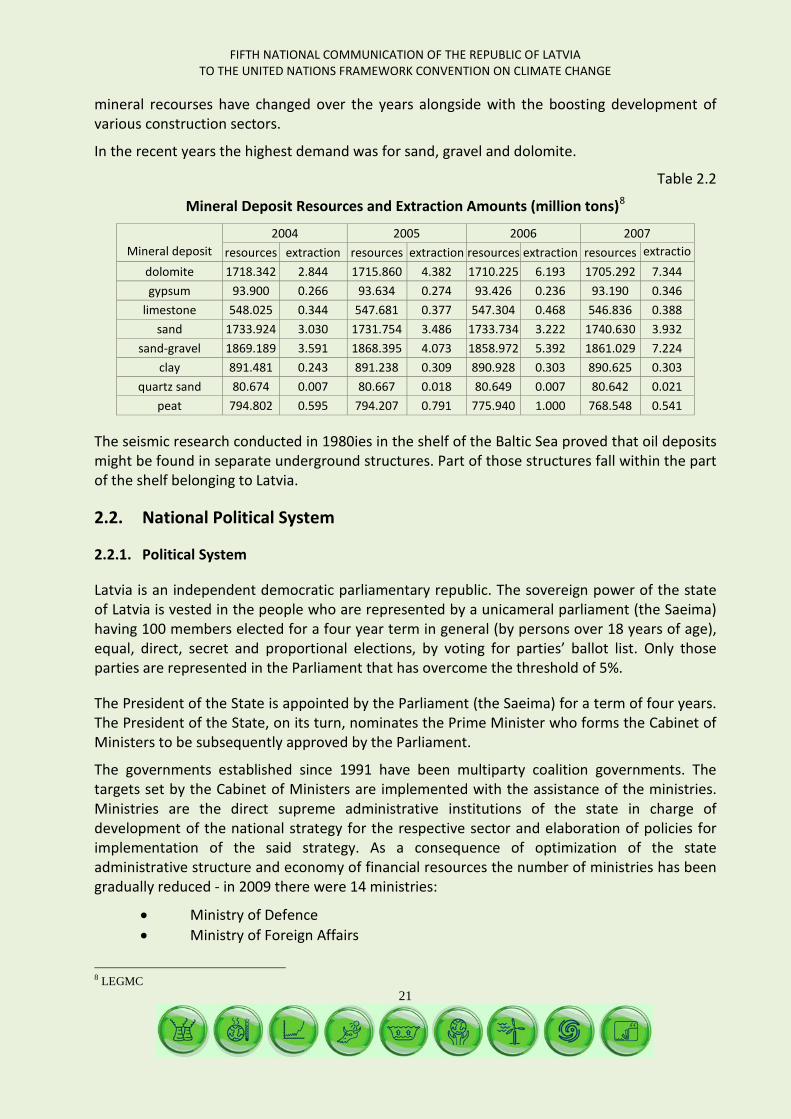
mineral recourses have changed over the years alongside with the boosting development of various construction sectors.
In the recent years the highest demand was for sand, gravel and dolomite.
Table 2.2
Mineral Deposit Resources and Extraction Amounts (million tons)8
Mineral deposit 2004 2005 2006 2007
resources extraction resources extraction resources extraction resources extractio dolomite 1718.342 2.844 1715.860 4.382 1710.225 6.193 1705.292 7.344
gypsum 93.900 0.266 93.634 0.274 93.426 0.236 93.190 0.346 limestone 548.025 0.344 547.681 0.377 547.304 0.468 546.836 0.388
sand 1733.924 3.030 1731.754 3.486 1733.734 3.222 1740.630 3.932 sand-gravel 1869.189 3.591 1868.395 4.073 1858.972 5.392 1861.029 7.224
clay 891.481 0.243 891.238 0.309 890.928 0.303 890.625 0.303 quartz sand 80.674 0.007 80.667 0.018 80.649 0.007 80.642 0.021
peat 794.802 0.595 794.207 0.791 775.940 1.000 768.548 0.541
The seismic research conducted in 1980ies in the shelf of the Baltic Sea proved that oil deposits might be found in separate underground structures. Part of those structures fall within the part of the shelf belonging to Latvia.
2.2. National Political System
2.2.1. Political System
Latvia is an independent democratic parliamentary republic. The sovereign power of the state of Latvia is vested in the people who are represented by a unicameral parliament (the Saeima) having 100 members elected for a four year term in general (by persons over 18 years of age), equal, direct, secret and proportional elections, by voting for parties’ ballot list. Only those parties are represented in the Parliament that has overcome the threshold of 5%.
The President of the State is appointed by the Parliament (the Saeima) for a term of four years. The President of the State, on its turn, nominates the Prime Minister who forms the Cabinet of Ministers to be subsequently approved by the Parliament.
The governments established since 1991 have been multiparty coalition governments. The targets set by the Cabinet of Ministers are implemented with the assistance of the ministries. Ministries are the direct supreme administrative institutions of the state in charge of development of the national strategy for the respective sector and elaboration of policies for implementation of the said strategy. As a consequence of optimization of the state administrative structure and economy of financial resources the number of ministries has been gradually reduced - in 2009 there were 14 ministries:
• Ministry of Defence • Ministry of Foreign Affairs
8 LEGMC
FIFTH NATIONAL COMMUNICATION OF THE REPUBLIC OF LATVIA TO THE UNITED NATIONS FRAMEWORK CONVENTION ON CLIMATE CHANGE
22
• Ministry of Economics; • Ministry of Finance; • Ministry of Internal Affairs; • Ministry of Education and Science; • Ministry of Culture; • Ministry of Welfare; • Ministry of Regional Development and Local Government; • Ministry of Transport; • Ministry of Justice; • Ministry of Health; • Ministry of Environment • Ministry of Agriculture.
The positions of three special ministers who were part of the Cabinet of Ministers were liquidated, i.e. the special assignment minister for electronic government affairs, the minister for society integration affairs and the special assignment minister for administration of EU funds.
2.2.2. Administrative – Territorial Division
The Constitution of the Republic of Latvia (Satversme) specifies that the territory of the state of Latvia, within the borders established by international agreements, consists of Vidzeme, Latgale, Kurzeme and Zemgale. However, such division is not of administrative-territorial significance. According to the administrative – territorial structure, till 2009 there were two types of municipalities in Latvia:
• Municipalities of local level (cities, districts and counties);
• Regional municipalities.
There are elected municipal councils (municipalities) in cities, districts and counties, whereas the regional municipalities consist of representatives appointed by the local municipalities. Both levels of municipalities act independently within their area of responsibility as stated in the law.
In 2004 there were 540 national level municipalities, including 444 counties, 26 districts, 53 cities and 7 cities of national importance fulfilling also the functions of a district.9 Local municipalities were joined in 26 regions, i.e. for a long period of time there were a high number of economically and administratively weak municipalities not able to ensure fulfilment of all municipal functions.10,11
9 Cabinet of Ministers Ordinance No.271 from 28 April 2004 “ On the Statistical Regions of the Republic of Latvia and the Encompassed Administrative Units ”,
http://www.likumi.lv/doc.php?id=88074&from=off 10 Cabinet of Ministers decree No.198 from 2 April 2004 „Regional Policy Guidelines” http://polsis.mk.gov.lv/view.do?id=2587 11 “National Development Plan of Latvia 2007-2013”, Ministry of Regional Development and Local Government, 2006, http://www.raplm.gov.lv/pub/print.php?id=94
FIFTH NATIONAL COMMUNICATION OF THE REPUBLIC OF LATVIA TO THE UNITED NATIONS FRAMEWORK CONVENTION ON CLIMATE CHANGE
23
The necessary legislative framework for establishment of larger and economically stronger administrative and territorial units – municipalities (in Latvian - novads) was elaborated and approved for implementation of the district establishment process.
The scope of the administratively territorial reform based upon the polycentric development approach was to establish local municipalities able to develop economically, by ensuring living environment attractive for the local population, likewise qualitative and multiform services.
Due to different reasons the regional reform lasted longer than initially intended and was completed only in 2009, when on 1 of July the new administrative division came into force, Containing 9 national importance cities and 109 municipalities (in Latvian - novads).12
2.3. Social Development
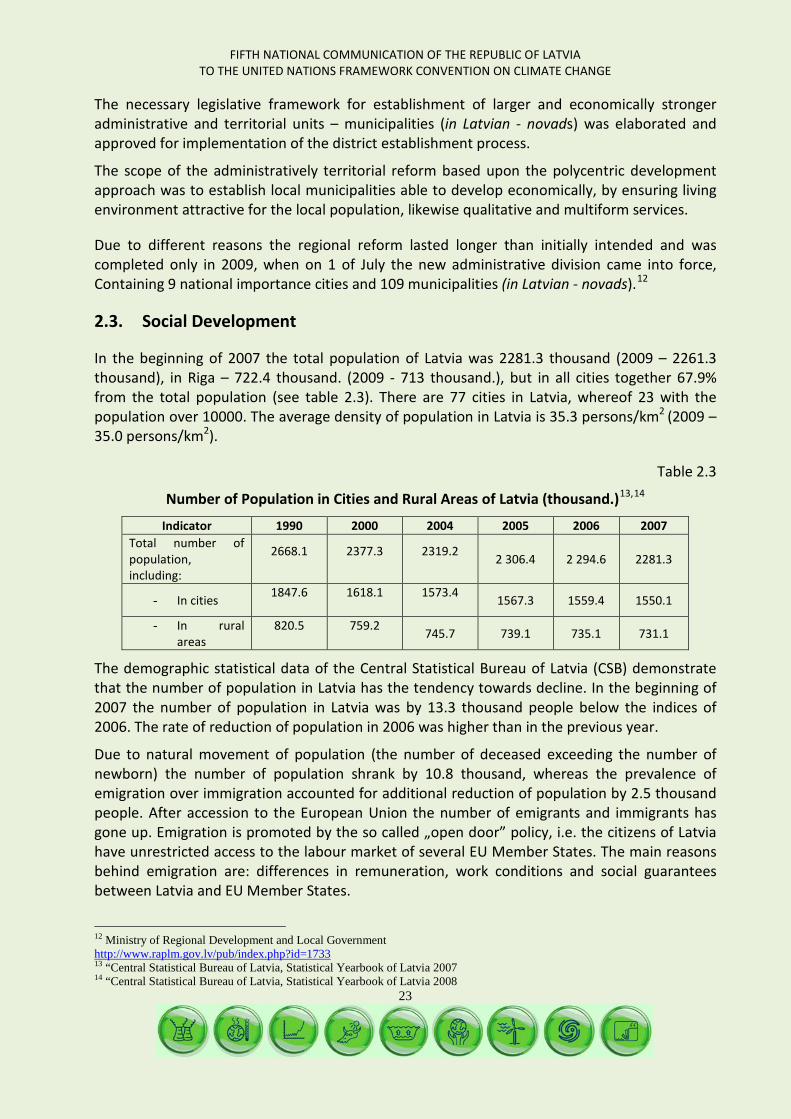
In the beginning of 2007 the total population of Latvia was 2281.3 thousand (2009 – 2261.3 thousand), in Riga – 722.4 thousand. (2009 - 713 thousand.), but in all cities together 67.9% from the total population (see table 2.3). There are 77 cities in Latvia, whereof 23 with the population over 10000. The average density of population in Latvia is 35.3 persons/km2 (2009 – 35.0 persons/km2).
Table 2.3
Number of Population in Cities and Rural Areas of Latvia (thousand.)13,14
Indicator
1990 2000 2004 2005 2006 2007 Total number of population, including:
2668.1
2377.3
2319.2 2 306.4 2 294.6 2281.3
- In cities 1847.6
1618.1
1573.4 1567.3 1559.4 1550.1
- In rural areas
820.5
759.2 745.7 739.1 735.1 731.1
The demographic statistical data of the Central Statistical Bureau of Latvia (CSB) demonstrate that the number of population in Latvia has the tendency towards decline. In the beginning of 2007 the number of population in Latvia was by 13.3 thousand people below the indices of 2006. The rate of reduction of population in 2006 was higher than in the previous year.
Due to natural movement of population (the number of deceased exceeding the number of newborn) the number of population shrank by 10.8 thousand, whereas the prevalence of emigration over immigration accounted for additional reduction of population by 2.5 thousand people. After accession to the European Union the number of emigrants and immigrants has gone up. Emigration is promoted by the so called „open door” policy, i.e. the citizens of Latvia have unrestricted access to the labour market of several EU Member States. The main reasons behind emigration are: differences in remuneration, work conditions and social guarantees between Latvia and EU Member States.
12 Ministry of Regional Development and Local Government http://www.raplm.gov.lv/pub/index.php?id=1733 13 “Central Statistical Bureau of Latvia, Statistical Yearbook of Latvia 2007 14 “Central Statistical Bureau of Latvia, Statistical Yearbook of Latvia 2008
FIFTH NATIONAL COMMUNICATION OF THE REPUBLIC OF LATVIA TO THE UNITED NATIONS FRAMEWORK CONVENTION ON CLIMATE CHANGE
24
The number of newborn in 2006 was 22.3 thousand, i.e. by 767 newborn more than in 2005. The level of mortality calculated per 1000 people has increased by 4.2%. The number of newborn – 9.7 as to 1000 people was the highest indicator of the previous 13 years. Though, the total fertility rate is insufficient for generation change, the average lifespan is increasing and the level of population aging is high what results in excessive work load of the working-age population to sustain the pension-age population.
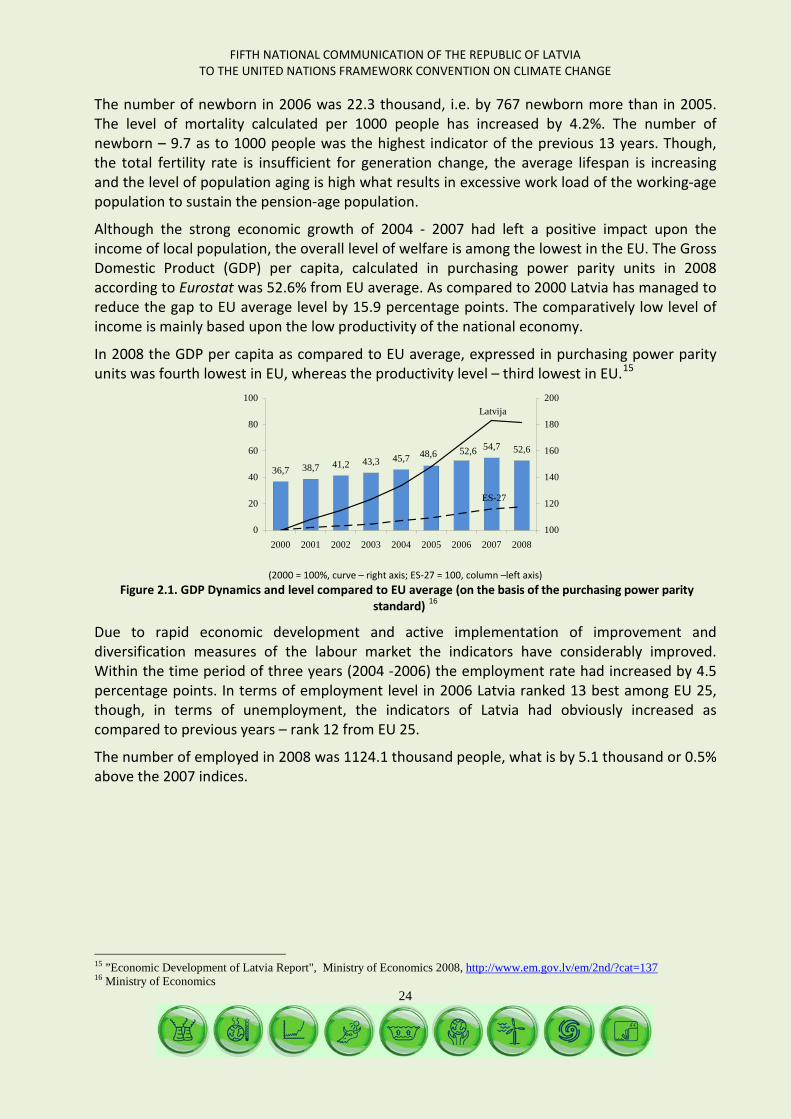
Although the strong economic growth of 2004 - 2007 had left a positive impact upon the income of local population, the overall level of welfare is among the lowest in the EU. The Gross Domestic Product (GDP) per capita, calculated in purchasing power parity units in 2008 according to Eurostat was 52.6% from EU average. As compared to 2000 Latvia has managed to reduce the gap to EU average level by 15.9 percentage points. The comparatively low level of income is mainly based upon the low productivity of the national economy.
In 2008 the GDP per capita as compared to EU average, expressed in purchasing power parity units was fourth lowest in EU, whereas the productivity level – third lowest in EU.15
36,7 38,7 41,2 43,3 45,754,7 52,648,6 52,6
ES-27
Latvija
0
20
40
60
80
100
2000 2001 2002 2003 2004 2005 2006 2007 2008100
120
140
160
180
200
(2000 = 100%, curve – right axis; ES-27 = 100, column –left axis)
Figure 2.1. GDP Dynamics and level compared to EU average (on the basis of the purchasing power parity standard) 16
Due to rapid economic development and active implementation of improvement and diversification measures of the labour market the indicators have considerably improved. Within the time period of three years (2004 -2006) the employment rate had increased by 4.5 percentage points. In terms of employment level in 2006 Latvia ranked 13 best among EU 25, though, in terms of unemployment, the indicators of Latvia had obviously increased as compared to previous years – rank 12 from EU 25.
The number of employed in 2008 was 1124.1 thousand people, what is by 5.1 thousand or 0.5% above the 2007 indices.
15 ”Economic Development of Latvia Report", Ministry of Economics 2008, http://www.em.gov.lv/em/2nd/?cat=137 16 Ministry of Economics
FIFTH NATIONAL COMMUNICATION OF THE REPUBLIC OF LATVIA TO THE UNITED NATIONS FRAMEWORK CONVENTION ON CLIMATE CHANGE
25
45
55
65
75
2000 2001 2002 2003 2004 2005 2006 2007n
WomenMenTotal
0
3
6
9
12
15
2000 2001 2002 2003 2004 2005 2006 2007n
WomenMenTotal
Employment Unemployment
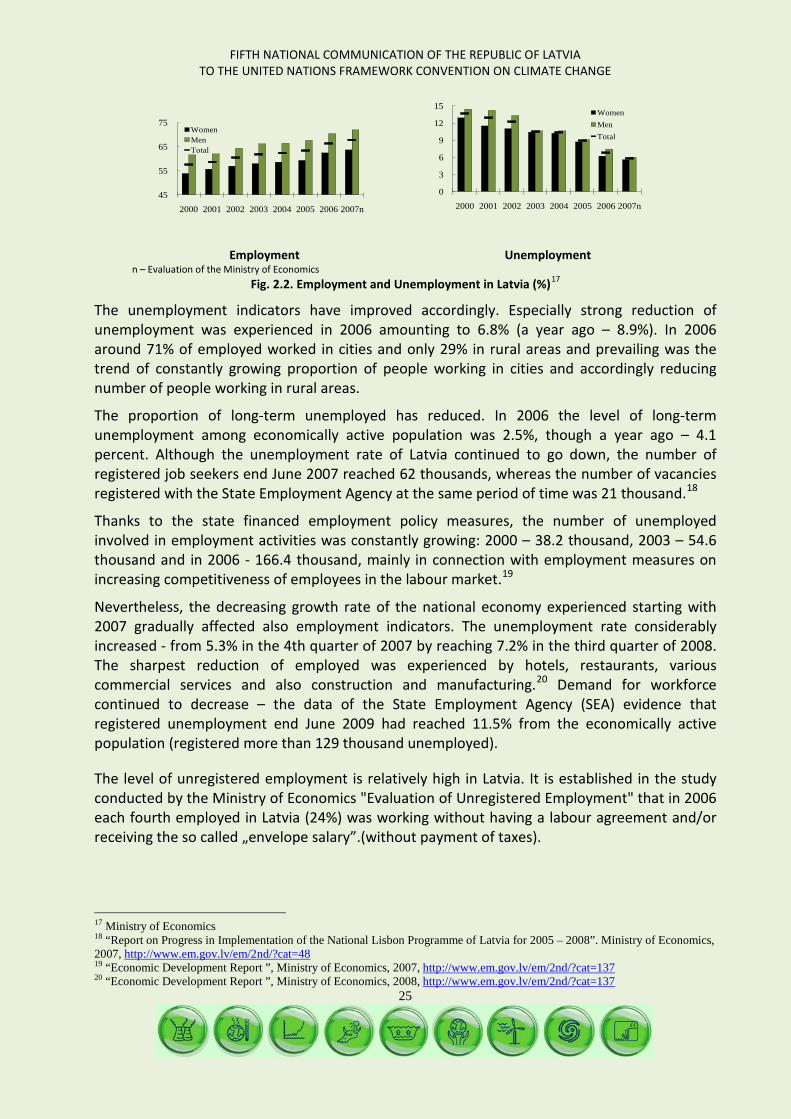
n – Evaluation of the Ministry of Economics Fig. 2.2. Employment and Unemployment in Latvia (%)17
The unemployment indicators have improved accordingly. Especially strong reduction of unemployment was experienced in 2006 amounting to 6.8% (a year ago – 8.9%). In 2006 around 71% of employed worked in cities and only 29% in rural areas and prevailing was the trend of constantly growing proportion of people working in cities and accordingly reducing number of people working in rural areas.
The proportion of long-term unemployed has reduced. In 2006 the level of long-term unemployment among economically active population was 2.5%, though a year ago – 4.1 percent. Although the unemployment rate of Latvia continued to go down, the number of registered job seekers end June 2007 reached 62 thousands, whereas the number of vacancies registered with the State Employment Agency at the same period of time was 21 thousand.18
Thanks to the state financed employment policy measures, the number of unemployed involved in employment activities was constantly growing: 2000 – 38.2 thousand, 2003 – 54.6 thousand and in 2006 - 166.4 thousand, mainly in connection with employment measures on increasing competitiveness of employees in the labour market.
19
Nevertheless, the decreasing growth rate of the national economy experienced starting with 2007 gradually affected also employment indicators. The unemployment rate considerably increased - from 5.3% in the 4th quarter of 2007 by reaching 7.2% in the third quarter of 2008. The sharpest reduction of employed was experienced by hotels, restaurants, various commercial services and also construction and manufacturing.
20
The level of unregistered employment is relatively high in Latvia. It is established in the study conducted by the Ministry of Economics "Evaluation of Unregistered Employment" that in 2006 each fourth employed in Latvia (24%) was working without having a labour agreement and/or receiving the so called „envelope salary”.(without payment of taxes).
Demand for workforce continued to decrease – the data of the State Employment Agency (SEA) evidence that registered unemployment end June 2009 had reached 11.5% from the economically active population (registered more than 129 thousand unemployed).
17 Ministry of Economics 18 “Report on Progress in Implementation of the National Lisbon Programme of Latvia for 2005 – 2008”. Ministry of Economics, 2007, http://www.em.gov.lv/em/2nd/?cat=48 19 “Economic Development Report ”, Ministry of Economics, 2007, http://www.em.gov.lv/em/2nd/?cat=137 20 “Economic Development Report ”, Ministry of Economics, 2008, http://www.em.gov.lv/em/2nd/?cat=137
FIFTH NATIONAL COMMUNICATION OF THE REPUBLIC OF LATVIA TO THE UNITED NATIONS FRAMEWORK CONVENTION ON CLIMATE CHANGE
26
2.4. Economic Development
2.4.1. General Information
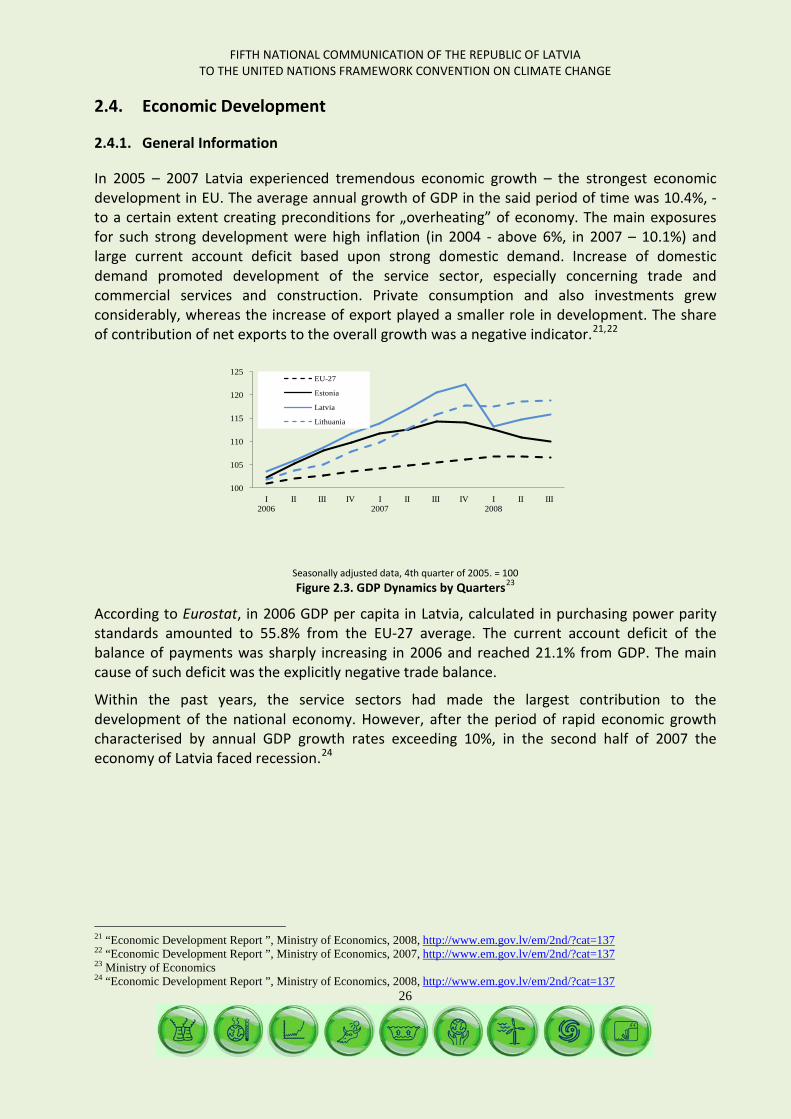
In 2005 – 2007 Latvia experienced tremendous economic growth – the strongest economic development in EU. The average annual growth of GDP in the said period of time was 10.4%, - to a certain extent creating preconditions for „overheating” of economy. The main exposures for such strong development were high inflation (in 2004 - above 6%, in 2007 – 10.1%) and large current account deficit based upon strong domestic demand. Increase of domestic demand promoted development of the service sector, especially concerning trade and commercial services and construction. Private consumption and also investments grew considerably, whereas the increase of export played a smaller role in development. The share of contribution of net exports to the overall growth was a negative indicator.21,22
100
105
110
115
120
125
I2006
II III IV I2007
II III IV I2008
II III
EU-27
Estonia
Latvia
Lithuania
Seasonally adjusted data, 4th quarter of 2005. = 100 Figure 2.3. GDP Dynamics by Quarters23
According to Eurostat, in 2006 GDP per capita in Latvia, calculated in purchasing power parity standards amounted to 55.8% from the EU-27 average. The current account deficit of the balance of payments was sharply increasing in 2006 and reached 21.1% from GDP. The main cause of such deficit was the explicitly negative trade balance.
Within the past years, the service sectors had made the largest contribution to the development of the national economy. However, after the period of rapid economic growth characterised by annual GDP growth rates exceeding 10%, in the second half of 2007 the economy of Latvia faced recession.24
21 “Economic Development Report ”, Ministry of Economics, 2008,
http://www.em.gov.lv/em/2nd/?cat=137 22 “Economic Development Report ”, Ministry of Economics, 2007, http://www.em.gov.lv/em/2nd/?cat=137 23 Ministry of Economics 24 “Economic Development Report ”, Ministry of Economics, 2008, http://www.em.gov.lv/em/2nd/?cat=137
FIFTH NATIONAL COMMUNICATION OF THE REPUBLIC OF LATVIA TO THE UNITED NATIONS FRAMEWORK CONVENTION ON CLIMATE CHANGE
27
-6
-3
0
3
6
9
12
I2004
II III IV I2005
II III IV I2006
II III IV I2007
II III IV I2008
II III
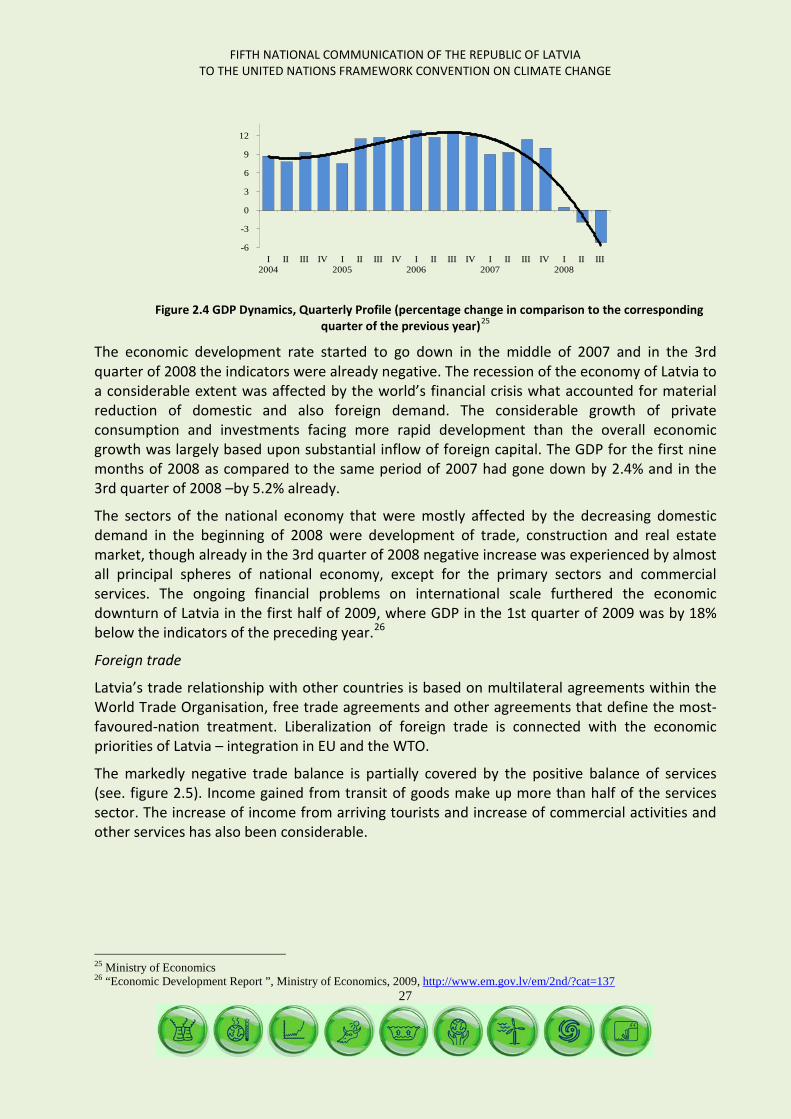
Figure 2.4 GDP Dynamics, Quarterly Profile (percentage change in comparison to the corresponding
quarter of the previous year)25
The economic development rate started to go down in the middle of 2007 and in the 3rd quarter of 2008 the indicators were already negative. The recession of the economy of Latvia to a considerable extent was affected by the world’s financial crisis what accounted for material reduction of domestic and also foreign demand. The considerable growth of private consumption and investments facing more rapid development than the overall economic growth was largely based upon substantial inflow of foreign capital. The GDP for the first nine months of 2008 as compared to the same period of 2007 had gone down by 2.4% and in the 3rd quarter of 2008 –by 5.2% already.
The sectors of the national economy that were mostly affected by the decreasing domestic demand in the beginning of 2008 were development of trade, construction and real estate market, though already in the 3rd quarter of 2008 negative increase was experienced by almost all principal spheres of national economy, except for the primary sectors and commercial services. The ongoing financial problems on international scale furthered the economic downturn of Latvia in the first half of 2009, where GDP in the 1st quarter of 2009 was by 18% below the indicators of the preceding year.26
Foreign trade
Latvia’s trade relationship with other countries is based on multilateral agreements within the World Trade Organisation, free trade agreements and other agreements that define the most-favoured-nation treatment. Liberalization of foreign trade is connected with the economic priorities of Latvia – integration in EU and the WTO.
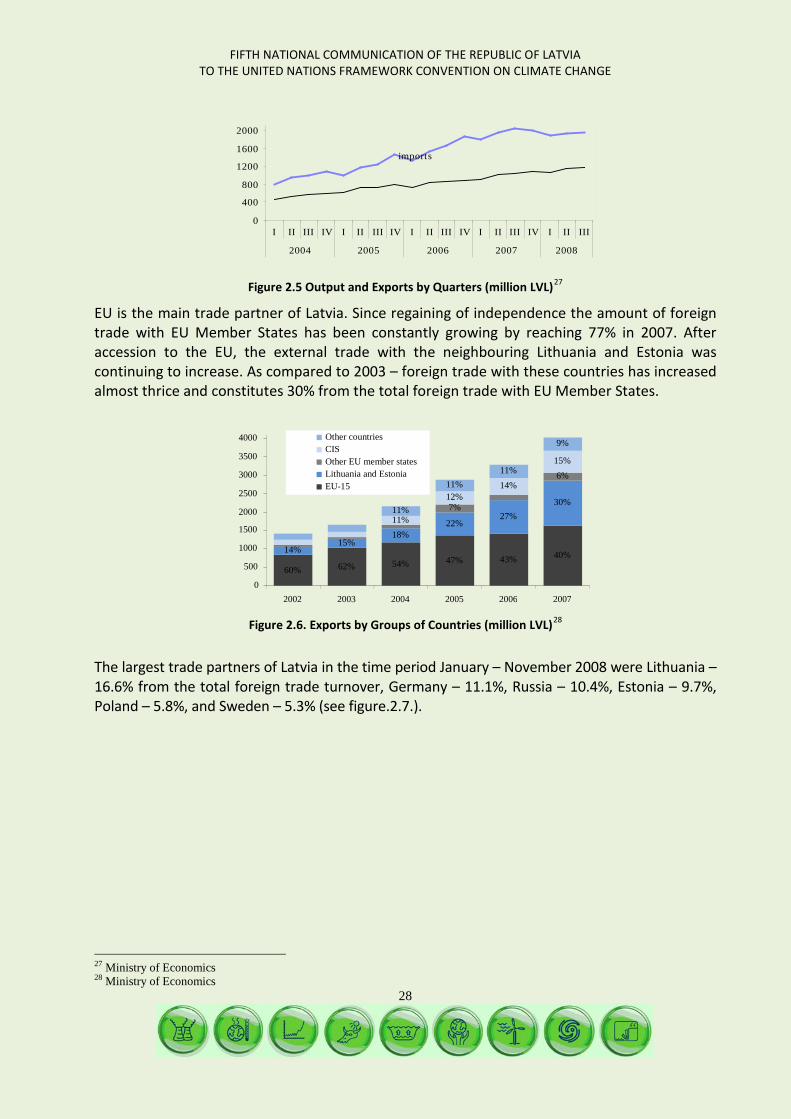
The markedly negative trade balance is partially covered by the positive balance of services (see. figure 2.5). Income gained from transit of goods make up more than half of the services sector. The increase of income from arriving tourists and increase of commercial activities and other services has also been considerable.
25 Ministry of Economics 26 “Economic Development Report ”, Ministry of Economics, 2009, http://www.em.gov.lv/em/2nd/?cat=137
FIFTH NATIONAL COMMUNICATION OF THE REPUBLIC OF LATVIA TO THE UNITED NATIONS FRAMEWORK CONVENTION ON CLIMATE CHANGE
28
0
400
800
1200
1600
2000
I II III IV I II III IV I II III IV I II III IV I II III
2004 2005 2006 2007 2008
imports
Figure 2.5 Output and Exports by Quarters (million LVL)27
EU is the main trade partner of Latvia. Since regaining of independence the amount of foreign trade with EU Member States has been constantly growing by reaching 77% in 2007. After accession to the EU, the external trade with the neighbouring Lithuania and Estonia was continuing to increase. As compared to 2003 – foreign trade with these countries has increased almost thrice and constitutes 30% from the total foreign trade with EU Member States.
Figure 2.6. Exports by Groups of Countries (million LVL)28
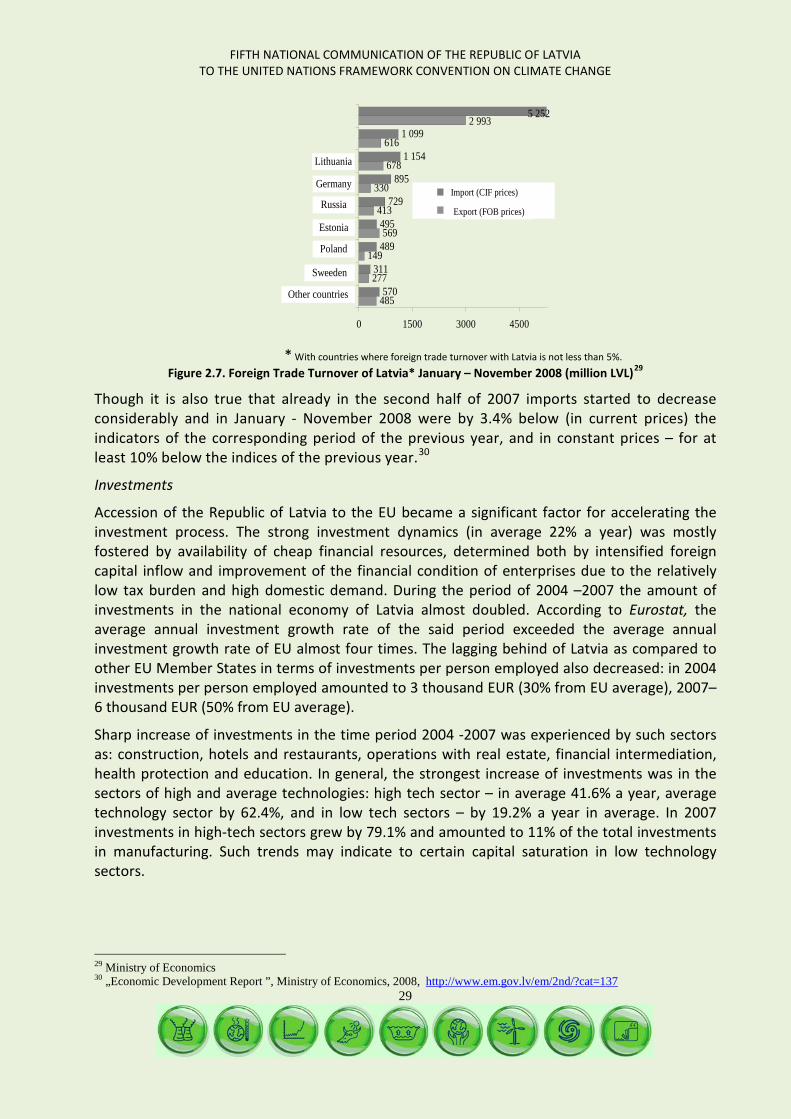
The largest trade partners of Latvia in the time period January – November 2008 were Lithuania – 16.6% from the total foreign trade turnover, Germany – 11.1%, Russia – 10.4%, Estonia – 9.7%, Poland – 5.8%, and Sweden – 5.3% (see figure.2.7.).
27 Ministry of Economics 28 Ministry of Economics
60% 62% 54% 47% 43% 40% 14% 15% 18% 22% 27%
30% 7%
6%
11%
12% 14%
15%
11%
11% 11%
9%
0 500
1000 1500 2000 2500 3000 3500 4000
2002 2003 2004 2005 2006 2007
Other countries CIS Other EU member states Lithuania and Estonia EU-15
FIFTH NATIONAL COMMUNICATION OF THE REPUBLIC OF LATVIA TO THE UNITED NATIONS FRAMEWORK CONVENTION ON CLIMATE CHANGE
29
485
277
149
569
413
330
678
616
570
311
489
495
729
895
1 154
1 0992 993
5 252
0 1500 3000 4500
Pārējās valstis
Zviedrija
Polija
Igaunija
Krievija
Vācija
Lietuva
Imports (CIF cenās)Eksports (FOB cenās)
Import (CIF prices)
Export (FOB prices)
Lithuania
Germany
Russia
Estonia
Poland
Sweeden
Other countries
* With countries where foreign trade turnover with Latvia is not less than 5%.
Figure 2.7. Foreign Trade Turnover of Latvia* January – November 2008 (million LVL)29
Though it is also true that already in the second half of 2007 imports started to decrease considerably and in January - November 2008 were by 3.4% below (in current prices) the indicators of the corresponding period of the previous year, and in constant prices – for at least 10% below the indices of the previous year.
30
Investments
Accession of the Republic of Latvia to the EU became a significant factor for accelerating the investment process. The strong investment dynamics (in average 22% a year) was mostly fostered by availability of cheap financial resources, determined both by intensified foreign capital inflow and improvement of the financial condition of enterprises due to the relatively low tax burden and high domestic demand. During the period of 2004 –2007 the amount of investments in the national economy of Latvia almost doubled. According to Eurostat, the average annual investment growth rate of the said period exceeded the average annual investment growth rate of EU almost four times. The lagging behind of Latvia as compared to other EU Member States in terms of investments per person employed also decreased: in 2004 investments per person employed amounted to 3 thousand EUR (30% from EU average), 2007– 6 thousand EUR (50% from EU average).
Sharp increase of investments in the time period 2004 -2007 was experienced by such sectors as: construction, hotels and restaurants, operations with real estate, financial intermediation, health protection and education. In general, the strongest increase of investments was in the sectors of high and average technologies: high tech sector – in average 41.6% a year, average technology sector by 62.4%, and in low tech sectors – by 19.2% a year in average. In 2007 investments in high-tech sectors grew by 79.1% and amounted to 11% of the total investments in manufacturing. Such trends may indicate to certain capital saturation in low technology sectors.
29 Ministry of Economics 30 „Economic Development Report ”, Ministry of Economics, 2008, http://www.em.gov.lv/em/2nd/?cat=137
FIFTH NATIONAL COMMUNICATION OF THE REPUBLIC OF LATVIA TO THE UNITED NATIONS FRAMEWORK CONVENTION ON CLIMATE CHANGE
30
In 2007 the investment dynamics slowed down. As compared to 2006, the investments increased by 7.5% what is by 8 percentage points below the level of 2006. The investments in light industry were experiencing a decline already since 2003.
2.4.2. Structure and Dynamics of National Economy Sectors
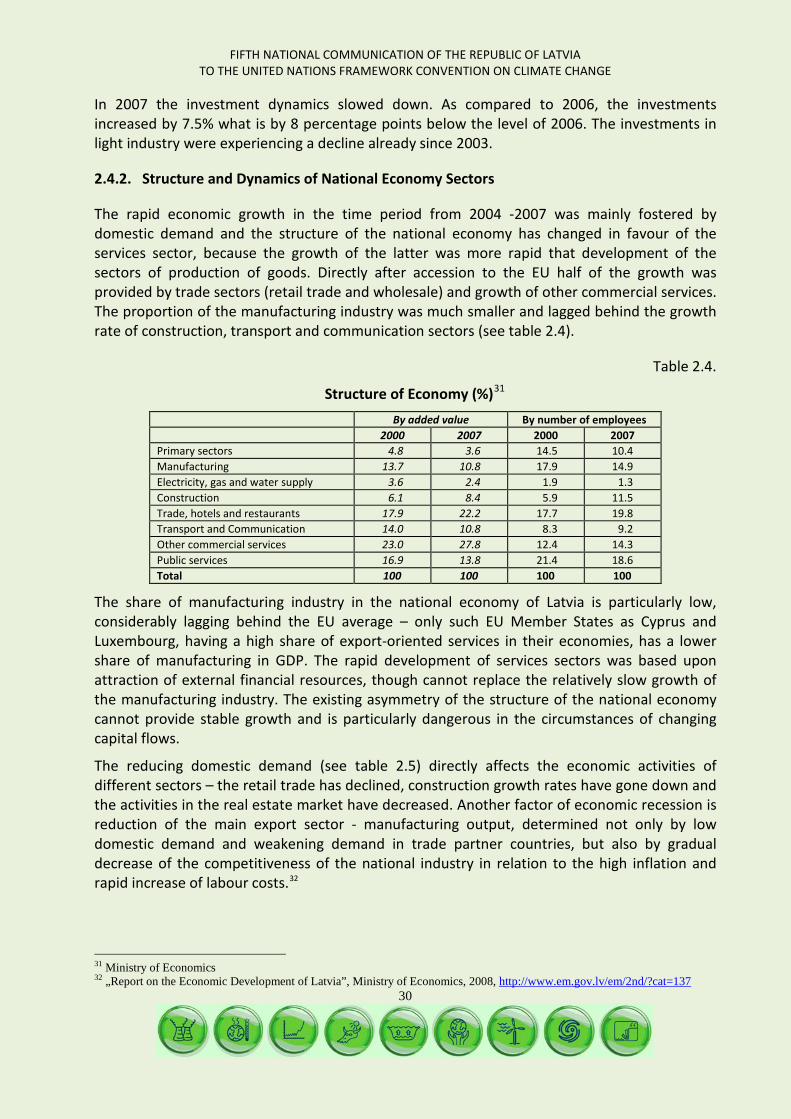
The rapid economic growth in the time period from 2004 -2007 was mainly fostered by domestic demand and the structure of the national economy has changed in favour of the services sector, because the growth of the latter was more rapid that development of the sectors of production of goods. Directly after accession to the EU half of the growth was provided by trade sectors (retail trade and wholesale) and growth of other commercial services. The proportion of the manufacturing industry was much smaller and lagged behind the growth rate of construction, transport and communication sectors (see table 2.4).
Table 2.4.
Structure of Economy (%)31
By added value By number of employees
2000 2007 2000 2007 Primary sectors 4.8 3.6 14.5 10.4 Manufacturing 13.7 10.8 17.9 14.9 Electricity, gas and water supply 3.6 2.4 1.9 1.3 Construction 6.1 8.4 5.9 11.5 Trade, hotels and restaurants 17.9 22.2 17.7 19.8 Transport and Communication 14.0 10.8 8.3 9.2 Other commercial services 23.0 27.8 12.4 14.3 Public services 16.9 13.8 21.4 18.6 Total 100 100 100 100
The share of manufacturing industry in the national economy of Latvia is particularly low, considerably lagging behind the EU average – only such EU Member States as Cyprus and Luxembourg, having a high share of export-oriented services in their economies, has a lower share of manufacturing in GDP. The rapid development of services sectors was based upon attraction of external financial resources, though cannot replace the relatively slow growth of the manufacturing industry. The existing asymmetry of the structure of the national economy cannot provide stable growth and is particularly dangerous in the circumstances of changing capital flows.
The reducing domestic demand (see table 2.5) directly affects the economic activities of different sectors – the retail trade has declined, construction growth rates have gone down and the activities in the real estate market have decreased. Another factor of economic recession is reduction of the main export sector - manufacturing output, determined not only by low domestic demand and weakening demand in trade partner countries, but also by gradual decrease of the competitiveness of the national industry in relation to the high inflation and rapid increase of labour costs.32
31 Ministry of Economics 32 „Report on the Economic Development of Latvia”, Ministry of Economics, 2008, http://www.em.gov.lv/em/2nd/?cat=137
FIFTH NATIONAL COMMUNICATION OF THE REPUBLIC OF LATVIA TO THE UNITED NATIONS FRAMEWORK CONVENTION ON CLIMATE CHANGE
31
Table 2.5
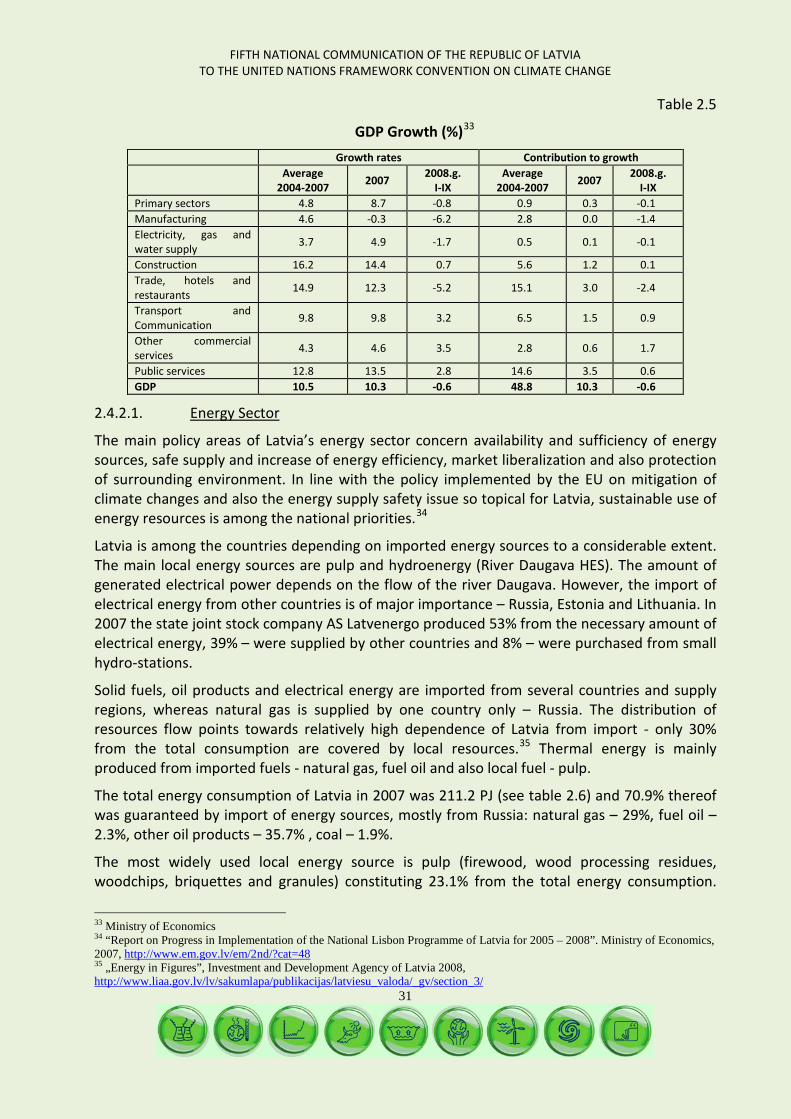
GDP Growth (%)33
Growth rates Contribution to growth
Average 2004-2007 2007 2008.g.
I-IX Average
2004-2007 2007 2008.g. I-IX
Primary sectors 4.8 8.7 -0.8 0.9 0.3 -0.1 Manufacturing 4.6 -0.3 -6.2 2.8 0.0 -1.4 Electricity, gas and water supply 3.7 4.9 -1.7 0.5 0.1 -0.1
Construction 16.2 14.4 0.7 5.6 1.2 0.1 Trade, hotels and restaurants 14.9 12.3 -5.2 15.1 3.0 -2.4
Transport and Communication 9.8 9.8 3.2 6.5 1.5 0.9
Other commercial services 4.3 4.6 3.5 2.8 0.6 1.7
Public services 12.8 13.5 2.8 14.6 3.5 0.6 GDP 10.5 10.3 -0.6 48.8 10.3 -0.6
2.4.2.1. Energy Sector
The main policy areas of Latvia’s energy sector concern availability and sufficiency of energy sources, safe supply and increase of energy efficiency, market liberalization and also protection of surrounding environment. In line with the policy implemented by the EU on mitigation of climate changes and also the energy supply safety issue so topical for Latvia, sustainable use of energy resources is among the national priorities.34
Latvia is among the countries depending on imported energy sources to a considerable extent. The main local energy sources are pulp and hydroenergy (River Daugava HES). The amount of generated electrical power depends on the flow of the river Daugava. However, the import of electrical energy from other countries is of major importance – Russia, Estonia and Lithuania. In 2007 the state joint stock company AS Latvenergo produced 53% from the necessary amount of electrical energy, 39% – were supplied by other countries and 8% – were purchased from small hydro-stations.
Solid fuels, oil products and electrical energy are imported from several countries and supply regions, whereas natural gas is supplied by one country only – Russia. The distribution of resources flow points towards relatively high dependence of Latvia from import - only 30% from the total consumption are covered by local resources.35
The total energy consumption of Latvia in 2007 was 211.2 PJ (see table 2.6) and 70.9% thereof was guaranteed by import of energy sources, mostly from Russia: natural gas – 29%, fuel oil – 2.3%, other oil products – 35.7% , coal – 1.9%.
Thermal energy is mainly produced from imported fuels - natural gas, fuel oil and also local fuel - pulp.
The most widely used local energy source is pulp (firewood, wood processing residues, woodchips, briquettes and granules) constituting 23.1% from the total energy consumption.
33 Ministry of Economics 34 “Report on Progress in Implementation of the National Lisbon Programme of Latvia for 2005 – 2008”. Ministry of Economics, 2007, http://www.em.gov.lv/em/2nd/?cat=48 35 „Energy in Figures”, Investment and Development Agency of Latvia 2008, http://www.liaa.gov.lv/lv/sakumlapa/publikacijas/latviesu_valoda/_gv/section_3/
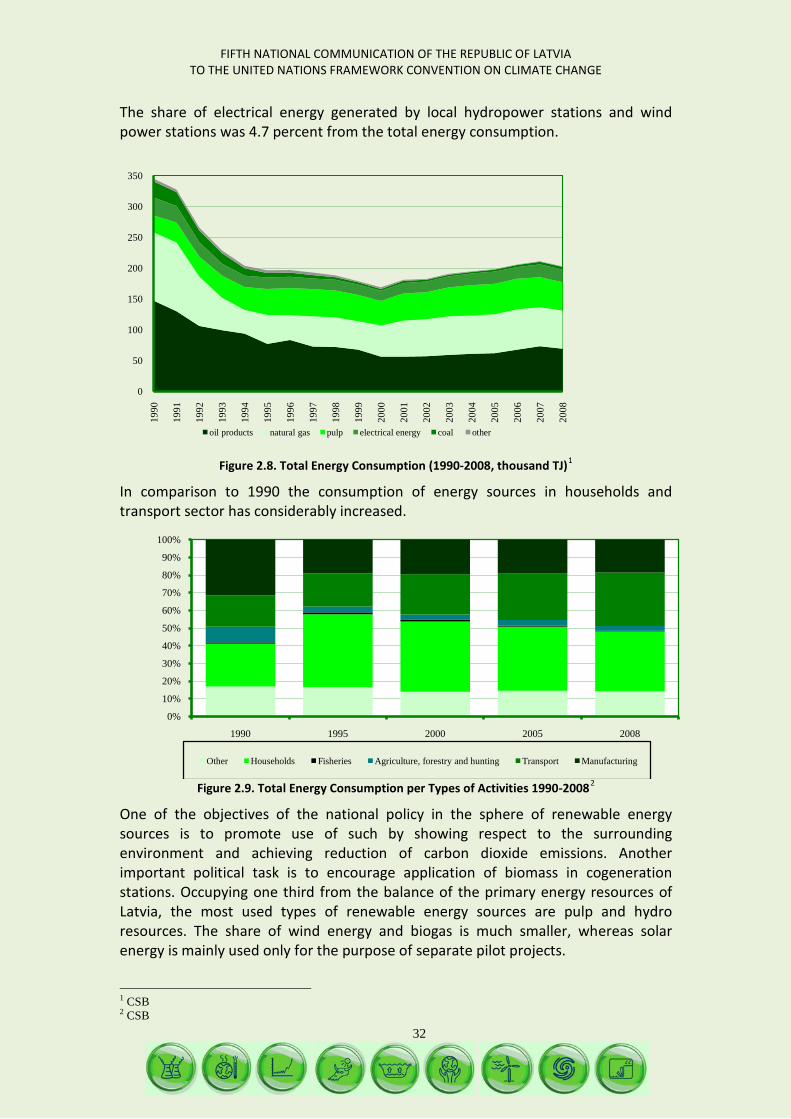
FIFTH NATIONAL COMMUNICATION OF THE REPUBLIC OF LATVIA TO THE UNITED NATIONS FRAMEWORK CONVENTION ON CLIMATE CHANGE
32
The share of electrical energy generated by local hydropower stations and wind power stations was 4.7 percent from the total energy consumption.
Figure 2.8. Total Energy Consumption (1990-2008, thousand TJ)1
In comparison to 1990 the consumption of energy sources in households and transport sector has considerably increased.
Figure 2.9. Total Energy Consumption per Types of Activities 1990-20082
One of the objectives of the national policy in the sphere of renewable energy sources is to promote use of such by showing respect to the surrounding environment and achieving reduction of carbon dioxide emissions. Another important political task is to encourage application of biomass in cogeneration stations. Occupying one third from the balance of the primary energy resources of Latvia, the most used types of renewable energy sources are pulp and hydro resources. The share of wind energy and biogas is much smaller, whereas solar energy is mainly used only for the purpose of separate pilot projects.
1 CSB 2 CSB
0
50
100
150
200
250
300
350
1990
1991
1992
1993
1994
1995
1996
1997
1998
1999
2000
2001
2002
2003
2004
2005
2006
2007
2008
oil products natural gas pulp electrical energy coal other
0%
10%
20%
30%
40%
50%
60%
70%
80%
90%
100%
1990 1995 2000 2005 2008
Other Households Fisheries Agriculture, forestry and hunting Transport Manufacturing
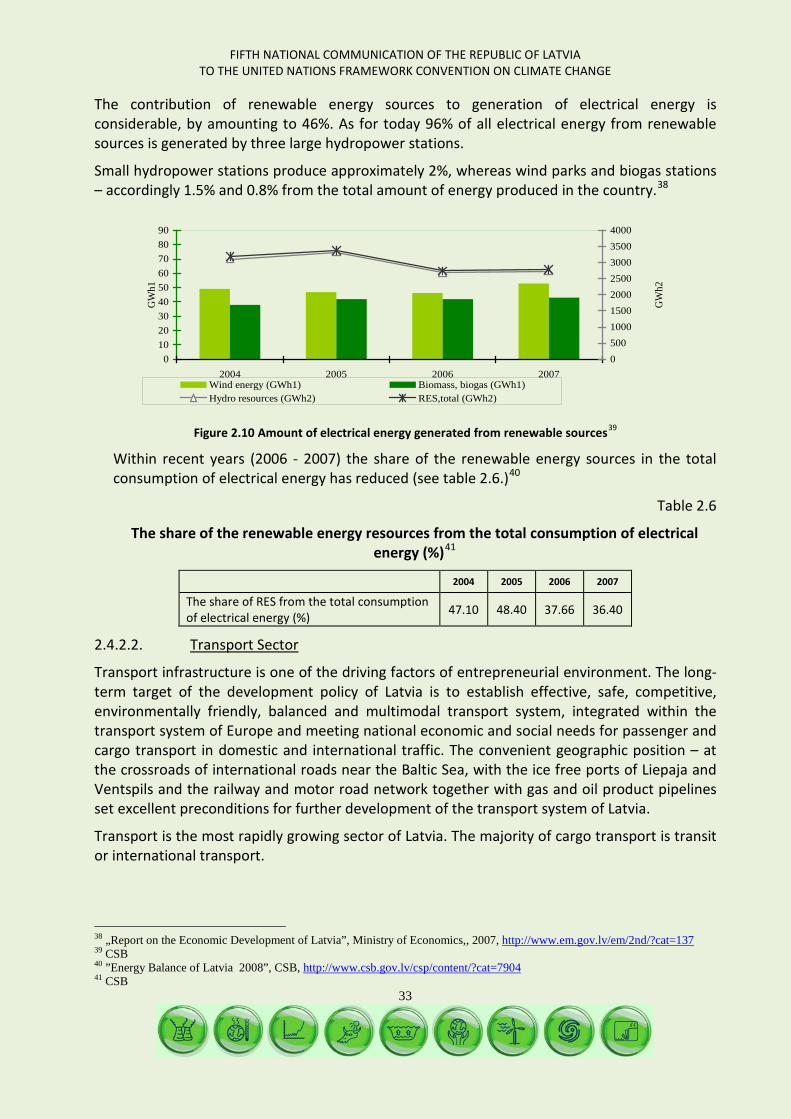
FIFTH NATIONAL COMMUNICATION OF THE REPUBLIC OF LATVIA TO THE UNITED NATIONS FRAMEWORK CONVENTION ON CLIMATE CHANGE
33
The contribution of renewable energy sources to generation of electrical energy is considerable, by amounting to 46%. As for today 96% of all electrical energy from renewable sources is generated by three large hydropower stations.
Small hydropower stations produce approximately 2%, whereas wind parks and biogas stations – accordingly 1.5% and 0.8% from the total amount of energy produced in the country.38
0102030405060708090
2004 2005 2006 2007
GW
h1
05001000150020002500300035004000
GW
h2
Wind energy (GWh1) Biomass, biogas (GWh1)Hydro resources (GWh2) RES,total (GWh2)
Figure 2.10 Amount of electrical energy generated from renewable sources39
Within recent years (2006 - 2007) the share of the renewable energy sources in the total consumption of electrical energy has reduced (see table 2.6.)
40
Table 2.6
The share of the renewable energy resources from the total consumption of electrical energy (%)41
2004 2005 2006 2007
The share of RES from the total consumption of electrical energy (%) 47.10 48.40 37.66 36.40
2.4.2.2. Transport Sector
Transport infrastructure is one of the driving factors of entrepreneurial environment. The long-term target of the development policy of Latvia is to establish effective, safe, competitive, environmentally friendly, balanced and multimodal transport system, integrated within the transport system of Europe and meeting national economic and social needs for passenger and cargo transport in domestic and international traffic. The convenient geographic position – at the crossroads of international roads near the Baltic Sea, with the ice free ports of Liepaja and Ventspils and the railway and motor road network together with gas and oil product pipelines set excellent preconditions for further development of the transport system of Latvia.
Transport is the most rapidly growing sector of Latvia. The majority of cargo transport is transit or international transport.
38 „Report on the Economic Development of Latvia”, Ministry of Economics,, 2007, http://www.em.gov.lv/em/2nd/?cat=137 39 CSB 40 ”Energy Balance of Latvia 2008”, CSB, http://www.csb.gov.lv/csp/content/?cat=7904 41 CSB
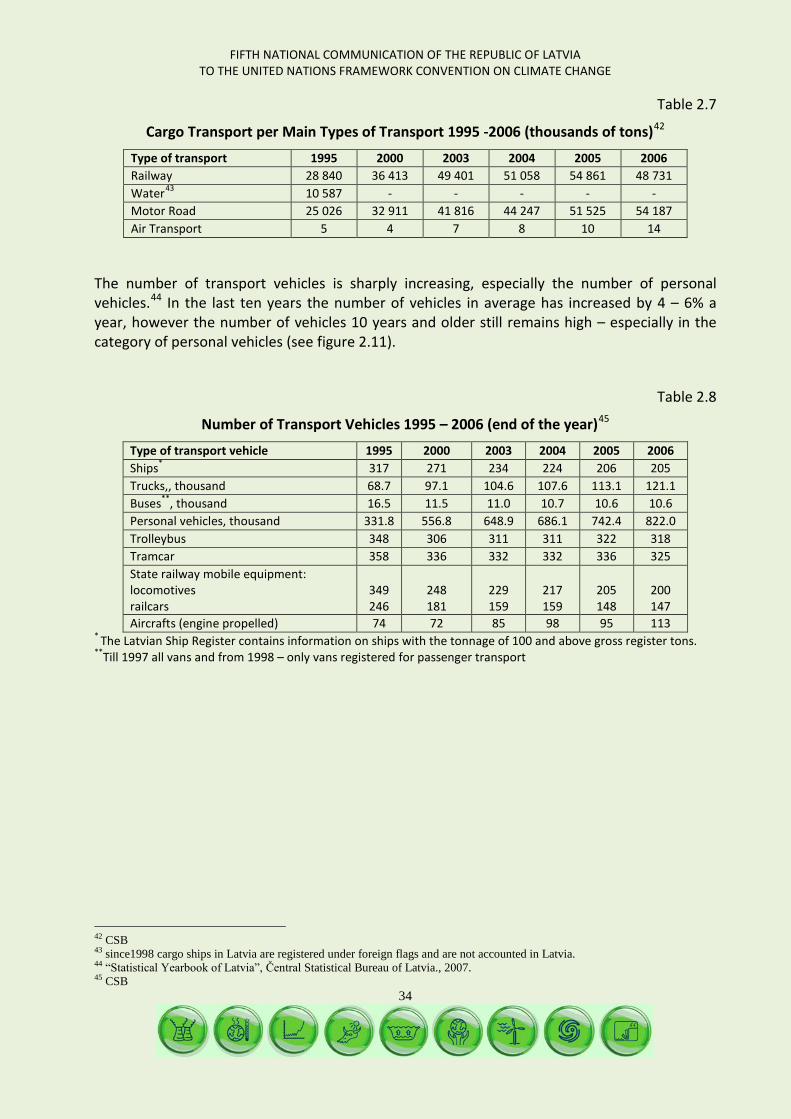
FIFTH NATIONAL COMMUNICATION OF THE REPUBLIC OF LATVIA TO THE UNITED NATIONS FRAMEWORK CONVENTION ON CLIMATE CHANGE
34
Table 2.7
Cargo Transport per Main Types of Transport 1995 -2006 (thousands of tons)42
Type of transport
1995 2000 2003 2004 2005 2006 Railway 28 840 36 413 49 401 51 058 54 861 48 731 Water43 10 587 - - - - - Motor Road 25 026 32 911 41 816 44 247 51 525 54 187 Air Transport 5 4 7 8 10 14
The number of transport vehicles is sharply increasing, especially the number of personal vehicles.44
In the last ten years the number of vehicles in average has increased by 4 – 6% a year, however the number of vehicles 10 years and older still remains high – especially in the category of personal vehicles (see figure 2.11).
Table 2.8
Number of Transport Vehicles 1995 – 2006 (end of the year)45
Type of transport vehicle
1995 2000 2003 2004 2005 2006 Ships* 317 271 234 224 206 205 Trucks,, thousand 68.7 97.1 104.6 107.6 113.1 121.1 Buses**, thousand 16.5 11.5 11.0 10.7 10.6 10.6 Personal vehicles, thousand 331.8 556.8 648.9 686.1 742.4 822.0 Trolleybus 348 306 311 311 322 318 Tramcar 358 336 332 332 336 325 State railway mobile equipment: locomotives railcars
349 246
248 181
229 159
217 159
205 148
200 147
Aircrafts (engine propelled) 74 72 85 98 95 113 * The Latvian Ship Register contains information on ships with the tonnage of 100 and above gross register tons. **Till 1997 all vans and from 1998 – only vans registered for passenger transport
42 CSB 43 since1998 cargo ships in Latvia are registered under foreign flags and are not accounted in Latvia. 44 “Statistical Yearbook of Latvia”, Čentral Statistical Bureau of Latvia., 2007. 45 CSB
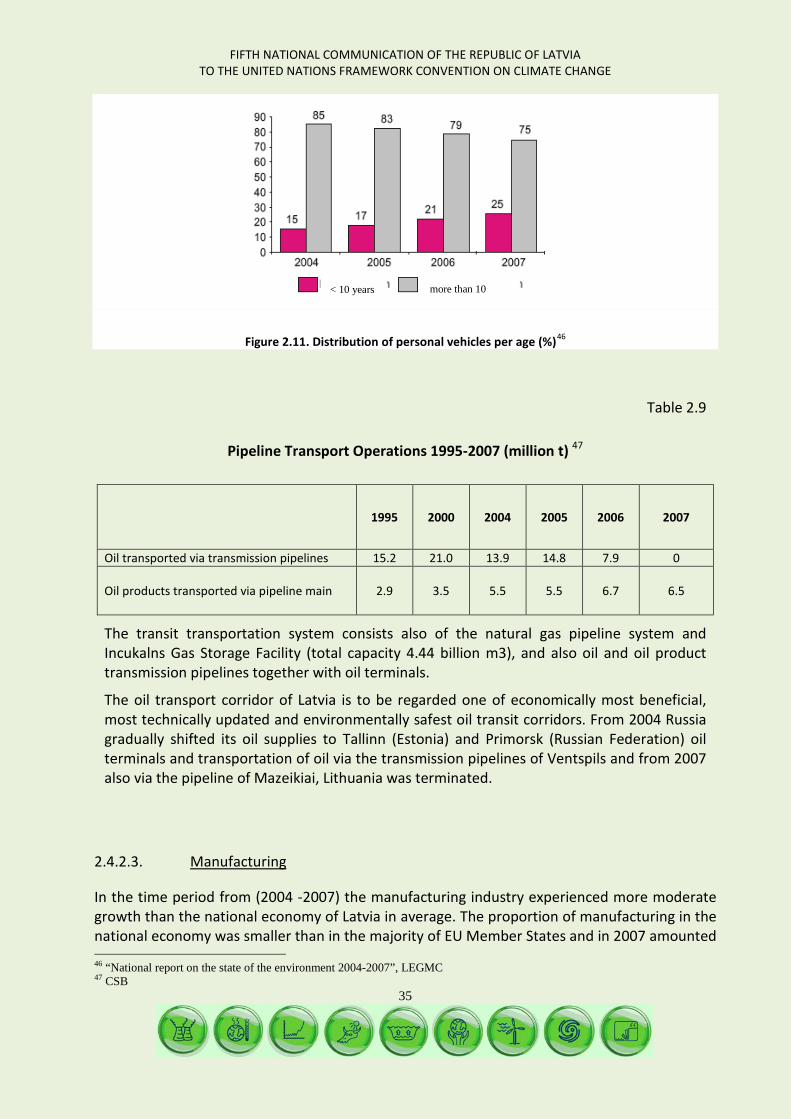
FIFTH NATIONAL COMMUNICATION OF THE REPUBLIC OF LATVIA TO THE UNITED NATIONS FRAMEWORK CONVENTION ON CLIMATE CHANGE
35
Figure 2.11. Distribution of personal vehicles per age (%)46
Table 2.9
Pipeline Transport Operations 1995-2007 (million t) 47
1995 2000 2004 2005 2006 2007
Oil transported via transmission pipelines 15.2 21.0 13.9 14.8 7.9 0
Oil products transported via pipeline main 2.9 3.5 5.5 5.5 6.7 6.5
The transit transportation system consists also of the natural gas pipeline system and Incukalns Gas Storage Facility (total capacity 4.44 billion m3), and also oil and oil product transmission pipelines together with oil terminals.
The oil transport corridor of Latvia is to be regarded one of economically most beneficial, most technically updated and environmentally safest oil transit corridors. From 2004 Russia gradually shifted its oil supplies to Tallinn (Estonia) and Primorsk (Russian Federation) oil terminals and transportation of oil via the transmission pipelines of Ventspils and from 2007 also via the pipeline of Mazeikiai, Lithuania was terminated.
2.4.2.3. Manufacturing
In the time period from (2004 -2007) the manufacturing industry experienced more moderate growth than the national economy of Latvia in average. The proportion of manufacturing in the national economy was smaller than in the majority of EU Member States and in 2007 amounted 46 “National report on the state of the environment 2004-2007”, LEGMC 47 CSB
< 10 years more than 10
FIFTH NATIONAL COMMUNICATION OF THE REPUBLIC OF LATVIA TO THE UNITED NATIONS FRAMEWORK CONVENTION ON CLIMATE CHANGE
36
to 9.4% only. The sector has undergone permanent decline already since 2000. Although during the last eight years (1999-2007) the manufacturing industry experienced stable production increase – 8.7% a year annually, though as from 2007 the production rate had already decreased by 1% below the indicators of the previous year.48
The oil transport corridor of Latvia is to be regarded one of economically most beneficial, most technically updated and environmentally safest oil transit corridors. From 2004 Russia gradually shifted its oil supplies to Tallinn (Estonia) and Primorsk (Russian Federation) oil terminals and transportation of oil via the transmission pipelines of Ventspils and from 2007 also via the pipeline of Mazeikiai, Lithuania was terminated.
The operational data for 2007 outline several problems of the manufacturing industry, because the constant or shrinking production amounts of such large scale manufacturing sub-branches as wood processing, food industry, light industry, production of machinery and equipment is not any more compensated with growing amount of other industries.
Table 2.10.
Manufacturing Industry Structure in 2007 (%)*49
By added value 2007
By number of employees 2007
Share of exports in sector’s sales
2007* Total manufacturing 100 100 48.7 Food industry 18.2 20.4 24.1 Light industry 6.8 12.6 76.6 Wood processing 22.7 19.3 65.1 Paper production and publishing 8.2 7.4 24.7 Chemicals, rubber and plastic industry 8.5 5.7 55.8 Production of other non-metallic mineral products 6.6 5.2 18.2
Production of metals and metal articles 11.2 8.4 64.6 Production of machinery and equipment 3.0 3.9 72.3 Production of electrical and optical equipment 5.4 4.5 61.1 Production of transport vehicles 3.5 4.1 75.1 Other industry sectors 6.0 8.5 53.4
* According to the operational statistics for January – November 2007
In 2006 the growth rate of one of the main fields of export of Latvia - wood processing, production of machinery and equipment was relatively low, by even experiencing decline in 2007.50
48 Latvia’s National Inventory Report, 1990-2007, LEGMC, Riga, 2009,
http://www.meteo.lv/upload_file/parskati/starpt_org/ANO/zinojums.pdf 49 Ministry of Economics 50 “Report on the Economic Development of Latvia”, Ministry of Economics, 2008, http://www.em.gov.lv/em/2nd/?cat=137
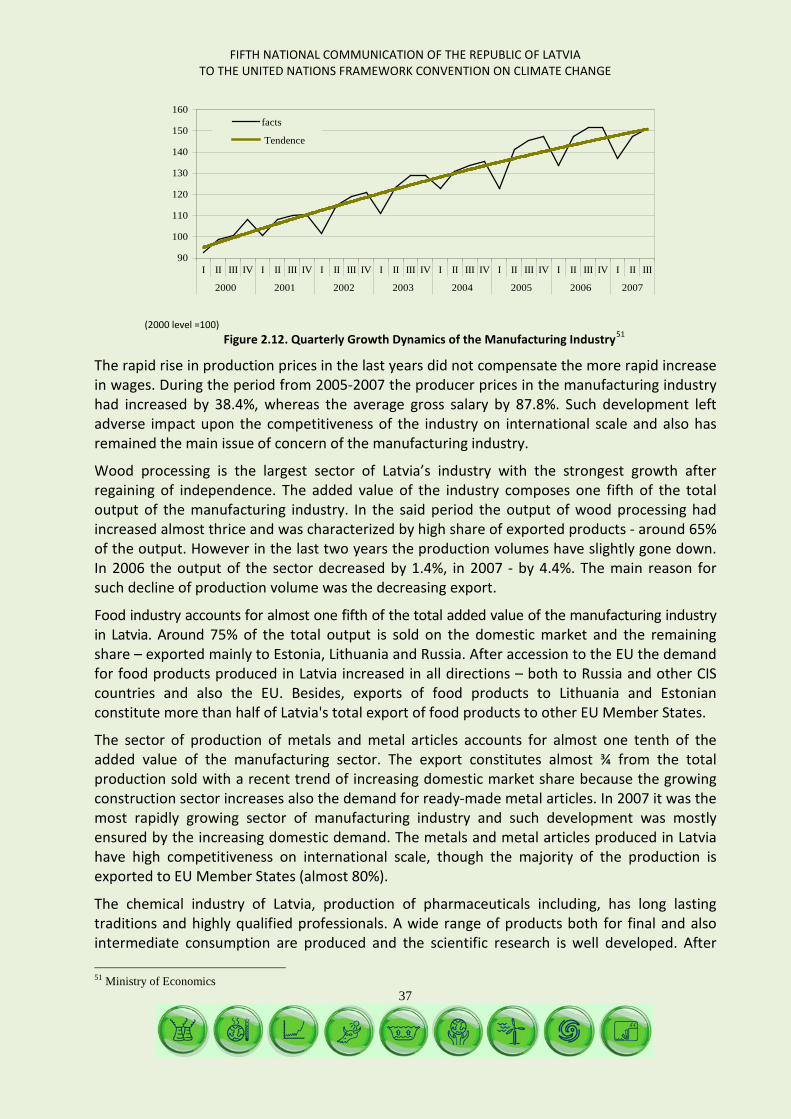
FIFTH NATIONAL COMMUNICATION OF THE REPUBLIC OF LATVIA TO THE UNITED NATIONS FRAMEWORK CONVENTION ON CLIMATE CHANGE
37
90
100
110
120
130
140
150
160
I II III IV I II III IV I II III IV I II III IV I II III IV I II III IV I II III IV I II III
2000 2001 2002 2003 2004 2005 2006 2007
facts
Tendence
(2000 level =100)
Figure 2.12. Quarterly Growth Dynamics of the Manufacturing Industry51
The rapid rise in production prices in the last years did not compensate the more rapid increase in wages. During the period from 2005-2007 the producer prices in the manufacturing industry had increased by 38.4%, whereas the average gross salary by 87.8%. Such development left adverse impact upon the competitiveness of the industry on international scale and also has remained the main issue of concern of the manufacturing industry.
Wood processing is the largest sector of Latvia’s industry with the strongest growth after regaining of independence. The added value of the industry composes one fifth of the total output of the manufacturing industry. In the said period the output of wood processing had increased almost thrice and was characterized by high share of exported products - around 65% of the output. However in the last two years the production volumes have slightly gone down. In 2006 the output of the sector decreased by 1.4%, in 2007 - by 4.4%. The main reason for such decline of production volume was the decreasing export.
Food industry accounts for almost one fifth of the total added value of the manufacturing industry in Latvia. Around 75% of the total output is sold on the domestic market and the remaining share – exported mainly to Estonia, Lithuania and Russia. After accession to the EU the demand for food products produced in Latvia increased in all directions – both to Russia and other CIS countries and also the EU. Besides, exports of food products to Lithuania and Estonian constitute more than half of Latvia's total export of food products to other EU Member States.
The sector of production of metals and metal articles accounts for almost one tenth of the added value of the manufacturing sector. The export constitutes almost ¾ from the total production sold with a recent trend of increasing domestic market share because the growing construction sector increases also the demand for ready-made metal articles. In 2007 it was the most rapidly growing sector of manufacturing industry and such development was mostly ensured by the increasing domestic demand. The metals and metal articles produced in Latvia have high competitiveness on international scale, though the majority of the production is exported to EU Member States (almost 80%).
The chemical industry of Latvia, production of pharmaceuticals including, has long lasting traditions and highly qualified professionals. A wide range of products both for final and also intermediate consumption are produced and the scientific research is well developed. After 51 Ministry of Economics
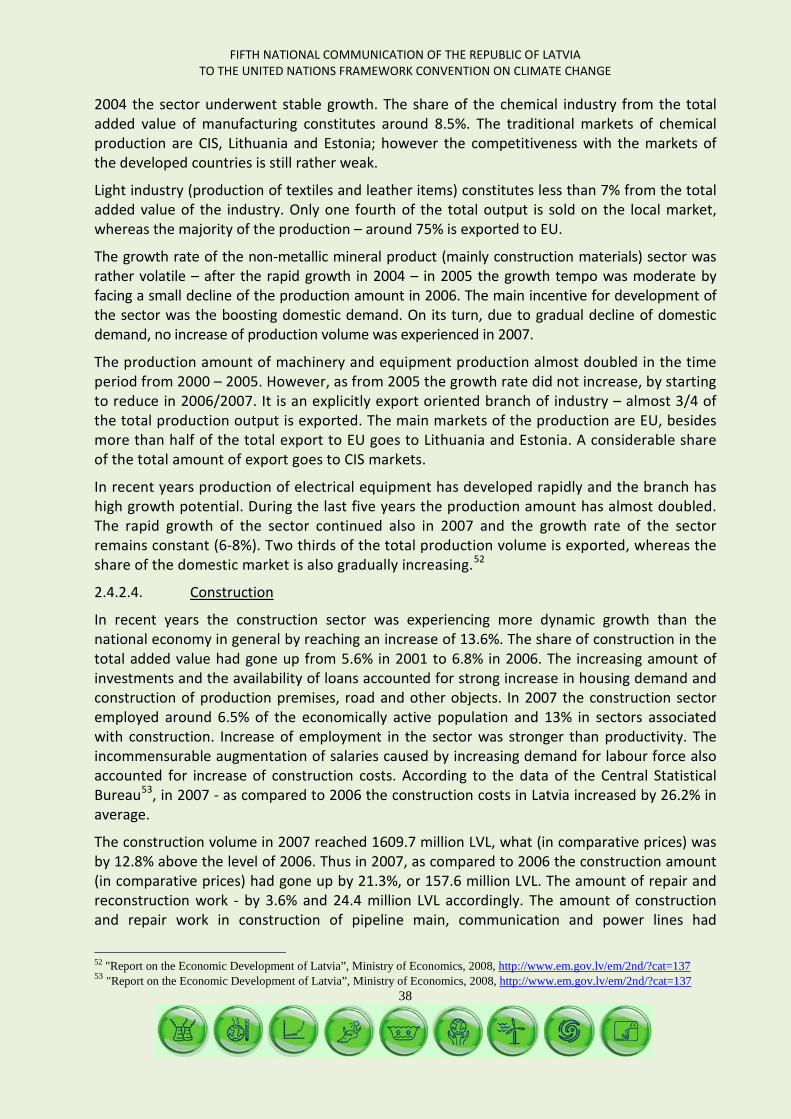
FIFTH NATIONAL COMMUNICATION OF THE REPUBLIC OF LATVIA TO THE UNITED NATIONS FRAMEWORK CONVENTION ON CLIMATE CHANGE
38
2004 the sector underwent stable growth. The share of the chemical industry from the total added value of manufacturing constitutes around 8.5%. The traditional markets of chemical production are CIS, Lithuania and Estonia; however the competitiveness with the markets of the developed countries is still rather weak.
Light industry (production of textiles and leather items) constitutes less than 7% from the total added value of the industry. Only one fourth of the total output is sold on the local market, whereas the majority of the production – around 75% is exported to EU.
The growth rate of the non-metallic mineral product (mainly construction materials) sector was rather volatile – after the rapid growth in 2004 – in 2005 the growth tempo was moderate by facing a small decline of the production amount in 2006. The main incentive for development of the sector was the boosting domestic demand. On its turn, due to gradual decline of domestic demand, no increase of production volume was experienced in 2007.
The production amount of machinery and equipment production almost doubled in the time period from 2000 – 2005. However, as from 2005 the growth rate did not increase, by starting to reduce in 2006/2007. It is an explicitly export oriented branch of industry – almost 3/4 of the total production output is exported. The main markets of the production are EU, besides more than half of the total export to EU goes to Lithuania and Estonia. A considerable share of the total amount of export goes to CIS markets.
In recent years production of electrical equipment has developed rapidly and the branch has high growth potential. During the last five years the production amount has almost doubled. The rapid growth of the sector continued also in 2007 and the growth rate of the sector remains constant (6-8%). Two thirds of the total production volume is exported, whereas the share of the domestic market is also gradually increasing.52
2.4.2.4. Construction
In recent years the construction sector was experiencing more dynamic growth than the national economy in general by reaching an increase of 13.6%. The share of construction in the total added value had gone up from 5.6% in 2001 to 6.8% in 2006. The increasing amount of investments and the availability of loans accounted for strong increase in housing demand and construction of production premises, road and other objects. In 2007 the construction sector employed around 6.5% of the economically active population and 13% in sectors associated with construction. Increase of employment in the sector was stronger than productivity. The incommensurable augmentation of salaries caused by increasing demand for labour force also accounted for increase of construction costs. According to the data of the Central Statistical Bureau53
The construction volume in 2007 reached 1609.7 million LVL, what (in comparative prices) was by 12.8% above the level of 2006. Thus in 2007, as compared to 2006 the construction amount (in comparative prices) had gone up by 21.3%, or 157.6 million LVL. The amount of repair and reconstruction work - by 3.6% and 24.4 million LVL accordingly. The amount of construction and repair work in construction of pipeline main, communication and power lines had
, in 2007 - as compared to 2006 the construction costs in Latvia increased by 26.2% in average.
52 "Report on the Economic Development of Latvia”, Ministry of Economics, 2008, http://www.em.gov.lv/em/2nd/?cat=137 53 "Report on the Economic Development of Latvia”, Ministry of Economics, 2008, http://www.em.gov.lv/em/2nd/?cat=137

FIFTH NATIONAL COMMUNICATION OF THE REPUBLIC OF LATVIA TO THE UNITED NATIONS FRAMEWORK CONVENTION ON CLIMATE CHANGE
39
increased 1.7 times, that of administrative buildings - 1.5 times and that of residential space - 1.3 times. At the same time the construction amount of local pipelines and constructions had declined by 21% and the amount of construction of production buildings and warehouses - by 10% accordingly. The place of performance of the majority of construction work is Riga - 43%, Riga district – 30.6% and the nearby health resort Jurmala 4.5%.
2.4.2.5. Housing
Households and public buildings are the largest heat consumers in Latvia, using more than 70% from the total annual production of thermal energy. In the housing sector, the main issue of concern is the high energy consumption, especially in buildings constructed in the time period from 1958-1992 when reinforced concrete constructions were widely used in construction. Since beginning of 90ies radical changes in the housing sector have taken place as the result of privatization and denationalization of private houses: the majority of the housing stock constitutes the private sector and in general a rather active residential market has been established.
In 2006 there were 342.9 thousand residential buildings in Latvia with the total number of 1018 thousand residential units, whereas the total area of the housing stock end 2007 reached 60.1 million m². Almost two thirds of the total housing stock is located in cities and only one third in rural areas. One of the main factors characterizing housing stock is the average total area of residential premises per capita: in 2000 it was 22.6 m², in 2006– 25.7 m² and in 2007 – 26.4 m².
Table 2.11
Housing Stock Main Indicators (total area end of the year mil. m²)54
2000 2005 2006 2007
Total 53.5 57.0 58.7 60.1 Including: Public sector 12.9 8.1 7.8 7.6 Private sector 40.6 48.9 50.9 52.5 Average per capita m² 22.6 24.8 25.7 26.4 Urban housing stock 34.8 37.1 38.2 39.1 Including: Public sector 10.2 6.3 6.1 5.9 Private sector 24.6 30.8 32.1 33.2 Average per capita m² 21.5 23.8 24.6 25.4 Rural housing stock 18.7 19.9 20.5 21.0 Including: Public sector 2.7 1.8 1.7 1.7 Private sector 16.0 18.1 18.8 19.3 Average per capita m² 25.0 27.1 28.0 28.8
The ownership structure of the housing stock has changed in the result of privatization of state and municipal residential buildings. The share of the private sector in the housing stock has increased from 76% end 2000 till 87% end 2007.
Active construction of new residential buildings was continued all through 2007 – residential buildings with the total area of 1188.4 thousand m² were put into operation what is by 46% 54 CSB and the Ministry of Economics
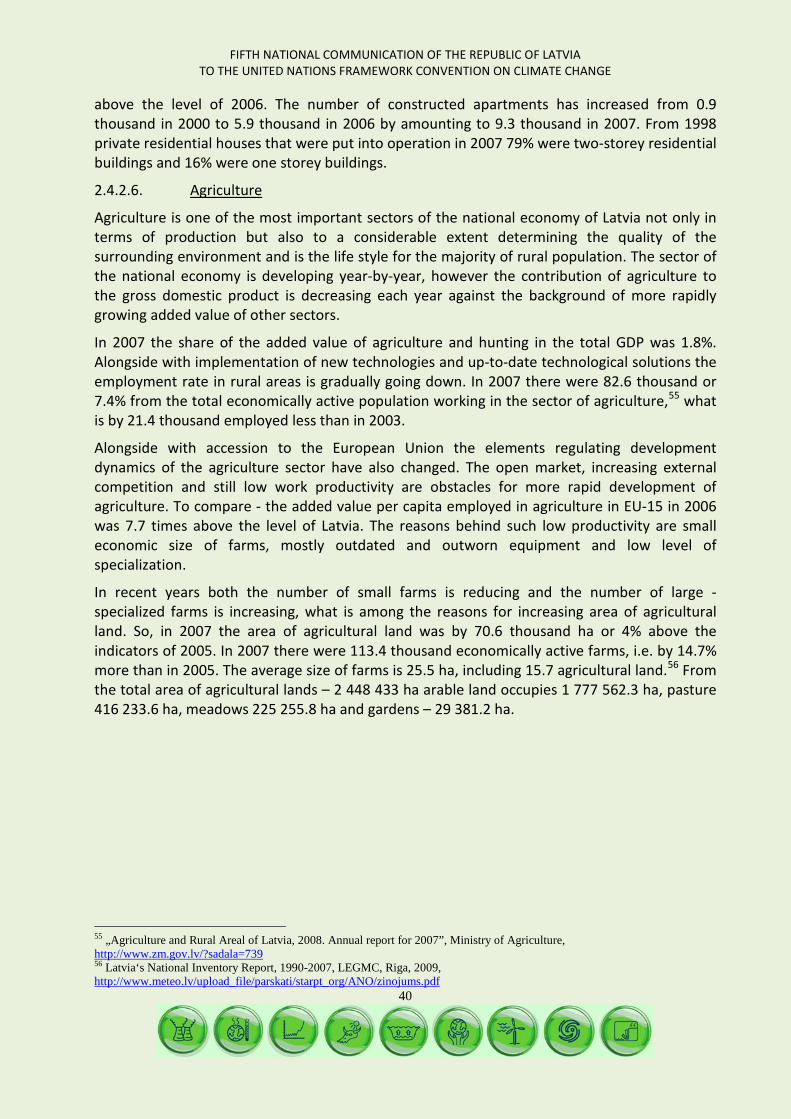
FIFTH NATIONAL COMMUNICATION OF THE REPUBLIC OF LATVIA TO THE UNITED NATIONS FRAMEWORK CONVENTION ON CLIMATE CHANGE
40
above the level of 2006. The number of constructed apartments has increased from 0.9 thousand in 2000 to 5.9 thousand in 2006 by amounting to 9.3 thousand in 2007. From 1998 private residential houses that were put into operation in 2007 79% were two-storey residential buildings and 16% were one storey buildings.
2.4.2.6. Agriculture
Agriculture is one of the most important sectors of the national economy of Latvia not only in terms of production but also to a considerable extent determining the quality of the surrounding environment and is the life style for the majority of rural population. The sector of the national economy is developing year-by-year, however the contribution of agriculture to the gross domestic product is decreasing each year against the background of more rapidly growing added value of other sectors.
In 2007 the share of the added value of agriculture and hunting in the total GDP was 1.8%. Alongside with implementation of new technologies and up-to-date technological solutions the employment rate in rural areas is gradually going down. In 2007 there were 82.6 thousand or 7.4% from the total economically active population working in the sector of agriculture,55
Alongside with accession to the European Union the elements regulating development dynamics of the agriculture sector have also changed. The open market, increasing external competition and still low work productivity are obstacles for more rapid development of agriculture. To compare - the added value per capita employed in agriculture in EU-15 in 2006 was 7.7 times above the level of Latvia. The reasons behind such low productivity are small economic size of farms, mostly outdated and outworn equipment and low level of specialization.
what is by 21.4 thousand employed less than in 2003.
In recent years both the number of small farms is reducing and the number of large - specialized farms is increasing, what is among the reasons for increasing area of agricultural land. So, in 2007 the area of agricultural land was by 70.6 thousand ha or 4% above the indicators of 2005. In 2007 there were 113.4 thousand economically active farms, i.e. by 14.7% more than in 2005. The average size of farms is 25.5 ha, including 15.7 agricultural land.56
55 „Agriculture and Rural Areal of Latvia, 2008. Annual report for 2007”, Ministry of Agriculture,
From the total area of agricultural lands – 2 448 433 ha arable land occupies 1 777 562.3 ha, pasture 416 233.6 ha, meadows 225 255.8 ha and gardens – 29 381.2 ha.
http://www.zm.gov.lv/?sadala=739 56 Latvia‘s National Inventory Report, 1990-2007, LEGMC, Riga, 2009, http://www.meteo.lv/upload_file/parskati/starpt_org/ANO/zinojums.pdf

FIFTH NATIONAL COMMUNICATION OF THE REPUBLIC OF LATVIA TO THE UNITED NATIONS FRAMEWORK CONVENTION ON CLIMATE CHANGE
41
Pasture17.0%
Grasslands9.2%
Orchards1.2%
Arable lands72.6%
Figure 2.13. Agricultural land by types of land use
(% to 01.01.2007)57
Traditionally, the leading agricultural industries are livestock breeding and crop farming. In 2006 in the final agricultural production structure (in base prices) crop farming accounted for 51% (including grain – 20%, feed – 10%, potatoes – 8%, vegetables – 5%, rapeseed – 4%), and livestock breeding accounted for 44% (including milk – 25%, pork – 7%, beef – 5%, egg – 4%), and other agricultural produce for 5% of the total output.
In 2007 the total agricultural produce increased by 11.1% what was one of the strongest increase indicators of recent years. Considerable increase of production amount was faced not only in crop farming (+16.9%), but also livestock breeding, where the increase of the physical amount has been more rapid than in preceding years (+11.3%).
The increase of the total agricultural produce of crop farming was mainly determined by increasing amounts of crops (+32.2%), rapeseed (+62.3%) and potatoes (+21.6%). The increase of the total produce was mostly facilitated by favourable weather conditions accounting for high productivity. After liquidation of the sugar production sector in 2007, growing of sugar-beets reached only around 2% from the former level.
The amount of all main production types of livestock breeding has increased. Material increase has been experienced by output of meat, especially beef (by 30.8%); pork (2.0%) and eggs (11.8).
Thus, milk produce output also increased more rapidly than previously - by 3.3.% in 2007 as compared to 1.0% in 2006, though the number of important agricultural stock has declined: cattle – by 0.5%, including milking cows - by 2.2%, pigs by 6.1% and increase was observed only in poultry farming – 12.1%.58,59
57 State Land Service
58 “„Agriculture and Rural Areal of Latvia, 2008. Annual report for 2007”, Ministry of Agriculture , http://www.zm.gov.lv/?sadala=739 59 “„Agriculture and Rural Areal of Latvia, 2009. Annual report for 2008”, Ministry of Agriculture ,http://www.zm.gov.lv/?sadala=739
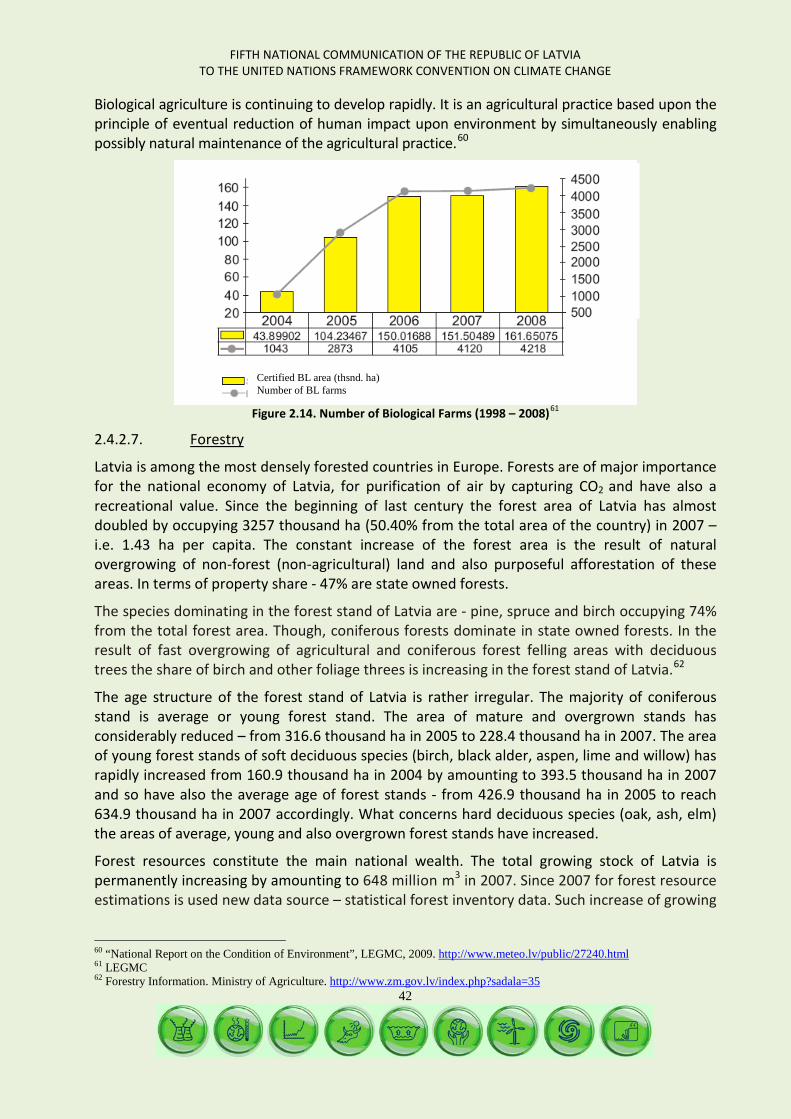
FIFTH NATIONAL COMMUNICATION OF THE REPUBLIC OF LATVIA TO THE UNITED NATIONS FRAMEWORK CONVENTION ON CLIMATE CHANGE
42
Biological agriculture is continuing to develop rapidly. It is an agricultural practice based upon the principle of eventual reduction of human impact upon environment by simultaneously enabling possibly natural maintenance of the agricultural practice.60
Figure 2.14. Number of Biological Farms (1998 – 2008)61
2.4.2.7. Forestry
Latvia is among the most densely forested countries in Europe. Forests are of major importance for the national economy of Latvia, for purification of air by capturing CO2 and have also a recreational value. Since the beginning of last century the forest area of Latvia has almost doubled by occupying 3257 thousand ha (50.40% from the total area of the country) in 2007 – i.e. 1.43 ha per capita. The constant increase of the forest area is the result of natural overgrowing of non-forest (non-agricultural) land and also purposeful afforestation of these areas. In terms of property share - 47% are state owned forests.
The species dominating in the forest stand of Latvia are - pine, spruce and birch occupying 74% from the total forest area. Though, coniferous forests dominate in state owned forests. In the result of fast overgrowing of agricultural and coniferous forest felling areas with deciduous trees the share of birch and other foliage threes is increasing in the forest stand of Latvia.62
The age structure of the forest stand of Latvia is rather irregular. The majority of coniferous stand is average or young forest stand. The area of mature and overgrown stands has considerably reduced – from 316.6 thousand ha in 2005 to 228.4 thousand ha in 2007. The area of young forest stands of soft deciduous species (birch, black alder, aspen, lime and willow) has rapidly increased from 160.9 thousand ha in 2004 by amounting to 393.5 thousand ha in 2007 and so have also the average age of forest stands - from 426.9 thousand ha in 2005 to reach 634.9 thousand ha in 2007 accordingly. What concerns hard deciduous species (oak, ash, elm) the areas of average, young and also overgrown forest stands have increased.
Forest resources constitute the main national wealth. The total growing stock of Latvia is permanently increasing by amounting to 648 million m3 in 2007. Since 2007 for forest resource estimations is used new data source – statistical forest inventory data. Such increase of growing
60 “National Report on the Condition of Environment”, LEGMC, 2009. http://www.meteo.lv/public/27240.html 61 LEGMC 62 Forestry Information. Ministry of Agriculture. http://www.zm.gov.lv/index.php?sadala=35
Certified BL area (thsnd. ha) Number of BL farms
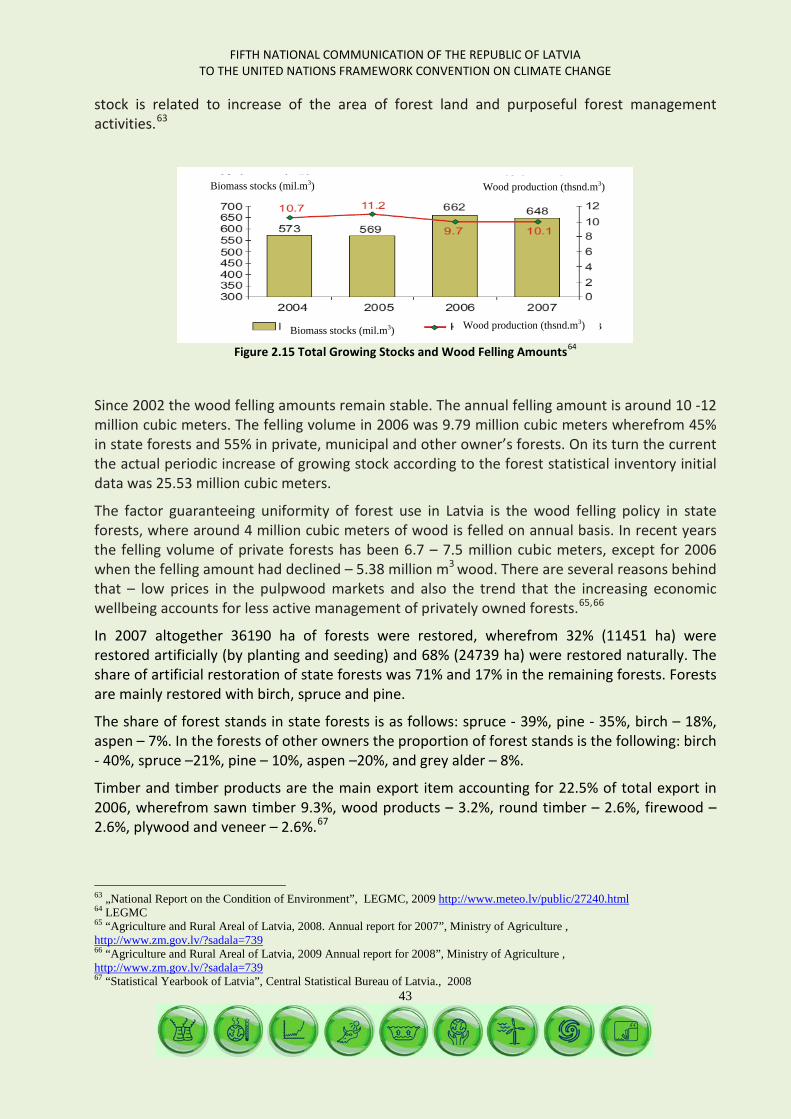
FIFTH NATIONAL COMMUNICATION OF THE REPUBLIC OF LATVIA TO THE UNITED NATIONS FRAMEWORK CONVENTION ON CLIMATE CHANGE
43
stock is related to increase of the area of forest land and purposeful forest management activities.63
Figure 2.15 Total Growing Stocks and Wood Felling Amounts64
Since 2002 the wood felling amounts remain stable. The annual felling amount is around 10 -12 million cubic meters. The felling volume in 2006 was 9.79 million cubic meters wherefrom 45% in state forests and 55% in private, municipal and other owner’s forests. On its turn the current the actual periodic increase of growing stock according to the forest statistical inventory initial data was 25.53 million cubic meters.
The factor guaranteeing uniformity of forest use in Latvia is the wood felling policy in state forests, where around 4 million cubic meters of wood is felled on annual basis. In recent years the felling volume of private forests has been 6.7 – 7.5 million cubic meters, except for 2006 when the felling amount had declined – 5.38 million m3 wood. There are several reasons behind that – low prices in the pulpwood markets and also the trend that the increasing economic wellbeing accounts for less active management of privately owned forests.65,66
In 2007 altogether 36190 ha of forests were restored, wherefrom 32% (11451 ha) were restored artificially (by planting and seeding) and 68% (24739 ha) were restored naturally. The share of artificial restoration of state forests was 71% and 17% in the remaining forests. Forests are mainly restored with birch, spruce and pine.
The share of forest stands in state forests is as follows: spruce - 39%, pine - 35%, birch – 18%, aspen – 7%. In the forests of other owners the proportion of forest stands is the following: birch - 40%, spruce –21%, pine – 10%, aspen –20%, and grey alder – 8%.
Timber and timber products are the main export item accounting for 22.5% of total export in 2006, wherefrom sawn timber 9.3%, wood products – 3.2%, round timber – 2.6%, firewood – 2.6%, plywood and veneer – 2.6%.67
63 „National Report on the Condition of Environment”, LEGMC, 2009
http://www.meteo.lv/public/27240.html 64 LEGMC 65 “Agriculture and Rural Areal of Latvia, 2008. Annual report for 2007”, Ministry of Agriculture , http://www.zm.gov.lv/?sadala=739 66 “Agriculture and Rural Areal of Latvia, 2009 Annual report for 2008”, Ministry of Agriculture , http://www.zm.gov.lv/?sadala=739 67 “Statistical Yearbook of Latvia”, Central Statistical Bureau of Latvia., 2008
Biomass stocks (mil.m3) Wood production (thsnd.m3)
Biomass stocks (mil.m3) Wood production (thsnd.m3)
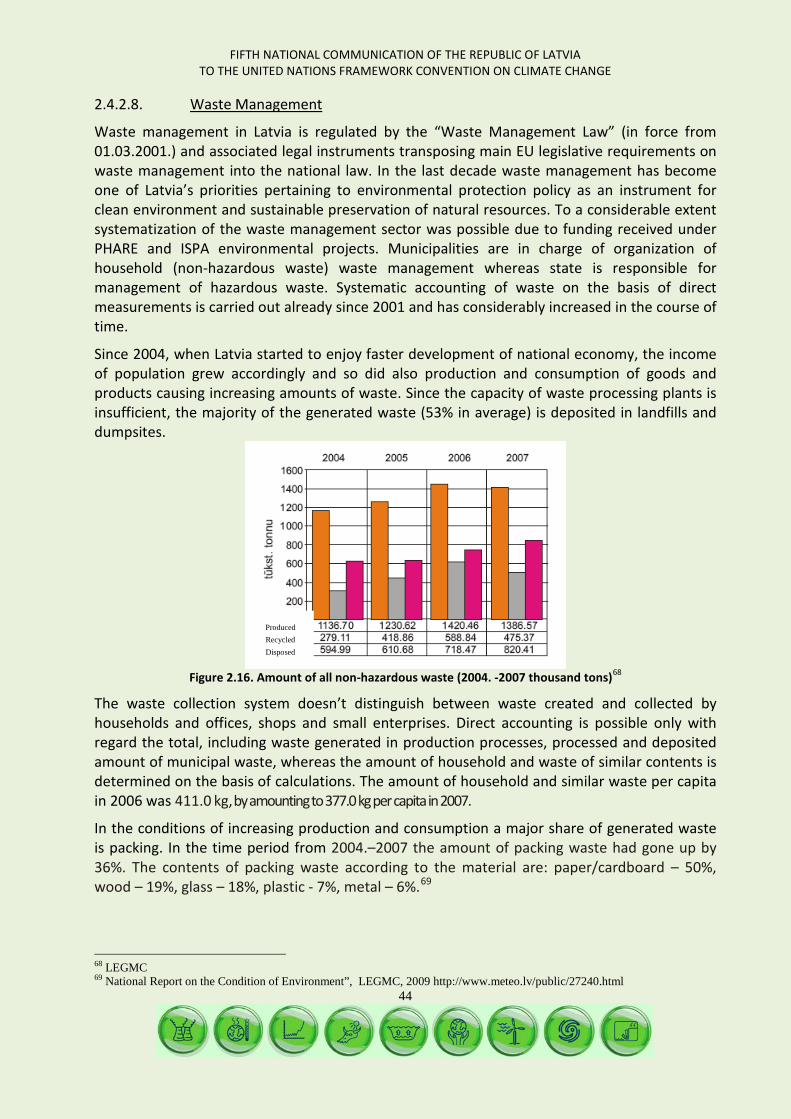
FIFTH NATIONAL COMMUNICATION OF THE REPUBLIC OF LATVIA TO THE UNITED NATIONS FRAMEWORK CONVENTION ON CLIMATE CHANGE
44
2.4.2.8. Waste Management
Waste management in Latvia is regulated by the “Waste Management Law” (in force from 01.03.2001.) and associated legal instruments transposing main EU legislative requirements on waste management into the national law. In the last decade waste management has become one of Latvia’s priorities pertaining to environmental protection policy as an instrument for clean environment and sustainable preservation of natural resources. To a considerable extent systematization of the waste management sector was possible due to funding received under PHARE and ISPA environmental projects. Municipalities are in charge of organization of household (non-hazardous waste) waste management whereas state is responsible for management of hazardous waste. Systematic accounting of waste on the basis of direct measurements is carried out already since 2001 and has considerably increased in the course of time.
Since 2004, when Latvia started to enjoy faster development of national economy, the income of population grew accordingly and so did also production and consumption of goods and products causing increasing amounts of waste. Since the capacity of waste processing plants is insufficient, the majority of the generated waste (53% in average) is deposited in landfills and dumpsites.
Figure 2.16. Amount of all non-hazardous waste (2004. -2007 thousand tons)68
The waste collection system doesn’t distinguish between waste created and collected by households and offices, shops and small enterprises. Direct accounting is possible only with regard the total, including waste generated in production processes, processed and deposited amount of municipal waste, whereas the amount of household and waste of similar contents is determined on the basis of calculations. The amount of household and similar waste per capita in 2006 was 411.0 kg, by amounting to 377.0 kg per capita in 2007.
In the conditions of increasing production and consumption a major share of generated waste is packing. In the time period from 2004.–2007 the amount of packing waste had gone up by 36%. The contents of packing waste according to the material are: paper/cardboard – 50%, wood – 19%, glass – 18%, plastic - 7%, metal – 6%.69
68 LEGMC
69 National Report on the Condition of Environment”, LEGMC, 2009 http://www.meteo.lv/public/27240.html
Produced
Recycled
Disposed
FIFTH NATIONAL COMMUNICATION OF THE REPUBLIC OF LATVIA TO THE UNITED NATIONS FRAMEWORK CONVENTION ON CLIMATE CHANGE
45
Table 2.12
Amount of Generated and Recycled Packing Waste in 2004 -200770
year
produced packaging (t) recycled packaging (t) recycled (%) 2004 236 600 110 857 46.9 2005 263 833 144 526 54.8 2006 306 838 141 097 43.0 2007 323 123 132 289 40.9
The main directions of development of waste management is completion of construction of the planned landfills complying the requirements for environmental protection and establishment of a system for separate collection and processing of waste and waste separation and composting sites. The national waste management plan for 2006-2012 foresees establishment of 10-11 modern waste landfills by closing down or reconstructing the old dumpsites till 2012. In 2004-2007 there were 64 dumpsites closed and in 2007 there were 84 managed dumpsites.71
Till middle 2008 the integrated permits for the performance of polluting activities were issued to 9 municipal waste and 2 hazardous waste landfills already put into operation. It plays a considerable role in fulfilment of binding EU legislative enactments regulating reduction of the amount of biodegradable wastes deposited in landfills and dumpsites amounting to 57% of the municipal waste of Latvia and also recycling of packing waste. The following targets are to be reached with regard biodegradable municipal waste going to landfills: a reduction of 75% in 2010, 50% in 2013, 35% in 2020 (from the amount of biodegradable waste produced in 1995).
72 Whereas the recycling norms set for paper/paperboard packing are: 2005 - 56% (53% recycling; 3% energy generation); 2007 - 67% (59% - recycling and 8% energy generation).73
Biogas collection facilities are operated by two landfills - Getlini landfill of Riga district and Kivites Landfill of city Liepaja that are also equipped with energy blocks for generation of energy. An underestimated source for production of biogas is sludge accumulated during wastewater treatment process. Production of biogas by anaerobic digestion of sewage sludge further used for generation of electrical and heating energy in cogeneration stations is carried out only in the waste water purification plant “Daugavgriva” in Riga city.
To improve the environmental infrastructure, especially water and waste management, development projects co-financed by the EU Cohesion Fund and the ERDF were implemented in the time period from 2006 – 2008. With the support of the Cohesion Fund 52 old landfills with the total area of 75 ha and not meeting environmental protection standards were re-cultivated and implementation of 7 other waste management projects was continued.
Another 41 projects have been implemented thanks to the financial aid of the ERDF - in total 40 biological wastewater treatment plants have been reconstructed or built a new.74
70 LEGMC
71 LEGMC, reports „Waste Management” http://www.meteo.lv/public/28759.html 72 European Parliament and Council Directive 1999/31/EC on the landfill of waste 73 European Parliament and Council Directive 94/62/EC on packing and packing waste. 74 “Report on Progress in Implementation of the National Lisbon Programme of Latvia for 2005 – 2008”. Ministry of Economics, 2007, http://www.em.gov.lv/em/2nd/?cat=48
FIFTH NATIONAL COMMUNICATION OF THE REPUBLIC OF LATVIA TO THE UNITED NATIONS FRAMEWORK CONVENTION ON CLIMATE CHANGE
46
3. GREENHOUSE GAS INVENTORY INFORMATION
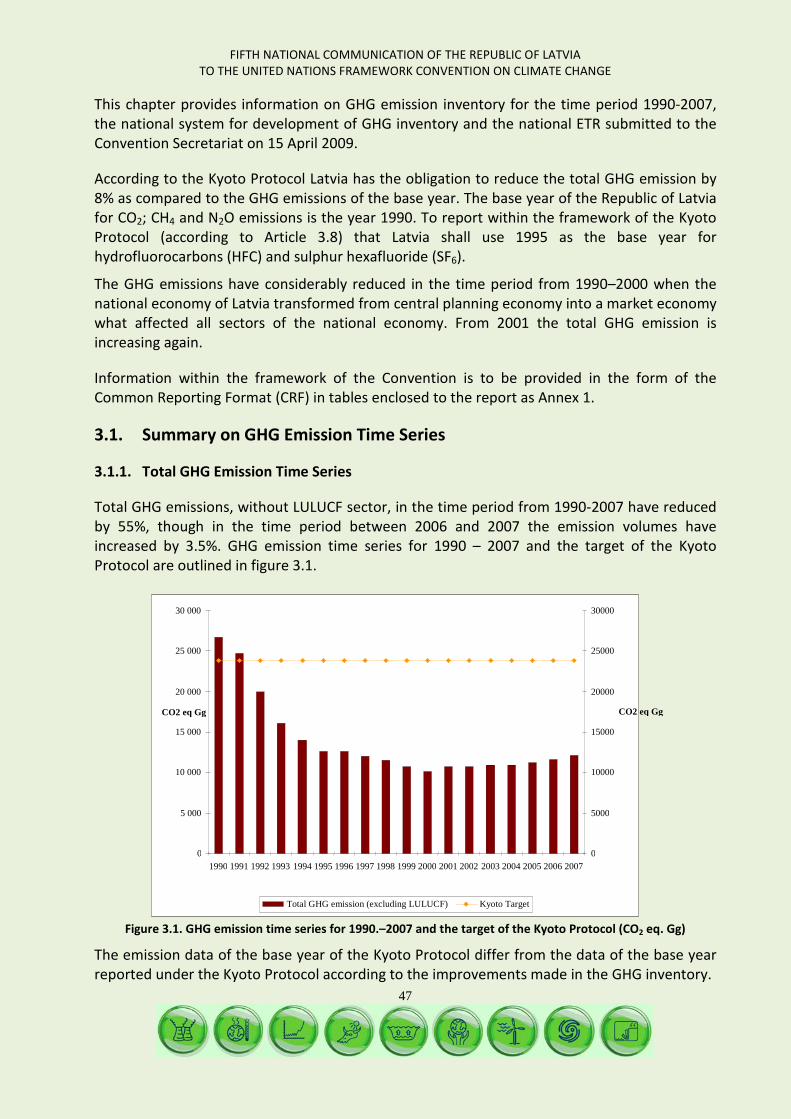
FIFTH NATIONAL COMMUNICATION OF THE REPUBLIC OF LATVIA TO THE UNITED NATIONS FRAMEWORK CONVENTION ON CLIMATE CHANGE
47
This chapter provides information on GHG emission inventory for the time period 1990-2007, the national system for development of GHG inventory and the national ETR submitted to the Convention Secretariat on 15 April 2009.
According to the Kyoto Protocol Latvia has the obligation to reduce the total GHG emission by 8% as compared to the GHG emissions of the base year. The base year of the Republic of Latvia for CO2; CH4 and N2O emissions is the year 1990. To report within the framework of the Kyoto Protocol (according to Article 3.8) that Latvia shall use 1995 as the base year for hydrofluorocarbons (HFC) and sulphur hexafluoride (SF6).
The GHG emissions have considerably reduced in the time period from 1990–2000 when the national economy of Latvia transformed from central planning economy into a market economy what affected all sectors of the national economy. From 2001 the total GHG emission is increasing again.
Information within the framework of the Convention is to be provided in the form of the Common Reporting Format (CRF) in tables enclosed to the report as Annex 1.
3.1. Summary on GHG Emission Time Series
3.1.1. Total GHG Emission Time Series
Total GHG emissions, without LULUCF sector, in the time period from 1990-2007 have reduced by 55%, though in the time period between 2006 and 2007 the emission volumes have increased by 3.5%. GHG emission time series for 1990 – 2007 and the target of the Kyoto Protocol are outlined in figure 3.1.
Figure 3.1. GHG emission time series for 1990.–2007 and the target of the Kyoto Protocol (CO2 eq. Gg)
The emission data of the base year of the Kyoto Protocol differ from the data of the base year reported under the Kyoto Protocol according to the improvements made in the GHG inventory.
0
5 000
10 000
15 000
20 000
25 000
30 000
1990 1991 1992 1993 1994 1995 1996 1997 1998 1999 2000 2001 2002 2003 2004 2005 2006 2007
CO2 eq Gg
0
5000
10000
15000
20000
25000
30000
CO2 eq Gg
Total GHG emission (excluding LULUCF) Kyoto Target
FIFTH NATIONAL COMMUNICATION OF THE REPUBLIC OF LATVIA TO THE UNITED NATIONS FRAMEWORK CONVENTION ON CLIMATE CHANGE
48
The major source of GHG in 2007, excluding LULUCF, was CO2 (8 608 thousand tons), accounting for 71.5% from the total emission, accordingly CH4 constituted 15%, N2O – 13%, and fluorated gases – 0.5% from total emission.
The energy sector caused 73% from total GHG emissions, agriculture - 17%, waste management – 6.9%, industrial processes – 2.6%, use of solvents and other products – 0.5%.
The main sources of GHG emission and CO2 removals in the time period from 1990 – 2007 are outlined in table 3.1, whereas the amounts of emissions per sectors of national economy are provided in table 3.2.
Energy sector, transport including is the largest source of GHG emissions and accounts for 73% of the total emissions for 2007. In recent years the emission amount has stabilized, though with the tendency to increase. The emission increase can be largely explained with the increasing amount of transport vehicles, what explains the rising emissions in the transport sector, which generates 31.7% from the total emissions and 43.3% from the total emissions in the energy sector. The emissions from transport have increased by 9.5% as compared to 2006. The largest source of CO2 emissions in the energy sector are burning of natural gas in the public and private sector what can be explained with the increasing demand for electrical energy and heat. The increasing consumption of natural gas can be explained with replacement of the type of fuel used - from liquid and solid fuels to natural gas, affected by the price and availability of natural gas and also by the local legislation regulating the amount of sulphur in liquid fuels and the fact that the majority of large enterprises have joined the EU ETS. The rapid development of manufacturing and construction is another factor affecting increasing emission volumes from the energy sector.
Agriculture is the second largest emission source accounting for around 17% of total emission volume of Latvia. Compared to 1990, emission volume in 2007 had declined by 65% - mainly due to restructuring of the national economy, reducing output of farms and dissolution of large farms. Increase/reduction of emissions is affected by fluctuations in the number of breeding stock, and also by the amount of fertilizers used.
In 2007 the industrial processes sector generated ca. 2.6% from the total GHG emissions. The highest emission reduction was experienced in the time period from 1991 – 1993 when the manufacturing sector was facing the crises caused by changes in the political, economic and social situation. Since 2000 total emission volume expressed in CO2 equivalents was increasing because of the growth of the industry sector. The boosting construction sector and the growing wellbeing of local population resulted in strong increase of industrial production what, on its turn, caused increasing demand for the necessary raw materials and so did the volume of total industrial production output.
Use of solvents and other products produce 0.5% from total emissions. The emission amount from this sector is associated with the economic situation in the country and is rather uniform.
As to 2007 as compared to 1999 the GHG emissions from waste management had increased by 0.9%, however, in 2007 as compared to 2006 - the emission rate has gone up by 3.2%, because the total amount of deposited waste had increased. Waste management sector produces ca 6.9% from the total emission amount of Latvia.
FIFTH NATIONAL COMMUNICATION OF THE REPUBLIC OF LATVIA TO THE UNITED NATIONS FRAMEWORK CONVENTION ON CLIMATE CHANGE
49
Forests and soil (meadows) captures and stores atmospheric carbon dioxide, whereas falling of trees and transformation of meadows into arable land cause potential CO2 emissions. Currently Land use, Land use change and forestry sector is a CO2 removal source. As compared to 1999 in 2007 the removal of CO2 had increased by 49%.

FIFTH NATIONAL COMMUNICATION OF THE REPUBLIC OF LATVIA TO THE UNITED NATIONS FRAMEWORK CONVENTION ON CLIMATE CHANGE
50
Table 3.1.
GHG emissions/removals 1990 – 2007 (CO2 equivalents Gg)
GHG emissions 1990 1991 1992 1993 1994 1995 1996 1997 1998 1999 2000 2001 2002 2003 2004 2005 2006 2007
net CO2 from LULUCF*
-2 217 -5 205 -9 843 -12 212 -13 766 -15 044 -15 975 -15 123 -15 142 -15 767 -17 403 -22 537 -18 346 -18 583 -20 428 -20 483 -24 300 -23 411
CO2emissions without net CO2
from LULUCF
19 222 17 611 14 100 11 846 10 334 9 120 9 192 8 664 8 271 7 689 7 054 7 476 7 477 7 648 7 679 7 800 8 287 8 608
CH4 emission including CH4 from
LULUCF 3 670 3 608 3 139 2 306 2 113 2 112 2 074 2 025 1 959 1 866 1 856 1 921 1 931 1 858 1 862 1 905 1 819 1 869
CH4 emission without CH4 from
LULUCF 3 651 3 586 3 104 2 281 2 084 2 076 2 037 1 979 1 908 1 808 1 797 1 888 1 892 1 820 1 828 1 870 1 782 1 837
N2O emission including N2O from
LULUCF 3 807 3 543 2 766 1 951 1 631 1 378 1 395 1 403 1 343 1 238 1 248 1 368 1 362 1 436 1 419 1 517 1 560 1 580
N2O emission without N2O from
LULUCF 3 805 3 540 2 761 1 948 1 628 1 374 1 391 1 398 1 338 1 232 1 242 1 365 1 357 1 431 1 415 1 513 1 554 1 577
HFCs 0 1 2 4 6 8 9 11 13 17 22 40 51 SF6 0 0 1 1 1 1 2 3 4 5 8 7 9
Total emission (including LULUCF)
5 261 1 946 -3 938 -7 955 -10 021 -11 554 -12 505 -11 692 -11 835 -12 657 -14 290 -19 236 -15 039 -15 272 -17 125 -17 031 -20 874 -19 902
Total emission (without LULUCF)
26 679 24 737 19 965 16 075 14 046 12 571 12 622 12 044 11 522 10 736 10 103 10 739 10 740 10 916 10 944 11 213 11 671 12 083
* Land use, land use change and forestry

FIFTH NATIONAL COMMUNICATION OF THE REPUBLIC OF LATVIA TO THE UNITED NATIONS FRAMEWORK CONVENTION ON CLIMATE CHANGE
51
Table 3.2.
GHG emissions/removals per sectors of industry 1990 – 2007 (CO2 equivalent Gg)
1990 1991 1992 1993 1994 1995 1996 1997 1998 1999 2000 2001 2002 2003 2004 2005 2006 2007
1. Energy 19 342 17 834 14 501 12 379 10 770 9 556 9 631 9 067 8 642 8 009 7 389 7 818 7 814 7 958 8 001 8 111 8 546 8 827
2. Manufacturing industries 510 431 189 46 132 145 145 152 158 191 148 166 182 199 210 234 255 309
3. Solvents and other products 56 51 49 46 45 46 48 49 48 49 49 55 53 54 55 54 64 55
4. Agriculture 5 931 5 578 4 429 2 917 2 417 2 131 2 084 2 038 1 913 1 717 1 714 1 855 1 851 1 890 1 856 1 981 1 999 2 059
5. Land use, land use change and forestry
-21 418 -22 791 -23 903 -24 030 -24 067 -24 125 -25 127 -23 736 -23 357 -23 393 -24 392 -29 976 -25 779 -26 188 -28 070 -28 245 -32 545 -31 984
6. Waste management 840 843 796 686 682 693 713 737 761 770 802 845 840 815 823 834 807 833
Total emissions (including LULUCF)
5 261 1 946 -3 938 -7 955 -10 021 -11 554 -12 505 -11 692 -11 835 -12 657 -14 290 -19 236 -15 039 -15 272 -17 125 -17 031 -20 874 -19 902

FIFTH NATIONAL COMMUNICATION OF THE REPUBLIC OF LATVIA TO THE UNITED NATIONS FRAMEWORK CONVENTION ON CLIMATE CHANGE
52
3.2. National System
The national system for annual GHG emission inventory is specified in the Cabinet of Ministers Regulations No. 157 adopted on 17 February 2009 “The National Inventory System of Greenhouse Gas Emission Units” (hereinafter – the Cabinet Regulations No.157). The said legislative enactment regulates institutional cooperation for establishment and maintenance of the national GHG inventory system, including data collection mechanism and the reporting procedure.
The national system for GHG emission estimates is established in line with the requirements set forth in the Kyoto Protocol. Main institutions, involved in preparing GHG inventory, their tasks and responsibility is specified in figure 3.2.
The institution in charge of the GHG inventory is the state limited liability company VSIA „Latvian Environment, Geology and Meteorology Centre" (LEGMC), in cooperation with other institutions specified in the Cabinet Regulations No. 157. The GHG inventory is coordinated with the ministries of sectors involved. After approval of the GHG inventory the Ministry of the Environment shall send it to the European Commission via the official representative office in Brussels, and the LEGMC shall upload it to the EEA Central Data Repository.
The GHG inventory information duly approved by the Ministry of the Environment shall be placed by the LVGMC in a special reporting portal of the Convention Secretariat.
The LEGMC shall also prepare the national air pollution emission inventory within the framework of the United Nations Economic Commissions for Europe Convention on Long-Range Transboundary Air Pollution that helps to guarantee coherence of both submittable reports.
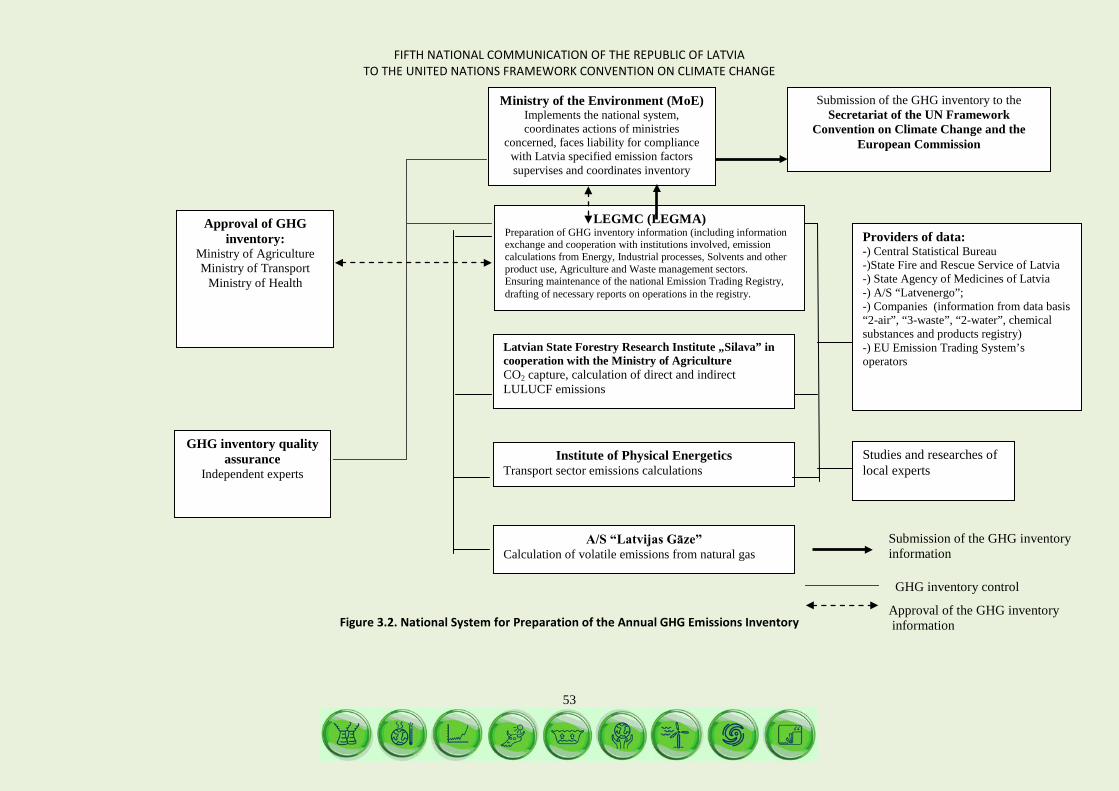
FIFTH NATIONAL COMMUNICATION OF THE REPUBLIC OF LATVIA TO THE UNITED NATIONS FRAMEWORK CONVENTION ON CLIMATE CHANGE
53
Figure 3.2. National System for Preparation of the Annual GHG Emissions Inventory
GHG inventory quality assurance
Independent experts
Submission of the GHG inventory to the Secretariat of the UN Framework
Convention on Climate Change and the European Commission
Approval of GHG inventory:
Ministry of Agriculture Ministry of Transport
Ministry of Health
Ministry of the Environment (MoE) Implements the national system, coordinates actions of ministries
concerned, faces liability for compliance with Latvia specified emission factors supervises and coordinates inventory
LEGMC (LEGMA) Preparation of GHG inventory information (including information exchange and cooperation with institutions involved, emission calculations from Energy, Industrial processes, Solvents and other product use, Agriculture and Waste management sectors. Ensuring maintenance of the national Emission Trading Registry, drafting of necessary reports on operations in the registry.
Latvian State Forestry Research Institute „Silava” in cooperation with the Ministry of Agriculture CO2 capture, calculation of direct and indirect LULUCF emissions
Institute of Physical Energetics Transport sector emissions calculations
Providers of data: -) Central Statistical Bureau -)State Fire and Rescue Service of Latvia -) State Agency of Medicines of Latvia -) A/S “Latvenergo”; -) Companies (information from data basis “2-air”, “3-waste”, “2-water”, chemical substances and products registry) -) EU Emission Trading System’s operators
A/S “Latvijas Gāze” Calculation of volatile emissions from natural gas
Studies and researches of local experts
Approval of the GHG inventory information
Submission of the GHG inventory information GHG inventory control
FIFTH NATIONAL COMMUNICATION OF THE REPUBLIC OF LATVIA TO THE UNITED NATIONS FRAMEWORK CONVENTION ON CLIMATE CHANGE
54
3.2.1. Quality Assurance and Quality Control
According to the Cabinet Regulations No.157 specified above, the institutions involved in GHG inventory are obliged to observe the quality control requirements defined in the Guidelines of the Intergovernmental Panel on Climate Change (IPCC).
The Ministry of the Environment is liable for overall quality control and implementation of the national system for GHG inventory and coordination of international inspections under the Convention. The LEGMC is responsible for coordination of the GHG inventory, including also compliance with quality control procedures. Each of the institutions involved in the GHG inventory is liable for compliance with the quality control requirements.
The following quality control measures shall be implemented during the GHG inventory of 2009:
• Verification of recording (description) of used assumptions and criteria, operational data and emission factors;
• Verification of emission time series; • Verification of the used units of measure; • Verification of data consistency among branch categories.
More detailed information on the applied quality control procedures, including emission factors used for the purpose of the GHG inventory is provided in section 1.6 of the National Inventory Report submitted to the Convention Secretariat on 15 April 2009.
Since publication of the “Fourth National Communication of the Republic of Latvia to the United Nations Framework Convention on Climate Changes” the legislative basis regulating quality control and establishing quality assurance procedures was improved.
3.2.2. Methodology used for the inventory
For the purpose of preparing the GHG inventory information Latvia has used the reporting guidelines75
• Revised 1996 IPCC Guidelines for National Greenhouse Gas Inventories;
referred to in the Convention and also IPCC methodology approved by the conferences of the parties (COP):
76
• Good Practice Guidance and Uncertainty Management in National Greenhouse Gas Inventories (2000);
77
• Good Practice Guidance for Land use, Land- use Change and Forestry (2003).
78
75 http://unfccc.int/resource/docs/2006/sbsta/eng/09.pdf http://unfccc.int/files/national_reports/annex_i_natcom_/application/pdf/nc5outline.pdf 76 http://www.ipcc-nggip.iges.or.jp/public/gl/invs1.htm 77 http://www.ipcc-nggip.iges.or.jp/public/gp/english/gpgaum_en.htm 78 http://www.ipcc-nggip.iges.or.jp/public/gpglulucf/gpglulucf.htm
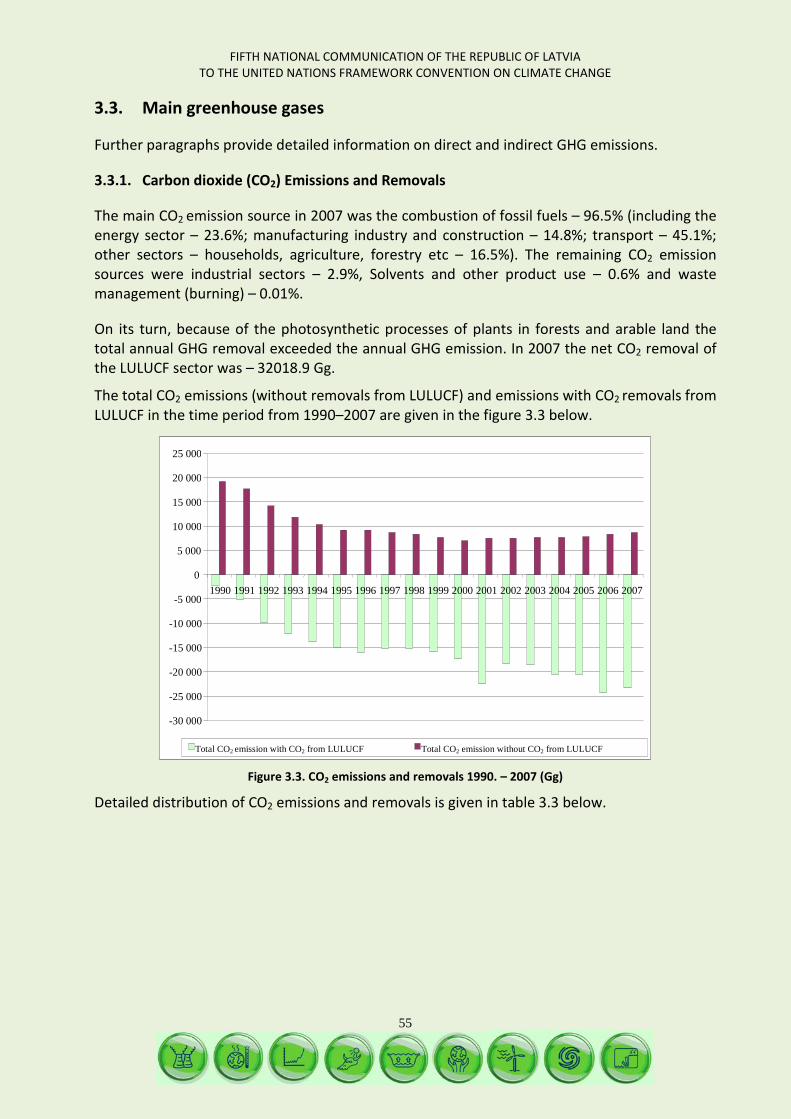
FIFTH NATIONAL COMMUNICATION OF THE REPUBLIC OF LATVIA TO THE UNITED NATIONS FRAMEWORK CONVENTION ON CLIMATE CHANGE
55
3.3. Main greenhouse gases
Further paragraphs provide detailed information on direct and indirect GHG emissions.
3.3.1. Carbon dioxide (CO2) Emissions and Removals
The main CO2 emission source in 2007 was the combustion of fossil fuels – 96.5% (including the energy sector – 23.6%; manufacturing industry and construction – 14.8%; transport – 45.1%; other sectors – households, agriculture, forestry etc – 16.5%). The remaining CO2 emission sources were industrial sectors – 2.9%, Solvents and other product use – 0.6% and waste management (burning) – 0.01%.
On its turn, because of the photosynthetic processes of plants in forests and arable land the total annual GHG removal exceeded the annual GHG emission. In 2007 the net CO2 removal of the LULUCF sector was – 32018.9 Gg.
The total CO2 emissions (without removals from LULUCF) and emissions with CO2 removals from LULUCF in the time period from 1990–2007 are given in the figure 3.3 below.
Figure 3.3. CO2 emissions and removals 1990. – 2007 (Gg)
Detailed distribution of CO2 emissions and removals is given in table 3.3 below.
-30 000
-25 000
-20 000
-15 000
-10 000
-5 000
0
5 000
10 000
15 000
20 000
25 000
1990 1991 1992 1993 1994 1995 1996 1997 1998 1999 2000 2001 2002 2003 2004 2005 2006 2007
Total CO2 emission with CO2 from LULUCF Total CO2 emission without CO2 from LULUCF
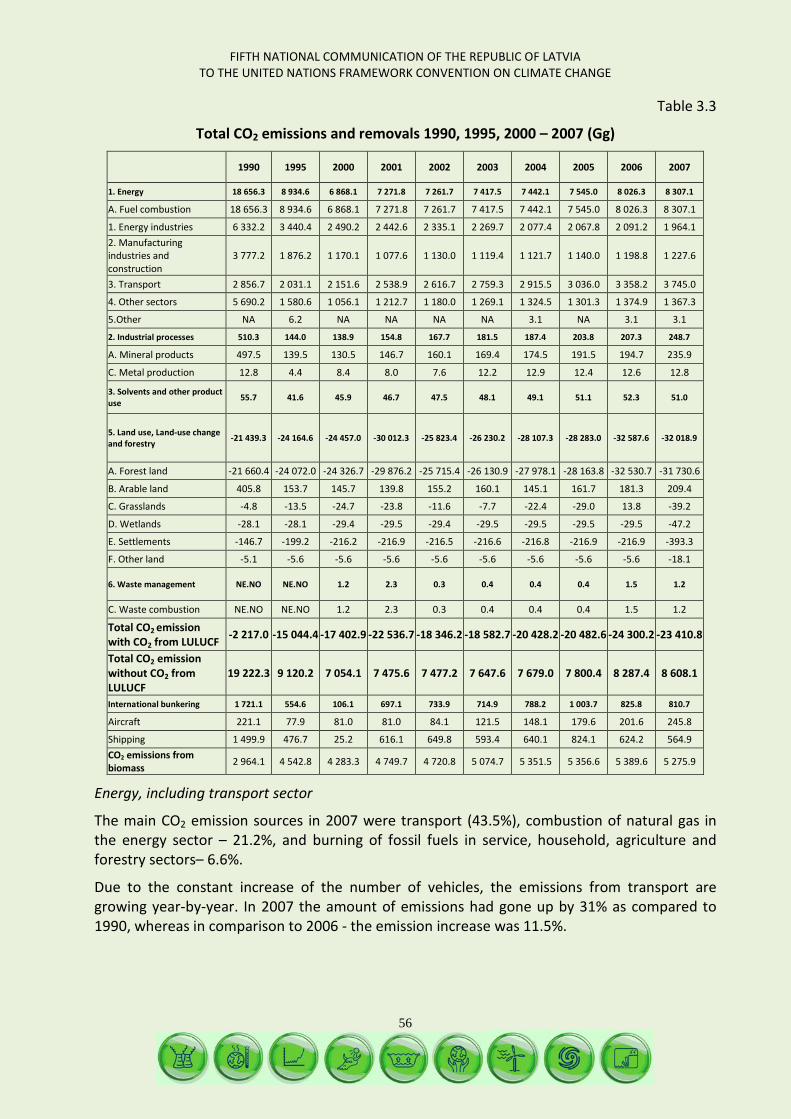
FIFTH NATIONAL COMMUNICATION OF THE REPUBLIC OF LATVIA TO THE UNITED NATIONS FRAMEWORK CONVENTION ON CLIMATE CHANGE
56
Table 3.3
Total CO2 emissions and removals 1990, 1995, 2000 – 2007 (Gg)
1990 1995 2000 2001 2002 2003 2004 2005 2006 2007
1. Energy 18 656.3 8 934.6 6 868.1 7 271.8 7 261.7 7 417.5 7 442.1 7 545.0 8 026.3 8 307.1
A. Fuel combustion 18 656.3 8 934.6 6 868.1 7 271.8 7 261.7 7 417.5 7 442.1 7 545.0 8 026.3 8 307.1
1. Energy industries 6 332.2 3 440.4 2 490.2 2 442.6 2 335.1 2 269.7 2 077.4 2 067.8 2 091.2 1 964.1 2. Manufacturing industries and construction
3 777.2 1 876.2 1 170.1 1 077.6 1 130.0 1 119.4 1 121.7 1 140.0 1 198.8 1 227.6
3. Transport 2 856.7 2 031.1 2 151.6 2 538.9 2 616.7 2 759.3 2 915.5 3 036.0 3 358.2 3 745.0
4. Other sectors 5 690.2 1 580.6 1 056.1 1 212.7 1 180.0 1 269.1 1 324.5 1 301.3 1 374.9 1 367.3
5.Other NA 6.2 NA NA NA NA 3.1 NA 3.1 3.1
2. Industrial processes 510.3 144.0 138.9 154.8 167.7 181.5 187.4 203.8 207.3 248.7
A. Mineral products 497.5 139.5 130.5 146.7 160.1 169.4 174.5 191.5 194.7 235.9
C. Metal production 12.8 4.4 8.4 8.0 7.6 12.2 12.9 12.4 12.6 12.8
3. Solvents and other product use 55.7 41.6 45.9 46.7 47.5 48.1 49.1 51.1 52.3 51.0
5. Land use, Land-use change and forestry -21 439.3 -24 164.6 -24 457.0 -30 012.3 -25 823.4 -26 230.2 -28 107.3 -28 283.0 -32 587.6 -32 018.9
A. Forest land -21 660.4 -24 072.0 -24 326.7 -29 876.2 -25 715.4 -26 130.9 -27 978.1 -28 163.8 -32 530.7 -31 730.6
B. Arable land 405.8 153.7 145.7 139.8 155.2 160.1 145.1 161.7 181.3 209.4
C. Grasslands -4.8 -13.5 -24.7 -23.8 -11.6 -7.7 -22.4 -29.0 13.8 -39.2
D. Wetlands -28.1 -28.1 -29.4 -29.5 -29.4 -29.5 -29.5 -29.5 -29.5 -47.2
E. Settlements -146.7 -199.2 -216.2 -216.9 -216.5 -216.6 -216.8 -216.9 -216.9 -393.3
F. Other land -5.1 -5.6 -5.6 -5.6 -5.6 -5.6 -5.6 -5.6 -5.6 -18.1
6. Waste management NE.NO NE.NO 1.2 2.3 0.3 0.4 0.4 0.4 1.5 1.2
C. Waste combustion NE.NO NE.NO 1.2 2.3 0.3 0.4 0.4 0.4 1.5 1.2
Total CO2 emission with CO2 from LULUCF -2 217.0 -15 044.4 -17 402.9 -22 536.7 -18 346.2 -18 582.7 -20 428.2 -20 482.6 -24 300.2 -23 410.8
Total CO2 emission without CO2 from LULUCF
19 222.3 9 120.2 7 054.1 7 475.6 7 477.2 7 647.6 7 679.0 7 800.4 8 287.4 8 608.1
International bunkering 1 721.1 554.6 106.1 697.1 733.9 714.9 788.2 1 003.7 825.8 810.7
Aircraft 221.1 77.9 81.0 81.0 84.1 121.5 148.1 179.6 201.6 245.8
Shipping 1 499.9 476.7 25.2 616.1 649.8 593.4 640.1 824.1 624.2 564.9 CO2 emissions from biomass 2 964.1 4 542.8 4 283.3 4 749.7 4 720.8 5 074.7 5 351.5 5 356.6 5 389.6 5 275.9
Energy, including transport sector
The main CO2 emission sources in 2007 were transport (43.5%), combustion of natural gas in the energy sector – 21.2%, and burning of fossil fuels in service, household, agriculture and forestry sectors– 6.6%.
Due to the constant increase of the number of vehicles, the emissions from transport are growing year-by-year. In 2007 the amount of emissions had gone up by 31% as compared to 1990, whereas in comparison to 2006 - the emission increase was 11.5%.

FIFTH NATIONAL COMMUNICATION OF THE REPUBLIC OF LATVIA TO THE UNITED NATIONS FRAMEWORK CONVENTION ON CLIMATE CHANGE
57
Industrial processes
In 2007 the second largest amount of CO2 emissions that are not related to energy sector in Latvia’s industry originated from production of mineral products (production of cement, clinker, lime, bricks and ceramic tiles) generating 95% of the total CO2 emissions from industrial processes.
Land use, land-use change and forestry
In 2009 the CO2 emissions and removals from LULUCF submitted to the Convention Secretariat were recalculated by applying a single methodology for all time series.
In 2007 the CO2 removals from LULUCF had increased by 49% in comparison to 1990. The largest sources of CO2 removal were forest lands constituting 99% of the total CO2 removal.
3.3.2. Methane (CH4) Emissions
The emissions of the second most important GHG - methane CH4 (with/without LULUCF sector) in 2007 as compared to 1990 had decreased by almost 49% (see figure 3.4 and table 3.4.).
Main CH4 emission sources are solid municipal waste landfills and enteric fermentation processes of livestock and also leakage from natural gas pipeline systems.
Figure 3.4 CH4 emissions 1990 – 2007 (Gg)
0
20
40
60
80
100
120
140
160
180
200
1990 1991 1992 1993 1994 1995 1996 1997 1998 1999 2000 2001 2002 2003 2004 2005 2006 2007
Total CH4 emissions with removals Total CH4 emissions without removals
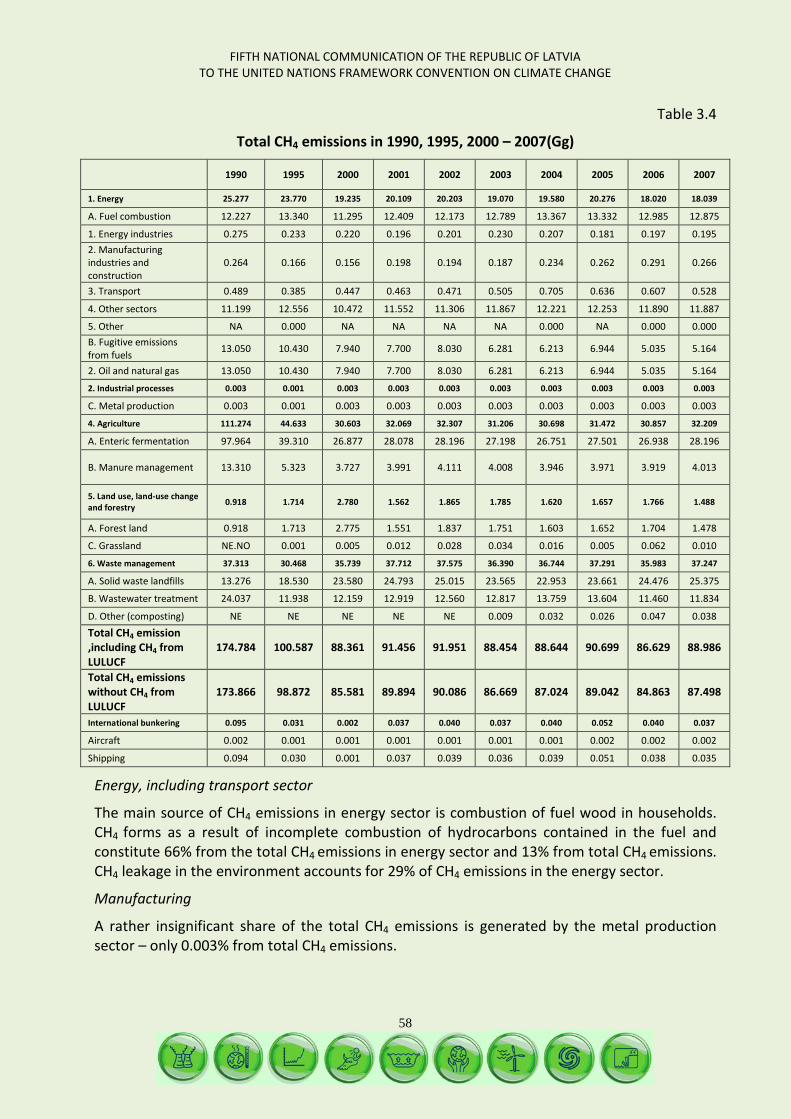
FIFTH NATIONAL COMMUNICATION OF THE REPUBLIC OF LATVIA TO THE UNITED NATIONS FRAMEWORK CONVENTION ON CLIMATE CHANGE
58
Table 3.4
Total CH4 emissions in 1990, 1995, 2000 – 2007(Gg)
1990 1995 2000 2001 2002 2003 2004 2005 2006 2007
1. Energy 25.277 23.770 19.235 20.109 20.203 19.070 19.580 20.276 18.020 18.039
A. Fuel combustion 12.227 13.340 11.295 12.409 12.173 12.789 13.367 13.332 12.985 12.875
1. Energy industries 0.275 0.233 0.220 0.196 0.201 0.230 0.207 0.181 0.197 0.195 2. Manufacturing industries and construction
0.264 0.166 0.156 0.198 0.194 0.187 0.234 0.262 0.291 0.266
3. Transport 0.489 0.385 0.447 0.463 0.471 0.505 0.705 0.636 0.607 0.528
4. Other sectors 11.199 12.556 10.472 11.552 11.306 11.867 12.221 12.253 11.890 11.887
5. Other NA 0.000 NA NA NA NA 0.000 NA 0.000 0.000 B. Fugitive emissions from fuels 13.050 10.430 7.940 7.700 8.030 6.281 6.213 6.944 5.035 5.164
2. Oil and natural gas 13.050 10.430 7.940 7.700 8.030 6.281 6.213 6.944 5.035 5.164
2. Industrial processes 0.003 0.001 0.003 0.003 0.003 0.003 0.003 0.003 0.003 0.003
C. Metal production 0.003 0.001 0.003 0.003 0.003 0.003 0.003 0.003 0.003 0.003
4. Agriculture 111.274 44.633 30.603 32.069 32.307 31.206 30.698 31.472 30.857 32.209
A. Enteric fermentation 97.964 39.310 26.877 28.078 28.196 27.198 26.751 27.501 26.938 28.196
B. Manure management 13.310 5.323 3.727 3.991 4.111 4.008 3.946 3.971 3.919 4.013
5. Land use, land-use change and forestry 0.918 1.714 2.780 1.562 1.865 1.785 1.620 1.657 1.766 1.488
A. Forest land 0.918 1.713 2.775 1.551 1.837 1.751 1.603 1.652 1.704 1.478
C. Grassland NE.NO 0.001 0.005 0.012 0.028 0.034 0.016 0.005 0.062 0.010
6. Waste management 37.313 30.468 35.739 37.712 37.575 36.390 36.744 37.291 35.983 37.247
A. Solid waste landfills 13.276 18.530 23.580 24.793 25.015 23.565 22.953 23.661 24.476 25.375
B. Wastewater treatment 24.037 11.938 12.159 12.919 12.560 12.817 13.759 13.604 11.460 11.834
D. Other (composting) NE NE NE NE NE 0.009 0.032 0.026 0.047 0.038
Total CH4 emission ,including CH4 from LULUCF
174.784 100.587 88.361 91.456 91.951 88.454 88.644 90.699 86.629 88.986
Total CH4 emissions without CH4 from LULUCF
173.866 98.872 85.581 89.894 90.086 86.669 87.024 89.042 84.863 87.498
International bunkering 0.095 0.031 0.002 0.037 0.040 0.037 0.040 0.052 0.040 0.037
Aircraft 0.002 0.001 0.001 0.001 0.001 0.001 0.001 0.002 0.002 0.002
Shipping 0.094 0.030 0.001 0.037 0.039 0.036 0.039 0.051 0.038 0.035
Energy, including transport sector
The main source of CH4 emissions in energy sector is combustion of fuel wood in households. CH4 forms as a result of incomplete combustion of hydrocarbons contained in the fuel and constitute 66% from the total CH4 emissions in energy sector and 13% from total CH4 emissions. CH4 leakage in the environment accounts for 29% of CH4 emissions in the energy sector.
Manufacturing
A rather insignificant share of the total CH4 emissions is generated by the metal production sector – only 0.003% from total CH4 emissions.
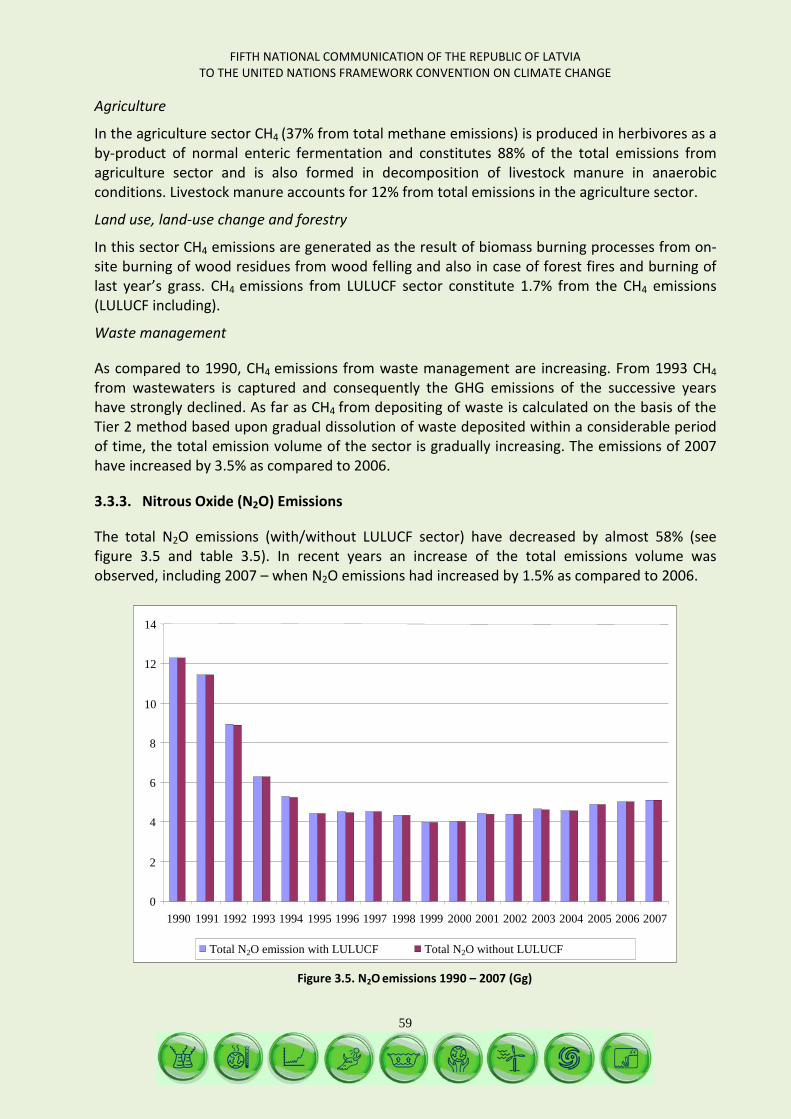
FIFTH NATIONAL COMMUNICATION OF THE REPUBLIC OF LATVIA TO THE UNITED NATIONS FRAMEWORK CONVENTION ON CLIMATE CHANGE
59
Agriculture
In the agriculture sector CH4 (37% from total methane emissions) is produced in herbivores as a by-product of normal enteric fermentation and constitutes 88% of the total emissions from agriculture sector and is also formed in decomposition of livestock manure in anaerobic conditions. Livestock manure accounts for 12% from total emissions in the agriculture sector.
Land use, land-use change and forestry
In this sector CH4 emissions are generated as the result of biomass burning processes from on-site burning of wood residues from wood felling and also in case of forest fires and burning of last year’s grass. CH4 emissions from LULUCF sector constitute 1.7% from the CH4 emissions (LULUCF including).
Waste management
As compared to 1990, CH4 emissions from waste management are increasing. From 1993 CH4 from wastewaters is captured and consequently the GHG emissions of the successive years have strongly declined. As far as CH4 from depositing of waste is calculated on the basis of the Tier 2 method based upon gradual dissolution of waste deposited within a considerable period of time, the total emission volume of the sector is gradually increasing. The emissions of 2007 have increased by 3.5% as compared to 2006.
3.3.3. Nitrous Oxide (N2O) Emissions
The total N2O emissions (with/without LULUCF sector) have decreased by almost 58% (see figure 3.5 and table 3.5). In recent years an increase of the total emissions volume was observed, including 2007 – when N2O emissions had increased by 1.5% as compared to 2006.
Figure 3.5. N2O emissions 1990 – 2007 (Gg)
0
2
4
6
8
10
12
14
1990 1991 1992 1993 1994 1995 1996 1997 1998 1999 2000 2001 2002 2003 2004 2005 2006 2007
Total N2O emission with LULUCF Total N2O without LULUCF
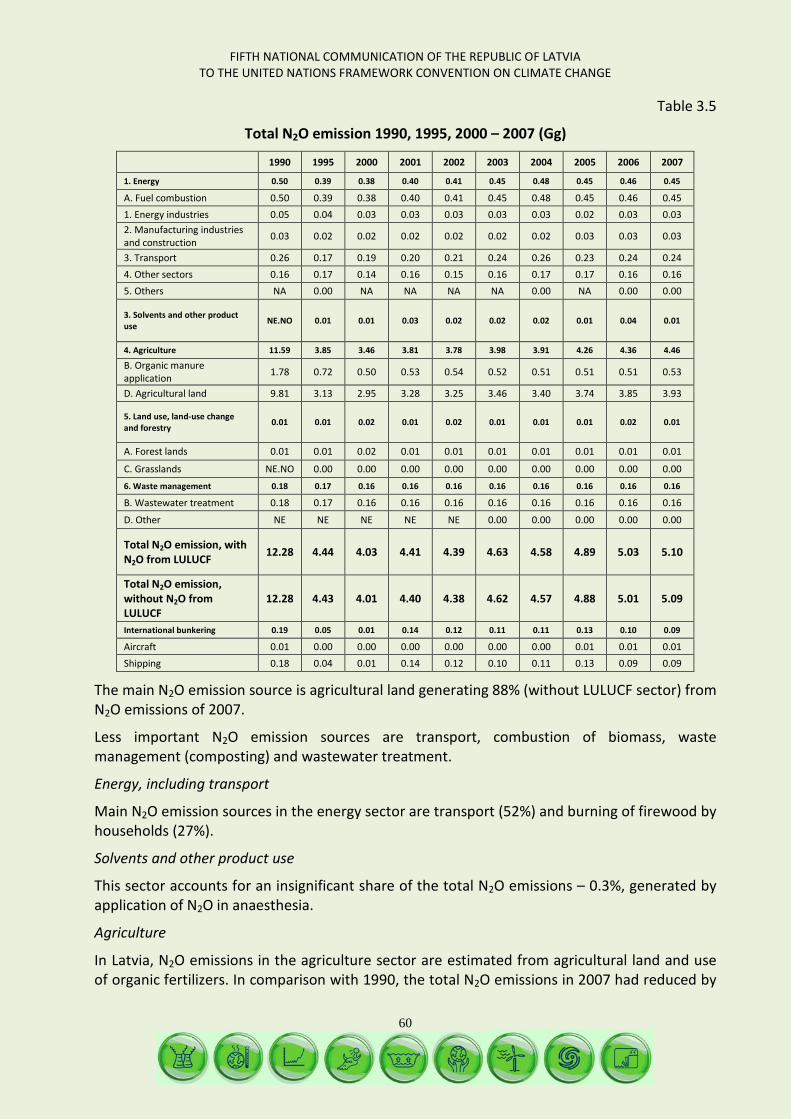
FIFTH NATIONAL COMMUNICATION OF THE REPUBLIC OF LATVIA TO THE UNITED NATIONS FRAMEWORK CONVENTION ON CLIMATE CHANGE
60
Table 3.5
Total N2O emission 1990, 1995, 2000 – 2007 (Gg)
1990 1995 2000 2001 2002 2003 2004 2005 2006 2007
1. Energy 0.50 0.39 0.38 0.40 0.41 0.45 0.48 0.45 0.46 0.45
A. Fuel combustion 0.50 0.39 0.38 0.40 0.41 0.45 0.48 0.45 0.46 0.45 1. Energy industries 0.05 0.04 0.03 0.03 0.03 0.03 0.03 0.02 0.03 0.03 2. Manufacturing industries and construction 0.03 0.02 0.02 0.02 0.02 0.02 0.02 0.03 0.03 0.03
3. Transport 0.26 0.17 0.19 0.20 0.21 0.24 0.26 0.23 0.24 0.24 4. Other sectors 0.16 0.17 0.14 0.16 0.15 0.16 0.17 0.17 0.16 0.16 5. Others NA 0.00 NA NA NA NA 0.00 NA 0.00 0.00
3. Solvents and other product use NE.NO 0.01 0.01 0.03 0.02 0.02 0.02 0.01 0.04 0.01
4. Agriculture 11.59 3.85 3.46 3.81 3.78 3.98 3.91 4.26 4.36 4.46
B. Organic manure application 1.78 0.72 0.50 0.53 0.54 0.52 0.51 0.51 0.51 0.53
D. Agricultural land 9.81 3.13 2.95 3.28 3.25 3.46 3.40 3.74 3.85 3.93
5. Land use, land-use change and forestry 0.01 0.01 0.02 0.01 0.02 0.01 0.01 0.01 0.02 0.01
A. Forest lands 0.01 0.01 0.02 0.01 0.01 0.01 0.01 0.01 0.01 0.01
C. Grasslands NE.NO 0.00 0.00 0.00 0.00 0.00 0.00 0.00 0.00 0.00 6. Waste management 0.18 0.17 0.16 0.16 0.16 0.16 0.16 0.16 0.16 0.16
B. Wastewater treatment 0.18 0.17 0.16 0.16 0.16 0.16 0.16 0.16 0.16 0.16
D. Other NE NE NE NE NE 0.00 0.00 0.00 0.00 0.00
Total N2O emission, with N2O from LULUCF 12.28 4.44 4.03 4.41 4.39 4.63 4.58 4.89 5.03 5.10
Total N2O emission, without N2O from LULUCF
12.28 4.43 4.01 4.40 4.38 4.62 4.57 4.88 5.01 5.09
International bunkering 0.19 0.05 0.01 0.14 0.12 0.11 0.11 0.13 0.10 0.09
Aircraft 0.01 0.00 0.00 0.00 0.00 0.00 0.00 0.01 0.01 0.01 Shipping 0.18 0.04 0.01 0.14 0.12 0.10 0.11 0.13 0.09 0.09
The main N2O emission source is agricultural land generating 88% (without LULUCF sector) from N2O emissions of 2007.
Less important N2O emission sources are transport, combustion of biomass, waste management (composting) and wastewater treatment.
Energy, including transport
Main N2O emission sources in the energy sector are transport (52%) and burning of firewood by households (27%).
Solvents and other product use
This sector accounts for an insignificant share of the total N2O emissions – 0.3%, generated by application of N2O in anaesthesia.
Agriculture
In Latvia, N2O emissions in the agriculture sector are estimated from agricultural land and use of organic fertilizers. In comparison with 1990, the total N2O emissions in 2007 had reduced by
FIFTH NATIONAL COMMUNICATION OF THE REPUBLIC OF LATVIA TO THE UNITED NATIONS FRAMEWORK CONVENTION ON CLIMATE CHANGE
61
62%. The main share of N2O emissions was generated by agriculture land - 88% and mainly because of increased use of mineral fertilizers.
Land use, land-use change and forestry
N2O emissions in this sector originate from on-site burning of wood residues from forest felling and in cases of forest fire or burning of last year's grass. N2O emissions from LULUCF constitute 0.2% from the total N2O emissions.
Waste management
Main N2O emission sources from waste management sector are wastewater processing and waste composting generating 3.1% and 0.1% from N2O emission accordingly.
3.3.4. Hydrofluorocarbons (HFC) and Sulphur Hexafluoride (SF6) Emissions
Emissions for the following hydrofluorocarbons (fluorated gases) are estimated in Latvia: HFC-134a, HFC-23, HFC – 125, HFC – 143a, HFC – 152, HFC – 227ea, and also SF6. The most popular gas is HFC-134a, applied in stationary freezing devices and car conditioners. Although the amount of fluorated gases and the emissions caused by such are rather small, the meaning of the said cannot be underestimated in the light of the GHG Global Warming Potential.
From 1995 the emission of fluorated gases is increasing year-by-year (1995. – 0.54 Gg CO2 eq. 2007. – 60.04 Gg CO2 eq.). The reasons behind such increase are: growth in the living standard, increasing number of new cars and overall development of the national economy.
3.4. Indirect GHG Emissions
In the time period 1990–2000 the amount of indirect emissions had reduced (see table 3.6) though starting with 2001 NOx, NMVOC and CO emissions had the tendency to increase due to more rapid use of firewood in the household sector and fuel consumption in the transport sector. The emissions of SO2 have considerably reduced due to replacement of the used type of fuel – more popular are becoming such types of fuel as natural gas and biomass with practically no sulphur contents.
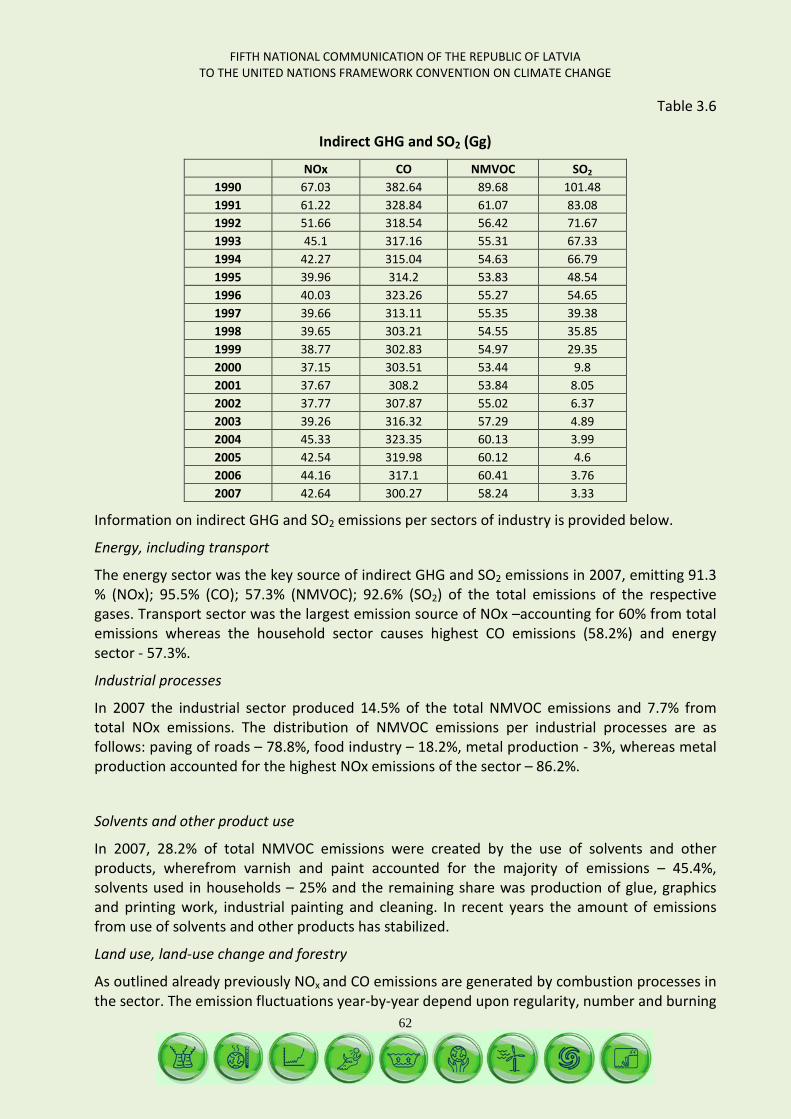
FIFTH NATIONAL COMMUNICATION OF THE REPUBLIC OF LATVIA TO THE UNITED NATIONS FRAMEWORK CONVENTION ON CLIMATE CHANGE
62
Table 3.6
Indirect GHG and SO2 (Gg)
NOx CO NMVOC SO2 1990 67.03 382.64 89.68 101.48 1991 61.22 328.84 61.07 83.08 1992 51.66 318.54 56.42 71.67 1993 45.1 317.16 55.31 67.33 1994 42.27 315.04 54.63 66.79 1995 39.96 314.2 53.83 48.54 1996 40.03 323.26 55.27 54.65 1997 39.66 313.11 55.35 39.38 1998 39.65 303.21 54.55 35.85 1999 38.77 302.83 54.97 29.35 2000 37.15 303.51 53.44 9.8 2001 37.67 308.2 53.84 8.05 2002 37.77 307.87 55.02 6.37 2003 39.26 316.32 57.29 4.89 2004 45.33 323.35 60.13 3.99 2005 42.54 319.98 60.12 4.6 2006 44.16 317.1 60.41 3.76 2007 42.64 300.27 58.24 3.33
Information on indirect GHG and SO2 emissions per sectors of industry is provided below.
Energy, including transport
The energy sector was the key source of indirect GHG and SO2 emissions in 2007, emitting 91.3 % (NOx); 95.5% (CO); 57.3% (NMVOC); 92.6% (SO2) of the total emissions of the respective gases. Transport sector was the largest emission source of NOx –accounting for 60% from total emissions whereas the household sector causes highest CO emissions (58.2%) and energy sector - 57.3%.
Industrial processes
In 2007 the industrial sector produced 14.5% of the total NMVOC emissions and 7.7% from total NOx emissions. The distribution of NMVOC emissions per industrial processes are as follows: paving of roads – 78.8%, food industry – 18.2%, metal production - 3%, whereas metal production accounted for the highest NOx emissions of the sector – 86.2%.
Solvents and other product use
In 2007, 28.2% of total NMVOC emissions were created by the use of solvents and other products, wherefrom varnish and paint accounted for the majority of emissions – 45.4%, solvents used in households – 25% and the remaining share was production of glue, graphics and printing work, industrial painting and cleaning. In recent years the amount of emissions from use of solvents and other products has stabilized.
Land use, land-use change and forestry
As outlined already previously NOx and CO emissions are generated by combustion processes in the sector. The emission fluctuations year-by-year depend upon regularity, number and burning
FIFTH NATIONAL COMMUNICATION OF THE REPUBLIC OF LATVIA TO THE UNITED NATIONS FRAMEWORK CONVENTION ON CLIMATE CHANGE
63
area of not controlled burning processes. The CO emissions in 2007 as compared to 2006 had reduced by 28% and NOx by 24% accordingly.
Waste management
The waste sector produces a comparatively small amount of indirect GHG and SO2 emissions. For example, in 2007 NOx, NMVOC and SO2 generated by the waste management sector accounted only for 0.01% from total emissions.
3.5. Accuracy/Inaccuracy of Data
Accuracy calculations are performed in accordance with the Tier 1 method. The assessment of inaccuracy of data and emission factors is based upon the estimates of the experts of each sector. A detailed description of inaccuracy calculations is included in the National Inventory Report submitted to the Convention Secretariat on 15 April 2009.
3.6. Changes after Publication of the Fourth National Communication
After publication of the „Fourth National Communication of the Republic of Latvia to the United Nations Framework Convention on Climate Change” improvements affecting the emission time series were introduced in the GHG inventory. The total GHG emission reduction for the time period 1990 - 2003 published in the fourth national communication was 58.6%, though, in the inventory information submitted in 2009 – 59.1% Accordingly, the difference in emission reduction calculations is not big – 0.5%.
The explanation of the last calculations is included in the national inventory report submitted to the Convention Secretariat on 15 April 2009, and the main changes are outlined in table 3.7.
Table 3.7.
Main changes in the fifth national communication compared to the fourth national communication
Transport sector Change of methodology - from 2004 emission calculations from transport sector are calculated according to the COPERT IV model
Industrial processes Change of the calculation methodology for emissions generated from cement, lime and steel production
Land use, land-use change and forestry sector Adjustment of the activity data – recalculation of CO2 removals for the entire time series on the basis of the forest resources monitoring information.
Agriculture sector Adjustment of operational data – the area of rich organic soils was adjusted – accordingly the amount of N2O emissions changes as well
Waste management
Improved methodology – a more detailed methodology for calculation of CH4 emissions from waste depositing was applied. The calculations comprise also CH4 and N2O emissions from composting of industrial wastes.
FIFTH NATIONAL COMMUNICATION OF THE REPUBLIC OF LATVIA TO THE UNITED NATIONS FRAMEWORK CONVENTION ON CLIMATE CHANGE
64
3.7. National Registry of GHG Emissions
The ETR of Latvia is governed by the applicable EU laws on GHG emission trading by also guaranteeing compliance with the decisions approved in the addendum to the Conference of the Parties serving as the meeting of the Parties to the Kyoto Protocol (13/CMP.1 and 15/CMP.1). The ETR software has been designed and coordinated with the requirements of the Data Exchange Standards for the Registry Systems under the Kyoto Protocol79
According to the Law “On Pollution” Section 324, the national GHG emission units registry shall be established and maintained by the Latvian Environment, Geology and Meteorology Centre, address Maskavas 165, Riga, LV-1019, by enabling the mandatory and voluntary participants of the International Emission Trading System, the possibility to perform in the ETR all permitted operations with emission quotas.
(DES).
The ETR of Latvia for the EU Emission Trading System (ETS) for the time period 2005 - 2007 and the first commitment period of the Kyoto Protocol 2008-2012 was established and developed on the basis of the software licensed by the UK Department of Forest, Environment and Rural Affairs (DEFRA)80
3.7.1. Latvia’s Emission Trading Registry’s Administrator and Contact Information
the so-called GRETA software. The ETR was established in full compliance with the Commission Regulation (EC) No. 2216/2004 for a standardised and secured system of registries pursuant to the Directive 2003/87/EC of the European Parliament and of the Council and Decision No. 280/2004/EC of the European Parliament and of the Council.
According to the procedure set forth in the Commission Regulation (EC) No.2216/2004 for the purpose of maintenance of the national registry the LEGMC has appointed two administrators and also a technical administrator. The contact information of registry administrators has been reported according to the common reporting form together with Latvia’s Initial Report under the Kyoto Protocol and filed to the International Trading Registry technical provider of the system established by the Convention secretariat81 - the International Transaction Log82
3.7.2. Cooperation with other Member States in Maintenance of Latvia’s ETR
(ITL), including reporting on any changes in the composition of the ETR administrators.
On 2005 LEGMC concluded an agreement with DEFRA on purchase and use of GRETA ETR software licence, help desk and receipt of updates. Latvia was joined to the GRETA ETR system during the EU ETS period and on the first (2008) and second (2009) year of the first commitment period of the Kyoto Protocol. The LEGMC provided ETR technical infrastructure (server, connection facilities, licences and certificates) performed installation of the software, all necessary inspections and appointed ETR administrators.
In 2008 the LEGMC concluded a cooperation agreement with the Finnish company “Innofactor ltd” on registry's technical administration services, technical supplies and maintenance of a backup server for restoration of ETR information in case of breakdown or error. Such changes
79 Data Exchange Standards for the Registry Systems under the Kyoto Protocol 80 Department of Forest, Environment and Rural Affairs 81http://unfccc.int/files/national_reports/initial_reports_under_the_kyoto_protocol/application/pdf/latvia_aa_report__unfccc.pdf 82 International Transaction Log
FIFTH NATIONAL COMMUNICATION OF THE REPUBLIC OF LATVIA TO THE UNITED NATIONS FRAMEWORK CONVENTION ON CLIMATE CHANGE
65
were implemented due to lapse of the term of the license agreement executed with DEFRA and change of the licensor of the software product (from 2008 GRETA International Limited (GIL) and imposition of new software use terms unfavourable for the user of the software.
Latvia's ETR is joined with the national ETR’s of other Member States via the ETR server of the European Commission (CITL – Community Independent Transaction Log). Besides, the National Registry of Latvia is also connected to the national registers of other participants of the Kyoto Protocol via the ITL.
3.7.3. Database Structure and the Capacity of Latvia’s ETS
GRETA registry system is implemented using a Microsoft SQL server relational database management system with a dedicated data model for supporting registry operations. The maximum size of a SQL Server 2000 database is: 1,048,516 tera bytes or 50 tera bytes per single file entry. The SQL server database model is also adjustable up to 32 processors with 64 gigabyte memory.
In the time period from 2005– 2007 (EU ETS period) there were two registry’s administrators appointed by the LEGMC and two technical administrators. After signing of the agreement with the Finnish company “Innofactor ltd” the functions of the technical administrators were taken over by the said company. The LEGMC provided two administrators and also availability of IT specialists if necessary (ensuring continuous operation of the ETR technical infrastructure).
3.7.4. Compliance with the Requirements of the Data Exchange Standards for Registry Systems under the Kyoto Protocol
GRETA ETR system which is used in Latvia has been developed for operations within EU ETS, where the ETS of the participants (Member States) have to be fully compatible with DES. The ETR software enables issuance, conversion, external transfers, cancellation, retirement and reconciliation processes using XML data exchange files and web-services as specified in the DES.
In addition, the ETR also contains: 24 hour clean – up, transaction status enquiry, time synchronization, data logging requirements (including transaction log, reconciliation log, Internal Audit Log and Message Archive) and different identified forms as specified in the UN DES document. The registry development team DEFRA / SIEMENS works in close collaboration with ITL administrators and the development team within the UNFCCC Secretariat.
For the first (2008) and second (2009) year of the first commitment period of the Kyoto Protocol Latvia used GRETA ETR software version 3.00.00.0083.
End 2007 LEGMC received “Recommendations for Registry Initialization” on the basis of which a considerable amount of documents were prepared that were sent to the Convention Secretariat for assessment on 23 January 2008. The documentation included Disaster Recovery Plan, Test plan and Test Report, Application Logging Documentation and Version Change Management. In 2008 August – September the Test Plan was completely revised by including the results of ITL and ETR function and procedure inspection cycle.
In first half of 2008 LEGMC completed elaboration of the initialization documentation by receiving 81% out of 100% compliance assessment percentage points what means that no material incompliance with the ETR initiation process was established.
FIFTH NATIONAL COMMUNICATION OF THE REPUBLIC OF LATVIA TO THE UNITED NATIONS FRAMEWORK CONVENTION ON CLIMATE CHANGE
66
Besides, the LEGMC has fulfilled all recommendations and requests set by the international experts which inspected the condition of Latvia within the framework of Latvia’s Initial Report under the Kyoto Protocol.83
According to the “Independent Assessment Report of the National Registry of Latvia" Latvia’s ETR meets all conformity requirements of the Data Exchange Standards. These obligations included adequate transaction procedures; adequate security measures to prevent unauthorized manipulations and adequate measures for data storage and registry recovery.
3.7.5. Minimization of Discrepancies and Transaction Cancellation Procedure
To minimise discrepancies between the Registry and the Transaction Log a common approach adjusted to all EU ETS ETR systems has been adopted. The same approach was adopted for the development of the remaining Kyoto Protocol Registry software functions:
• Communications between the National Registry and the ITL will be via web-services using XML messages;
• If applicable, before forwarding of a request to the ITL for processing. The Registry shall validate data entries against the list of checks. This will help to minimize sending of incorrect information to the ITL for approval;
• All assigned amount units that are involved in a transaction shall be earmarked internally within the Registry, by allocating individual codes, thereby preventing the assigned amount units from being involved in another transaction before a response has been received from the ITL and the current transaction has been completed;
• The web-service that automatically sends the message to the ITL for processing will ensure that a message received acknowledgement is received from the ITL before completing the submission of the message. When no acknowledgement message has been received following a number of retries, the web-service will terminate the submission and roll-back any changes made to the unit blocks that were involved;
• Where a 24 hour clean-up message is received from the ITL, the existing web-service will roll back any pending transactions and the units that were involved, thereby preventing any discrepancies in the unit blocks between the Registry and the ITL;
• In the event of an unforeseen failure, the data discrepancies between the Registry and the ITL can be corrected via a manual intervention function within the Registry. Following this, reconciliation will be performed to validate that the data is in sync between the Registry and the ITL.
3.7.6. Security Measures for Prevention of Unauthorized Manipulations and Operators' Errors
The security measures of the Register are defined in several documents elaborated on the basis of the LEGMC information system security policies instrument. The ETR GRETA system includes several security measures implemented to prevent unauthorized access.
83 http://unfccc.int/documentation/documents/advanced_search/items/3594.php?rec=j&priref=600004606#beg
FIFTH NATIONAL COMMUNICATION OF THE REPUBLIC OF LATVIA TO THE UNITED NATIONS FRAMEWORK CONVENTION ON CLIMATE CHANGE
67
3.7.7. Preventing Unauthorized Access
Access to the Registry is possible only via a Username and a Password – the Username is created by the ETR software itself upon registration in the ETR, though the password is automatically delivered to the e-mail address of the respective user from the ETR software.
The main scope of the LEGMC information source logical data protection is to ensure coordinated availability and management of information. The access control is provided on the basis of the LEGMC operational requirements, safety rules, provisions of the Commission Regulation (EC) No.2216/2004 (21 December 2004) for a standardised and secured system of registries pursuant to Directive 2003/87/EC of the European Parliament and of the Council and Decision No. 280/2004/EC of the European Parliament and of the Council, the applicable Latvian laws, normative enactments and DES recommendations.
The users shall observe the mandatory requirements for password criteria– the password length of at least 10 characters complying with Hypertext Transfer Protocol (HTTP) basic authentication scheme. Every 2 months the ETR software automatically requests the user to change the access password. If the user enters wrong password three times in sequence the access to the user's account is blocked and can be unblocked only by the LEGMC ETR administrator.
The users are prohibited from disclosing one's account identifier and/or password to another person. It is also prohibited to write the password down, send per e-mail in plain text, spell on the phone or disclose otherwise.
To guarantee that only licensed software is used and no unauthorized downloading of software or software tools is admissible. It is recommended to record and maintain information about software downloaded to the PC of the particular user and e.g. verify such information on quarterly basis.
3.7.8. Prevention of Unpermitted Manipulations and Operator’s Errors
Operations to be performed by a particular user in the ETR are controlled via an authorization system preventing unauthorized access to certain functions and operations. All operations performed by a particular user are registered and recorded by the internal control procedures. Any manipulations with the database can be performed via the internal procedures that cannot be directly accessed from the user’s interface and is only an intranet service.
To prevent operator’s errors, the Registry software incorporates the following design:
• Regular validation and control is performed on all user inputs to ensure that only valid details are approved and submitted to the ITL for general approval (processing);
• Repeated confirmation of user input is displayed to help the user to spot any errors that may have been made; and
• An internal process has been implemented for secondary approval for relevant operations before submitting the details to the ITL for processing.
FIFTH NATIONAL COMMUNICATION OF THE REPUBLIC OF LATVIA TO THE UNITED NATIONS FRAMEWORK CONVENTION ON CLIMATE CHANGE
68
3.7.9. Publicly Accessible Information via Latvia’s ETR Users Interface
Only authorized persons (having a username and a password) have access to Latvia’s ETR accounts. With these instruments the user can access to one account only. Only the ETR administrator has access to all ETR information without any limitations.
According to the UN Framework of Climate Change Convention Conference of the Parties decision 13/CMP/1 Annex E Articles 44 – 48 the following information has to be publicly available:
• Article 45 – Information about the accounts opened in Latvia’s Emission trading registry, account types, account holders and contact persons has been published in the Latvia’s Emission trading registry public reports section - http://etrlv.lvgma.gov.lv/Default.aspx?Module=/PublicReports
• Article 46 – There are no Joint Implementation Projects registered in Latvia; • Article 47 – Information of the Kyoto Protocol units in the Latvia’s Emission Trading
registry opened accounts as well as transactions of Kyoto Protocol units is submitted in Standard Electronic Format” (see table 3.8).
Table 3.8.
Information on the Assigned Amount Units in Latvia ETR
AAU – assigned amount units in registry 119182130
EUA_AAU (European Union units) according to Latvia’s National Allocation Plan 16 992 415 EUA_AAU allocated to Latvia’s operators in 2008 according to Latvia’s National Allocation Plan 2 597 744
National Reserve (according to Latvia’s National Allocation Plan) 4 003 695
Commitment Period Reserve (on 15 April 2009) 60 413 328
3.7.10. Measures to Safeguard, Maintain and Recover Data in the Event of a Disaster
Database and application backup
GRETA ETR system ensures automatic registration of transactions in the application software database and in XML format – in transaction registration files.
According to the cooperation agreement with the Finnish company “Innofactor ltd” on backup copy creation procedures, backup copies of the database and transaction registration files are periodically transferred to another site. The backup copies of “Innofactor ltd” can be stored longer than specified in DES and, if necessary, supplied to the LEGMC upon request. The technical infrastructure for use of the registered information is determined by “Innofactor ltd” and meets the standards of the backup system. The desirable standard specified in GRETA ETR software is Microsoft SQL 2000.
Data base and backup copies
Latvia’s ERT has two environments:
1. ETR production (work) environment; 2. ETR pre-production (test) environment.
FIFTH NATIONAL COMMUNICATION OF THE REPUBLIC OF LATVIA TO THE UNITED NATIONS FRAMEWORK CONVENTION ON CLIMATE CHANGE
69
The above mentioned environments were installed on two sets of equipment – two servers for each ETR environment. All four servers are located in the main building of LEGMC, address Maskavas 165, Riga.
Copying of the data of the National Registry was carried out with the purpose of obtaining backup copies making recovery of data on servers and workstations possible after computer breakdown, gross negligence or malicious conduct of the user resulting in full or partial loss or damage of data. Backup copies can also be used as a benchmark for data comparison to establish any changes in the data.
The procedure for making National Registry data backup copies is determined by the Technical administrator of the National Registry on the basis of the classification of the resources and assessment of the eventual risks carried out together with the Registry administrator.
Backup copies are made from the servers of the National Registry - DEFRAWEB and DEFRASQL1 and also the firewall.
The backup copies of the National Registry servers (in case of DEFRASQL1 also backup copies of the data bases of the National Registry) are created on a separate hard disk:
1) To the server DEFRAWEB by means of the Microsoft Backup build-in tool; 2) To the server DEFRASQL1, with the Microsoft SQL Backup build-in back-up tool.
Backups are made every night according to the following plan:
1) Monday: full backup of server data and data base; 2) Tuesday – Saturday: differential backup of server’s data and data base (backup of all
files changed since the last full backup).
Backup copies in the form of a CD are kept for at least 5 years in 2 places at LEGMC:
1. LEGMC main building, address Maskavas 165, Riga – two copies of each CD in two separate rooms
2. LEGMC Lab building, address: Osu 5, Jurmala.
After lapse of the term of 5 years the CD and the respective backup copies are delivered to the State Archive.
Two employees of LEGMC, Technical Department are responsible for making, control and verification of backup copies in EU ETS period and first (2008) and second (2009) commitment year of the Kyoto Protocol. The data records of the backup copies are verified on daily basis. Any deviations from the set norms are inspected and, if necessary, improvements are made.
Use and restoration of backup copies for correction of errors in the National Registry.
Backup copies of the same type are created automatically for all GRETA ETR and no changes in the software pertaining to the process and operations of backup copying have been implemented.
Disaster Recovery Plan
1) LEGMC internal information system networks
All switches used in the technical infrastructure of the Registry have producer’s warranty. All main switches have been duplicated and serve also as backup switches that can handle the
FIFTH NATIONAL COMMUNICATION OF THE REPUBLIC OF LATVIA TO THE UNITED NATIONS FRAMEWORK CONVENTION ON CLIMATE CHANGE
70
network services in case of a hardware failure. The firewall is duplicated in the LEGMC network and in the event of hardware failure, services will be provided without any interruption.
2) External information system networks
The services of external information system networks are provided by the State Information Network Agency (VITA). LEGMC has concluded a service agreement with VITA guaranteeing uninterrupted monitoring of network failures. It is also agreed that VITA will remove any service failures within 2 hours in any case.
3) Server hardware errors
Server problems can occur on hard drives and power supply devices. Both these devices are duplicated in each production environment and any hardware failures cannot cause server shutdown. Both production environment servers have producer's guarantee and support service is available. In case hardware error has resulted in data loss, after solution of the hardware error, the software of the Registry and necessary data are recovered on the basis of the data recovery plan.
In case of breakdown of the main server of the National Registry all operations shall be manually diverted to the second database server.
4) Software errors
Common reasons for data corruption are failed software updates, instalment of security improvements, malfunction of hardware or unexpected server shutdown. Updates of the ETR software used in the 1 and 2 year of the first commitment period under the Kyoto Protocol consisted of three stages:
• First stage - recovery of the operating system and other important ETR functions (may take from 1 – 3 hours for each server + 1 hour for each server for instalment of software);
• Second stage - re-instalment of the Registry (may take up to 2 hours); • Third stage – importing of data from backup copies to the servers and launching them
online (may take 30 - 60 minutes).
5) ETR operational errors
In case there are problems or deviations in the operation of the National Registry, the LEGMC administrator shall report to “Innofactor ltd”. In the event it is impossible to eliminate the errors in the software on the spot, it is reported to the GRETA ETR support service. Detailed information about the activities to be performed has been provided to the ITL and Convention Secretariat within the framework of the ETR initialization procedure.
In case of any discrepancies between ETR and CITL server, the Latvian Registry administrator shall immediately communicate with the CITL support service. Information exchange, database improvements and receipt of necessary assistance (advice) for improvement of listed problems is received and delivered via e-mail.
Recovery plan for hardware breakdown
In comparison to software errors, recovery of operations in case of physical damage of hardware can take much time, therefore it is necessary to organize backup recovery device that would ensure the operations of the Registry.
FIFTH NATIONAL COMMUNICATION OF THE REPUBLIC OF LATVIA TO THE UNITED NATIONS FRAMEWORK CONVENTION ON CLIMATE CHANGE
71
The energy supply facility to the main ETR server room with the total capacity of 10 kW guarantees uninterrupted power supply to the ETR server. This power supply facility ensures power supply for around 15 minutes after interruption of overall power supply.
Information shall be delivered to the e-mail address of the ETR technical administrator in the following cases:
1. Unacceptable changes in the climate regime are established by the climate control system;
2. Power supply interruptions; 3. Unsanctioned entrance in the server room.
In the first (2008) and second (2009) year of the commitment period under the Kyoto Protocol LEGMC had concluded an agreement with “Innofactor ltd” on maintenance of ETR data restoration backup device on the servers of “Innofactor ltd” for cases of breakdown (special media in “Innofactor ltd” MS SQL (for the database) and MS Windows (online software applications). Only specially authorized employees of “Innofactor ltd” are granted unlimited access to Latvia’s ETR database server via an existing IP – limited remote access84
The activities to be implemented in case it is necessary to transfer the operations of the National Registry to the disaster restoration backup media, are laid down in the ETR Disaster Recovery Plan elaborated by the LEGMC and approved by ITL.
connection. Thereby ensuring importing of the backup copy of the database to disaster recovery backup media in the server database on monthly basis.
3.7.11. Test Plans and Test Reports
According to the cooperation agreement with DEFRA, LEGMC received already tested ETR software and there was no need to test the functioning of the ETR software. Should any problems incur in the course of application of the software, all such software problems and shortcomings shall be reported to DEFRA and the support service of the National Registry. Such shortcomings are corrected and after software testing – delivered to the LEGMC.
LEGMC had to test compatibility of the software with ITL and CITL, and also compliance of the software with the requirements of DES and the Commission Regulation (EC) No. 2216/2004 (as amended) (Annex H (from DES) and CITL tests).
All tests are performed in line with the EU ETS / Kyoto protocol Emission Trading Registry test plan drafted by the LEGMC and approved by the ITL and duly communicated to the Convention Secretariat within the framework of the ETR initialization procedure. The annexes of the plan (11 in total) summarize and report on the results of all tests performed.
Latvia’s ETR software successfully passed all DES tests enclosed as Annex H (31 October - 1 November 2007) and also CITL tests (6 June 2008) and series of ITL tests lasting for 5 weeks. The tests were performed in accordance with the Registry testing documentation prepared by the ITL.
Latvia's ETR successfully participated in the second (18 July – 4 August 2008) and also the third (23 September and 26 September 2008) live connection of the ITL to EU ETS - Go-Live with ITL 84 Remote desktop
FIFTH NATIONAL COMMUNICATION OF THE REPUBLIC OF LATVIA TO THE UNITED NATIONS FRAMEWORK CONVENTION ON CLIMATE CHANGE
72
project - a simulation of real going alive of ETR systems. Latvia’s ETR participated in "Going alive of ETR systems with ITL" project held from 29 September - 16 October 2008. After 16 October 2008 the National Registry of Latvia is participating in the International Emission Trading System in uninterrupted mode.
FIFTH NATIONAL COMMUNICATION OF THE REPUBLIC OF LATVIA TO THE UNITED NATIONS FRAMEWORK CONVENTION ON CLIMATE CHANGE
73
4. POLICIES AND MEASURES
FIFTH NATIONAL COMMUNICATION OF THE REPUBLIC OF LATVIA TO THE UNITED NATIONS FRAMEWORK CONVENTION ON CLIMATE CHANGE
74
4.1. Policy Development Process
Policy development process in Latvia is complicated and time-consuming. For the required legislative acts to be adopted a certain procedure, which is stipulated by the Rules of Procedure of the Cabinet of Ministers85 and Rules of Procedure of the Parliament (Saeima).86
4.1.1. Institutions Involved in Development of the Climate Change Policy
The Ministry of Environment is the institution responsible for coordination of compliance with the requirements of the Convention and the Kyoto Protocol in this country.87
The Ministry of the Environment is the leading state administration institution in the area of environment protection, including also mitigation of the climate change. It develops the national environmental policy, organises and coordinates implementation of the environment policy and inclusion of the principles of the environmental policy in policy documents of other industries, as well as coordinates acquisition of funds of the climate change financial instruments. In order to ensure that environment protection requirements are set for certain polluting activities by application of the system of permits, the Ministry of Environment and institutions supervised by it carry out control over implementation of the environmental requirements and compliance to them.
Problems and issues related to development and implementation of the climate change policy are dealt with by the Ministry of Environment, Ministry of Finance, Ministry of Economics, Ministry of Transport, Ministry of Agriculture and institutions supervised by the relevant ministries.
Institutions supervised by the Ministry of the Environment – State Environmental Service, Environment State Bureau and the state limited liability company Latvian Environment, Geology and Meteorology Centre, ensure implementation of the climate policy within framework of their competence.
The goal of the State Environmental Service (SES) is to ensure compliance to regulatory acts in the area of environmental protection and utilisation of natural resources, as well as to promote sustainable utilisation of natural resources and energy. Functions of SES include performance of the state control over environment protection and utilisation of natural resources in the territory of Latvia, the continental shelf of the Baltic Sea and the economic area of the Republic of Latvia according to the procedure stipulated in the regulatory acts. It also carries out control over fishing from Latvian fishing ships in the territorial waters of the EU Member States and international waters.
SES issues and approves permits (licences), technical terms of reference and other administrative acts for utilisation of natural resources and performance of polluting activities, informs the public on the operation of the Service and provides environmental information at the disposal of the Service to the public, as well as participates in emergency situations management.
85 http://www.mk.gov.lv/lv/mk/darbibu-reglamentejosie-dokumenti/kartibas-rullis/ 86 http://www.likumi.lv/doc.php?id=57517 87 Acorrding to Law “On UN General Convention on Climate Change” (adopted on 09.03.1995.), Ordinance of the Cabinet of Ministers No. 462 of 16.08.1995. „On compliance to the Law „On UN General Convention on Climate Change " and the Law “ On Kyoto Protocol of the UN General Convention on Climate Change” (adopted on 30.05.2002.)
FIFTH NATIONAL COMMUNICATION OF THE REPUBLIC OF LATVIA TO THE UNITED NATIONS FRAMEWORK CONVENTION ON CLIMATE CHANGE
75
The Latvian Environment, Geology and Meteorology Centre collects and stores environmental information and provides it to the public, state and municipal institutions, performs environment monitoring, identifies and evaluates mineral deposits, manages hazardous waste sites owned by the state, ensures safe management of radioactive waste and nuclear sites; participates in implementation of the national policies in the areas of geology, meteorology, climatology, hydrology, water and air quality, cross-border air pollution impact, as well as management of radioactive and hazardous waste.
The Environment State Bureau performs environmental impact assessment of planned activities and planning documents, carries out tasks stipulated for it in the Law “On Pollution” in relation to permits of A and B category for performance of polluting activities; reviews applications of natural and legal entities and adopts resolutions in cases when this task is delegated to the Bureau by regulatory acts related to environment protection, as well as ensures provision of information to the public.
The Law „On Pollution” established institutional responsibility for implementation and fulfilment of the environmental policy. Climate change mitigation policy and measures involve all the branches of the national economy, therefore, policies and measures for reduction of GHG emissions and increase of CO2 removal in addition to the Ministry of the Environment are implemented also by the following ministries:
• The Ministry of Foreign Affairs performs required actions for the UN conventions and other international agreements to be valid in the territory of this country, supervises development of the national position on the issues related to the climate change policy and circulation of the relevant information within the European Union, within the framework of its competence;
• The Ministry of Economics develops and implements structural policies of the national economy – policies of industry, building, energy, external economy, internal market (goods and services), business development, investments and consumer protection;
• The Ministry of Agriculture develops policies of agriculture and forestry, as well as organises and coordinates implementation of these policies;
• The Ministry of Transport is responsible for development of environmentally friendly transport system;
• The Ministry of Education and Science develops policies of education and science, as well as organises and coordinates implementation of these policies;
• The Ministry of Finance develops the policy of finance and coordinates its implementation;
• The Ministry of Regional Development and Municipalities ensures appropriate inclusion of requirements of environmental legal acts in planning and implementation of the national environmental policy on the local level.
Involvement of municipalities, scientific institutions and universities, as well as the general public in the area of climate change mitigation also plays an important role.
4.2. National and Regional Programs
During recent years the climate change mitigation policy has been among the priorities in Latvia. In this regard several international legal acts have been adopted and the assumed obligations have to be complied with and fulfilled. The climate policy of Latvia is based upon the
FIFTH NATIONAL COMMUNICATION OF THE REPUBLIC OF LATVIA TO THE UNITED NATIONS FRAMEWORK CONVENTION ON CLIMATE CHANGE
76
EU climate policy, whose basic principles are incorporated in the below listed policy documents and which are implemented by applying new political and economic instruments:
• Climate change mitigation policy for 2005 - 2010
In order to fulfil requirements of the Convention, the Kyoto Protocol and EU legislative acts on climate change in 2005 the Cabinet of Ministers approved “Climate change mitigation policy for 2005 – 2010” (hereinafter referred to as the “Program”) with the long term goal to encourage mitigation of the climate change caused by human activities, i.e. to ensure that starting with 2008, the total amount of GHG emissions in Latvia does not exceed 92% of 1990 level.
The Ministry of the Environment coordinates implementation of the Program. Responsible institutions involved in the Program submit reports on achievement of the set goals and implementation of measures to the Ministry of Environment every second year with the first reports submitted until January 5, 2007. The Ministry of the Environment summarises the information submitted in the reports and every second year prepares an informative report to the Cabinet of Ministers on the implementation of the program.
• Environmental policy guidelines for 2009 - 2015
On July 31, 2009 the Cabinet of Ministers approved the Environmental policy guidelines for 2009 – 2015 by its Resolution No” 517 “On Environmental policy guidelines for 2009 – 2015”. This is a medium term planning document, which reflects the existing situation, defines the environmental policy goals, issues to be solved, basic principles of the policy and policy results, as well as directions of actions for achieving the environmental policy goals.
After assuming international obligations both in the area of the climate change and also, for example, within the context of Lisbon Strategy, Latvia has to fulfil two equally important and complicated tasks: encouragement of economic growth and, thus, also social welfare. At the same time GHG emissions have to be reduced by introducing energy efficiency measures, environmentally friendly technologies, and by replacing fossil fuel by renewable energy sources.
Also by means of encouraging management and mitigation of risks caused by the climate change by integrating this risks management at all levels of all the branches of the national economy (state, regions, and municipalities).
• Climate and Energy Package
On December 17, 2008 the European Parliament adopted the Climate and Energy Package, which defines the EU policy in the area of the climate change and energy until 2010. Approved legal acts contain a whole package of documents in the area of the climate change mitigation – Directive on the improvement of performance of the EU ETS, resolution on obligations of the Member States for limiting their GHG emissions, which are not included in the ETS (transport, agriculture, waste management), Directives on geological storage of CO2 and Directives on promotion of use of renewable energy sources.
The goals set in the Climate and Energy Package for Latvia for year 202088
1. To increase the share of renewable energy sources up to 40% of the end consumption;
:
2. Increase of GHG emissions in non-ETS sectors by 17% compared to 2005;
88 http://www.vidm.gov.lv/lat/dokumenti/ppd/?doc=9338
FIFTH NATIONAL COMMUNICATION OF THE REPUBLIC OF LATVIA TO THE UNITED NATIONS FRAMEWORK CONVENTION ON CLIMATE CHANGE
77
3. Reduction of GHG emissions in ETS sector by 21% compared to 2005. 4. Guidelines on use of renewable energy sources for 2006 - 2010.89
Renewable energy sources take an important place in the balance of primary energy resources of Latvia. Biomass (wood) and hydro electricity are the major renewable energy sources in Latvia, wind energy, biogas and straw are used less. The main strategic goal in relation to renewable energy sources is optimum utilisation of the potential of the Latvian renewable energy sources taking into consideration economic, geographic and technical possibilities, as well as international and EU policy goals and requirements concerning renewable energy sources.
Implementation of the policy of renewable energy sources has to result in fulfilment of the major task – expansion of use of renewable energy sources in Latvia. At the same time implementation of actions provided for in the guidelines of use of renewable energy sources will help to achieve the indicative targets set in the EU legal acts in relation to expansion of their use. What concerns proportion of RES in the total balance of primary resources the goal of increasing this proportion up to 35% in year 2010 and achieving 37% until 2016 has been defined in the guidelines of use of RES.
In compliance to „Guidelines on use of renewable energy sources for 2006 - 2013” the Ministry of Environment has developed “Program for development of production and use of biogas” where encouragement of use of biogas is among the measures aimed at increasing the proportion of RES in the balance of energy resources. Also tasks for implementing this measure have been set – development of the program for development of biogas and implementation of pilot projects of production of biogas.
• European Union emission allowances trading system (EU ETS)
The regional emission allowances trading system has been in operation in the EU Member States as from January 1, 2005. The system was established by the Directive of the European Parliament and Council 2003/87/EC of October 13, 200390
The Latvian National Emissions Allowances Allocation Plan for 2005 – 2007 was approved by the Ordinance of the Cabinet of Ministers No. 270 of April 27, 2004 “On Emissions Allowances Allocation Plan for 2005 - 2007”.
, which establishes the system of trade of allowances of emissions of green house gases in the Community and amends the Council Directive 96/61/EC. The basic goal of the EU ETS is to promote actual reduction of CO2 emissions from installations covered by ETS, thus, helping the Member States and also the European Union to comply with the relevant obligations for reduction of emissions provided for in Kyoto Protocol in the most profitable manner. In 2005 – 2007 the EU ETS was based upon the National Emission Allowances allocation plans of the Member States approved by the European Commission, according to which the mandatory participants of the Emissions Trading System were allocated a certain amount of emission units.
91
89
During this period the total number of emission allowances amounted to 13 706 012 allowances (on mean 4.57 mil per year). 99 installations from Latvia participated in the EU ETS during the period of 2005 – 2007 as mandatory or voluntary participants (18 installations joined the system as voluntary participants).
http://www.vidm.gov.lv/files/text/VIDMPamn_201006__AERPamn.pdf; http://www.vidm.gov.lv/files/text/Vides_parsk_AER_pamatnost.pdf 90 http://eur-lex.europa.eu/LexUriServ/LexUriServ.do?uri=CELEX:32003L0087:LV:HTML 91 http://www.meteo.lv/upload_file/SEG_REGISTRS/Latvijas_NAP_2005.pdf
FIFTH NATIONAL COMMUNICATION OF THE REPUBLIC OF LATVIA TO THE UNITED NATIONS FRAMEWORK CONVENTION ON CLIMATE CHANGE
78
The Emissions Allowances Allocation plan for 2008 – 2012 was approved by the Ordinance of the Cabinet of Ministers No. 542 of September 4, 2008 “On Emissions Allowances Allocation Plan for 2008 – 2012”.92
It should be noted that in relation to allocation of emissions allowances from the reserve of new installations additional conditions have to be applied, which ensure that the reserve of new installations is available for as many new installations as possible, i.e. the following can be allocated to a single installation:
In the EU Emissions Allowances Allocation Plan for 2008 – 2012 it is stated that in Latvia 83 installations operate within the framework of ETS, out of which 9 installations have joined the system voluntarily. The total number of emissions allowances amount to 16 992 415 allowances (on mean 3.39 mil per year). Allocation of emissions allowances for the time period of 2008 – 2012 takes into account the growth of the existing industrial installations by 6% and reduction of emissions by 20% for the existing energy installations compared to the base year.
1) Not more than 80% of the amount of emissions allowances required for the installation;
2) Not more than 45% (in case of industrial installations) or 20% (in case of energy installations) of the total amount of allowances reserve intended for new installations.
Emissions allowances are allocated free of charge to both mandatory and voluntary participants of the EU ETS. In case the reserve of emissions allowances is used up emissions allowances for new installations will have to be bought in the market according to the current market conditions.
Also the aviation branch will be included in the EU ETS as from 2012 and emissions units allocated to operators representing this branch will be calculated in accordance with a special scheme. The distribution of aviation operators will not be based upon the country of registration of an operator, but the country where the relevant operator operates.
Important changes will be implemented during the third stage of the EU ETS (2013 – 2020) – emission units will not be allocated to operators of certain sectors of the Member States, instead, they will be offered to purchase allowances in an auction, the margin of installation capacity for mandatory operators will be increased up to 25MW. New branches will be included in the system – chemical industry, production of ferrous metals, etc.
• International emissions trading system (IET)
IET, which was established in compliance to Article 17 of Kyoto Protocol, started its operation as from 2008. IET provides a possibility for the Member States to purchase emissions units from other Member States and used them for fulfilling their obligations for reduction of emissions stipulated by Kyoto Protocol.
The Concept of participation of Latvia in the international trade of emissions was approved by the Ordinance of the Cabinet of Ministers No. 249 of April 12, 2006 “On the Concept of participation of Latvia in the international trade of emissions”.93
92
It is the general goal of the Concept to promote prevention of the global climate change and it was developed for the
http://www.meteo.lv/upload_file/SEG_REGISTRS/NAP2_Latvia_LV_1.pdf 93http://www.vidm.gov.lv/lat/darbibas_veidi/emisiju_tirdznieciba/starptautiska_emisiju_tirdznieciba/files/text/Darb_jomas//Koncepc_starpt_ET_1204_140906.doc
FIFTH NATIONAL COMMUNICATION OF THE REPUBLIC OF LATVIA TO THE UNITED NATIONS FRAMEWORK CONVENTION ON CLIMATE CHANGE
79
purpose of ensuring adoption of a resolution concerning participation of Latvia in the international trade of emissions within the framework of the Convention and its Kyoto Protocol. The Concept provides options for optimum management of the international trade of emissions in Latvia, fulfilment of the obligations defined by the Convention and its Kyoto Protocol. Its adoption was the first political decision of the Latvian government on participation of this country in IET, in particular, a tool for attracting additional funds to Latvia as from 2008.
Latvia has planned to sell its emission rights or assigned amount units, which are available and not used, to Member States, for whom it is not profitable to ensure compliance to obligations of reducing anthropogenic GHG emissions with their own resources. In year 2009 several contracts were concluded with countries of Annex I to Kyoto Protocol for sale of more than 10 mill units. Funds obtained from this sale may be used exclusively for measures related to reduction of anthropogenic GHG emissions.
The proceeds from sale of the assigned amount units will be allocated in compliance to priorities, criteria and procedures stipulated in regulatory acts, as well as types and amounts of costs to be covered for implementation of projects, which will contribute to achieving goals of the climate change policy of Latvia.
It should be noted that use of proceeds obtained from participation in IET for implementation of measures for reduction of emissions would not only ensure fulfilment of international obligations of Latvia, but also increase the amount of not used assigned amount units, which could be offered on the international market in future. Besides, such measures are related to issues of efficient use of energy and energy independence important for the competitiveness of the national economy.
• Joint implementation projects
In 2002 in Latvia important political documents were developed - “Conception for the implementation of the JI projects under the UNFCCC Kyoto Protocol for the time period from 2002 to 2012” and “Strategy for the implementation of the JI projects under the UNFCCC Kyoto Protocol for the time period from 2002 to 2012”.
On November 8, 2007 the Parliament (Saeima) adopted the Law “On Participation of the Republic of Latvia in the flexible mechanisms of the Kyoto Protocol”, which stipulates the basic principles for participation of Latvia in Kyoto Protocol flexibility mechanisms, including application of proceeds obtained in the result of sale of assigned amount units within the framework of the climate change financial instrument. These funds should be used for funding projects in energy, agriculture, forestry, transport, industry, waste management and other branches of the national economy because they have considerable impact upon the national emission or removal of green-house gases.
The Latvian government has decided on participation in Kyoto Protocol flexibility mechanisms by Regulations of the Cabinet of Ministers No. 510 of July 7, 2008 “Procedure for implementation of Kyoto Protocol projects mechanisms”, thus, providing a possibility to attract additional investments for reduction of GHG emissions.
The procedure of exchange of emissions reduction units and certified emissions reduction units has been defined and the institutional system for implementation of the projects mechanisms in Latvia has been established. During the period of 2008 to 2012 it is not planned to allocate
FIFTH NATIONAL COMMUNICATION OF THE REPUBLIC OF LATVIA TO THE UNITED NATIONS FRAMEWORK CONVENTION ON CLIMATE CHANGE
80
emissions reduction units for reduction or restriction of emissions achieved in installations covered by the EU ETS due to jointly implemented projects in Latvia.
In compliance to Paragraph 13 of Section 321 of the Law “On Pollution” the maximum amount of emissions reduction units and certified emissions reduction units, which can be used by operators of EU ETS installations within the framework of EU ETS, has been set at 10% of the amount of emissions allowances allocated to the particular installation. This amount has been set in compliance to the principle that application of Kyoto Protocol mechanisms can supplement reduction of emissions achieved in the country, as well as considering the principle that within the framework of EU ETS reduction of emissions from installation emitting GHG is a priority.
4.3. Policies, Measures and their Impact
For Latvia to be able to achieve the goal defined in Kyoto Protocol it is necessary to implement the following directions of action of the climate change mitigation policy94
• Increase the share of renewable energy sources in the energy balance;
:
• Improve efficiency of use of energy resources; • Develop an environmentally friendly transport system; • Promote the implementation of the best available techniques, environmentally
friendly technologies and cleaner production; • Promote the implementation of environmentally sound agricultural methods that
reduce direct GHG emissions; • Increase CO2 removals in forestry; • Establish an up-to-date municipal waste management system, ensuring collection of
biogas in the municipal waste landfills; • Participate in the EU ETS and Kyoto Protocol flexibility mechanisms; • Promote the implementation of environmental management systems.
The following chapters provide a description of policies to be implemented and main measures according to these directions of action, as well as implemented additions and changes in policy documents and legal acts since adoption of “Climate change mitigation program for 2005 – 2010” and development of “Fourth national communication of the Republic of Latvia to the United Nations Framework Convention on Climate Change”. The summary of policies and measures has been drafted in accordance with the Report of Latvia to the European Commission submitted on June 15, 2009.95
4.3.1. Energy
The summary of policies and measures for reduction of emissions in the energy sector is reflected in Table 4.1.
94 Progress Report of Latvia according to the European Parliament and Council Decision No. 280/2004/EC on the monitoring mechanism in relation to emissions of greenhouse gases and implementation of Kyoto Protocol in the Community (year 2009) http://cdr.eionet.europa.eu/lv/eu/ghgpro/envsgraha 95 http://cdr.eionet.europa.eu/lv/eu/ghgpro/envsjybvw

FIFTH NATIONAL COMMUNICATION OF THE REPUBLIC OF LATVIA TO THE UNITED NATIONS FRAMEWORK CONVENTION ON CLIMATE CHANGE
81
Table 4.1. Summary of Policies and Measures in Energy
Name of policy or measure Goal and/ or impacted action
Impacted GHG
Type of the instrument Status
Implementing institution or institutions
Approximate reducing impact (CO2 eq.)
2010 2015 2020
Policy: increase the share of renewable energy sources in the energy balance
Support for energy generation in small hydroelectricity plants
Increase of the share of renewable energy sources in the energy balance Electricity generation from renewable energy sources (Directive 2001/77/EC)
CO2, N2O Economic, Regulating Adopted The Ministry
of Economics 4.524 4.524 4.524
Support for wind electricity production
Increase of the share of renewable energy sources in the energy balance Electricity generation from renewable energy sources (Directive 2001/77/EC)
CO2, N2O Economic, Regulating Adopted The Ministry
of Economics 19.952 23.200 29.522
Support for energy production in biogas plants from agricultural waste
Increase of the share of renewable energy sources in the energy balance Reduction of GHG emissions by applying a suitable waste management process
CO2, CH4, N2O Economic, Regulating Planned The Ministry
of Economics 14.811 55.084 55.084
Support for energy production in biogas plants from waste landfills
Increase of the share of renewable energy sources in the energy balance Reduction of GHG emissions by applying a suitable waste management process
CO2, CH4, N2O Economic, Regulating Planned The Ministry
of Economics 174.898 249.854 249.854
Support for energy production in cogeneration plants by using renewable fuel
Increase of the share of renewable energy sources in the energy balance CO2, CH4, N2O Economic,
Regulating Adopted The Ministry of Economics 99.634 196.574 278.705
Policy: improve efficiency of use of energy resources
Investment programs for the support of energy efficiency and promotion of use of renewable energy sources in District Heating systems
Efficient use of fuel in District Heating systems, promotion of cogeneration, reduction of energy loss and emissions, increase of use of renewable energy sources in the total fuel balance for District Heating
CO2, CH4, N2O Economic, Informative Implemented The Ministry
of Economics NE* NE NE
Support for projects for improvement of energy efficiency of buildings
Involvement of end users in improvement of energy efficiency of buildings, thus, reducing energy consumption and emissions due to use of energy
CO2 Economic, Informative Planned
The Ministry of Economics, municipalities
7.544 60.907 92.196
Support for projects for improvement of energy efficiency of buildings
Involvement of end users in improvement of energy efficiency of buildings, thus, reducing energy consumption and emissions due to use of energy
CO2
Economic, Voluntary/ mutual agreement
Planned The Ministry of Economics, municipalities
3.463 21.953 481.505
Terms of marking of household air conditioners, bulbs and dishwashers, refrigerators, freezers and stoves
Reduction of energy use by households Energy labels of household items - Directives 2003/66/EC , 2002/40/ EC, 2002/31/ EC, 99/9/ EC, 98/11/ EC, 96/89/ EC, 96/60/ EC
CO2 Regulating Adopted The Ministry of Economics NE NE NE
“Energy Law” (1998), “Electricity Market Law” (2005)
Promotion of development of local and renewable energy sources and efficient use of fuel
CO2 Economic Implemented The Ministry of Economics NE NE NE
Support for energy production in cogeneration plants
More efficient use of fuel Promotion of Cogeneration (Directive 2004/8/EC)
CO2, CH4, N2O Economic, Regulating The Ministry
of Economics 165.424 401.744 401.744
Policy: promotion of reduction of indirect GHG emissions
Setting of national emission ceilings
Reduce total national emissions of indirect GHG and ammonia
SO2, NOx, NMVOC, NH3
Regulating Implemented The Ministry of the Environment
NE NE NE
Control of emissions of large scale combustion installations
Restriction of emissions of polluting substances from large combustion plants Ensure monitoring of large combustion plants
Indirect GHG Regulating Implemented The Ministry of the Environment
NE NE NE
* NE – not estimated
FIFTH NATIONAL COMMUNICATION OF THE REPUBLIC OF LATVIA TO THE UNITED NATIONS FRAMEWORK CONVENTION ON CLIMATE CHANGE
82
Policy. Increase the share of renewable energy sources in the energy balance
„Guidelines of energy development for 2007 - 2016”96 and „Guidelines of use of renewable energy sources for 2006 - 2013”97
The share of electricity generated from RES should amount to 49.3% of the total electricity consumption in the country in 2010. The priority development directions for achieving this goal are as follows:
stipulate that for the purpose of achieving the set target of self-provision – at least 36-37% of the total consumption of primary energy resources, increase of use of renewable energy resources should be promoted both in electricity generation and heat production, as well as in transportation. Use of RES should be coordinated in compliance to sustainable development of forests and agriculture.
• Support for efficient use of biomass not only for heat production, but also for electricity generation. The total planned capacity of cogeneration plants which will be fired with biomass or biogas fuel amounts to 70-80 MWel;
• Use of wind energy with installed capacity up to 135 MW; • Reasonable acquiring of potential of small scale HPPs.
The main support mechanisms for achieving the set goals will be as follows:
• Mandatory purchase of generated electricity and a fixed purchase price of electricity when renewable energy sources are used for electricity generation;
• Earmarked subsidies for investments.
In compliance to Sections 28 and 29 of the “Electricity Market Law” an operator, who generates electricity in a cogeneration process or uses RES for generation, may obtain rights to sell the generated electricity within the framework of mandatory purchase.
Terms for electricity generation by use of RES, criteria for qualification of producers, the procedure of setting the price of electricity depending on the type of RES, as well as measures for promotion of electricity generation from biomass are regulated by the Regulations of the Cabinet of Ministers No. 198 of February 24, 2009 “Regulations on electricity generation from renewable energy sources and energy price calculation”.
The Regulations define the share for every RES, which out of the total consumption of all the Latvian end users of electricity, shall be covered by electricity generated from RES (Table 4.2).
96 http://www.em.gov.lv/em/images/modules/items/item_file_15063_3.doc 97 http://www.vidm.gov.lv/files/text/VIDMPamn_201006__AERPamn.pdf
FIFTH NATIONAL COMMUNICATION OF THE REPUBLIC OF LATVIA TO THE UNITED NATIONS FRAMEWORK CONVENTION ON CLIMATE CHANGE
83
Table 4.2
The share of the total consumption of Latvian end users of electricity, which shall be covered by electricity generated from renewable energy sources
Type of renewable energy sources and electricity plants Year 2009 Year 2010 and further
years Hydroelectric power stations with capacity above 5 MW 36.35 % 34.31 % Hydroelectric power stations with capacity 5 MW and below 1.88 % 1.98 %
Wind power plants compliant with Paragraph 5.4 of the Regulations No. 198 0.20 % 0.27 %
Wind power plants compliant with Paragraph 5.5 of the Regulations No. 198 3.88% 5.10%
Biogas power plants 1.97 % 2.66 % Biomass power plants and power plants where biomass is used along with fossil fuel 3.46 % 4.97 %
Solar power plants 0.00 % 0.01 % Total 47.74 % 49.30 %
„Latvian National Development Plan for 2007 - 2013”98
The goal of the activity „Development of wind power plants” is to increase electricity generation from wind resources, to diversify supplies of primary energy resources and to increase the share of self-provision of electricity. The planned total public funding amounts to 7.03 mill. LVL with the support intensity of 30%.
provides for support from the EU Structural Fund and Cohesion Fund for the activity “Development of cogeneration power plants using renewable energy sources”. The goal of this activity is to achieve a considerable increase of the electricity generation and heat production volumes from RES, thus, reducing the dependence of Latvia from import of primary energy resources. The total public funding amounts to 17.35 mill. LVL with the support intensity of 50%.
„Biogas Generation and Development of Use Programme for 2007 – 2011”99
Policy. Improve efficiency of use of energy resources
defines the goal of development of the renewable energy source – biogas production and use in Latvia, at the same time finding complex solutions to issues of management of biodegradable by-products and waste produced in production, treatment and processing processes, as well as minimising the risks of air, water and soil pollution and possible threat to human health. The Programme defines the goal of increase of the amount of generated biogas during the period from 2007 to 2011 by 3.5 to 13 mill.m3/year correspondingly.
”Guidelines of energy development for 2007 - 2016”100
During the time period until year 2016 the mean specific heat consumption in buildings should be reduced from 220 - 250 kWh/m2/year to195 kWh/m2/year. This measure should result in achieving the specific heat consumption in buildings of 150 kWh/m2/year until 2020.
stipulate that starting from year 2008 energy efficiency measures should result in reduction of the consumption of primary energy resources by 1% per year compared to the calculated consumption without implementation of efficiency measures.
98 http://www.nap.lv/lat/ 99 http://www.vidm.gov.lv/lat/print/files/text/Darb_jomas//Biogazes_raz_un_izmant_att_pr_2007-2011.doc 100 http://www.em.gov.lv/em/images/modules/items/item_file_15063_3.doc
FIFTH NATIONAL COMMUNICATION OF THE REPUBLIC OF LATVIA TO THE UNITED NATIONS FRAMEWORK CONVENTION ON CLIMATE CHANGE
84
„Latvian First Energy Efficiency Action Plan for 2008 - 2010”, which was developed in compliance to the minimum requirements defined in the Directive of the European Parliament and Council 2006/32/EC of April 5, 2006 on energy end-use efficiency and energy services and repealing Council Directive 93/76/EEC (1) in relation to energy end-use efficiency, provides for total savings amounting to 3483 GWh.
“Latvian National Development Plan for 2007 – 2013” provides for support from the EU Structural Fund and Cohesion Fund for the activity “Improvement of Heat Insulation of Multi-apartment Residential Buildings”. The goal of the measures is to promote accessibility of buildings, their sustainability and efficiency. Planned total public funding amounts to 27.5 mill. LVL.
The goal of the activity „Improvement of Heat Insulation of Social Residential Houses” is to improve energy efficiency of municipal social residential buildings, at the same time improving their quality and sustainability. Planned total public funding amounts to 6.9 mill. LVL with the planned intensity of funding of 30%.
„Guidelines of energy development for 2007 - 2016”101
Policy. Promotion of reduction of indirect GHG emissions
also define goals for improving efficiency of heat production installations and reduction of heat losses in district heating systems. „Latvian National Development Plan for 2007 - 2013” provides for support from the EU Structural Fund and Cohesion Fund for the activity „Improvement of efficiency of district heating systems”, which is aimed at improving efficiency of heat production, reducing heat losses in transmission and distribution systems. Planned total public funding amounts to 42.32 mill. LVL with the planned intensity of funding of 40-50% depending on the use of fossil or renewable energy sources for heat production.
• Setting of national emissions ceiling
On September 13, 2003 the Regulations of the Cabinet of Ministers No.507 “Regulations on the state emissions ceiling”102 were adopted and they define the total maximum permitted emission in the atmosphere in this country (the maximum amount of polluting substance, which may be emitted from all the emissions sources during a year, is expressed in kilotons) for air polluting substances and groups of substances referred to in Paragraph 3 of these Regulations as from year 2010. The above Regulations implement the requirements of the Directive of the European Parliament and Council 2001/81/EC of October 23, 2001 on the maximum defined emission of certain substances polluting the atmosphere for countries103
The total state emissions ceiling of SO2 amounts to 101 kt/year, NOx– 61 kt/year, ammonia (NH3)– 44 kt/year, NMVOC – 136 kt/year.
.
The defined emissions ceilings force the country to adopt legislative acts and to implement actions for achieving as high as possible reductions of indirect GHG and NH3 emissions from all branches of the national economy. In the course of implementing actions for reducing emissions it is necessary to observe that they do not promote increase of direct GHG, for example, promotion of use of biomass does not have a negative impact upon increase of indirect GHG emissions.
101 http://www.em.gov.lv/em/images/modules/items/item_file_15063_3.doc 102 http://www.likumi.lv/doc.php?id=78884&from=off 103 http://eur-lex.europa.eu/LexUriServ/LexUriServ.do?uri=CONSLEG:2001L0081:20040501:LV:PDF
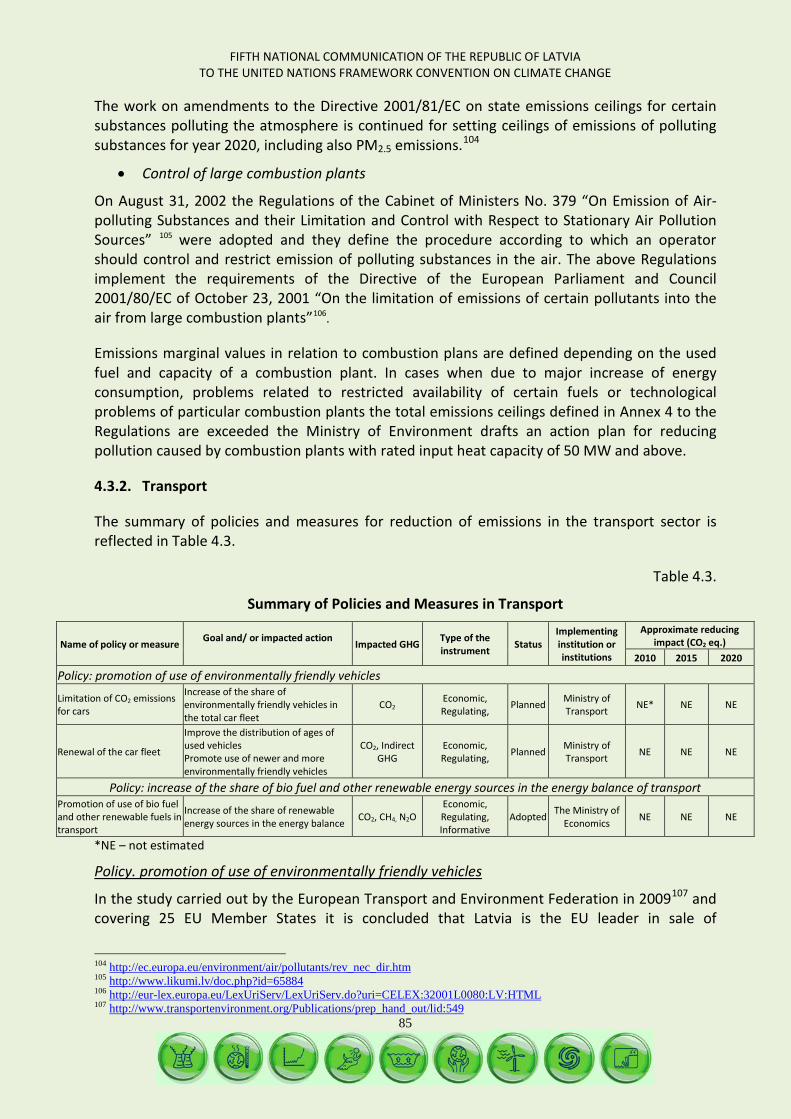
FIFTH NATIONAL COMMUNICATION OF THE REPUBLIC OF LATVIA TO THE UNITED NATIONS FRAMEWORK CONVENTION ON CLIMATE CHANGE
85
The work on amendments to the Directive 2001/81/EC on state emissions ceilings for certain substances polluting the atmosphere is continued for setting ceilings of emissions of polluting substances for year 2020, including also PM2.5 emissions.104
• Control of large combustion plants
On August 31, 2002 the Regulations of the Cabinet of Ministers No. 379 “On Emission of Air-polluting Substances and their Limitation and Control with Respect to Stationary Air Pollution Sources” 105 were adopted and they define the procedure according to which an operator should control and restrict emission of polluting substances in the air. The above Regulations implement the requirements of the Directive of the European Parliament and Council 2001/80/EC of October 23, 2001 “On the limitation of emissions of certain pollutants into the air from large combustion plants”106
Emissions marginal values in relation to combustion plans are defined depending on the used fuel and capacity of a combustion plant. In cases when due to major increase of energy consumption, problems related to restricted availability of certain fuels or technological problems of particular combustion plants the total emissions ceilings defined in Annex 4 to the Regulations are exceeded the Ministry of Environment drafts an action plan for reducing pollution caused by combustion plants with rated input heat capacity of 50 MW and above.
.
4.3.2. Transport
The summary of policies and measures for reduction of emissions in the transport sector is reflected in Table 4.3.
Table 4.3.
Summary of Policies and Measures in Transport
Name of policy or measure Goal and/ or impacted action Impacted GHG Type of the
instrument Status Implementing institution or institutions
Approximate reducing impact (CO2 eq.)
2010 2015 2020
Policy: promotion of use of environmentally friendly vehicles
Limitation of CO2 emissions for cars
Increase of the share of environmentally friendly vehicles in the total car fleet
CO2 Economic, Regulating, Planned Ministry of
Transport NE* NE NE
Renewal of the car fleet
Improve the distribution of ages of used vehicles Promote use of newer and more environmentally friendly vehicles
CO2, Indirect GHG
Economic, Regulating, Planned Ministry of
Transport NE NE NE
Policy: increase of the share of bio fuel and other renewable energy sources in the energy balance of transport Promotion of use of bio fuel and other renewable fuels in transport
Increase of the share of renewable energy sources in the energy balance CO2, CH4, N2O
Economic, Regulating, Informative
Adopted The Ministry of Economics NE NE NE
*NE – not estimated
Policy. promotion of use of environmentally friendly vehicles
In the study carried out by the European Transport and Environment Federation in 2009107
104
and covering 25 EU Member States it is concluded that Latvia is the EU leader in sale of
http://ec.europa.eu/environment/air/pollutants/rev_nec_dir.htm 105 http://www.likumi.lv/doc.php?id=65884 106 http://eur-lex.europa.eu/LexUriServ/LexUriServ.do?uri=CELEX:32001L0080:LV:HTML 107 http://www.transportenvironment.org/Publications/prep_hand_out/lid:549
FIFTH NATIONAL COMMUNICATION OF THE REPUBLIC OF LATVIA TO THE UNITED NATIONS FRAMEWORK CONVENTION ON CLIMATE CHANGE
86
environmentally unfriendly cars. Assessments of the researchers certify that one new car, which was sold in Latvia in 2007, emitted 183 grams CO2 in the atmosphere after driving 1 km.
In the EU in 2007 one new sold car emitted on mean 158.7 grams CO2 per kilometre in the atmosphere. Although other data indicate that in year 2008 this figure was reduced to 153.5 grams CO2 per kilometre, car manufacturers have not succeeded in fulfilling their commitment to reduce the amount of CO2 to 140 grams per kilometre.
On April 23, 2009 the Regulation of the European Parliament and Council No. 443/2009 setting emission performance standards for new passenger cars as part of the Community’s integrated approach to reduce CO2 emissions from light-duty vehicles108
Actions and measures for renewing the car fleet are implemented based upon the requirements of the Directive of the European Commission No. 2003/76/EC of August 11, 2003 amending Council Directive 70/220/EEC relating to measures to be taken against air pollution by emissions from motor vehicles.
was adopted. This Regulation defines emissions standards for new cars. The Regulation obliges car producers to reduce emissions of CO2 to 130 grams until 2015 and to 95 grams per kilometre until 2020.
109
These conditions are incorporated in the Regulations of the Cabinet of Ministers No. 505 “Regulations for Conformity Assessment of Wheeled Vehicles and Parts Thereof”.
110
On June 20, 2007 Regulation (EC) No 715/2007 of the European Parliament and the Council on type approval of motor vehicles with respect to emissions from light passenger and commercial vehicles (Euro 5 and Euro 6) and on access to vehicle repair and maintenance information (with amendments No. 692/2008) was adopted.
111
Policy. Promotion of use of biofuel and other renewable fuels in transport
The Regulation defines new limits – EURO5 and EURO6 standards for air polluting emissions from vehicles, and those are set for both gasoline and diesel engines. As soon as EURO6 standards enter into force in relation to all vehicles equipped with diesel engines, also in Latvia the defined reductions of emissions will have to be complied with.
In compliance to the Directive 2003/30/EC of the European Parliament and Council of 8 May 2003 on the promotion of the use of bio fuels or other renewable fuels for transport, Latvia has to achieve 5.75% proportion of bio fuel in the total energy capacity of gasoline and diesel intended for transport until December 31, 2010. As from October 1, 2009 5% of bio fuel is added to the fuel sold in Latvia. Addition of bio fuel is mandatory with the intention to reduce consumption of fossil fuel and emissions of CO2. Latvia has committed to increase the proportion of added bio fuel up to 10% in 2020.
Production and use of bio fuel in Latvia until year 2010 is planned in compliance to the program “Production and use of bio fuel in Latvia (2003.-2010.)”112
108
, where promotion of use of bio diesel for diesel engines in the amount of 40% of the total diesel used in agriculture is set as one of the main priority tasks, and “Bio Fuel Law”. As from 2005 the state has been granting direct
http://eur-lex.europa.eu/LexUriServ/LexUriServ.do?uri=OJ:L:2009:140:0001:0015:EN:PDF 109 http://eur-lex.europa.eu/LexUriServ/LexUriServ.do?uri=CELEX:32003L0076:LV:HTML 110 http://www.likumi.lv/doc.php?id=139095 111 http://eur-lex.europa.eu/LexUriServ/LexUriServ.do?uri=OJ:L:2007:171:0001:0016:EN:PDF 112 http://www.zm.gov.lv/index.php?sadala=442&id=446
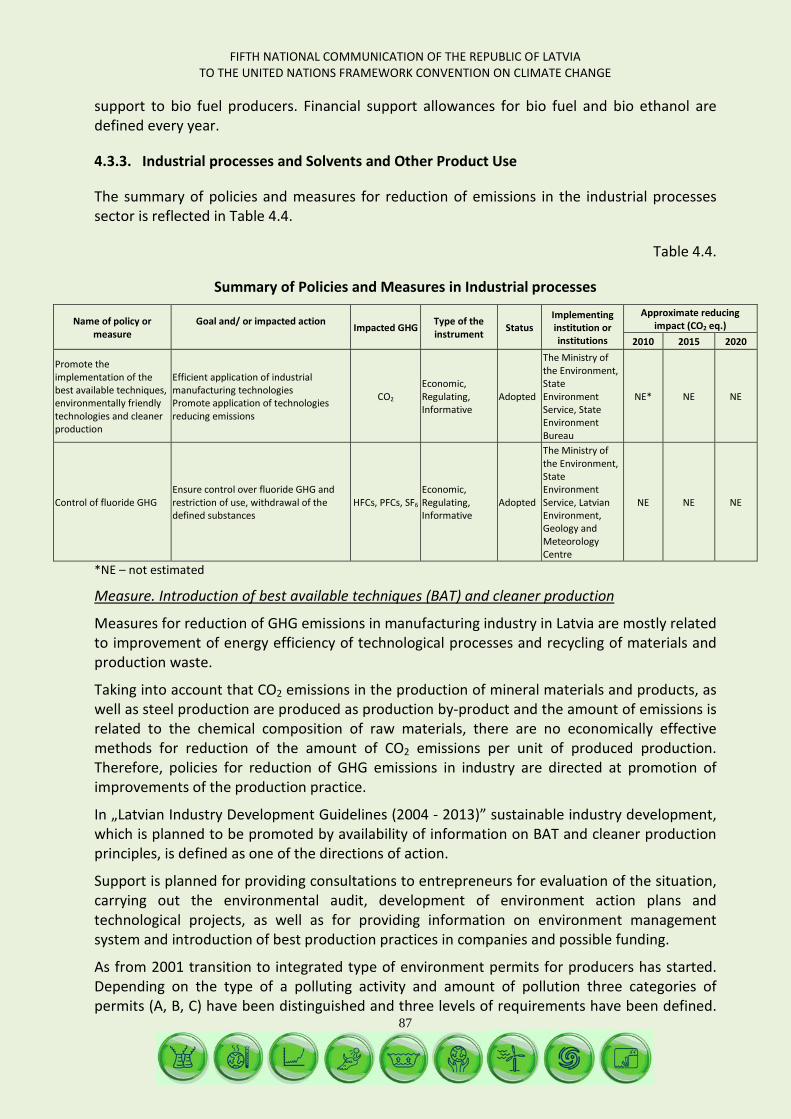
FIFTH NATIONAL COMMUNICATION OF THE REPUBLIC OF LATVIA TO THE UNITED NATIONS FRAMEWORK CONVENTION ON CLIMATE CHANGE
87
support to bio fuel producers. Financial support allowances for bio fuel and bio ethanol are defined every year.
4.3.3. Industrial processes and Solvents and Other Product Use
The summary of policies and measures for reduction of emissions in the industrial processes sector is reflected in Table 4.4.
Table 4.4.
Summary of Policies and Measures in Industrial processes
Name of policy or measure
Goal and/ or impacted action Impacted GHG Type of the
instrument Status Implementing institution or institutions
Approximate reducing impact (CO2 eq.)
2010 2015 2020
Promote the implementation of the best available techniques, environmentally friendly technologies and cleaner production
Efficient application of industrial manufacturing technologies Promote application of technologies reducing emissions
CO2 Economic, Regulating, Informative
Adopted
The Ministry of the Environment, State Environment Service, State Environment Bureau
NE* NE NE
Control of fluoride GHG Ensure control over fluoride GHG and restriction of use, withdrawal of the defined substances
HFCs, PFCs, SF6 Economic, Regulating, Informative
Adopted
The Ministry of the Environment, State Environment Service, Latvian Environment, Geology and Meteorology Centre
NE NE NE
*NE – not estimated
Measure. Introduction of best available techniques (BAT) and cleaner production
Measures for reduction of GHG emissions in manufacturing industry in Latvia are mostly related to improvement of energy efficiency of technological processes and recycling of materials and production waste.
Taking into account that CO2 emissions in the production of mineral materials and products, as well as steel production are produced as production by-product and the amount of emissions is related to the chemical composition of raw materials, there are no economically effective methods for reduction of the amount of CO2 emissions per unit of produced production. Therefore, policies for reduction of GHG emissions in industry are directed at promotion of improvements of the production practice.
In „Latvian Industry Development Guidelines (2004 - 2013)” sustainable industry development, which is planned to be promoted by availability of information on BAT and cleaner production principles, is defined as one of the directions of action.
Support is planned for providing consultations to entrepreneurs for evaluation of the situation, carrying out the environmental audit, development of environment action plans and technological projects, as well as for providing information on environment management system and introduction of best production practices in companies and possible funding.
As from 2001 transition to integrated type of environment permits for producers has started. Depending on the type of a polluting activity and amount of pollution three categories of permits (A, B, C) have been distinguished and three levels of requirements have been defined.
FIFTH NATIONAL COMMUNICATION OF THE REPUBLIC OF LATVIA TO THE UNITED NATIONS FRAMEWORK CONVENTION ON CLIMATE CHANGE
88
The pollution permit A contains a mandatory requirement to apply BAT in operations, however, their selection and level of application is determined in compliance to the Law “On Pollution”.
The pollution permit B contains a requirement to apply cleaner production measures, which ensure reduction of the amount of waste, reduction of consumption of raw materials, chemical substances or chemical products, water and energy, replacement of dangerous chemical substances by less dangerous, recycling or use of raw materials. Implemented and planned cleaner production measures have to be described in the application for pollution permit B and in the application for pollution permit C.
Taking into account that the share of the solvents and other products sector in the total amount of the state GHG emissions is small no special measures for reduction of GHG emissions in this branch are being implemented or planned.
Measure. Promotion of control of fluoride GHG
On September 6, 2005 the Regulations of the Cabinet of Ministers No. 688 “Regulations on Ozone Layer Depleting Substances and Fluoride Greenhouse Effect Gases, which are Refrigerating Mediums” were adopted.113 By the above Regulations the requirements of the Regulation of the European Parliament and Council No. 2037/2000 of June 29, 2000 “On Substances Depleting Ozone Layer”114
They define specific limitations for operations with fluoride gases, which are refrigerating mediums, and specific environment requirements for operation of stationary and mobile refrigerating installations, which are continuously operated in the Republic of Latvia. In compliance to the Regulations an operator, who performs any operations with fluoride gases, should prevent leakage of these gases, carry out continuous monitoring of installations and report all the operations to the state competent authorities. In compliance to the monitoring data there are no perfluorcarbon (PFC) type gases in circulation in Latvia. A special permit, which is issued by the State Environment Service, is also required for operations with refrigerating media.
(with amendments) are transposed.
4.3.4. Agriculture
The summary of policies and measures for reduction of emissions in the agriculture sector is reflected in Table 4.5.
113 http://www.likumi.lv/doc.php?id=116350&from=off 114 http://eur-lex.europa.eu/LexUriServ/LexUriServ.do?uri=CONSLEG:2000R2037:20080101:LV:PDF
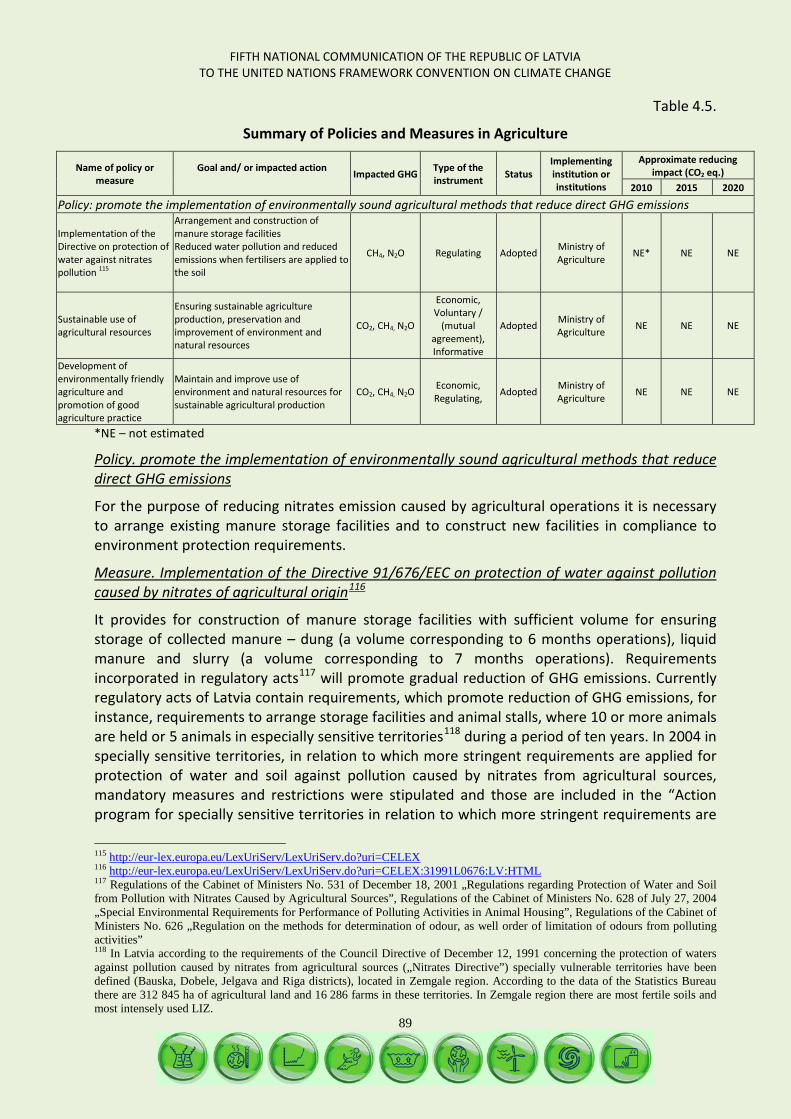
FIFTH NATIONAL COMMUNICATION OF THE REPUBLIC OF LATVIA TO THE UNITED NATIONS FRAMEWORK CONVENTION ON CLIMATE CHANGE
89
Table 4.5.
Summary of Policies and Measures in Agriculture
Name of policy or measure
Goal and/ or impacted action Impacted GHG Type of the
instrument Status Implementing institution or institutions
Approximate reducing impact (CO2 eq.)
2010 2015 2020
Policy: promote the implementation of environmentally sound agricultural methods that reduce direct GHG emissions
Implementation of the Directive on protection of water against nitrates pollution 115
Arrangement and construction of manure storage facilities
Reduced water pollution and reduced emissions when fertilisers are applied to the soil
CH4, N2O Regulating Adopted Ministry of Agriculture NE* NE NE
Sustainable use of agricultural resources
Ensuring sustainable agriculture production, preservation and improvement of environment and natural resources
CO2, CH4, N2O
Economic, Voluntary /
(mutual agreement), Informative
Adopted Ministry of Agriculture NE NE NE
Development of environmentally friendly agriculture and promotion of good agriculture practice
Maintain and improve use of environment and natural resources for sustainable agricultural production
CO2, CH4, N2O Economic, Regulating, Adopted Ministry of
Agriculture NE NE NE
*NE – not estimated
Policy. promote the implementation of environmentally sound agricultural methods that reduce direct GHG emissions
For the purpose of reducing nitrates emission caused by agricultural operations it is necessary to arrange existing manure storage facilities and to construct new facilities in compliance to environment protection requirements.
Measure. Implementation of the Directive 91/676/EEC on protection of water against pollution caused by nitrates of agricultural origin116
It provides for construction of manure storage facilities with sufficient volume for ensuring storage of collected manure – dung (a volume corresponding to 6 months operations), liquid manure and slurry (a volume corresponding to 7 months operations). Requirements incorporated in regulatory acts
117 will promote gradual reduction of GHG emissions. Currently regulatory acts of Latvia contain requirements, which promote reduction of GHG emissions, for instance, requirements to arrange storage facilities and animal stalls, where 10 or more animals are held or 5 animals in especially sensitive territories118
115
during a period of ten years. In 2004 in specially sensitive territories, in relation to which more stringent requirements are applied for protection of water and soil against pollution caused by nitrates from agricultural sources, mandatory measures and restrictions were stipulated and those are included in the “Action program for specially sensitive territories in relation to which more stringent requirements are
http://eur-lex.europa.eu/LexUriServ/LexUriServ.do?uri=CELEX 116 http://eur-lex.europa.eu/LexUriServ/LexUriServ.do?uri=CELEX:31991L0676:LV:HTML 117 Regulations of the Cabinet of Ministers No. 531 of December 18, 2001 „Regulations regarding Protection of Water and Soil from Pollution with Nitrates Caused by Agricultural Sources”, Regulations of the Cabinet of Ministers No. 628 of July 27, 2004 „Special Environmental Requirements for Performance of Polluting Activities in Animal Housing”, Regulations of the Cabinet of Ministers No. 626 „Regulation on the methods for determination of odour, as well order of limitation of odours from polluting activities” 118 In Latvia according to the requirements of the Council Directive of December 12, 1991 concerning the protection of waters against pollution caused by nitrates from agricultural sources („Nitrates Directive”) specially vulnerable territories have been defined (Bauska, Dobele, Jelgava and Riga districts), located in Zemgale region. According to the data of the Statistics Bureau there are 312 845 ha of agricultural land and 16 286 farms in these territories. In Zemgale region there are most fertile soils and most intensely used LIZ.
FIFTH NATIONAL COMMUNICATION OF THE REPUBLIC OF LATVIA TO THE UNITED NATIONS FRAMEWORK CONVENTION ON CLIMATE CHANGE
90
applied for protection of water and soil against pollution caused by nitrates from agricultural sources”119
In the report prepared by the Ministry of Agriculture and the Ministry of Environment to the European Commission in 2008 information on introduction and implementation of measures of the Directive 91/676/EEC concerning the protection of waters against pollution caused by nitrates from agricultural sources, as well as quality of ground, underground and sea waters and results of monitoring of agricultural discharges was summarised.
. It is planned that in year 2007 manure storage facilities will be constructed in 70% of farms and by the middle of 2008 – in 80% of farms.
120
Measure. Sustainable use of agriculture resources
For measures for development of rural areas funding is available from „Rural Development Programme for 2007 – 2013” measures – like improvement of competitiveness in agriculture and forestry; environment and rural landscape; improvement of the quality of life and diversification of rural economy. The program LEADER offers funding for preparing development concepts of rural farms.
Latvian farmers had to comply with good agricultural practice and environment condition terms for receiving the uniform area payments as from 2004. The essence of mutual compliance provides that as from year 2009 for the purpose of receiving any payments requirements in relation to environment, animals and plants health protection and in the area of animal welfare stipulated in the Latvian legislation have to be complied with. When a farmer does not comply with the mutual compliance management requirements or good agricultural practice and environment condition the total amount of direct payments is reduced or not granted at all.
Measure. Promotion of development of environmentally friendly agriculture and promotion of Good Agricultural Practice
In order to promote implementation of the above referred measures, to improve efficiency of management measures in especially sensitive territories and promote good agriculture practice in the country, the Ministry of Agriculture has implemented several measures in 2008:
1) “Arrangement of buffer belts” (establishment of buffer belts along fields, rivers, lakes, water reservoirs and ditches). This measure was commenced in compliance to the Latvian Rural Development Plan for 2004 – 2006 and continued in accordance with the Latvian Rural Development Program. 252 applications were received in 2008 and their administration is under way.
2) Technical assistance support from the Latvian Rural Development Program (2007 – 2013) was granted to the following measures:
• Preparation of “Methodology of development of fertilisation plans of cultivated plants”;
• Drafting of a new issue of “Good agriculture practice conditions in Latvia”; • Publication of information material “Methodology of development of fertilisation
plans of cultivated plants”, brochure “Good agriculture practice conditions in Latvia” and manual of industries standards “Production and management of manure”.
119 Ordinance of the Cabinet of Ministers No. 163 of March 18, 2004, http://www.zm.gov.lv/doc_upl/ricibas_programma.pdf 120 http://www.zm.gov.lv/doc_upl/GADA_ZINOJUMS_2009_v_docx_small.pdf
FIFTH NATIONAL COMMUNICATION OF THE REPUBLIC OF LATVIA TO THE UNITED NATIONS FRAMEWORK CONVENTION ON CLIMATE CHANGE
91
3) The following projects were implemented by using subsidies allocated for development of the national agriculture:
• “Improvement of manure standards and calculation of the unit of livestock”; • “Monitoring of the soil mineral nitrogen in specially sensitive territories for
fulfilment of requirements defined in the EU Nitrates Directive (91/676/EEC)”; • The project “Definition of maximum norms of fertilisers for cultivated plants”
was commenced; • Support for the project “Impact of minimum soil treatment in non-changing fields
to the productivity of plants, environment and evaluation of the management measures in especially sensitive territories” was approved.
4) From the state budget funding was granted for the preparation of the industries standard “Withdrawal of manure and soil treatment”.
Results of the implemented projects will promote awareness of farmers of environmental methods of agricultural operations and their necessity.
Conditions of good agriculture practice have been developed within a joint project between Latvia and Denmark for the purpose of fulfilment of requirements of regulatory acts121
Good agriculture practice covers major areas of agricultural operations, which can cause and do cause water, air or soil pollution, and provides recommendations, by observing which it is possible either to eliminate pollution or at least minimise it.
.
Goals of good agriculture practice122
o Reduce negative impact of economic activities upon the environment, prevent depletion or inefficient use of basic natural resources – land, water, plants, animals, rural landscape;
:
o Comply with terms adopted in EU countries and other developed countries in agricultural production, so that products produced in Latvia would not have any obstacles in the external market and Latvian rural environment would be attractive for tourists.
4.3.5. Land-use, Land-use change and Forestry
The summary of policies and measures for reduction of emissions in the land-use, land-use change and forestry sector is reflected in Table 4.6.
121 Conditions of good agriculture practice. LLU, Jelgava, 1999 122 Conditions of good agriculture practice. LLU, Jelgava, 1999
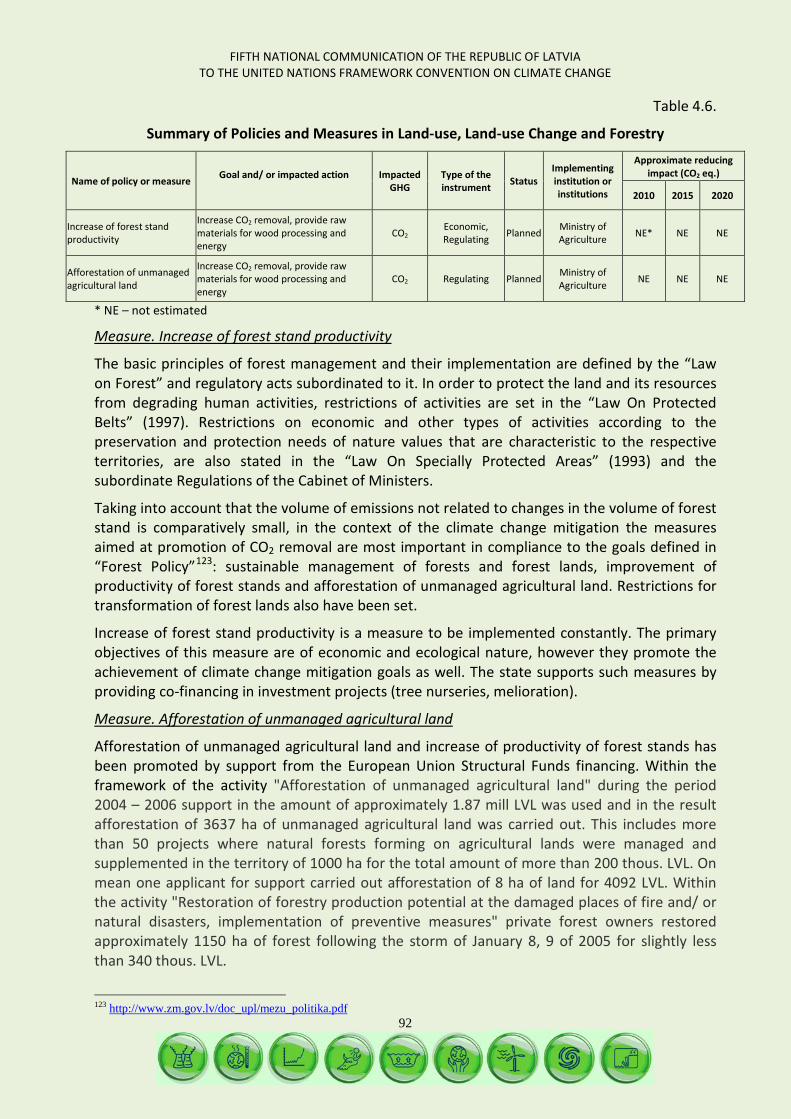
FIFTH NATIONAL COMMUNICATION OF THE REPUBLIC OF LATVIA TO THE UNITED NATIONS FRAMEWORK CONVENTION ON CLIMATE CHANGE
92
Table 4.6.
Summary of Policies and Measures in Land-use, Land-use Change and Forestry
* NE – not estimated
Measure. Increase of forest stand productivity
The basic principles of forest management and their implementation are defined by the “Law on Forest” and regulatory acts subordinated to it. In order to protect the land and its resources from degrading human activities, restrictions of activities are set in the “Law On Protected Belts” (1997). Restrictions on economic and other types of activities according to the preservation and protection needs of nature values that are characteristic to the respective territories, are also stated in the “Law On Specially Protected Areas” (1993) and the subordinate Regulations of the Cabinet of Ministers.
Taking into account that the volume of emissions not related to changes in the volume of forest stand is comparatively small, in the context of the climate change mitigation the measures aimed at promotion of CO2 removal are most important in compliance to the goals defined in “Forest Policy”123
Increase of forest stand productivity is a measure to be implemented constantly. The primary objectives of this measure are of economic and ecological nature, however they promote the achievement of climate change mitigation goals as well. The state supports such measures by providing co-financing in investment projects (tree nurseries, melioration).
: sustainable management of forests and forest lands, improvement of productivity of forest stands and afforestation of unmanaged agricultural land. Restrictions for transformation of forest lands also have been set.
Measure. Afforestation of unmanaged agricultural land
Afforestation of unmanaged agricultural land and increase of productivity of forest stands has been promoted by support from the European Union Structural Funds financing. Within the framework of the activity "Afforestation of unmanaged agricultural land" during the period 2004 – 2006 support in the amount of approximately 1.87 mill LVL was used and in the result afforestation of 3637 ha of unmanaged agricultural land was carried out. This includes more than 50 projects where natural forests forming on agricultural lands were managed and supplemented in the territory of 1000 ha for the total amount of more than 200 thous. LVL. On mean one applicant for support carried out afforestation of 8 ha of land for 4092 LVL. Within the activity "Restoration of forestry production potential at the damaged places of fire and/ or natural disasters, implementation of preventive measures" private forest owners restored approximately 1150 ha of forest following the storm of January 8, 9 of 2005 for slightly less than 340 thous. LVL.
123 http://www.zm.gov.lv/doc_upl/mezu_politika.pdf
Name of policy or measure Goal and/ or impacted action
Impacted GHG
Type of the instrument Status
Implementing institution or institutions
Approximate reducing impact (CO2 eq.)
2010 2015 2020
Increase of forest stand productivity
Increase CO2 removal, provide raw materials for wood processing and energy
CO2 Economic, Regulating Planned Ministry of
Agriculture NE* NE NE
Afforestation of unmanaged agricultural land
Increase CO2 removal, provide raw materials for wood processing and energy
CO2 Regulating Planned Ministry of Agriculture NE NE NE
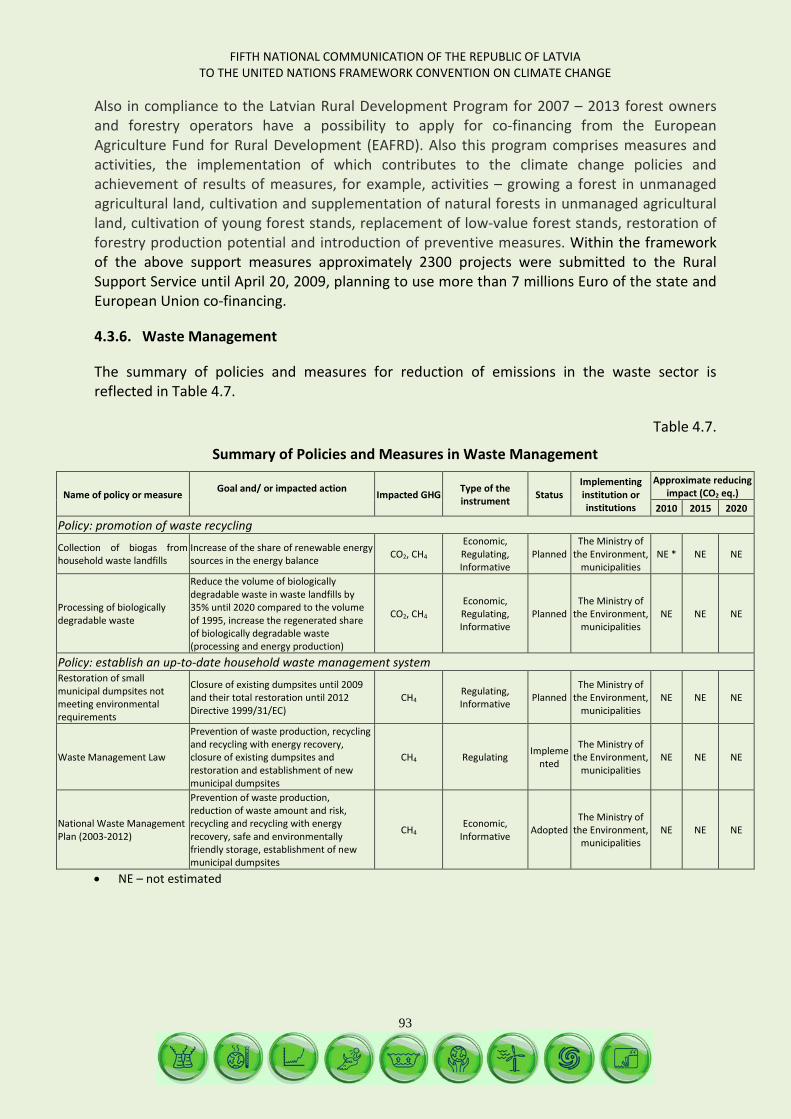
FIFTH NATIONAL COMMUNICATION OF THE REPUBLIC OF LATVIA TO THE UNITED NATIONS FRAMEWORK CONVENTION ON CLIMATE CHANGE
93
Also in compliance to the Latvian Rural Development Program for 2007 – 2013 forest owners and forestry operators have a possibility to apply for co-financing from the European Agriculture Fund for Rural Development (EAFRD). Also this program comprises measures and activities, the implementation of which contributes to the climate change policies and achievement of results of measures, for example, activities – growing a forest in unmanaged agricultural land, cultivation and supplementation of natural forests in unmanaged agricultural land, cultivation of young forest stands, replacement of low-value forest stands, restoration of forestry production potential and introduction of preventive measures. Within the framework of the above support measures approximately 2300 projects were submitted to the Rural Support Service until April 20, 2009, planning to use more than 7 millions Euro of the state and European Union co-financing.
4.3.6. Waste Management
The summary of policies and measures for reduction of emissions in the waste sector is reflected in Table 4.7.
Table 4.7.
Summary of Policies and Measures in Waste Management
Name of policy or measure Goal and/ or impacted action Impacted GHG Type of the
instrument Status Implementing institution or institutions
Approximate reducing impact (CO2 eq.)
2010 2015 2020
Policy: promotion of waste recycling
Collection of biogas from household waste landfills
Increase of the share of renewable energy sources in the energy balance CO2, CH4
Economic, Regulating, Informative
Planned The Ministry of
the Environment, municipalities
NE * NE NE
Processing of biologically degradable waste
Reduce the volume of biologically degradable waste in waste landfills by 35% until 2020 compared to the volume of 1995, increase the regenerated share of biologically degradable waste (processing and energy production)
CO2, CH4 Economic, Regulating, Informative
Planned The Ministry of
the Environment, municipalities
NE NE NE
Policy: establish an up-to-date household waste management system Restoration of small municipal dumpsites not meeting environmental requirements
Closure of existing dumpsites until 2009 and their total restoration until 2012 Directive 1999/31/EC)
CH4 Regulating, Informative Planned
The Ministry of the Environment,
municipalities NE NE NE
Waste Management Law
Prevention of waste production, recycling and recycling with energy recovery, closure of existing dumpsites and restoration and establishment of new municipal dumpsites
CH4 Regulating Implemented
The Ministry of the Environment,
municipalities NE NE NE
National Waste Management Plan (2003-2012)
Prevention of waste production, reduction of waste amount and risk, recycling and recycling with energy recovery, safe and environmentally friendly storage, establishment of new municipal dumpsites
CH4 Economic,
Informative Adopted The Ministry of
the Environment, municipalities
NE NE NE
• NE – not estimated
FIFTH NATIONAL COMMUNICATION OF THE REPUBLIC OF LATVIA TO THE UNITED NATIONS FRAMEWORK CONVENTION ON CLIMATE CHANGE
94
Policy. Establish an up-to-date household waste management system
It is the goal defined in „National Waste Management Plan for 2006 - 2012”124
According to the National Waste Management Plan for 2006 – 2012 it is planned to establish 10 – 12 new regional municipal waste landfills in Latvia and to promote separated collection of waste, as well as to close and restore the existing dumpsites.
to prevent production of waste and ensure considerable reduction of the total produced waste volume by means of applying the best practice of prevention of waste production, best available technologies, improvement of efficiency of use of resources and promotion of more sustainable behaviour by consumers.
Measures:
For implementation of the planned policies a complex solution is required – implementation of a range of measures in the municipal waste management sector, including the following:
- Construction of regional landfills in compliance to requirements of the European Council Directive 1999/31/EC of April 26, 1999 on the landfill of waste125
- Closure of existing dumpsites until 2009 and their complete restoration until 2012; until 2009;
- Procurement of new waste collection, sorting and processing equipment. - Development of regional municipal waste management projects based upon
agreement between municipalities.
On June 13, 2006 the Regulations of the Cabinet of Ministers No. 474 “No.474 „Regulations Regarding the Construction of Landfill Sites, the Management, Closure and Re-cultivation of Landfill Sites and Waste Dumps” were adopted”126
Policy. Promotion of recycling of waste
, including requirements of the Directive 1999/31/EC.
Measure. Collection of biogas from municipal waste landfills
Considering that the majority of biodegradable organic waste is still disposed of, unseparated from the main flow, in municipal waste landfills, thus generating CH4 in anaerobic degradation process, collection of biogas has a considerable potential to reduce GHG emissions from the waste sector. An additional gain is presented by its use for production of heat and/ or generation of electricity.
In 2005 in waste landfills in Latvia – SIA „Getliņi”, as well as in BO SIA „Liepājas RAS” closed waste landfill „Šķēdes” and the new waste landfill „Ķīvītes”, totally 4599 tons of CH4 were collected, and in 2006 totally 5155 tons and in 2007 totally 4758 tons of pure CH4 were collected.
“Biogas production and use development program project for 2007 – 2011” was approved by the Ordinance of the Cabinet of Ministers No. 371 of June 14, 2007.127
124http://www.vidm.gov.lv/lat/likumdosana/normativie_akti/files/text/Likumd/atkrit_apsaimn_pl//VidM_271205_Valsts_plans.doc 125 http://eur-lex.europa.eu/LexUriServ/LexUriServ.do?uri=CELEX:31999L0031:LV:HTML 126 http://www.likumi.lv/doc.php?id=139004 127 http://www.vidm.gov.lv/lat/print/files/text/Darb_jomas//Biogazes_raz_un_izmant_att_pr_2007-2011.doc
FIFTH NATIONAL COMMUNICATION OF THE REPUBLIC OF LATVIA TO THE UNITED NATIONS FRAMEWORK CONVENTION ON CLIMATE CHANGE
95
Measure. Processing of biologically degradable waste
In compliance to the material prepared by the Latvian Waste Management Association (LWMA) “Proposals for the strategy on management of biologically degradable waste in compliance to the requirements of the European Council Directive 1999/31/EC on the landfill of waste and Regulations of the Cabinet of Ministers No. 15 of January 3, 2002” biologically degradable waste forms approximately 57% of the total volume of municipal waste.
In 2003 the European Commission and the Environment Protection Fund supported the project prepared by the Latvian Waste Management Association LIFE Environment for the program “Processing of biologically degradable waste by using methods of composting”. The main task of the project – to establish an optimum scheme for sorting and collecting biologically degradable waste in municipalities, as well as to carry out practical evaluation and utilisation of most suitable composting technologies for their processing, ensuring production of high quality compost.
Within the framework of the above project the material “Management of biologically degradable waste” was prepared and published. It is the goal of the publication to reflect characteristics of biologically degradable waste and their management requirements based upon the collected data and experience of European countries for the promotion of broader introduction of new biological processing technologies in practice in Latvia.
The project was completed in 2005 and in two municipalities – in Stopiņi parish and in Ķekava parish, the scheme of management and processing of biologically degradable waste was developed and introduced, as well experimental results were obtained for introducing the optimum composting technology in practice.
4.3.7. Cross-sectoral Policies and Measures
The summary of cross sectoral policies and measures for reduction of emissions is reflected in Table 4.8.
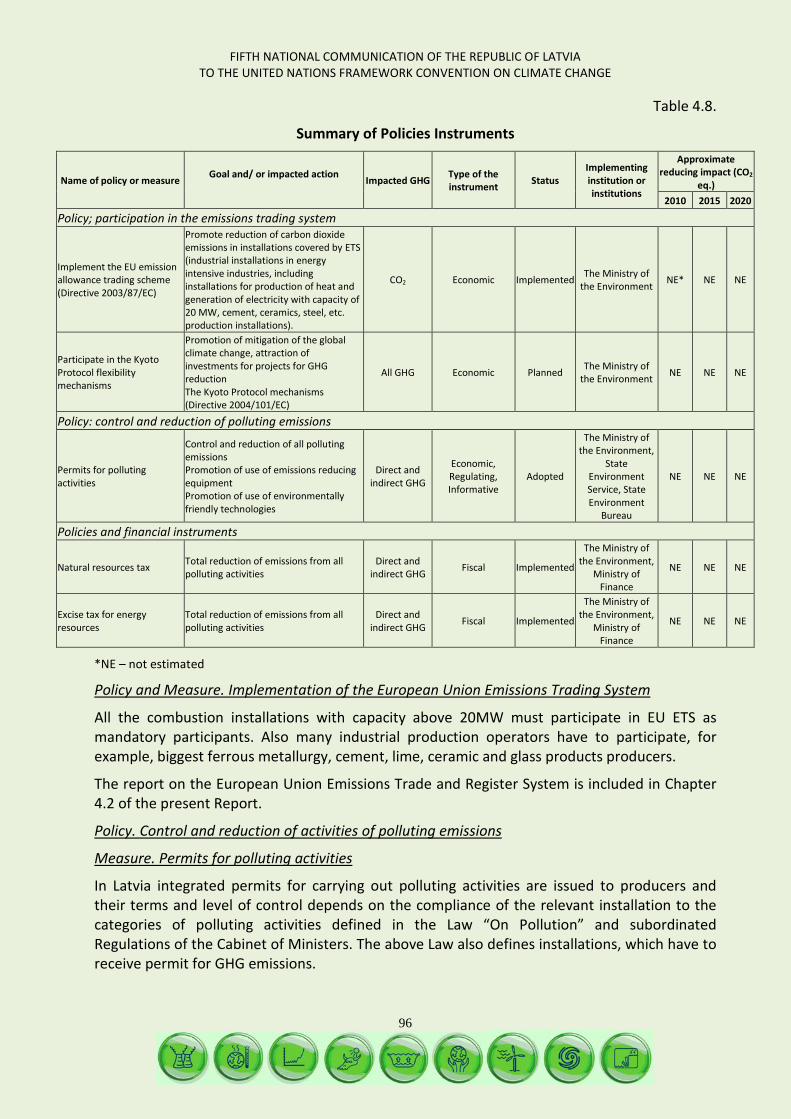
FIFTH NATIONAL COMMUNICATION OF THE REPUBLIC OF LATVIA TO THE UNITED NATIONS FRAMEWORK CONVENTION ON CLIMATE CHANGE
96
Table 4.8.
Summary of Policies Instruments
Name of policy or measure Goal and/ or impacted action Impacted GHG Type of the
instrument Status Implementing institution or institutions
Approximate reducing impact (CO2
eq.) 2010 2015 2020
Policy; participation in the emissions trading system
Implement the EU emission allowance trading scheme (Directive 2003/87/EC)
Promote reduction of carbon dioxide emissions in installations covered by ETS (industrial installations in energy intensive industries, including installations for production of heat and generation of electricity with capacity of 20 MW, cement, ceramics, steel, etc. production installations).
CO2 Economic Implemented The Ministry of the Environment NE* NE NE
Participate in the Kyoto Protocol flexibility mechanisms
Promotion of mitigation of the global climate change, attraction of investments for projects for GHG reduction The Kyoto Protocol mechanisms (Directive 2004/101/EC)
All GHG Economic Planned The Ministry of the Environment NE NE NE
Policy: control and reduction of polluting emissions
Permits for polluting activities
Control and reduction of all polluting emissions Promotion of use of emissions reducing equipment Promotion of use of environmentally friendly technologies
Direct and indirect GHG
Economic, Regulating, Informative
Adopted
The Ministry of the Environment,
State Environment Service, State Environment
Bureau
NE NE NE
Policies and financial instruments
Natural resources tax Total reduction of emissions from all polluting activities
Direct and indirect GHG Fiscal Implemented
The Ministry of the Environment,
Ministry of Finance
NE NE NE
Excise tax for energy resources
Total reduction of emissions from all polluting activities
Direct and indirect GHG Fiscal Implemented
The Ministry of the Environment,
Ministry of Finance
NE NE NE
*NE – not estimated
Policy and Measure. Implementation of the European Union Emissions Trading System
All the combustion installations with capacity above 20MW must participate in EU ETS as mandatory participants. Also many industrial production operators have to participate, for example, biggest ferrous metallurgy, cement, lime, ceramic and glass products producers.
The report on the European Union Emissions Trade and Register System is included in Chapter 4.2 of the present Report.
Policy. Control and reduction of activities of polluting emissions
Measure. Permits for polluting activities
In Latvia integrated permits for carrying out polluting activities are issued to producers and their terms and level of control depends on the compliance of the relevant installation to the categories of polluting activities defined in the Law “On Pollution” and subordinated Regulations of the Cabinet of Ministers. The above Law also defines installations, which have to receive permit for GHG emissions.
FIFTH NATIONAL COMMUNICATION OF THE REPUBLIC OF LATVIA TO THE UNITED NATIONS FRAMEWORK CONVENTION ON CLIMATE CHANGE
97
In the Regulations of the Cabinet of Ministers No. 294 "Procedures by which Polluting Activities of Category A, B and C shall be Declared and Permits for the Performance of Category A and B Polluting Activities shall be Issued” 128
Cleaner production measures ensuring reduction of waste and consumption of raw materials, chemical substances or chemical products, water and energy consumption, replacement of dangerous chemical substances, recycling or re-use of raw materials have to be applied in relation to B category polluting activities. Permits also define standards and restrictions, which have to be taken into consideration by all the operators performing polluting activities. BAT and cleaner production principles have to be applied not only in industry, but also in energy and agriculture.
subordinated to the Law “On Pollution” the procedure for issue of A, B and C category permits for performance of polluting activities and GHG emissions permits, the type of information to be provided in the application for the permit and included in the permit, the monitoring and information provision requirements, etc. have been defined. Permits for polluting activities for A category operators contain a mandatory requirement to apply BAT (Section 21 of the Law “On Pollution”).
Measure. Promotion of use of equipment reducing emissions
In compliance to the Law “On Environment Protection” environment quality norms and standards are mandatory for all users of the environment and natural resources. In order to reduce leakage of volatile oil products, as well as ensure protection of soil and underground water, environment quality norms have been developed for petrol stations, oil bases and movable containers. Specific environment requirements, which define additional restrictions for C category polluting activities, are applied to small scale boiler houses (approximately 1300) depending on their input heat capacity and used fuel as from 2005. Full compliance to the above requirements should be ensured by small scale boiler houses within a period of five years.
Measure. Restriction of sulphur content for certain types of liquid gasoline
In Latvia it is prohibited to import, distribute and use fuel oil (HFO) with sulphur content exceeding 1% (mass percentage). There are exceptions to this prohibition in cases when emissions of sulphur dioxide do not exceed the set air quality norms. In compliance to the requirements of the European Parliament and Council Directive 2001/81/EC of October 23, 2001 on national emission ceilings for certain atmospheric pollutants, emission ceilings of SO2, NOx, NH3 and NMVOC have been defined for Latvia until 2010.
4.3.7.1. Financial instruments
Natural resources tax
In compliance to the Law of December 15, 2005 “On Natural Resources Tax”129
128
(with amendments until 12.06.2009.) the goal of the natural resources tax is to promote economically efficient use of natural resources, to limit pollution of the environment, to reduce production and sale of products polluting the environment, to promote introduction of new, environmental technologies, to support sustainable development of the national economy, and ensure financing for environment protection measures.
http://www.likumi.lv/doc.php?id=64719&from=off 129 http://www.likumi.lv/doc.php?id=124707
FIFTH NATIONAL COMMUNICATION OF THE REPUBLIC OF LATVIA TO THE UNITED NATIONS FRAMEWORK CONVENTION ON CLIMATE CHANGE
98
Natural resources tax is assessed and collected for use of natural resources – nature, also soil, ground, bowels of the Earth, air, water, biological diversity, as well as for pollution of the environment and use of various products harmful to the environment. Rates of the natural resources tax, groups of taxpayers and the procedure of payment are defined in the Regulations of the Cabinet of Ministers No. 504 of June 20, 2006 “Procedure of assessment and payment of the natural resources tax” (with amendments).
Natural resources tax payers, who finance projects by implementing technological improvements or other environment protection measures for reducing environment pollution or consumption of natural resources, can receive tax reliefs.
Excise tax for energy resources
The Law “On Excise Tax” (with amendments until 12.06.2009.) defines the procedure for imposing excise tax on excise goods in compliance to the European Commission and Council Directive 2003/74/EC of October 27, 2003 restructuring the Community framework for the taxation of energy products and electricity, and the European Commission and Council Directive 2004/74/EC of April 29, 2004 amending Directive 2003/96/EC as regards the possibility for certain Member States to apply, in respect of energy products and electricity, temporary exemptions or reductions in the levels of taxation.
Currently tax is imposed to oil products, coal (natural resources tax), peat (natural resources tax) and electricity, however, in future it is planned to impose the tax also to natural gas. The excise tax is not applied to energy resources, when they are used for other purposes and not as a fuel or gasoline. In Latvia excise tax is imposed to oil products, which are imported to Latvia, exported from Latvia, processed, stores, sold, received or dispatched in Latvia (Table 4.9). Depending on the type of oil products and their application it is possible to receive tax reliefs or reductions (for example, for biofuel).
A certain portion of excise tax revenues is used for reconstruction, repair and maintenance of roads. Taking into account liberalisation of electricity and gas markets planned in near future it can be expected that the base and rates of taxes will be changed, including changes in application of tax to electricity and natural gas.
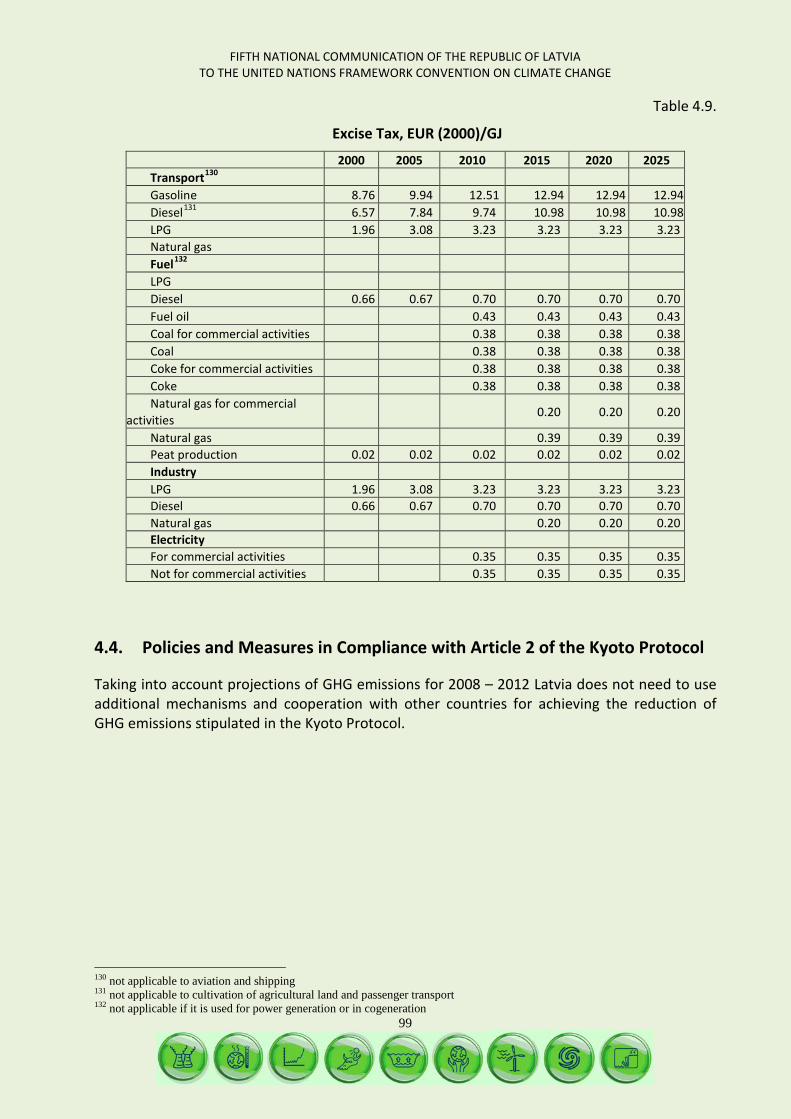
FIFTH NATIONAL COMMUNICATION OF THE REPUBLIC OF LATVIA TO THE UNITED NATIONS FRAMEWORK CONVENTION ON CLIMATE CHANGE
99
Table 4.9.
Excise Tax, EUR (2000)/GJ
2000 2005 2010 2015 2020 2025 Transport130 Gasoline 8.76 9.94 12.51 12.94 12.94 12.94 Diesel131 6.57 7.84 9.74 10.98 10.98 10.98 LPG 1.96 3.08 3.23 3.23 3.23 3.23 Natural gas Fuel132 LPG Diesel 0.66 0.67 0.70 0.70 0.70 0.70 Fuel oil 0.43 0.43 0.43 0.43 Coal for commercial activities 0.38 0.38 0.38 0.38 Coal 0.38 0.38 0.38 0.38 Coke for commercial activities 0.38 0.38 0.38 0.38 Coke 0.38 0.38 0.38 0.38 Natural gas for commercial
activities 0.20 0.20 0.20
Natural gas 0.39 0.39 0.39 Peat production 0.02 0.02 0.02 0.02 0.02 0.02 Industry LPG 1.96 3.08 3.23 3.23 3.23 3.23 Diesel 0.66 0.67 0.70 0.70 0.70 0.70 Natural gas 0.20 0.20 0.20 Electricity For commercial activities 0.35 0.35 0.35 0.35 Not for commercial activities 0.35 0.35 0.35 0.35
4.4. Policies and Measures in Compliance with Article 2 of the Kyoto Protocol
Taking into account projections of GHG emissions for 2008 – 2012 Latvia does not need to use additional mechanisms and cooperation with other countries for achieving the reduction of GHG emissions stipulated in the Kyoto Protocol.
130 not applicable to aviation and shipping 131 not applicable to cultivation of agricultural land and passenger transport 132 not applicable if it is used for power generation or in cogeneration
FIFTH NATIONAL COMMUNICATION OF THE REPUBLIC OF LATVIA TO THE UNITED NATIONS FRAMEWORK CONVENTION ON CLIMATE CHANGE
100
5. PROJECTIONS, TOTAL IMPACT OF POLICIES AND MEASURES AND THE KYOTO PROTOCOL MECHANISMS

FIFTH NATIONAL COMMUNICATION OF THE REPUBLIC OF LATVIA TO THE UNITED NATIONS FRAMEWORK CONVENTION ON CLIMATE CHANGE
101
The Latvian long-term economic strategy defines achievement of the level of welfare of residents compliant to the living standards of the developed countries within foreseeable future as the main goal of the national economics policy. For this purpose Latvia has to achieve the mean GDP per capita of the EU countries within coming 15 – 25 years. The active, preferable and supported scenario of convergence of the national economy development provides for achievement of the defined goals. They can be implemented at a beneficial combination of external and internal factors, as well as successful utilisation of advantages and opportunities.
Main goals and directions of activities of the National Development Plan are directed at economic growth and development of human capital, and the tasks defined for achieving the above generally do not contradict the goals, principles of sustainable development and the National Environment Policy and do not threaten fulfilment of the international obligations of Latvia in the area of environment. Goals of the National Development Plan generally correspond to the EU and national environment planning documents and international conventions. It can be projected that implementation of the National Development Plan will have a positive impact upon the environment because structural changes in the national economy will gain speed and the intensity of use of resources will decrease. GHG emissions depend on activities of the national economy and economic efficiency.
The projections were prepared in the first half of 2008 when just the first signs of economic recession could be seen in the country. The projection of GHG emissions of Latvia is based upon the long-term macro economic development scenario, which is characterised by the following parameters and assumptions:
High annual GDP increase during the first half of the period (on mean 8% per year until 2010), which can decrease to 5% after 2010 taking into account the achieved level of production; The growth of GDP will be determined mainly by increase of productivity and increase of
employment to a lesser extent; Following the high inflation in 2004 – 2008 it will gradually decrease to 3% and stabilise
at the level of 2% during next years; Annual export growth, which is the main precondition for growth in processing industry; A high proportion of import is maintained in the economy and it is promoted by the
stable internal demand, inflow of foreign investments and possibilities to use the EU Structural Funds. Considerable balancing of export and import can be expected after 2010; Changes in the structure of the national economy branches are continued – the
proportion of agriculture decreases and the portion of services grows; Increase of the proportion of high technologies branches in the economy will reduce the
risk of intensification of branches depleting resources.
5.1. Projections
GHG emissions in Latvia are projected for years 2010, 2015 an 2020. It should be taken into account that 2005 has been used as the base year for developing projections and they were based on the inventory GHG for years 1990 – 2005 available at the end of 2007.
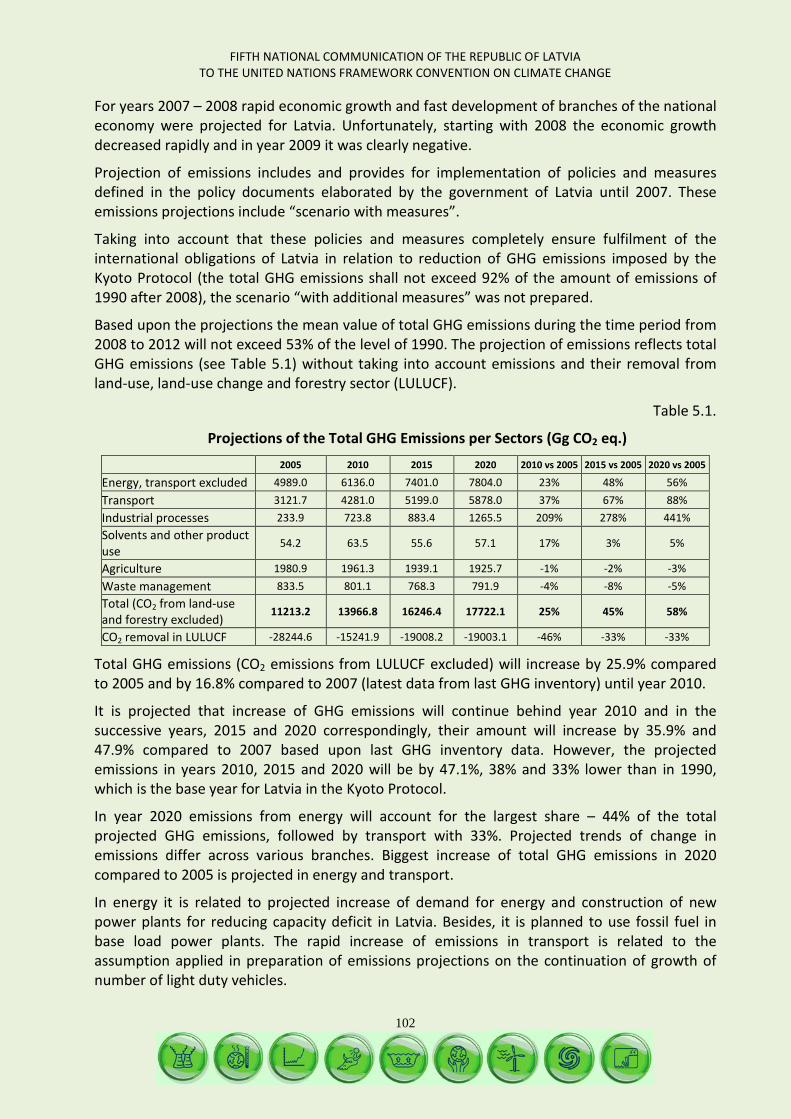
FIFTH NATIONAL COMMUNICATION OF THE REPUBLIC OF LATVIA TO THE UNITED NATIONS FRAMEWORK CONVENTION ON CLIMATE CHANGE
102
For years 2007 – 2008 rapid economic growth and fast development of branches of the national economy were projected for Latvia. Unfortunately, starting with 2008 the economic growth decreased rapidly and in year 2009 it was clearly negative.
Projection of emissions includes and provides for implementation of policies and measures defined in the policy documents elaborated by the government of Latvia until 2007. These emissions projections include “scenario with measures”.
Taking into account that these policies and measures completely ensure fulfilment of the international obligations of Latvia in relation to reduction of GHG emissions imposed by the Kyoto Protocol (the total GHG emissions shall not exceed 92% of the amount of emissions of 1990 after 2008), the scenario “with additional measures” was not prepared.
Based upon the projections the mean value of total GHG emissions during the time period from 2008 to 2012 will not exceed 53% of the level of 1990. The projection of emissions reflects total GHG emissions (see Table 5.1) without taking into account emissions and their removal from land-use, land-use change and forestry sector (LULUCF).
Table 5.1.
Projections of the Total GHG Emissions per Sectors (Gg CO2 eq.) 2005 2010 2015 2020 2010 vs 2005 2015 vs 2005 2020 vs 2005
Energy, transport excluded 4989.0 6136.0 7401.0 7804.0 23% 48% 56% Transport 3121.7 4281.0 5199.0 5878.0 37% 67% 88% Industrial processes 233.9 723.8 883.4 1265.5 209% 278% 441% Solvents and other product use
54.2 63.5 55.6 57.1 17% 3% 5%
Agriculture 1980.9 1961.3 1939.1 1925.7 -1% -2% -3% Waste management 833.5 801.1 768.3 791.9 -4% -8% -5% Total (CO2 from land-use and forestry excluded)
11213.2 13966.8 16246.4 17722.1 25% 45% 58%
CO2 removal in LULUCF -28244.6 -15241.9 -19008.2 -19003.1 -46% -33% -33%
Total GHG emissions (CO2 emissions from LULUCF excluded) will increase by 25.9% compared to 2005 and by 16.8% compared to 2007 (latest data from last GHG inventory) until year 2010.
It is projected that increase of GHG emissions will continue behind year 2010 and in the successive years, 2015 and 2020 correspondingly, their amount will increase by 35.9% and 47.9% compared to 2007 based upon last GHG inventory data. However, the projected emissions in years 2010, 2015 and 2020 will be by 47.1%, 38% and 33% lower than in 1990, which is the base year for Latvia in the Kyoto Protocol.
In year 2020 emissions from energy will account for the largest share – 44% of the total projected GHG emissions, followed by transport with 33%. Projected trends of change in emissions differ across various branches. Biggest increase of total GHG emissions in 2020 compared to 2005 is projected in energy and transport.
In energy it is related to projected increase of demand for energy and construction of new power plants for reducing capacity deficit in Latvia. Besides, it is planned to use fossil fuel in base load power plants. The rapid increase of emissions in transport is related to the assumption applied in preparation of emissions projections on the continuation of growth of number of light duty vehicles.
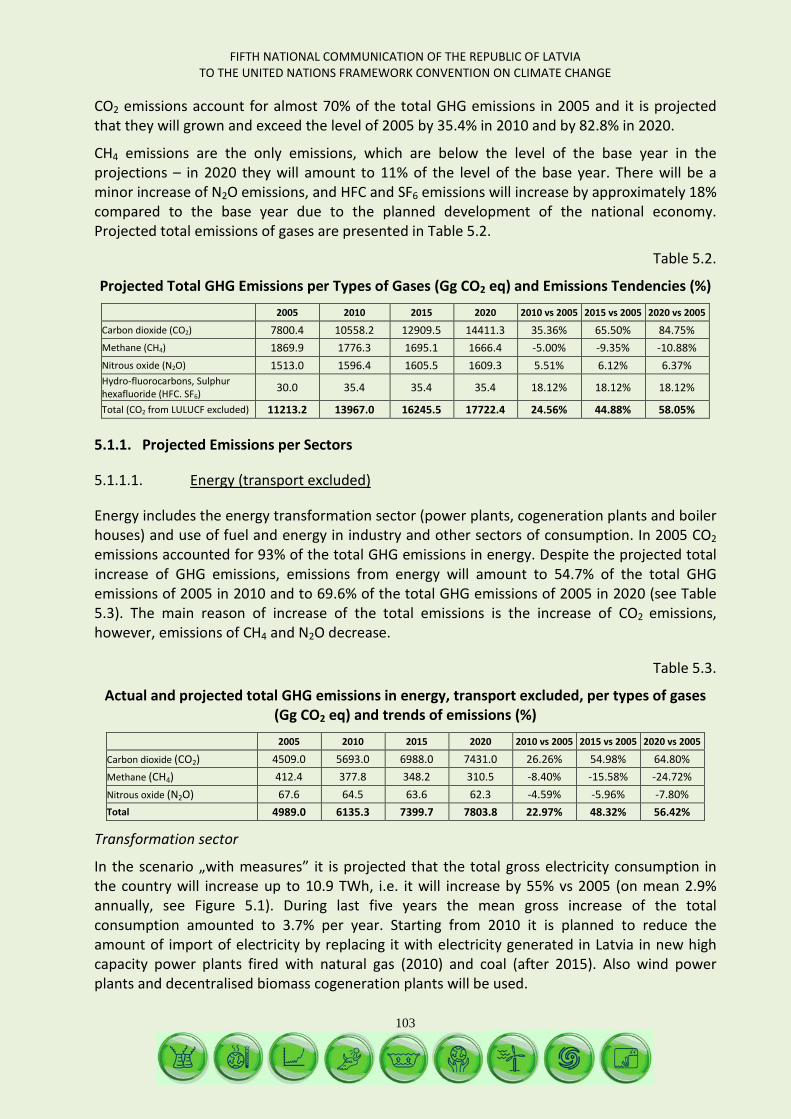
FIFTH NATIONAL COMMUNICATION OF THE REPUBLIC OF LATVIA TO THE UNITED NATIONS FRAMEWORK CONVENTION ON CLIMATE CHANGE
103
CO2 emissions account for almost 70% of the total GHG emissions in 2005 and it is projected that they will grown and exceed the level of 2005 by 35.4% in 2010 and by 82.8% in 2020.
CH4 emissions are the only emissions, which are below the level of the base year in the projections – in 2020 they will amount to 11% of the level of the base year. There will be a minor increase of N2O emissions, and HFC and SF6 emissions will increase by approximately 18% compared to the base year due to the planned development of the national economy. Projected total emissions of gases are presented in Table 5.2.
Table 5.2.
Projected Total GHG Emissions per Types of Gases (Gg CO2 eq) and Emissions Tendencies (%)
2005 2010 2015 2020 2010 vs 2005 2015 vs 2005 2020 vs 2005
Carbon dioxide (CO2) 7800.4 10558.2 12909.5 14411.3 35.36% 65.50% 84.75% Methane (CH4) 1869.9 1776.3 1695.1 1666.4 -5.00% -9.35% -10.88% Nitrous oxide (N2O) 1513.0 1596.4 1605.5 1609.3 5.51% 6.12% 6.37% Hydro-fluorocarbons, Sulphur hexafluoride (HFC. SF6)
30.0 35.4 35.4 35.4 18.12% 18.12% 18.12%
Total (CO2 from LULUCF excluded) 11213.2 13967.0 16245.5 17722.4 24.56% 44.88% 58.05%
5.1.1. Projected Emissions per Sectors
5.1.1.1. Energy (transport excluded)
Energy includes the energy transformation sector (power plants, cogeneration plants and boiler houses) and use of fuel and energy in industry and other sectors of consumption. In 2005 CO2 emissions accounted for 93% of the total GHG emissions in energy. Despite the projected total increase of GHG emissions, emissions from energy will amount to 54.7% of the total GHG emissions of 2005 in 2010 and to 69.6% of the total GHG emissions of 2005 in 2020 (see Table 5.3). The main reason of increase of the total emissions is the increase of CO2 emissions, however, emissions of CH4 and N2O decrease.
Table 5.3.
Actual and projected total GHG emissions in energy, transport excluded, per types of gases (Gg CO2 eq) and trends of emissions (%)
2005 2010 2015 2020 2010 vs 2005 2015 vs 2005 2020 vs 2005
Carbon dioxide (CO2) 4509.0 5693.0 6988.0 7431.0 26.26% 54.98% 64.80% Methane (CH4) 412.4 377.8 348.2 310.5 -8.40% -15.58% -24.72% Nitrous oxide (N2O) 67.6 64.5 63.6 62.3 -4.59% -5.96% -7.80% Total 4989.0 6135.3 7399.7 7803.8 22.97% 48.32% 56.42%
Transformation sector
In the scenario „with measures” it is projected that the total gross electricity consumption in the country will increase up to 10.9 TWh, i.e. it will increase by 55% vs 2005 (on mean 2.9% annually, see Figure 5.1). During last five years the mean gross increase of the total consumption amounted to 3.7% per year. Starting from 2010 it is planned to reduce the amount of import of electricity by replacing it with electricity generated in Latvia in new high capacity power plants fired with natural gas (2010) and coal (after 2015). Also wind power plants and decentralised biomass cogeneration plants will be used.
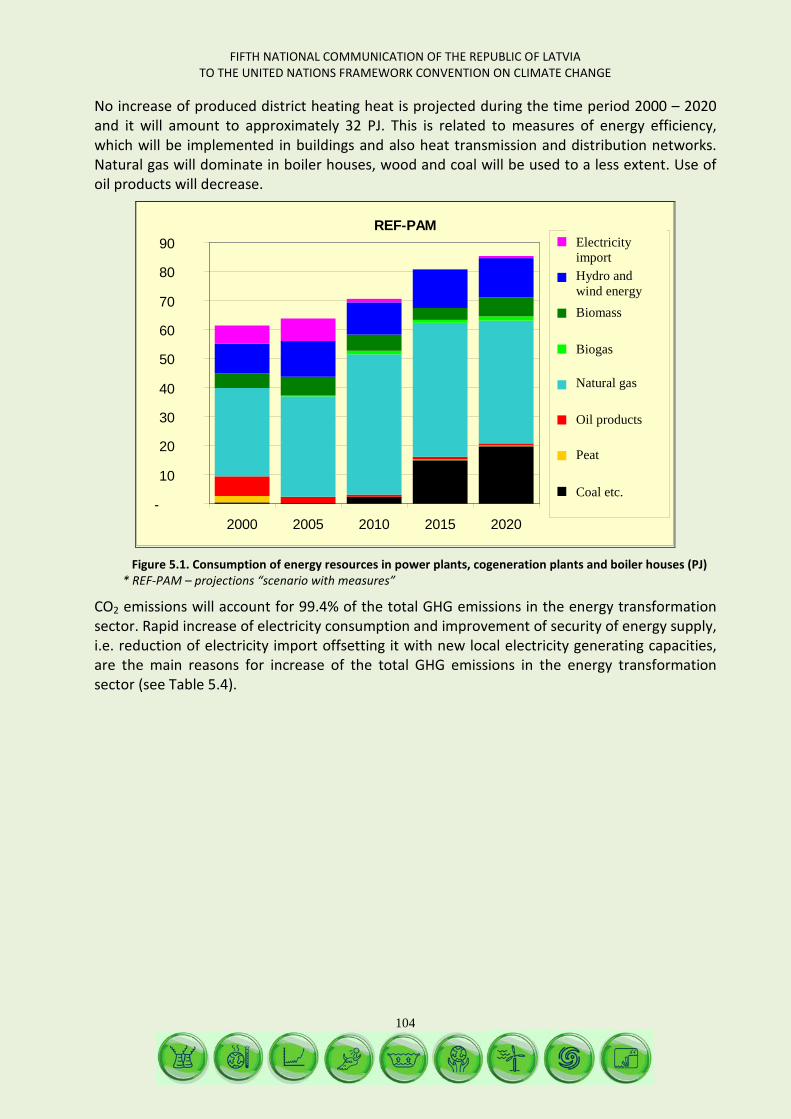
FIFTH NATIONAL COMMUNICATION OF THE REPUBLIC OF LATVIA TO THE UNITED NATIONS FRAMEWORK CONVENTION ON CLIMATE CHANGE
104
No increase of produced district heating heat is projected during the time period 2000 – 2020 and it will amount to approximately 32 PJ. This is related to measures of energy efficiency, which will be implemented in buildings and also heat transmission and distribution networks. Natural gas will dominate in boiler houses, wood and coal will be used to a less extent. Use of oil products will decrease.
REF-PAM
-
10
20
30
40
50
60
70
80
90
2000 2005 2010 2015 2020
ElktroenerģijasimportsHidro un VējaenerģijaBiomasa
Biogāze
Dabas gāze
Naftas produkti
Kūdra
Oglec u.c.
Figure 5.1. Consumption of energy resources in power plants, cogeneration plants and boiler houses (PJ)
* REF-PAM – projections “scenario with measures”
CO2 emissions will account for 99.4% of the total GHG emissions in the energy transformation sector. Rapid increase of electricity consumption and improvement of security of energy supply, i.e. reduction of electricity import offsetting it with new local electricity generating capacities, are the main reasons for increase of the total GHG emissions in the energy transformation sector (see Table 5.4).
Electricity import
Hydro and wind energy
Biomass
Biogas
Natural gas
Oil products
Peat
Coal etc.
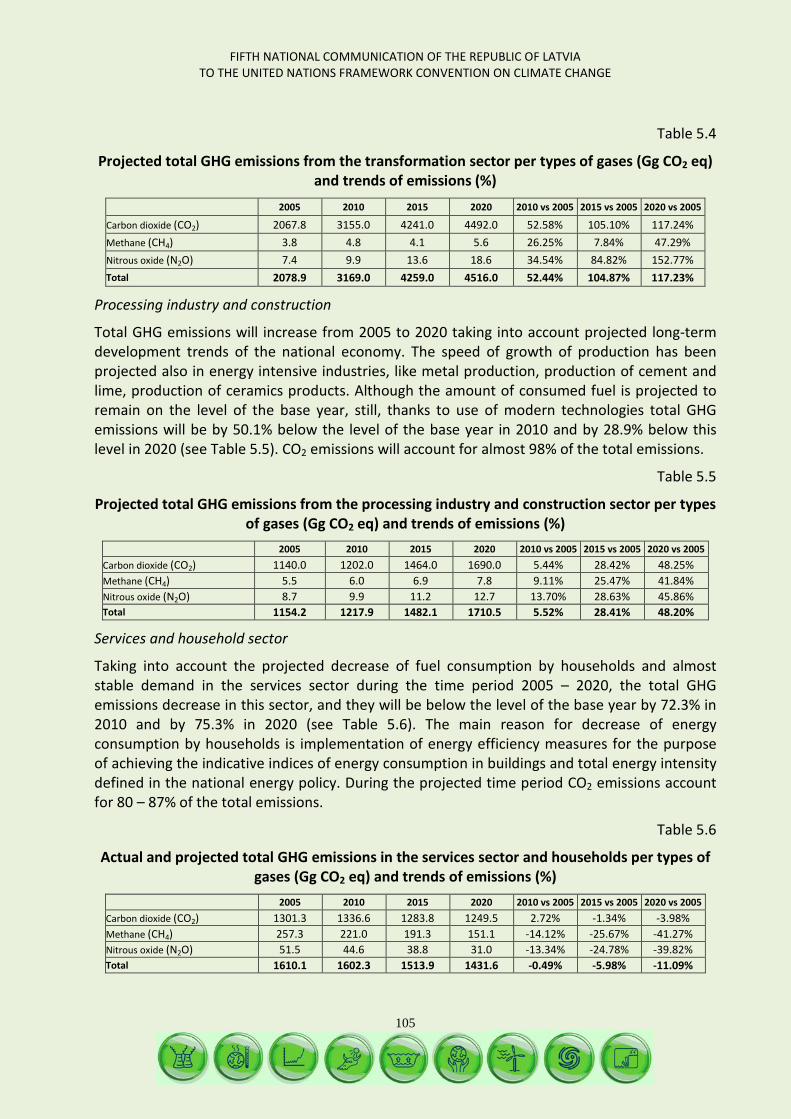
FIFTH NATIONAL COMMUNICATION OF THE REPUBLIC OF LATVIA TO THE UNITED NATIONS FRAMEWORK CONVENTION ON CLIMATE CHANGE
105
Table 5.4
Projected total GHG emissions from the transformation sector per types of gases (Gg CO2 eq) and trends of emissions (%)
2005 2010 2015 2020 2010 vs 2005 2015 vs 2005 2020 vs 2005
Carbon dioxide (CO2) 2067.8 3155.0 4241.0 4492.0 52.58% 105.10% 117.24% Methane (CH4) 3.8 4.8 4.1 5.6 26.25% 7.84% 47.29% Nitrous oxide (N2O) 7.4 9.9 13.6 18.6 34.54% 84.82% 152.77% Total 2078.9 3169.0 4259.0 4516.0 52.44% 104.87% 117.23%
Processing industry and construction
Total GHG emissions will increase from 2005 to 2020 taking into account projected long-term development trends of the national economy. The speed of growth of production has been projected also in energy intensive industries, like metal production, production of cement and lime, production of ceramics products. Although the amount of consumed fuel is projected to remain on the level of the base year, still, thanks to use of modern technologies total GHG emissions will be by 50.1% below the level of the base year in 2010 and by 28.9% below this level in 2020 (see Table 5.5). CO2 emissions will account for almost 98% of the total emissions.
Table 5.5
Projected total GHG emissions from the processing industry and construction sector per types of gases (Gg CO2 eq) and trends of emissions (%)
2005 2010 2015 2020 2010 vs 2005 2015 vs 2005 2020 vs 2005 Carbon dioxide (CO2) 1140.0 1202.0 1464.0 1690.0 5.44% 28.42% 48.25% Methane (CH4) 5.5 6.0 6.9 7.8 9.11% 25.47% 41.84% Nitrous oxide (N2O) 8.7 9.9 11.2 12.7 13.70% 28.63% 45.86% Total 1154.2 1217.9 1482.1 1710.5 5.52% 28.41% 48.20%
Services and household sector
Taking into account the projected decrease of fuel consumption by households and almost stable demand in the services sector during the time period 2005 – 2020, the total GHG emissions decrease in this sector, and they will be below the level of the base year by 72.3% in 2010 and by 75.3% in 2020 (see Table 5.6). The main reason for decrease of energy consumption by households is implementation of energy efficiency measures for the purpose of achieving the indicative indices of energy consumption in buildings and total energy intensity defined in the national energy policy. During the projected time period CO2 emissions account for 80 – 87% of the total emissions.
Table 5.6
Actual and projected total GHG emissions in the services sector and households per types of gases (Gg CO2 eq) and trends of emissions (%)
2005 2010 2015 2020 2010 vs 2005 2015 vs 2005 2020 vs 2005 Carbon dioxide (CO2) 1301.3 1336.6 1283.8 1249.5 2.72% -1.34% -3.98% Methane (CH4) 257.3 221.0 191.3 151.1 -14.12% -25.67% -41.27% Nitrous oxide (N2O) 51.5 44.6 38.8 31.0 -13.34% -24.78% -39.82% Total 1610.1 1602.3 1513.9 1431.6 -0.49% -5.98% -11.09%
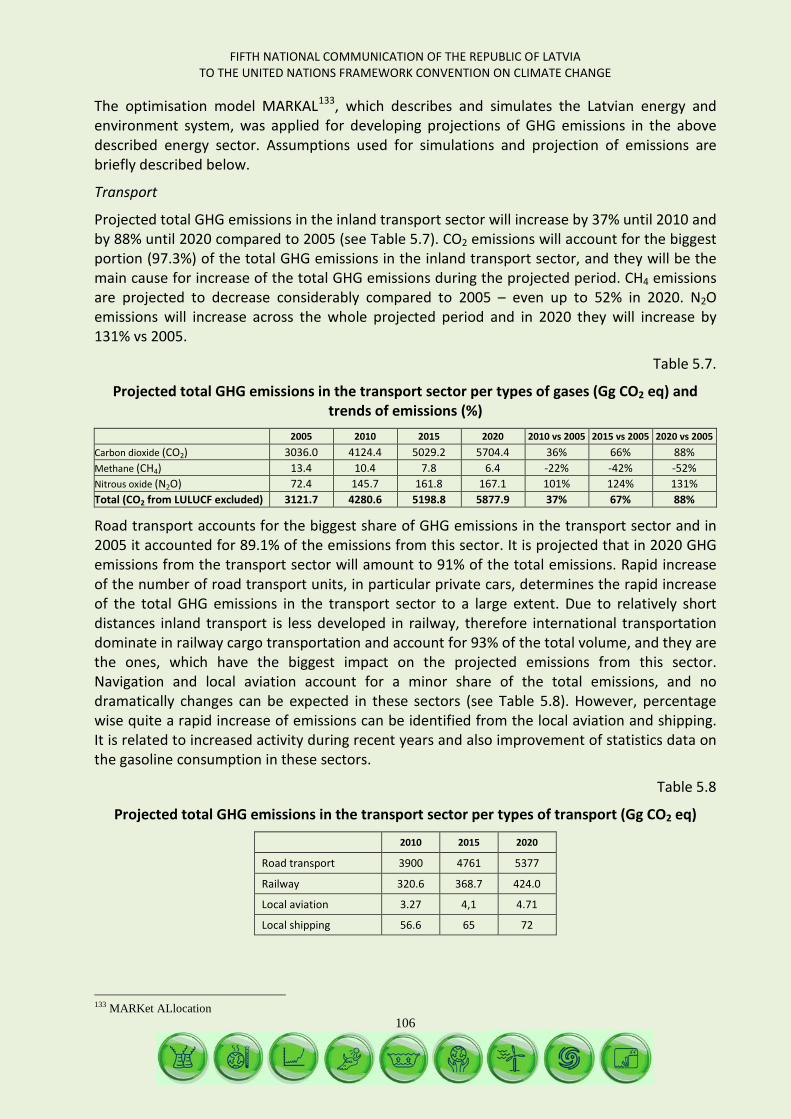
FIFTH NATIONAL COMMUNICATION OF THE REPUBLIC OF LATVIA TO THE UNITED NATIONS FRAMEWORK CONVENTION ON CLIMATE CHANGE
106
The optimisation model MARKAL133
Transport
, which describes and simulates the Latvian energy and environment system, was applied for developing projections of GHG emissions in the above described energy sector. Assumptions used for simulations and projection of emissions are briefly described below.
Projected total GHG emissions in the inland transport sector will increase by 37% until 2010 and by 88% until 2020 compared to 2005 (see Table 5.7). CO2 emissions will account for the biggest portion (97.3%) of the total GHG emissions in the inland transport sector, and they will be the main cause for increase of the total GHG emissions during the projected period. CH4 emissions are projected to decrease considerably compared to 2005 – even up to 52% in 2020. N2O emissions will increase across the whole projected period and in 2020 they will increase by 131% vs 2005.
Table 5.7.
Projected total GHG emissions in the transport sector per types of gases (Gg CO2 eq) and trends of emissions (%)
2005 2010 2015 2020 2010 vs 2005 2015 vs 2005 2020 vs 2005 Carbon dioxide (CO2) 3036.0 4124.4 5029.2 5704.4 36% 66% 88% Methane (CH4) 13.4 10.4 7.8 6.4 -22% -42% -52% Nitrous oxide (N2O) 72.4 145.7 161.8 167.1 101% 124% 131% Total (CO2 from LULUCF excluded) 3121.7 4280.6 5198.8 5877.9 37% 67% 88%
Road transport accounts for the biggest share of GHG emissions in the transport sector and in 2005 it accounted for 89.1% of the emissions from this sector. It is projected that in 2020 GHG emissions from the transport sector will amount to 91% of the total emissions. Rapid increase of the number of road transport units, in particular private cars, determines the rapid increase of the total GHG emissions in the transport sector to a large extent. Due to relatively short distances inland transport is less developed in railway, therefore international transportation dominate in railway cargo transportation and account for 93% of the total volume, and they are the ones, which have the biggest impact on the projected emissions from this sector. Navigation and local aviation account for a minor share of the total emissions, and no dramatically changes can be expected in these sectors (see Table 5.8). However, percentage wise quite a rapid increase of emissions can be identified from the local aviation and shipping. It is related to increased activity during recent years and also improvement of statistics data on the gasoline consumption in these sectors.
Table 5.8
Projected total GHG emissions in the transport sector per types of transport (Gg CO2 eq)
2010 2015 2020
Road transport 3900 4761 5377
Railway 320.6 368.7 424.0
Local aviation 3.27 4,1 4.71
Local shipping 56.6 65 72
133 MARKet ALlocation

FIFTH NATIONAL COMMUNICATION OF THE REPUBLIC OF LATVIA TO THE UNITED NATIONS FRAMEWORK CONVENTION ON CLIMATE CHANGE
107
5.1.1.2. Industrial processes and Solvents and other product use
Emissions, which are not directly related to fuel consumption, are included under industrial processes. Emissions caused by use of raw materials in technological equipment of industrial manufacturing processes accounted only for 2.6% of the total GHG emissions in 2005.
Projected fast development of production in various sub-sectors of the industry sector indicate increase of GHG emissions from industrial processed by 209.5% in 2010 and by 441.1% in 2020 compared to 2005. CO2 emissions will account for the biggest share of the total emissions (87% in 2005), and will increase by 503.4% until 2020 compared to 2005 (see Table 5.9).
The biggest volume of production is projected in the sector of production of minerals – cement, lime, construction materials. According to the projections the amount of produced cement will increase by 85% and the amount of the produced cement clinker will increase by approximately 92%. The total produced amount of iron and steel is projected to increase by up to 50%, including the increase of produced steel by 32%. Projections of industrial production volumes are impacted by the rapid pace of development of construction, as well as the planned development of machine manufacturing.
Table 5.9
Projected total GHG emissions from industrial processes per types of gases (Gg CO2 eq) and trends of emissions (%)
2005 2010 2015 2020 2010 vs 2005 2015 vs 2005 2020 vs 2005
Carbon dioxide (CO2) 203.83 688.33 847.86 1229.94 237.70% 315.97% 503.42% Methane (CH4) 0.06 0.07 0.09 0.11 24.55% 57.45% 93.41% Hydro-fluorocarbons, Sulphur hexafluoride (HFC, SF6)
29.99 35.43 35.43 35.43 18.12% 18.12% 18.12%
Total (CO2 from LULUCF excluded) 233.88 723.83 883.38 1265.48 209.49% 277.71% 441.08%
The trend of development of use of fluoride gases during recent years (2000 – 2006) indicate that their volume is growing dramatically, thus, most probably the consumption of fluoride gases will continue to increase over next years.
5.1.1.3. Use of solvents and other products
Total GHG emissions from the use of solvents and other products will increase by 17.2% compared to 2005 by 2010, and slight changes in the volume are projected after 2015 (see Table 5.10). Increase of volumes in construction, as well as growth of the production, import and consumption of paints and varnishing materials is the main factors for the increase of emissions.
Table 5.10
Projected total GHG emissions from use of solvents and other products per types of gases (Gg CO2 eq) and trends of emissions (%)
2005 2010 2015 2020 2010 vs 2005 2015 vs 2005 2020 vs 2005
Carbon dioxide (CO2) 51.10 51.75 43.81 45.28 1.28% -14.26% -11.39% Nitrous oxide (N2O) 3.10 11.78 11.78 11.78 280.00% 280.00% 280.00% Total (CO2 from LULUCF excluded) 54.20 63.53 55.59 57.06 17.22% 2.57% 5.28%
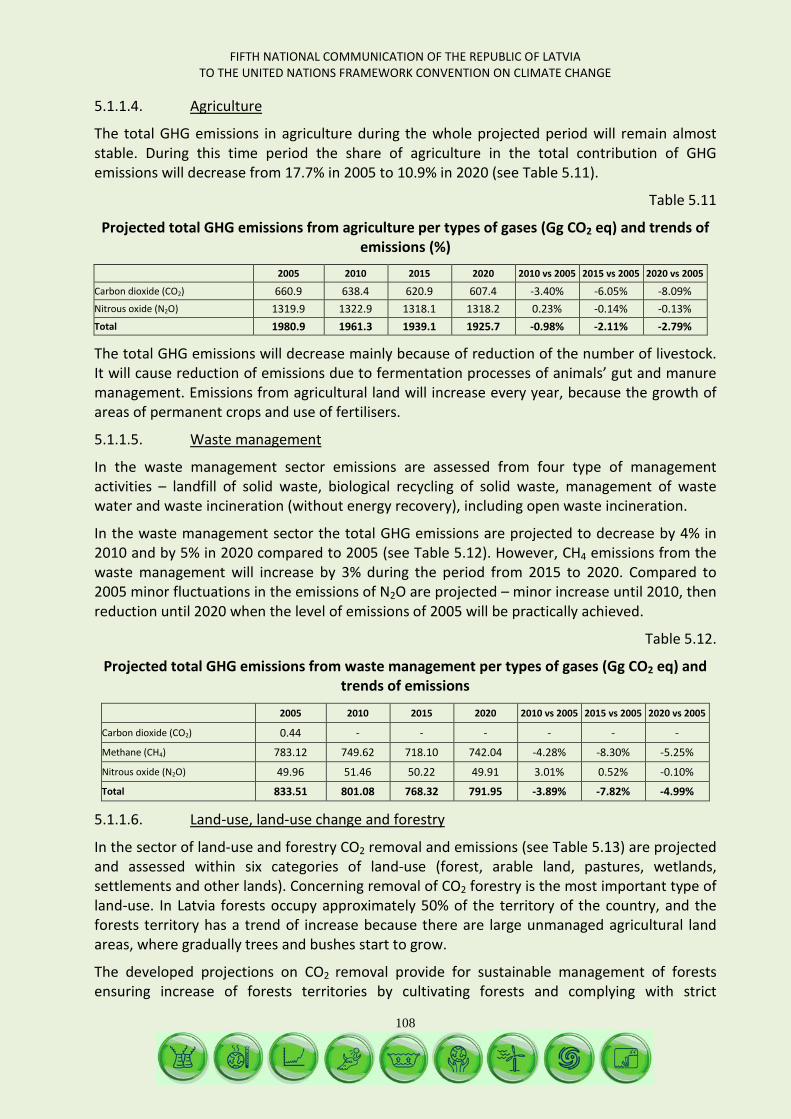
FIFTH NATIONAL COMMUNICATION OF THE REPUBLIC OF LATVIA TO THE UNITED NATIONS FRAMEWORK CONVENTION ON CLIMATE CHANGE
108
5.1.1.4. Agriculture
The total GHG emissions in agriculture during the whole projected period will remain almost stable. During this time period the share of agriculture in the total contribution of GHG emissions will decrease from 17.7% in 2005 to 10.9% in 2020 (see Table 5.11).
Table 5.11
Projected total GHG emissions from agriculture per types of gases (Gg CO2 eq) and trends of emissions (%)
2005 2010 2015 2020 2010 vs 2005 2015 vs 2005 2020 vs 2005
Carbon dioxide (CO2) 660.9 638.4 620.9 607.4 -3.40% -6.05% -8.09% Nitrous oxide (N2O) 1319.9 1322.9 1318.1 1318.2 0.23% -0.14% -0.13% Total 1980.9 1961.3 1939.1 1925.7 -0.98% -2.11% -2.79%
The total GHG emissions will decrease mainly because of reduction of the number of livestock. It will cause reduction of emissions due to fermentation processes of animals’ gut and manure management. Emissions from agricultural land will increase every year, because the growth of areas of permanent crops and use of fertilisers.
5.1.1.5. Waste management
In the waste management sector emissions are assessed from four type of management activities – landfill of solid waste, biological recycling of solid waste, management of waste water and waste incineration (without energy recovery), including open waste incineration.
In the waste management sector the total GHG emissions are projected to decrease by 4% in 2010 and by 5% in 2020 compared to 2005 (see Table 5.12). However, CH4 emissions from the waste management will increase by 3% during the period from 2015 to 2020. Compared to 2005 minor fluctuations in the emissions of N2O are projected – minor increase until 2010, then reduction until 2020 when the level of emissions of 2005 will be practically achieved.
Table 5.12.
Projected total GHG emissions from waste management per types of gases (Gg CO2 eq) and trends of emissions
2005 2010 2015 2020 2010 vs 2005 2015 vs 2005 2020 vs 2005
Carbon dioxide (CO2) 0.44 - - - - - -
Methane (CH4) 783.12 749.62 718.10 742.04 -4.28% -8.30% -5.25%
Nitrous oxide (N2O) 49.96 51.46 50.22 49.91 3.01% 0.52% -0.10%
Total 833.51 801.08 768.32 791.95 -3.89% -7.82% -4.99%
5.1.1.6. Land-use, land-use change and forestry
In the sector of land-use and forestry CO2 removal and emissions (see Table 5.13) are projected and assessed within six categories of land-use (forest, arable land, pastures, wetlands, settlements and other lands). Concerning removal of CO2 forestry is the most important type of land-use. In Latvia forests occupy approximately 50% of the territory of the country, and the forests territory has a trend of increase because there are large unmanaged agricultural land areas, where gradually trees and bushes start to grow.
The developed projections on CO2 removal provide for sustainable management of forests ensuring increase of forests territories by cultivating forests and complying with strict
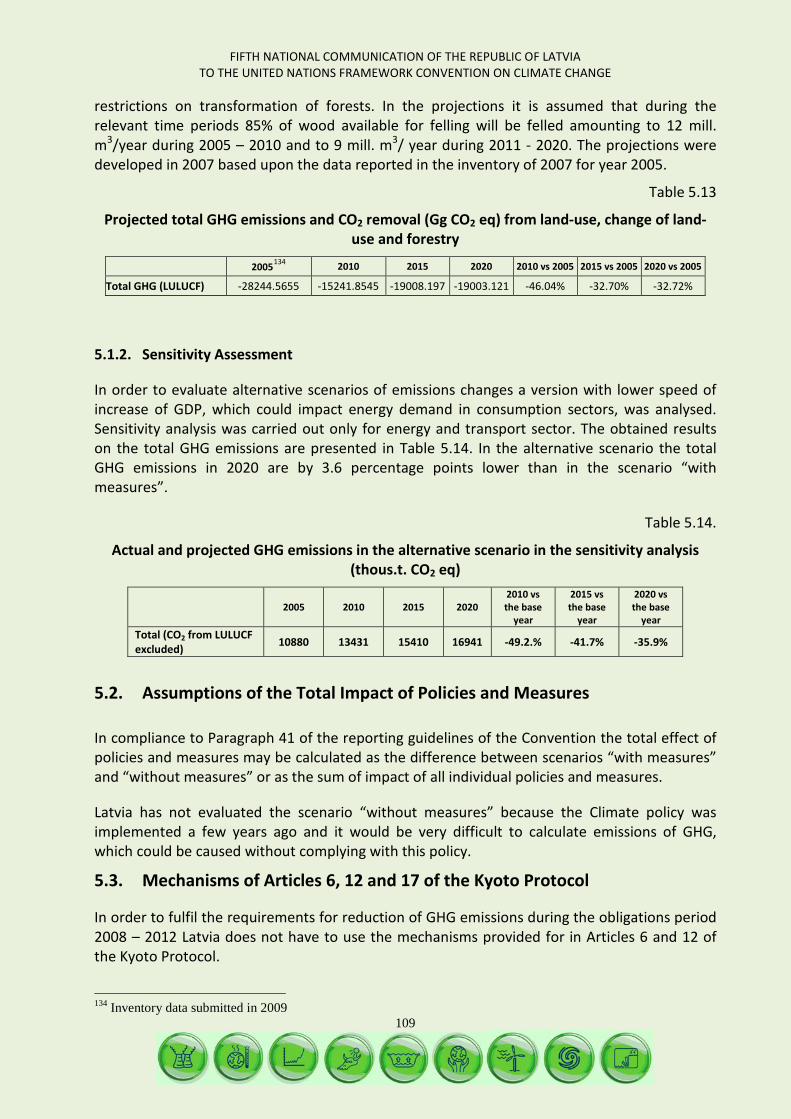
FIFTH NATIONAL COMMUNICATION OF THE REPUBLIC OF LATVIA TO THE UNITED NATIONS FRAMEWORK CONVENTION ON CLIMATE CHANGE
109
restrictions on transformation of forests. In the projections it is assumed that during the relevant time periods 85% of wood available for felling will be felled amounting to 12 mill. m3/year during 2005 – 2010 and to 9 mill. m3/ year during 2011 - 2020. The projections were developed in 2007 based upon the data reported in the inventory of 2007 for year 2005.
Table 5.13
Projected total GHG emissions and CO2 removal (Gg CO2 eq) from land-use, change of land-use and forestry
2005134 2010 2015 2020 2010 vs 2005 2015 vs 2005 2020 vs 2005
Total GHG (LULUCF) -28244.5655 -15241.8545 -19008.197 -19003.121 -46.04% -32.70% -32.72%
5.1.2. Sensitivity Assessment
In order to evaluate alternative scenarios of emissions changes a version with lower speed of increase of GDP, which could impact energy demand in consumption sectors, was analysed. Sensitivity analysis was carried out only for energy and transport sector. The obtained results on the total GHG emissions are presented in Table 5.14. In the alternative scenario the total GHG emissions in 2020 are by 3.6 percentage points lower than in the scenario “with measures”.
Table 5.14.
Actual and projected GHG emissions in the alternative scenario in the sensitivity analysis (thous.t. CO2 eq)
2005 2010 2015 2020 2010 vs the base
year
2015 vs the base
year
2020 vs the base
year Total (CO2 from LULUCF excluded) 10880 13431 15410 16941 -49.2.% -41.7% -35.9%
5.2. Assumptions of the Total Impact of Policies and Measures
In compliance to Paragraph 41 of the reporting guidelines of the Convention the total effect of policies and measures may be calculated as the difference between scenarios “with measures” and “without measures” or as the sum of impact of all individual policies and measures.
Latvia has not evaluated the scenario “without measures” because the Climate policy was implemented a few years ago and it would be very difficult to calculate emissions of GHG, which could be caused without complying with this policy.
5.3. Mechanisms of Articles 6, 12 and 17 of the Kyoto Protocol
In order to fulfil the requirements for reduction of GHG emissions during the obligations period 2008 – 2012 Latvia does not have to use the mechanisms provided for in Articles 6 and 12 of the Kyoto Protocol.
134 Inventory data submitted in 2009
FIFTH NATIONAL COMMUNICATION OF THE REPUBLIC OF LATVIA TO THE UNITED NATIONS FRAMEWORK CONVENTION ON CLIMATE CHANGE
110
As from 2008 Latvia has joined the international emissions allowances trading system.
5.4. Methodology
Different methods were applied for projecting emissions in each of the sectors.
5.4.1. Energy
Emissions of the energy sector were projected using the MARKAL model, which describes the whole energy supply system.
MARKAL is an optimisation model, which usually describes development of a particular energy branch during a period of 40 – 50 years on the national or regional model depending on the input data. Results obtained with MARKAL model depend on input parameters and algorithm of the model. The main paradigms of the model are the perfect market (competitive partial equilibrium) and visibility of development of technologies during a period of several decades.
For MARKAL model projections on prices of energy resources and energy service demands or other parameters (for example, area of heated premises or mileage of vehicles reflecting the required amount of energy) are required as input data. Consumption of electricity and district heating is determined by the model itself.
The structure of the model is adapted, so that emissions can be calculated not only based upon the type of fuel, but also based upon the sector and corresponding technologies, which is important for NMVOC and NOx calculations. For the performance of diverse analysis the energy and environment system analysis tool has been created and is based upon the structure of the Latvian energy, possible future technologies, emissions reduction possibilities and energy development scenarios, taking into account the following:
The environment factor – NOx, SO2, NMVOC, GHG emissions restrictions; Broader use of renewable and local resources – a bigger share of RES in the total
national electricity demand; broader use of wood in district heating production; Emissions reduction possibilities by implementing energy efficiency measures; Security of electricity supply in the country – import of electricity; Regional trade possibilities – electricity and emissions markets; Uncertainty factor of emissions reduction goals.
By application of energy and environment system models replies to the following and similar questions are found:
How energy should be developed to achieve secure and costs efficient energy supply; What will the emissions level be if new environment legislation enters into force; What measures have to be implemented for fulfilling environment conditions and
what impact will they have upon the energy supply structure, and what will be the costs of reduction of emissions; To what extent the developed strategies and their costs depend on assumptions
(energy price, economic growth, energy demand, etc.).
Measures for reduction of emissions, which can be evaluated by the model, can be grouped according to the following characteristics:
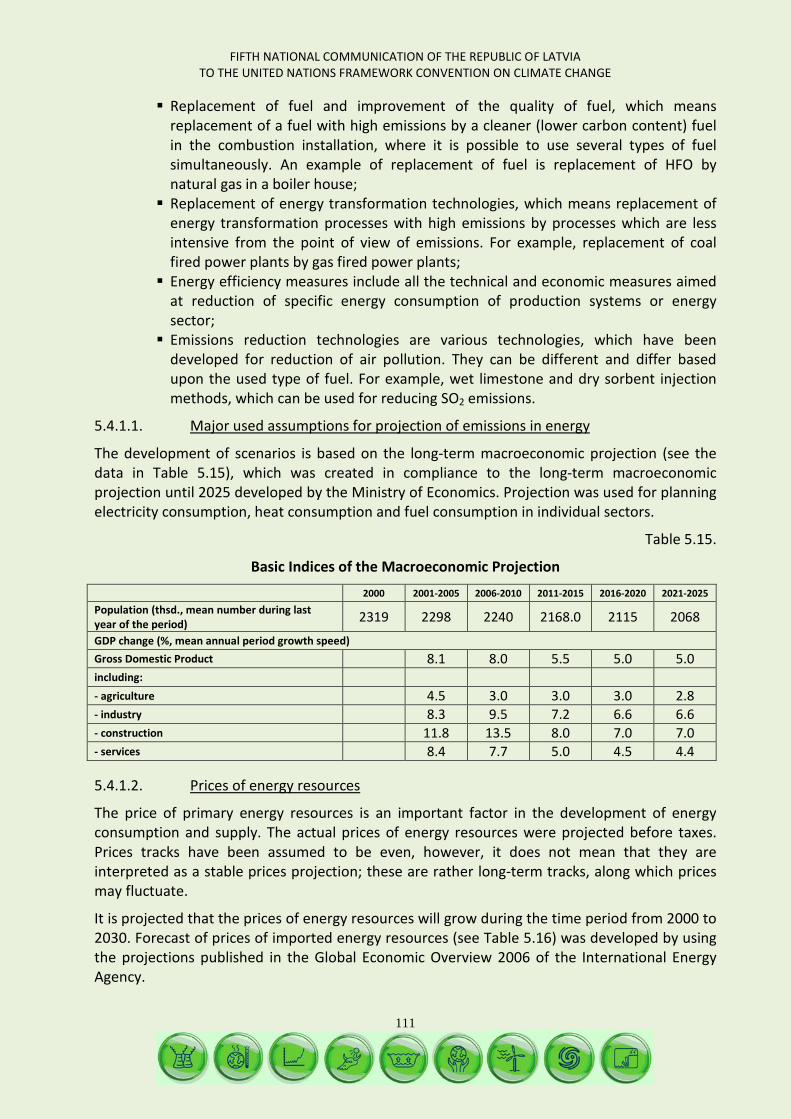
FIFTH NATIONAL COMMUNICATION OF THE REPUBLIC OF LATVIA TO THE UNITED NATIONS FRAMEWORK CONVENTION ON CLIMATE CHANGE
111
Replacement of fuel and improvement of the quality of fuel, which means replacement of a fuel with high emissions by a cleaner (lower carbon content) fuel in the combustion installation, where it is possible to use several types of fuel simultaneously. An example of replacement of fuel is replacement of HFO by natural gas in a boiler house; Replacement of energy transformation technologies, which means replacement of
energy transformation processes with high emissions by processes which are less intensive from the point of view of emissions. For example, replacement of coal fired power plants by gas fired power plants; Energy efficiency measures include all the technical and economic measures aimed
at reduction of specific energy consumption of production systems or energy sector; Emissions reduction technologies are various technologies, which have been
developed for reduction of air pollution. They can be different and differ based upon the used type of fuel. For example, wet limestone and dry sorbent injection methods, which can be used for reducing SO2 emissions.
5.4.1.1. Major used assumptions for projection of emissions in energy
The development of scenarios is based on the long-term macroeconomic projection (see the data in Table 5.15), which was created in compliance to the long-term macroeconomic projection until 2025 developed by the Ministry of Economics. Projection was used for planning electricity consumption, heat consumption and fuel consumption in individual sectors.
Table 5.15.
Basic Indices of the Macroeconomic Projection 2000 2001-2005 2006-2010 2011-2015 2016-2020 2021-2025
Population (thsd., mean number during last year of the period) 2319 2298 2240 2168.0 2115 2068 GDP change (%, mean annual period growth speed) Gross Domestic Product 8.1 8.0 5.5 5.0 5.0 including: - agriculture 4.5 3.0 3.0 3.0 2.8 - industry 8.3 9.5 7.2 6.6 6.6 - construction 11.8 13.5 8.0 7.0 7.0 - services 8.4 7.7 5.0 4.5 4.4
5.4.1.2. Prices of energy resources
The price of primary energy resources is an important factor in the development of energy consumption and supply. The actual prices of energy resources were projected before taxes. Prices tracks have been assumed to be even, however, it does not mean that they are interpreted as a stable prices projection; these are rather long-term tracks, along which prices may fluctuate.
It is projected that the prices of energy resources will grow during the time period from 2000 to 2030. Forecast of prices of imported energy resources (see Table 5.16) was developed by using the projections published in the Global Economic Overview 2006 of the International Energy Agency.
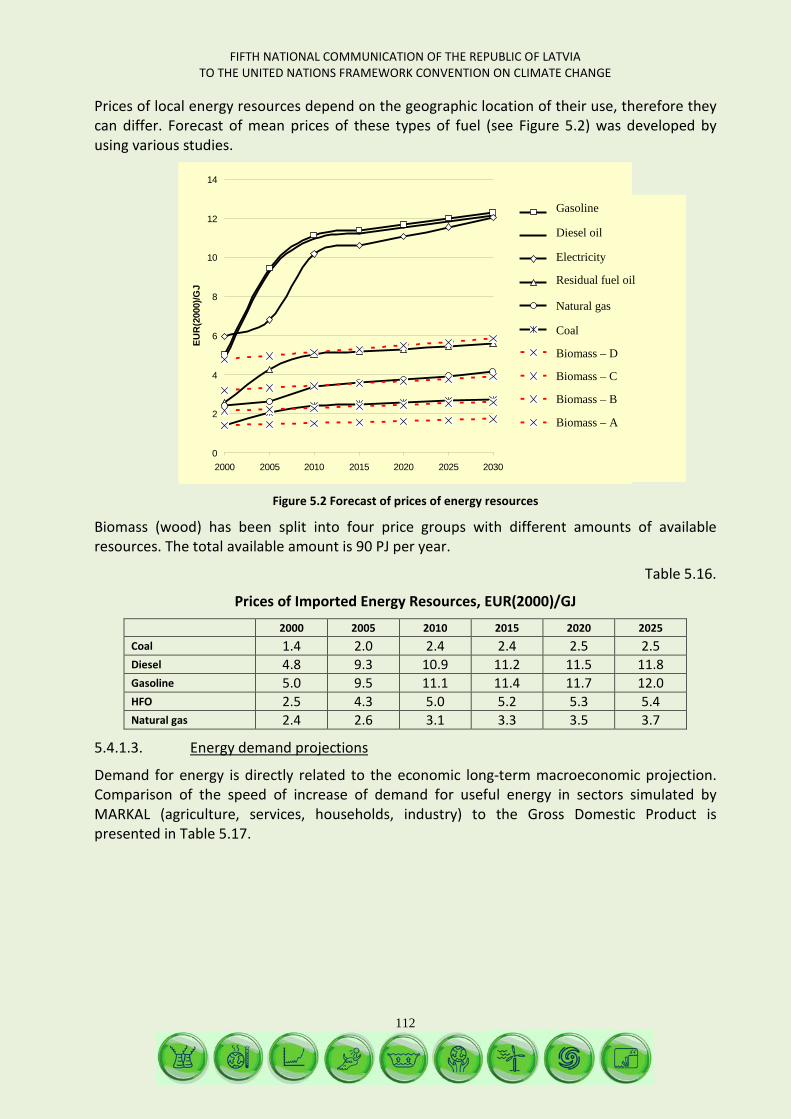
FIFTH NATIONAL COMMUNICATION OF THE REPUBLIC OF LATVIA TO THE UNITED NATIONS FRAMEWORK CONVENTION ON CLIMATE CHANGE
112
Prices of local energy resources depend on the geographic location of their use, therefore they can differ. Forecast of mean prices of these types of fuel (see Figure 5.2) was developed by using various studies.
0
2
4
6
8
10
12
14
2000 2005 2010 2015 2020 2025 2030
EUR
(200
0)/G
J
Benzīns
Dīzeļdegviela
Elektroenerģija
Mazuts
Dabas gāze
Ogles
Biomasa - D
Biomasa - C
Biomasa - B
Biomasa - A
Figure 5.2 Forecast of prices of energy resources
Biomass (wood) has been split into four price groups with different amounts of available resources. The total available amount is 90 PJ per year.
Table 5.16.
Prices of Imported Energy Resources, EUR(2000)/GJ
2000 2005 2010 2015 2020 2025 Coal 1.4 2.0 2.4 2.4 2.5 2.5 Diesel 4.8 9.3 10.9 11.2 11.5 11.8 Gasoline 5.0 9.5 11.1 11.4 11.7 12.0 HFO 2.5 4.3 5.0 5.2 5.3 5.4 Natural gas 2.4 2.6 3.1 3.3 3.5 3.7
5.4.1.3. Energy demand projections
Demand for energy is directly related to the economic long-term macroeconomic projection. Comparison of the speed of increase of demand for useful energy in sectors simulated by MARKAL (agriculture, services, households, industry) to the Gross Domestic Product is presented in Table 5.17.
Gasoline Diesel oil Electricity Residual fuel oil Natural gas Coal Biomass – D Biomass – C Biomass – B
Biomass – A
FIFTH NATIONAL COMMUNICATION OF THE REPUBLIC OF LATVIA TO THE UNITED NATIONS FRAMEWORK CONVENTION ON CLIMATE CHANGE
113
Table 5.17.
Mean Annual Rate of Development of the Demand for Useful Energy
2001-2005 2006-2010 2011-2015 2016-2020 2021-2025 2026-2030 GDP annual growth, % 8.0 8.0 5.5 5.0 5.0 4.3 Annual growth of the demand for useful energy, % 3.4 2.7 1.9 1.7 1.6 1.4
Agriculture 1.7 0.8 0.6 0.6 0.5 0.2 Services 5.7 3.8 2.6 2.3 2.1 1.7 Residents (household) 2.1 0.8 0.6 0.8 0.7 0.7 Industry 1.2 2.8 2.5 2.4 1.9 1.7 Energy intensity, (2000 = 1) 0.80 0.62 0.52 0.44 0.38 0.33
In the GHG emissions projections scenario “with measures” the policy goals, measures to be implemented and indicative values defined in the document “Energy Development Guidelines for 2007 – 2016” are taken into account. The main aspects taken into account in the development of scenarios are as follows:
Increase of self-provision, including in electricity generation; Diversification of supplies of primary energy resources; Energy intensity in 2010, 2015 and 2020 has to reach the values of 0.35, 0.28, and 0.22
TOE/1000 EUR (2000) correspondingly; Energy efficiency measures in the consumers sector to ensure that as from 2008
implementation of energy efficiency measures result in the annual reduction of consumption of primary energy resources by 1% compared to the calculated consumption without implementing efficiency measures; The mean specific heat consumption in buildings should be reduced from 220 – 250 to
195 kWh/m2/year by 2016 and to 150 kWh/m2/year by 2020; Maintain and increase efficient use of RES so that the share of renewable energy sources
in the total consumption of primary energy resources would amount to 36%-37%, and the share of RES of the total energy consumption would amount to 49.3% in 2010; The mean efficiency of heat production installations should be increased from 68% to 80
– 90% by 2016;
The mean amount of heat losses in heat transmission and distribution networks should be reduced from 18% to 14% by 2016.
5.4.2. Transport
A set of models consisting of two individual models was used for projecting fuel consumption and emissions in transport. For quantitative and qualitative projection of the fleet of vehicles dynamic model is applied and the results obtained from it are then used for projecting fuel consumption and emissions which is done with the COPERT III model broadly used in EU countries. Input data for both models were taken from the data on road transport in Latvia collected and published by the Road Traffic Safety Directorate of the Republic of Latvia, as well as experts’ evaluations and assumptions on possible future development scenarios.
FIFTH NATIONAL COMMUNICATION OF THE REPUBLIC OF LATVIA TO THE UNITED NATIONS FRAMEWORK CONVENTION ON CLIMATE CHANGE
114
One of the most important factors of operation of any model is statistic treatment of input data, their analysis and preparation in the format required by the relevant model. Data preparation for the simulation base year (2005) includes split of the fleet of vehicles per type of vehicles, type of fuel, capacity of engines and age of engines or in compliance to the EU directives regulating emissions from vehicles. The other important type of use of statistics data is their processing by using statistic analysis methods to use the obtained analysis results in selection of projection parameters.
First, by using the model the quantitative growth projection of the road transport of Latvia is determined based upon the following factors:
The analysis of the time line, which shows the number of light duty vehicles - N(t) and cargo vehicles (t) registered in the country during the relevant period of time; Projected scenarios of development of the national economy and changes in
income and welfare of residents; Analysis of the current condition of the fuel market and development trends.
In the course of projecting the number of passenger cars for the coming years two tools of analysis are used, first, time line analysis, and second, correlation between income per capita and changes in the number of vehicles.
Based upon the projected number of vehicles and their split per age groups, upon the type of used fuel and engine volume the gasoline consumption and amount of emissions is calculated in compliance to COPERT III model.
For projecting emissions it is necessary to enter several parameters in the model, for example:
Gasoline consumption per 100 km; Annual mileage; Split of mileage per types of roads (city, intercity); Mean speed of driving; Gasoline quality and others.
5.4.2.1. Major applied assumptions for projection of emissions in the transport sector
The projected increase of GDP and increase of the level of welfare of population will promote purchase of cars. The number of light duty vehicles in coming years will continue to grow, because at present the number of cars per capita in Latvia is considerably below the level of other EU countries; the level of saturation of cars has not been achieved, as it amounts to approximately 550 cars per 1000 residents;
Projections forecast that the mean age of the car fleet will decrease and at the same time the proportion of cars with more efficient use of gasoline will increase;
Projections provide for broader utilisation of biofuel and increase of its share up to 5.75% of the total energy intensity of gasoline and diesel intended for transport in 2010;
Development of cargo transport, where the number of heavy vehicles and transportations will depend on GDP changes and changes in the internal consumption demand, in particular.

FIFTH NATIONAL COMMUNICATION OF THE REPUBLIC OF LATVIA TO THE UNITED NATIONS FRAMEWORK CONVENTION ON CLIMATE CHANGE
115
5.4.3. Industrial processes and Solvents and Other Product use
The combined method of time lines and impact of macroeconomic indices was applied for projection of emissions from industrial processes. In this combined approach it was assumed that every narrow area of the national economy will develop in proportion to the speed of projected development speed of the national economy. Correlations of amounts of output of every subsection are formed in the form of “correction of errors”, which comply with the model of error correction. The obtained time lines were corrected in compliance to the known and forecasted technologies changes in every subsection.
The following data was used in preparation of projections:
Data on dynamics of the historical production development; Data on projections of macroeconomic indices; Data on historical dynamics of the external trade.
In several sectors both qualitative and quantitative methods of research were applied for projections, and they included grouping of data, data analysis and synthesis, interpolation of data and evaluation by experts.
5.4.3.1. Main assumptions for industrial processes emission projections
Projections of the emissions of the industrial processes (see Table 5.18) are based on the analysis of the statistics data on the amount of production during the time period from 1990 to 2006, long-term macroeconomic forecast and projected external trade indices and trends in relation to projected amount of production.
GHG emissions from the industrial processes are projected for the scenario “with measures”, in which it is assumed that Latvian companies comply with the requirements set in the Law “On Pollution” in the course of organisation of production processes. In compliance to the above requirements companies should organise the production process by implementing best and newest technologies providing the lowest level of GHG emissions. Projections of development of individual sub-branches were performed based upon the long-term macroeconomic projections development until 2025 by the Ministry of Economics.
The projection of the amount of the produced industrial production is largely impacted by the rapid pace of development of construction, as well as planned development of machine manufacturing.
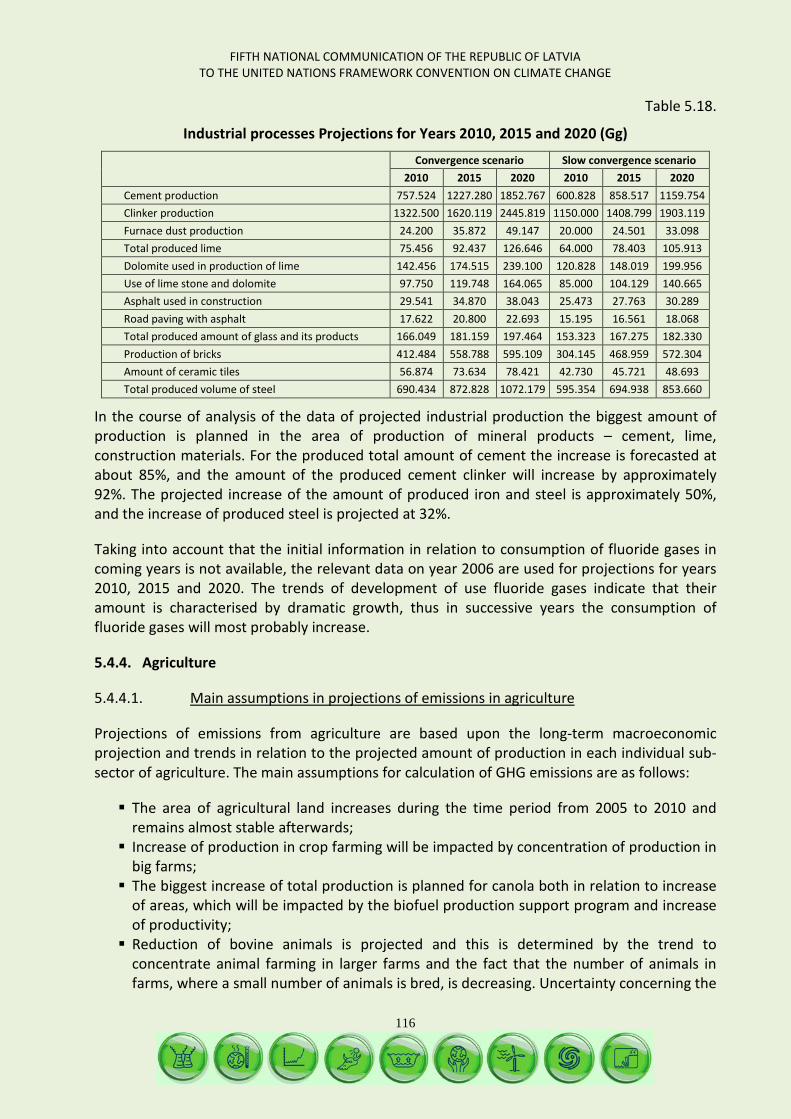
FIFTH NATIONAL COMMUNICATION OF THE REPUBLIC OF LATVIA TO THE UNITED NATIONS FRAMEWORK CONVENTION ON CLIMATE CHANGE
116
Table 5.18.
Industrial processes Projections for Years 2010, 2015 and 2020 (Gg)
Convergence scenario Slow convergence scenario
2010 2015 2020 2010 2015 2020 Cement production 757.524 1227.280 1852.767 600.828 858.517 1159.754 Clinker production 1322.500 1620.119 2445.819 1150.000 1408.799 1903.119 Furnace dust production 24.200 35.872 49.147 20.000 24.501 33.098 Total produced lime 75.456 92.437 126.646 64.000 78.403 105.913 Dolomite used in production of lime 142.456 174.515 239.100 120.828 148.019 199.956 Use of lime stone and dolomite 97.750 119.748 164.065 85.000 104.129 140.665 Asphalt used in construction 29.541 34.870 38.043 25.473 27.763 30.289 Road paving with asphalt 17.622 20.800 22.693 15.195 16.561 18.068 Total produced amount of glass and its products 166.049 181.159 197.464 153.323 167.275 182.330 Production of bricks 412.484 558.788 595.109 304.145 468.959 572.304 Amount of ceramic tiles 56.874 73.634 78.421 42.730 45.721 48.693 Total produced volume of steel 690.434 872.828 1072.179 595.354 694.938 853.660
In the course of analysis of the data of projected industrial production the biggest amount of production is planned in the area of production of mineral products – cement, lime, construction materials. For the produced total amount of cement the increase is forecasted at about 85%, and the amount of the produced cement clinker will increase by approximately 92%. The projected increase of the amount of produced iron and steel is approximately 50%, and the increase of produced steel is projected at 32%.
Taking into account that the initial information in relation to consumption of fluoride gases in coming years is not available, the relevant data on year 2006 are used for projections for years 2010, 2015 and 2020. The trends of development of use fluoride gases indicate that their amount is characterised by dramatic growth, thus in successive years the consumption of fluoride gases will most probably increase.
5.4.4. Agriculture
5.4.4.1. Main assumptions in projections of emissions in agriculture
Projections of emissions from agriculture are based upon the long-term macroeconomic projection and trends in relation to the projected amount of production in each individual sub-sector of agriculture. The main assumptions for calculation of GHG emissions are as follows:
The area of agricultural land increases during the time period from 2005 to 2010 and remains almost stable afterwards; Increase of production in crop farming will be impacted by concentration of production in
big farms; The biggest increase of total production is planned for canola both in relation to increase
of areas, which will be impacted by the biofuel production support program and increase of productivity; Reduction of bovine animals is projected and this is determined by the trend to
concentrate animal farming in larger farms and the fact that the number of animals in farms, where a small number of animals is bred, is decreasing. Uncertainty concerning the
FIFTH NATIONAL COMMUNICATION OF THE REPUBLIC OF LATVIA TO THE UNITED NATIONS FRAMEWORK CONVENTION ON CLIMATE CHANGE
117
amount of milk quotas after 2010 and possible restrictions of quotas may reduced the number of dairy cows; In the course of developing projections of limed areas and use of liming material it was
taken into account that in the new Rural Development Plan for 2007 – 2013 no support is provided for performance of liming. Therefore, increase of liming is not expected in small and medium scale farms;
Use of fertilisers, including nitrogen fertilisers, may grow in Latvia during next period (5 – 15 years) trying to achieved better harvests and using more intensive and fertilisers demanding sorts and Western technologies.
5.4.5. Waste Management
In order to calculate projections of CH4 emissions from disposal of solid waste it is necessary to project the amount of disposed waste and the amount of CH4 recovered at the sites of disposal of waste. Further for developing the emissions projection the first order decay calculations method is applied, it is used also for annual calculation of emissions, which are reported to the Convention Secretariat. If another method of calculation of emissions was used for projections, the calculated emissions would differ considerably and such projections would not be compatible to the data of the annual inventory.
The following are used as input data for projections (see Table 5.19):
• Amounts of waste from the data base „3-Waste”. Data on production of municipal (not dangerous) waste, processing, collection and disposal are available starting from 2001. These projections use data as from 2002 because in 2001 the quality of data was not satisfactory;
• Amount of produced and processed packaging – values, which are obtained by collecting data and information in compliance to the regulatory acts of accounting of packaging;
• Data on Gross Domestic Product available at the Internet site of the Latvian Central Statistics Bureau for years 2002 - 2006;
• Projection of growth of the Gross Domestic Product until 2025; • Projection of the number of population developed by the Demography Centre of the
University of Latvia.
The projected amount of recovered CH4 and projected amounts of solid municipal waste for 2010. 2015 and 2020 are presented in Tables 5.20. and 5.21.
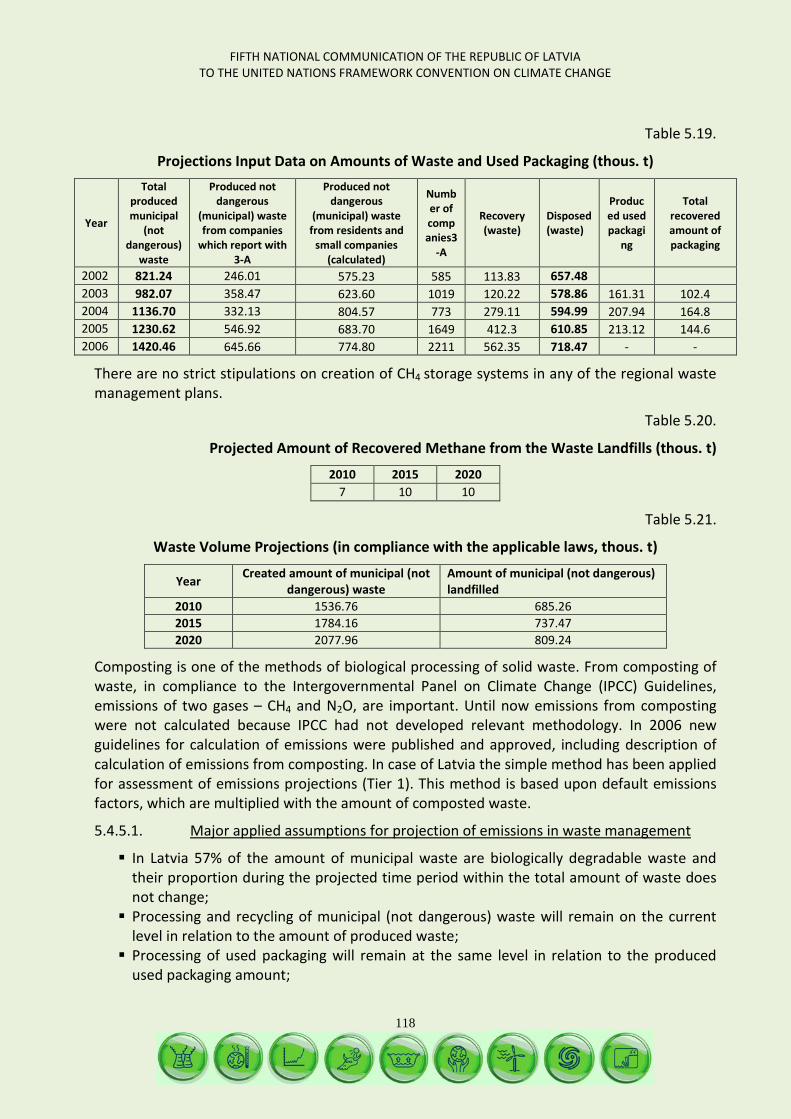
FIFTH NATIONAL COMMUNICATION OF THE REPUBLIC OF LATVIA TO THE UNITED NATIONS FRAMEWORK CONVENTION ON CLIMATE CHANGE
118
Table 5.19.
Projections Input Data on Amounts of Waste and Used Packaging (thous. t)
Year
Total produced municipal
(not dangerous)
waste
Produced not dangerous
(municipal) waste from companies
which report with 3-A
Produced not dangerous
(municipal) waste from residents and
small companies (calculated)
Number of companies3
-A
Recovery (waste)
Disposed (waste)
Produced used packagi
ng
Total recovered amount of packaging
2002 821.24 246.01 575.23 585 113.83 657.48 2003 982.07 358.47 623.60 1019 120.22 578.86 161.31 102.4 2004 1136.70 332.13 804.57 773 279.11 594.99 207.94 164.8 2005 1230.62 546.92 683.70 1649 412.3 610.85 213.12 144.6 2006 1420.46 645.66 774.80 2211 562.35 718.47 - -
There are no strict stipulations on creation of CH4 storage systems in any of the regional waste management plans.
Table 5.20.
Projected Amount of Recovered Methane from the Waste Landfills (thous. t)
2010 2015 2020 7 10 10
Table 5.21.
Waste Volume Projections (in compliance with the applicable laws, thous. t)
Year Created amount of municipal (not dangerous) waste
Amount of municipal (not dangerous) landfilled
2010 1536.76 685.26 2015 1784.16 737.47 2020 2077.96 809.24
Composting is one of the methods of biological processing of solid waste. From composting of waste, in compliance to the Intergovernmental Panel on Climate Change (IPCC) Guidelines, emissions of two gases – CH4 and N2O, are important. Until now emissions from composting were not calculated because IPCC had not developed relevant methodology. In 2006 new guidelines for calculation of emissions were published and approved, including description of calculation of emissions from composting. In case of Latvia the simple method has been applied for assessment of emissions projections (Tier 1). This method is based upon default emissions factors, which are multiplied with the amount of composted waste.
5.4.5.1. Major applied assumptions for projection of emissions in waste management
In Latvia 57% of the amount of municipal waste are biologically degradable waste and their proportion during the projected time period within the total amount of waste does not change; Processing and recycling of municipal (not dangerous) waste will remain on the current
level in relation to the amount of produced waste; Processing of used packaging will remain at the same level in relation to the produced
used packaging amount;
FIFTH NATIONAL COMMUNICATION OF THE REPUBLIC OF LATVIA TO THE UNITED NATIONS FRAMEWORK CONVENTION ON CLIMATE CHANGE
119
Composting of waste will take place in compliance to the stipulations in the regional plans; CH4 recovery from waste landfill sites will increase up to 10 thous. tons in 2013.
FIFTH NATIONAL COMMUNICATION OF THE REPUBLIC OF LATVIA TO THE UNITED NATIONS FRAMEWORK CONVENTION ON CLIMATE CHANGE
120
6. CLIMATE CHANGE IMPACT, VULNERABILITY ASSESSMENT AND ADAPTATION MEASURES
FIFTH NATIONAL COMMUNICATION OF THE REPUBLIC OF LATVIA TO THE UNITED NATIONS FRAMEWORK CONVENTION ON CLIMATE CHANGE
121
6.1. Vulnerability and Threat Assessment
In the summary of long-term observations and latest survey data on climate change in Latvia the information collected in the State Research program “Climate change impact on the Latvian water environment” (KALME, 2006 - 2009) is used (more than 100 researchers of Latvia participated in this program), along with information from the popular science publication “Climate change and global warming”135 and compilation of scientific articles „Climate Change in Latvia”136
Regular monitoring of ambient air temperature in the territory of Latvia was commenced in 1795. The regime and distribution of the air temperatures in the territory of Latvia is determined by the amount of the received Solar radiation
.
137, peculiarities of the atmosphere circulation138, as well as the impact caused by the Baltic Sea and Riga Sea Gulf and terrain139
In the 60-ies of last century it was established for the first time that the air temperature in Riga was gradually increasing (Figure 6.1). Air temperature in Riga is generally characterised by a considerable range of fluctuations – the lowest mean monthly temperature (-17.1º C) was observed in January, 1803, and the highest temperature (+22.8º C) was registered in July, 1914. The mean increase of air temperature during last century has amounted to 0.5ºC in Latvia and approximately 1ºC in Riga. In winter the increase of the air temperature has been 1.9ºC, in spring – 1.3ºC, and in autumn – 0.7ºC. The 24 hours range of air temperature has decreased. Calculations for the time period 1950 – 2003 certify an essential increase of temperature in all the 22 meteorological monitoring stations of Latvia. For example, year 2008 in Liepaja with the mean ambient temperature of 9.0°C has been by 2.0°C warmer than 2007, and year 2008 should be noted as the warmest year as from year 2000. The biggest increase of the ambient temperature in Latvia has been in spring and early autumn. The annual mean ambient temperature in Latvia amounts to + 5.8ºC.
. Also the impact of the city environment is important.
135 Kļaviņš M., Blumberga D., Bruņeniece I., Briede A., Grišule G., Andrušaitis A., Āboliņa K. (2008.) „Klimata mainība un globālā sasilšana” [Climate change and global warming], LU Akadēmiskais apgāds, 174 pp. 136 University of Latvia, Compilation of scientific articles „Climate Change in Latvia” (2007.), Editor Māris Kļaviņš, LU Akadēmiskais apgāds, 268 pp. 137 The balance of radiation in Latvia amounts to approximately 1500 MJ/m2 per year; in winter the radiation balance is negative and in summer it is positive; the longest period of the sun radiation per year amounts to 1840-1940 hours and can be observed at the coast of the Baltic Sea, it is shortest at Vidzeme Highland – only 1580 hours per year. Due to high cloudiness in the territory of Latvia the sun shines slightly less than 50% of the possible time of shining. 138 Ambient temperatures decrease in meridian direction, getting further away from the sea. Only in far South East regions decrease in the distribution of ambient temperatures can be observed in South – North direction. 139 Lowest temperatures can be observed in the territories of Kurzeme Highlands, Vidzeme Highland and Latgale Highland.
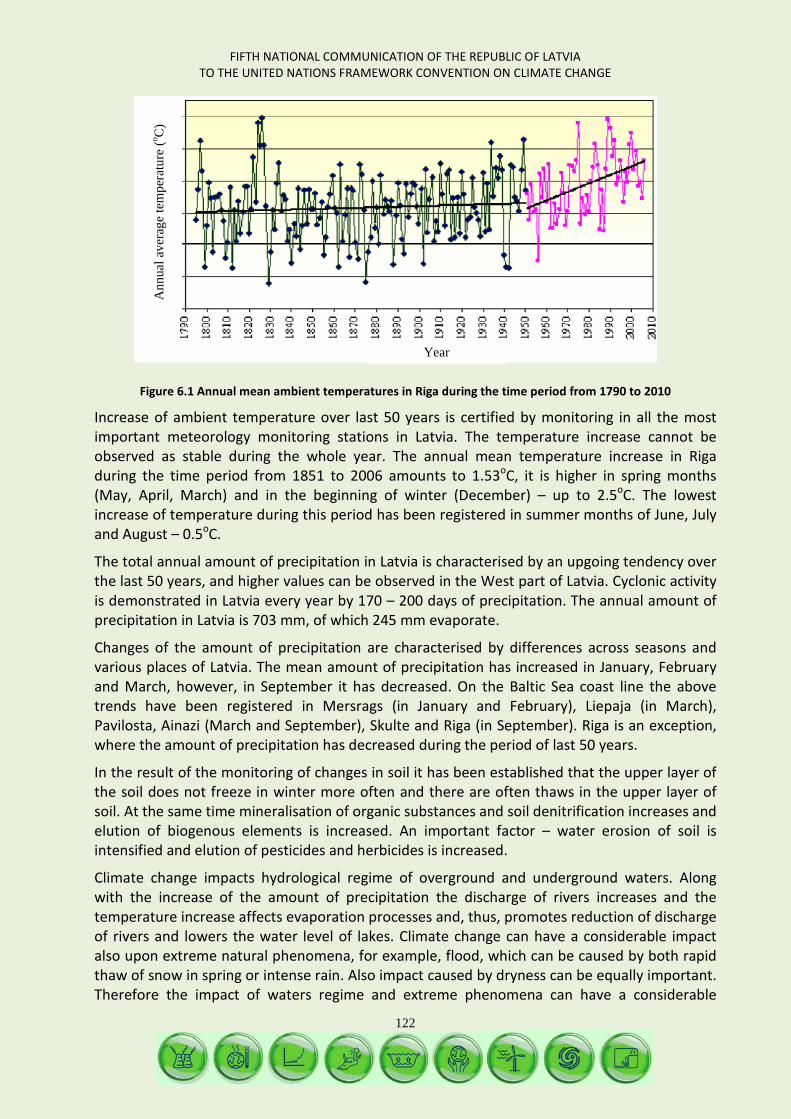
FIFTH NATIONAL COMMUNICATION OF THE REPUBLIC OF LATVIA TO THE UNITED NATIONS FRAMEWORK CONVENTION ON CLIMATE CHANGE
122
Figure 6.1 Annual mean ambient temperatures in Riga during the time period from 1790 to 2010
Increase of ambient temperature over last 50 years is certified by monitoring in all the most important meteorology monitoring stations in Latvia. The temperature increase cannot be observed as stable during the whole year. The annual mean temperature increase in Riga during the time period from 1851 to 2006 amounts to 1.53oC, it is higher in spring months (May, April, March) and in the beginning of winter (December) – up to 2.5oC. The lowest increase of temperature during this period has been registered in summer months of June, July and August – 0.5oC.
The total annual amount of precipitation in Latvia is characterised by an upgoing tendency over the last 50 years, and higher values can be observed in the West part of Latvia. Cyclonic activity is demonstrated in Latvia every year by 170 – 200 days of precipitation. The annual amount of precipitation in Latvia is 703 mm, of which 245 mm evaporate.
Changes of the amount of precipitation are characterised by differences across seasons and various places of Latvia. The mean amount of precipitation has increased in January, February and March, however, in September it has decreased. On the Baltic Sea coast line the above trends have been registered in Mersrags (in January and February), Liepaja (in March), Pavilosta, Ainazi (March and September), Skulte and Riga (in September). Riga is an exception, where the amount of precipitation has decreased during the period of last 50 years.
In the result of the monitoring of changes in soil it has been established that the upper layer of the soil does not freeze in winter more often and there are often thaws in the upper layer of soil. At the same time mineralisation of organic substances and soil denitrification increases and elution of biogenous elements is increased. An important factor – water erosion of soil is intensified and elution of pesticides and herbicides is increased.
Climate change impacts hydrological regime of overground and underground waters. Along with the increase of the amount of precipitation the discharge of rivers increases and the temperature increase affects evaporation processes and, thus, promotes reduction of discharge of rivers and lowers the water level of lakes. Climate change can have a considerable impact also upon extreme natural phenomena, for example, flood, which can be caused by both rapid thaw of snow in spring or intense rain. Also impact caused by dryness can be equally important. Therefore the impact of waters regime and extreme phenomena can have a considerable
Year
Ann
ual a
vera
ge te
mpe
ratu
re (o C
)
FIFTH NATIONAL COMMUNICATION OF THE REPUBLIC OF LATVIA TO THE UNITED NATIONS FRAMEWORK CONVENTION ON CLIMATE CHANGE
123
impact upon population, national economy in general, agriculture and hydro energy in particular.
Increasing discharge of rivers has been registered in such rivers as Venta, Salaca, Lielupe and Gauja in January and February, as well as in Gauja and Salaca in March and in Venta and Lielupe in December. During spring – summer seasons flows increase in Venta and Lielupe, however, in other regions the process of discharge of rivers has not changed significantly. Besides, the flow of river Daugava in winter is considerably more intense than in summer, where, during the monitoring period (1881 – 2004) the indices have remained stable. Winter flows in rivers have increased considerably during last decades. Periods of low water from the point of view of total annual flows of rivers are followed by time periods when river flows are above the mean values. This cycle amounts to 6 - 28 years. Also increase and decrease of underground waters takes place in cycles.
The annual mean water temperature in water reservoirs is increasing. Moving of ice in rivers starts earlier, also the high water period sets in earlier. Rivers of the West part of Latvia are characterised by later formation of the ice layer and earlier moving of ice. The length of standing of ice in rivers and lakes decreases.
The minimum flows of rivers of Latvia have increased and the maximum flows have decreased. The process of river overgrowing is becoming more intense. Red alga and blue alga can be seen in rivers more often. Fish breeds of warm waters appear farther and farther northwards. In the Gauja basin a new breed of fish, characteristic for the south, was found. Earlier spawning of salmon-type fish has been observed. Young salmons tend to migrate to the sea at a younger age. A type of alga, which was encountered less often earlier, is spreading in lakes with higher intensity.
Performed observations in the Baltic Sea and Riga Gulf demonstrate that the length of stand of ice and spreading of ice is decreasing. During the time period from 1875 – 1892 to 1970 – 1993 the multiannual mean water level had increased by 26 cm in Daugavgrīva. When large territories of the Baltic Sea are not covered by ice, resident birds have more territories suitable for spending winters there.
The decrease of the length and spread of icing has a negative impact upon the number of the seal population. In the Baltic Sea and Riga Gulf saltiness has been decreasing over last 30 years. The amount of cod is decreasing. More intense erosion of the coasts has a negative impact upon the biotopes of the costal area
The vertical stratification regime of the water of Riga Gulf is changing – stratification is maintained for a longer period of time, thus, the exchange of oxygen between upper and deeper layers is even more restricted. Sustained deficit of oxygen is observed in the water layer close to the bottom in the central part of the Baltic Sea. The amount of nitrogen and phosphorus, which enters the ecosystem of the Baltic Sea and Riga Gulf from natural sources, is increasing. Longer and more intense blossom of blue alga takes place in summer. The annual maximum water levels in relation to the assumed absolute height of the Baltic Sea have been increasing during last 100 years, the rise of the mean water level during winter months is very pronounced. Considerable differences of water-rise levels caused by the wind between various places along the coastal line of Latvia (Liepāja and Kolka) can be explained by different impact of storms upon particular coastal areas depending on different wind directions and character of
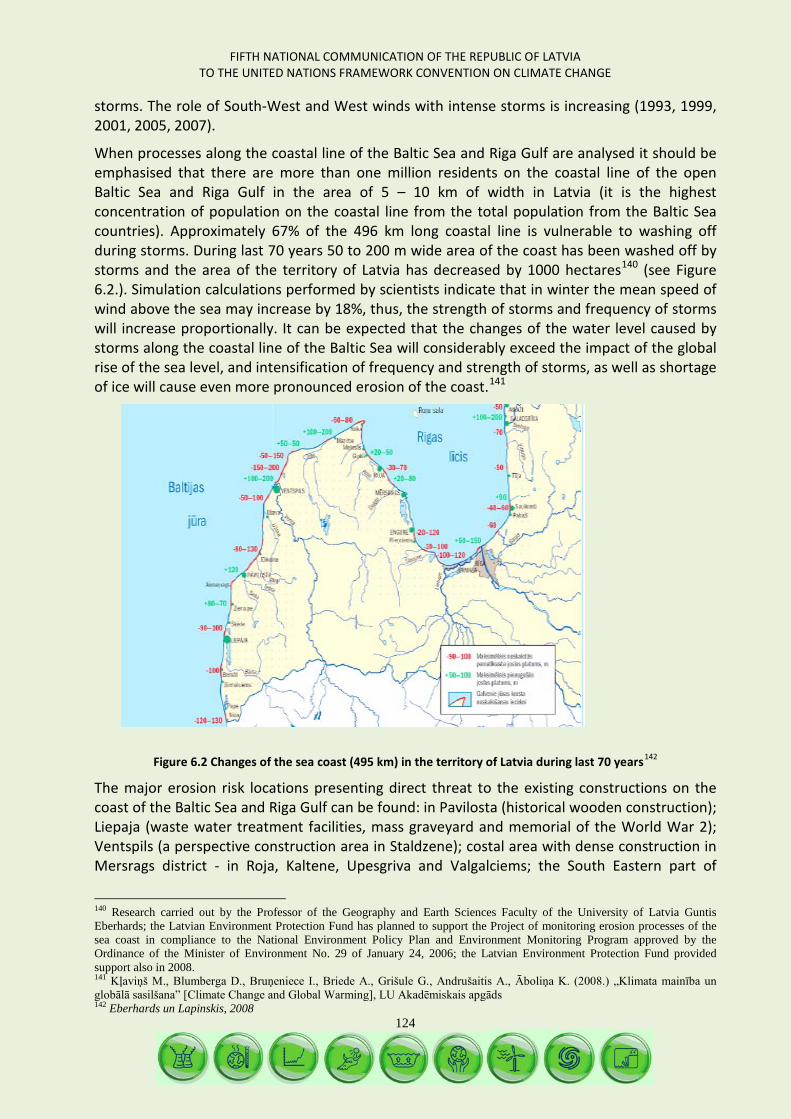
FIFTH NATIONAL COMMUNICATION OF THE REPUBLIC OF LATVIA TO THE UNITED NATIONS FRAMEWORK CONVENTION ON CLIMATE CHANGE
124
storms. The role of South-West and West winds with intense storms is increasing (1993, 1999, 2001, 2005, 2007).
When processes along the coastal line of the Baltic Sea and Riga Gulf are analysed it should be emphasised that there are more than one million residents on the coastal line of the open Baltic Sea and Riga Gulf in the area of 5 – 10 km of width in Latvia (it is the highest concentration of population on the coastal line from the total population from the Baltic Sea countries). Approximately 67% of the 496 km long coastal line is vulnerable to washing off during storms. During last 70 years 50 to 200 m wide area of the coast has been washed off by storms and the area of the territory of Latvia has decreased by 1000 hectares140 (see Figure 6.2.). Simulation calculations performed by scientists indicate that in winter the mean speed of wind above the sea may increase by 18%, thus, the strength of storms and frequency of storms will increase proportionally. It can be expected that the changes of the water level caused by storms along the coastal line of the Baltic Sea will considerably exceed the impact of the global rise of the sea level, and intensification of frequency and strength of storms, as well as shortage of ice will cause even more pronounced erosion of the coast.141
Figure 6.2 Changes of the sea coast (495 km) in the territory of Latvia during last 70 years142
The major erosion risk locations presenting direct threat to the existing constructions on the coast of the Baltic Sea and Riga Gulf can be found: in Pavilosta (historical wooden construction); Liepaja (waste water treatment facilities, mass graveyard and memorial of the World War 2); Ventspils (a perspective construction area in Staldzene); costal area with dense construction in Mersrags district - in Roja, Kaltene, Upesgriva and Valgalciems; the South Eastern part of
140 Research carried out by the Professor of the Geography and Earth Sciences Faculty of the University of Latvia Guntis Eberhards; the Latvian Environment Protection Fund has planned to support the Project of monitoring erosion processes of the sea coast in compliance to the National Environment Policy Plan and Environment Monitoring Program approved by the Ordinance of the Minister of Environment No. 29 of January 24, 2006; the Latvian Environment Protection Fund provided support also in 2008. 141 Kļaviņš M., Blumberga D., Bruņeniece I., Briede A., Grišule G., Andrušaitis A., Āboliņa K. (2008.) „Klimata mainība un globālā sasilšana” [Climate Change and Global Warming], LU Akadēmiskais apgāds 142 Eberhards un Lapinskis, 2008
FIFTH NATIONAL COMMUNICATION OF THE REPUBLIC OF LATVIA TO THE UNITED NATIONS FRAMEWORK CONVENTION ON CLIMATE CHANGE
125
Mersrags district; Abragciems, constructions at Tukums district in Engure, constructions to the South from the port, Apsuciems, Ragaciems, Bigaunciems; the coast line of the central part of Jurmala city (Dubulti – Bulduri) and Saulkrasti (from the former life-saving station to Skulte port).
A factor, which intensifies erosion of Latvian coasts, is the deficit of slit in the flow of slit of the East Baltic longitudinal coastal line. Sand silt in the shallow part of the sea coastal line is running out and this process promotes the vertical erosion of the bottom. During last decades operations of ports have artificially caused the deficit of silt – the sand (including unpolluted sand), which is taken away from the port ships channels, pockets for accumulation of silt and ports territories are buried in the sea landfills at a high depth behind the active coast litodynamic area. The annual volumes, which are buried mostly in the sea, amount to 1 –2 to 3 –3.5 mill.m3 of fine and medium coarse sand. Besides, hydrotechnical constructions of ports (piers, breakwaters, ship channels), construction of HPP and other artificial water reservoirs on rivers and excess excavation of warp from the lower sections of rivers interrupt the natural transportation of silt along the coast and causes their increasing deficit, which is compensated by the sea by means of washing off the coast.
Seasonality, dynamics and nature cycles – beginning of opening of leaves, blossoming, first frosts, yellowing of leaves, harvest, migration of birds, spawn of fish, are the objects of phenologic research and indicators. In Latvia phenologic observations were commenced in the 30-ies of the 19th century: in Puze – 1822, in Lestene and Lubana – 1824; systematic monitoring in the whole territory of Latvia were commenced in 1926.
Phenologic indicators show that the beginning of blossoming of the bird cherry Padus racemosa, linden Tilia cordata and the beginning of yellowing of leaves of birch Betula pendula present negative trends during the time period 1928 – 1939 and 1959 -2004. The blossoming phase gets prolonged by 1.6 days in case of the bird cherry and by 0.9 days in case of linden every decade. The autumn phase in Latvia sets in 2.8 days earlier within a decade, contrary to Europe where autumn sets in later. Yellowing of leaves of cultivated plants starts 1 – 2 earlier every 30 years, and falling of leaves starts 0.5 – 2.4 days earlier. When birch and maple Acer platanoides were observed, it was discovered that the vegetation period has increased by 9.8 days (or by 3.3 days per decade) for birch and by 18.5 days (or 6.2 days per decade) for maple.
The extent of economic loss caused by the climate change is characterised by compensations of loss caused by agricultural climatic conditions in agriculture, which amounted to 630 080 LVL in 2000. Compensation of losses caused by natural disasters and accidents (storms, flood, fire) to persons, who deal with fishing along the coastal line or in inland waters or fish breeding, amounted to 19 101.42 LVL in 2001; in 2004 the total compensation of losses caused by agricultural climatic conditions amounted to 221 908 LVL, and in 2005 it amounted to 440 641.94 LVL (including compensation for livestock killed by gnats in the amount of 131 091.50 LVL, and for material losses caused by flood in the amount of 309 550.44 LVL). 143
Also in 2006 considerable losses were caused to agricultural producers due to unfavourable agricultural climatic conditions. In order to ensure payment of compensations for losses in agriculture and forestry caused by dryness, and in compliance to the Informative Report approved by the Cabinet of Ministers on September 19, 2006 “On Emergency Situation in Agriculture”, additional funding of 25.8 million LVL was allocated for the subsidies program.
143 Data of the Rural Support Service
FIFTH NATIONAL COMMUNICATION OF THE REPUBLIC OF LATVIA TO THE UNITED NATIONS FRAMEWORK CONVENTION ON CLIMATE CHANGE
126
In 2006 the following support payments were made because of losses caused by dryness: in crop farming 18.81 million LVL were paid, in cattle farming 5.76 million LVL were paid and in forestry 0.48 million lats were paid144
Excess dryness and strong winds increase possibilities of forest fires and fires, for example, in 2006, which was one of the worst years in protecting forests from fire, the highest number of forest fires in this country was registered – 1929 (total loss caused by forest fires was estimated at 1.96 million LVL). Cultivated forest plantations suffer due to extreme natural conditions – in 2006 fires destroyed 564 hectares of young forest stands
.
145, the spring dryness and summer heat of 2006 were the main reasons, why it was necessary to re-plant 25% of forest stands planted in that year146
The Daugava river and its affluents, lower parts of the Lielupe and Gauja, Lubana lake and its basin, the Barta at its inflow to Liepaja lake are areas characterised by increased risk of flood. Elimination of risks caused by the climate change is especially important on the Daugava, because the Daugava HPP cascade (Pļaviņas HPP, Keguma HPP and Riga HPP) has been recognised as a national flood risk territory
.
147
The storm of January, 2005, which affected not only Latvia, but the whole Northern Europe, caused enormous damage. In compliance to the EU criteria, which are defined in the Council Regulation (EC) No. 2012/2002 of November 11, 2002 establishing the European Union Solidarity Fund
. Therefore proper monitoring of hydrotechnical constructions, maintenance of their technical condition and strict compliance to the modes of operation are a very important factor for preventing flood.
148
On April 11, 2007 the Cabinet of Ministers approved “Informative Report on Allocation of Funds of the Central Budget to Municipalities for Elimination of the Consequences of the Storm of January 14 and 15, 2007 at Schools and Kindergartens, as well as Other Municipal Sites, which are Required for Ensuring Fulfilment of Important Municipal Functions” prepared by the Ministry of Regional Development and Municipalities. It is stated there that until March 16, 2007 documents were received from municipalities certifying caused losses to 69 infrastructure sites for the total amount of 836 330 LVL (315 316 LVL were allocated).
(ESF), the total damage caused to Latvia was evaluated at the amount of approximately 192 million Euros (ESF allocated 9.487 million Euros), to Estonia - at 48 million Euros (ESF allocated 1.29 million Euros), to Lithuania – at approximately 15 million Euros (ESF allocated 0.379 million Euros).
6.2. Projected Impact of Climate Change
Projections on possible ambient temperature change in Latvia certify that the annual mean temperature will increase by approximately 2.6°C (B2 scenario) to 4°C (A2 scenario)149
144 Publication of the Ministry of Agriculture of the Republic of Latvia „Latvian Agriculture and Rural Areas”, 2007.
. The biggest increase of the mean temperature will refer to December and January (up to 6°C) and the smallest – to June. The maximum mean monthly temperature will increase above the mean
145 Data of the State Forest Service: http://www.vmd.gov.lv/index.php?sadala=35&id=895&ord=35 146 Data of A/S „Latvijas valsts meži” 147 „National Program of Evaluation and Management of Flood Risks for 2008 - 2015”, approved by the Cabinet of Ministers by Ordinance No. 830 on December 20, 2007 148 OV C 283, 20.11.2002. 149 According to the four scenarios developed by scientists of the UN Intergovernmental Panel on Climate Change (IPCC), where A2 scenario provides for heterogeneous world with a rapid increase of population, slow economic development and slow changes in technologies, and B2 scenario provides for moderate increase of population and medium economic growth with creation of economic, environment and social sustainability solutions on the local level.
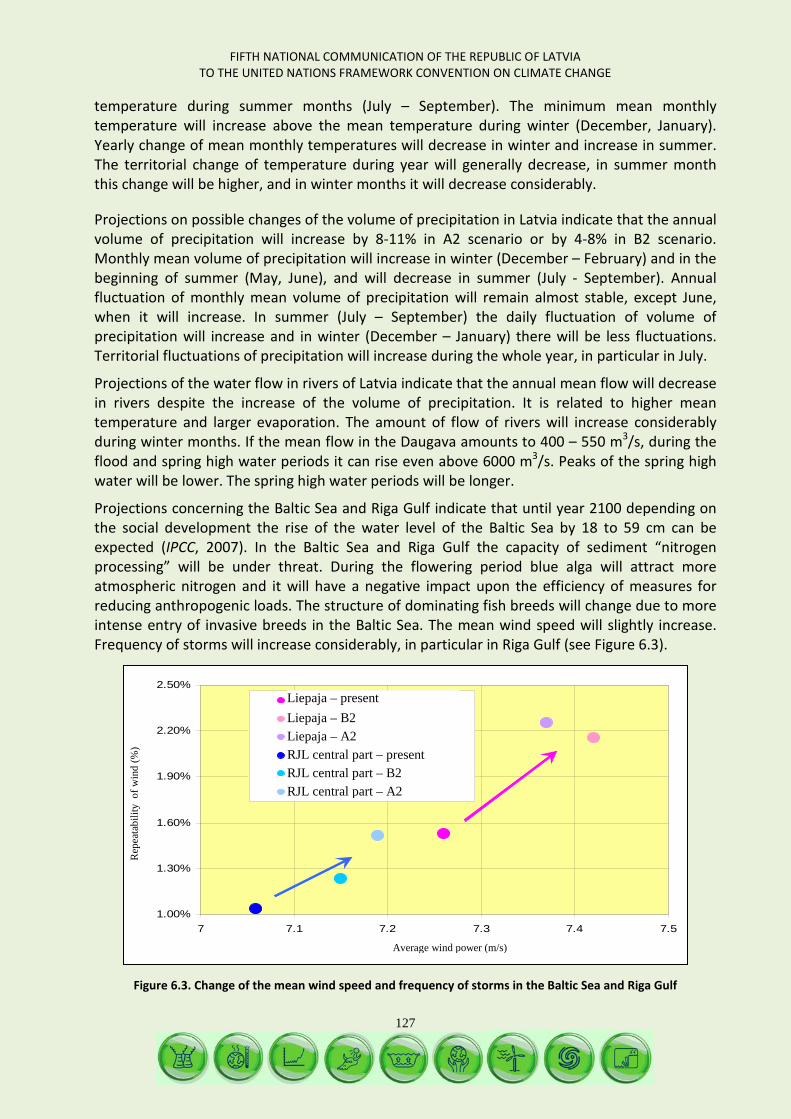
FIFTH NATIONAL COMMUNICATION OF THE REPUBLIC OF LATVIA TO THE UNITED NATIONS FRAMEWORK CONVENTION ON CLIMATE CHANGE
127
temperature during summer months (July – September). The minimum mean monthly temperature will increase above the mean temperature during winter (December, January). Yearly change of mean monthly temperatures will decrease in winter and increase in summer. The territorial change of temperature during year will generally decrease, in summer month this change will be higher, and in winter months it will decrease considerably.
Projections on possible changes of the volume of precipitation in Latvia indicate that the annual volume of precipitation will increase by 8-11% in A2 scenario or by 4-8% in B2 scenario. Monthly mean volume of precipitation will increase in winter (December – February) and in the beginning of summer (May, June), and will decrease in summer (July - September). Annual fluctuation of monthly mean volume of precipitation will remain almost stable, except June, when it will increase. In summer (July – September) the daily fluctuation of volume of precipitation will increase and in winter (December – January) there will be less fluctuations. Territorial fluctuations of precipitation will increase during the whole year, in particular in July.
Projections of the water flow in rivers of Latvia indicate that the annual mean flow will decrease in rivers despite the increase of the volume of precipitation. It is related to higher mean temperature and larger evaporation. The amount of flow of rivers will increase considerably during winter months. If the mean flow in the Daugava amounts to 400 – 550 m3/s, during the flood and spring high water periods it can rise even above 6000 m3/s. Peaks of the spring high water will be lower. The spring high water periods will be longer.
Projections concerning the Baltic Sea and Riga Gulf indicate that until year 2100 depending on the social development the rise of the water level of the Baltic Sea by 18 to 59 cm can be expected (IPCC, 2007). In the Baltic Sea and Riga Gulf the capacity of sediment “nitrogen processing” will be under threat. During the flowering period blue alga will attract more atmospheric nitrogen and it will have a negative impact upon the efficiency of measures for reducing anthropogenic loads. The structure of dominating fish breeds will change due to more intense entry of invasive breeds in the Baltic Sea. The mean wind speed will slightly increase. Frequency of storms will increase considerably, in particular in Riga Gulf (see Figure 6.3).
Figure 6.3. Change of the mean wind speed and frequency of storms in the Baltic Sea and Riga Gulf
1.00%
1.30%
1.60%
1.90%
2.20%
2.50%
7 7.1 7.2 7.3 7.4 7.5
Vidējais vēja ātrums m/s
Vētru
atk
ārto
jam
ība
%
Liepāja - mūsdienas
Liepāja - B2
Liepāja - A2
RJL centrālā daļa - mūsdienas
RJL centrālā daļa - B2
RJL centrālā daļa - A2
Average wind power (m/s)
Rep
eata
bilit
y o
f win
d (%
)
Liepaja – present
Liepaja – B2
Liepaja – A2
RJL central part – present
RJL central part – B2
RJL central part – A2
FIFTH NATIONAL COMMUNICATION OF THE REPUBLIC OF LATVIA TO THE UNITED NATIONS FRAMEWORK CONVENTION ON CLIMATE CHANGE
128
Projections of the processes along the coastal line of the Baltic Sea and Riga Gulf certify that the possibility of tides caused by wind will be considerably impacted not only by the projected increase of intensity of storms in future, but also rise of the Baltic Sea level. It is projected that:
Hydrometeorological and hydrodynamic conditions will be very close the conditions, which have been observed during last 15 – 20 years;
Strong South West, West and North West storms will repeat every 2 – 5 years; Strong storms can be expected from October to February; During the period of storms there will be no stable ice cover at the coastal area, the
sea coast and seaside will not be frozen; The force of storms will increase, the wind speed will increase, as well as the height
of waves and maximum tides caused by wind at the coast; The mean and maximum speed of erosion during storms will be close to the
maximum level during the current period; Erosion of the coast will continue mostly in the areas where it took place during last
century and last decade; The length of sections of the basic coast, which are washed off, will increase along
with levelling of the coastal line; Also in future the soil taken out from ship channels for ensuring operation of ports
will not be returned to the flow of the shallow area silt, instead, they will be buried in far away sea landfills, thus, considerably increasing the deficit of silt;
During this period of time no protective constructions against washing off will be constructed at the threatened areas of the coast.
The projections have been developed taking into account the five sections of the Latvian sea coast with different level of risk of erosion and vulnerability in relation to erosion. During next 15 years Latvia will lose more than 310 ha (on average 20 ha per year) of forests of the dunes protective area, grey dunes and meadows, territories of settlements with construction, roads along the coast line, and other infrastructure sites. Erosion will cover more than 258 km or 51.5% of the total length of the coastal line.
If along with warming of the climate the routes of the powerful Atlantic cyclones will move towards North across the South of Sweden and Finland (similar to the situation during the hurricane of 2005), there will be no strong North West winds along the coast of Latvia, in particular along the coast of Riga Gulf, during the peaks of storms and Kurzeme coast of Riga Gulf from Kolka (Usi) to Bigaunciems (Jurmala City) will be protected from erosion.
6.3. Adaptation Policies and Measures
After adoption of the European Commission Green Paper to the Council, European Parliament, European Economics and Social Committee and Committee of Regions “Adaptation to Climate Change in Europe. Versions of the EU actions” (COM(2007)354; 29.06.2007. – hereinafter referred to as “Green Paper”) on adaptation to climate change, the European Commission organised a broad debate on this document, including four regional workshops where also Latvia took part. The opinion of Latvia – initial position on the Green Paper (on 28 questions put forward therein) was submitted to the European Commission On November, 2007.
FIFTH NATIONAL COMMUNICATION OF THE REPUBLIC OF LATVIA TO THE UNITED NATIONS FRAMEWORK CONVENTION ON CLIMATE CHANGE
129
The Cabinet of Ministers adopted the informative report “On Adaptation to Climate Change” (05.08.2008.) and its protocol resolution150
Quite a number of instruments pertaining to climate change impacts and adaptation to them have been developed and implemented in Latvia: informative reports (on adaptation, on management of the Baltic Sea and Riga Gulf coastal line, etc.), policy planning documents (for evaluation and management of the flood risk, management of agricultural risks, land policies, rural development, territorial planning, strengthening of the national security and civil defence), as well as legislative acts (on the environment, including climate change, indicators, climate change monitoring, forests monitoring, environment monitoring, geological processes monitoring, water management, assessment of the initial flood risks, flood risk management plan, protective areas, state material reserves, compensation payments for rural and fisheries development, restriction of spread of invasive breeds, minimisation of flood risks, construction, including construction climatology, standards, etc.).
drafted by the Ministry of the Environment. It describes the essence of the adaptation problem, characterizes risks related to climate change (for example, more often and powerful storms, flood, dryness, human health problems, loss or movement of animals and plants, etc.) and also advantages (a longer vegetation period, increasing volume of precipitation will allow to achieve higher and more stable power generation from own hydro power plants). In compliance to the protocol resolution the Ministry of the Environment should develop the Concept on Adaptation to Climate Change within a year following the adoption of the European Commission White Paper on adaptation to climate change (until 01.04.2010.) and submit it to the Cabinet of Ministers.
Policies and measures related to climate change and adaptation to them are defined in a range of programmatic and conceptual documents referred to under Chapter 4 - „The Guidelines of the National Environmental Policy for 2007 – 2013”, “National Development Plan for 2007 – 2013”, “Flood Risks Evaluation and Management National Program for 2008 – 2015”, “National Security Concept”.
The Concept “On the Management Policy of Agricultural Risks” (2007) deals with compensation for losses to producers caused by natural factors by reducing the direct state support and involving producers in risks insurance and coverage of losses. Support mechanisms related to adaptation to climate change are included in the “Rural Development Programme for Latvia 2007 – 2013” and also defined in the “Latvian Rural Development National Strategy Plan for 2007 - 2013”.
The essential importance of the land in maintaining the balance of the nature and climate processes is emphasised in the “Land Policy Guidelines for 2008 - 2014”.
The “Spatial Planning Development Concept” (2009) of Latvia defines four levels of planning – national, regional (planning regions), district municipal and local municipalities level planning. All these levels refer also to the coastal territories, the development of which is planned taking into account the potential climate change risks. Despite the fact that the costal line of the Baltic Sea and the Riga Gulf is considered a national value, though, it is not approved in any regulatory enactments, the initiative has been taken by the Ministry of Regional Development and Municipalities, which, by respecting local, national and international interests has elaborated a development strategy till 2030 of the coastal area as a territory of national importance.
150 http://polsis.mk.gov.lv/view.do?id=2760
FIFTH NATIONAL COMMUNICATION OF THE REPUBLIC OF LATVIA TO THE UNITED NATIONS FRAMEWORK CONVENTION ON CLIMATE CHANGE
130
Also the Law “On Civil Defence” (2006) provides for creation of a system for management of accidents, including natural disasters. The “National Civil Defence Plan” (developed on annual basis) defines natural disasters (storms, hurricanes, earthquakes, icing, snow banks and ice blockages, high heat, dryness, fires of forests and peat bogs) lists measures to be implemented and also functions of the institutions responsible for disaster management.
Among economic and financial instruments for elimination of risks related to climate change to be named are revenues from international emissions trading (Climate Change Financial Instrument) and their disposition, state aid for RES, subsidies from the Latvian Environmental Protection Fund and Rural Support Service, loans from the Environmental Investment Fund, EU funding during the funding period 2007 – 2013. For example, during the EU funding 2007 – 2013 planning period the national program for acquisition of funding from the ERDF for the activity “Minimisation of environment risks” for prevention of flood threat has been approved. It is planned to implement infrastructure improvement measures and construct new infrastructure to prevent flooding over of territories of national importance facing increased flood risk.
The researchers of the Faculty of Geography and Earth Sciences, Faculty of Biology151, Institute of Biology of the University of Latvia152, the Latvian State Forestry Research Institute „Silva” 153
The municipality of the capital Riga has commenced active work on evaluation of risks and possibilities related to climate change, including assessment of all eventual costs and expenses. Case analyses was based upon data and results obtained during the international project ASTRA, maps of the sea level for Riga city developed by the Potsdam Climate Impact Research Institute (Germany), management forms of the natural park “Piejura”, the hydrodynamic models for Riga (research of the University of Latvia and Riga Technical University).
and other researcher centres” deal with the issues of scientific research of climate change and environmental impact. In the course of development of the adaptation policies there has been close cooperation with scientists within the framework of the state research program “Climate Change Impact on Water Environment in Latvia” (2006 – 2009). The results of the program foresee monitoring and research of the water environment of Latvia; incorporation of the recommendations in national development planning, environmental policy and sector specific regulatory acts and planning documents for the purpose of mitigating the adverse consequences of climate change upon water environment. Primary data are provided by the LEGMC (climate change indicators, climate change monitoring), Public Health Agency (public and environment health), CSB, State Regional Development Agency and other institutions.
Latvia has participated in the following international activities pertaining to development of adaptation policies:
• The Experts Working Groups of the European Commission and EU Presidency on adaptation to climate change (EGAD) and science for climate change (EGSci);
151 Research projects of the Faculty of Biology of the University of Latvia „Biological diversity of wet forests under climate change impact” (2006), „Change of growth of trees under impact of climate and environment factors and their relation to biological diversity indicators” (2007), etc. 152 Research „Global climate change and actions for mitigating its impact in Latvia” (2005), „National adaptation strategy for management of the risk caused by climate change: extreme climate phenomena and their impact” (2006), etc. 153 Research „Evaluation of the impact of extreme wind speeds upon stability of tree stands, development of the support system for decision taking” (2006), etc.
FIFTH NATIONAL COMMUNICATION OF THE REPUBLIC OF LATVIA TO THE UNITED NATIONS FRAMEWORK CONVENTION ON CLIMATE CHANGE
131
• The European Initiative on establishment of the Global Monitoring for Environment and Security (GMES) global monitoring in relation to one of the priorities set therein concerning monitoring of climate change impacts;
• The work of the European Organisation for the Exploitation of Meteorological Satellites (EUMETSAT);
• The European Climate Impact Research Coordination project CIRCLE ERA-NET, promoting exchange of scientific conclusions and political solutions between countries;
• The European Commission and the European Environmental Agency Member States Experts’ group on the climate change impacts and adaptation;
• The work of the European Environment Information and Observation Network (EIONET) in relation to the impact and threat caused by the climate change and adaptation to them, taking into account the development of the adaptation indicators for the required monitoring of efficiency of the adaptation process;
Latvia has prepared and submitted to the Convention Secretariat information in relation to the Nairobi Work Program on impacts, threats of the climate change and adaptation, and has also drafted the procedure for participation in the work of the European Space Agency for promoting scientific cooperation for research of the climate system and prevention of disasters.

FIFTH NATIONAL COMMUNICATION OF THE REPUBLIC OF LATVIA TO THE UNITED NATIONS FRAMEWORK CONVENTION ON CLIMATE CHANGE
132
7. FINANCIAL RESOURCES AND TRANSFER OF TECHNOLOGY, INCLUDING INFORMATION UNDER ARTICLES 10 AND 11, OF THE
KYOTO PROTOCOL As Latvia is not an Annex II party therefore the provisions of Article 4.3, 4.4 and 4.5 are
not applicable.

FIFTH NATIONAL COMMUNICATION OF THE REPUBLIC OF LATVIA TO THE UNITED NATIONS FRAMEWORK CONVENTION ON CLIMATE CHANGE
133
8. RESEARCH AND SYSTEMATIC OBSERVATIONS
FIFTH NATIONAL COMMUNICATION OF THE REPUBLIC OF LATVIA TO THE UNITED NATIONS FRAMEWORK CONVENTION ON CLIMATE CHANGE
134
8.1. Scientific Research
Starting from 2003 the financing of the public and private sectors for the development of applied research and innovative commercial activity has increased substantially. Investments in environmental protection, including various research projects, have increased remarkably starting from 2005. Apart from state aid, financial resources for various projects in the form of loans are granted also by the private sector, including the commercial banks of Latvia, by applying appropriate loan interest.
In Latvia various political instruments have been adopted that provide for state support for scientific research involving application of GHG emission reducing and innovative technologies in national economy154,155
The scientific priorities of Latvia till 2010 – the national research programme commissioned by the government for the performance of scientific research in certain priority directions for the state with the aim of facilitating the development of these sectors and promoting the applied research in these sectors
, yet the practical feedback from research related to climate changes until 2004 was comparatively insignificant due to lack of centralised coordination of scientific work.
156
A comprehensive research and science funding system that is applied in Europe for many years already was launched in Latvia in 2007. It includes funding for target projects (national research programmes), institutional financing (base financing), grant financing, foreign financing (from EU structural funds, framework programmes, etc.) and funding from various funds. The total financing for science from the state budget in 2007 was 41 millions LVL.
was elaborated in 2005 – 2006 and in 2007 was fully transposed into the financing mechanisms.
The Cabinet of Ministers has approved the following nine science priority directions for 2006-2009: agrobiotechnology, biomedicine and pharmacy, energy, informatics, Letonics, materials science, forest science, medical science and environmental science,157
Defining of priority directions of science allows for prevention of dispersed allocation of funds of national science budget between science areas without carrying out previous analysis of their scientific potential and the expected feedback, and allows focusing of the science policy more purposefully on perspective areas by strengthening a result-oriented approach.
pertaining also to the regional impact of climate changes to water ecosystems and adaptation, as well as sustainable management and protection of the Baltic Sea and inland water environment.
In the execution of the national programmes related to climate change (the use of alternative energy resources and new technologies, increase of energy efficiency and its technological solutions) several scientific institutes and higher educational establishments are involved:
• The Latvian State Forest Research Institute “Silava”, the University of Agriculture of Latvia, the Latvian State Institute of Wood Chemistry carried out the research “Substantiation of Deciduous Trees Cultivation And Rational Utilisation, New Products
154 “National Innovation Programme for 2003– 2006”, www.em.gov.lv/em/images/modules/items/item_file_5359_2.doc 155 “National Lisbon Programme of Latvia for 2005-2008”, http://www.em.gov.lv/em/images/modules/items/item_file_14488_3.pdf 156 Ministry of Education and Science of the Republic of Latvia http://izm.izm.gov.lv/nozares-politika/zinatne/valsts-petijumu-progr.html 157 Order of the Cabinet of Ministers of 6 June 2006 No. 412 “On priority scientific directions for financing of fundamental and applied research in 2006-2009”, http://www.lzp.lv/latv/MK_rikojums_nr412.htm
FIFTH NATIONAL COMMUNICATION OF THE REPUBLIC OF LATVIA TO THE UNITED NATIONS FRAMEWORK CONVENTION ON CLIMATE CHANGE
135
And Technologies” (time of execution 2005-2008); research structured in 4 inter-related projects; financing – 657 800 LVL),
• The Institute of Physical Energetics of the Latvian Academy of Sciences, the Institute of Solid State Physics of the University of Latvia (LU), the Riga Technical University (RTU) carried out the research within the framework of the programme “Research and Elaboration of Modern Methods and Development of High-Tech in the Field of Energy: Environmentally Friendly Energy, Security of Energy Supply and Energy Efficiency” (time of execution 2006-2009; research structured in 7 projects; financing - 522 671 LVL),
• The University of Latvia, the LU Institute of Biology, the University of Agriculture of Latvia, the Latvian Institute of Aquatic Ecology, the Latvian Fish Resources Agency and the University of Daugavpils are participating in the programme “Climate Change Impact on Water Environment in Latvia” (time of execution 2006-2009; research structured in 9 projects; financing - 364 399 LVL).
The results of the national research programme “Climate Change Impact on Water Environment in Latvia” were also used to bring the climate change issues to the attention of general public by publishing two books “Klimata mainība un globālā sasilšana” (Climate Change and Global Warming) and “Klimata pārmaiņas politikas līkločos” (Climate Change from Political Perspective). Climate change issues are included also in the voluminous school book “Vides zinātne” (Environmental Science). Public involvement in the decision making process on environmental issues in general and climate change in the context of sustainable ecological activity in particular is a very important area that is to be developed.
Alongside with the research included in the national research programmes the budgetary funding allocated for science in relation to climate changes was also used for financing several other projects important for the national economy in 2006 and 2007 funding was allocated for more than 40 projects for the total amount of 156.8 thousand LVL, whereas in 2008 alone 24 projects were financed for the total amount of nearly 92 thousand LVL comprising also several new topics (such as the possibilities of producing bio hydrogen, extreme climate changes, solutions for storage of carbon dioxide in conditions of Latvia, etc.).158
With the co-financing from the Latvian Environmental Protection Fund during the period 2005-2007 more than 20 projects were implemented in relation to RES, energy efficiency and climate changes.
In 2007 the Forest Development Fund financed the research project “Improvement of Responsiveness of the Latvian Forestry Sector to the Possible Climate Changes in Europe and of the Value of Quality Wood as an Industrial Raw Material” the aim of which was to develop, improve and apply in forestry tree selection possibilities. One of the research priorities of the Forest Development Fund for 2008 is the role of the forest in the reduction of climate change and adaptation to climate change.
The problems related to climate changes in Latvia and the Baltic Sea region in general cannot be addressed without taking into account the neighbouring countries, therefore the respective research is often carried out by way of international cooperation. Thus, within the framework of the project “Baltic Biomass Network” of the European Commission INTERREG IIIB programme, in 2007 SIA “Vides Projekti” coordinated the project “Evaluation of the Possibilities of Establishment of Fast-growing Tree Plantations in Conditions of Latvia” by carrying out 158 Latvian Council of Science, http://www.lzp.gov.lv/index.php?option=com_content&task=blogsection&id=16&Itemid=79
FIFTH NATIONAL COMMUNICATION OF THE REPUBLIC OF LATVIA TO THE UNITED NATIONS FRAMEWORK CONVENTION ON CLIMATE CHANGE
136
evaluation of the potential of biomass of the region in growing of fast-growing energy wood species (osier, alder, aspen) and in relation to development of appropriate processing technologies.
The researchers of the Institute of Energy Systems and Environment of the Riga Technical University are taking part in the cooperation project of the universities of the Nordic countries „REBUS” by carrying out a research whose aim is to ensure that 75% of heating energy consumed by private houses in Latvia would be generated from solar energy and only 25% from various other renewable energy resources and by also designing specific solar energy storage devices.
In the time period form 2006 – 2012 the University of Latvia and the North Vidzeme Biosphere Reserve Administration are taking part in an international project related to the Baltic Sea region “Climate Change: Impacts, Costs and Adaptation in the Baltic Sea Region - BaltCICA”.159
With regard the issue on adaptation to changes caused by climate change, a working group of experts was established on the basis of the Ordinance of the Cabinet of Ministers dated 18 September 2008 that will be in charge of developing priority directions of action requiring research in the field of adaptation to climate change.
8.2. Systematic Observations
8.2.1. Meteorological Observations
Situation in Latvia is characterised by good traditions in climate research and a long history of meteorological observations that make the observations done in Latvia important also on an international scale. Meteorological observations in the territory of Latvia can be traced back to the end of the18th century (1795) when in Riga the oldest meteorological station in the Baltics started to operate. By the end of the 19th century a permanent meteorological observation network was already established. On the basis of the data of the lengthy observations it is possible to develop research on climate change in the territory of Latvia.
In the course of time the observation timing, the number of observation stations and their locations, the technical means (instruments and hardware) have changed, therefore research on homogeneity of historical observation series is important in order to obtain reliable results. Since 2003 data of meteorological and hydrological observations are published on the Internet by making freely accessible information that has been obtained using the state budget resources.160
Since autumn 2006 information from the Doppler’s meteorological radar is also directly accessible on the Internet, thus providing the picture of the actual precipitation situation within a radius of 250 around Riga. The data obtained with the Latvian radar are included in the Nordic weather radar information exchange network (NORDRAD).
End 2006 LEGMC carried out meteorological observations in 63 observation stations, spread over the entire territory of Latvia. Their ability of obtaining data and information is continuing to improve - an automatic meteorological station in Rucava has been installed and put into service; in Riga and Ventspils the measurements of solid particles (PM10 and PM2.5) have been
159 North Vidzeme Biosphere Reserve, http://www.biosfera.lv/lv/comment/reply/583 160 LEGMC, http://www.meteo.lv/public/hidrometeo_dati.html
FIFTH NATIONAL COMMUNICATION OF THE REPUBLIC OF LATVIA TO THE UNITED NATIONS FRAMEWORK CONVENTION ON CLIMATE CHANGE
137
started. In Riga observations of heavy metals in PM10 dust have commenced. In 2008 a new station of meteorological observations was installed in Riga, but in the Dobele observation station observations of ozone with an ozone analyser have been started.
The international cooperation of Latvia in the field of meteorology is continuing to expand that allows improve reliability and quality of weather forecasts. In 2004 Latvia became the first of the Baltic countries to join the European Meteorological Satellite Organization (EUMETSAT) which opens up possibilities of receiving operative meteorological information from the most contemporary artificial Earth satellites.
Since 2006 LEGMC is a party to the system of the European national meteorological services cooperation organisation EUMETNET. Since 2008 Latvia is a country of cooperation of the European Centre for Medium–Range Weather Forecasts (ECMWF). In 2008 a declaration was signed on the participation of Latvia in the Economic Interest Grouping of the National Meteorological Services of Europe (ECOMET).
8.2.2. Hydrological Observations
The first hydrological observations in the territory of Latvia date back to the 16th century when the recording of ice moving phenomena on the river Daugava near Riga began in 1530. Observations of the water level in the coastal area of the Baltic Sea started in 1841 in Daugavgriva and later also in Liepaja (1865), Ventspils (1873) and Kolka (1884).
Measurements of water level, temperature, salinity, wave and ice phenomena in the Baltic Sea and the Gulf of Riga are carried out in 9 stations. 4 coastal observation stations have observation data series for more than 100 years; observations in the other stations cover nearly 80 years. In 2008 the automatic coastal hydrological station of Skulte was put into operation.
According to the requirements of the EU Water Framework Directive 2000/60/EC, the territory of Latvia is divided into four river basin areas - Daugava, Gauja, Lielupe and Venta river basin area.161
Hydrological observations of terrestrial rivers are carried out in about 60 stationary observation stations located near rivers and reservoirs of Latvia, monitoring water level, flow, water temperature, ice phenomena and ice thickness. Two of the terrestrial hydrological observation stations operating at present have been operating for more than 100 years, but the number of stations whose observations of data series cover more than 70 years is more than a half of their total number. In 2007, 7 new automatic hydrological stations were installed (5 on rivers and 2 on lakes).
Each of the areas covers several medium and large sized river catchment areas. Of special importance in the evaluation and prevention of the risks caused by climate change is the river Daugava, as the cascade of the Daugava hydro power plant (Plavinu HPP, Keguma HPP and Riga HPP) has been recognised as a flood risk territory of national scale.
Modern technical equipment, automatic observation sensors and mobile communication devices provide the possibility to receive water level and temperature data in real time regime and perform operative information follow-up and correction of possible inaccuracies.
161 LEGMC, http://www.meteo.lv/public/upju_baseinu_apgabali.html
FIFTH NATIONAL COMMUNICATION OF THE REPUBLIC OF LATVIA TO THE UNITED NATIONS FRAMEWORK CONVENTION ON CLIMATE CHANGE
138
8.2.3. Environmental Quality Observations
LEGMC provides also environmental quality observations, including underground waters (in 75 observation stations), atmospheric air quality monitoring, assessment of the impact of air quality on ecosystems and monitoring of the impacts of trans-boundary air pollution on ecosystems within the scope of several international programmes: GAW - Global Atmosphere Watch programme, EMEP - Cooperative Programme for the Monitoring and Evaluation of Long Range Air Pollutants in Europe, ICP - Integrated Monitoring (International Cooperative Programme on Integrated Monitoring of Air Pollution Effects on Ecosystems) – the international cooperation programme “Integral Monitoring” for monitoring of air pollution effects on ecosystems.
All observation data are kept in LEGMC archives – part in digitalised, part in a paper form. The latest systematic observation data are stored in observation databases. The quality of the operative observation data and the quality and homogeneity of historical measurement data series is controlled and analysed on a regular basis. Observation data are available without restrictions to all parties of concern. Online information on air pollution as well as monthly analysis of air quality and meteorological and hydrological observation data are available on the LEGMC’s web page.162
Hydrometeorological information and data are regularly exchanged with the appropriate services in the neighbouring countries - Lithuania, Belarus and Russia, and cooperation within the framework in international projects and programmes (with WMO, ECMWF, ECOMET, EUMETSAT) is taking place.
Other observation data, including the historical observations, are available in LEGMC data archives.
163
8.2.4. Databases
Until July 2009 LEGMC maintained 15 databases and registers164
162 LEGMC,
of which 14 were publicly available online upon prior electronic registration. In the data bases data and information on meteorology, terrestrial and marine hydrology, environmental quality, emission amounts, underground nature resources, chemicals is entered, controlled and revised (see table 8.1), including summary tables and thematic maps on human-induced environmental load.
http://www.meteo.lv/public/27920.html 163 LEGMC, http://www.meteo.lv/public/27243.html 164 http://www.meteo.lv/public/datu_bazes.html
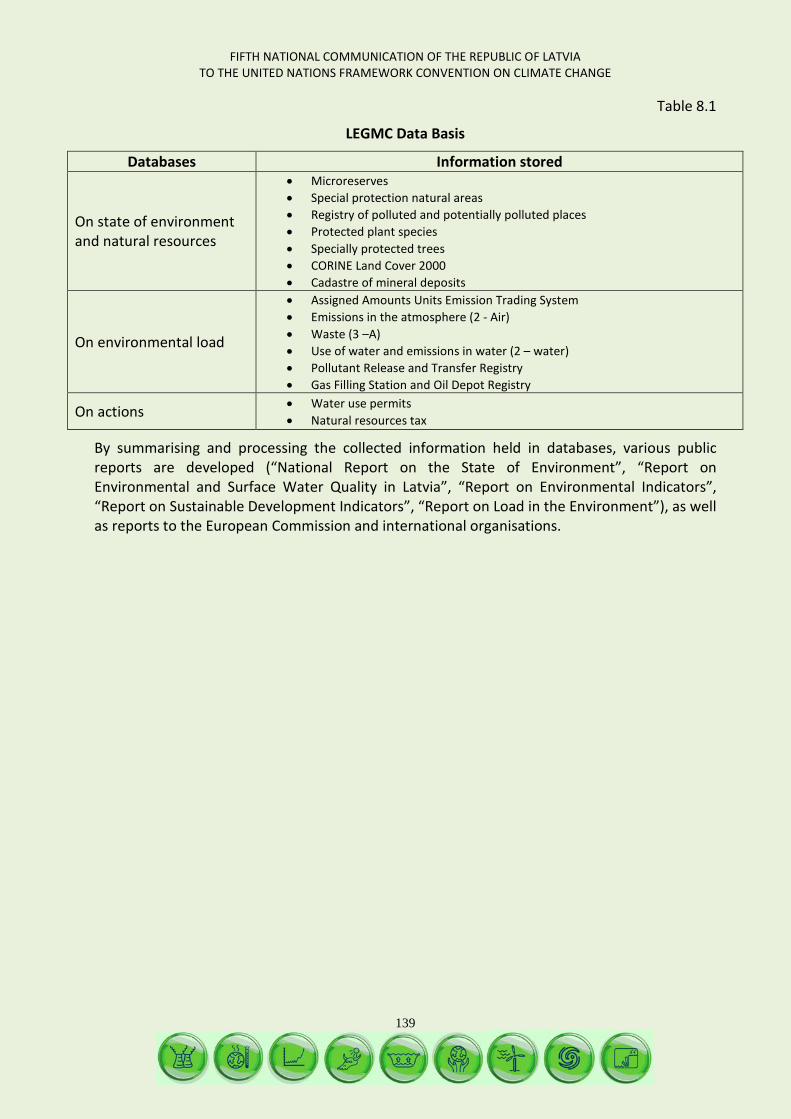
FIFTH NATIONAL COMMUNICATION OF THE REPUBLIC OF LATVIA TO THE UNITED NATIONS FRAMEWORK CONVENTION ON CLIMATE CHANGE
139
Table 8.1
LEGMC Data Basis
Databases Information stored
On state of environment and natural resources
• Microreserves • Special protection natural areas • Registry of polluted and potentially polluted places • Protected plant species • Specially protected trees • CORINE Land Cover 2000 • Cadastre of mineral deposits
On environmental load
• Assigned Amounts Units Emission Trading System • Emissions in the atmosphere (2 - Air) • Waste (3 –A) • Use of water and emissions in water (2 – water) • Pollutant Release and Transfer Registry • Gas Filling Station and Oil Depot Registry
On actions • Water use permits • Natural resources tax
By summarising and processing the collected information held in databases, various public reports are developed (“National Report on the State of Environment”, “Report on Environmental and Surface Water Quality in Latvia”, “Report on Environmental Indicators”, “Report on Sustainable Development Indicators”, “Report on Load in the Environment”), as well as reports to the European Commission and international organisations.
FIFTH NATIONAL COMMUNICATION OF THE REPUBLIC OF LATVIA TO THE UNITED NATIONS FRAMEWORK CONVENTION ON CLIMATE CHANGE
140
9. EDUCATION, TRAINING AND RAISING OF PUBLIC AWARENESS ON ENVIRONMENTAL ISSUES
FIFTH NATIONAL COMMUNICATION OF THE REPUBLIC OF LATVIA TO THE UNITED NATIONS FRAMEWORK CONVENTION ON CLIMATE CHANGE
141
9.1. Political Tools
The Latvian long-term conceptual policy planning document “Growth Model for Latvia: People First” (2005) shows the growth model for Latvia that will be shaped by developing knowledge-based economy. However, in real life not everything has gone so well. And still, in order to increase the number of students in engineering, natural sciences, environmental sciences and medical education study programmes, the following measures have been taken:165
Remarkable corrections have been made in allocation of study places financed from state budgetary sources among the thematic education groups by increasing the number of study places in engineering, natural sciences, environmental sciences and medical education thematic groups;
The EU Structural Funds are directed basically for the development of engineering, natural sciences, environmental sciences and medical education thematic group study programmes;
Personal income tax incentives have been laid down for employers for the study fee covered by them or for repayment of the principal amount of a study credit for employees who acquire a Bachelor’s, any level of professional, as well as Master’s study programme in the thematic groups “Natural sciences, mathematics and information technology” or “Engineering sciences, production and construction”.
The Environmental Protection Law (2006) lays down the main environmental principles:
• the “polluter pays” principle – a person covers all costs, which are related to the assessment, prevention, and limitation of pollution or liquidation of the consequences thereof caused due to his or her activities;
• the precautionary principle – it is admissible to limit or prohibit an activity or measure, which may affect the environment or human health, but the impact of which is not sufficiently assessed or scientifically proved, if prohibition is a proportionate means in order to ensure the protection of the environment or human health. The principle shall not be applicable to immediate measures that are performed in order to prevent threats of damage or irreversible damage;
• the prevention principle – a person prevents the emerging of the pollution and other adverse effects damaging to the environment or human health as much as possible, but, if it is not possible, prevents the spread and the negative consequences thereof;
• the assessment principle – the effect of any such activity or measure, which may substantially affect the environment or human health, shall be assessed prior to permission or commencement of this activity or measure. An activity or measure, which may have adverse effects on the environment or human health even if all requirements of environmental protection are observed, shall be allowed only in such case, if the
165 Zaļoksnis J. „Vides izglītība ilgtspējīgai attīstībai politikā un augstskolās” (Environmental education for sustainable development in politics and universities) – collection of articles „Vides izglītība augstskolā” (Environmental education in universities) – M.Kļaviņs and J.Zaļoksnis edition, LU Akadēmiskais apgāds, Riga, pp. 107-126
FIFTH NATIONAL COMMUNICATION OF THE REPUBLIC OF LATVIA TO THE UNITED NATIONS FRAMEWORK CONVENTION ON CLIMATE CHANGE
142
intended positive result for the public as a whole exceeds the damage caused by the relevant activity or measure to the environment and the public.
Sections 40-42 of the Law lay down the environmental science, environmental education and sustainable education procedures. The Laws also stipulates that, when developing the environmental policy and taking decisions, the basic principles of regional development specified in the Regional Development Law shall be observed.
Until the end of 2008 the basic principles and aims of environmental policy were laid down in the National Environmental Policy Plan for 2004-2008. In 2009 the Cabinet of Ministers accepted the Environmental Policy Guidelines for 2009-2015 developed by the Ministry of Environment (hereinafter – the “Guidelines”) with the basic aim of environmental policy to ensure for the people the possibility to live in a clean and arranged environment by preserving the biological diversity and ensuring sustainable use of natural resources, as well as participation of the society in decision making.
It is noted in the Guidelines that in circumstance of the economic crisis in the next years there will be lack of financing and hence it will be possible to implement only the priority tasks. Taking into account that the environmental and natural issues involve a very broad scope, five thematic sections have been established: “Air”, “Water”, “Earth”, “Nature” and “Climate”.
The Ordinance No. 517 of the Cabinet of Ministers from 31 July 2009 defines that by 1 December 2012 the Ministry of Environment has to develop a mid-term report on the procedure of implementation of the Guidelines and the necessary supplements, and by 1 December 2015 – a final report on the implementation of the Guidelines and proposals for environmental policy development for the next years.
The Guidelines provide for the following result indicators: in 2010 the HGH emissions shall not exceed 14 119 Gg of CO2 equivalents per year, in 2011 – 14 575 Gg of CO2 equivalents per year, in 2012 – 15 031 Gg of CO2 equivalents per year, in 2013 – 15 487 Gg of CO2 equivalents per year, in 2014 – 15 943 Gg of CO2 equivalents per year, and in 2015 – 16 399 Gg of CO2 equivalents per year. Whereas the forecast amount of GHG removals remains practically constant (with a slight tendency of reduction from 33 Gg of CO2 equivalents in 2010 to 31 Gg of CO2 equivalents in 2015).
It is mentioned in the Guidelines that starting from 2012 one of the possible sources of funds could be income from auctions of emission quotas provided for in the emissions trading scheme. According to calculations of the European Commission, for Latvia such income could reach up to 45 million EUR per year. It is essential for Latvia that most of the funds obtained in such auctions are directed for the implementation of local climate change policies and measures.
Section 8 of the “Law on Participation of the Republic of Latvia in the Flexible Mechanisms of the Kyoto Protocol” regulates disposition of proceeds obtained as a result of the international trade of the assigned amount units and establishes that the resources of a climate change financial instrument shall be used for the financing of such projects in the field of agriculture, transport, energy, forestry, waste management, manufacturing and other fields of national economy:
1) Which promote the reduction or restriction of emission of greenhouse gases and other polluting substances for educational measures and scientific research by shaping public
FIFTH NATIONAL COMMUNICATION OF THE REPUBLIC OF LATVIA TO THE UNITED NATIONS FRAMEWORK CONVENTION ON CLIMATE CHANGE
143
awareness regarding climate change, and the development and introduction of such measures which promote the adaptation to climate change;
2) Which significantly improve the environmental quality, including the reduction of transnational air pollution, water pollution and pollution dangerous to human health, increase of the collection of carbon dioxide and possibilities of storage.
The “Education Development Guidelines for 2007-2013” (2006) have been developed on the basis of the society and education development guidance established in several international and Latvian policy planning documents (Lisbon Development Strategy, the Bologna Process, the Memorandum of Lifelong Learning of the European Commission, the UNESCO Programme “Education for All”, the European Commission Work Programme “Education and Training 2010”, the European Initiative “i2010 – a European Information Society for Growth and Employment”, the EU Framework Strategy on gender equality, the “Growth Model for Latvia: People First”, the “Long-term Economic Development Strategy”, the “Common Strategy for National Economy”, the “Latvian Sustainable Development Guidelines”, the “Policy Planning Guidelines”, the “Latvian National Action Plan for the Promotion of Employment”, the “Sports Policy Guidelines for 2004-2009”, the “Regional Policy Guidelines”, as well as in the development documents of Latvian planning regions).
Substantial financial support in the development of education, training and public environmental awareness is provided each year by the Latvian Environmental Protection Fund and its Administration. The Administration of the Latvian Environmental Protection Fund is a direct administration authority subordinated to the Ministry of Environment whose functions and tasks are laid down in the Latvian Environmental Protection Fund Law. The aim of the Fund is to promote the development of sustainable national economy by integrating the environmental protection requirements in all sectors of national economy in order to ensure the right of the people to live in qualitative environment in accordance with environmental policy guidelines, as well as sufficient measures for the preservation of biological diversity and protection of ecosystems. For instance, in 2008 in the field of activity of the mass media and publishing, as well as environmental education and mentoring 143 projects were supported of the submitted 398. The financing allocated to air protection and climate change issues amounted to 10 thousand LVL, to activity of the mass media and publishing in the field of environmental education – 430 thousand LVL, to multi-sectoral projects – 514 thousands LVL, to environmental education and mentoring – 598 environmental LVL. Large support is provided each year by the Administration of the Latvian Environmental Protection Fund in organisation of such competitions as “the Most Tidy Parish in Latvia”, “the Most Tidy City of Latvia”, “Sower”, “the Best of Environmental Journalism”, the annual awards “Apple” and “the Best Packaging in Latvia”.
9.2. Educational Establishments
In order to promote cooperation between institutions related to environmental science and educational development and to facilitate the implementation of the environmental policy, in May 2004, by an order of the Minister of Environment, the Latvian Council of Environmental Science and Education (VZIP) - a coordinating and consultative intersectoral institution - was established whose decisions are of recommendatory nature in the field of environmental science and educational development. The aim of the Council is to promote cooperation between institutions related to environmental science and educational development in order to
FIFTH NATIONAL COMMUNICATION OF THE REPUBLIC OF LATVIA TO THE UNITED NATIONS FRAMEWORK CONVENTION ON CLIMATE CHANGE
144
identify and effectively address problems in the field environmental science and educational development.
Since 2007 the VZIP together with the Administration of the Latvian Environmental Protection Fund and with its support organises each year the competition “Environment Science Award” the aim of which is to develop the environmental science and education in Latvia by informing the society on the great personalities of Latvia who shape the environmental science and educational platform (in nominations “the New Environmental Scientist”, “The High-Scholl Environmental Educator”, “the Environmental Sciences Teacher” and “the Environmental Activist Group”).
The LU Faculty of Geography and Earth Sciences166
In RTU
provides academic studies in geography, geology and environmental science. The faculty offers higher academic education at three level studies: bachelor’s, master’s and doctoral study programmes, as well as professional training in teacher’s study programme of geography and natural sciences, and also professional higher education master’s study programme of spatial development planning. The academic staff of the faculty in collaboration with scientists from many countries of the world ensures also development of scientific research in geography, geology and environmental science in Latvia. The annual LU scientific conferences have gained broad appreciation (in 2009 the 67th scientific conference took place).
167
VASSI
knowledge on climate technologies can be obtained at the Faculty of Power and Electrical Engineering, the study programmes “Power and Electrical Engineering” and “Environmental Science”, but research is dealt with by the Institute of Energy and the Institute of Energy Systems and Environment (VASSI). The basic aim and task of the study programme “Environmental Sciences” is to familiarise students with the environmental protection and climate change problems by drawing attention to their causes and possibilities of problem solutions. The sub-area of environmental engineering sciences include other areas - agricultural engineering science, biology, chemical technology, construction, mechanics, energy, ecology, geology, etc.
168
At the annual scientific conferences of the RTU (in 2009 the 50th scientific conference took place) separate sessions are dedicated to environmental and climate technologies by analysing the possibilities of increasing the energy efficiency of buildings, cogeneration processes, eco-design, environmental impact of households.
comprises the Department of Energy Systems and Environment, the Sustainable Development Information and Study Centre, the Environmental Monitoring Laboratory, the Green Laboratory and the Climate Technology Laboratory. VASSI provides environmental studies and scientific research in cooperation with other higher educational establishments and involves in local and international projects. VASSI provides for students theoretical knowledge on climate change and global warming, the physical aspects thereof, legislation, climate technologies and economical aspects in the implementation of climate projects, as well as teaches practical calculations of CO2 and other GHG emissions.
166http://www.geo.lu.lv/gzzf/index.php 167 http://www.rtu.lv/ 168 http://www.videszinatne.lv/index.php/en/par-vassi
FIFTH NATIONAL COMMUNICATION OF THE REPUBLIC OF LATVIA TO THE UNITED NATIONS FRAMEWORK CONVENTION ON CLIMATE CHANGE
145
In the Latvia University of Agriculture (LLU)169
9.3. Involvement of NGO’s and Public Organisations
in relation to climate change the most of attention to the teaching and research process is paid in the Faculty of Forest (the study programmes “Forestry Research”, “Woodworking”, “Woodworking Technologies”, “Forest Ecology and Forestry”, “Forestry Operations and Technology”, “Forestry Economics and Politics”, “Wood Materials and technologies”, etc.; the Faculty of Rural Engineering (the study programmes “Landscape Gardening and Architecture”, “Land Survey”, “Environmental Science”, “Environment and Water Management”, “Hydroengineering”, “Construction Science”, “Environmental Engineering”, etc.), and the Faculty of Agriculture. LLU has established the obligatory undergraduate study course “Ecology and Environmental Protection”.
The Baltic Environmental Forum170
The Latvian Environmental Protection Club (VAK)
(BEF) that was founded in 1995 by the Baltic Ministries of Environment, Germany and the European Commission as a technical assistance project takes part in various projects related to climate change: (“Using Ecological Construction Materials in New, Energy Efficient Buildings in the Baltic States, 2009-2011”, “From Estonia till Croatia: Intelligent Energy Saving Measures for Municipal housing in Central and Eastern European Countries (INTENSE), 2008-2011”, “Exchange of Information and Promotion of Cooperation for Increasing Energy Efficiency of Energy Resource Use and Facilitation for Changing Consumer Patterns in the Baltic States, 200.-2008”, “Developing Concepts for Innovative and Energy Efficient Construction of New Buildings, 2007-2009”).
171
In relation to innovations and research in the field of energy VAK invites to increase the efficiency of co-generation, reduce the costs of the new energy technologies, transfer the latest existing technologies to small and medium sized companies that operate on RES and future energy markets. Stress is laid on the role of investments in the possible future energy types – the use of solar thermal energy, development of photovoltaic elements, the use of biogas for public and operative transport, investments in hydrogen and fossil elements, carbon capture and storage.
is a NGO with long traditions (established in 1987) that are paying much attention in its research and actions to climate change, RES, price of energy resources and dependency on supplies, energy efficiency, as well as to evaluation and reduction of energy infrastructure risks related to natural disasters.
The World Wildlife Fund172
169
, Latvian Division (WWF Latvia), has been working in Latvia since 1991, and was re-registered in 2005 as an establishment with the name “World Wide Fund for Nature”. It has developed a special climate calculator that can be used by every inhabitant to calculate its CO2 emissions made during a year. Research in 2009 showed that the largest total amount of CO2 emissions in Latvia is created by housings (heating, electricity, hot water) – 1.53 t CO2 per capita per year, followed by transport – 1.05 t CO2 per capital per year, and food production – 1.03 t CO2 per capita per year. Whereas goods (358 kg CO2 per capita) and services (133 kg CO2 per capita) in total account only for 12% of the total GHG emission of an average inhabitant of Latvia. While during the last ten years the GHG emissions from food processing
http://www.llu.lv/ 170 http://www.bef.lv/ 171http://www.vak.lv/lapas.php 172http://www.pdf.lv/
FIFTH NATIONAL COMMUNICATION OF THE REPUBLIC OF LATVIA TO THE UNITED NATIONS FRAMEWORK CONVENTION ON CLIMATE CHANGE
146
have remained unchanged and those created by housings have even decreased, the amount of the GHG emissions created by transport have only increased.
“Zaļā Brīvība” (The Green Freedom)173 was founded in 1993 as the Green Library of the VAK and re-registered in 2000 with the name “Zaļā Brīvība”. It informs the public on impact of the consumer philosophy and way of life, as well as of globalisation on the nature and social environment and advocates environmentally and climate friendly consumption and green procurement. In 2007, within the framework of the Baltic and Nordic cooperation project financed by the Nordic Council of Ministers, as a result of expert cooperation between “Zaļā Brīvība” and the International Network for Sustainable Energy, the research “Sustainable Energy Strategy for Latvia: Vision 2050”174
The project “Pēdas”
was developed that deals with the possibilities of Latvia of using only RES by 2050.
175
The Advisory Council of a Climate Change Financial Instrument
(“Footprints”) (founded in 2002) organises annually measures (including waste collection bees) popularising the environmental protection aspects, sustainable way of life and consumption, etc. (for example, the art competition “I love My Planet” in 2005). In 2007, in cooperation with the British Embassy in Latvia, the competition “Zaļā trīscīņa (“The Green Triathlon” was organised in order to popularise environmental education in general educational establishments and facilitate the involvement of pupils in environmental activities. In 2007,the Footprints Project involved in the global campaign “A Billion Trees for the Planet” organised by the United Nations Environmental Programme (UNEP), by presenting with the support of the JSC “Latvijas Valsts Meži” to schools, municipalities and Latvian towns around 2800 tree plants.
176
The aim of the Climate Technology Cooperation Council
promotes the economic and environmental protection efficiency of utilisation of the resources of the Climate Change Financial Instrument in directions related to the implementation of the Climate Change Financial Instrument in order to promote cooperation and information exchange between national authorities, individuals and the society as a whole.
177
173
is to facilitate information exchange and cooperation between the professional orders operating in the climate technology sector. Its main functions are to promote the use and improvement of economical, financial, administrative, voluntary and communicative political instruments related to climate technologies. The main task of the Council is to provide, in accordance with the public interests and options of Latvia, to the Ministry of Environment and other sectoral ministries proposals on drafts of normative acts and policy planning documents, as well as on drafts of the EU and international law regarding the use of climate technologies. It is composed of representatives from the Latvia Biogas Association, Latvian Forest Owners’ Association, the Biomass Association “LATbioNRG”, the Small Hydroenergy Association, the Wind Energy Association, the association “Farmers’ Saeima”, the Latvian Association of Energy Auditors, the Latvian Forest Industry Federation, and the Latvian Association of Local and Regional Governments.
http://www.zb-zeme.lv/ 174 http://www.zb-zeme.lv/images/dokumenti/vision%202050.pdf 175 http://www.pedas.lv/ 176 Established in 2008 in accordance with CM Regulations of 28 April 2008 No. 312 “Regulation of The Advisory Council of a Climate Change Financial Instrument” 177 Established in March 2009 by an order of the Minister of Environment.
FIFTH NATIONAL COMMUNICATION OF THE REPUBLIC OF LATVIA TO THE UNITED NATIONS FRAMEWORK CONVENTION ON CLIMATE CHANGE
147
9.4. Community Information Measures
The annual international conference “Environmental Science and Education in Latvia and Europe: Education for Sustainable Development” has become a significant tradition. In 2007 the first conference took place; the topic of the 3rd conference in 2009 was “Education and Science for Climate Change Prevention”. During the conference discussions were held about new scientific and research results, traditional and innovative teaching and study methodologies, international cooperation projects and the methods of public involvement in environmental activities. The conference was supported by the Soros Foundation Latvia, the Norwegian financial instrument grant for the project “Development of Contents of Environmental Science Study and Materials” and the VASSI.
In September 2006, the 1st international conference devoted to environmental and sports education in the context of sustainable development took place. During this experience exchange conference the environmental education, as well as the human health promotion projects were presented. The 2nd international conference was dedicated to issues of energy and climate change. The aim of these conferences was:
• To share the existing positive experience gained in Latvia in improvement of public environmental awareness and practical activities in the fields of energy saving and climate change;
• To discuss the approaches used and learn about the most successful public education projects in schools, universities (formal education) and the NGO sector (informal education);
• To get acquainted with examples of foreign best practices and educational projects that have facilitated the raising of public awareness and change in behaviour;
• To find new ways and forms of communication with the society on energy and climate change issues.
In autumn 2008 in Jurmala already the 2nd international conference on sustainable development “Let’s Save Energy – Will Help Climate” took place that was organised by the Latvian Green Movement. The conference participants learned about new information sources on the issue of energy and climate change, discussed creative methods of educating and informing the school youth and the public as a whole and the possibilities of cooperation in establishment of certain pilot projects in Latvia. In the organisation of both conferences the Environmental Education Fund “Keep Latvia Tidy”, the Latvian Green Movement and the Friedrich Ebert Fund’s Office in the Baltics participated in cooperation with the Association of Environmental Educators, the Swedish International Cooperation Agency, the Swedish Institute, embassies of the Nordic countries, the Nordic Council of Ministers’ Office in Riga, the Danish Cultural Institute, and the Ministry of Environment.
In 2007, in the framework of the International Polar Year Programme178
178
, in Latvia a conference was organised that was attended by scientists from the leading Norwegian research institutes, as well as representatives of Latvian environmental education and science organisations. Whereas in 2008 the Embassy of Kingdom of Norway in Latvia in cooperation with the Environmental Education Fund “Keep Latvia Tidy”, the Latvian Green Movement, the
http://www.ipy.org/
FIFTH NATIONAL COMMUNICATION OF THE REPUBLIC OF LATVIA TO THE UNITED NATIONS FRAMEWORK CONVENTION ON CLIMATE CHANGE
148
Association of Environmental Educators and the Ministry of Environment, organised the competition for pupils of classes 7 to 9 “If I were the Minister of Environment…”. The aim of the competition was to promote the pupils’ understanding of ecological processes caused by climate change in polar areas by motivating to find original solutions in preservation of the natural environment in polar areas. 23 pupils from all regions of Latvia sent in their ideas in the form of essays.
In September 2008 the Ministry of Environment gathered participants in the international environmental education conference “Education for Change: From Theory to Practice”. It was organised by the Children’s Environmental School in cooperation with the State Youth Initiative Centre, the Daugavpils University, the Association of Environmental Educators, the Ministry of Environment, the WWF Sweden Division, the Friedrich Ebert Fund, the I. Kant State University of Russia, the Klaipeda University and the Tallinn University.
The participants of the conference adopted a Declaration recognising, among other things, that, since the load of the consumer society on ecosystems and climate change has a tendency to increase, governments should urgently develop and implement the necessary strategies to reduce the environmentally degrading factors. This can be achieved by developing innovative approaches to education on sustainable development by expanding its dimensions and facilitating local solutions at the same time.
In the beginning of 2009, SIA “VentEko” and the Ministry of the Environment in cooperation with the Joint Research Centre of the European Commission, the UNDP and LU Faculty of Geography and Earth Sciences, organised the international conference “Land Degradation”. The main topics of discussion of the conference were strategies, legislation, implementation programmes and technical methods for addressing soil degradation problems on an international, EU, national, regional and local level.
In summer 2009 at the Ministry of the Environment the workshop “Model and action plan for increasing the use and energy efficiency of the Latvian RES” took place where researchers from the RTU VASSI presented a research work on how to develop the Latvian energy sector, not only in the situation of economic crisis. The research is a continuation of the evaluation of the possibilities of use of RES in Latvia by 2020, developed in 2008.
In autumn 2009, the Environmental Management Division of the LU Faculty of Economics and Management in cooperation with the Regional Environmental Centre for Central and Eastern Europe organised the conference “Environmental Communication in Latvia: Evaluation of the Situation and Possibilities of Cooperation”. The aim of the conference was to open a public discussion on the possibilities of more effective use of communication tools not only in the field of environment but also in other sectors of national economy. During the conference an overview of the present situation in environmental communication was presented and information on best practices of environmental communication both in the public and the private sectors was provided, as well as discussions were initiated on the role of communications in cross-sectoral cooperation and environmental policy integration.
In autumn 2009, the regional workshop “The Energy Wood Today and From the Future Perspective - Utilisation Monitoring and Understanding of Technology” took place that was organised by the VASSI in cooperation with the UN Economic Commission for Europe, the UN Food and Agricultural Organisation, the Swedish Forest Agency and the Ministry of Agriculture of the Republic of Latvia. The aim of the workshop was to get acquainted with basic principles

FIFTH NATIONAL COMMUNICATION OF THE REPUBLIC OF LATVIA TO THE UNITED NATIONS FRAMEWORK CONVENTION ON CLIMATE CHANGE
149
of accounting and utilisation of energy wood used in various countries that would allow the EU member States develop more effectively national RES action plans by the end of June 2010 in order ensure by 2020 that the energy consumption from RES accounts for 20% of the final energy consumption.
Another activity that was important from the point of view public awareness raising was the Earth Hour action organised by the WWF Latvia Division on 28 March at 20:30 by switching off lighting for one hour. The official participant cities and towns of the Earth Hour action were Riga, Preili, Jelgava, Dobele, Saldus, Aizkraukle, Ventspils, Limbazi, Cesis, Valka, Lielvarde and Bauska, as well as two counties – the Lielvarde and the Kraslava county.
Widely welcomed was the campaign “Save Latvian Dunes” organised in 2007, 2008 and 2009 by the Latvian Green Movement, the Coalition Clean Baltic and the Environmental Education Fund “Keep Latvia Tidy” and supported financially by Hipotēku un Zemes Banka (Mortgage and Land bank). Thanks to these campaigns, the number of dune drivers and destroyers has decreased by 50% (information from the State Environmental Service).
The Ministry of Economy has promoted publishing of several books: “Par bioetanola pielietošanas iespēju paplašināšanu transportā” (On possibilities of expanding the use of bioethanol in transport) „Ekonomiskais vērtējums par Vācijas pieredzi rapša eļļas degvielas un biodīzeļdegvielas pielietošanas lietderību Latvijas apstākļos” (Economic evaluation of German experience in rapeseed oil fuel and biodiesel fuel utilisation usefulness in Latvian conditions) and „Biogāzes iespējas un tās kā transportlīdzekļu degvielas izmantošana” (Possibilities of biogas and its use as a transport fuel). In cooperation between the Latvia University of Agriculture and the Institute of Corporate Management the publication “Par biodīzeļdegvielas kvalitāti, lai tuvinātu biodīzeļdegvielas īpašību kopumu fosilās dīzeļdegvielas īpašībām” (On quality of biodiesel fuel in order to approximate the set of characteristics to those of fossil diesel fuel) was prepared.
With the support of the INTERREG IIIB project ASTRA ( Developing Policies & Adaptation Strategies to Climate Change in the Baltic Sea Region), the National Research Programme “Climate Change Impact on Water Environment in Latvia” and the Latvian Council of Science, the LU prepared and published in 2007 the compendium of scientific papers „Climate Change in Latvia”.
With the support of the National Research Programme “Climate Change Impact on Water Environment in Latvia” the book for general public “Climate Change and Global Warming” was prepared and published in 2008 that characterises the climate of the Earth and its forming factors, the nature of climate change and discusses the global warming and its consequences, future scenarios. Special attention is paid to manifestations of climate change in Latvia, climate technologies and the climate policy. The book was presented to 426 libraries of Latvian secondary schools.
On 13 March 2008, the Strategic Analysis Commission (SAC) of the President of Latvia, in cooperation with the Embassy of Kingdom of Denmark in Latvia and the Danish Cultural Institute, organised the round table on “Public Awareness and Social Attitudes Towards Climate Change: Latvian and Danish Perspective”. In the end of 2008, the SAC published the interdisciplinary research of group of authors “Climate Change: Challenges for Latvia in the International Environment”.
FIFTH NATIONAL COMMUNICATION OF THE REPUBLIC OF LATVIA TO THE UNITED NATIONS FRAMEWORK CONVENTION ON CLIMATE CHANGE
150
In 2009, by using the Norwegian financial instrument grant for the project “Development of Contents of Environmental Science Study and Materials”, the compendium of scientific papers by a group of authors “Environmental Education at Universities” was published.
9.5. Participation in International Projects
From 2005 to 2007, Latvia participated in the international project ASTRA – “Development of Policy and Adaptation Strategies in Relation to Climate Change in the Baltic Sea Region”179
Latvia has started participation in an international project “Climate Change: Impacts, Costs and Adaptation in the Baltic Sea Region or BaltCICA”
of the INTERREG IIIB programme of the Baltic Sea region, co-financed by the EU.
180
Latvia provided remarkable input in the sub-project “Europe Adapts to Climate Change. Comparing National Adaptation Strategies”
(2009-2011) together with 24 involved partners. This project will continue the ASTRA project the aim of which was to establish the potential impacts of climate change in different places of the Baltic Sea Region and to promote public information. The BaltCICA project will address the issue of how knowledge of climate change impacts is gained by decision makers and preparers thereof on a national and local scale.
181
Since 2007, Latvia is participating successfully as an observer in the EU's Climate Change Research Coordination for a Larger Europe or CIRCLE ERA-NET
of the EU project “Partnership for European Environmental Research or PEER” established in 2001, which evaluated the policy making process and instruments in ten the most successful countries in the field of environment in relation to development of the policy for adaptation to climate change. In the research the experience gained by Denmark, Finland, France, Germany, Latvia, the Netherlands, Portugal, Spain, Sweden and the United Kingdom was analysed.
182
, which dealt with exchange of scientific findings and political solution between the countries. Latvia has successfully involved in the group of Central and Eastern European countries of the project. In 2010 the project CIRCLE ERA-NET will continue its work.
179 http://www.astra-project.org 180 http://www.baltcica.org/ 181 http://www.peer.eu/fileadmin/user_upload/publications/PEER_Report1.pdf 182 http://www.circle-era.net/
FIFTH NATIONAL COMMUNICATION OF THE REPUBLIC OF LATVIA TO THE UNITED NATIONS FRAMEWORK CONVENTION ON CLIMATE CHANGE
151
ANNEXES
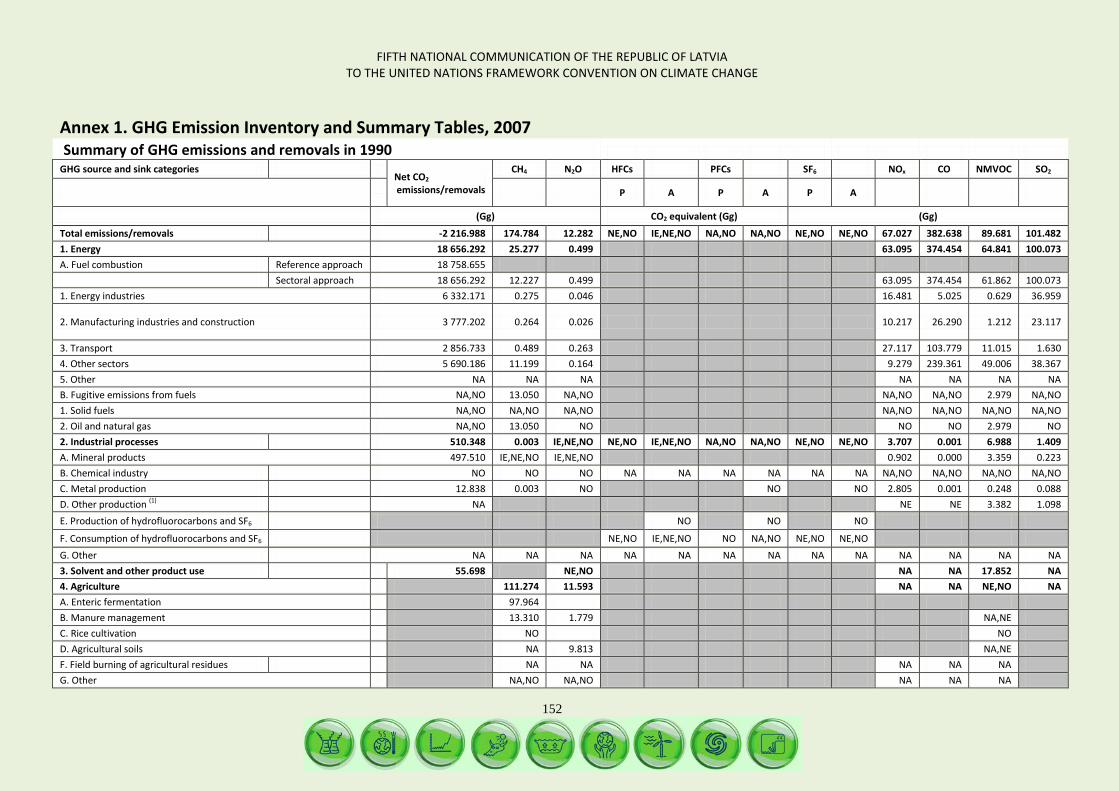
FIFTH NATIONAL COMMUNICATION OF THE REPUBLIC OF LATVIA TO THE UNITED NATIONS FRAMEWORK CONVENTION ON CLIMATE CHANGE
152
Annex 1. GHG Emission Inventory and Summary Tables, 2007 Summary of GHG emissions and removals in 1990 GHG source and sink categories Net CO2
emissions/removals CH4 N2O HFCs PFCs SF6 NOx CO NMVOC SO2
P A P A P A
(Gg) CO2 equivalent (Gg) (Gg)
Total emissions/removals -2 216.988 174.784 12.282 NE,NO IE,NE,NO NA,NO NA,NO NE,NO NE,NO 67.027 382.638 89.681 101.482 1. Energy 18 656.292 25.277 0.499 63.095 374.454 64.841 100.073 A. Fuel combustion Reference approach 18 758.655 Sectoral approach 18 656.292 12.227 0.499 63.095 374.454 61.862 100.073 1. Energy industries 6 332.171 0.275 0.046 16.481 5.025 0.629 36.959
2. Manufacturing industries and construction 3 777.202 0.264 0.026 10.217 26.290 1.212 23.117
3. Transport 2 856.733 0.489 0.263 27.117 103.779 11.015 1.630 4. Other sectors 5 690.186 11.199 0.164 9.279 239.361 49.006 38.367 5. Other NA NA NA NA NA NA NA B. Fugitive emissions from fuels NA,NO 13.050 NA,NO NA,NO NA,NO 2.979 NA,NO 1. Solid fuels NA,NO NA,NO NA,NO NA,NO NA,NO NA,NO NA,NO 2. Oil and natural gas NA,NO 13.050 NO NO NO 2.979 NO 2. Industrial processes 510.348 0.003 IE,NE,NO NE,NO IE,NE,NO NA,NO NA,NO NE,NO NE,NO 3.707 0.001 6.988 1.409 A. Mineral products 497.510 IE,NE,NO IE,NE,NO 0.902 0.000 3.359 0.223 B. Chemical industry NO NO NO NA NA NA NA NA NA NA,NO NA,NO NA,NO NA,NO C. Metal production 12.838 0.003 NO NO NO 2.805 0.001 0.248 0.088 D. Other production (1) NA NE NE 3.382 1.098 E. Production of hydrofluorocarbons and SF6 NO NO NO
F. Consumption of hydrofluorocarbons and SF6 NE,NO IE,NE,NO NO NA,NO NE,NO NE,NO G. Other NA NA NA NA NA NA NA NA NA NA NA NA NA 3. Solvent and other product use 55.698 NE,NO NA NA 17.852 NA 4. Agriculture 111.274 11.593 NA NA NE,NO NA A. Enteric fermentation 97.964 B. Manure management 13.310 1.779 NA,NE C. Rice cultivation NO NO D. Agricultural soils NA 9.813 NA,NE F. Field burning of agricultural residues NA NA NA NA NA G. Other NA,NO NA,NO NA NA NA
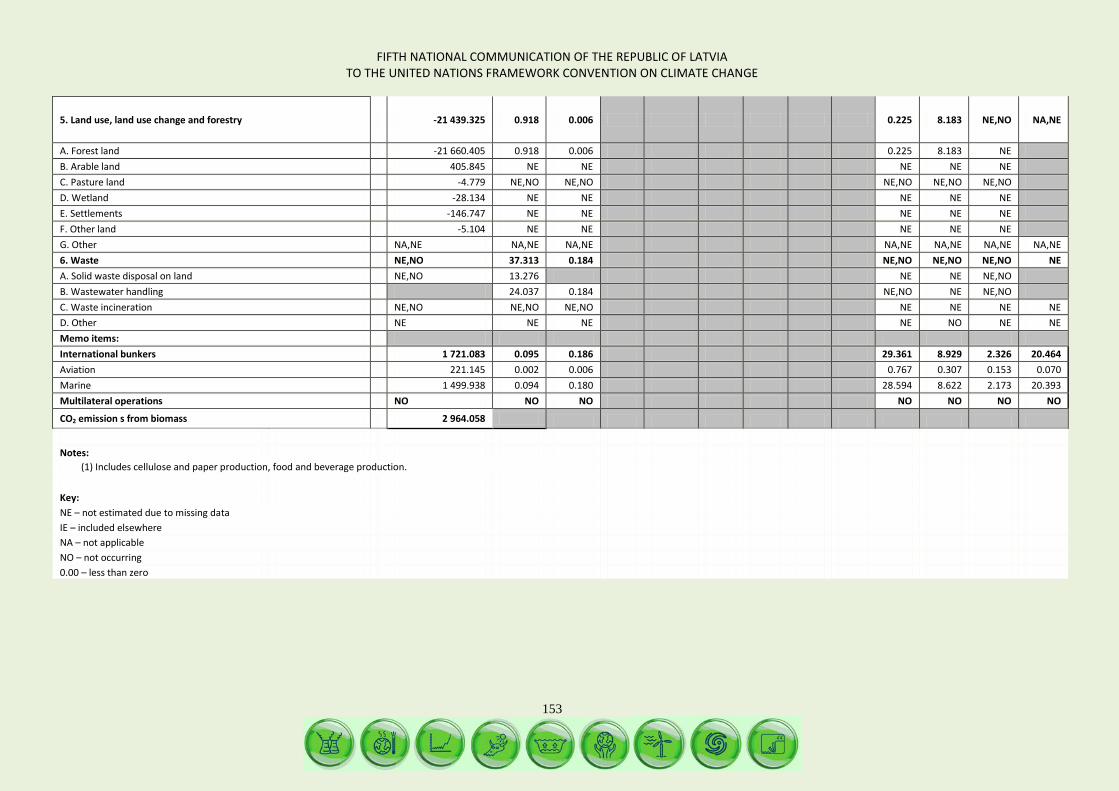
FIFTH NATIONAL COMMUNICATION OF THE REPUBLIC OF LATVIA TO THE UNITED NATIONS FRAMEWORK CONVENTION ON CLIMATE CHANGE
153
5. Land use, land use change and forestry -21 439.325 0.918 0.006 0.225 8.183 NE,NO NA,NE
A. Forest land -21 660.405 0.918 0.006 0.225 8.183 NE B. Arable land 405.845 NE NE NE NE NE C. Pasture land -4.779 NE,NO NE,NO NE,NO NE,NO NE,NO D. Wetland -28.134 NE NE NE NE NE E. Settlements -146.747 NE NE NE NE NE F. Other land -5.104 NE NE NE NE NE G. Other NA,NE NA,NE NA,NE NA,NE NA,NE NA,NE NA,NE 6. Waste NE,NO 37.313 0.184 NE,NO NE,NO NE,NO NE A. Solid waste disposal on land NE,NO 13.276 NE NE NE,NO B. Wastewater handling 24.037 0.184 NE,NO NE NE,NO C. Waste incineration NE,NO NE,NO NE,NO NE NE NE NE D. Other NE NE NE NE NO NE NE Memo items: International bunkers 1 721.083 0.095 0.186 29.361 8.929 2.326 20.464 Aviation 221.145 0.002 0.006 0.767 0.307 0.153 0.070 Marine 1 499.938 0.094 0.180 28.594 8.622 2.173 20.393 Multilateral operations NO NO NO NO NO NO NO
CO2 emission s from biomass 2 964.058 Notes:
(1) Includes cellulose and paper production, food and beverage production. Key: NE – not estimated due to missing data IE – included elsewhere NA – not applicable NO – not occurring 0.00 – less than zero
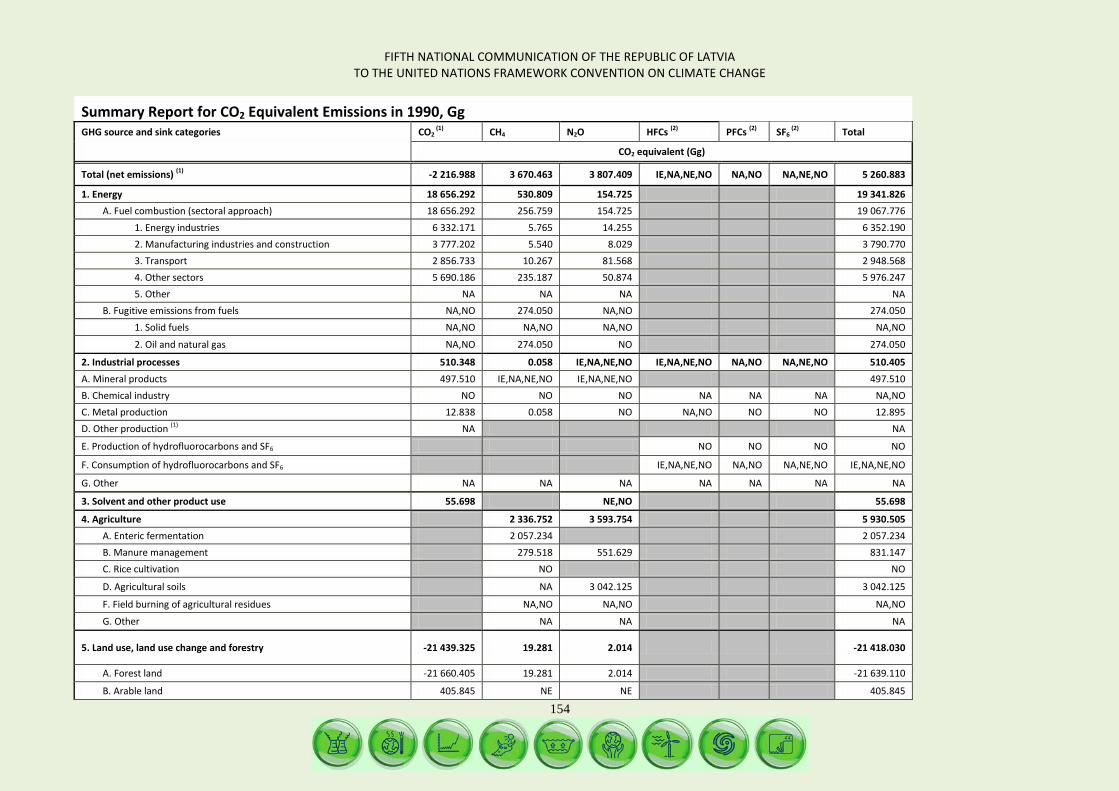
FIFTH NATIONAL COMMUNICATION OF THE REPUBLIC OF LATVIA TO THE UNITED NATIONS FRAMEWORK CONVENTION ON CLIMATE CHANGE
154
Summary Report for CO2 Equivalent Emissions in 1990, Gg GHG source and sink categories CO2
(1) CH4 N2O HFCs (2) PFCs (2) SF6 (2) Total
CO2 equivalent (Gg)
Total (net emissions) (1) -2 216.988 3 670.463 3 807.409 IE,NA,NE,NO NA,NO NA,NE,NO 5 260.883
1. Energy 18 656.292 530.809 154.725 19 341.826 A. Fuel combustion (sectoral approach) 18 656.292 256.759 154.725 19 067.776
1. Energy industries 6 332.171 5.765 14.255 6 352.190 2. Manufacturing industries and construction 3 777.202 5.540 8.029 3 790.770 3. Transport 2 856.733 10.267 81.568 2 948.568 4. Other sectors 5 690.186 235.187 50.874 5 976.247 5. Other NA NA NA NA
B. Fugitive emissions from fuels NA,NO 274.050 NA,NO 274.050 1. Solid fuels NA,NO NA,NO NA,NO NA,NO
2. Oil and natural gas NA,NO 274.050 NO 274.050
2. Industrial processes 510.348 0.058 IE,NA,NE,NO IE,NA,NE,NO NA,NO NA,NE,NO 510.405 A. Mineral products 497.510 IE,NA,NE,NO IE,NA,NE,NO 497.510 B. Chemical industry NO NO NO NA NA NA NA,NO C. Metal production 12.838 0.058 NO NA,NO NO NO 12.895 D. Other production (1) NA NA
E. Production of hydrofluorocarbons and SF6 NO NO NO NO
F. Consumption of hydrofluorocarbons and SF6 IE,NA,NE,NO NA,NO NA,NE,NO IE,NA,NE,NO
G. Other NA NA NA NA NA NA NA
3. Solvent and other product use 55.698 NE,NO 55.698
4. Agriculture 2 336.752 3 593.754 5 930.505 A. Enteric fermentation 2 057.234 2 057.234 B. Manure management 279.518 551.629 831.147 C. Rice cultivation NO NO
D. Agricultural soils NA 3 042.125 3 042.125
F. Field burning of agricultural residues NA,NO NA,NO NA,NO
G. Other NA NA NA
5. Land use, land use change and forestry -21 439.325 19.281 2.014 -21 418.030
A. Forest land -21 660.405 19.281 2.014 -21 639.110
B. Arable land 405.845 NE NE 405.845

FIFTH NATIONAL COMMUNICATION OF THE REPUBLIC OF LATVIA TO THE UNITED NATIONS FRAMEWORK CONVENTION ON CLIMATE CHANGE
155
Summary Report for CO2 Equivalent Emissions in 1990, Gg C. Pasture land -4.779 NE,NO NE,NO -4.779
D. Wetland -28.134 NE NE -28.134
E. Settlements -146.747 NE NE -146.747
F. Other land -5.104 NE NE -5.104
G. Other NA,NE NA,NE NA,NE NA,NE
6. Waste NE,NO 783.563 56.916 840.479 A. Solid waste disposal on land NE,NO 278.786 278.786 B. Wastewater handling 504.777 56.916 561.693 C. Waste incineration NE,NO NE,NO NE,NO NE,NO
D. Other NE NE NE NE
Memo items:
International bunkers 1 721.083 2.001 57.668 1 780.752 Aviation 221.145 0.032 1.902 223.079 Marine 1 499.938 1.969 55.766 1 557.673 Multilateral operations NO NO NO NO
CO2 emission s from biomass 2 964.058 2 964.058
Total CO2 equivalent emissions without land use, land use change and forestry 26 678.913
Total CO2 equivalent emissions with land use, land use change and forestry 5 260.883
Key: NE – not estimated due to missing data IE – included elsewhere NA – not applicable NO – not occurring 0.00 – less than zero

FIFTH NATIONAL COMMUNICATION OF THE REPUBLIC OF LATVIA TO THE UNITED NATIONS FRAMEWORK CONVENTION ON CLIMATE CHANGE
156
Summary on GHG Emissions and Removals in 2007 GHG source and sink categories Net CO2 CH4 N2O HFCs PFCs SF6 NOx CO NMVOC SO2
emissions/removals P A P A P A
(Gg) CO2 equivalent (Gg) (Gg)
Total emissions/removals -23 410.775 88.986 5.098 61.478 51.341 NA,NO NA,NO NE,NO 0.000 42.644 300.272 58.241 3.327
1. Energy 8 307.141 18.039 0.454 38.955 286.891 33.368 3.080
A. Fuel combustion Reference approach 8 275.336
Sectoral approach 8 307.141 12.875 0.454 38.955 286.891 32.738 3.080
1. Energy industries 1 964.122 0.195 0.026 4.041 5.931 0.435 1.185 2. Manufacturing industries and construction 1 227.570 0.266 0.029 3.918 13.893 0.484 0.981
3. Transport 3 744.984 0.528 0.238 25.593 48.276 6.997 0.165 4. Other sectors 1 367.349 11.887 0.162 5.392 218.786 24.821 0.747 5. Other 3.115 0.000 0.000 0.011 0.004 0.002 0.001 B. Fugitive emissions from fuels NA,NO 5.164 NA,NO NA,NO NA,NO 0.629 NA,NO 1. Solid fuels NA,NO NA,NO NA,NO NA,NO NA,NO NA,NO NA,NO
2. Oil and natural gas NA,NO 5.164 NO NO NO 0.629 NO
2. Industrial processes 248.726 0.003 IE,NE,NO 61.478 51.341 NA,NO NA,NO NE,NO 0.000 3.303 0.001 8.436 0.246
A. Mineral products 235.945 IE,NE,NO IE,NE,NO 0.457 0.000 6.650 0.157 B. Chemical industry NO NO NO NA NA NA NA NA NA NA,NO NA,NO NA,NO NA,NO C. Metal production 12.781 0.003 NO NO NO 2.847 0.001 0.251 0.089
D. Other production (1) NA NO NO 1.535 NO E. Production of hydrofluorocarbons and SF6 NO NO NO
F. Consumption of hydrofluorocarbons and SF6 61.478 51.341 NO NA,NO NE,NO 0.000
G. Other NA NA NA NA NA NA NA NA NA NA NA NA NA 3. Solvent and other product use 51.029 0.013 0.000 NA 16.430 0.000 4. Agriculture 32.209 4.460 NA NA NE,NO NA A. Enteric fermentation 28.196 B. Manure management 4.013 0.529 NA,NE C. Rice cultivation NO NO D. Agricultural soils NA 3.931 NA,NE
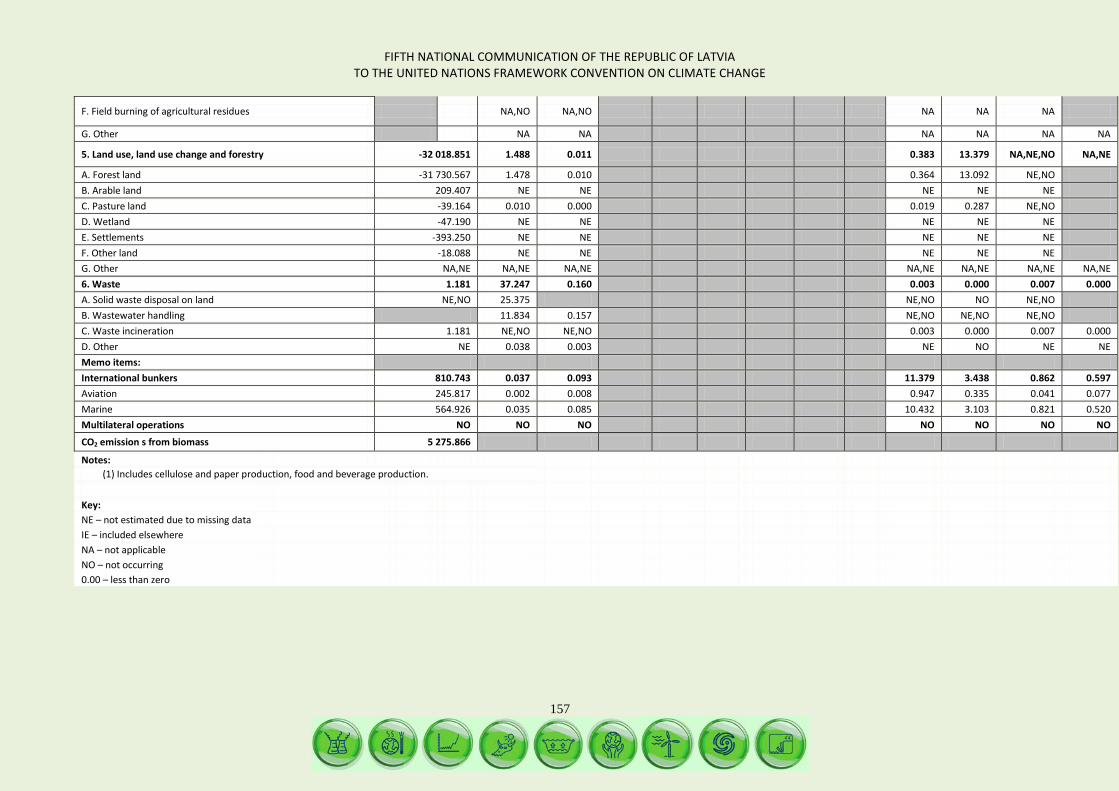
FIFTH NATIONAL COMMUNICATION OF THE REPUBLIC OF LATVIA TO THE UNITED NATIONS FRAMEWORK CONVENTION ON CLIMATE CHANGE
157
F. Field burning of agricultural residues NA,NO NA,NO NA NA NA
G. Other NA NA NA NA NA NA
5. Land use, land use change and forestry -32 018.851 1.488 0.011 0.383 13.379 NA,NE,NO NA,NE
A. Forest land -31 730.567 1.478 0.010 0.364 13.092 NE,NO B. Arable land 209.407 NE NE NE NE NE C. Pasture land -39.164 0.010 0.000 0.019 0.287 NE,NO D. Wetland -47.190 NE NE NE NE NE E. Settlements -393.250 NE NE NE NE NE F. Other land -18.088 NE NE NE NE NE G. Other NA,NE NA,NE NA,NE NA,NE NA,NE NA,NE NA,NE 6. Waste 1.181 37.247 0.160 0.003 0.000 0.007 0.000 A. Solid waste disposal on land NE,NO 25.375 NE,NO NO NE,NO B. Wastewater handling 11.834 0.157 NE,NO NE,NO NE,NO C. Waste incineration 1.181 NE,NO NE,NO 0.003 0.000 0.007 0.000 D. Other NE 0.038 0.003 NE NO NE NE Memo items: International bunkers 810.743 0.037 0.093 11.379 3.438 0.862 0.597 Aviation 245.817 0.002 0.008 0.947 0.335 0.041 0.077 Marine 564.926 0.035 0.085 10.432 3.103 0.821 0.520 Multilateral operations NO NO NO NO NO NO NO
CO2 emission s from biomass 5 275.866
Notes: (1) Includes cellulose and paper production, food and beverage production.
Key: NE – not estimated due to missing data IE – included elsewhere NA – not applicable NO – not occurring 0.00 – less than zero
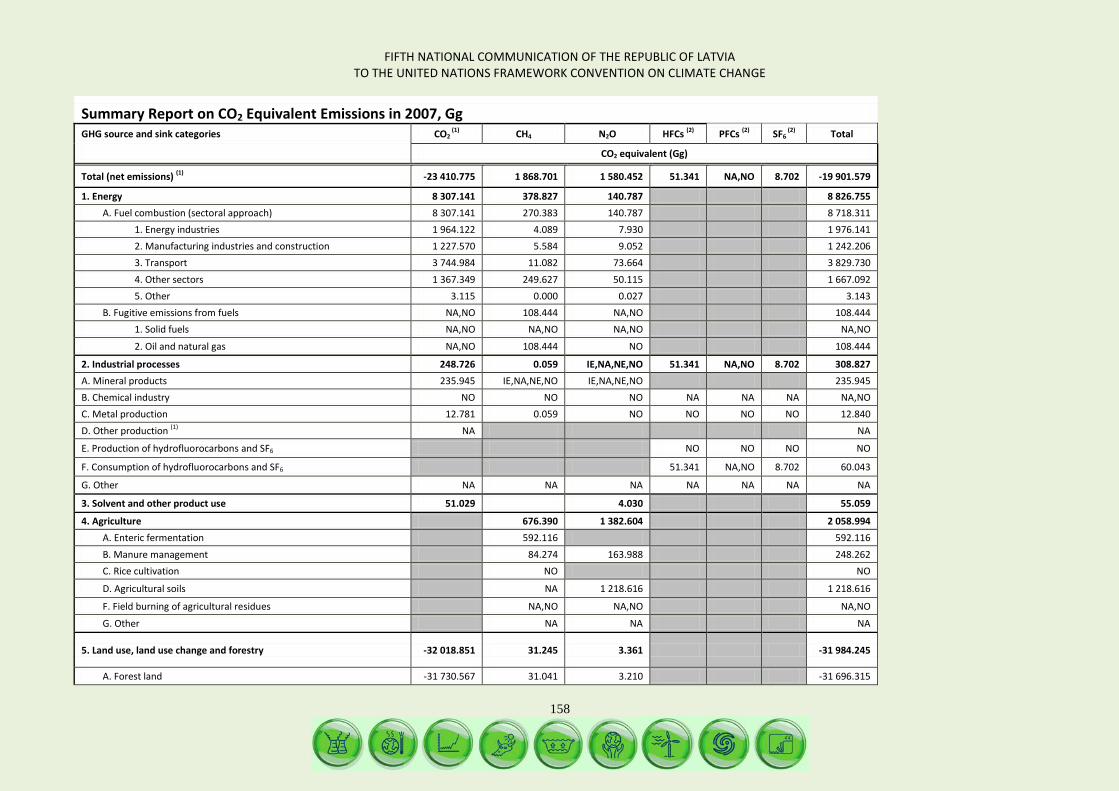
FIFTH NATIONAL COMMUNICATION OF THE REPUBLIC OF LATVIA TO THE UNITED NATIONS FRAMEWORK CONVENTION ON CLIMATE CHANGE
158
Summary Report on CO2 Equivalent Emissions in 2007, Gg GHG source and sink categories CO2
(1) CH4 N2O HFCs (2) PFCs (2) SF6 (2) Total
CO2 equivalent (Gg)
Total (net emissions) (1) -23 410.775 1 868.701 1 580.452 51.341 NA,NO 8.702 -19 901.579
1. Energy 8 307.141 378.827 140.787 8 826.755 A. Fuel combustion (sectoral approach) 8 307.141 270.383 140.787 8 718.311
1. Energy industries 1 964.122 4.089 7.930 1 976.141 2. Manufacturing industries and construction 1 227.570 5.584 9.052 1 242.206 3. Transport 3 744.984 11.082 73.664 3 829.730 4. Other sectors 1 367.349 249.627 50.115 1 667.092 5. Other 3.115 0.000 0.027 3.143
B. Fugitive emissions from fuels NA,NO 108.444 NA,NO 108.444 1. Solid fuels NA,NO NA,NO NA,NO NA,NO
2. Oil and natural gas NA,NO 108.444 NO 108.444
2. Industrial processes 248.726 0.059 IE,NA,NE,NO 51.341 NA,NO 8.702 308.827 A. Mineral products 235.945 IE,NA,NE,NO IE,NA,NE,NO 235.945 B. Chemical industry NO NO NO NA NA NA NA,NO C. Metal production 12.781 0.059 NO NO NO NO 12.840 D. Other production (1) NA NA
E. Production of hydrofluorocarbons and SF6 NO NO NO NO
F. Consumption of hydrofluorocarbons and SF6 51.341 NA,NO 8.702 60.043
G. Other NA NA NA NA NA NA NA
3. Solvent and other product use 51.029 4.030 55.059
4. Agriculture 676.390 1 382.604 2 058.994 A. Enteric fermentation 592.116 592.116 B. Manure management 84.274 163.988 248.262 C. Rice cultivation NO NO
D. Agricultural soils NA 1 218.616 1 218.616
F. Field burning of agricultural residues NA,NO NA,NO NA,NO
G. Other NA NA NA
5. Land use, land use change and forestry -32 018.851 31.245 3.361 -31 984.245
A. Forest land -31 730.567 31.041 3.210 -31 696.315
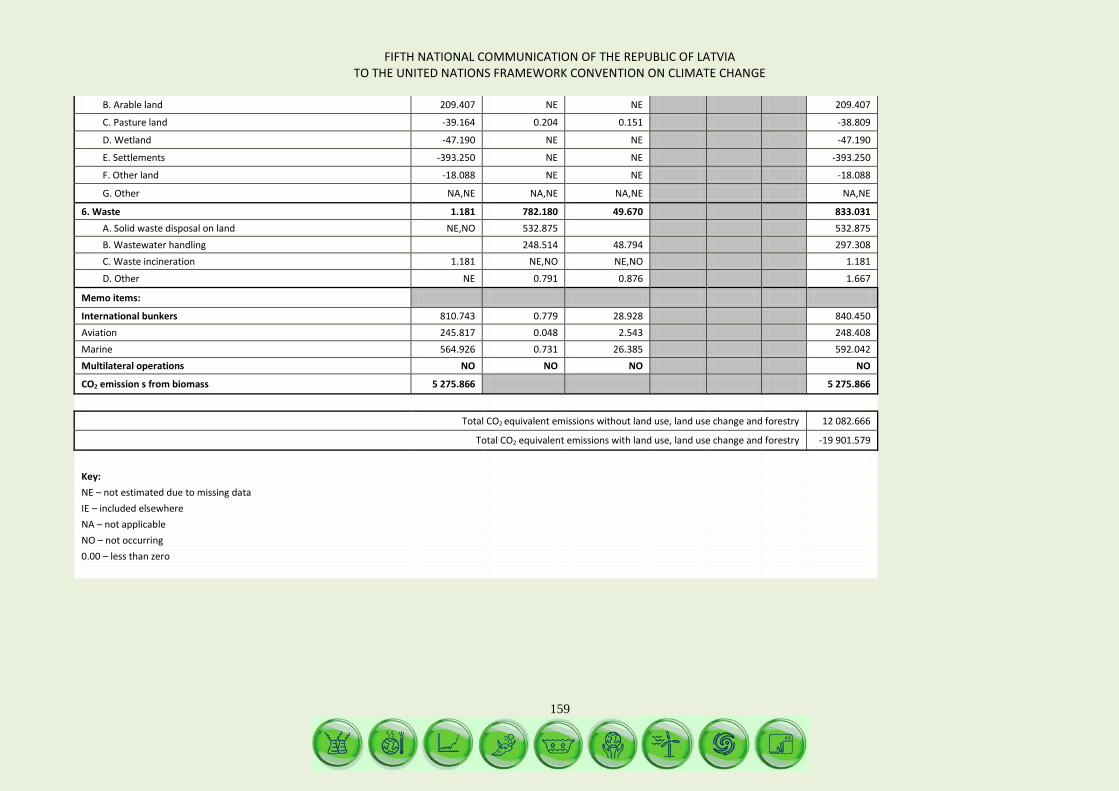
FIFTH NATIONAL COMMUNICATION OF THE REPUBLIC OF LATVIA TO THE UNITED NATIONS FRAMEWORK CONVENTION ON CLIMATE CHANGE
159
B. Arable land 209.407 NE NE 209.407
C. Pasture land -39.164 0.204 0.151 -38.809
D. Wetland -47.190 NE NE -47.190
E. Settlements -393.250 NE NE -393.250
F. Other land -18.088 NE NE -18.088
G. Other NA,NE NA,NE NA,NE NA,NE
6. Waste 1.181 782.180 49.670 833.031 A. Solid waste disposal on land NE,NO 532.875 532.875 B. Wastewater handling 248.514 48.794 297.308 C. Waste incineration 1.181 NE,NO NE,NO 1.181
D. Other NE 0.791 0.876 1.667
Memo items:
International bunkers 810.743 0.779 28.928 840.450 Aviation 245.817 0.048 2.543 248.408 Marine 564.926 0.731 26.385 592.042 Multilateral operations NO NO NO NO
CO2 emission s from biomass 5 275.866 5 275.866
Total CO2 equivalent emissions without land use, land use change and forestry 12 082.666
Total CO2 equivalent emissions with land use, land use change and forestry -19 901.579
Key: NE – not estimated due to missing data IE – included elsewhere NA – not applicable NO – not occurring 0.00 – less than zero
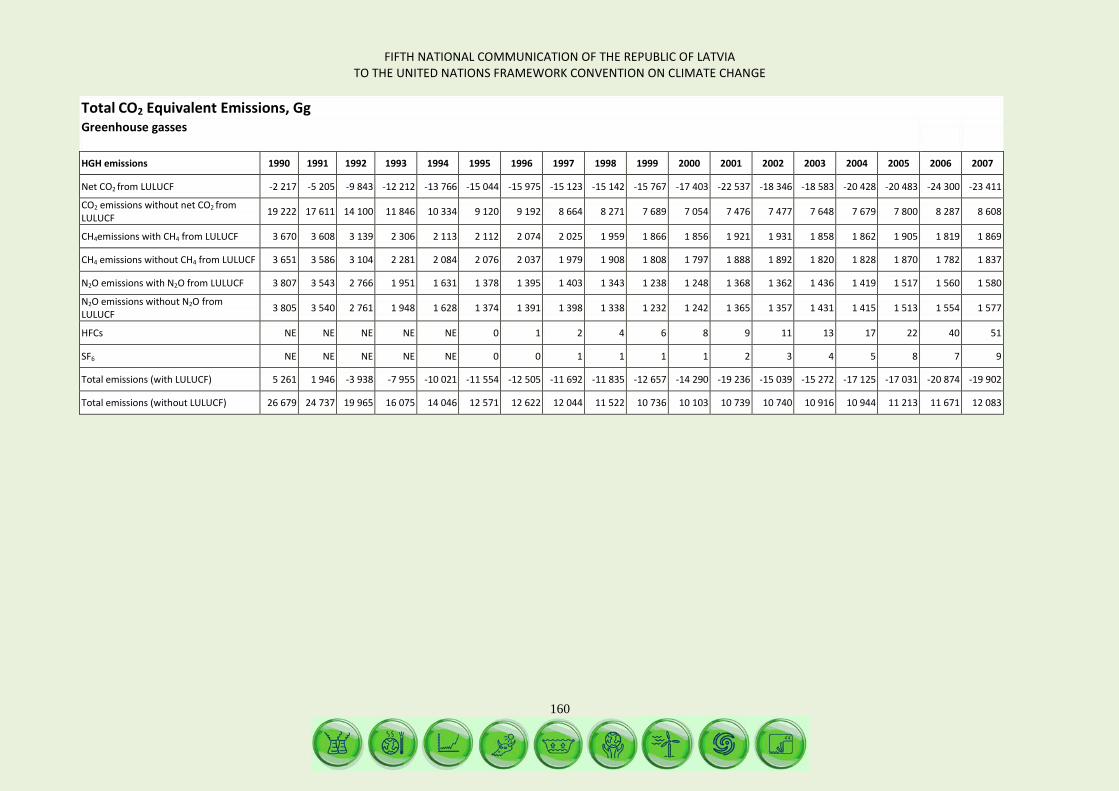
FIFTH NATIONAL COMMUNICATION OF THE REPUBLIC OF LATVIA TO THE UNITED NATIONS FRAMEWORK CONVENTION ON CLIMATE CHANGE
160
Total CO2 Equivalent Emissions, Gg Greenhouse gasses
HGH emissions 1990 1991 1992 1993 1994 1995 1996 1997 1998 1999 2000 2001 2002 2003 2004 2005 2006 2007
Net CO2 from LULUCF -2 217 -5 205 -9 843 -12 212 -13 766 -15 044 -15 975 -15 123 -15 142 -15 767 -17 403 -22 537 -18 346 -18 583 -20 428 -20 483 -24 300 -23 411
CO2 emissions without net CO2 from LULUCF 19 222 17 611 14 100 11 846 10 334 9 120 9 192 8 664 8 271 7 689 7 054 7 476 7 477 7 648 7 679 7 800 8 287 8 608
CH4emissions with CH4 from LULUCF 3 670 3 608 3 139 2 306 2 113 2 112 2 074 2 025 1 959 1 866 1 856 1 921 1 931 1 858 1 862 1 905 1 819 1 869
CH4 emissions without CH4 from LULUCF 3 651 3 586 3 104 2 281 2 084 2 076 2 037 1 979 1 908 1 808 1 797 1 888 1 892 1 820 1 828 1 870 1 782 1 837
N2O emissions with N2O from LULUCF 3 807 3 543 2 766 1 951 1 631 1 378 1 395 1 403 1 343 1 238 1 248 1 368 1 362 1 436 1 419 1 517 1 560 1 580
N2O emissions without N2O from LULUCF 3 805 3 540 2 761 1 948 1 628 1 374 1 391 1 398 1 338 1 232 1 242 1 365 1 357 1 431 1 415 1 513 1 554 1 577
HFCs NE NE NE NE NE 0 1 2 4 6 8 9 11 13 17 22 40 51
SF6 NE NE NE NE NE 0 0 1 1 1 1 2 3 4 5 8 7 9
Total emissions (with LULUCF) 5 261 1 946 -3 938 -7 955 -10 021 -11 554 -12 505 -11 692 -11 835 -12 657 -14 290 -19 236 -15 039 -15 272 -17 125 -17 031 -20 874 -19 902
Total emissions (without LULUCF) 26 679 24 737 19 965 16 075 14 046 12 571 12 622 12 044 11 522 10 736 10 103 10 739 10 740 10 916 10 944 11 213 11 671 12 083
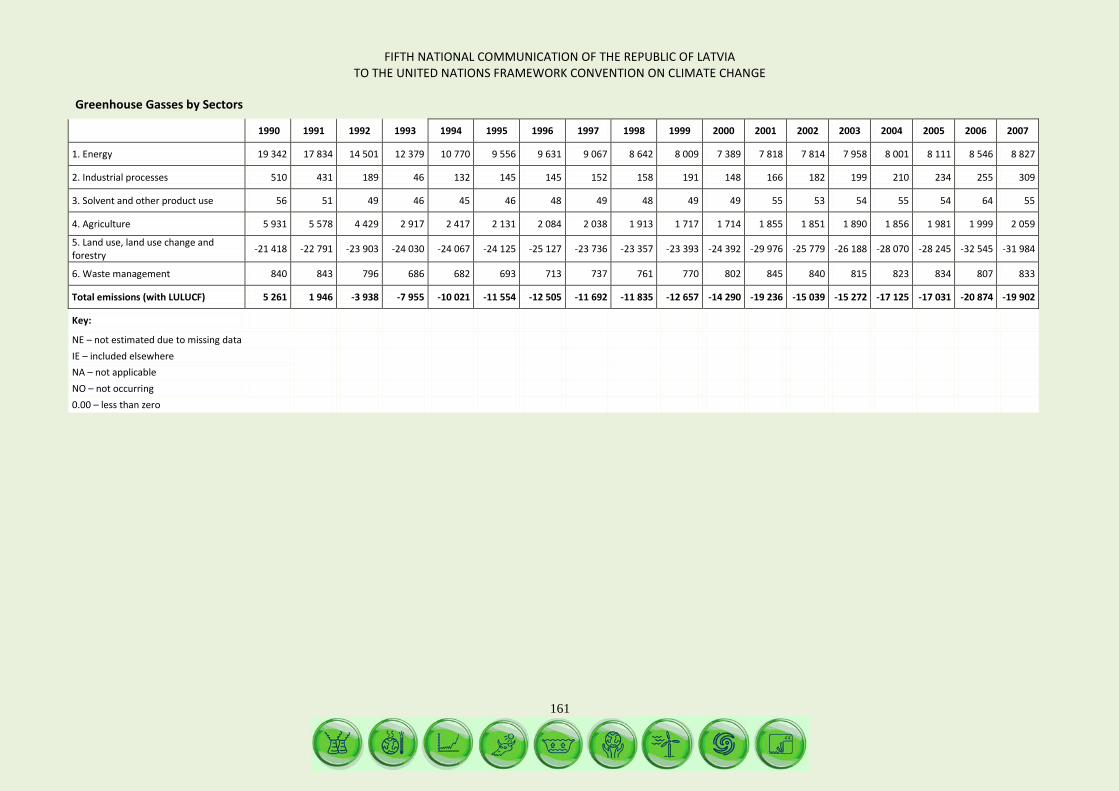
FIFTH NATIONAL COMMUNICATION OF THE REPUBLIC OF LATVIA TO THE UNITED NATIONS FRAMEWORK CONVENTION ON CLIMATE CHANGE
161
Greenhouse Gasses by Sectors
1990 1991 1992 1993 1994 1995 1996 1997 1998 1999 2000 2001 2002 2003 2004 2005 2006 2007
1. Energy 19 342 17 834 14 501 12 379 10 770 9 556 9 631 9 067 8 642 8 009 7 389 7 818 7 814 7 958 8 001 8 111 8 546 8 827
2. Industrial processes 510 431 189 46 132 145 145 152 158 191 148 166 182 199 210 234 255 309
3. Solvent and other product use 56 51 49 46 45 46 48 49 48 49 49 55 53 54 55 54 64 55
4. Agriculture 5 931 5 578 4 429 2 917 2 417 2 131 2 084 2 038 1 913 1 717 1 714 1 855 1 851 1 890 1 856 1 981 1 999 2 059
5. Land use, land use change and forestry -21 418 -22 791 -23 903 -24 030 -24 067 -24 125 -25 127 -23 736 -23 357 -23 393 -24 392 -29 976 -25 779 -26 188 -28 070 -28 245 -32 545 -31 984
6. Waste management 840 843 796 686 682 693 713 737 761 770 802 845 840 815 823 834 807 833
Total emissions (with LULUCF) 5 261 1 946 -3 938 -7 955 -10 021 -11 554 -12 505 -11 692 -11 835 -12 657 -14 290 -19 236 -15 039 -15 272 -17 125 -17 031 -20 874 -19 902
Key: NE – not estimated due to missing data IE – included elsewhere NA – not applicable NO – not occurring 0.00 – less than zero
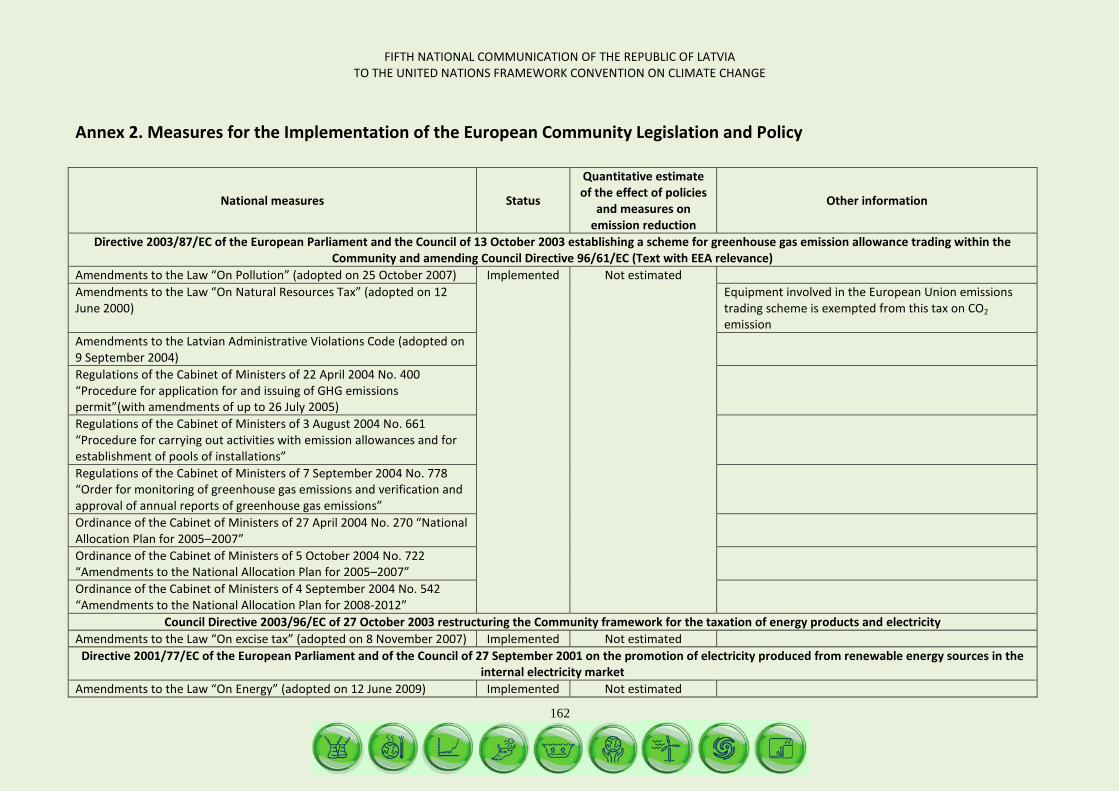
FIFTH NATIONAL COMMUNICATION OF THE REPUBLIC OF LATVIA TO THE UNITED NATIONS FRAMEWORK CONVENTION ON CLIMATE CHANGE
162
Annex 2. Measures for the Implementation of the European Community Legislation and Policy
National measures Status
Quantitative estimate of the effect of policies
and measures on emission reduction
Other information
Directive 2003/87/EC of the European Parliament and the Council of 13 October 2003 establishing a scheme for greenhouse gas emission allowance trading within the Community and amending Council Directive 96/61/EC (Text with EEA relevance)
Amendments to the Law “On Pollution” (adopted on 25 October 2007) Implemented Not estimated
Amendments to the Law “On Natural Resources Tax” (adopted on 12 June 2000)
Equipment involved in the European Union emissions trading scheme is exempted from this tax on CO2 emission
Amendments to the Latvian Administrative Violations Code (adopted on 9 September 2004)
Regulations of the Cabinet of Ministers of 22 April 2004 No. 400 “Procedure for application for and issuing of GHG emissions permit”(with amendments of up to 26 July 2005)
Regulations of the Cabinet of Ministers of 3 August 2004 No. 661 “Procedure for carrying out activities with emission allowances and for establishment of pools of installations”
Regulations of the Cabinet of Ministers of 7 September 2004 No. 778 “Order for monitoring of greenhouse gas emissions and verification and approval of annual reports of greenhouse gas emissions”
Ordinance of the Cabinet of Ministers of 27 April 2004 No. 270 “National Allocation Plan for 2005–2007”
Ordinance of the Cabinet of Ministers of 5 October 2004 No. 722 “Amendments to the National Allocation Plan for 2005–2007”
Ordinance of the Cabinet of Ministers of 4 September 2004 No. 542 “Amendments to the National Allocation Plan for 2008-2012”
Council Directive 2003/96/EC of 27 October 2003 restructuring the Community framework for the taxation of energy products and electricity Amendments to the Law “On excise tax” (adopted on 8 November 2007) Implemented Not estimated
Directive 2001/77/EC of the European Parliament and of the Council of 27 September 2001 on the promotion of electricity produced from renewable energy sources in the internal electricity market
Amendments to the Law “On Energy” (adopted on 12 June 2009) Implemented Not estimated
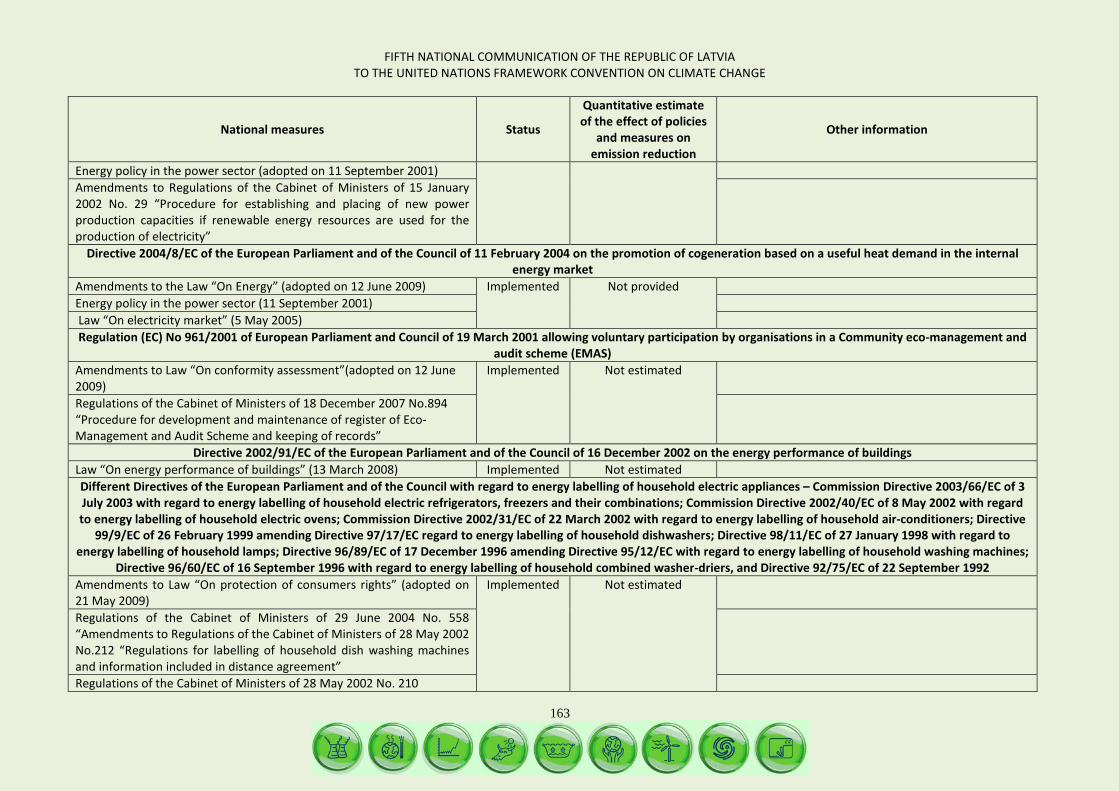
FIFTH NATIONAL COMMUNICATION OF THE REPUBLIC OF LATVIA TO THE UNITED NATIONS FRAMEWORK CONVENTION ON CLIMATE CHANGE
163
National measures Status
Quantitative estimate of the effect of policies
and measures on emission reduction
Other information
Energy policy in the power sector (adopted on 11 September 2001) Amendments to Regulations of the Cabinet of Ministers of 15 January 2002 No. 29 “Procedure for establishing and placing of new power production capacities if renewable energy resources are used for the production of electricity”
Directive 2004/8/EC of the European Parliament and of the Council of 11 February 2004 on the promotion of cogeneration based on a useful heat demand in the internal energy market
Amendments to the Law “On Energy” (adopted on 12 June 2009) Implemented Not provided Energy policy in the power sector (11 September 2001) Law “On electricity market” (5 May 2005) Regulation (EC) No 961/2001 of European Parliament and Council of 19 March 2001 allowing voluntary participation by organisations in a Community eco-management and
audit scheme (EMAS) Amendments to Law “On conformity assessment”(adopted on 12 June 2009)
Implemented Not estimated
Regulations of the Cabinet of Ministers of 18 December 2007 No.894 “Procedure for development and maintenance of register of Eco-Management and Audit Scheme and keeping of records”
Directive 2002/91/EC of the European Parliament and of the Council of 16 December 2002 on the energy performance of buildings Law “On energy performance of buildings” (13 March 2008) Implemented Not estimated Different Directives of the European Parliament and of the Council with regard to energy labelling of household electric appliances – Commission Directive 2003/66/EC of 3 July 2003 with regard to energy labelling of household electric refrigerators, freezers and their combinations; Commission Directive 2002/40/EC of 8 May 2002 with regard to energy labelling of household electric ovens; Commission Directive 2002/31/EC of 22 March 2002 with regard to energy labelling of household air-conditioners; Directive
99/9/EC of 26 February 1999 amending Directive 97/17/EC regard to energy labelling of household dishwashers; Directive 98/11/EC of 27 January 1998 with regard to energy labelling of household lamps; Directive 96/89/EC of 17 December 1996 amending Directive 95/12/EC with regard to energy labelling of household washing machines;
Directive 96/60/EC of 16 September 1996 with regard to energy labelling of household combined washer-driers, and Directive 92/75/EC of 22 September 1992 Amendments to Law “On protection of consumers rights” (adopted on 21 May 2009)
Implemented Not estimated
Regulations of the Cabinet of Ministers of 29 June 2004 No. 558 “Amendments to Regulations of the Cabinet of Ministers of 28 May 2002 No.212 “Regulations for labelling of household dish washing machines and information included in distance agreement”
Regulations of the Cabinet of Ministers of 28 May 2002 No. 210
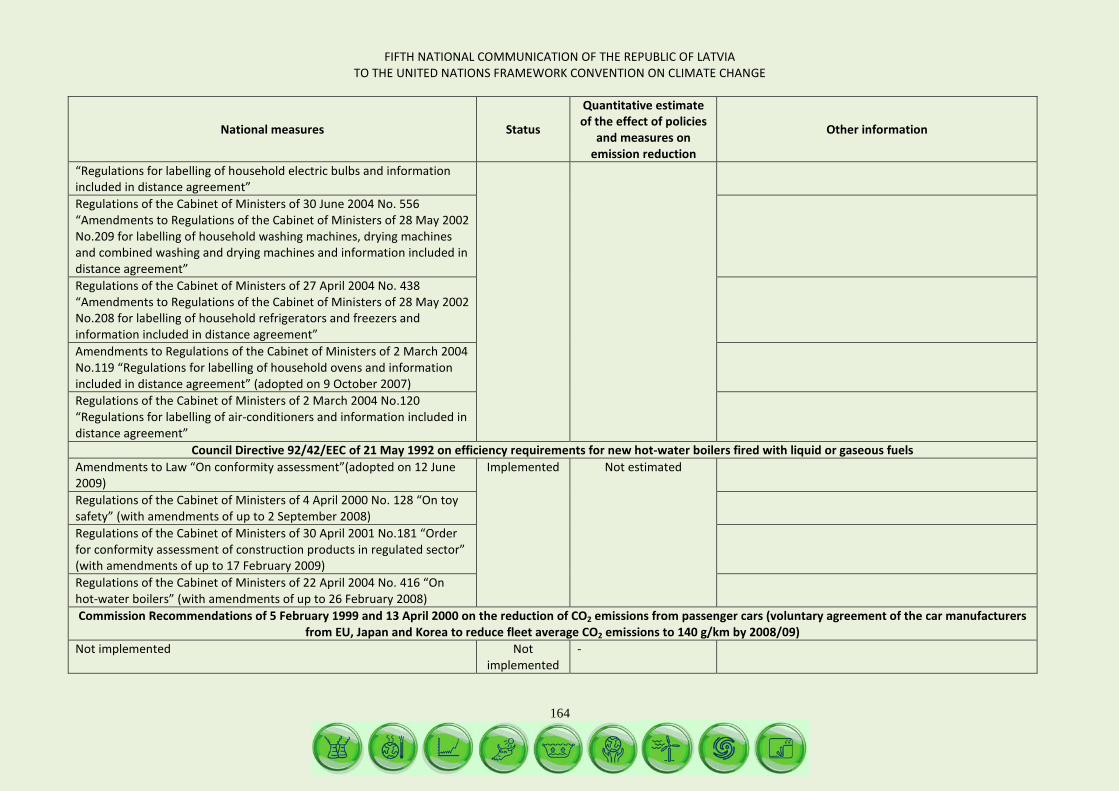
FIFTH NATIONAL COMMUNICATION OF THE REPUBLIC OF LATVIA TO THE UNITED NATIONS FRAMEWORK CONVENTION ON CLIMATE CHANGE
164
National measures Status
Quantitative estimate of the effect of policies
and measures on emission reduction
Other information
“Regulations for labelling of household electric bulbs and information included in distance agreement” Regulations of the Cabinet of Ministers of 30 June 2004 No. 556 “Amendments to Regulations of the Cabinet of Ministers of 28 May 2002 No.209 for labelling of household washing machines, drying machines and combined washing and drying machines and information included in distance agreement”
Regulations of the Cabinet of Ministers of 27 April 2004 No. 438 “Amendments to Regulations of the Cabinet of Ministers of 28 May 2002 No.208 for labelling of household refrigerators and freezers and information included in distance agreement”
Amendments to Regulations of the Cabinet of Ministers of 2 March 2004 No.119 “Regulations for labelling of household ovens and information included in distance agreement” (adopted on 9 October 2007)
Regulations of the Cabinet of Ministers of 2 March 2004 No.120 “Regulations for labelling of air-conditioners and information included in distance agreement”
Council Directive 92/42/EEC of 21 May 1992 on efficiency requirements for new hot-water boilers fired with liquid or gaseous fuels Amendments to Law “On conformity assessment”(adopted on 12 June 2009)
Implemented Not estimated
Regulations of the Cabinet of Ministers of 4 April 2000 No. 128 “On toy safety” (with amendments of up to 2 September 2008)
Regulations of the Cabinet of Ministers of 30 April 2001 No.181 “Order for conformity assessment of construction products in regulated sector” (with amendments of up to 17 February 2009)
Regulations of the Cabinet of Ministers of 22 April 2004 No. 416 “On hot-water boilers” (with amendments of up to 26 February 2008)
Commission Recommendations of 5 February 1999 and 13 April 2000 on the reduction of CO2 emissions from passenger cars (voluntary agreement of the car manufacturers from EU, Japan and Korea to reduce fleet average CO2 emissions to 140 g/km by 2008/09)
Not implemented Not implemented
-
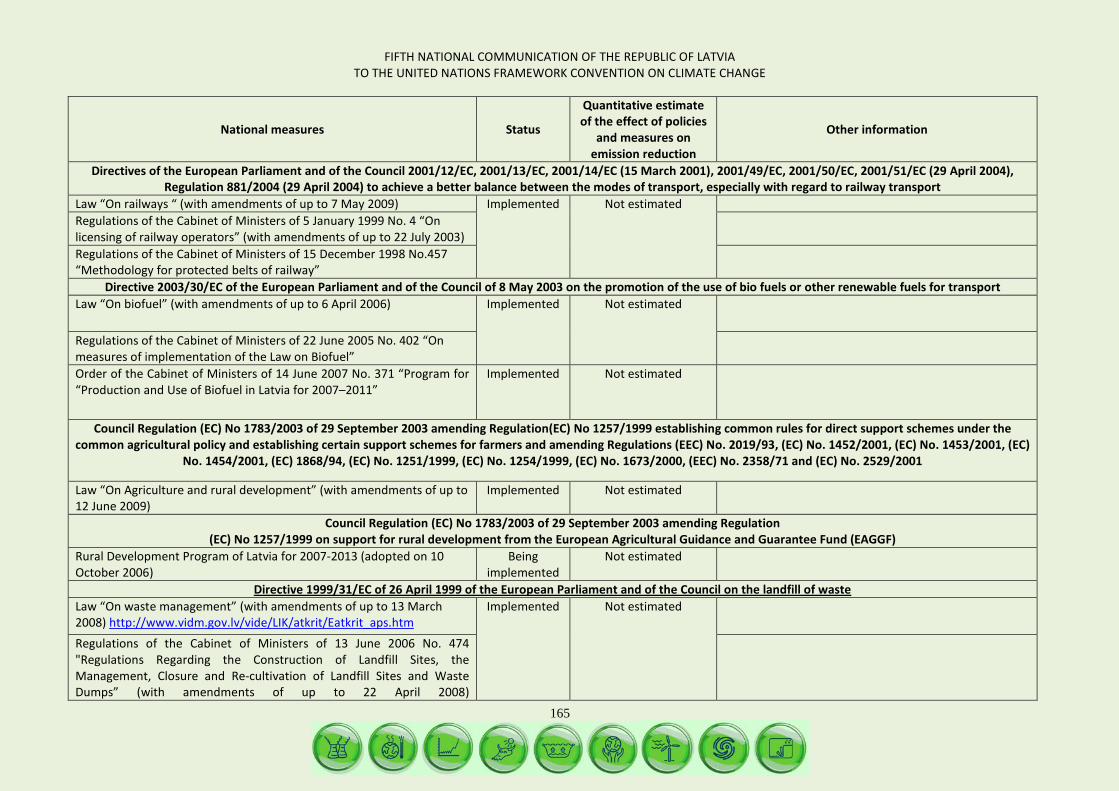
FIFTH NATIONAL COMMUNICATION OF THE REPUBLIC OF LATVIA TO THE UNITED NATIONS FRAMEWORK CONVENTION ON CLIMATE CHANGE
165
National measures Status
Quantitative estimate of the effect of policies
and measures on emission reduction
Other information
Directives of the European Parliament and of the Council 2001/12/EC, 2001/13/EC, 2001/14/EC (15 March 2001), 2001/49/EC, 2001/50/EC, 2001/51/EC (29 April 2004), Regulation 881/2004 (29 April 2004) to achieve a better balance between the modes of transport, especially with regard to railway transport
Law “On railways “ (with amendments of up to 7 May 2009) Implemented Not estimated Regulations of the Cabinet of Ministers of 5 January 1999 No. 4 “On licensing of railway operators” (with amendments of up to 22 July 2003)
Regulations of the Cabinet of Ministers of 15 December 1998 No.457 “Methodology for protected belts of railway”
Directive 2003/30/EC of the European Parliament and of the Council of 8 May 2003 on the promotion of the use of bio fuels or other renewable fuels for transport Law “On biofuel” (with amendments of up to 6 April 2006) Implemented Not estimated
Regulations of the Cabinet of Ministers of 22 June 2005 No. 402 “On measures of implementation of the Law on Biofuel”
Order of the Cabinet of Ministers of 14 June 2007 No. 371 “Program for “Production and Use of Biofuel in Latvia for 2007–2011”
Implemented Not estimated
Council Regulation (EC) No 1783/2003 of 29 September 2003 amending Regulation(EC) No 1257/1999 establishing common rules for direct support schemes under the common agricultural policy and establishing certain support schemes for farmers and amending Regulations (EEC) No. 2019/93, (EC) No. 1452/2001, (EC) No. 1453/2001, (EC)
No. 1454/2001, (EC) 1868/94, (EC) No. 1251/1999, (EC) No. 1254/1999, (EC) No. 1673/2000, (EEC) No. 2358/71 and (EC) No. 2529/2001
Law “On Agriculture and rural development” (with amendments of up to 12 June 2009)
Implemented Not estimated
Council Regulation (EC) No 1783/2003 of 29 September 2003 amending Regulation (EC) No 1257/1999 on support for rural development from the European Agricultural Guidance and Guarantee Fund (EAGGF)
Rural Development Program of Latvia for 2007-2013 (adopted on 10 October 2006)
Being implemented
Not estimated
Directive 1999/31/EC of 26 April 1999 of the European Parliament and of the Council on the landfill of waste Law “On waste management” (with amendments of up to 13 March 2008) http://www.vidm.gov.lv/vide/LIK/atkrit/Eatkrit_aps.htm
Implemented Not estimated
Regulations of the Cabinet of Ministers of 13 June 2006 No. 474 "Regulations Regarding the Construction of Landfill Sites, the Management, Closure and Re-cultivation of Landfill Sites and Waste Dumps” (with amendments of up to 22 April 2008)
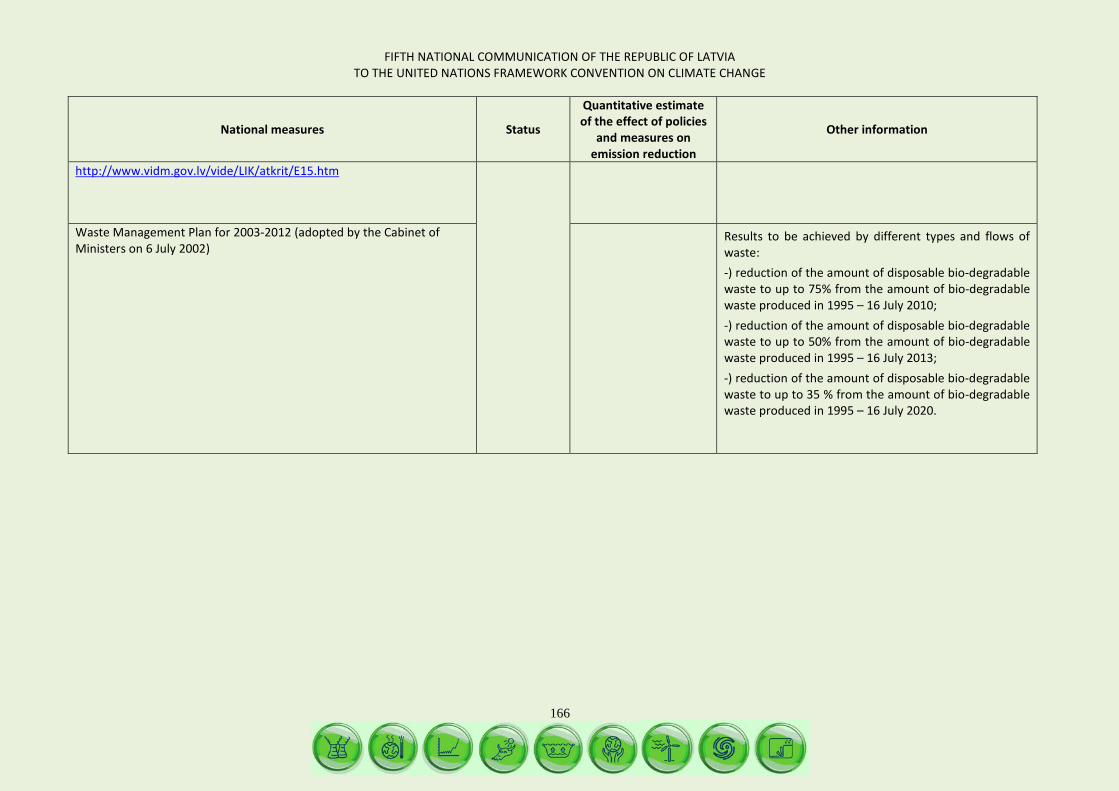
FIFTH NATIONAL COMMUNICATION OF THE REPUBLIC OF LATVIA TO THE UNITED NATIONS FRAMEWORK CONVENTION ON CLIMATE CHANGE
166
National measures Status
Quantitative estimate of the effect of policies
and measures on emission reduction
Other information
http://www.vidm.gov.lv/vide/LIK/atkrit/E15.htm
Waste Management Plan for 2003-2012 (adopted by the Cabinet of Ministers on 6 July 2002)
Results to be achieved by different types and flows of waste: -) reduction of the amount of disposable bio-degradable waste to up to 75% from the amount of bio-degradable waste produced in 1995 – 16 July 2010; -) reduction of the amount of disposable bio-degradable waste to up to 50% from the amount of bio-degradable waste produced in 1995 – 16 July 2013; -) reduction of the amount of disposable bio-degradable waste to up to 35 % from the amount of bio-degradable waste produced in 1995 – 16 July 2020.
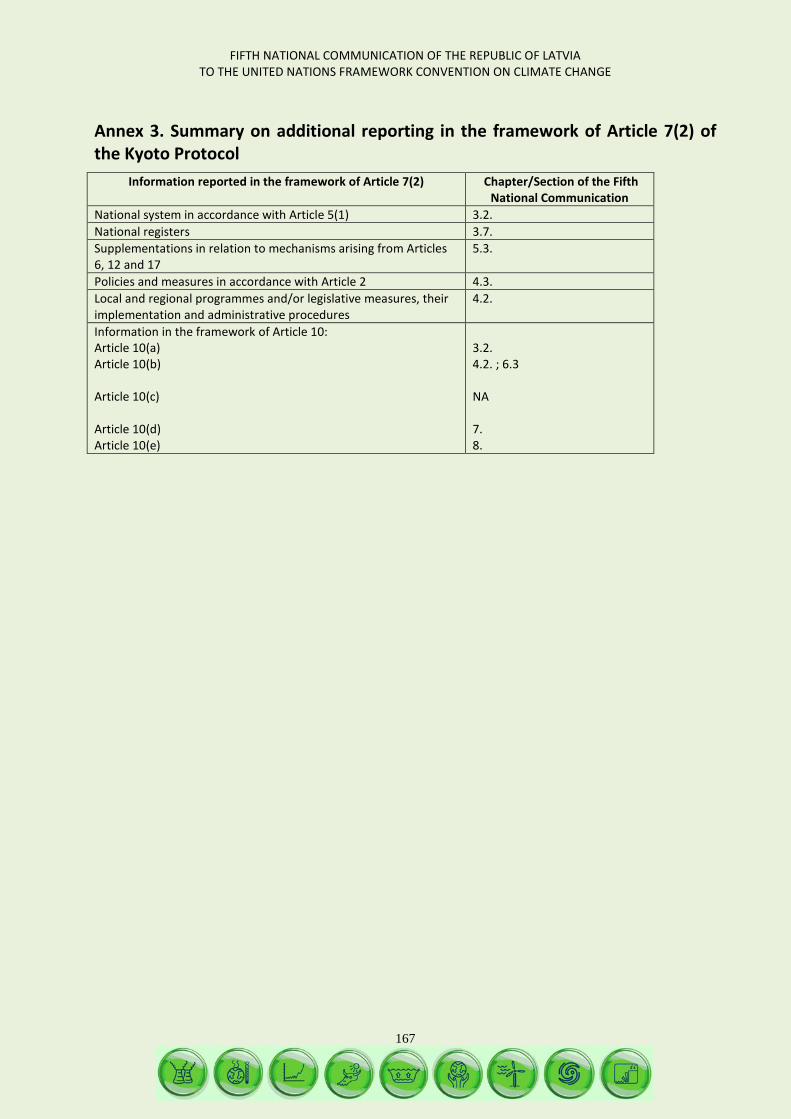
FIFTH NATIONAL COMMUNICATION OF THE REPUBLIC OF LATVIA TO THE UNITED NATIONS FRAMEWORK CONVENTION ON CLIMATE CHANGE
167
Annex 3. Summary on additional reporting in the framework of Article 7(2) of the Kyoto Protocol
Information reported in the framework of Article 7(2)
Chapter/Section of the Fifth National Communication
National system in accordance with Article 5(1) 3.2. National registers 3.7. Supplementations in relation to mechanisms arising from Articles 6, 12 and 17
5.3.
Policies and measures in accordance with Article 2 4.3. Local and regional programmes and/or legislative measures, their implementation and administrative procedures
4.2.
Information in the framework of Article 10: Article 10(a) Article 10(b) Article 10(c) Article 10(d) Article 10(e)
3.2. 4.2. ; 6.3 NA 7. 8.
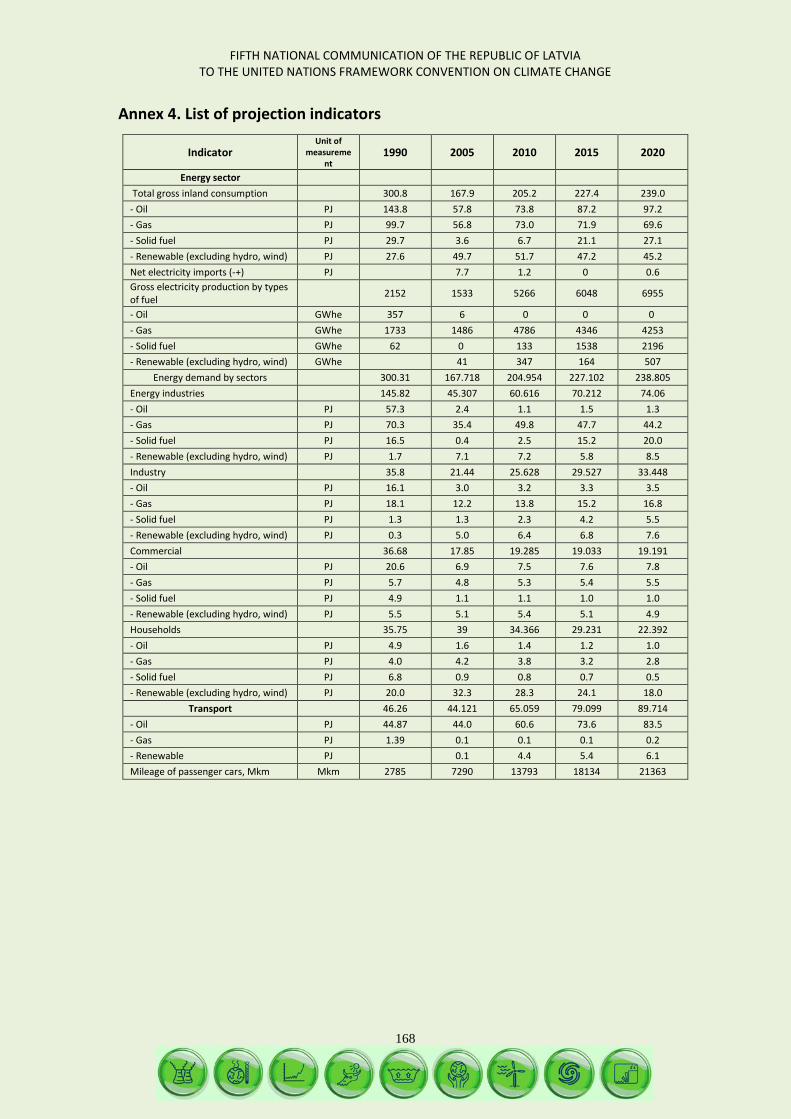
FIFTH NATIONAL COMMUNICATION OF THE REPUBLIC OF LATVIA TO THE UNITED NATIONS FRAMEWORK CONVENTION ON CLIMATE CHANGE
168
Annex 4. List of projection indicators
Indicator Unit of
measurement
1990 2005 2010 2015 2020
Energy sector Total gross inland consumption 300.8 167.9 205.2 227.4 239.0 - Oil PJ 143.8 57.8 73.8 87.2 97.2 - Gas PJ 99.7 56.8 73.0 71.9 69.6 - Solid fuel PJ 29.7 3.6 6.7 21.1 27.1 - Renewable (excluding hydro, wind) PJ 27.6 49.7 51.7 47.2 45.2 Net electricity imports (-+) PJ 7.7 1.2 0 0.6 Gross electricity production by types of fuel 2152 1533 5266 6048 6955
- Oil GWhe 357 6 0 0 0 - Gas GWhe 1733 1486 4786 4346 4253 - Solid fuel GWhe 62 0 133 1538 2196 - Renewable (excluding hydro, wind) GWhe 41 347 164 507
Energy demand by sectors 300.31 167.718 204.954 227.102 238.805 Energy industries 145.82 45.307 60.616 70.212 74.06 - Oil PJ 57.3 2.4 1.1 1.5 1.3 - Gas PJ 70.3 35.4 49.8 47.7 44.2 - Solid fuel PJ 16.5 0.4 2.5 15.2 20.0 - Renewable (excluding hydro, wind) PJ 1.7 7.1 7.2 5.8 8.5 Industry 35.8 21.44 25.628 29.527 33.448 - Oil PJ 16.1 3.0 3.2 3.3 3.5 - Gas PJ 18.1 12.2 13.8 15.2 16.8 - Solid fuel PJ 1.3 1.3 2.3 4.2 5.5 - Renewable (excluding hydro, wind) PJ 0.3 5.0 6.4 6.8 7.6 Commercial 36.68 17.85 19.285 19.033 19.191 - Oil PJ 20.6 6.9 7.5 7.6 7.8 - Gas PJ 5.7 4.8 5.3 5.4 5.5 - Solid fuel PJ 4.9 1.1 1.1 1.0 1.0 - Renewable (excluding hydro, wind) PJ 5.5 5.1 5.4 5.1 4.9 Households 35.75 39 34.366 29.231 22.392 - Oil PJ 4.9 1.6 1.4 1.2 1.0 - Gas PJ 4.0 4.2 3.8 3.2 2.8 - Solid fuel PJ 6.8 0.9 0.8 0.7 0.5 - Renewable (excluding hydro, wind) PJ 20.0 32.3 28.3 24.1 18.0
Transport 46.26 44.121 65.059 79.099 89.714 - Oil PJ 44.87 44.0 60.6 73.6 83.5 - Gas PJ 1.39 0.1 0.1 0.1 0.2 - Renewable PJ 0.1 4.4 5.4 6.1 Mileage of passenger cars, Mkm Mkm 2785 7290 13793 18134 21363
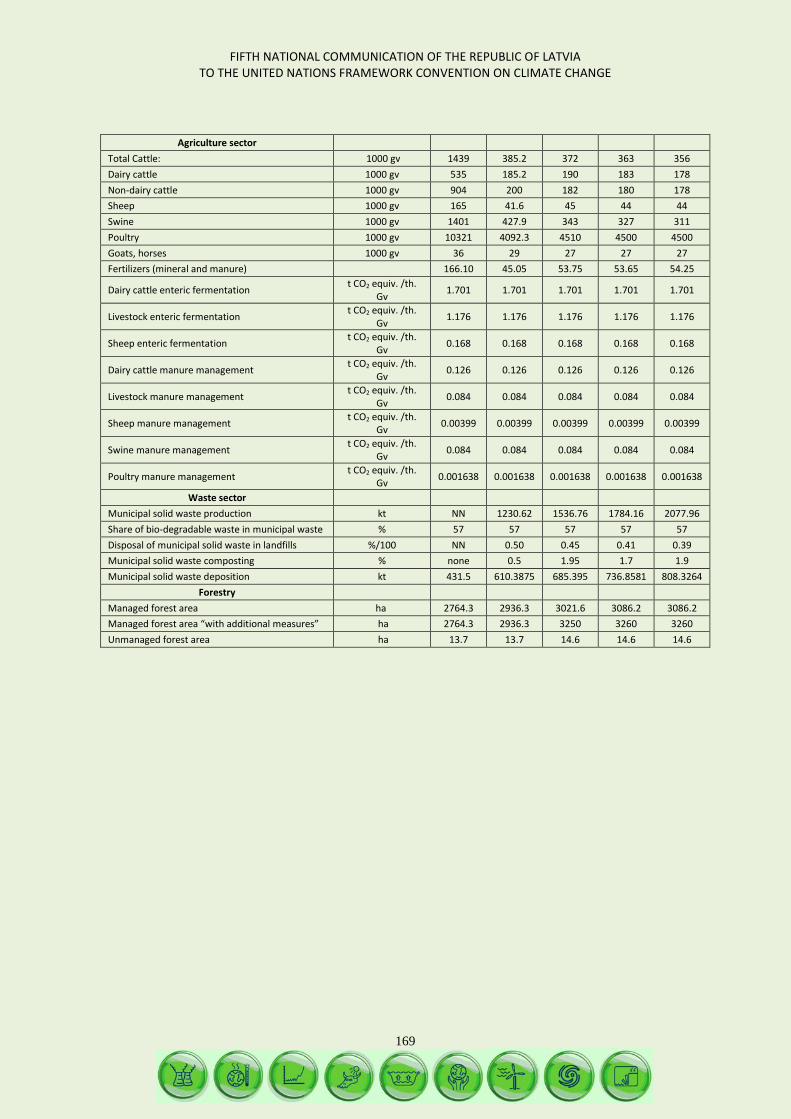
FIFTH NATIONAL COMMUNICATION OF THE REPUBLIC OF LATVIA TO THE UNITED NATIONS FRAMEWORK CONVENTION ON CLIMATE CHANGE
169
Agriculture sector Total Cattle: 1000 gv 1439 385.2 372 363 356 Dairy cattle 1000 gv 535 185.2 190 183 178 Non-dairy cattle 1000 gv 904 200 182 180 178 Sheep 1000 gv 165 41.6 45 44 44 Swine 1000 gv 1401 427.9 343 327 311 Poultry 1000 gv 10321 4092.3 4510 4500 4500 Goats, horses 1000 gv 36 29 27 27 27 Fertilizers (mineral and manure) 166.10 45.05 53.75 53.65 54.25
Dairy cattle enteric fermentation t CO2 equiv. /th. Gv 1.701 1.701 1.701 1.701 1.701
Livestock enteric fermentation t CO2 equiv. /th. Gv 1.176 1.176 1.176 1.176 1.176
Sheep enteric fermentation t CO2 equiv. /th. Gv 0.168 0.168 0.168 0.168 0.168
Dairy cattle manure management t CO2 equiv. /th. Gv 0.126 0.126 0.126 0.126 0.126
Livestock manure management t CO2 equiv. /th. Gv 0.084 0.084 0.084 0.084 0.084
Sheep manure management t CO2 equiv. /th. Gv 0.00399 0.00399 0.00399 0.00399 0.00399
Swine manure management t CO2 equiv. /th. Gv 0.084 0.084 0.084 0.084 0.084
Poultry manure management t CO2 equiv. /th. Gv 0.001638 0.001638 0.001638 0.001638 0.001638
Waste sector Municipal solid waste production kt NN 1230.62 1536.76 1784.16 2077.96 Share of bio-degradable waste in municipal waste % 57 57 57 57 57 Disposal of municipal solid waste in landfills %/100 NN 0.50 0.45 0.41 0.39 Municipal solid waste composting % none 0.5 1.95 1.7 1.9 Municipal solid waste deposition kt 431.5 610.3875 685.395 736.8581 808.3264
Forestry Managed forest area ha 2764.3 2936.3 3021.6 3086.2 3086.2 Managed forest area “with additional measures” ha 2764.3 2936.3 3250 3260 3260 Unmanaged forest area ha 13.7 13.7 14.6 14.6 14.6