FIFTH ANNUAL CONFERENCE UC-34C Issued:June 1977 ConferenceProceedings Fifth Annual Conference of the...
208
LA=6850-C ConferenceProceedings (’p ● Q) f CIC-14 REPORT COLLECTION ‘o + REPRODUCTION o coPy FIFTH ANNUAL CONFERENCE OF THE INTERNATIONAL NUCLEAR TARGET DEVELOPMENT SOCIETY OCTOBER 19,20,21,1976 PROCEEDINGS @) : 10s alamos scientific laboratory of the university of California LOS AL AMOS, NEW MEXICO 87545 I \ An Affirmative Action/Equal Opportunity Employer UNITED STATES ENERGY REsEARCH AND DEVELOPMENT ADMINISTRATION CONTRACT W-7405 -ENG. 36
Transcript of FIFTH ANNUAL CONFERENCE UC-34C Issued:June 1977 ConferenceProceedings Fifth Annual Conference of the...

LA=6850-CConferenceProceedings
(’p●
Q)f CIC-14 REPORT COLLECTION
‘o +REPRODUCTION
o coPy
FIFTH ANNUAL CONFERENCE
OF THE
INTERNATIONAL NUCLEAR TARGET
DEVELOPMENT SOCIETY
OCTOBER 19,20,21, 1976
PROCEEDINGS
@):10s alamos
scientific laboratory
of the university of CaliforniaLOS AL AMOS, NEW MEXICO 87545
I \
An Affirmative Action/Equal Opportunity Employer
UNITED STATESENERGY REsEARCH AND DEVELOPMENT ADMINISTRATION
CONTRACT W-7405 -ENG. 36

printed in the United States of America. Available fromNational Technical Information Serviee
U.S. Department of Commerce5285 Port Royal RoadSpringfield, VA 22161
Price: Printed Copy $7.75 Microfiche $3.00
Tbi. r.purt w.. pr.parrd .s . . .cc...I d worksp.m..md
b. !hc lf.itrd SI.WS (k.vcmnwnt,N’eitherthet!niwd St.tcsnor thetfnitrd S1.1.sF.n.r#, R=.rch ..d lh.v.lopnwntAd.mi.i.tmti... nor . . . .( their.mpl.+ms. nor..> &their cm.1,!,.10,.. .Ubr’mlr”cl.m. ., the,, emp!.,ces. m.k” .nyw.rr.. t}. .xpr-s or ,mplird,or . . ..nws ..v IC.S.I Ii. btllt} orrewommibi!it,tfin the.w.r.m. complete.”.. or .scI.l .”. of. . .. Inf.rm.ti,,n. .IIp. r.tus. IIr.adwt,or processdisclosed.orrepr..c@. th. t its . . . would .OI i. fri.g. prIV.WIS .Wnd
rkhl..

LA-6850-CUC-34C
Issued:June 1977
ConferenceProceedings
Fifth Annual Conference of the
International Nuclear Target Development SocietyI
Held
la
at
m
the Los Alamos Scientific Laboratory
Los Alamos, New Mexico
October 19–21, 1976
Compilers
JudithC. GurskyJohn G. Povelites
0sscientific laboratory
of the University of CaliforniaLOS ALAMOS, NEW MEXICO 87545
/\
An Affirmative Action/Equal Opportunity Employer
UNITED STATES
ENERGY RESEARCH AND DEVELOPMENT ADMINISTRATION
CONTRACT W-7405 -ENG. 36
ABOUT THIS REPORT
This official electronic version was created by scanning the best available paper or microfiche copy of the original report at a 300 dpi resolution. Original color illustrations appear as black and white images. For additional information or comments, contact: Library Without Walls Project Los Alamos National Laboratory Research Library Los Alamos, NM 87544 Phone: (505)667-4448 E-mail: [email protected]

FOREWORD
Ideas and techniques on the preparation and standardization of
nuclear targets were exchanged at the fifth annual conference of the
International Nuclear Target Development Society held at the Los
Alamos Scientific Laboratory (LASL) on October 19 - 21, 1976. The
conference was sponsored jointly by the Physics Di~ision and the
Chemistry-Nuclear Chemistry Division. Participants were from LASL
and twenty-one other laboratories including six from foreign countries.
These Proceedings represent a compilation of most of the papers
presented at the Conference. Three papers presented orally are not
included because they have been published elsewhere as noted in
their abstracts. In addition, two papers were contributed for the
Proceedings, but they were not presented orally (Stoner and Bashkin
and Saettel). Papers are reproduced as received from the authors.
The discussions following the papers have been summarized and
appear in the back of the Proceedings. Unfortunately the first
morning’s session was not recorded on tape; therefore these discussions
are not available. TWO of the planned discussion sessions are repre-
sented by papers in the body of the Proceedings (Anderl and Heagney),
while the discussion following Heagney’s paper appears in the back.
The other discussion sessions (Perry, Riel, Gursky) include contri-
butions from many people. In reporting the session, a presentation
by the session leader is followed by a discussion summary. In addition,
an abstract of J. Gallant’s work, described by Wayne Perry, is included
in the Proceedings.
Judith C. Gursky
John G. Povelites
Co-Chairmen
iv

CONTENT S
Tuesday, October 19
Session A
THE SELECTION, CHARACTERIZATION AND COATING OFLASER-FUSION TARGETS
R. Jay Fries . . . . . . . . . . . . . . . . . . . . . . . . .
ETCHING OF THIN SILICON FILMS
S. C. Stotlar, C. Maggiore, and C. Gruhn . . . . . . . . . . .
A FAST TAPE TIUNSPORT SYSTEM FOR USE WITH ON-LINESEPARATORS
J. A. Macdonald, J. C. Hardy, H. Schmeing,N. C. Bray, W. Perry, R. B. Walker, andM. Wightman . . . . . . . . . . . . . . . . . . . . . . . . .
TARGET PREPARATION WITH THE LASL ISOTOPE SEPARATOR //1
Gregory M. Kelley and Bruce J. Dropesky . . . . . . . . . . .
USE OF AN ISOTOPE SEPARATOR AT THE INEL
R.A. Anderl. . . . . . . . . . . . . . . . . . . . . . . . .
Session B
VAPOR DEPOSITION OF LARGE AREA Np~ AND U02 DEPOSITS
H. L. Adair,J. M. Dailey
ALTERNATIVES TOSTRIPPING HEAVY
D. Ramsay .
THE PREPARATION
J. R. Gibson, E. H. Kobisk, and. . . . . . . . . . . . . . . . . . . . . . . . .
THIN FILM CARBON FOILS FOR USE INION BEAMS
. . . . . . . . . . . . . . . . . . . . . . . . .
OF NITROGEN-15 TARGETS
J.D. Stinson . . . . . . . . . . . . . . . . . . . . . . . .
REDUCTION TECHNIQUES FOR ISOTOPIC MATERIALS
Joanne M. Heagney and Joseph S. Heagney . . . . . . . . . . .
DEUTERATED TITANIUM TARGETS ON THIN BACKINGS
1
32
37
38
48
59
74
85
92
A.M6ens. . . . . . . . . . . . . . . . . . . . . . . . . . . 100

TARGETS OF SILICON OXIDE AND VANADIUM OXIDE ENRICHEDIN 180 ON VARIOUS BACKINGS
A. Miens . . . . . . . . . . . . . . . . . . . . . . . . . ..106
PREPARATION OF ISOTOPICALLY ENRICHED MERCURY TARGETS
H. U. Friebel, Mrs. D. Frischke, R. Grossmann,W. Hering, H. J. Maier, and H. Puchta . . . . . . . . . . . . 112
Wednesday, October 20
Session C
A METHOD FOR STRETCHING ULTRATHIN POLYPRO~ENE FILMS
D. M. Barrusand R. L. Blake . . . . . . . . . . . . . . . . . 129
PREPARAT ION OF ULTRATHIN POLYETHYLENE FOILS BY FILMCASTING
Betty S. Cranfill o........ . . . . . . . . . . ..o 130
PLASTIC-BONDED TARGETS OF CARBON-13 AND SILICON
R. Rohwerand M. J. Urizar . . . . . . . . . . . . . . . . . . 138
THICK TARGETS FOR IN-BEAM HYPERF INE STRUCTURE STUDY
T. Minsmisono and D. Ramsay . . . . . . . . . . . . . . ..o 142
A RAPID AND ACCURATE METHOD FOR MEASURING THE THICKNESSOF EXT12EMELY THIN TARGETS
Peter Maier-Komor . . . . . . . . . . . . . . . . . . . . . . 150
PRODUCTION OF FRACTIONAL ATOMIC LAYER STANDARDS OFNIOBIUM AND VANADIUM
G. E. Thomas and P. J. Dusza . . . . . . . . . . . . . . . . . 164
THE ROLE OF AUGER ELECTRON SPECYCROSCOPY AND SECONDARYION MASS SPECTROSCOPY IN THIN FILM C@iPOSITION ANALYSIS
R. W. Springer . . . . . . . . . . . . . . . . . . . . . . . . 176
vi

Session D
PREPARATION OF SELF-SUPPORTING SILVER SULPHIDE TARGETS
M. A. Saettel . . ..oe. . .. O. O. O. O.. O. .0 177
REPRODUCIBILITY AND ACCURACY IN THE PRODUCTION ANDTHICKNESS MEASUREMENT OF EVAPORATED CARBON FILMS
John O. Stoner, Jr. and Stanley Bashkin . . . . . . . . . . 186
A METHOD FOR THE PREPARATION OF SELENTUM FOILS
J. L. Gallant . . . . . . . . . . . . . . . . . . . . . . . 192
DISCUSS ION FOLLOWING PAPERS (IN ORDER OF PRESENTATION) . . . . 193
LIST OF ATTENDEES eo. OOO ,0000004 .$,.0., .0 201
vit

THE SELECTION, CHARACTERIZATION A[4D COATING OF
LASER-FUSION TARGETS*
by
R. Jay Fries
University of CaliforniaLos Alamos Scientific Laboratory
Los Alamos, New Mexico 87545
ABSTRACT
In this paper, I will describe some of the techniques we have
developed to fabricate targets for the Los Alamos Laser Fusion program.
These laser-fusion targets are essentially microminiature packages of
50:50 deuterium:tritium mixtures. They are zapped with our high-power
short-pulse lasers to compress them to 103 to 104 times normal liquid
density and to heat them to temperatures of several kilovolts. Under
these conditions the deuterium and tritium undergo a fusion reaction
to produce helium 4 plus a neutron plus energy. Calculations indicate
that with sufficiently large lasers we will be able to get back more
energy than vie put in and therefore have a source of fusion power.
* Work performed under the auspices of the U. S. Energy Research and
Development Administration.

Although our lasers have very high power outputs, their energy output
per pulse is very small. As an example, we have under construction an
eight-beam C02 laser, illustrated in Fig. 1, that will have a power output
or from 10 t~ 40 terrawatts, which exceeds the power generating capacity
of the entire United States. However, the energy per pulse is only 10 kJ
which is just about enough to warm up your morning cup of coffee by about
10° c. As a consequence, laser-fusion targets cannot contain much mass and
we find ourselves working in a microminiature world.
I will first describe in detail how we fabricate one type of laser-fusion
target, known as the ball-and-disk type, to introduce you to our micro-mini
world. Then I will describe some of the novel techniques we have developed
to coa’t laser-fusion targets with metals and dielectrics.
A schematic of one of our ball-and-disk targets is shown in Fig. 2. This
target was invented at LASL to overcome the problems of nonsynlmetric illumination
by only one or two laser beams. The DT fuel is contained as a high-pressure gas
inside a glass microballoon. A disk of low-z material covers the area surround-
ing the pellet. In use, this disk is vaporized by a laser prepulse to form a
plasma which has a very high energy conductivity. This high-conductivity plasma
then allows the energy from the main laser pulse to couple uniformly to the
pellet over its entire surface. The outside surface of the glass microballoon is
heated by this plasma and streams .away from the pellet like an ablator. This
imparts a rocket reaction force to the remainder of the shell, called the pusher,
and thus implodes it, compressing and heating the DT fuel. This technique is
known as ablation-driven compression.

The glass microballoon is typically 40 to 60 microns in diameter with
a one- to two-micron-thick wall. In order to avoid the development of
instabilities during the compression, the microballoon must be highly spherical
and have uniform wall thickness.
The support film should minimize the mass of extraneous material in the
vicinity of the target. liehave developed a duplex plastic film which supports
the target rigidly, provides a substrate for the disk and acts as a glue to
hold the microballoon in place. This film is a laminate of polystyrene and
nitrocellulose with a total thickness of about 100 nanometers. The low-z
absorber diskis usually one micron of polyethylene that is vapor deposited from
the same direction as the laser beam. In Fig. 3, we show a photomicrograph of
one OF these ball-and-disk targets. In this case we used a gold disk to enhance
its visibility.
The largest part of the effort required to fabricate this target is the
selection and characterization of the glass microballoons. In Fig. 4 we show
a close-up of one
with a 1.5 micron
hair, as shown in
of these microballoons. This is 40-micron-diameter microballoon
wall . It weighs about 30 nanograms and is smaller than a human
Fig. 5.
And now,
have threaded
shown in Fig.
just to emphasize the Iilleputian nature of our microballoons, we
our hair through the eye of the smallest standard sewing needle as
6.
Glass microballoons are made by several different companies for use as
fillers and density-control additives for plastics. They are available in minimum
orders of 2 tc 10 pounds. And at a density of 10’0 balls per pound, that is a
lot of microballoons. However, most of these are not suitable for use as laser
targets. Although we have not actually counted the bad ones, one in 106 or 107
3

is a conservative estimate for the fraction of good microbal eons. That
still leaves 1000 to 10,000 good balls in each one pound batch. So the
only problem is how to find the good ones.
In Fig. 7 we outline the process we use to find the good microballoons.
I will describe each one of these steps in detail below. For now, I want
you to notice that we first use three batch processes to increase the
fraction of good microballoons that are present in
we must start examining the microballoons one at a
terization and measurement. In all of these techn”
the seemingly perverse character of these very ligl
the batch; after these,
time for quality charac-
ques we must account for
t microballoons for which
electrostatic, surface tension and aerodynamic forces greatly exceed gravita-
tional’ effects.
The first batch process, shown in Fig. 8, is size separation. Normal
screening methods are greatly hampered by the tendency of dry microballoons
to agglomerate strongly when shaken and the tendency of wet microballoons to
float. We have, therefore, used the bouyant forces in a float screening
method as shown in the figure. The microballoons are introduced under an
inverted screen stack which is immersed in ethanol in an ultrasonic cleaner.
Bouyancy provides the driving force and the ultrasonic motion provides agitation.
This method gives very efficient screening. It also eliminates broken pieces
of microballoons and any microballoons containing large holes. The method is
used a second time later after the crush test, described below, to separate
good balls from broken pieces.
Once the microballoons are separated by size, their particle density is
a measure of their wall thickness. The density of microballoons of interest
is less than 0.5 g/cm3, too light for the use of any liquid density separation
4
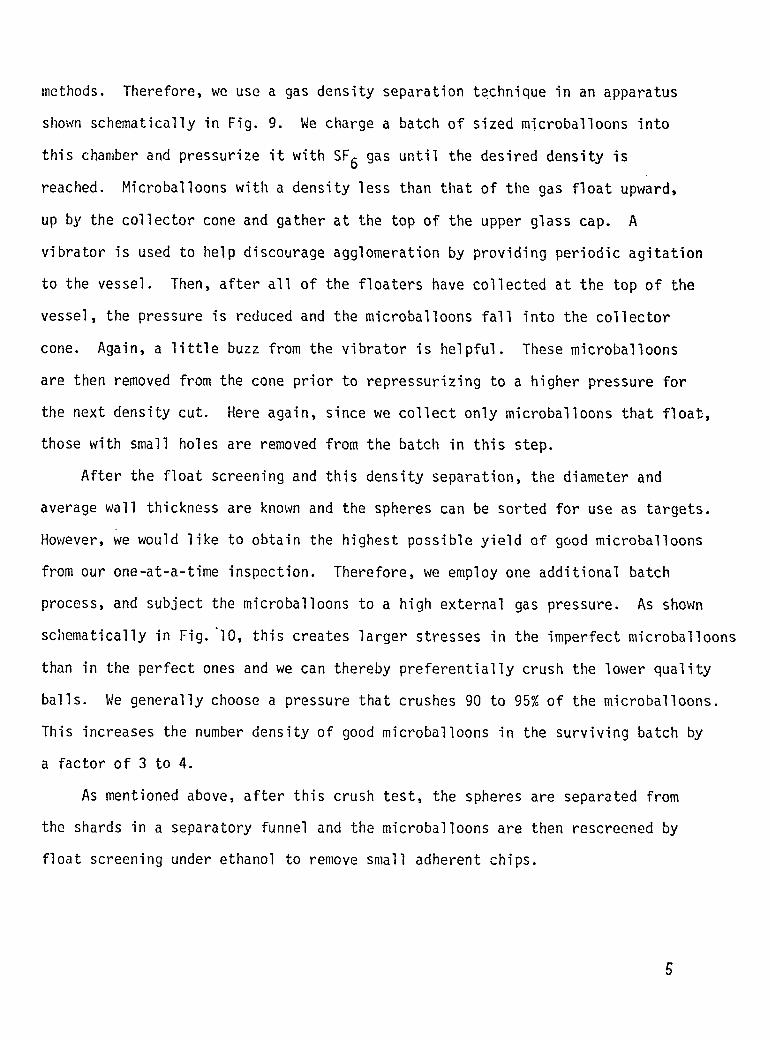
methods. Therefore, we use a gas density separation technique in an apparatus
shown schematically in Fig. 9. We charge a batch of sized microballoons into
this chamber and pressurize it with SF6 gas until the desired density is
reached. Microballoons with a density less than that of the gas float upward,
up by the collector cone and gather at the top of the upper glass cap. A
vibrator is used to help discourage agglomeration by providing periodic agitation
to the vessel. Then, after all of the floaters have collected at the top of the
vessel, the pressure is reduced and the microballoons fall into the collector
cone. Again, a little buzz from the vibrator is helpful. These microballoons
are then removed from the cone prior to repressurizing to a higher pressure for
the next density cut. Here again, since we collect only microballoons that float,
those with small holes are removed from the batch in this step.
After the float screening and this density separation, the diameter and
average wall thickness are known and the spheres can be sorted for use as targets.
However, we would like to obtain the highest possible yield of good microballoons
from our one-at-a-time inspection. Therefore, we employ one additional batch
process, and subject the microballoons to a high external gas pressure. As shown
schematically in Fig. “1O, this creates larger stresses in the imperfect microballoons
than in the perfect ones and we can thereby preferentially crush the lower quality
balls. We generally choose a pressure that crushes 90 to 95% of the microballoons.
This increases the number density of good microballoons in the surviving batch by
a factor of 3 to 4.
As mentioned above, after this crush test, the spheres are separated from
the shards in a separator funnel and the microballoons are then rescreened by
float screening under ethanol to remove small adherent chips.
5

At this point, we have completed the batch processing and must now go
to the one-at-a-time inspection technique, as shown in the processing flow
diagram in Fig. 7. If the microballoons are transparent glass such as we
have been di~cussing, we use optical interferometry to select high-quality
microballoons and measure their wall thickness. If, on the other hand, the
microballoons are metal or otherwise opaque we use x-ray m
for this purpose.
In this latter case, we lay out a 10 by 10 array of m
thin f
oil ho”
moving
croradiography
croballoons on a
a singie
we slide
into its
array is
lm of mylar that is stretched across a frame. A microdrop of light
ds each ball in place by surface tension. The array is made by re-
microballoons from a dish under the microscope with a tool made from
p-ieceof camel ’shair glued to the end ofa dissecting needle. Then
the array holder under the microscope and deposit the microballoon
proper
placed
in vacuum by an
place in the array with our camel’s hair. When complete, the
against the emulsion side of a Kodak HRP
x-ray source about one-half meter away.
plate and irradiated
In Fig. 11, we show
typical radiographic images of a good microballoon on the left and a bad one
on the right.
Now, with glass microballoons, we have found that it is faster and more
precise to quality select and measure wall thickness by optical interferometry.
For this inspection we spread out the microballoons on a glass microscope slide
and use a Jamin-Lebedev interferometer attachment on our Zeiss research microscope
to examine the balls. A field of balls on the stage of the interferometer is
shown in Fig. 12. If the microballoon is spherical with uniform walls, we will
see circular interference fringes that are concentric with the outside of the
microballoon. If the microballoon is not spherical or if the walls are not
6

uniform, the fringes will be noncircular and/or nonconcentric. There is
only one high-quality microballoon in this figure, the one in the upper
left corner. Most of the rest range from bad to horrible. In Fig. 13,
we illustrate one of the oddities that we sometimes encounter. This
microballoon has a very nonuniform wall thickness but the nonuniformity
is very symmetrical. liemight be able to use this type to compensate for
some asymmetries in the laser energy input. Except that we’ll probably
never find another one like it.
Acceptable microballoons are removed from the interferometer micro-
scope stage with our camel’s hair tool or from the radiograph array with
a micro vacuum pipette. If necessary, they are cleaned in acetone and then
placed into a glass capillary to be loaded with DT fuel.
The microballoons are filled with the desired density of DT fuel gas
by permeation through the wall at elevated temperature. The capillary
containii?g the selected microballoons is placed in a steel vessel that is
then pressurized with DT gas and heated to the desired temperature. Usually
24 h at 400° C is sufficient to fill any of the glass microballoons that we
use. And inthis case, nature smiles on us because at room temperature these
glass microballoons retain the DT fuel gas with a half-life in excess of one
year. Following cooling and depressurization, the microballoons are Floated
out from the capillary in acetone and mounted for use as targets.
The target holder consists of a strip of molybdenum foil with a 4-mm
hole near one end where the target is mounted. A thin polystyrene film is
picked up from a water surface so that it covers the hole in the molybdenum
sheet. A thin nitrocellulose film is then laminated to the polystyrene, also
by picking it up from a water surface. A DT-filled microballoon is then placed
7

near the center of the kwu hole on the polystyrene side of the film. Here
again, our camel’s hair tool is used to position the microballoon on the
plastic film. With the ball in place, the target holder is placed on a
hot plate at.’.,150°C for about 30 seconds. This heating stretches the plastic
films tautly across the hole and softens the polystyrene which serves to glue
the ball to the films. The nitrocellulose supports the entire assembly during
this processing.
The mounted target is then placed in an x-ray counter shown schematically
in Fig. 14 to assay the tritium content of the microballoon. If this is
satisfactory, the absorber disk is then applied. To do this, a mask with a
200 micron diameter hole is centered over the ball and this assembly is then
mounte’d ima vacuum evaporator. Polyethylene is boiled in a resistance-wire-
heated crucible located below the target mask assembly. This creates the
polyethylene vapor beam that deposits through the mask to create the disk and
the cap on the front of the ball.
Figure 15 shows another completed ball-and-disk target. The ball has been
nickel coated here to increase its mass. The colored rings in the polyethylene
disk arise because of light interference effects. In Fig. 16, we show a two-
beam ball-and-disk target using a plain glass ball and a polyethylene disk. In
this case, the microballoon is supported by sandwiching it between two nitro-
cellulose films so that the equator of the ball is in the plane of the support
film, and polyethylene disks are deposited on both sides of the support film.
Sometimes, for other types of experiments we mount microballoons on glass
posts or stalks, as shown in Fig. 17. The stalk tapers down to be about 5
microns where it attaches to the ball. The two are glued together with a fast-
setting epoxy.
Alternatively, we can use a glass fiber as shown ~
case, we can use a much thinner fiber - down to one or
n Fig. 18. In this
two microns diameter -
because the fiber is immobilized at both ends by gluing to the molybdenum
frame.
That concludes my description of the fabrication of these laser targets.
Now I want to describe several novel techniques that we have developed for
coating microsphere with metals and dielectrics.
In Fig. 19 we show a schematic of a generalized laser-fusion target that
might be useful with our large, multibeam laser systems in the future. We
start with a preexisting glass or metal microballoon for a mandrel and then
coat that with a high-z, high-density metal to serve as the pusher and then
overcoat this pusher with a low-z, low-density material to serve as the
absorber-ablator.
A plastic coating is frequently desired for this absorber-ablator layer.
Thus, we developed a glow discharge polymerization technique, shown schematically
in Fig. 20, to put uniform coatings of polymerized paraxylene plastic onto
microsphere substrates. We place two flat parallel-plate electrodes in our
vacuum system and admit a mixture of argon and paraxylene vapor to get a
pressure of about 400 millitorr. Then we drive the electrodes with about 400
volts at one kiloherz which creates a glow discharge between the two electrodes.
This glow discharge activates the paraxylene to form ions and free radicals which
then deposit on any surfaces in the vicinity, reacting and polymerizing in the
process. We found that if we put glass microballoons on the lower electrode,
the plasma causes them to bounce. This keeps the balls in motion to prevent
agglomeration and to allow a uniform coating of plastic to be deposited over their
entire surface. Figure 21 shows a picture of the apparatus, which was mounted in
an 18 inch bell jar vacuum system. Figure 22 is a close-up view of a set of
electrodes. We put a mylar fence around the bottom electrode to prevent the balls
from bounc ng away.
9

We found that metal microballoons didn’t bounce nearly as well in the
plasma as the glass inicroballoons and as a result, they didn’t coat as well.
As shown in Fig. 23, we overcame this difficulty by mounting a set of
electrodes on an electromagnetic vibrator. With the combined plasma and
vibrator agitation we can now coat metal microballoons as well as the glass
ones. Figure 24 is a microradiograph of a plastic coated glass microballoon.
It i
obta
lustrates the good adherence and coating thickness uniformity that we
n with this technique.
Now I want to describe our techniques for coating microballoons with metal.
We have tried all of the usual methods with our microsphere, including physical
vapor deposition, sputtering, electroless deposition and electroplating. In
all of these methods, the trick is to keep the microsphere moving so that they
don’t agglomerate together or stick to the apparatus and so that they are coated
uniformly with the metal. I will limit my discussion to electroplating and to
electroless deposition because we have developed novel techniques to coat micro-
sphere with metal by both of these processes. Both of these techniques were
developed by Tony Mayer in LASL Group CMB-6.
Let’s start with electroless plating. In this technique, the metal is
generated by chemical reduction in an aqueous solution. The metal then plates
out onto surfaces in contact with the solution.
The method
microsphere in
desired deposit
we used in the past for electroless plating was to disperse the
the vortex of a vigorously-stirred plating solution until the
thickness was obtained.
As shown in Fig. 25, useful coatings were obtained by this method. However,
agglomeration was a serious problem; coating thickness uniformity from ball-to-ball
in the same batch varied widely as the figure illustrates, and, it was difficult
10

to obtain good surfaces on coat” ngs thicker than about 5 microns. In addition,
rather different stirring techniques were requ
or less dense than the plating solution.
These difficulties prompted us to develop
red for microsphere more dense
this new technique, in which the
microsphere are dispersed in the plating solution by pumping. Me show a schematic
of the apparatus in Fig. 26. The m.icrospheres to be plated are contained in a
cylindrical reaction chamber between two end screens. This chamber is driven
up and down over a stationary piston which effectively pumps the solution through
the reaction chamber. The motion of the pumped solution imparts a random stirring
motion to the microsphere regardless of their relative density.
For example, when the cylinder moves down, the plating solution is forced up
through the reaction chamber which lifts, rotates and disperses any sinking
particles. Conversely, when the cylinder moves up, the solution is pulled into
the cavity through the top screen. This rotates and disperses any floating particles.
An
in
dr
additional advantage of this system is ready removal of any gases that are formed
the plating process.
Figure 27 shows an overall view of the apparatus. The motor assembly that
ves the reaction cylnder up and down is above the apparatus but it is not
connected in this view.
Figure 28 shows cross sections and surfaces of electroless nickel coatings
deposited onto Solacel metal microballoons with this new technique. Note that
we have obtained very thick coatings with good ball-to-ball uniformity and good
surface quality.
Finally, I want to describe our electroplating technique. Electroplating
was of particular interest to us because of the wide range of high-strength metals
and alloys that can be deposited by this technique. A schematic of the apparatus
11

is shown in Fig. 29. I{ereagain, we contain the microballoons in a cylindrical
reaction cavity that is closed off at each end with a plastic screen. A cathode
wire is mounted adjacent to each screen inside the reaction chamber. Plating
solution is pumped through this chamber - first downward and then upward - which
forces the particles alternately against each end of the chamber.
A switching system is used so that the only cathode that is activated is
the one against which the particles are being pumped. Note that most of the volume
of the cavity is filled with large, 3-mm-diam plastic spheres. As the much smaller
microsphere are pumped from one end of the chamber to the other, they tumble and
bounce against these big plastic spheres, which breaks up any agglomerates that
are forming.
Figure 30 is an overall view of the apparatus showing the reaction chamber,
the pumps and the timing and switching circuitry.
In Fig. 31, we show a close up of the reaction chamber and you can see the
tiny black rnicrospheres that we are plating mixed in with the big white plastic
balls.
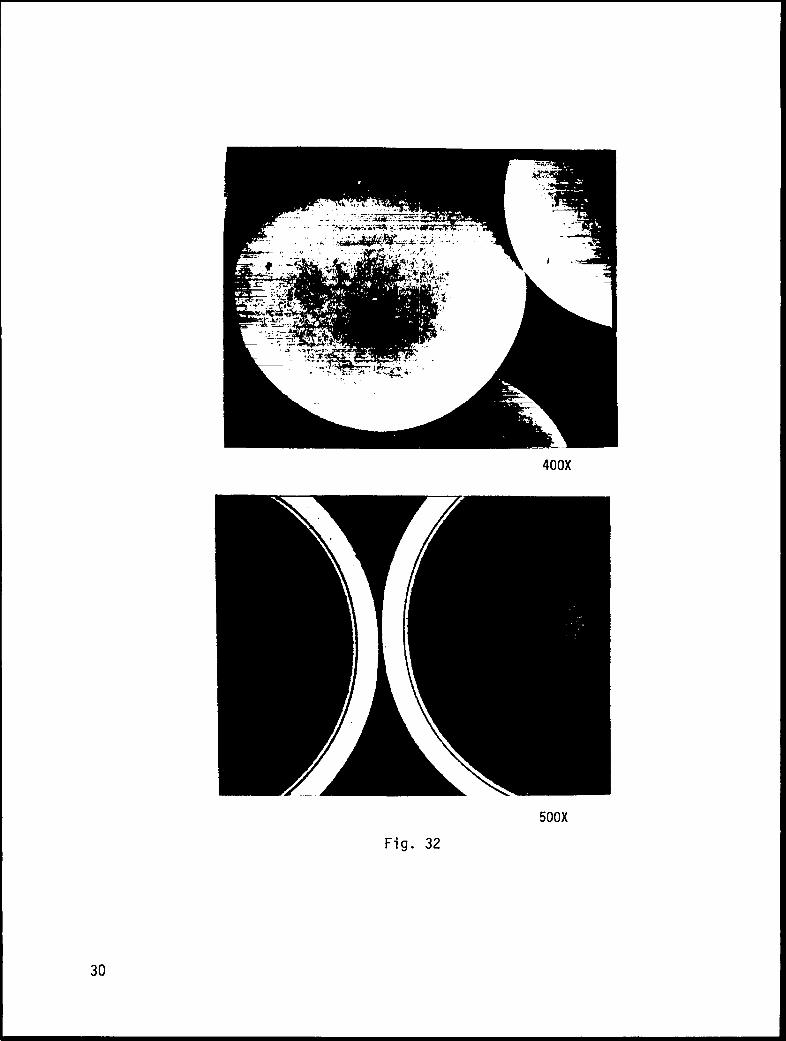
We have found this apparatus to be very useful. With it, we can plate thick)
high-quality layers of metal onto microsphere substrates regardless of their densit
relative to the plating solution. Figure 32 shows a 14-micron-thick bright-nickel
coating applied to Solacel metal microballoons. We have also plated copper and
gold/copper alloys and we are now working on a high-strength nickel/iron alloy.
12
Acknowledgements
The techniques described above represent the work of many people. We
have a group of twelve people here in the Laser Division at LASL, who are
responsible for the detailed target fabrication and assembly. Of these,
Gene Farnum deserves special recognition for the development of many of the
separation and characterization techniques that we use. In addition to this
“in-house” effort, as shown in Fig. 33, we have been aided by people in 29
different groups spread across 11 LASL divisions, as well as by the Advanced
Engineering Department of Bendix, Kansas City Division. The successes we have
achieved are, in large measure, a direct result of this very broad base of
support on which we have been able to call.
13

Figure Captions
Fig. 1.
Fig. 2.
Fig. 3.
Fig. 4.
Fig. 5.
Fig. 6.
Fig. 7.
Fig. 8.
Fig. 9.
Fig. 10.
Fig. 11.
Fig. 12.
Fig. 13.
LASL’S eight-beam, 10 kJ C02 laser system.
Schematic diagram of a one-beam ball-and-disk target.
Photomicrograph of a one-beam ball-and-disk target. Metallic
disk employed to enhance visibility.
Close-up view of a glass microballoon, ~40 vm diameter with a
~ 1.5 ~m-thick wall.
Photomicrograph of a glass microballoon on a hair, which is a
useful tool for manipulating microballoons.
Glass microballoon on a hair that is threaded through the eye of a
sewing needle to illustrate the scale.
Flow diagram for glass microballoon processing.
Schematic diagram of inverted liquid screening technique for size
separation of microballoons.
Schematic diagram of gas-density separation apparatus used to separate
previously-sized microballoons according to their wall thickness.
Schematic diagram of wall stresses in symmetric and assymetric
microballoons resulting from an external gas pressure.
X-ray microradiographs of symmetric and assymetric microballoons.
Glass microballoons as viewed in an optical interferometer. A
microballoon exhibits circular fringes that are comentric with
outside surface of the microballoon.
Interferometer fringe pattern of a glass microballoon that has
unusually symmetric wall-thickness nonuniformity.
good
the
an
14

Fig. 14. Schematic diagram of x-ray counting system used to assay tritium
content of microbal loons.
Fig. 15. Photomicrograph ofa one-beam ball-and-disk target with a metal-
coated microballoon and a polyethylene disk mounted on a thin
(~1000 il)plastic film. (Disk location indicated by interference
fringes. )
Fig. 16. Photomicrograph of a two-beam ball-and-disk target using a glass
microballoon mounted between thin plastic films (~ 500 ~), onto
which polyethylene disks are deposited.
Fig. 17. Photomicrograph of a glass microballoon target glued to a thin glass
stalk.
Fig. 18. Photomicrograph of a bare glass microbal
thin (1 to 2 pm) glass fiber.
Fig. 19. Schematic diagram of a generalized, mult
oon target glued to a very
layered laser-fusion target.
Fig. 20. Schematic diagram of the apparatus used for glow-discharge polymerization
(GDP) method of applying plastic coatings to laser-fusion targets.
Fig. 21. Photograph of the glow-discharge-polymerization apparatus.
Fig. 22. Photograph of stationary electrode assembly used in the GDP apparatus
for coating glass microballoons and stationary mandrels.
Fig. 23. Photograph of vibratory electrode assembly used in the GDP apparatus
for coating metal microballoons.
Fig. 24. X-ray microradiograph of a GDP plastic-coated glass microballoon.
Fig. 25. Metallographic sections of nickel coatings (on Solacel metal micro-
balloons) applied by the st
electroless plating.
rred-vortex dispersion technique of
15
Fig. 26. Schematic diagram of our pumped-solution apparatus for electroless
plating.
Fig. 27. Photograph of the pumped-solution apparatus for electroless plating.
Fig. 28. Metallographic sections and scanning electron micrographs of nickel
coatings (on SolaceIs) applied by the pumped-solution technique of
electroless plating.
Fig. 29. Schematic diagram of our pumped-solution electroplate.
Fig. 30. Overall photograph of our pumped-solution electroplate.
Fig. 31. Close-up view of plating cell used in our pumped-solution electro-
plate. The small black spheres are the metal microballoons that
are being plated while the large white spheres are the plastic
balls used tobreak up agglomerates.
Fig. 32. Metallographic sections and scanning electron micrographs of nickel
coatings (on Solacels) applied by our pumped-solution electrop”
Fig. 33. List of groups that have contributed to the development of our
target fabrication program.
ater.
laser
16

—.
Fig. 1
p%
40nm Nitrooalluloso..\ 70nm Polystyrene\\.
— Support film
Pushw- Gloss microsphwo-50~m diam
c=
La$or beam
AbsarborLayer
.- I pm Polyethylona
ar-O.5*fn Beryllium
Fig. 2
17

c’\
Fig. 3 Fig. 4
—.,
r. .
~.
e
-. .,-- .-. ..4
.- ..=
. .. --— . ...: :.,?=+
—
!.—
.,------ ,
,.. .
--
—
= ‘-- ..
Fig. 5 Fig. 6
18

lb kEIVEOf!ICROSAUOONS( +10” / POUNO)
+.kllEEN 10 SIZE
(s Toloz YIm)4
DENS:TV SEPARATE FOR
WALL THICNNESS(OOITO1%YIELO)
+
CRUNCH TEST mllpGRADE QUALITV
(5 ZYIEUJ), 6ATCN ~ INOWIDUAL BAU
PROCESSES
/’\+
PROCESSES +
OPTICAL PRESSLECTION fklSAL [NTERFEROHETRYFOR(.5 ZYIELO)
CUALITY SELECTION
+ OR Ano MEASUR5PIENT
HICJIORAGIOGRAPW FoR ( ‘1 z YIELO )
QuALITY SELECTION ANO i%ASURSNENT
(~.%yIELO)
\ /
CSRTIFIEO. HIGN-QUALXTf MICROSAUWNSRWY FOR SASFILLING ANO fiOUNTING
( OVEIIAU YIELD .10-’ )
Fig. 7
Ethanol bath
- Collection pan
i \ - #pm screen
/ \ R 53pm screen
/ \ 63pm screen
? I ‘Particles to be screened
) broken pieces ond solidsUltrasonicagitation
Fig. 8
EXTERNAL PRESSURIZATION
VECTORS REPRESENT WALL STRESS
Fig. 9Fig. 10
19

Fig. 11
Fig. 12
20
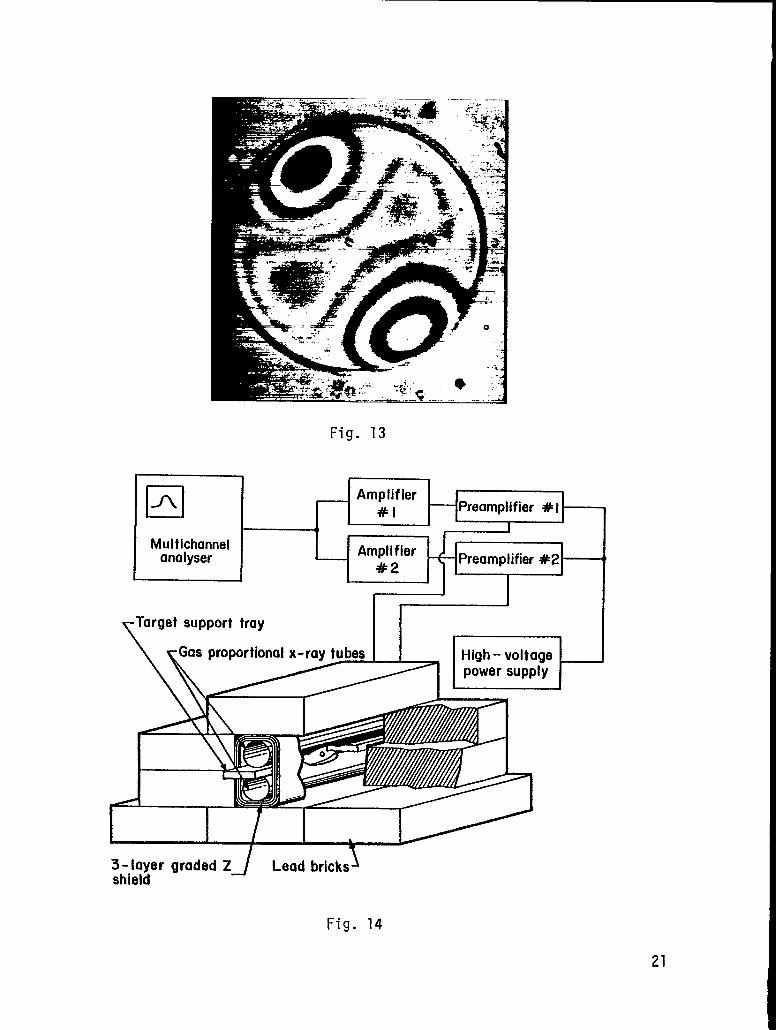
Fig. 13
c1A _ Amplifier#l Preamplifier#I
1, — IMultichannelanalyser Amplifier—
#2Preamplifier#2
I
Fig. 14
21

Fig. 15
Fig. 16
22
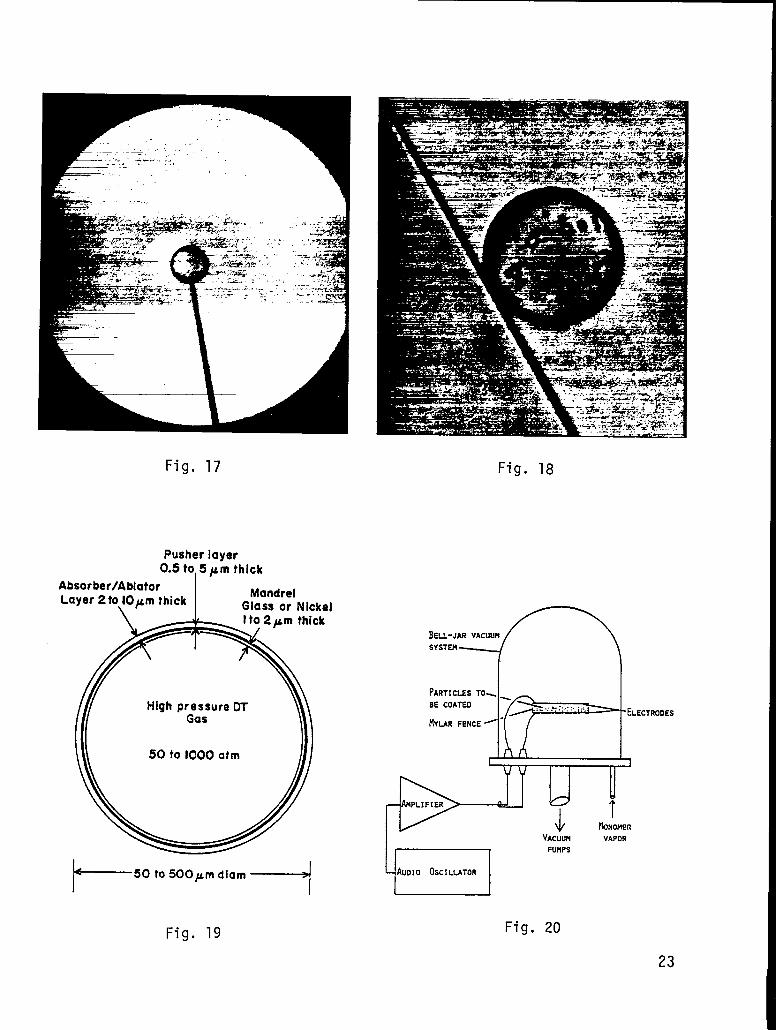
Fig. 17 Fig. 18
Pusherlayer0.5to15pm thick
Absorber/AblatorLayer2ta)Opm thick Mandrel
GltIS$ or Nickel
BEU-JAR VACUUM
sYsTEn
PARTICLES TO- .
BE COATED-ELECTRODES
MYUR FENCE ~ -
I 1
1
L
?
ibNOFIER
h- 50 to 500pm diam
--i
I,- VACUISN VAPOR
IPUMPS
‘-iAUOIO OSCILLATOR I
Fig. 19 Fig. 20
23

Fig. 21
Fig. 22
Fig. 23
24
Fig. 24

400X
400X
Fig. 25
25

Ovwfb Parfa
7=Mtlctmi
Fig. 27

400X400X
27

I Power Supply II b
I {
o
Top Cathode
A
:de
Plating Column
EE
(laY-$El Rottom H------ . .
Pump——
Top %_. —-— ——mp -
‘—1
— —I
II
Fig. 29
28

Fig. 30
Fig. 31
29
400X
500X
Fig. 32
30

IASERTARGETFABRICATIONPROGRAM
A LARGE FRACTION OF TARGf3’FABRICATION EFFORT IS OUTSIDE OF
L-DIVISIONPROPER,
WE HAVE RECEIVED MAJOR SUPPORT FROM:
CMB-1, -3, -6
J-14
M-1, -8
P-9,.-12,.-DOR
Q-26
R-2
WX-5
ADVANCED ENGINEERING DEPT,, BKC
WE HAVE ALSO BENEFITTED SIGNIFICANTLY FROM THE SUPPORT
OF:
CMB-7,-8
E-4
ENG-6,-7
H-5
P-2, -3
R-1
SD-L -2, -3, -4, -5, -6
Wx-1,-2
Fig. 33
37
ETCHING OF THIN SILICON FILMS*
by
S. C. Stotlar, C. J. Maggiore, C. R. Gruhn
ABSTRACT
Silicon films 1 pm to 6 pm thick can befabricated by an etching technique similar toone developed by R. L. Meek and others. Di-ameters greater than 5 mm are achieved. Sur-face barrier detectors fabricated from thesethin windows have been used for heavy iondetection. The etching technique used by theLos Alamos Scientific Laboratory (LASL) toobtain these thin films is described.
I. INTRODUCTION
Self-supporting epitaxial silicon films < 1 pm thick have been produced
using an electrochemical etch technique. R. L. Meek first introduced the tech-
nique of thinning n/n+ silicon wafers by selective anodic dissolution of the
substrate.1’2 The electrochemical etch rate of n+- type silicon in HF solution
is much higher than for n-type silicon. This fact is used to etch the n+-type
substrate (.01 Q-cm) from the n-type epitaxial layer (> 1 Q-cm) leaving a thin
epitaxial film supported at the edge by the substrate. The films produced in
this manner have been used to fabricate epitaxial silicon Schottky barrier (ESSB)
detectors.3,4,5
II. METHOD
The apparatus required to electroetch epitaxial silicon wafers consists of
a power supply and holders for the wafer and platinum electrode. Figure 1 shows
a picture of the holder assembly. The sapphire plate holding the wafer is
*Work performed under the auspices of the U. S. Energy Research and DevelopmentAdministration.
32

mechanically positioned relative to the electrode and the entire wafer-electrode
apparatus lowered into the etch with a portable laboratory jack.
An electrical contact was made
conductive silver epoxy. To insure
polishing, the n+ side of the wafer
minutes. This removed ~lOpm of the
electrical contact was then mounted
to the n+ substrate side of the wafer with
a uniform low resistivity contact and uniform
was pre-etched with 20:1 HNO :HF for three3
silicon substrate. The wafer with its
epi side against a clean sapphire plate with
paraffin. The n+ substrate was coated with wax (Apiezon W) except where etching
was to occur. This surface preparation yielded an etching mask with well-defined
edges that was stable over the relatively long etching times required.
After alignment of the wafer relative to the electrode, the wafer was
immersed in a 5% (weight percent) aqueous HF solution. A +8v bias was applied
to the wafer and the current and voltage monitored until the etch was complete.
During the etch a magnetic stirrer and nitrogen bubbler were used to keep the
etch concentration uniform in the vicinity of the electrode. The etch was per-
formed in the dark because photo induced charge in the substrate will cause non-
uniform etching. Similarly photo induced charge in the epitaxial layer may re-
sult in holes in the finished film. The temperature of the etch was 20°C.
Table I shows the properties of the n/n+ wafers used in this study. The
ability to produce the thin films relies on the fact that the etch rate in the
n-type epitaxial layer is >1000 times slower than in the substrate due to the
difference in resistivities. If the substrate is etched away to the edge of
the mask, etching will still proceed in the epitaxial film. It was observed
that the epitaxial film etched through preferentially at this edge. Meek has
TABLE I
Resistivity of Epi
6
(!i&cm)flO%
1
1
9
9
9
CHARACTERISTICS OF
Thickness
t
(pm)tlO%
1
2
3
4.4
6.2
STARTING MATERIAL
Substrate
6
(Q-cm)
.005 - .020
.005 - .020
.005 - .015
.005 - .015
.005 - .020
Substrate
4.
L
(pm)t25%
200
200
250
300
250
33

pointed out that this is due to diffusion of holes into the n-type region from
the n+ substrate. To minimize this problem it is desirable to have the etch
proceeding radially toward the edge of the mask at the time the etch is termin-
ated.
A number of different probe-wafer geometries were tried. To produce 5mm
diameter films it was found that either a flat or hemispherical electrode 3mm
in diameter placed lmm from the wafer yielded the most consistent results.
Figure 2 shows two of the platinum electrodes in their teflon holders.
As the etching proceeds, the current drops after the epitaxial layer is
reached and will continue to drop as the etched pattern increases in size. How-
ever, this drop in the etching current is not reproduceable enough to be used as
a means of timing the etch termination. A periodic visual inspection was made
to determine when the etch should stop. The size of the film was determined by
shining a light through the sapphire plate and the partially transparent film.
Typical etching currents were 200ma/cm2
Typical etch times were 60f15 minutes.
2initially and 120ma/cm at termination.
Fig. 1Etching apparatus used to support thewafer and electrodes in the etch.
Fig. 2Platinum electrodes used for etching.
34

To produce the thin films efficiently the technique outlined above was
generalized to a multiple point apparatus. A square array of nine flat elec-
trodes was mounted opposite a two inch wafer masked with nine holes 5mm in dia-
meter. Since termination of the etch is critical to prevent etch through at the
edge of the film, each pattern was terminated by masking with wax when indicated
by visual inspection. There were no problems associated with possible crosstalk
between electrodes and adjacent films. After etching and cleaning the wafer was
diced into separate self supporting films with a diamond scriber.
The yield of suitable films from multiple etching depended on the thickness
of the epitaxial film and care in handling. Yields of N50% for the l~m material
and >80% for films thicker than 3pm were obtained. For lpm material the largest
films obtained were 5mm in diameter, but films up to 2.5cm in diameter have been
produced with 50pm material. These large area patterns require the use of a
flatscreen electrode.
III. RESULTS
The thin films have been fabricated into surface barrier detectors. Their16 3
responses to a particles, O ions, and fission fragments have been measured.
The thickness uniformity of the ESSB detectors was measured with an a thickness
gauge and by the u response of the detector. Table II shows the results of the
uniformity measurements. The a beam was collimated to 0.5mm diameter and
measurements were taken in a square matrix with 0.5mm spacing.
TABLE II
UNIFORMITY MEASUREMENTS
Total Thicknessa Thickness MinusDetector (proof Si) Electrodesb Thickness Observedc
26-4 4.39t.15 4.13?.16 4.18t.06
40-1 2.88?.13 2.66?.13 2.52f.04
28-2 .971e08 .71*.1(3
aThe thickness determined by the standard surface barrier detector.
bThe total thickness minus the thickness due to the front and back contactsas measured at the time of evaporation.
cThickness measured by the alpha response of the ESSB detector itself.
35

IV. CONCLUSIONS
Selective anodic dissolution of the substrate of m/m+ epitaxial silicon
wafers has been shown to be a viable processing technique for the production of
thin self-supporting epitaxial films. The technique has been used to produce
simultaneously up to nine films 5mm in diameter on a single two inch wafer.
The uniformity of films produced in this manner is determined primarily by the
uniformity of the epitaxial growth process. The specifications of the commer-
cially prepared epitaxial material were i_lO%thickness and resistivity over the
two inch diameter
detectors uniform
ACKNOWLEDGMENTS
surface. The resultant films have been processed into ESSB
to t3% for thicknesses >3uInand f14% for a 0.71pm detector.
The authors wish to thank J. Gursky for help in evaporating the contacts on
the detectors fabricated from the thin films.
REFERENCES
1.
2.
3.
4.
5.
R. L. Meek, “Electrochemically Thinned N/N+ Epitaxial Silicon - Method andApplications ,“ Electrochemical Technology (July 1971).
R. L. Meek, W. M. Gibson, and R. H. Braun, “Preparation of Supported, Large-Area, Uniformly Thin Silicon Films for Particle-Channeling Studies,” NuclearInstruments and Methods 94 (1971).—
C. Maggiore, P. Goldstone, C. Gruhn, H. DeHaven, S. Stotlar, and N. Jarmie,“Thin Epitaxial Silicon for dE/dX Detectors,” IEEE Trans. Nucl. Sci. NS-24(February 1977).
A. Tetefort, “Etude d’cm Nouvean Precede de Preparation de DetecteursNucleaires dE/dX Minces,” Thesis University Clermont-Ferrand, France (1976).
J. P. Ponpon, P. Siffert, F. Vazeille, “Thin dE/dX Detectors of UniformThickness Made on Epitaxial Silicon,” NIM 112, 465-467 (1973).
36

A FAS1’ TAPE TRANSPORT SYSTEM FOR USE VITii ON-LINE SEPARATORS
J.A. Macdonald, J.C. Hardy, H. Schmeing, N.C. Bray,
W. Perry, R.B. Walker and N. Wightman
Atomic Enepgy of Canada Lh<ted
Chalk River Nucleap Luboratm%es
ChaZk River, 0ni5ar%o, Canada KOJ IJO
ABSTRACT
A fast tape transport system has been developed
for transporting samples collected from the ion beam of an isotope
separator to a low background area. The unusual features of the
system are its tape speed (up to 585 cm s‘1) and the fact that
the tape system operates entirely in air except for the
collection point on the tape at the end of the beam line.
Published in Nucl. Instr. and Meth. 139 (1976) 355.
37

TARGET PREPARATION WITH THE LASL ISOTOPE SEPARATOR #1
Gregory M. Kelley CNC-11
Bruce J. Dropesky CNC-11
I. Introduction
The vacuum evaporation method of target preparation is currently in
widespread use. Its limitations become apparent when, for example, a
chemically pure, highly enriched target of a naturally low abundance iso-
tope is desired. The demand for such targets has made the electromagnetic
separation, electrostatic retardation technique more and more attractive.
Basically, an isotope or mass separator (the terms tend to be used
interchangeably) consists of; an ion source, electrostatic lenses for
controlling beam shape, an electromagnetic analyzer stage, and a collection
or retardation/collection system. The Swedish built machine used here at
LASL for the past eleven years is shown in Figure 1.
Five high voltage supplies are used. One supplies the 50-60 kV accel-
eration potential. Three others provide necessary lens voltages. The
fifth is connected in series with the acceleration supply. It provides a
O-2 kV net voltage which is brought through an overhead conduit to the
retardation/collection assembly.
The analyzer magnet is a 90° sector, with a 1.6 m radius. Its power
supply is rated at 10 kW with a current stability of 1 part in 104 per
hour. It provides a field of up to 0.35 T (3500 gauss).
Three, freon baffled, oil diffusion pumps keep the system pressure in
the low 10-6 region. Figure 2 shows a titanium sublimator pump and a L(N2)
cold surface used to further reduce the pressure in the post-analyzer
section to the low 10-7 region. To the right of the photo is the grounded
shield around the high voltage cable and ceramic feedthrough used to bring
the retardation potential to the lens.
The ion source most generally used is of the Nielsen or oscillating
electron type shown in Figure 3. Its anode and end plates are of high
purity, high density graphite. In order to reduce memory effects, and
maintain sample purity, the internal components of the source proper are
usually replaced before use with a different charge material. The integral,
plug in design of the source allows us to dedicate sources to specific
charge materials.
38

II. Charge Vaporization and Ionization
Table 1 lists several targets, charge materials, and methods of charge
vaporization and ionization.
TABLE I
TARGET CHARGE MATERIAL
‘Be BeO
237U‘3°8
121Sb Sb (metal)
21OPb Pb (metal)
50Ti TiCL4
VAPORIZATION METHOD
Internal Chlorination (a)
Charge Heating(b)
High Vapor Pressure (c)
Compound
a. The internal chlorination method, first described by Sidenius
1), wherein CC14 vapor is passed through aand Skilbreid
heated rare earth oxide, thus converting it to a volatile
chloride which is then dissociated in the plasma discharge and
ionized.
b. Heating one of the more volatile metals such as Pb or Sb, to
a temperature where its vapor pressure is high enough to
provide a plasma discharge and thus, an ion beam of the
desired intensity.
c. Introduction of vapor from a highly volatile compound, such as
‘ic’4’into the ion source Plasma region where dissociation and
ionization occur.
III. Retardation Lens
Figure 4 shows our retardation lens in place in the collector chamber.
Retardation potential is brought to the lens by the vertical tube seen in the39

center of the photo. The rectangular slot in which the target holder is
mounted allows adjustment of the foil in the “X” direction. The small central
tube allows “Z” axis corrections in order to achieve the desired spot size.
Focusing of stable mass beams is accomplished by deflecting the beam to either
of two fluorescent screens. The horizontal lines delineate the height of the
lens entrance slit.
IV. Target Preparation
a) The neutron induced fission cross section of 237U was measured by exposing
a chemically purified, isotonically separated sample to the neutron pulse from
an underground nuclear explosion. The short half life of 237U (t1/2
= 6.70 t
0.02 d) and the rigid timing of the Pommard event called for unusually smooth
scheduling and a high degree of interlaboratory cooperation so that the target
could be properly placed on the experimental tower shortly before the detona-
tion. Forty-two mg of enriched 236U were irradiated in the high flux isotope
reactor (HFIR) at Oak Ridge National Laboratory for a period of 22 days. The
irradiated sample containing % 1.9% 237U was directly air shipped to LASL for
chemical purification, (chiefly to remove fission products and curie quantities
of Np) prior to isotopic separation and air shipment to the Nevada Test Site.
As shown in Figure 5, a concentrated solution of the purified uranium was
transferred to a quartz wool wad in a quartz tube, evaporated to dryness, and
converted to U308 by heating in air to 800”C. (The purification and transfer
were done in a hot cell because of the high radiation levels involved. )
After the charge was placed in the ion source, it was volatized using the
internal chlorination technique. Ion beams of the uranium isotopes were pro-
duced and accelerated at a potential of 50 keV. Figure 6 shows the simple cup236U
and galvanometers arrangement which was provided to monitor the 5-10 PA
beam. The adjacent slit was provided to allow the 237U ions to enter the
retardation lens. Ion energy was reduced to 300 eV to prevent sputtering and
allow a deposit to build up. A second view of the lens (Figure 7) shows the
25-pm thick, .5-cm diam. stainless steel backing onto which the237
U was de-
posited and its support ring being inserted prior to the separator run.
Three charges totalling ~ 34 mg236
U and ‘N 50 Ci of 237U were processed
through the separator in a period of 40 h, to provide the final target for the
Pommard event. The deposit consisted of 18.1 pg of 237U, covered an area of
% 1 cm2, and lay totally within the area through which the collimated neutron
beam passed.
40
b) The target used to study the 210Pb(p,d) 20gPb reaction at 20.6 MeV3)
with
the LASL Tandem Van de Graaff and particle spectrograph was produced as follows.
The charge material for the ion source was a metallic lead sample enriched
in 22.3-y 210Pb. It was prepared from a nitric acid solution of 210Pb(Ra-D)
whose decay products were in approximate equilibrium.
Shortly before the separator run, a chemical separation was performed on
the starting material. Its purpose was to reduce the level of activity intro-
duced into the ion source by removing the daughter products 210Bi and 210Po.
The purified solution had 0.5 mg of normal lead added to insure an ade-
quate charge size for the ion source. The combined lead was reduced to the
metal, compacted to a pellet, dried, and weighed. The pellet weighed 1.1 mg
and contained m 10 mCi of 210Pb. It was placed in the ion source and heated to
a temperature sufficient to produce approximately 5 VA of lead ions which was
then accelerated to 50 keV.
In order to produce a usefully thick 2’OPb deposit on the 50 pg/cm2
carbon foil, it was necessary to retard the beam entering the lens to a net
voltage of approximately zero.
The resulting210
Pb deposit covered a nearly square area w 3 mm on a
side. It weighed% 22 pg (as determined by y-ray counting), and constituted
% 25% of the amount in the charge. A target thickness of%
achieved.
c) The target used to study the (t,p) and (t,a) reactions
dem was prepared in this manner.
240 ~g/cm2 was
on 5°Ti4) at the Tan-
A standard CC14 flask was filled with% 5 cc of the highly
volatile liquid TiC14. Flow of the TiC14 vapor into the ion source was con-
trolled by our normal CC14 needle valve. The Ti ion current was brought to
N 20 VA or N 1 VA of the 5.3% abundant 50Ti. Ions entering the lens were
slowed to 300 eV.
Attempts to build up a thick deposit on a 50-pg/cm2 carbon foil were
frustrated by persistent foil breakage. Finally, a rather thin (% 10ug/cm2)
deposit thickness was obtained and the target was brought to the Van de
Graaff facility for scattering experiments.
d) Attempts to produce a10Be target in the 50-100 pg/cm2 thickness
range have been carried out.
During the past few years we have made many attempts to produce a Be
target in the 50-100 vg/cm2 thickness range on thin C foil backings for in-
beam nuclear reaction spectroscopy at the Tandem Van de Graaff. The most
vel~able charge material has been found to be BeO from a BeC12 solution41

which has been pipetted onto a quartz wool pad, dried, and heated
N 800°C in air.
The usual internal chlorination process easily produces 5-20
ions which, after entering the retardation lens are slowed to 600
to
PA of Be+
eV. When the
buildup approaches fractions of a microgram, a stretching of the carbon foil
which usually results in breakage is observed. This phenomenon is quite severe,
and has been noted in the literature. Various techniques, such as heating the
foil during deposition or laminating the foils (as suggested by Jerry Lerner
during last year’s meeting), have produced no significant improvement, as the
deposit on carbon is apparently limited to% 2 ~g or a maximum thickness of
N 16 ~g/cm2.
Preliminary tests on thicker (400 pg/cm2) Pt foils indicate that even this
comparatively high Z (78) material is subject to severe stressing. Three
attempts to deposit Be have produced only a single target. Although a vism”
inspection of the target showed promise, when it was later irradiated at the
Van de Graaff, the Be deposit proved to be a disappointingly thin 10 vg/cm2.
In conclusion, I’d like to point out that while the production of certain
targets approaches the routine, others can present great difficulties because
of the little known, but often encountered, deposit-substrate interactions.
42

References
1.
2.
3.
4.
5.
G. Sidenius and O. Skilbreid, Proc. 1960 Int. Symp. On Separation
of Radioactive Isotopes p. 243 Springer - Verlag, Mien 1961.
J. H. McNally, J. W. Barnes, B. J. Dropesky, P. A. Seeger, and
K. Wolfsberg, “Neutron-Induced Fission Cross Section of 237U”, Phys.
Rev. C~, 717 (1974).
G. Igo, E. R. Flynn, B. J. Dropesky, and P. D. Barnes, “210Pb(p,d)
20gPb Reaction at 20.6 MeV”, Phys. Rev. C3_, 349 (1971).
D. C. Williams, J. D. Knight, and W. T. Leland, “The (t,p) and (t,a)
Reactions on 48Ca and 50Ti,” Phys. Letters, 22, 162 (1966).—
D. L. Auton, “Direct Readings on 10Be,” Nucl. Phys. A157, 305-322,
(1970).
43

FIGURE CAPTIONS
Figure 1. The LASL Isotope Separator #1.
Figure 2. Titanium sublimator and LN2 cold surface.
Figure 3. LASL plug-in ion source.
Figure 4. The retardation lens in place.
Figure 5. Loading the charge.
Figure 6.237U
Entrance slit configured for .
Figure 7. Target foil being inserted.
44

Fig. 1
Fig. 2
45

Fig. 3
Fig. 4
46

Fig. 5
Fig. 6 Fig. 7
47

USE OF AN ISOTOPE SEPARATOR AT THE INEL*
R. A. AnderlEG&G Idaho, Inc., Idaho National Engineering Laboratory
INTRODUCTION
Two major programs in our Nuclear Physics Branch are concerned withthe measurement of the decay properties of fission product isotopes andwith the measurement of integral capture cross sections for isotopes ofinterest to advanced fast reactor systems. Central to efforts in both ofthese programs is a “laboratory-type” electromagnetic isotope separatorlocated at the Test Reactor Area, INEL.
Under development at the present time is the capability for performing“on-line” mass separation of fission products transported by a gas-jettechnique from a 252Cf spontaneous fission source to the ion source ofthe isotope separator. Using this capability in conjunction with a tapetransport collector system, decay properties of short-lived fission productswill be studied.
Of more interest to this conference is the use of the isotopeseparator for preparation of highly-enriched rare-earth samples for ourcross-section measurement program. Hence, this discussion will center onthis latter application and will include a sketch of the cross sectionexperiment with an emphasis on sample requirements, a brief descriptionof our isotope separator and a more detailed description of the collectionapparatus used in the preparation of the majority of the samples for theexperiment.
Briefly, the cross section experiment involves an EBR-11 irradiationof selected isotopes of Nd, Sm, and Eu to a fluence of approximately5 X 1021 n/cm2, a post-irradiation measurement of the products of neutronabsorption in each sample, and a determination of the integral capturecross section for each isotope. EBR-11 is a liquid-sodium-cooled fastreactor which is used principally for irradiation experiments pertainingto the development of advanced fast reactor systems. The cross sectionsmeasured in this experiment will contribute to the evaluation of thefission-product-poison effect in fast reactors, the evaluation of thelong-term capture worth of EU203 as a fast reactor control material,and the development of a reliable burnup monitor for advanced fast reactorfuels.
Because standard activation and gamma spectrometric techniques arenot applicable for most of the isotopes of interest in this experiment,mass spectrometric techniques will be used to determine the products ofneutron absorption for each sample. In this perspective and noting that
*Work performed under the auspices of the U. S. Energy Research andDevelopment Administration.
48

most of the materials are expected to have integral capture cross sectionsranging from 100 mb to 3 barns, post irradiation (A-I-1)/Aratios areexpected to be 100 ppm to 10,000 ppm. It is evident that for many of thesamples high chemical purity and high isotopic enrichments are required.
Off-the-shelf enriched isotopes from ORNL, with primary isotopesenriched from 90% to 99%, are by-and-large unsatisfactory withoutadditional enrichment. The required high enrichments (99.999% A, 10 ppmA+l) can be obtained by additional isotope separation of the ORNLenriched stock. At the present tinw this additional enrichment is beingdone using the INEL isotope separator equipped with a retardation lens.The following paragraphs describe the apparatus used for this samplepreparation.
EXPERIMENTAL
Isotope Separator
Nut”
ionion
Our electromagnetic isotope separator was designed and built byetec S. A., Geneva, Switzerland, and was frst operational in 1972.
Ion sources used wit the separator are the oscillating electron?source (Nielsen-type) 1) and the high-temperature-surface-ionization
source (Johnson-type).(2) The Nielsen source is used for gaseouselements, for elements-which are easily vaporized and for elem;nts of highionization potential which cannot be run with the Johnson source. TheJohnson source is used routinely for high efficiency (-40%) production ofalkali metal and lanthanide ions and can be used for actinides.
The ion beam is formed with an electrostatic lens assembly consistingof an extraction electrode, three cylindrical electrodes for cylindricalfocus, and quadruple singlet for beam compression. With the ion sourceoperated at a positive 50 kV to 60 kV, the extraction voltage is 10 kV to15 kV, the focus voltage is 10 kV to 25kV, and the quadruple voltage is100 v to 200 v. Typical extracted ion currents are 10 l.IAto 100 pA.
Mass dispersion is obtained with a water-cooled, 90° sector electro-magnet which has a mean radius of 150 cm, a magnet pole gap of 50 mm,and fringing field terminators at entrance and exit boundaries. Poweredby a transistorized O to 150 A power supply (current stability betterthan 1 part in 104), the magnet has a field strength ranging from O to5000 Gauss. Therefore, it is possible to collect mass-separated speciesover a mass range of O to 265 amu. The mass range for simultaneouscollection is given by
Ynax - ‘ilmin= 0“15 “lmin
and the mass dispersion is approximately 9 mm for mass 150 and 50 keV ions.
49

50
The beam shape is variable from a 3 mm circular spot to a 2 mm X (1 cmto 3 cm high) line spot. Enhancement factors with respect to adjacentmasses of 1000 to 10,000 at mass 150 can be attained.
For direct viewing of the ion beam shape a transmission fluorescentscreen coated with K Br is used. An electronically driven vibratingprobe with current signal displayed as an oscilloscope trace at the consoleis used for indirect viewing of the beam.
Collector assemblies of interest to this conference are discussedin detail in the next section.
A vacuum of less than 5 X 10⁻⁷ torris maintained throughout theseparator vacuum chamber with three Edwards oil diffusion pumps which havedual water-cooled chevron baffles on each pump inlet. Two 6 inch diffusionpumps provide differential pumping at the ion source-electrostatic lensassembly and a single 9 inch diffusion pump is used at the collector.To further improve the vacuum quality at the collector end, a liquidnitrogen cold trap is located in the dispersion chamber between the magnetand the collection chamber.
Collection Apparatus
The collection apparatus used for the sample preparation is shown inFigures 1 and 2 which are photos of the collection chamber interior asseen through the top opening and the rear opening, respectively. Thesetup includes a vibrating probe beam scanner, a rotatable-collection-frame assembly, and a retardation lens.
Mounted on a movable carriage, the vibrating probe unit can belocated at any position along a line perpendicular to the ion beamdirection. Movement of the carriage is accomplished by a remotecontrol outside the vacuum chamber. The probe vertical pin swingsthrough an arc which is approximately 1.75 inches from the ion beam focalplane.
The rotatable-collection-frame system consists of 16 inch by 2.4 inchcollection frames which are attached to two “wheels,” each “wheel” supportedin a vertical upright by a stainless shaft and Delrin bearing assembly.As shown in Figure 2, the right-hand shaft is coupled to a vacuum-rotary-motion feedthrough which permits remote control of the rotation of acollection frame into the focal plane of the ion beam. The rotatable systemprovides for interchangeable mounting of up to three collection frames,each of which can incorporate one or more of the following:
(1) a foil for direct collection of small quantities ofmass-separated isotopes at full energy,
(2) a foil that can be used as a beam stop for all butone or more selected isotopic beams which pass onthrough apertures to other collection devices,

Figure 1. View of the rotatable collection-frame assembly and theretardation lens through the top opening of the collectionchamber.
51

Figure 2. View of the rotatable collection-frame assembly and theretardation lens through the rear opening of the collection
K9 chamber.

(3) a transmission fluorescent screen for direct viewingof the ion beam shape,
(4) a Faraday cup for measuring ion beam currents.
For the setup used here with the retardation lens, two collection framesare mounted on the system “wheels.” One frame supports a foil used as abeam stop for all ion beams but the one entering the retardation lens.The second contains a transmission fluorescent screen for viewing thebeam shape and a Faraday cup for measuring the isotopic ion currententering the retardation lens.
The design of the retardation lens, as illustrated bff
he schematicin Figure 3, is based on the study by Dionisio and DeLima 3 andcorresponds to their system D5. This particular design was selectedbecause it is used easily with line-focused beams and can provide eithersharply-defined narrow deposits when the focus electrodes are used orbroader deposits when the focus electrodes are removed. As shown inFigures 1 and 2, the focus lens elements were removed for the presentapplication.
The beam defining electrode, with a .187 inch by 2.0 inch slotaperture, the electron suppression electrodes, with .40 inch by 2.0 inchslot apertures, and the retardation electrode are each 4 inch by 4 inchsquare. The focus electrodes are 4 inches high and are separated by a2 inch gap. hliththe exception of the beam defining electrode which isconstructed from stainless steel, all other lens elements are fabricatedfrom Type 6061 aluminum alloy. To minimize arcing all corners arerounded and the surfaces of the elements are polished. A foil holderwhich slips into the T-slot in the retardation electrode is used tocollect the isotonically enriched deposit.
The assembled lens is installed as two parts on the platform shownin the photographs. Mounted in one set of Plexiglass supports whichprovide for electrode alignment and spacing and attachment to the platformare the first three electrodes. Providing alignment and spacing of thefocus and retardation electrodes is another set of Plexiglass supportswhich are mounted to nylon screws which serve as electrical standoffinsulators with respect to the grounded platform. Two pins mounted onelectrical insulators attached to the beam defining electrode are usedto provide, via a difference amplifier, a correction signal to theacceleration supply for beam position stabilization.
As shown by the photographs in Figures 2 and 4, the retardationvoltage is transmitted to the retardation lens through a speciallydesigned high-voltage feedthrough located on the top cover-plate of thecollection chamber. Fabricated from Plexiglass, the high voltage feed-through insulator is 7 inches long with approximately 4.25 inches extendingabove the 7.6 inch X 15.7 inch X 2 inch thick Plexiglass cover plateand .75 inch extending below the cover plate. The insulator bodyprotruding above the cover plate is 1.75 inches in diameter. This systemhas been successfully tested at 62 kV.
53

Grounded Shield
/
(both sides)
Electron Suppression Electrodes
\
\
Focus Electrode
Retardation Electrode \
o 1 2I 4
InchesEGG-A-608
Figure 3. Schematic Illustration of Retardation Lens.

It should be noted that although Plexiglass (an acrylic plastic)is not the most desirable material to use in a vacuum environmentbecause of its vapor pressure and outgassing properties, the mass-separator vacuum system is able to maintain the vacuum in the collectionchamber at less than 3 X 10⁻⁷ torr. Lexan (a polycarbonate plastic)is a superior material to use in the vacuum environment but is considerablymore expensive.
Grounded metal plates are used to shield as much of the collectionchamber from the high voltage feedthrough, the high voltage lead to theretardation electrode, and the lens itself. These plates are situatedas close as possible to the respective high voltage components.
Illustrated in Figure 5 is a schematic of the electrical layout ofthe power supplies used with the mass separator when operated in theretardation mode. Typical operating voltages are: (1) 50 kV, accelerationsupply; (2) 12 kV, extraction supply; (3) 20 kV, focus supply; (4) 200 V,quadruple supply; (5) 200 V, beam stop supply; (6)suppression supply; (7) 300 V, retardation supply.
Sample Preparation
200 V, electron
Isotonically enriched samples prepared with the separator retardationsystem include the following: ND-143, -144, -145, -146, -148, -150; Sm-147,-149; Eu-151, -152, -153, -154. For the Nd, Sm and stable Eu isotopes,rare earth oxide material previously enriched to 90% to 99% at ORNL wasused as charge material in the Johnson ion source. The mass-separatedprimary isotopic beam was deposited on 1 mil nickel foil or 0.5 milvanadium foil mounted in a foil holder which slipped into the T-slot ofthe retardation lens. Approximately 50 Pg to 75 pg deposits which measuredfrom 2 mm to 3 mmwide by 30 mm to 35 mm high were collected. Typicalisotopic ion currents ranged from 6 PA to 10 uA and the collection timeper run was 90 minutes.
Isotope dilution mass spectrometry was used to measure the samplemass and sample enrichment for representative samarium samples. Theseanalyses indicated that there was negligible loss of material in thecollection of the decelerated ion beam and enhancement factors with respectto adjacent masses of better than 4000 were achieved.
SUMMARY
An electromagnetic isotope separator with a retardation lens as acollector was used to prepare highly enriched samples of Nd-143, -144, -145,-146, -148, -150; Sm-147, -149; Eu-151, -152, -153, -154. The 50 ug to75 pg samples, deposited on 1 mil nickel foil or 0.5 mil vanadium foil, arepart of a sample set to be irradiated in EBR-11 as part of an integral-capture cross-section measurement program at the INEL. This discussionpresented a description of the isotope separator and the apparatus usedfor the sample preparation.
56

F gure 4. Photograph of the high-voltage teedthrough as-installed onthe top of the collection chamber.
55

1r--’%
oa
I=k- 0U
3
,,,,,
NC
-.3-m
mt.
Ii
57

REFERENCES
1. K. O. Nielsen, Nuclear Instruments and Methods ~(1957) 289.
2. P. O. Johnson et al, Nuclear Instruments and Methods 106 (1973)—.83.
3. J. S. Dionisio and D. X. DeLima, Nuclear Instruments and Methods 61(1968) 260.
—
58

VAPOR DEPoSITION OF LARGE AMA Npo~ AND U02 DEPOSITS*
H. L. Adair, J. R. Gibson, E. H. Kobisk, and J. M. Dailey
Union Carbide Corporation, Nuclear DivisionOak Ridge National Laboratory, Solid State Division
P. O. Box X, Oak Ridge, Tennessee 37830
ABSTRACT
Deposition of Np02 and U02 thin films
diameter has become a routine operation in
over an area of 7.5- to 10-cm
preparation of fission chamber
plates. Vacuum evaporation or electroplating has been used for this
purpose. The “paint brush” technique has been used as well; however,
uniformity requirements normally eliminate this procedure. Vapor
deposition in vacuum appears to be the most suitable technique for
preparing NP02 and U02 deposits of >200 cm2. This paper describes the
procedures used in preparing uniform large area deposits of Np02
( 226 cm2) and U02 (%2000 cm2) by vacuum evaporation using electron
bombardment heating and several substrate motion and heating methods
to achieve uniformity and adhesion.
INTRODUCTION
Small and large area deposits of actinide materials
of substrates are important to experimentalists who need
for precision cross-section measurements, for sources of
fission fragments, and for standard calibration sources.
on a variety
such materials
neutrons or
Normal require-
ments for actinide deposits are that they should be adherent, uniform,
and well defined in terms of areal density and contained impurities.
*Research sponsored by the Energy Research and Development Administration
under contract with Union Carbide corporation.59
Two techniques used most often for preparing actinide deposits are
1 The electroplating procedureelectroplating and vacuum evaporation.
is limited in areal density (normally <2 mg/cm2) and in the area possible
to coat. The previous two limitations are overcome when physical vapor
deposition is used; however, the deposition efficiency for this process
is usually <1 percent (depending upon uniformity requirements).
The preparation of 235U02 deposits of <8 cm in diameter by the
physical vapor deposition process has been described.2 At that time,
this area of 235U02 deposit was considered to be large compared with
previously fabricated specimens. Within the past year, however, the
Isotope Research Materials Laboratory (IRML) at the Oak Ridge National
Laboratory (ORNL) has prepared considerably
(2000 cm2) and 237Np02 (226 cm2) to be used
fragments under neutron bombardment and for
measurements, respectively. Techniques and
actinide deposits will be described in this
LARGE AREA DEPOSITS
larger area targets of 235U02
as sources of fission
use in precision cross-section
systems used in preparing
paper.
OF U02
There exists a large demand for well-defined, small pore size,
membrane filters for use in blood research, cellular separation, tissue
culture, and in other similar areas of research.3 The membrane filters
must have precise pore size distribution and possess chemical and
thermal stability under a wide range of applications. One such procedure
used to prepare such filters is to pass a plastic material over a 235U02
60

target while the target is being bombarded by neutrons. Resultant 235u
fission causes fission fragments to penetrate the filter material
leaving sensitized tracks which can then be preferentially etched into
uniform, cylindrical pores. The pore size is controlled by the length
of the etching process. 4
To be economically attractive, exposure of large areas of filter
material is desired, within restraints of target fabrication technology
and neutron irradiation capability. It was determined that the desired
235U02 deposits needed for this purpose would be approximately 51 cm
wide and 76 cm long and contain 800 to 1000 pg/cm2 of 235U. As one can
see, this represents a considerable extrapolation in area from the
8-cm diameter deposits previously prepared in our laboratory.
The procedure used to generate large area uranium targets was simply
a modification of the one described in Reference 1. Since the targets
were required to be uniform within +3 percent of the mean areal density,
it was determined that the best approach would be to use two electron
bombardment evaporation sources and a substrate mounted on a rotating
drum assembly. Both electron bombardment sources were similar to the
one shown in Fig. 1. As is shown, the electron beam is accelerated
through an angle of 270° and impinges on a pressed U02 pellet. The
electron beam can be programmed to sweep the pellet surface in a
predetermined pattern to achieve maximum uniformity of evaporation.
To determine the system configuration for locating two electron
beam guns under a rotating drum to give the desired uniformity of+3
61

percent, the
t =
where
t =
m=
hv =
P_—
D=
x=
following equation was used.s
Imhvz
-[
1+
17rp
I
(1)
[h2+ (D+ X)2]2 [hV2+ (X- D)2]2v
film thickness,
total mass of material evaporated,
source to substrate distance,
density of material,
distance from center line to center of electron beam crucible,
distance from center line to a point on the substrate where
the film thickness is determined.
In addition, information provided by the Airco-Temescal Corporation
concerning the uniformity of deposits from dual electron bombardment
6 Equation 1 was derived from Holland’s equationsources was used.
rp(h 2 + rS.2)2v J
where
dj = the perpendicular distance from the center line of
the evaporating beam and the point on the substrate
where the deposition thickness is determined,
(2)
and the other terms are as defined for Equation 1. Thus , the following
equation can be derived from Equation 1:
62
Inhvz~=— ( 1 1
Tp+ (hv2 +622)2
1
●
(h 2 +612)2v
(3)
Since61=D+Xand62= D- X, Equation 1 can be obtained by substituting
these terms in Equation 3.
The 51-cm x 76-cm targets were prepared using 25.5-cm x 76-cm
substrate segments mounted on the rotating drum. A schematic representation
of the preparative setup assumed in making the uniformity calculations is
shown in Fig. 2. The terms shown in Fig. 2 are defined as for Equation 1
with
t = deposited film thickness at the center of the substrate,o
te = deposited film thickness at the edge of the substrate.
The desired uniformity range is illustrated by the dashed lines in Fig. 3.
Curve 1 in Fig. 3 was computed from Equation 1, whereas curve 2 was
from information provided by Airco-Temescal Corporation. 7 Thus, as
shown in Fig. 3, a distance from the center line to the source of
approximately 20 cm together with hv = 45.7 cm should theoretically
the desired uniformity.
obtained
is
yield
A schematic representation of the experimental equipment assembly
235U02 evaporation is shown in Fig. 4.used for the Pellets containing
approximately 20 g of U02 were pressed and placed in each of the
electron bombardment evaporation sources. The chamber was evacuated
to the low 10-5 or high 10-6 torr range by using a 0.4 m3/min. roughing
pump in tandem with a 15-cm diameter oil diffusion pump. The substrate
63

was heated to 200-250”C and the evaporation was begun; substrate heating
was necessary to insure an adherent bond between the titanium substrate
and the U02 layer. Uniformity as well as average thickness of the U02
deposit was determined by weighing test plates placed on each side of
the substrate as shown in Fig. 5. A resonating quartz crystal thickness
monitor, shown in Fig. 6, was calibrated and used to determine in situ.—
when the approximate desired film thickness was obtained. Also in Fig. 6
235U02 pellets, quartz-can be seen the electron bombardment heat sources,
iodide heating lamps, and the mounted titanium substrate. Since, as was
shown in Fig. 4, two separate power supplies were used (one for each
electron bombardment gun) it was anticipated that perhaps it would be
difficult to maintain exactly the same evaporation rate from each source
and consequently the uniformity requirements of +3 percent would be difficult
to achieve. The desired mean thickness range was 0.8 to 1 mg/cm2. It
was decided to evaporate until approximately 0.8 mg/cm2 of U02 deposit
had been attained, and then determine the real thickness using the tared
test plates as well as to verify the uniformity of deposit across the
titanium substrate. If the desired uniformity was not obtained, the
evaporation source on the side containing the lowest areal density could
then be adjusted and more material evaporated to bring the total areal
density across the substrate to within the desired uniformity range.
After two such titanium substrates were coated, they were glued to
a thick aluminum substrate in a specified pattern. One such pattern is
64

illustrated in Fig. 7. As shown, one plate was attached in the central
region and the other plate was sheared and glued to each side of the
central diagonal plate. During neutron irradiation, as the membrane
moved over the source surface, it was highly desirable not to have a
straight line discontinuity in the membrane pore distribution resulting
from few or no fission fragment tracks. This is the purpose for angling
the deposits as shown in Fig. 7.
Uniformity of deposition obtained for two U02 evaporations is shown
in Fig. 8. These uniformities were obtained very simply by counting
the alpha disintegrations over a 2.54-cm diameter area at various locations
on each substrate. As iS shown, the desired uniformity (for the most part)
was obtained for the 0.8 mg/cm2 coating with slightly larger variations
for the 1.0 mg/cm2 coating. Both coatings were deemed acceptable.
LARGE AREA DEPOSITS OF Np02
One of the chief concerns of today is our national energy problem.
The United States is trying to become energy self-sufficient by relying
heavily on research in geothermal, coal gasification, solar and nuclear
processes. Many believe the energy problem can best be alleviated or
reduced through an enhanced reliance on nuclear power. Thus, more and
more research is being conducted to better characterize existing and
proposed future reactor materials. The goals of this research are to
make power reactors efficient and safe for use on a large scale to meet
the energy needs of the future.
65

One phase of the reactor research effort involves determining
accurate cross-section data for the various reactor fuel materials. It
is important to know, for example, the ratio of the neutron capture
cross section to that for fission for certain reactor fuel materials. A
high ratio would mean that more neutrons are being captured and fewer
fission events taking place. These values are needed to accurately
calculate fuel utilization efficiencies.
The IRML has been involved in preparing many samples such as 235U02 ,
239Pu02, and 238U02 for use in neutron cross-section measurements. In
the past ~8-cm diameter deposits have been used for this purpose. The
procedures used to prepare such targets have been described in the
literature and now have been adapted for use in preparing large-area
237Np02 deposits were used to assemble a237Np02 targets. The large
fission chamber for measurements of the 237Np neutron fission cross
section. This data will be used as a nuclear cross section standard and
will lead to more accurate cross sections for other materials employed in
nuclear reactors.
A total of five 237Np02 targets having a coated area of 226 cm2
(17.8 cm x 12.7 cm) were prepared by the vacuum evaporation-condensation
of 237Np02 using an electron beam heat source previously described in
Fig. 1. Schematically, the deposition assembly used for preparing these
targets is shown in Fig. 9. As is shown, the large substrate was located
30.5 cm from the source and was rotated to achieve good deposition
uniformity.
66

The system used is shown in Fig. 10. A vacuum of <2 x 10⁻⁵ torr
was obtained by using a 0.4 m3/cm roughing pump and a 15-cm diameter oil
diffusion pump. The Np02, in powder form, was pressed into a pellet
and placed in the electron beam gun crucible. After the system was
evacuated to <2 x 10⁻⁵ torr, the rotating aluminum substrate was heated
to approximately 200”C and the evaporation initiated. Actual Np02
thickness and uniformity was determined by weighing tared satellite
targets after deposition was complete. An areal density of approximately
100 pg/cm2 was obtained on both sides of the five 0.025-mm thick aluminum
substrates. Deposit uniformity was <8 percent and the vapor collection
efficiency was approximately 4 percent.
suMMARY
Very large area deposits of actinide oxides cai.be prepared by
physical vapor deposition. Normally, the only limitation in achieving
the required uniformity of such deposits are the expense of the material
and its availability. In most instances, uniformities of <S percent can
be achieved by employing single or multiple evaporation sources and
adjusting the source-to-substrate distance.
67

REFERENCES
1. H. L. Adair, Nuclear Inst. and Methods 113, pp. 545-548, (1973).
2. Ibid. 1, p. 545.
3. Nuclepore Corporation, Nuclepore Membranes and Hardware for the
Laboratory, Catalog LAB 20, p. 2.
4. Ibid. 3.
5. L. Holland, Vacuum Deposition of Thin Films, John Wilex and Sons,
New York, p. 145, 1958.
6. Airco Temescal, Physical Vapor Deposition, pp. 80-83, 1976.
7. Ibid. 6.
68

Fig. 1.
Fig. 2.
Fig. 3.
Fig. 4.
Fig. 5.
Fig. 6.
Fig. 7.
Fig. 8.
Fig. 9.
Fig. 10.
FIGURE CAPTIONS
Electron beam evaporation source.
Schematic showing terms used in calculating the film thickness
profile from two electron bean sources.
Curves showing the uniformity variation for different distances
from the two electron beam sources.
235uQevaporationS .Schematic of the system used for the
Close-up view of the rotary substrate mechanism, quartz iodide
heater lamps, quartz crystal monitor, and test plates used in
film-thickness determination.
Interior view of the 23%JQ evaporation system.
Schematic showing arrangement of 235u~ deposits on final
substrate.
Uniformity of the 235U02 deposits for 0.8 mg/cm2 and 1.0 mg/cm2
thicknesses.
Schematic of 237Np02 system.
Glove box system used for 237Np02 evaporations.
69

ELECTRON BEAM
SHIELO
WATERCOIL-
—FILAMENT
ANOOE PLATE \ MOUNTING BLOCK
270° IOKW EVAPORATION SOURCE
Fig. 1
t.04
I .02
!.00
~.>
0.98
0.96
I
/’I1/
.-- ———- -- ————____________ .- —--
@
--- ———---
t—
I I I I I I I
15 16 !7 18 19 20 21 22 23D [cm)
Fig. 3
“’’’-’’’”--’’’””RAOIANTHEATERS-
i
+!.’,
,’ ,“ . .‘-. .
L/);’/
-0----”’
t‘. ,
,..’
/’ ,.,./“ / . ..
,.. .,\ 1/ ,..,\l 1/,’
%5=
1.
?‘. I
... \ $.\\\ -
J.::=\\ \-h‘, :
1:,’,1
Ii;,il~~.\
.. \\]/:....,i, \ I /,/’.,..
./’ - 1
&
WI
:I
745.7 cm
8 kVAPOWER SUPPLY
w/x-YSWEEP
Fig. 4

71

51.6cm
~“’m-—————i
(a
0.8 mq/cm2 COATING
f.0 mq/cm2 COATING
25.8cm
f9.5cm
-LFig .
f7.8 cm X f2.7 cm COATEDAREA ON 20.3 cm X !5.2 cmROTATED SU SSTRATE
“. ‘. ‘. :‘. .. ., :
,.’
t’
VACUUMSYSTEM
6 kVAEB POWER SUPPLY
Fig. 8
72
Fig. 9

\
‘i
—-.—-,; --1.>!:1/ljg ,
m.-:,..
AJ9--. —— “i
.M
-A-J.4
..
a ..m.
.*‘“”--
73
Fig. 10

Alternatives to Thin Film Carbon Foils for Use
in Stripping Heavy Ion Beams
D. RamSay
Department of Physics, Stanford University, Stanford, California 94305*
In reviewing
questions arise.
papers published concerning stripper foil behavior, several
Why is it that so much work has been done on prolonging
the life of carbon films and so little work done on looking for a substitute?
What good does it do to bake, rotate and oscillate foils when there is no
clear cut explanation of why they break in the first place? Well, as a
target maker I have a sneaking suspicion that I am partly responsible for
the bulk of the research being confined to carbon foils. Like people climb
mountains, because they are there, physicists use carbon foils because we
can mke them.
In an attempt to atone for this negligence, I gathered up a cluster
of surplus targets and ran them in the Van de Graaff accelerator at Stanford.
Using an O+6
beam I destroyed thin films of B, Al, V, C and Si02. This
paper would end right here except that two of the targets did not break.
The first was a 2 pgm/cm2 carbon foil backed with 10 pgm/cm2 gold. (Figure
la) . This was exposed to the beam about the same length of time as a
2 ~gm/cm2 carbon target without any gold backing, which tore at the beam
spot . Here you can see the familiar dark area in the center which could
be due to carbon build-up by the cracking of hydrocarbons.1
In an attempt
to find out if this carbon layer varied depending on the target material,
we ran a HfO film which was glass transparent under similar conditions.
74

The HfO target did not break and when examined two features were readily
apparent. First it did not have as discernible a dark spot and the film
now was wrinkled. (Figure lb). The creases radiate out from the edge
of the beam spot which remained perfectly flat and they stretch to the
of the film which is 1.25 cm in diameter. There is evidence that the
thickening of the beam spot foil area is not due to carbon build-up.2
edge
Could the obvious strain present in the HfO foil be due simply to
this thickening effect? We next evaporated an Al foil which had a center
circular area (6 mm diameter) , twice as thick as the rest of the film (2 cm
diameter) . (Figure lc). This foil is 50 pgm/cm2 and 25 pgm/cm2 respectively.
Thinner films, 10 and 20 pgm/cmz were tried but the center sections tore
while drying. In the Al foil the thickened area is perfectly round, but
if you look closely you can see that the tension between the wrinkles has
distorted the edges of the circle into almost straight lines. Now Our
beam spot at Stanford is oval so the stresses are
we examined the broken carbon-only foil (Fig. ld)
flaps we could see that tear was across the thick
not as uniform. When
and matched up the torn
area. It has always
bothered me
visualize a
to rip at a
that a film should ever break at its thickest part but if we
mechanical dimensional distortion under radial stress, starting
point on the edge of the beam spot, we can see how it could tear
across the center in one or possibly two directions and then stop abruptly,
because the strain is relieved. This kind of tearing was the case in most
of our foils and is typical of carbon greater than 1 cm in diameter.
Thomton3 reports that some foils after breaking flap in the beam and
continue to strip electrons intermittently. It certainly seems possible
that the rupture of a stripper foil could be due to purely mechanical strains
75

built up by a uniform flat foil becoming
in the beam spot and thinner all around.
non-uniform, specifically thicker
The next question was, what
mechanism could be responsible for thickening the film?
Early in the development of the semi-conductor industry there was a
great deal of trouble caused by thin film devices failing due to what came
to be called a mass transport effect. 4 (Figure 2). This is an aluminum
film 1500 fl thick which has been carrying a direct current density of
106 A/cm2. Both grain boundary and surface transport have left voids in
the film. (Figure 3). Here we have a gold film, 6000 &
after passage of 2“106 A/cm2 at 350”C for 2 hours. You
at the cathode on the right and hillocks at the anode on
thick before and
can see the voids
the left. In
electromigration, aluminum and gold atoms move in the direction of the
electron flow, i.e. toward the anode. For alternating current no mass
transport has been observed. We know that when an ion beam passes through
a foil it scatters off electrons (Figure 4a) . In a carbon foil then,
we have in essence a direct current flow from the outer rim of the foil
toward the beam spot.5
There is also a temperature gradient both of these
conditions favor electrotransport 6 (Fig. 4b). Here we show schematically
what could result if this phenomena is actually taking place. The perimeter
of the beam spot would be depleted of material as it is transported toward
the center; the beam spot area thickens; energy transmission decreases;
the film tightens; radial stress lines appear from the strain of non-uniformity;
and the foil tears. ml these observed facts fall nicely into place, but
is it theoretically possible?
Significant mass transport of Al and Au thin films occurs at current
densities of 1 to 2“106 A/cm2 in films 1500 to 6000 ~ thick. Most carbon
76
stripper foils are on
calculate the area we
and t the thickness
the order of 100 to 300 fi thick. (Figure 4c). To
use ‘Trdt where d is the diameter of the beam spot
of the film. For a 4 mm d spot the area is about
2.5”10-6 2
cm . In order to get beam densities of 106 A/cm2 in the stripper
foil we would require a current of around 1 ~p. The actual current through
the stripper foi17 is approximately the same as the beam current incident
on the foil estimated at 10 to 100 I.JA. This gives rise to a current density
of 10 to 100 A/cm2. This is too low by a factor of 10,000.
In reviewing the literature available on electromigration we were
unable to find enough information to calculate the current densities needed
for a thin carbon film to exhibit mass transport. Most of the work has
-5 ~2 8been done with metals and surface areas were on the order of 10 .
Although there is a correlation between self-diffusion coefficients and
electrotransport, the other factors entering into the equation are unknown
for carbon. 9We decided to duplicate some of the earlier experiments and
substitute carbon for aluminum.
Carbon films 1 to 10 mm wide and 1 to 2.5 10-6
cm thick were deposited
on glass slides. The ends were coated with aluminum for electrical contact
and the length of the carbon strips varied from 1 mm to 5 mm. All of
the samples failed. (Figure 5a). Resistance varied between 5 and 22 Meg ohms.
The lifetimes in a vacuum of 10-5
Torr were from
density of 2.7 A/cm2 to 60 minutes at 10 A\cm2.
tration of what happened but it shows quite well
8 hours at a current
This is not the best illus-
that the carbon film is
ruined. In
the film at
interesting
other cases it was more apparent that there was a depletion of
the cathode. When viewed through a microscope there were some
features. Before total failure often there were streaks running
77

the length of the carbon film between
was a slight but definite decrease in
anode and cathode. In one case there
resistance before failure. Possibly
some of the aluminum atoms diffused across. Structural changes did not
occur linearally with time. In every case destruction seemed to accelerate
noticeably the last few minutes.
There was at least one more piece of information that we felt was
needed. Since one of the original targets was a thin aluminum foil and
it was destroyed in the beam, could there be a failure in an aluminum film
at these low current densities? We evaporated a 4 pgm/cm2 aluminum strip,
6 mm wide and 7 mm long on a glass slide and covered the ends with a thick
coating of aluminum for electrical contacts. A 22 Meg ohm resistor was
put in the circuit and a direct current of 100 u7nnps was run through it
for 90 minutes. The resistance slowly increased (a total of 65%) then the
film failed. (Figure 5b). When examined the open channel at the cathode
end was wider than the open area at the anode end. The channel was devoid
of debris at the cathode side but there were islands of Al grains in the
anode channel. This is not conclusive evidence of electrotransport but
it is in keeping with the findings of other researchers except for the
lower current density by a factor of 1000 and the considerably larger
surface area, 0.42 cm2 compared to 3.5*1O-5 2
cm .
TO sum up then, we find that electromigration cannot be ruled out
as at least one of the possible mechanisms for causing carbon stripper foil
failure. If mass surface transport of carbon atoms in the direction of
the electron flow is the primary factor then we can use this information
to design a longer–lasting solid stripper. Beryllium for instance, has a
self-diffusion factor of only 0.5, while for carbon it is 5.0. Instead of
78

a material which flows with the electrons why not a mixture of say carbon
and platinum. It has been suggested that platinum migrates against the
electron flow. Certainly it would increase the life of present stripper
foils to start with as large a beam spot as possible and slowly focus it
smaller. Also the larger the diameter of the foil the greater the lifetime.
The smaller the area of the beam spot the shorter the lifetime. Heating it
evenly reduces the temperature gradient and probably makes the foil more
elastic. Making the supporting plastic thicker should help by furnishing
a stronger mechanical support. Dielectrics like boron nitride are a
possibility. At any rate the
single crystal carbon foil is
a target-makers best friend.
could serve as solid stripper
need for a solution is growing. Perhaps, a
the answer; in that case, diamonds will be
There are five low Z elements that theoretically
foils; Be, B, Mg, Al and Si. If we add to
that just low Z compounds like BeO, BN, and SiC we get over 20 possibilities,
not to mention mixtures
like Be/Al. Then there
thickness and diameter.
like Si with a dash of phosphorous or alloys
are variations like grain size and crystal structure,
Maybe one foil the size of a large pizza could
be rotated like a phonograph record and would last 3 years.
Are there any more suggestions?
79

References
* Supported in part by the National Science Foundation.
1 J. L. Yntema, Nucl. Instr. and Meth. 98 (1972) 379.—
2 P. Dobberstein, L. Henke, Nucl. Inst. and Meth. 119 (1974) 611.
3 S. T. Thornton, R. H. McKnight and R. C. Rittner, Nucl. Instr. and Meth.
101 (1972) 607.
4 Maissel and Glang, “Handbook of Thin Film Technology” (McGraw-Hill, 1970) .
5 J. L. Yntema, IEEE Trans. on Nucl. Sci., Vol. NS-23, No. 2 (April 1976).
6 M. Etzion, I. A. Blech and Y. Komen, J. Appl. Phys., to be published.
7 J. L. Yntema, Nucl. Instr. and 14eth. 113 (1973) 605.
8 I. A. Blech, Bell Labs., Murray Hill, N.J., private communication.
9 P. B. Ghate, Appl. Phys. Lett., Vol. 11, No. 1 (1 July 1967).—
80

a.
(’,
Fig. 1 81

Fig. 2
Fig. ?
82

a.
Bran
b.
CARSON STRIPPERFol.
QigP’JcURRENT~Ol,#, V,A~P>jn~t
d:di.m.tcr .f be(msr.t
t.th!’h.e,$ off,[m
c.
Fig. j-i
83

>-.,=..”. .. .
-. i
i!!!!=-.,...... . ., “ i
IEiT.~ .1
...—i
. ...-,>...i
a.
b.
Fig. 5
84
THE PREPARATION OF NITROGEN-15 TARGETS
by
J.D. S+inson
Division of Physics, National Research Council
Ottawa, Canada
A technique for the preparation of nitrogen-15 targets using
titanium as a reactant is described. !l’argets in the range of 5 vg/cm2
to 75P9/cm2have been routinely produced. Evaporation and nittiding
temperatures, chemical cleaning of substrates and vacuum system
requirements are given.
Introduction:
Over the past eight years a technique has been used for the
production of nitrogen-15 targets. Though the method of producing
(1)nitrogen targets is wel 1 known, the technique described has been
developed to provide better quality targets on a routine basis.
Special attention has been paid to vacuum system requirements,
deposition -
of purity.
Graaff acce
Canada.
emperature and nitriding procedure to obtain some degree
These targets have been used for ay studies at the Van de
erator installation at the National Research Council of
85

Vacuum System:
A commercial vacuum sys-
oil diffusion pump has been modif
water cooled chevron baffle and a
added to provide the trapping for
em with a 30 cm bell jar and a 10 cm
ed to reduce oil back-streaming. A
liquid nitrogen baffle have been
the work chamber. Oil back-streaming
is further reduced by the addition of a zeolite trap between the fore-
pump and diffusion pump. Roughing of the work chamber is accomplished
with a separate zeolite trapped pump. The vacuum obtained with this
system is better than 10-7 Torr after six hours of pumping and permits
the evaporation process to proceed at better than 10-6 Torr.
Evaporation Source Preparation:
A tungsten source with a I cm dimple and a 0.25 mm thickness
is used to evaporate the target titanium. A 20 cm distance from the
evaporation source to the target substrate has been selected. This
distance permits an accepi-able uniform
easy calculation of source charge. A
to completion will give a 1 pg/cm2 coa-
is used
is carr
Substra-
X 0.025
86
ty of target th
mg charge of t
ing of nitrided
A three strand tungsten helix source 4.5 cm long x 1 cm diamter
ckness and al lows
tanium evaporated
titanium.
to evaporate 0.25 g of titanium for getter pumping.
A pre-firing of both evaporation sources at 1500”C in vacuum
ed out to minimize target contamination.
e Preparation:
Metal Iurgical
cm is used as a
grade tantalum sheet in a strip 15.25 cm x 2.5 cm
target backing. After deposition each strip
supplies four targets, 2.5 cm x 2.5 cm in size, from the centre section.
To provide a clean surface for the titanium deposition the tantalum
strip
tanta
5:2:1
i mmed
jet.
(2)is chemically polished according to a recipe by Tegart. The
urn is immersed for 3 to 5 seconds in the fol lowing solution:
5 or 2 by volume of 982 H2S04, 70% HN03, 49% HF. The tantalum is
ately rinsed in de-mineralized water and then dried in a nitrogen
The substrate surface after this treatment appears shiny and may
have some orange peal effect under low magnification. The tantalum
substrate is weighed on a semi-microbalance for eventual target fhickness
determination.
Chamber Fixturing:
Three pairs of water cooled electrodes feed power for target
processing and are shown on the accompanying drawing. One pair of
electrodes is required for each of the fol lowing functions: the
evaporation of target titanium at A, outgassing of the substrate and
nitriding the deposited titanium at B, and the evaporation of titanium
for getter pumping at C. Titanium evaporated for gettering is shielded
from the target substrate as illustrated.
The power required to perform the steps in the process at A
and B is supplied by one power supply and is switched from one pair of
electrodes to the other during the procedure. A second supply provides
power for getter pumping at C. Both supplies are capable of providing
2 KVA of power.
A pyrex f
at D is attached i-o
leaking in the requ
ask containing 15N with a break seal and stopcock
the chamber. A bleed valve provides control for
red quantity of gas.
87


Processing Procedure:
A base vacuum of better than 10‘6 Torr is required before
preceding with the deposition process. Filling the trap with liquid
nitrogen improves the vacuum on our system to better than 10-7 Torr.
Target processing is started by first outgassing the tantalum
substrate by heating to 800”C for one or two minutes or unti I outgassing
has ceased. The system pressure is allowed to recover before continuing
further with fhe process. This usually takes no longer than three or
four minutes.
The titanium getter source and the evaporation source are
powered to simultaneously raise their temperatures to 1000”C, with an
accompanying rise in vacuum pressure being observed. The getter source
temperature is further increased to about 1700”C or until the titanium
melts and begins to evaporate. The pumping action of the evaporating
titanium rapidly reduces the chamber pressure lower than 10-7 Torr.
The evaporation source temperature is now increased to completely
evaporate the target titanium and takes about one minute to do so. After
switch
is iso
of 300
coated
ng off the power to both evaporation sources, the vacuum chamber
ated by closing the main valve.
Nitrogen-15 gas is bled into the vacuum chamber to a pressure
mi I Iitorr. Nitriding is accomplished by heating the titanium
tantalum in situ to an observed temperature of 750 to 800”C and
maintaining this temperature for five minutes. The target is allowed
to cool in the 15N environment for one half hour before removal from
the chamber. Weighing of the target and calculating the thickness
completes the procedure.
89

The temperature figures quoted for the nitriding process are
readings taken with an optical pyrometer and have not been corrected
for em
Genera
ssivity.
Comments:
Experience has shown that the nitriding temperature range
previously stated is important. An incomplete nitriding reaction is
the result of the temperature being too low; whereas, too high a
temperature can cause nitrogen diffusion into the tantalum substra-
resulting in a target with a poorly defined thickness.
The important contaminants in ay studies are the low Z e
These give a high background because of large cross sections for a
e
ements.
reactions. Carbon and, to a lesser degree, oxygen are present in the
targets produced. Researchers(3)
nave included in a publication, the
results of an investigation of the purity and stoichiometry of -
#148. It is not within the scope of this paper to report their I
findings; briefly stated, they found the following:
arge-
comp ete
‘iNo.75was representative of the nitriding efficiency.
The carbon, titanium atom ratio was equal to 0.11.
The oxygen, titanium atom ratio was less than 0.09.
It is not known if these results are valid for all the targets produced.
Some experimental work with reactants other than titanium
has been done. Zirconium and niobium did not give as good results as
titanium and considerably
elements.
ess development time was expended on these
90
Improvements on this technique can be made; for example,
titanium of higher purity could be used and an oil free vacuum system
would undoubtedly reduce carbon contamination.
More than 160 targets have been produced by the method
outlined here and improvements in technique and equipment are being
evaluated.
The author gratefully acknowledges the advice and encouragement
of Drs. R.S. Storey and W.R. Dixon.
(1) Aitken, J.I-l., University of Toronto, Private communication.
(2) Tegart, W.J. McG., The EhWLPQ@tiC and Chemical Polishing of
Metals, Pergamon, New York, 1959.
(3) Dixon, W.R. and Storey, R.S., 1971, Can. J. Phys. 49, 13.
91

REDUCTION TECHNIQUES FOR ISOTOPIC MATERIALS
Joanne M. Heagney and Joseph S. Heagney
MicroMatter Co., Seattle, WA.
INTRODUCTION
The inventory form of many of the isotopes of the elements provided
by O.R.N.L., Isotope Sales is other than metal. The reason being in most
cases that the metal is not the most stable form of the element. While
most of these isotopes can be obtained from O.R.N.L. as metal, it is clear-
ly advantageous in the case of the more reactive elements for the target-
maker to perform the reductions simultaneouswith or just prior to fabri-
cating the target.
Table 1 lists those elements whose inventory form at O.R.N.L. is other
than metal and which can be easily reduced using equipment and materials
readily available to most target making facilities. Three basic reduction
methods are indicated; furnace reduction with hydrogen gas, reduction-
distillation with active metals or carbon and electrolytic reduction.
These three methods will be discussed separatelywith attention to varia-
tions between different metals using the same reduction method.
HYDROGEN REDUCTIONS
Hydrogen reductions are by far the simplest
of all the reduction techniques. Using a common
and most straight forward
tube furnace, reductions
of isotonically enriched Cr203, CUO, Ge02, Inz03, Fe203, Pb(N03)2, T1203
and W03 can be accomplished. The oxide is placed in a combustion boat and
the boat inserted into the tube furnace. The combustion boat must be care-
fully selected so as not to contaminate the resultant metal (e.g. Iron forms
a carbide if a graphite boat is used). Care must also be taken to select a
combustion tube which is serviceable up to the maximum temperature at which.
the reduction will be carried out. Vycor tubes may be used up to 1000oC,
Quartz to 1300°C and Silliminite (which is opaque) Up to 1700°C. However,
for most reductions, a Vycor tube is sufficient. A hinged type tube furnace
is extremely advantageous in that it allows one to view the material when
“jiggling!’the combustion tube to consolidate a lower melting metal. It
92

,.
also allows for more rapid cool down after reduction. Hydrogen from a tank is
passed through a catalytic cartridge to remove o~gen and then through a trap
of either phosphorus pentoxide or liquid nitrogen to remove water vapor. After
thoroughly
and burned
the excess
“flashback
of loss of
combustion
flushing the system with hydrogen, the gas may either be ignited
at the outlet of the combustion tube or vented in a fume hood. If
hydrogen gas is ignited, a small oil trap should be used to prevent
explosions” in the tube which could be dangerous and costly in terms
material. Table 1 lists the proper temperature range and type of
boat to use for each element.
Lead isotopes are provided by O.R.N.L., Isotope Sales as the nitrate.
One can convert the nitrate to oxide by dissolving it in deionized water, add-
ing an excess of ammonium hydroxide to precipitate lead hydroxide and finally
by adding hydrogen peroxide to precipitate lead oxide. Wash the oxide thor.
oughly, centrifuge, decant, dry and then reduce with hydrogen. One can reduce
lead nitrate directly by using a covered combustion boat with a couple of small
holes in the cover to allow hydrogen flow. The cover prevents the nitrate from
“spitting out” of the boat when it decomposes to the oxide.
REDUCTION - DISTILLATION
This method in general utilizes an active reductant like Aluminum, Cal-
cium, Lanthanum, Zirconium, Thorium, etc. or Carbon, whose oxides are volatile.
Usually the process takes place in a vacuum evaporator using any one of the
many heating methods to achieve the reaction temperature. In most cases, the
reduced metal evaporates near the reaction temperature, while the reductant and
its oxides have very low evaporation rates at this temperature. In these cases,
one can often evaporate a target foil directly onto the substrate. Usually,
however, the reaction goes at a high enough temperature to cause some contamin-
ation of the deposit and a re-evaporation or re-distillation step is required.
The powdered oxide of the material to be reduced is mixed with the finely
divided reductant and the mixture is pressed into a pellet to assure good
physical contact and to exclude as much gas as possible. One and one-half to
two times the~ochiotnetricratio of reductant to oxide is used to allow for
oxidized reductant and non-uniform mixing. It is important to use finely di-
vided reductant, but since active metal powders oxidize rapidly, they are
most effective is freshly prepared from the bulk material just prior to each
reduction. Filings from a lump are usually used, but there is some concern about
93

contamination from the file; therefore, a separate, unoxidized, high quality
file is recommended for each reductant used. The pellets are loaded into a
tight-geometry source and heated to the reaction temperature. For Ca, Mg,
Sr, Sm and Yb oxides a resistance-heated tantalum pinhole or tube-type
source is used (See Figure 1). For the higher temperature oxides like Dy,
Er, Gd, Nd and Lu an electron heated tantalum crucible set-up is used.
The rate of heating should be slow and care taken to avoid “runaway” as
rapid out-gassingmay eject pellets from the more open sources or deposit
small “spits” of material on the substrate. The substrate is placed close
to the source opening and in the case of large quantities is often movable
to allow for the increase in thickness of the deposit. Substrates are
chosen for non-interactionwith and easy removal of the deposit. Polished
tungsten sheet is often used. Some very carefully designed sources for
use with induction heating have been made and reported by 0.R.N.L.1$2 A
more detailed discussion of the reduction of the rare earth oxides may be
found in the literature.3,4
In the case of the carbon reduction of Chromium and Iron$ a graphite
crucible in an electron heated crucible set-up is preferred; while for
Cadmium and Zinc a resistance heated tantalum pinhole-type source is used.
The reaction is monitored by the increase in pressure due to the evolution
of C02 and CO. Little contamination occurs due to the high purity of carbon
available and the extremely low vapor pressure of carbon. For large quan-
tities the pumping load may be so large as to require extremely long times
in the usual vacuum system. Also carbide formation may cause low yield or
poor final metal.
Electrodeposition is
ELECTROLYTIC REDUCTION
the most conservativemethod for the reduction of
isotopic oxides of Zinc and Cadmium to obtain metal for rolling or vacuum
evaporation. Usually better than 90$ of the metal can be deposited on the
cathode and what remains in solution can be recovered chemically. Figure 2
illustrates a simple electroplating cell used for plating small quantities
of material. Construction details were designed for easy assembly and dis-
assembly. The volume of plating solution is kept to a minimum in order to
maximize the concentration for better plating efficiency and higher quality
deposits. A plating cell with an internal diameter as small as 1/4” and a
94

solution volume of one to two milliliters might be used when plating limited
quantities of isotopes of Zinc and Cadmium. It is also important to keep
the plating baths free from unnecessary additives in order to obtain metals
of as high a purity as possible. Some plating baths resulting in high
yields and good quality deposits are as follows:
Cadmium - Dissolve CdO in NaCN solution. Add NaOH. Ratio of consti-tuents should be about 2:6:1 (Cd, NaCN, NaOH). Keep thevolume of solution to 1-5 ml. depending on the quantity ofisotope available. Plate onto polished stainless steel orplatinum. Use a platinum anode. Current density should be5-10 ma/cm2.
Zinc - Dissolve ZnO in NaCN solution. Add NaOH. The ratio ofconstituents should be 1.5-2:3:3 (ZnO, NaCN, NaOH). Use aplatinum anode and either a platinum or stainless steelcathode. Current density should be 8-10 ma/cm2.
Dissolve ZnO in dilute H2S04. Add just enough NaOH toprecipitate basic zinc oxide. Then barely redissolve theprecipitate with dilute H2S04. The pH should be no lessthan 3.5. Dilute NaOH must be added dropwise as the dep-osition progresses to maintain the pH above 3.5. A plat-inum anode and polished stainless steel cathode are used.The current density should be 2-10 ma/cm2.
Deposits may be either flexed free from the cathode in the case of the
less adherent ones or they may be scraped free using a razor blade. If the
resulting metal deposit is to be used for rolling, it should be as free of
oxides as possible. Clean metal beads may be obtained by melting under
ammonium chloride.5 This is a rather risky procedure when small quantities
of material are involved, as the procedure is apt
losses. Press the metal into a single pellet and
a small pyrex, conical-bottomed centrifuge tube.
ium chloride to cover the pellet. Carefully heat
to cause significant
place it at the bottom of
Add just enough ammon-
the bottom of the tube
over a bunsen burner until the Zinc or Cadmium metal just melts and swirls
slightly in the molten ammonium chloride. Cool quickly and remove the
bead of metal. Wash it thoroughly in deionized water and dry in acetone.
If significant loss of material does occur, one can recover the material
chemically from the ammonium chloride. This cleaning technique may also be
used for lead metal.
95

96
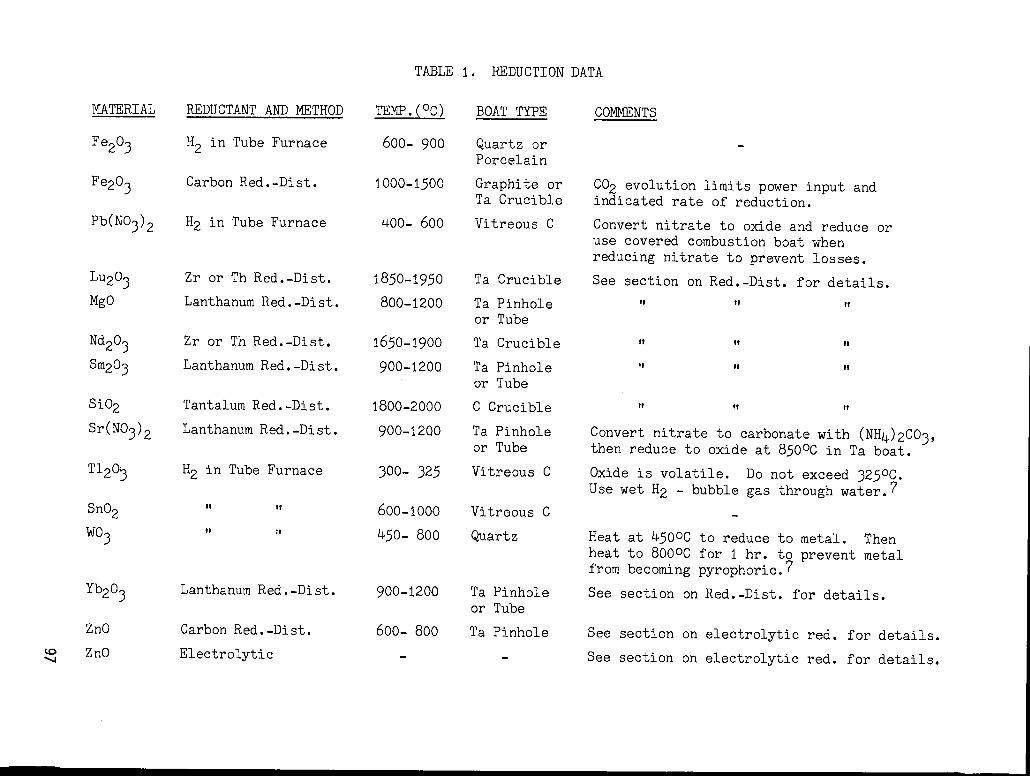
vN.
a)
.Ii
!q.
.,0N
ol=
ii2’
-PiJ&
Cdcdo
a)a)s+
X..c%
l
97

Fig. i. Resistance-Heated Evaporation Sources.
(Y5
Fig. 2. Electroplating Cell Used forSmall Quantities of Material.
i- platinum spiral or wire; 2 - l//+_l/2_in.-
ID Lucite plating cell; 3 - O-ring seal;4- backing to be plated (cathode); 5 - metalbase
98

REFERENCES
1.
2.
3*
4.
5.
6.
7.
8.
9.
10.
E. H. Kobisk, Isotop. Radiat. Technol. ~ (1), 1-3 (1969.
E. H. Kobisk andW. B. Grisham, Mat. Res. Bull. ~, 651-62 (1969).
L. Westgaard and S. Bjornholm, Nucl. Instr. and Meth. 42, 77-80 (1969).
F. H. SDedding and A. H. Daane, Metals~, 504 (1957).
F. Karasek, Argonne National Laboratory, private communication.
P. R. Kuen, F. R. O’Donnell-and E. H. Kobisk, Nucl. Instr. and Meth.~ (1972).
E. McDaniels, Oak Ridge National Laboratory, private communication.
C. A. Hampel (cd.). Rare Metals Handbook, 2nd cd., Reinhold PublishingCorp., London, 1961.
R. E. Honig, RCARev. 2J, 567 (1962).
Fredrick Lowenheim (cd.). Modern Electroplating, 2nd cd., Wiley Publ.co., New York, 1963.
99

DEUTERATED TITANIUM TARGETS ON THIN BACKINGS
A. M6ens
Centre de Recherches Nuc16aires, Laboratoire PNPA
67037 Strasbourg-C6dex, France
Abstract
Stretched deuterated titanium targets on different thin metallic
substrates have been prepared by evaporating titanium onto backings in
a deuterium atmosphere.
I. - INTRODUCTION
Deuterated titanium targets on thin substrates have been prepared
and stretched on special target holders for recoil distance lifetime and
magnetic moment measurements. Deut erat ed polyethylene could not be
used because of its rapid deterioration under bombardment. Neither was
the method proposed by Gallant1)
applicable because of difficulties incur -
red in stretching the annealed and brittle thin targets.
The method used here consisted in the evaporation of titanium in
a tenuous atmosphere of D ~. The titanium gets the deuterium to form in
the best conditions Ti . Dl ~[ 1
Ref. 2 which is stable to 500°C..
II. - PROCEDURE
A diagram of the apparatus is shown in Fig. 1. One gram of
titanium was placed in the crucible of the electron gun. The backings
were fixed on a substrate heater, 15 cm above the crucible. The sys-
tem was evacuated with an oil diffusion pump, to a vacuum of 5. 10-6 Torr.
When this vacuum was attained, liquid nitrogen was forced through a
circuit located above the trap of the pump. This accessory was necessary
100

to condense baclcstreaming oil vapors that would occur at the D2 working
pressure. At the beginning of the titanium evaporation, the backings, hea-
ted to 200°C, were protected by a shield. When steady evaporation of
titanium was reached, a needle valve was opened to introduce D at a
-32
pressure of 5.10 Torr. After a few minutes the shield was removed
and the material proceeded to deposit on the backings. The rate of evapo-
ration and the film thickness were monitored with a quartz oscillator.
The evaporation was performed over a period of 2-3 h so as to permit
the titanium to absorb a maximum of D z. It was found by trial and error
that the parameters mentioned above were fairly critical for the success-
ful preparation of the films.
Targets of 250 to 300 ug/cm2/
of deuterated titanium have been
made on the following backings :
1 mg/cm2 of
250 ug/cm2/
Corporation.
charge. The
3)gold evaporated on mirror surfaced plates ,
and 450 ug/cm of nickel supplied by the Chromium/2
The nickel surfaces were cleaned in an argon glow dis -
copper substrates of the nickel foils were later removed
with Richard’s solution,
800 ug/cm’ of copper evaporated on glass slides with barium/
as release agent. For some of the latter the copper substrates
chloride
were
removed in order to obtain self-supporting targets of deuterated
tit anium. These targets, however, could not be stretched.
Target preparations are planned using other metals such as rare
earths since their deuterafed forms are purported to possess a tempera-
4)tur e stability superior to that of deuterated titanium .
111. - TARGET THICKNESS MEASUREMENTS
To determine the quantity of deuterium occluded, use was made
of the D (p, po) nuclear reaction for which the cross section at Cllab= 165°
5)has been measured by Sherr et al. . Figure 2 shows typical spectra of
101

scattered protons for an incident energy of 2. 5 MeV. Spectrum 2a was
obtained by bombarding the deuterated side of the target and furnished
the ratio of deuterium to titanium plus copper. Spectrum 2b is the spec-
trum obtained by bombarding the non-deuterated side of the target and
permitted evaluation of the quantities of titanium and copper which then
appeared in resolved peaks. Taking into account the Rutherford scatte-
ring cross s ection for titanium, we found that the quantity of occluded
deuterium corresponded to approximately 2 ug/cm’./
Although the proportion of deuterium turned out to be less than
that sometimes found in thick targets, these thin targets were well
adapted to a plunger system. With them, measurements have been made
21Neon magnetic moments of the first excited states in the mirror nuclei
21and Na [Ref. 6] .
Acknowledgements
The author would like to thank G.
scattering experiments to determine the
for aid especially during the manuscript
References
Costa for performing the elastic
target compositions, and A. Pape
preparation.
1) J. L. Gallant
Nucl. Inst. and Meth. 102 (1972) 477.
2) P. Pascal
Nouveau Trait6 de Chimie Min6rale
(Masson and Co. , Paris, 1965) - Tome IX, p. 176.
3) J. L. Gallant
International Conference of the Nuclear Target Development
Society, Argonne National Laboratory, 1975.
4) Brochure of “Nukem GmbH”, D-6450 Hanau 1, Postfach 110080,West Germany.
5) R. Sherr, J. M. Blair, H. R. Kratz, C. L. Bailey and R. F.
Taschek, Phys. Rev. 72 (1974) 662.—
6) F.A. Beck, T. Byrski, G. J. Costa, J. P. Vivien
International Meeting on Hyperfine Interactions, Louvain 1975.
102
Figure Captions
Fig. 1 Schematic diagram of the apparatus used to prepare
deuterated titanium targets.
Fig. 2 Spectra of elastically scattered protons from a
deuterated titanium target, on a copper backing.
a) B earn impinging on the deuterated side.
Peaks of titanium and copper are unresolved.
b) B earn impinging on the non-deuterated side.
Titanium and copper peaks resolved.
103

heating b[o
mask —
bell jar ———
shield —
titanium
LN circuit —:
figure 1
glass wooL insulation
thermocouplef— ——
—— .—_ _
— —._ _—. _////////4
------ - ------ -
—
—
—
~
pumping system &
.
quartz sensor
glow dischargeeLectrode
—————
+ H .V.
104
—

1000
[~
D
160I
Proton beam Ti+cu%T-
—.—
1
.—..~...~
Si Detector %b ’65”
Proton beam Ti+Cu D—a-
====+=--”---”-:-: - ;“-IJlj0-- ‘Si Detector 165” 160
I I
\
— Ti+ Cu
II—
500
0 \AL
2LM0— Cu
1000
y _z 12C
2 Iv -
0 J I Io 100 200 300 Loo 500 600 700 800 900 1000
CHANNEL NUMBER

TARGETS OF SILICON OXIDE AND VANADIUM OXIDE ENRICHED
IN ‘8 O ON VARIOUS BACKINGS
A. M6ens
Centre de Recherches Nucli5aires, Laboratoire PNPA
67037 Strasbourg-C4dex, France
Abstract
Enriched water has been electrolyzed and the resulting180
2
reacted with silane and
oxide. The product was
I. - INTRODUCTION
vanadium to form silicon oxide and vanadium
then evaporated onto various backings.
Anodic oxidation is a well known technique for making oxygen
targets, especially self-supporting ones or those on chemically non-
1 -4)reactive substrates . This method is not applicable if the desired
substrate, iron for example, is reactive. In such a case an oxide can
be prepared and evaporated onto a backing. We have prepared tungsten
oxide with enrichied 170 as Muggleton ‘-6) suggested, but for other
experiments, a metal derived component of lower Z was required. For
7)one s cries of experiments silicon oxide was prepared. For another
8)series , where silicon was too light, we prepared vanadium oxide.
This report will describe the methods of preparation of silicon and
vanadium oxides using
II. - PREPARATION
180 enriched water.
A. Silicon Oxide
The silicon oxide preparation is based on two reactions :
1801) Electrolysis of water to liberate z,
106

2) Reaction of 02 with silane9)
SiH4 -i- z o -__>2
SiO z + 2H20.
A diagram of the apparatus is shown in Fig. 1. In essence, the
apparatus has two functional components : Part 1, the vessel for the
electrolysis and Part 2, the reaction chamber for the silicon oxide
formation. Part 1 contains the enriched water and is cooled by a water-
ice bath. This part could not be pumped and so was flushed for about an
hour with argon before the electrolysis. Part 2 was evacuated with a
180rotary pump and then purged with argon. During the operation the
2
was swept into Part 2 by the circuit 4+6 (see Fig. 1). The flow rate
was monitored via the number of bubbles passing a mineral oil trap. A
trial run with ordinary water was perfomed to determine the flow rate
produced by the electrolysis. The silane flow rate was adjusted to exceed
the stoichiometric proportions necessary to react with the flowing oxygen.
The argon carrier gas flow rate was the same as that of the electrolysis
products. The excess silane burned with a small flame at the oil trap
upon contact with air. We have worked under the following conditions :
- A volume of O. 1 cm3 of water to which a small quantity of metal-
lic sodium was added to facilitate the electrolysis.
- An electrolyzing current of 200 mA. The electrolysis of the water
was complete after approximately 150 min. The silane flow was
then stopped and the argon flow continued until the exc ess SiH4
was flushed out of the system.
A total of 70 mg of white powder presumed to be Si18
02 [Ref. 9]
18was obtained, representing a conversion efficiency for 02 of
50 %.
B. - Vanadium oxide
This compound was prepared in two steps :
107
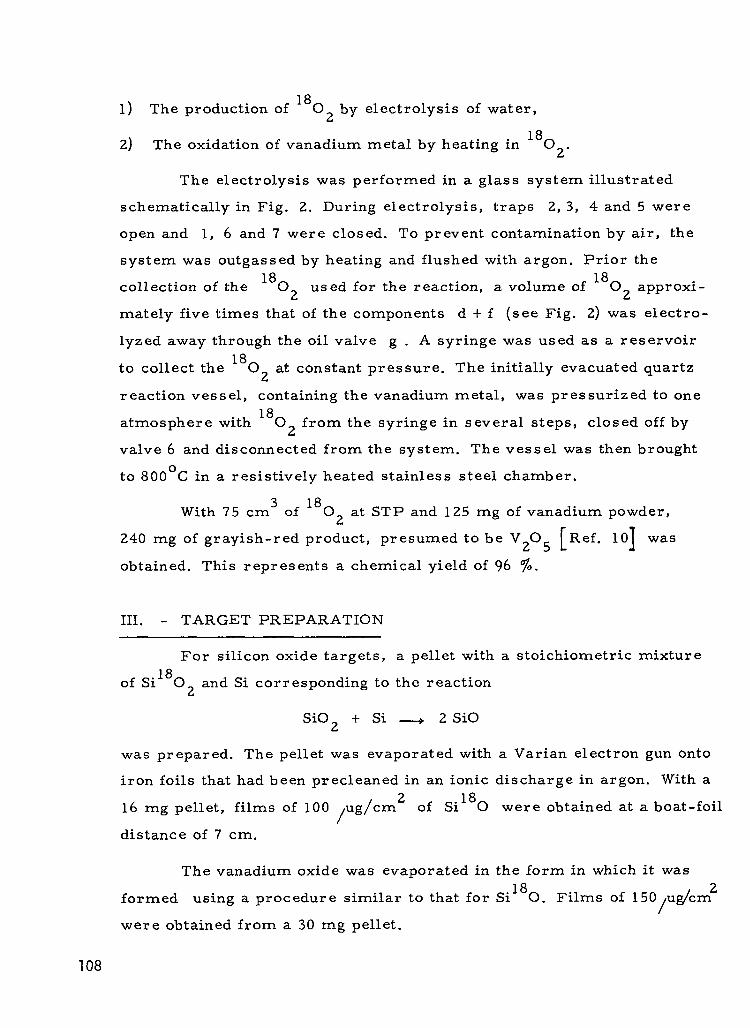
1) The production of18
02 by electrolysis of water,
182) The oxidation of vanadium metal by heating in 02.
The electrolysis was performed in a glass system illustrated
s thematically in Fig. 2. During electrolysis, traps 2, 3, 4 and 5 were
open and 1, 6 and 7 were closed. To prevent contamination by air, the
system was outgassed by heating and flushed with argon. Prior the
18 18collection of the 02 used for the reaction, a volume of 02 approxi-
mately five times that of the components d + f (see Fig. 2) was elect ro -
lyzed away through the oil valve g . A syringe was used as a reservoir
to collect the18
02 at constant pressure. The initially evacuated quartz
reaction vessel, containing the vanadium metal, was pressurized to one
18atmosphere with 02 from the syringe in several steps, closed off by
valve 6 and disconnected from the system. The vessel was then brought
to 800°C in a resistively heated stainless steel chamber.
With 75 cm’ of ‘8 02 at STP and 125 mg of vanadium powder,
240 mg of grayish-red product, presumed to be V205 [Ref. 10] was
obtained. This represents a chemical yield of 96 ~..
III . - TARGET PREPARATION
For silicon oxide targets,
of Si18 02 and Si corresponding to
SiO z + Si
a pellet with a stoichiometric mixture
the reaction
~ 2 SiO
was prepared. The pellet was evaporated with a Varian electron gun onto
iron foils that had been precleaned in an ionic
16 mg pellet, films of 100 ug/cm2/
of Si180
distance of 7 cm.
The vanadium oxide was evaporated in
formed using a procedure similar to that for
were obtained from a 30 mg pellet.
108
discharge in argon. With a
were obtained at a boat-foil
the form in which it was
Si180. Films of 150 ug/cm2/

The resulting targets were used in magnetic moment measure-
7-8) 18ments in which the O enrichment was found to b e about 90 ~. in
all cases. The initial18
0 enrichment of the water was 98.5 YO.
Acknowledgments
The author would like to thank M. Goldberg for his interest and
aid, and A. Pape for his assistance with the manuscript preparation.
References
1)
2)
3)
4)
5)
6)
7)
8)
9)
10)
G. Amsel, Ann. Phys. (Paris) ~ (1964) 309.
A. Aladjen and D. G. Branden,
Vat. Sci. and Tech. ~ (1969) 635.
D. Phillips, Nucl. Instr. and Meth. ~ (1974) 19S.
M. A. Saettel, International Conference of the Nuclear Target
Development Society, Argonne National Laboratory , 1975.
A. H. Muggleton and F. A. Hove,
Nucl. Inst. and Meth. 12 (1961) 192.—
A. H. Muggleton and C. T. Parsons,
Nucl. Inst. and Meth. 27 (1964) 397.—
M. Forterre, J. Gerber, M. B. Goldberg, J. P. Vivien and
K. H. Speidel, Phys. Lett. 55B (1975) 56.
J. Gerber, M. B. Goldberg, K. H. Speidel,
Phys. Lett. @B (1976) 338.
P. Pascal, Nouveau Trait6 de Ch:mie Min6rale
(Masson and Co. , Paris, 1965) Tome VIII, p. 331.
P. Pascal, ibid. , Tome XII, p. 167.
109

Figure captions
Figure 1. - Schematic diagram of the apparatus used for preparing
silicon dioxide.
Part 1 : Electrolysis vessel
Part 2 : Reaction chamber
The cross-hatched part is made of copper. The rest is in pyrex.
1-7)
a)
b)
c)
d)
e)
f)
g)
h)
needle valves
argon bottle
silane bottle
manometer
to rotary pump
water-ice bath
mineral oil trap
flexible joint
fritted glass.
Figure 2. - Schematic diagram of the apparatus used for preparing
vanadium oxide.
The system is made of pyrex except for the reaction vessel which is
made of quartz.
1-7)
a* .!4
b)
c)
d, e)
f)
h)
i)
j)
k)110
valves
oil valves
electrolysis tube
water-ice bath
security traps
dessicant
removable syringe
r eactian vessel
vanadium powder
glass -quartz connection.
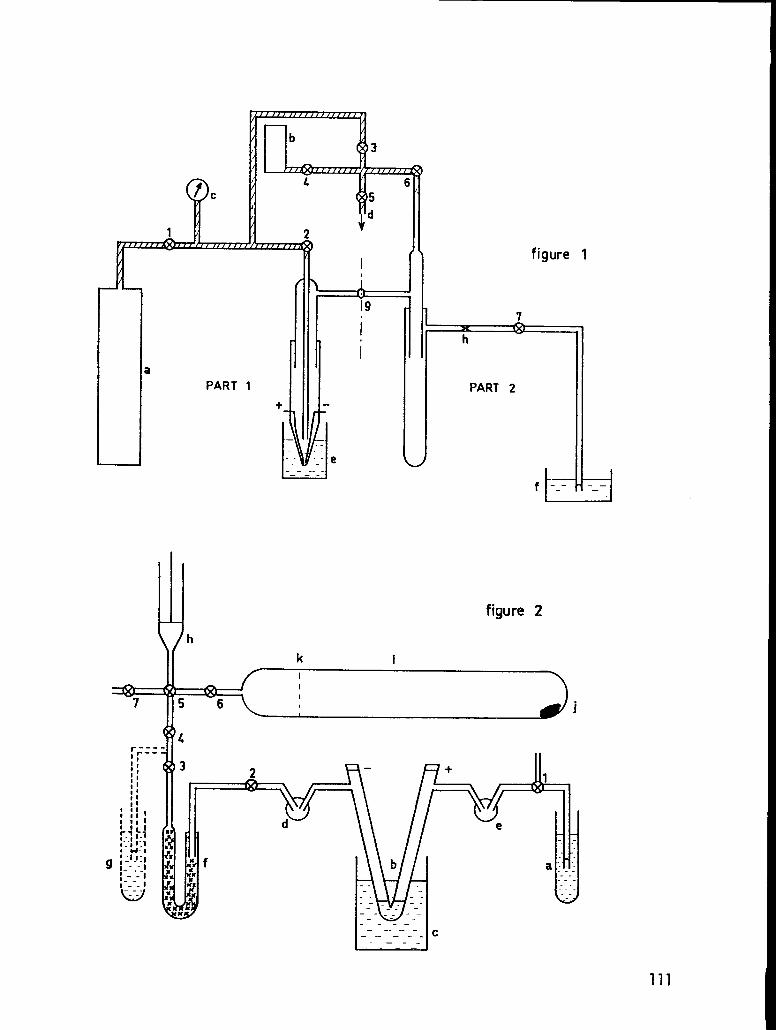
&?.
1
1
1
PAR”
figure 1
7x u)
h
PART 2
f --- 1 ---
figure 2
h
k i
II
-..— - .—— —
a
c
111

PREPARATION OF ISOTOPICALLY ENRICHED MERCURY TARGETS
H. U. Friebel, Dagmar Frischke, R, Gro13rnann~ w. Hering~
H. J. Maier+) and H. puchta
Sekti.on Physik der Universi.tat Munchen, Abteilung I@rnphySik
8046 Garchimg bei Miinchen, W-Germany
ABSTRACT
Mercury targets have been prepared in form of HgS-films,
consisting of isotonically enriched mercury and sulfur. The sulfi-
de compound was chosen because of its comparatively high thermal
stability. Starting up with HgO and elemental S, a three-step pro-
cess was developed resulting in black HgS-films:
1.
2.
3.
Metallothermic reduction of HgO to metallic Hg
Conversion of metallic Hg and powdered S to HgS using a ball
mill
Vacuum sublimation of HgS on a LN2- cooled metallic backing
The procedure was utilized for the routine production of HgS-
targets in the thickness range between 5 ~9/Crn2 and 3 mg/cm2 on
80 ~g/cm2 up to 10 mg/cm2 thick Al, Ni, Cu and Bi foils. The over-
all efficiency of the process is approximately 20 %.
+)presented the paper
112

1. INTRODUCTION
The primary difficulty in performing nuclear reactions on mer-
cury is usually t-o obtain a suitable target. we have prepared isoto-
nically enriched mercury targets in two different ways: first, by
electrolytic deposition of mercury metal 1)and second by vacuum eva-
poration of HgS, a special selected mercury compound.
Electrolytic deposition of mercury metal requires a metallic
backimg which is able to form an amalgam as for example copper, gold
or bismuth. A great number of bismuth-amalgam-targets has been pro-
duced and tested im our laboratory. It became apparent during the
course of this development,that the homogeneity and the in-beam sta-
bility of these targets were unsatisfactory. On the other hand, va-
cuum condensed mercury sulfide films on metallic backings proved to
be excellent targets for heavy ion transfer reactions.
This situation is illustrated by Fig, 1, Which shows two SPec-
tra originating from204
Hg . The spectrum on the left was taken with
a 204HgS target on a thin aluminum backing. It is a typical spectrum
of a homogeneous target, with two gaussian shaped peaks indicating
elastic scattering from the ground state and inelastic scattering
from the first
was taken with
It features an
dicates strong
excited state, respectively. The spectrum on the right
a metallic mercury target on a bismuth career foil.
elastic peak with a large low energy tail. This in-
energy straggling, caused by severe target inhomoge-
neities. In fact, the average thickness of this target is 1.5 mg/cm2.
The local effective thickness however fluctuates between O and
113

4●
0.
v+E4
002slNno2
001
114

17 mg/cm2 as may be estimated from the shape of the tail.
The maximum allowed beam current is about 20 particle nA for
the HgS-target and about 1 particle nA for the amalgam target.
These facts demonstrate the superior quality of the sulfide
get. In the following, a detailed description of the preparation
HgS-targets will be presented.
tar-
Of
HgS was selected as the most suitable compound for mercury tar-
gets because of its chemical and thermal stability. In addition, at
least one sulfur isotope
all our experiments with
could be tolerated as a target compound in
mercury.
Two modifications of mercury sulfide are known: a red, hexago-
na 1 ~-form, commonly known as cinnabar, and a black, cubic ~-form
known as meta-cinnabar. Our preparation methods result in thin films
of the black, meta cinnabar modification. This is of no importance
for the nuclear experiments.
The process
both mercury and
scheme in Fig. 2
2. CONCISE
of preparation
sulfur must be
PROCESS DESCRIPTION
depends upon the question whether
isotonically enriched or not. The
gives a summary of all possible modifications of the
procedure. The most general case is the requirement of isotopic en-
0richment for both elements (column 1 in Fig.2) . Since isotonically
enriched mercury is supplied in form of HgO by the OR~ and enriched
sulfur in the elemental form, the first problem is to prepare HgS
starting up with these materials. This is done by a metallothermic
115

o1 02
HgO (Hg isot.enriched)S (natural)
1
Precipitation of Hg S
with HzS from
Hydrochloric Solution &HgO (Hg isot. enriched)
S (isat. enriched)
Metallothermic
Reduction Hg04Hg
o31 1
THg (natural) LHg [natural)
S (isot. enriched) S (natural)
J,
[
Ball Mill:
Hg+S~Hg S
-i ‘ithcs2HgS - Purification
Fig. 2: Schematic view of procedures involved in HgS target
production

reduction of mercury oxide
of the metal together with
mercury sulfide is formed.
to mercury metal followed by a treatment
powdered sulfur in a ball mill whereby
An excess of free sulfur is removed by a
purification process with CS2. The second problem is the target pre-
paration in its narrow sense. It is accomplished by vacuum condensa-
tion of HgS on a cooled metal backing.
If the natural isotopic mixture of sulfur can be tolerated but
isotonically enriched mercury is required (column@ in Fig. 2) , the
preparation of HgS is done in the usual standard way by dissolving
HgO in hydrochloric acid and precipitating HgS from that solution
with H2S.
If the natural isotopic mixture of mercury is admitted but iso-
tonically enriched sulfur is required - for instance for the prepa-
ration of a sulfur target - it is convenient to start up with metal-
lic mercury and powdered sulfur (column o3 in Fig. 2) . Likewise the
trivial case - natural isotopic mixture of both mercury and sulfur -
may be treated if mercury sulfide is not available from stock (column
o4 in Fig. 2).
3. DETAILS OF THE PROCEDURE
3.1. Preparation of Mercury Metal
The conversion of mercury oxide to mercury metal is done by a
special reduction distillation technique, utilizing the set-up out-
lined im Fig. 3. The substantial part of this set-up is a quartz
vessel composed of a sphere and a U-shaped tube. The spherical part
777

HgO+R-+H~+RO
Collection Efficiency: 70 YO
Furnace (Copper Cylinder)
\
Heating
Cartridge- Heater
/’ Reaction’Mixture (HgO+R)
Re{ction Vessel (Quartz) ;:————
To VacuumpumpII
Aalve
=Quick - Coupling
Thermocou
g-Mirror
N2
Eazl ,0123 f.5cm
Fig. 3: Set-up for reduction of HgO
118

can be
drical
pellet
in the
heated by means of a simple oven, which consists of a cylin-
copper block with four installed 250 W cartridge heaters. A
made of a mixture of HgO and a suitable reductant is placed
spherical part of the vessel. The reduction is initiated by
heating the pellet up to 500 ‘C in a vacuum of approximately 10-5
Torr. The mercury vapour produced at this temperature is forced
to condense in the U-shaped region. This is accomplished by slight-
ly heating the upper section of the tube with a heating tissue and
cooling the “U” by liquid nutrogen. The result of this procedure
is a metallic mirror which converts to a mercury droplet when the
tube is allowed to warm up. The efficiency of this reduction is
about 70 %.
The proper selection of the reductant is crucial for the success
of the reaction.We have found tungsten powder to meet all require-
ments of the present problem.First, its vapour pressure and the va-
pour pressure of its oxide are low compared to the vapour pressure of
mercury, which is a necessary condition for every reduction-distil-
lation process. Second, tungsten enables a temperature-controlled
completion of the reaction. This may be understood by a simple ther-
modynamic consideration. The diagram in Fig.4 shows the oxygen-affi-
nities of some important elements by means of the dissociation pres-
sures of their oxides. The dissociation pressure is the partial
pressure of oxygen above the oxide in a thermodynamical equili-
brium. The lower the dissociation pressure of an oxide at a dis-
tinct temperature, the higher the affinity for oxygen of the ele-
ment in question. The strong reductants are located in the lower
right region of this diagram, and vice versa the elements with
119

in.4
.
Ilo;
PO,(Torr)
10°
,()-10
,.-20
,0-30
,0-LC
,0-5[
T“K ,5 10 5
O’lPOJTmr)
10°
,0-10
,0.20
,0-30
,()-40
,.-50
250 300 400 5.006J0700 900 11300120001300011001500 2500
—T(°C)
Fig. 4: partial pressure of 02(P0 ) of some metal oxides as2
function of temperature
120

easy reducible oxides in the upper left region. From a thermodyna-
mical point of view, a certain oxide may be reduced by any element
whose oxide has a lower dissociation pressure. Hence mercury oxide
is expected to be easily converted to metal by classical reductants
as for instance zirconium and thorium. However, because of the ex-
tremely high oxygen-affinity of these two elements, the reaction
with mercury oxide runs into an “explosion, which causes the pow-
dered mixture of metal and oxide to spread around the whole reac-
tion vessel and thus leads to a contamination of the condensing
mercury. If we now consider tungsten, its affinity for oxygen is
considerable weaker. This allows a control of the reaction speed
by variation of the furnace temperature, using tungsten as the re-
ductant. At 500 ‘C, the reaction comes to a completion in about
10 minutes.
3.2. Preparation of mercury sulfide
HgS is prepared by the following procedure: mercury metal is
carefully mixed with an excess of about 10 % of the stoichiome-
tric amount of sulfur. The mixture is then treated in a ball mill
for several hours. Thereby the two elements react and black mercury
sulfide is formed according to the formula
Hg+S HgS .
The ball mill (Fig. 5) is of the planetary type with milling cylin-
ders spinning around their own axis and simultaneously rotating on
a horizontal disk. A photo of a milling cylinder with the grind-
ing balls and the reaction mixture inside is shown in Fig. 6. The
construction material of cylinder and balls i.s agate. The centri-
121
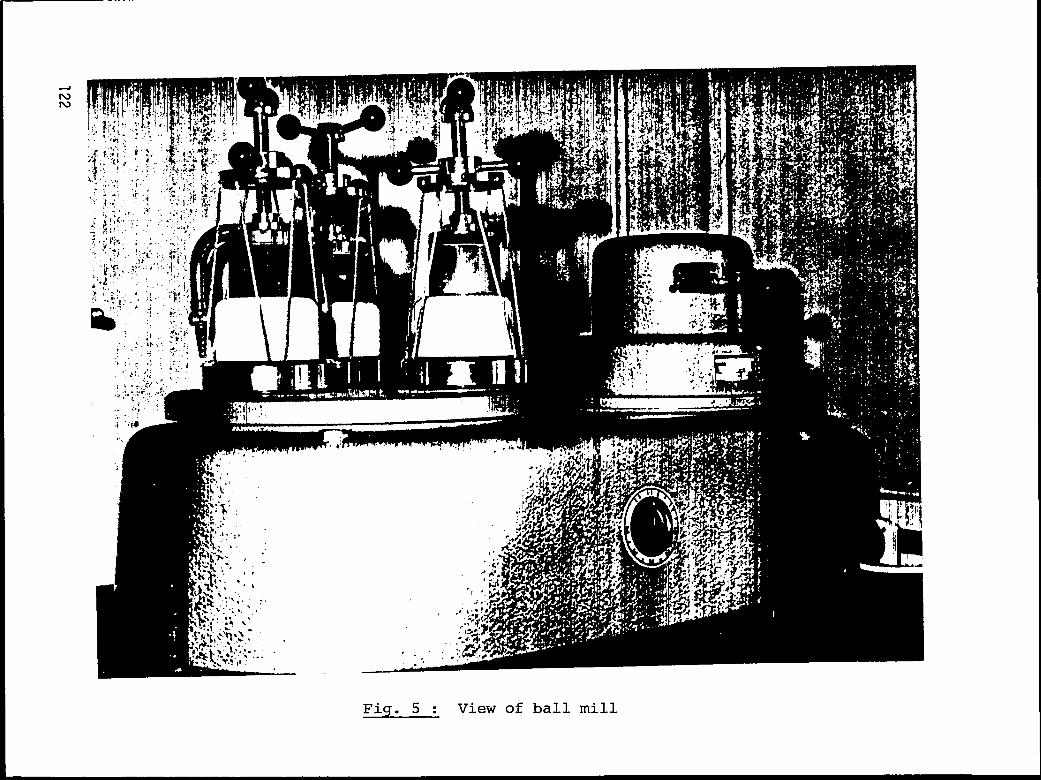
--..=..-/.
I....-...
,..*
..
..-,-
,,”,..
.
-..-..-z-,
-.
122


fugal force reacting on the balls reaches up to 12 times the gravi-
ty . This guarantees a thorough contact of the two elements and a
nearly complete conversion to HgS .
HgS prepared in this way usually contains a fraction of free
sulfur. This is removed by treating the freshly prepared compound
with CS2 in an extraction apparatus of the Thielepape type.
The efficiency of this method of preparing HgS is about 90 %.
The overall-efficiency up to this point - referred to the amount of
mercury expended - is about 65 %.
3.3. Vacuum condensation of HgS
The growth of the HgS thin film is accomplished by vacuum subli-
mation of mercury sulfide on a cooled metal backing. A collimating
tantalum boat is used to optimize the collection efficiency and
average values of about 150 ~g/cm2 per mg of sublimed material are
achieved. It is vital for the success of the procedure, that the tem-
perature of both the evaporation source and the substrate are well
controlled during operation. The temperature of the boat must be
kept strictly below 300°C to prevent a dissociation of the weekly
bound mercury sulfide molecules. Substrate cooling on the other
hand is necessary to enforce a condensation of the volatile material.
The optimum substrate temperature turned out to be -130 ‘C, which is
a compromise between a satisfactory condensation efficiency and a
tolerable amount of internal stress of the HgS film. At temperatures
considerably lower than -130 ‘C large internal stresses are ob-
124

—
;,
.-. ,
,
j
,
Fig. 7: Substrate holder (x) with cooling device
I 125

Fig. 8: Detailed viewholder
of evaporation source and substrate
126

served. They cause the thin film to-split off the backing when this
is warmed up. For reasons of thermal conductivity a metallic back-
ing must be used. In Fig. 7 the practical realization of the evapo-
ration arrangement is shown. The substrate holder (x) is mounted on
one end of a copper rod, which is fed out of the vacuum chamber
through a 0.5 mm thick sheet of stainless steel and cooled by li-
quid nitrogen on its other end outside the chamber. Thermal losses
to the walls of the vacuum chamber are minimized by this construc-
tion. The desired substrate temperature is adapted about one hour
after beginning of cooling and remains sufficiently constant du-
ring the 5 minute sublimation process. Fig. 8 shows the substrate
holder and the evaporation source in more detail. When the vacuum
chamber is closed, the substrate is automatically centered above
the source in the correct distance of 2 cm.
4. FINAL DATA
Up to the present day, HgS-targets in the thickness range bet-
ween 5 ~g/cm2 and 3 mg/cm2 have been prepared. Various backings
were used, i.e. Al 80 ~g/cm2, Ni. 300 ~g/cm2, Cu 300 ~g/cm2
and Bi 500 ~g/cm2.
30 mg of mercury oxide and 3.5 mg of sulfur are necessary to
produce 1 target of 3 mg/cm2 thickness with a diameter of 15 mm.
This corresponds to an overall efficiency of 20 %, referring to the
expended amount of mercury.
727

References:
1)H.J. Maier et al.: Jahresbericht 1972 des Beschleunigerlabora-
toriums der Universitat und der Technischen Universit~t Munchen
128

A METHOD FOR STRETCHING ULTRATHIN POLYPROPYLENE FILMS
by
D. M. 13arrus and R. L. Blake
University of California, Los Alamos Scientific Laboratory
ABSTRACT
The method of stretching non-oriented polypropylene film over a heated, Teflon-
covered, aluminum disk is used to prepare films of thickness ranging from 1500 2 to
15000 x. Thickness variations of less than 20% over areas up to 100 cm2 are rela-
tively easy to achieve. Since polypropylene contains only carbon and hydrogen, it
is an effective window for proportional counters in detecting ultrasoft X-rays.
Such films have also been used as windows for gas absorption cells and energy-
10SS nuclear detectors, and as isolation windows for clean, high vacuum systems.
Published in Rev. Sci.. Instr. 48 (1977) 116.—
129

PREPARATION OF ULTRATHIN POLYETHYLENE FOILS BY FILM CASTING*
by
Betty Cranfill
University of CaliforniaLos Alamos Scientific Laboratory
Los Alamos, New Mexico 87545
ABSTRACT
A procedure for making polyethylene foils with a thickness
of 0.02 pm to 2 urnby the film casting method is described. The
thickness of the foils is determined by the concentration and
temperature of the solution, and the quality is controlled by
the uniformity of temperature and rate of solution drainage.
* Work performed under the auspices of the U. S. Energy Researchand Development Administration.
130

Thin plastic films are often used in the fabrication of laser fusion
targets. They are used for support films, as in the ball and disk type of
target shown in Fig. 1. Here a deuterium and tritium filled glass micro-
balloon is sandwiched between two 500 angstrom thick plastic films. A
thicker plastic disk surrounds the microballoon, producing the interference
rings shown.
Thin plastic films are also used for
targets which require a material with a h
spectroscopy experiments which require a f
single foil and double foil flat
gh hydrogen content, and for ion-
euterated film. Polyethylene is
an ideal material for these types of targets.
By using the film casting method, it is possible to produce polyethylene
films over a wide range of thicknesses. Useful films down to 200 angstroms
thick have been made and still thinner ones can be made, although they are
very fragile and may not be useful.
The method described uses glass microscope slides as the casting surface.
This limits the size of the film, but there is no reason to believe the appa-
ratus couldn’t be modified to produce larger films. The current method pro-
duces uniform areas of about 5 cmz with no more than 10% variation in thick-
ness. The thickness is determined by the solution concentration and tempera-
ture.
The film casting
in the 500 ml. flask.
apparatus is shown in Fig. 2. The solution is contained
It is forced up through the center tube into the vessel
at the top by means of air pressure produced by the bulb attached to the flask.
A glass microscope slide is placed in the solution and the vessel is then
drained by releasing the pressure by means of a stopcock.

To provide uniform heat, a spherical heating mantle encloses the flask
and a two foot heating tape is wrapped around the neck of the flask and the
upper vessel. The temperature-of both is regulated by a variable power supply.
The upper heating reduces heat loss and it maintains a uniform temperature
during drainage and evaporation which is important in producing uniform films.
The flask and heating mantle are placed on a magnetic stirrer to mix the so-
lution and to help maintain an even temperature distribution.
It is also necessary to heat the microscope slide to approximately the
same temperature as the solution. This is easily done on a hot plate. Cold
slides will result in cloudy, uneven films, and slides that are too hot will
produce very thick films.
When the solution has drained from the upper vessel, the slide is removed
and allowed to dry.. It dries almost instantly and the film may be removed by
flotation on water as soon as it has cooled to room temperature. It comes off
quite easily and there is no need to coat the slide with a releasing agent.
When it is’floating on water, bright interference colors may be seen
and uniform areas selected. Figure 3 shows some films floating on water.
The gold one is made from a 2% solution and is about 1000 angstroms thick.
It appears to be quite uniform-over almost its entire area. There is one
which is almost invisible and has a gray appearance. ;;Itis about 600 angstroms
thick and was-made from a 1% solution. There are also two films made from a
3% solution which are about 2000 angstroms thick. When lighted from one
angle they appear the same color. The lighting for the photography unfortunately
made them appear different colors. These show more color variation and do not
appear to be quite as uniform as the thinner ones, but they still have
usable areas of uniformity.
132

Thicker films tend to be less uniform than the thinner ones, and the
films tend to be thicker at the top of the slide and thinner towards the
bottom. Also the edges tend to be thicker. There may be some variation
from slide to slide if there is any temperature change, but they are gener-
ally quite consistent and the interference colors may be used to select
areas of the desired thickness.
The graph in Fig. 4 shows the film thickness plotted as a function of
solution concentration at a particular temperature. Curves A and B show the
results of polyethylene dissolved in toluene at 102° C and 88° C, respectively.
Higher temperatures than the boiling point of toluene, which is about 110° C,
are required to dissolve concentrations higher than 6%, so xylene is used,
which has a boiling point of about 140° C. Curves C and D show the results
of polyethylene in xylene at 130° C and 100° C.
Films as thick as 2 micrometers have been made reproducibly by this
method using an 8% solution in xylene at 130° C. The thinness of the films
that can be made is limited only by their strength.
At first it appeared that more polyethylene went into solution at the
higher temperatures to account for the increase in thickness, but upon further
examination this does not appear to be the case. The solution appeared clear
with no undissolved particles and no particles on the films. Rather, it is
the rate of evaporation of the solvent which influences the thickness. Curves
A and C are almost continuous. Both were done close to the boiling points of
the solvents used. Curve D was done at a temperature considerably below the
boiling point of xylene, but still higher than the temperature of curve B, yet
thinner films were produced at an equal concentration.
This seems reasonable when the process involved in the deposition of the
film is considered. Warm temperatures and vapors in the vessel and a slow
rate of evaporation maintain a fluid state so the solution is able to drain
133

down the slide, leaving a thinner film. If the film dries too quickly,
drainage down the slide is inhibited and a thicker film is deposited.
This also becomes apparent if a very hot slide is placed in the
solution. As the solution is drained from the vessel, the heat from
the slide evaporates the solvent very quickly and a very thick film is
deposited. Films up to several micrometers thick have been made in this
way from 5 to 6% solutions, but the reproducibility is very poor.
The rate of drainage is also an important factor, but the film caster
provides a fairly uniform rate, although the higher concentrations drain
slightly slower due to increased viscosity.
The type of polyethylene used also influences the results. Microthene
FN 510 was used in this case. It is a low density, low molecular weight
type. A higher density type was also tried. A 3% solution required
temperatures over 100° C to dissolve and did not produce similar results.
The film thicknesses were measured by interferometry. Those under
.5 micrometers were measured by the Senarmont method and those over .5
micrometers were measured by the Jamin-Lebedev method.
measure the difference in optical
background.
Thus, by using the film cast”
These techniques
path lengths through the sample and the
ng method it is possble to produce thin
to ultra-thin polyethylene films of the desired thickness by simply choosing
the proper concentration and temperature. The films have a usable area of
uniformity and many may be produced easily in a short period of time.
134
FIGURECAPTIONS
Figure 1. Ball and disk target.
Figure 2. Film casting apparatus.
Figure 3. Polyethylene films on water.
Figure 4. Polyethylene film thickness vs solution concentration.
135

w’ r—.. I— ..
e— 1.;$..-
.’
—— — ..
Fig. 2
136

Fig. 3
.-Z*!5
2.0
1.5
1.0
0.5
A TOLUENEB TOLUENEC XYLENED XYLENE
AT 102° CAT 88° CAT I 30° C /AT 100° C c
A
1234567 8
SOLUTION CONCENTRATION (weight % )
Fig. 4
737

PLASTIC-BONDED
R. K.
TARGETS OF CARBON-13 AND SILICON
Rohwer and M. J. UrizarUniversity of California, Los Alamos Scientific Laboratory,
Los Alamos, New Mexico 87545
INTItOIXJCTION Mill BACKGROUND
This is an account of a successful effort to mold thin, large area
(18 x 10.5 cm) targets of elemental carbon and silicon for pion scattering
13experiments. The carbon was enriched to 90% in the C isotope. The
silicon was natural. Both of these materials, as supplied, were in the
form of very fine powders. This made the problem difficult. There were
also restrictions on the binder. A minimum of binder should be present
and ideally it should contain only carbon and hydrogen. Heavier elements
such as oxygen and fluorine present in many plastics would have interfered
with the scattering experiment.
Group WX-2 at LASL is a weapons group and part of our assignment is
the fabrication of plastic-bonded explosives. These are very highly filled
(binder lean) systems of fine particle size materials. We have developed
techniques for applying
molding powder and then
Thus the
think.
We
target program
were fortunate
plastic coatings to these materials to form a
pressing this molding powder into finished parts.
was not so foreign to our background as one might
to have a binder on hand that met the chemical
requirements and was a much better binder than polyethylene, an obvious
138

candidate. This material is Kraton 1101. It may not have been the best
possible binder but it had two outstanding virtues for this program. It
was available and we knew how it behaved.
Kraton 1101 is one of a group of thermoplastic rubbers made by
Shell Chemical Co. It is a block copolymer of styrene and butadiene in
a 30/70 ratio. It is soluble in toluene, chlorinated solvents and some
other solvents, and insoluble in water, acetone and alcohols. It has a
distinct softening point at about 100”C and becomes progressively more
fluid at higher temperatures.
DETAILS AND PREPARATION
Carbon Molding Powder
The 13C-enriched material was furnished to us as an extremely fine
powder. The small particle
standard slurry technique.
size made it necessary for us to modify our
In this preparation we first prepared a lacquer
of Kraton in toluene. The carbon powder was then added to the lacquer and
the resultant paste stirred and aged for about one hour. The paste was then
poured slowly into a container of well agitated water at 60”c. Stirring
was continued and the mixture was heated to 76°C where the toluene started
to distill. All the toluene was removed by about 85”c. At this temperature
the batch was cooled and the solids recovered by filtration. The resulting
molding powder was dried overnight in a forced draft oven at 65°C.
Quantities used for a 67-g batch of molding powder at a 92/8 - carbon/-
Kraton weight ratio were:
Kraton 1101 5.36 g made into lacquer in 100 cm3 of toluene
Carbon 61.64 g
139

The paste of the two materials mentioned above was poured into 400 cm~
3of water in an 800-cm beaker.
Silicon Molding Powder
The silicon powder was not as fine a
it had a different surface chemistry which
hot-water slurry process. To prepare this
particle size as the carbon but
would not allow us to use the
molding powder we took advantage
of the fact that Kraton is not soluble in acetone. A Kraton lacquer was
prepared and the silicon powder was stirred into it just as in the carbon
preparation. This paste was then poured into a large quantity of well-
stirred acetone. The acetone extracted the toluene from the paste particles
to give firm molding powder agglomerates. This powder was allowed to settle,
most the acetone and some fines were decanted, and the solids Were then
recovered by filtration. The filter cake was washed twice with acetone
to remove more toluene and then once with water to remove the acetone.
The finished powder was dried overnight at 65°C in a forced draft oven.
Quantities used for a 65-g batch of 92/8 - s~licon/KratonWere:
Kraton 1101 5.217 g in 60 cm3 of toluene.
Silicon 60.0 g
The paste of these materials was poured into 600 cm3 of acetone in
a l-liter beaker.
Pressing
Each of the above molding powders was ground to pass through a
20 mesh seive. The proper amount of the screened powder was poured into
140

the die and very carefully leveled. This step is important because at
these high loadings the material will not flow when it is pressed, it
merely consolidates in place. Thus uneven powder distribution will yield
a final part with large density variations. After the powder was leveled,
the top punch was lowered onto the powder and the entire die was placed
in a 140°C oven to heat. When the die temperature reached 130”C, it was
transfered to the press. Pressure ~ras applied in several steps with the
pressure being reduced to zero after each step. When the final pressure
of 5400 psi was reached, it was maintained until the die had cooled to
about 50”C. At this temperature the Kraton is no longer mobile and the
die was disassembled and the part removed.
l!he die was a heavy, bolted picture frame resting on a bottom punch.
The top punch was a rectangular plug. All the interior surfaces were
polished to a 16 micro-inch finish and none of the parts stuck despite
the fact that no mold release was used.
CONCLUSION
This is not presented as an optimum preparation, rather it is a
description of a process that yielded usable parts for a program that had
to be completed in a very short time.
141

THICK TARGETS FOR IN-BEAM HYPERFINE STUCTURE STUDY*
T. Minamisono+ and D. RamsayDepartment of Physics, Stanford University
Stanford, California 94305
Production of nuclear polarization is the first step in the study of hyper-
fine structure (H.F.S.) detecting nuclear radiations. This is possible by
1employing nuclear reactions initiated with polarized and unpolarized beams2.
Once the polarization is produced, our concern is its preservation during the
nuclear lifetime of the specific state we are interested in and to keep the effect
given from the electromagnetic perturbation fields.
Our specific interest was in the &emitting nuclei with lifetimes of a few
seconds, which were produced by the (p,n) , (p,a) , (d,p) and (d,n) reactions
initiated with fast polarized beams accelerated by the tandem van de Graaff at
Stanford University. The typical beam energy was 5 - 15 MeV with a beatn inten-
sity of = 10 na.
The polarization of the incident beam was transferred to the product nuclei-
the polarization was detected by measuring the 13-decayup-down asymmetry along
the polarization produced (Fig. 1). The energy of the B-rays was higher than
several MeV. A typical counting rate of 103 - 104 C.P.S. with 10% &asYmmetrY
was observed using a thick target.
In order to take advantage of the above experimental conditions, the targets
must satisfy several conditions. They must be thick enough to stop every product
nuclei and also stop the beam to utilize all available energy. They must be of
high purity to retain product polarization since there is a spin-lattice relax-
ation process by which polarization is destroyed. It is known that paramagnetic
impurities shorten the relaxation time. Thus there should not be many paramagnetic
142

ions, or if produced, they should not remain long enough to shorten the relaxation
time.
They must be well annealed in order to take advantage of the crystalline
internal field. They should be kept at a specific temperature when in use to
protect the polarized element against the static and dynamic depolarization mech-
anisms caused by radiation damage. This damage should either be healed quickly
or frozen in a certain crystal site by choosing a suitable temperature. The
final site of the recoil implanted nuclei in the ionic sample should be a substi-
tution of the same isotope or other elements where the electronic configuration
is diamagnetic and stable. For this purpose, it is appropriate to choose a sample
in which an element with similar mass-weight recoil nuclei is included. Metallic
samples are known to be suitable as implantation media for a short–lived state.
This type of target has been well investigated and is used to keep the nuclear
polarization of the nuclear states with mini-second to a few seconds, by com-
.,bining with low temperature techniques.
The targets we used were metallic plate, pressed or fused polycrystals and
single crystals.
7Lithium metal: A slice was cut from an enriched block 10 mm x 10 mm x 2 mm
or = 150 mg/cm2 and kept in dry kerosene until ready to use. The surface was then
thoroughly etched in ethyl alcohol to remove residual oils and oxide. As men-
tioned above, the depolarization mechanisms are well known for the lighter element
metals and it is very useful for the polarization phenomena study to determine the
absolute polarization transfer in the present7Li(d,p)8Li reaction (Fig. 2).
Other examples are polycrystalline ZrB2 and single crystal Si and ZrB2“
Ionic polycrystals: The general procedure where one or both compounds were
water soluble, e.g
in air at % 100”C.
, Calcium bromide-Potassium bromide, was to dry them thoroughly
The materials were then suitably mixed and melted under an
143

Argon atmosphere in an Aluminum oxide crucible to form a chemical compound.
Reducing the temperature very slowly through the crystallization zone, a few
degrees
sample.
Another
to four
per minute, was effective in preserving greater polarization in the
If practical, the resultant sample may be sliced to target thickness.
method was to grind the crystals with mortar and pestle. Then, three
hundred milligrams of the powder was pressed between two stainless steel
plates (Premier Brand Ferrotype) at about three tons per square inch3. The
resulting two cm diameter disc was trimmed at the edges to one and a half cms
and mounted with Zipbond contact cement on a Tantalum split-ring holder
(Fig. 4 a, b). The typical final target thickness was 100 - 150 mg/cm2.
In cases where the compounds were not water soluble, the fine powders were
thoroughly mixed and dried by heating in vacuum before melting or fusing. When
the pressed discs were too fragile to mount, as with Magnesium oxide-Aluminum
oxide, the mixture of the power of 1 Urn diameter grain was heated to = 100”C on
a hot plate and treated with two to five drops per side of a polyethylene-xylene
solution (1 mg to 1 ml) and allowed to dry under a fifty ml beaker. This made
them mechanically strong enough to handle. When the compound was reactive to
either oxygen or water, the target was prepared in a glove box under dry Argon.
The powder was sandwiched between two Tantalum foils .0025 mm thick, separated
by a glass ring spacer 1.2 mm in diameter by 1 mm thick, and sealed vacuum tight
with fast-setting epoxy (Zynolyte brand) (Fig. 4 c). The energy of the incident
beam of particles and the B-rays were = 10 MeV and > 2 MeV respectively and can
penetrate the window.
4Single crystal targets Li103 , Si,KCaBr 4
3’KBR,CaF, and MgF
2were prepared
for the hyperfine structure study of the associated elements. Slices 0.5 to 1.0 mm
were made with a diamond saw using light mineral oil as the lubricant. The
crystalline axes were selected to match the specific hyperfine study.
144

we have shown several examples of choosing a suitable target and preparing
it carefully, in which recoil implantation was possible and nuclear polarization
was kept for = 10 seconds (Figs. 2, 3 and Table 1) . Since we are able to produce
various polarized elements by imitating nuclear reactions with polarized beams,
there may be other ways to prepare targets which are suitable for specific
hyperfine studies.

*Work supported in part by the National Science Foundation
tOn leave from the Department of Physics, Osaka University, Toyonaka,
Osaka 560, Japan
REFERENCES
1T. Minamisono, et al. “Measurement of the Quadruple Moment of
8.— Li by Use of
a Polarized Deutron Beam and N.M.R. Detection,” Physical Review Letters 34,
1465 (1975).—
LE. Matthias and D. A. Shirley. “Hyperfine Structure and Nuclear Radiations,”North Holland Publ. Co., Amsterdam (1968).
3K. Sugimoto, H. Horie. Journal Phys. Sot. Japan 34, supplement (1973).
4M. Kusuhara. “A method for the Preparation of Dueterated Polyethylene Targets,”
Nucl. Inst. and Methods ~, 328 (1970).
4Synthesized by Dr. R. Feigelson, Materials Research Center, Stanford University.
146

[
.4
[
1.
4
.
:
‘1
Fig. I
\ Li Metal
103
( )
I !
I 2 31
TIME (see)
Fig. 2
[-Em.-?.
1 ml-1
I 1s?. nm)o
mm)●I
om (1)
.7.
tL,, r,},1
*ljlil IIT
1’1
‘1
I -
0 I
1010 I 03a I o=FRECUENCY( hHz)
Fig. 3
147

-.:. -.. .. . . ..-.1,,-.+~. . .- “=~ :. },*
-. — —,. — ..- ---
z!
EijIi!P.! . . . . . ... . . . .. . _ _ .._ .i11!1:11111111111111;Illlltll lllllll;lll’ 1[1’l’l’tll
JJ
148’
c

<
c
\!
-.+m
l-l04
coc-i
Ez
.i-
KJ
mm-d
In
K1
r-l
1=
A
m.
m1C4
o-l
r4-2.m-dm
(IJ
m
+-+-1
+?1
.-
m.
4I&m04-2G-riCn
mm
A2rn%$4v-do-
l
0-l
m.
w
+-*I04
0-l
N
U).
I

A ~PID AND ACCURATE METHOD FOR MEASURING
THE THICKNESS OF EXTREMELY THIN TARGETS
Peter Maier-Komor
Physik-Department, Techn. Universitat Miinchen, Germany
ABSTRACT
With
ness
With
carbon as an example the possible accuracy of the thick-
measurement of light transparent foils is demonstrated.
a quartz prism-spectrophotometer the transmission
characteristics of carbon foils in the energy range of 200 -
2500 nm was investigated. The transmittance as a function of
carbon foil thickness was measured at different wavelengths.
With these data the absorption coefficients and the reflectivi-
ties of carbon foils were calculated.
Knowing these optical constants for one wavelength it is easy
to calculate the absolute thickness of a carbon foil by mea-
suring only its transmittance for this monochromatic light.
With this method carbon foils were investigated grown on
different parting agents, to see if there might be an epi-
taxial effect, giving different crystalline clusters in the
almost amorphous carbon foils.
INTRODUCTION
The necessity of precise thickness measurements of thin car-
bon stripper foils is shown on the example of a Lamb shift
experiment with hydrogen like S-ions. The current of the
hydrogen like S-ions should be very stable compared to the
current of the most probable charge-state. The problem is
that the charge-state distribution varies rapidly with the
150

stripper thickness at the extreme charge states. S–ions cause
high migration in the stripper foils which requires to
exchange frequently the stripper foils of nearly the identical
thickness. The required carbon thicknesses are 3 - 6 ~g/cmz.
To estimate the thickness gravimetricly we have a Mettler
ME 21 electronic vacuum microbalance. If you cut the target
out of the frame, the error of the total surface area will be
about 10 % for very thin foils, and if you weigh the frame
without and with the foil, the error will be about 0.5 ~g/cm2
because of adsorption and resorption effects. So, both me-
thods have an error of about 10 % for a 5 ~g/cm2 foil and are
very tedious and time consuming.
X-ray, 0( - or 8 - absorption are all ruled out due to their
very low absorption. There is at present no theory, which
well describes the energy loss distribution of light ions in
extreme thin foils, because the effect of resonance collisions
with bound atomic electrons cannot be calculated with good ac-
curacy.
Heavy ions cant be used due to the charge-state distribution
shift.
Rutherford scattering of light ions is a good method to deter-
mine the areal density of such thin foils. But you need a small
accelerator, and this method is also very time consuming.
We investigated a very old method which is mostly used for
only semi - quantitative measurements ‘).
The diagram in these papers shows that light absorption is
very sensitive for carbon foils in a thickness range from
5- 50 ~g/cm2. But this diagram itself is not useful for
quantitative information, because the light meter is not cali-
brated and the
last not least
how the carbon
wavelength range of the light is unknown. And
the thickness calibration might be just report
foils of Oak Ridge behave.
151

THEORY
Absorption of monoenergetic light in matter is described by
Beer’s law. The transmitted intensity IT is equal to the in-
coming monoenergetic intensity 10 multiplied with the expo-
nential function of the absorption coefficient ~ and the
foil thickness x (fig. 1).
Vac urn
constants:
IT=Io.e-~x
.[n5,.-p.x10
Surface: 1 jR1=(ll-l]2*k2R = (1-n]2
[n.l)z .k2 21iT7
l~=lO(l-R1)(l-R2).e-~X
Doub[e Reflectance: RR=l-(l-RIH1-RZ)
lnq=-Px+ln(l-R~)10
n=lk=O
Fig. 1: Calculations of transmittance and double reflectance.
Using this law for the transmittance of monochromatic light
through a thin foil you cant neglect the reflectivity at the
foil. The reflectance can be calculated using the optical
constants: refractive index n and absorption coefficient k.
At both boundaries occurs reflection.
152

At the first surface the reflectance is (n-1)2 + k2‘1 =
(n+l)2 + k2.
At the second boundery the reflectance is R2 = (1-n)2
(l+n)2.
Of course there is also a reflection component of the reflected
intensity IR2 at the first surface but for high absorption
coefficients k one can neglect this contribution to the trans-
mitted intensity IT. All light scattering in the foil is neg-
lected, which is a good approximation for nearly all thin foils
measured with a commercially available spectrophotometer with
its big acceptance angle of the collecting mirror.
The transmitted intensity through a thin foil is
IT= 10 - (I-RI) . (1-R2) . e-~x. ~ and k are both the absorp-
tion coefficient but only with different dimensions, we will
[1use for~ the dimension ~~ .
Later we will notice, that the transmittance as a function of
foil thickness yields a term of reflectance at both surfaces.
This double reflectance is RR = I-(l-RI) . (1-R2). The finite
equation is now ~n>=-p” x + in (I-RR).10
With this equation it should be easy to measure the thickness
of a target foil: one just need a spectrophotometer and data
on n and k out of the literature. But the literature is very
poor on optical constants for carbon.
A. Cosslett and V. E. Cosslett 2, measured the variation of
optical absorption with thickness of evaporated carbon films,
1- 30 ~g/cm2 thick.
They saw no constant absorption coefficient for the different
thick carbon films. One reason for the results of Cosslett
could be, that the surface of the carbon has a different
physical behaviour due to adsorption. This would be surprising
for me. Carbon is such an active material that foils of target
753

thicknesses up to 100 or 200 pg/cm2 should completely adsorb
through the whole thickness. The main reason seems to be that
the optical constants depend on the electronic structure of the
carbon or graphite crystals. The crystalline structure of car-
bon films might depend on thickness.
Taff and Phillip 3, have investigated the optical properties
of carbon in a natural graphite crystal, a pyrolytic graphite
sample and mechanically polished glassy carbon sheet.
Fig. 2 shows their two limits of possible reflectivity of a
carbon surface. The curve for natural graphite and pyrolytic
graphite is nearly identical. The reflectivity of glassy car-
bon is generally lower. Glassy carbon exhibits no distinct
crystal structure, it is almost amorphous.
Di Nardo and Goland 4, investigated the optical properties of
a 6 to 7 ~g/cm2 carbon foil prepared on potassium hydroxide
as parting agent in the wavelength range 2200 ~ - 5800 ~. They
compared their results with the data of Taft and Philipp.
I calculated the double reflectance and the absorption coef-
ficient from their data (fig. 3). The absorption coefficient
is shown in fig.[1
3 only with the dimension ~ for there was2
no information about the specific gravity of the materials.
The optical constants of their carbon foil-investigated-lie
between the data of graphite and glassy carbon.
154
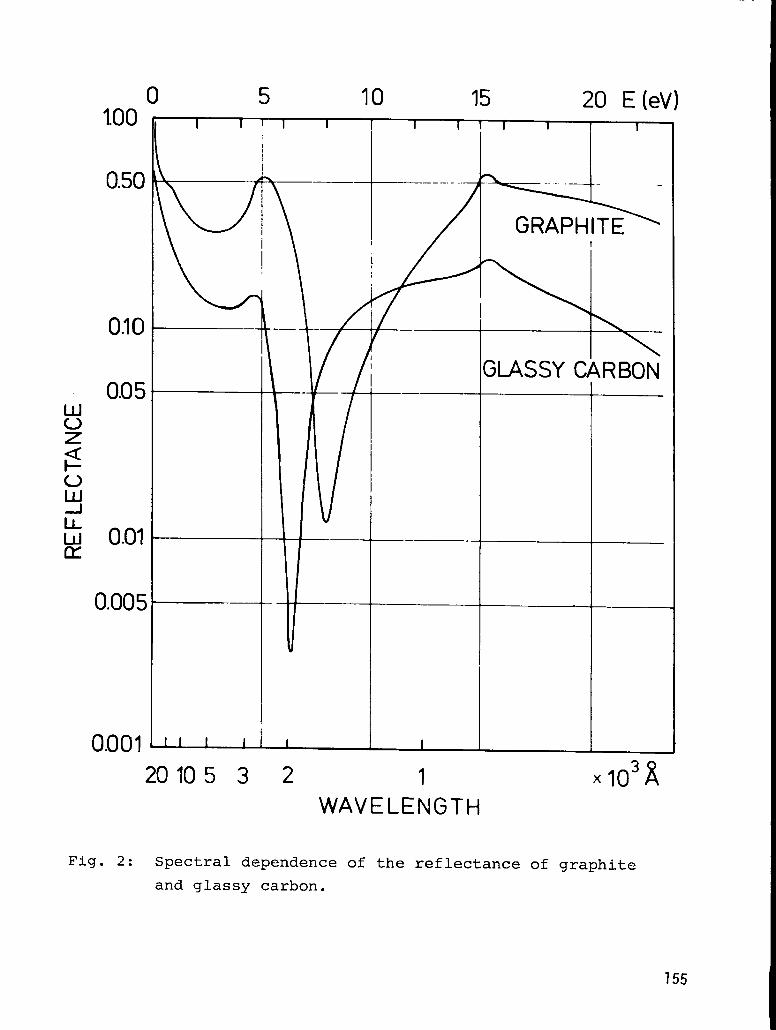
1.00
0.50
0.1o
0.05
0.01
0.005
0.001
0 5 10 15 20 E(eV)I 1 I I I I I 1 I I 1
II
\ u / —
— —
t
1 I 1 I I I
20105 3 2 1
WAVELENGTH
Fig. 2: Spectral dependence of the reflectance of graphite
and glassy carbon.
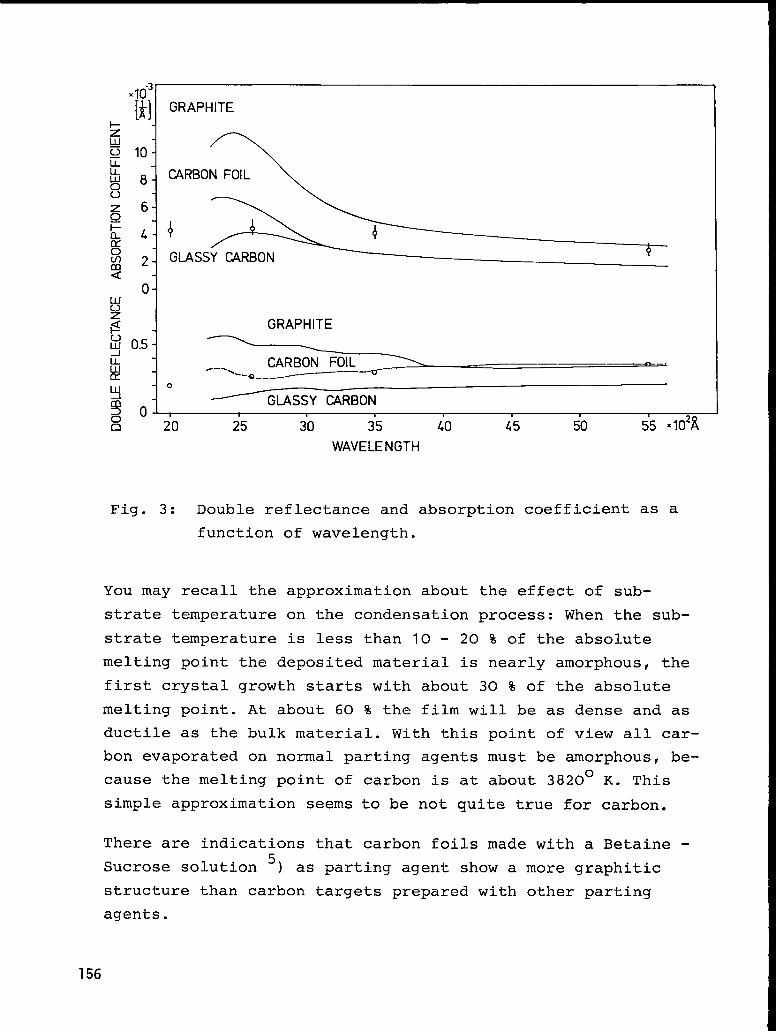
GRAPHITE
7CARBON FOIL
+
GLASSY CARBON +
GRAPHITE
CARBON FOIL~—.“-a__ —.--— ——-u-
Y: 0~o. , ~GLASSY CARBON
n 20 25 30 35 40 45 50 55 ‘lo2a
WAVELENGTH
Fig. 3: Double reflectance and absorption coefficient as a
function
You may recall the
strate temperature
strate temperature
of wavelength.
approximation about the effect of sub-
on the condensation process: When the sub-
is less than 10 - 20 % of the absolute
melting point the deposited material is nearly amorphous, the
first crystal growth starts with about 30 % of the absolute
melting point. At about 60 % the film will be as dense and as
ductile as the bulk material. With this point of view all car-
bon evaporated on normal parting agents must be amorphous, be-
cause the melting point of carbon is at about 3820° K. This
simple approximation seems to be not quite true for carbon.
There are indications that carbon foils made with a Betaine -
Sucrose solution 5, as parting agent show a more graphitic
structure than carbon targets prepared with other parting
agents.
156

EXPERIMENTAL AND RESULTS
With an electron gun evaporator we produced carbon foils of
various thicknesses up to 150 ~g/cm2 on two different parting
agents. One parting agent was Betaine-Sucrose, the other was
NaF, which was evaporated just before the carbon evaporation
on microscope slides in a thickness of about 50 ~g/cm2. The
carbon source substrate distance was 50 cm. The thickness
measurements were done with a well calibrated Kronos quartz
thickness monitor. The carbon foil thickness calculations
were done with the approximation of a carbon poi’nt source
(about 3 mm in diameter) and equal sticking coefficients for
the not cooled quartz and the substrate surface.
With a Zeiss quartz prism-spectrophotometer PMQ3 we measured
the transmittance as a function of wavelength from 2000~ -
25000 ~ Shown in fig. 4.
a) is the curve for a carbon foil 10.6 ~g/cm2 thick grown on
Betaine - Sucrose as parting agent
b) is the curve for a carbon
c) is the curve for a carbon
ducts of Atomic Energy of
foil 11.2 ~g/cm2 thick grown on NaF.
foil bought at Commercial Pro-
Canada Limited. The thickness of
this foil should be 10 ~g/cmz + 20 %. If this foil does not—behave too different from our foils the thickness was about
14 ~g/cm2.
In general you see, if you want to measure the thickness of
thin carbon foils you should do this at short wavelengths. But
one can measure the thickness of thick carbon foils at long
wavelengths where the foil would be opaque for short wavelengths.
157

0.40
0.35
0.3C
025
Q2C
0.15
O.lc
0.0:
0025 10 15 20 25 X103~
WAVELENGTH
Fig. 4: Spectral dependence of the transmittance for three
different carbon foils in the 10 ~g/cm2 range.

In fig. 5 is shown the transmittance as a function of carbon
foil thickness for 4 wavelengths. The full circles are for car-
bon foils made on Betaine - Sucrose. The open circles are for
foils made on NaF. The lines are fitted through the points for
the Betaine made carbon foils.
The points for the NaF made carbon foils would give their own
line with nearly the same gradient, but with less double re-
flectance, which can be seen at the extension of the line to
zero thickness. The dashed lines with the higher gradient
show the tunnel effect for light. This effect starts ap–[1proximately at a thickness X ‘~2 = ~ [X] ,
which sug-cm 138
gests that one should not measure carbon foil thicknesses in
this range.
For the longer wavelengths, the measured points do not lie
perfectly on the fitted line. This means that different cry-
stalline structure shows more effect at this long wavelengths.
If the crystalline structure is dependent on evaporation rate
we can explain the deviations at the long wavelengths, be-
cause we did not try to get the same evaporation rate for
every carbon foil.
Fig. 6 shows the same functions for shorter wavelengths. The
tunnel effect cannot be seen, because we did not produce such
thin foils. Here the full circles are nearest to the fitted
lines at 3500 ~ and 5500 ~. From 2000 ~ to 3500 ~ there is
nearly no difference between the open and full circles, which
suggests that the optical constants are not sensitive to a
different crystalline structure, which seems to be in no good
agreement with the data of Di Nardo and Goland (fig. 3) . The
circles in this diagram are our calculated data in this region
for carbon foils on Betaine - Sucrose. To get the absorption
[1coefficient in the dimension ~ we used a value of 2 for the
specivic gravity. 2
159
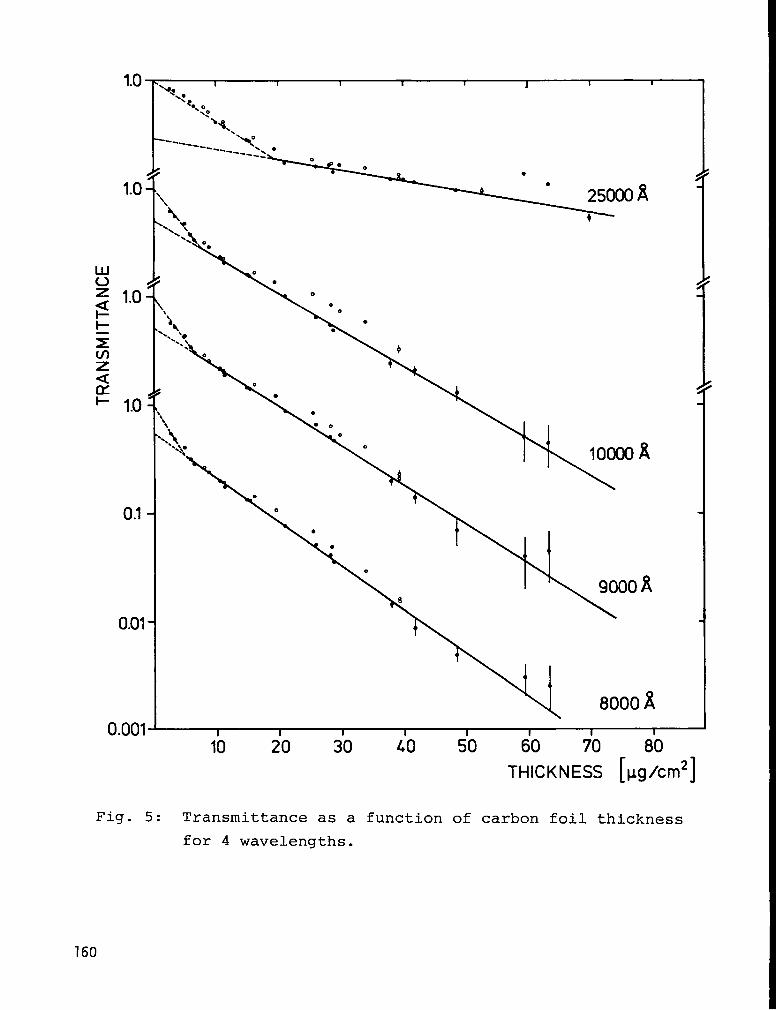
1.0 -.** I 1 I I I J 1 I-,*N*.~*.:
w------ “k” .
-----.--*>
●
wu~ 1.0++5u)zu* 1.0 ‘.
+.,.x
0.1-
0.01-
0.001 I I I I I I I I10 20 30 40 50 60 70 80
THICKNESS [pg/cm2]
Fig. 5: Transmittance as a function of carbon foil thickness
for 4 wavelengths.
160
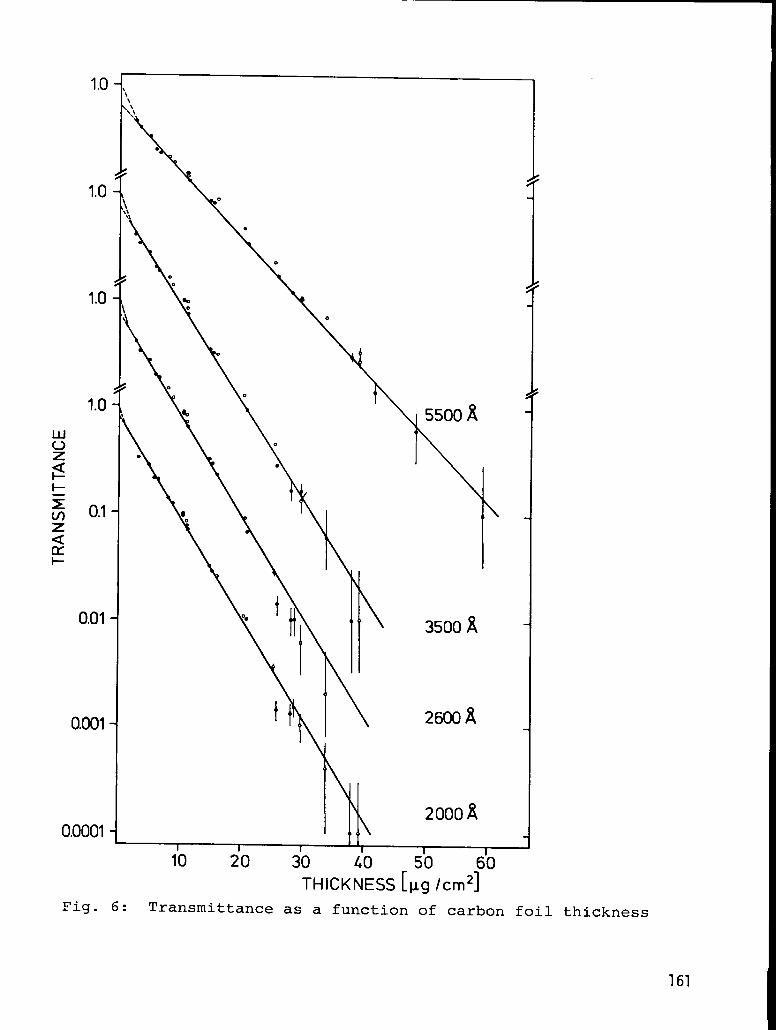
1.0
1.0
1.0
0.001
0.0001
\\‘.:t
\
.
.
“vi V I 5500A
\A“*
tt
I II
\
II
3500 A
26008
\ 20008,
I I I I
10 20 30 40 5’0 6’()
THICKNESS [~g /crn2]
Fig. 6: Transmittance as a function of carbon foil thickness
161
If we use the specivic gravity of 2.25 for graphite and a
specivic gravity of 1.3 + 0.1 for the carbon foil, which is—
a value of amorphous carbon the curves for the absorption
coefficients of graphite and carbon foil are nearly identical.
This means that the cyrstalline structure is of nearly no
consequence for the absorption coefficient in this wavelength
range. Now the measurements of Di Nardo and Goland give with-
in the errors the same results than our data.
For our carbon foils the data are most precise in the wave-
length region from 3500 ~ - 8000 ~. The absolute thickness is
correct within 5 %, but the main advantage of this method is
that the relative thickness is correct within 0.5 %, which
means for example one can distinguish between a 5 pg/cm2 and
a 4.98 ~g/cm2 carbon foil.
What one can learn for carbon foil production is: The parting
agent may influence the crystal growth in the carbon layer.
The carbon foil should be more stable if it is more like gra-
phite, this means let us surch for parting agents which give
more double reflectance.
162

REFERENCES
1) Adair H.L. and Kobisk E.H. ,
P. 29 in Proceedings of the conference of the Nuclear
Target Development Society, Argonne 1975.
2) Cosslett A. and Cosslett V.E.,
Brit. J. Appl. Phys. 8, 374 (1957).
3) Taft E.A. and Philipp H.R.,
Phys. Rev. 138, A 197 (1965).
4) Di Nardo R.P. and Goland A.N.,
J. Opt. SOC. Am. 61, 1321 (1964).
5) Maier-Komor P.,
Nucl . Instr. and Meth. 102, 485 (1972).
763

PRODUCTION OF FRACTIONAL ATOMIC LAYERBy acceptance of this article, thepublisher or recipient acknowledgesthe U.S.Government’s right to STANDARDS OF NIOBIUM AND VANADIUM*retain a nonexclusive, royalty-freelicense in and to any copyrightcovering the article. G. E. Thomas and P. J. Dusza
Argonne National Laboratory, Argonne, Illinois60439
ABSTRACT
In controlled-fusionresearch, one method of determining surface
effectsis tomeasure the sputteryieldsof high-energy ions and neutrons for
various solids. Due to the low-atom-displacement cross sectionsfor these
processes at high particleenergies, only fractionalatomic-layer deposits
can be collectedin reasonable irradiationtimes. Quantitativeanalysisof
these collectorsisbest done by comparison with standards of comparable
thickness. To produce such standards a modified Pierce-type electron-beam-
gun evaporation system with a thicknessmonitor was used. An “accurate”
Nb standard of O. l-monolayer deposit thickness was prepared by evaporation
under cent rolled conditions. Nb standards of 1. 1 , 0. 11, and O. 011 monolayer
were produced in a single evaporation. These standards were then calibrated
to the “accurate” standard. The errors quoted do not include those associated
with the monitor its elf. The relative accuracy of the standards was verified
by Rutherford backscattering and ion micro-probe measurements. Standards
of Nb and V on single-crystal Si substrates were produced.
‘Work performed under the auspices of the USERDA, Division of Physical
Research.
164

Most of the targets which are produced at the Physics Division
target-fabrication facility at Argonne National Laboratory are used in basic
research experiments. The very thin fractional-atomic-layer targets
described in this paper were used in an experiment which yielded valuable
information for the fusion power program. We will first briefly describe
this experiment, then present the method of fabrication of the targets,and
finallydiscuss the techniquesused to determine the targetthicknesses.
Experimental Arrangement
A t Argonne National Laboratory Kaminsky, Das, and Dusza
are performing experiments in which they are studying surface effects related
1to controlled thermonuclear devices. One aspect of this research deals with
measurements of sputter yields of high-energy ions and neutrons for various
materials, such as niobium, which might be
vessel cr other fusion-reactor components.
used for the plasma-containment
The experimental arrangement
for neutron-sputteringmeasurements is shownin Fig. 1. Neutrons with energies
of 14.1 MeV from the Lawrence Livermore Laboratory Rotating-Target
Neutron Source2 strikethe target,cause the release of atoms from the target
which in turn are collectedon silicondiscs placed on eitherside of the target.
Because of the low neutron fluenceand of the low cross sectionfor the
displacement of atoms by 14.1-Me V neutrons, only fractionalatomic layers
of material can be collectedin a reasonable irradiationtime and since sputter
yieldsare determined by measuring the amount of targetmaterial collected
on the silicondiscs, theanalyticaltechniquesused had to be calibratedwith
fractional-atomic-layers standards.

Three “relative” standards were first produced using the config-
uration shown in Fig. 2 inwhich the siliconsubstrateswere respectively7.0 cm,
22.1 cm, and 70.0 cm from the niobium evaporation source. The Kronos3 quartz
thicknessmonitor was also 7.0 cm from the source. Using thisgeometry with a
4Pierce-type electron-beam-gun evaporator,
2a thicknessmonitor depositof0.23 Pg/cm
produced a self-consistentset of substrateswith niobium depositsof 1.1,0.11 and
0.011 monolayer standards in one evaporation. . As a result, there was
excellent intercalibration between these three standards; the thickness of the
deposits relative to each other are known with an accuracy of 57’0.
A more accurate O. 1 monolayer niobium standard was then produced
with the thickness monitor 10 cm, and the target substrate 70 cm distance
from the evaporation source. At these distances the evaporation produced both
a O. l-monolayer thick deposit on the target and a deposit thickness on the
2monitor of O. 97 pg/cm , sufficient for good statistical accuracy. This
“accurate” standard was then used to calibrate the thickest “relative” standard
and in turn it was used to calibrate the other two “relative” standards.
Deposit Thickness Determination
We set out to quantitativelycalibratethree techniques (schematically
shown inFig. 3)used for depositthicknessmeasurements. The most
successfultechniquewas Rutherford backscantering,shown schematicallyin
Fig. 4. A collimatedbeam of 1.5-Me V 4He+ particlesfrom a 2-Me V Van de
Graaff5 struck the standard, and the particleswhich were scatteredat 90°
were detectedby a silicon-barrierdemce. A typicalenergy spectrum as
recorded on a multi-channel analyzer is shown in Fig. 5. As can be seen in
166
the figure, the helium atoms which were scattered from the niobium had much
mor e recoil energy than those from the lighter silicon atoms. The good
resolution of the niobium peak indicates there was very little straggling while
the broad continuum results from considerable straggling and multiple scattering
of particlesoffof the siliconsubstrate. The background intensityin the area
under and near the niobium peak is largelydue to pulse pileup from the silicon
substrate which, in part, limits the sensitivity for detectixg niobium.
Most of the niobium-standard values plotted on the thickness-versus-
intensity graph of Fig. 6 fall within error for a good line fit. Note the position
on the graph of the “accurate” standard.
The second method tried was that using an Auger Electron
Spectrometer (AES). Although this method has sufficient sensitivity to measure
these standards, it was not relied on for quantitative data because the few
monolaye rs of carbon and oxygen surface contamination attenuated the niobium
signal. Sputter cleaning, which is usually used to remove such contamination,
would probably have also removed some of the niobium.
The third method was that using the Ion Microprobe Mass Analyzer
(IMMA) and is shown in Fig. 7. With this method a 10-vm-diameter ion beam
(e. g. 20-keV 0-) was rastered over a target surface area of 200 pm X i60 pm.
Some of the sputtered target material was then mass analyzed, producing the
niobiti spectrum in Fig. 8. The iron contaminant was probably picked up
during vapor deposition. Next, a depth profile of one mass was obtained by
setting the analyzer at the mass of interest (93 for Nb) and noting the intensity
as a function of time, while sputtering. Figure 9 shows intensity curves
for several niobium standards.
167

Errors
The errors associated with the various standards
are shown in Table I. The distance error includes the position of both the
standard and monitor in relation to the evaporation source. The monitor thickness
error of one Angstrom is used only when determining the “accurate” standard
accumulative error. In Fig. 6, the vertical error bars are those associated
with systematic errors and the horizontal error bars are those associated with
statistical errors.
Summary
Fractional atomic layers of both niobium and vanadium have
been produced using the e-gun system. By determining the thickness of the
“accurate” standard with greater statistical accuracy and by reducing the
“pile-up It backgro~d, itwould be possibleto produce mm-e accurate and also
possibly thinner standards.
Acknowledgments
We would like to thank Dr. M. S. Kaminsky for his continued
interest in this project. We would also like to express our appreciation to
Dr. G. T. Garvey for his support of the target-fabrication facility.
168

References
1Manfred Kaminsky, CRC Critical Reviews in Solid State Sciences,
~ (4), 433–457 (Aug. 1976).
2R. Booth and H. H. Barshall, Nucl. Instr. and Methods, fi (1972).
3Kronos film thickness monitor model QM 321, Kronos, Inc. represented
by Veeco Instruments, Inc. , Arlington Heights, Illinois.
4Electron beam gun system, model VeB-6, Veeco Instruments, Inc. ,
Arlington Heights, 111.
5High Voltage Engineering type JN.
1.
2.
3.
4.
5.
6.
7.
8.
9.
Figure Captions
Configuration for sputtering niobium or silicon substrates.
Set-up for evaporating materials on silicon substrates.
Systems for measuring target thicknesses.
Rutherford backs cantering schematic.
Niobium energy spectrum from Rutherford-backscattered
Intensity curves for various thickness niobium targets.
alpha particles.
Ion microprobe used for measuring
Mass spectrum of niobium standard
Curve of intensity versus thickness
various standards.
target thicknesses.
target using ion microprobe.
using the ion microprobe for
Table
i. Niobium standards showing error sources.
169

TABLE I
Niobium Standards
Errors (’?70) Estimated
Distance, Thickness; Accurate Std. Accumulative
(monola yers ) (Monitor ) Error (~o)
Thickness
Accurate Std.
0.1 2.0 10 12
Relative Stds.
i. 1 4.0 40 12 15
0. Ii 3.0 40 12 15
0.011 3.0 40 12 15
0.0022 3.0 100 12 15
aMonitor thickness error used for accurate std. error calculation only.
170

NEUTRON SPUTTERING CONFIGURATION
*14.1 MeV -
MONO-ENERGETICNEUTRONS
Fig. 1
ELECTROhGUN\
—
T2.5cm Dia.
-LNb
‘cl ‘a~‘x?PNb PELLET
oL_L!!-J”SCALE (cm)
QUARTZTHICKNESSMONITOR
Fig. 2
777

AUGER SPECTROSCOPY
ELECTRON BEAM (e.g. 5keV)
SECONDARY ELECTRONBEAM, ENERGYANALYZED
BACKSCATTERED PRIMARY10?S, ENERGY ANALYZED
ION MICROPROBE
ION BEAM (q. 20keV ‘60-)
,
Fig. 3
RUTHERFORD BACKSCATTERING CONFIGURATION
BIASEDAPERTURE
L5MeV -4~e+
IDETECTOR
MULTICHANNELANALYZER
CURRENTINTEGRATOR
I-L=
.
Fig. 4
172

RUTHERFORD f2ACl:SCATTERlh!G SPECTRUM0.01 MONOLAYERS Nb ON Si (Ill)
.$2c
:u
>1- vt.--\_,_e_d__d_/..
Gzw
‘,”! ~~X250
t-Z
.“./. . ...“ :..:... . .,.. . ..-..........-”.0. .“..)”:*t>”..:/..”o...
“., .#“/........v.t I I , I
0.8 1.0 ‘Si 1.2 %’
4He ENERGY (McV)
Fig. 5
‘1—T~r~l 1 1 1 1 I
CALIBRATION CURVER.B. S. BY 1.5 MeV %{e+ {
SCATTER ANGLE 90”
0 ACURATE STANDARD
7 A “RELATIVE” STANDARDS /1
o.ool~.~~ d- _.l_l_Ll.JIJJ.J105 106 10’ I08
COUNTS/COULOMB
Fig. 6
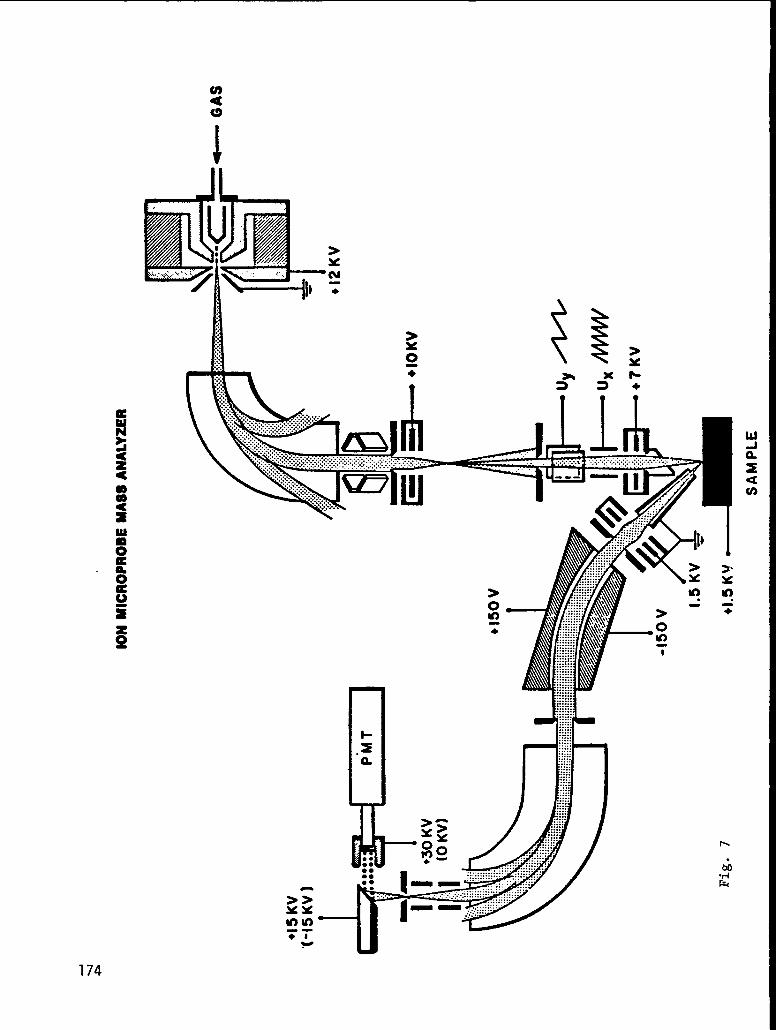
n+
--. –
Ni
0U37
7F......:::::::::::..................::::::..............:::::....;:::.::::::::.
- L~~.x
:::::;::::..:::::a ::::::::::::....:::;::::.:::.:::.::::;:::....;:::.::::
>- ....::::S@ .::::.....::::go
.::::........;::!..,.. ,: :::.
:: ● - .:, .; ::;. ..”● 9
.. :::. .. ::::, . .
I.......,:::::..............
● 0 . . . . . . . . . . . . . .:, ::.......
● 0.: ;.. ..:.
.- ~ .:::,:: ..:::.
... . . . . . . . . . ., .::..: .,. .. . .: ..., ., . . . . . .... ... . . . . . . . . . .
$2 I.....,- ~ ,::::;:;:;;”:””
mm”.....’.2.. . . .
.-*1
GWIE-4
Ui
174

ION MICROPROBE SPECTRUM OF NEUTRON-SPUTTERED
Nb DEPOSITE ON Si(lll) SUBSTRATE
28Si ‘3Nb
‘OgNbO
160
“Si++
\
L1 J L L .~v-_
44Si0
Y56Fe
~
MASS SCALE (m/s)
Fig. 8
I06 I I 1 I I I I I I I
VAPOUR DEPOSITED Nb STAN2ARDS
IMMA PARA!JETERS: EIEAhi DlA?4ETE!?,15.8pm
BEAMCURRENT. 8.5x169Af.?
RASTER AREA, 160x200pm5 105= -z =
[
0.1 ML
,- x> - I ‘\t- \G
\\\
zid
“<0.01 ML
: 104: -~1~ ./”-”\
:1\“\.\\\.\\r0.002 ML~’”--:~_- -UY. . !
103: I I 1 I 1 I I I I 14 8 12 16 20 24 28 32 3’6 40 44
TIME (sec~ld)
Fig. 9

THE ROLE OF AUGER ELECTRON SPECTROSCOPY AND SECONDARY ION
IN THIN FILM COMPOSITION ANALYSIS
by
R. W. Springer
Los Alamos Scientific Laboratory
ABSTRACT
MASS SPECTROSCOPY
Auger Electron Spectroscopy (AES), because of its surFace sensitivity, is
ideally suited to the elemental analysis of surface constituents. The technique,
when combined with ion beam etching techniques, allows depth profiles yielding
elemental distribution within the solid. Secondary Ion Mass Spectroscopy (S1}1S).,
naturally accompanies depth profiling as the sputtered ions are mass analyzed.
The SIMS spectra allow fingerprint analysis of the chemical state of the surface
by fragment analysis. The limits and sensitivities of these tools along with
recent attempts to quantify AES will be presented. Examples of application to
sputter profiling will also be discussed.
176

Preparation of self-supportingSilver Sulphide Targets
M.A. SAETTEL
Centre iz Recherches Euc16ai.res,~niversit~ Louis pasteur
Strasbourg, France
The sulphurizationof a thin silver layer is a technic which can be
used fur preparing self-supporting silver sulphide targets.
This paper describes a very simple method of obtaining self-supporting
sulphur targets composed of Silver Sulphide, which are stable, Of a fixed
composition, using only a small amount of sulphur.
The method can easily be used for preparing self-supporting silver
sulphide targets with isotonically-enriched sulphur.
1. INTRODUCTION
The preparation of sulphur targets is always difficult. The evaporation
of the element or the compounds (zinc or cadmium sulphide) by heating them
in a crucible, produces inhomogeneous targets, on account of the bad adherence
to the backing material, and the efficiency of the method is very low. On
the other hand, sulphur targets made from the element do not withstand the
impact of the bean from an accelerator.
Engelbertink and Ollness (ref.]) propose a method of preparation of
sulphur targets, by dissolving the sulphur in toluene and applying this
solution, drop by drop, onto a silver foil : the sulphur reacts with the
silver and produces silver sulphide. The reaction takes place at 60°C; at
this temperature, the toluene evaporates easily. We have tried this
method, but the homogeneity of the targets was not satisfying and their
thicknesses were difficult to standardize.
Watson gives
on a thick silver
supporting silver
another interesting method for preparing sulphur targets
backing. We have used the principle for obtaining self-
sulphide targets (ref.2).
777

2. PREPAIUTION OF SELF-SUPPORTING SILVER SULPHIDE TARGETS
- 2.1. Principle
The sulphur reacts easily with silver at 150”C. A thin silver
layer of a fixed thickness is placed above a small amount of sulphur, which
totally transfoms the silver layer into silver sulphide.
2.2. Procedure
The silver is evaporated by means of a tantalum crucible on glass-
slides covered with a layer of baryum chloride (about 50~g/cm2) The salt is
evaporated in the same vacuum enclosure as the silver. The thickness of the
layer is measured with a calibrated sensor head connected to a deposit
monitor during evaporation.
A small amount of sulphur (about 200pg) is placed in a tungsten
crucible covered with alumina. This type of crucible has been chosen, because
there is no reaction possible between the two materials.
The reaction takes place in a drying-oven at 150”C, where the silver
layer on the glass-slide is placed on the crucible containing the sulphur.
The distance between the silver layer and the sulphur is about 31’nmI.
The chemical reaction
2Ag + S + Ag2S
starts and a bro~inish stain appears on the contact glass side. When the
sulphur has completely passed through the silver layer, the target is bro~m
and the reaction can be considered as being finished.
If the silver layer remains too long a time upon the sulphur, the
target will increase in area, but will not contain an excess of sulphur.
The reaction takes place easily in an oven, when both, tlw sil~.rr
layer and the sulphur are at the same temperature. The sulphurization is KCYS
difficult in the atmosphere, when only the crucible containing the sulphur
is heated.
After about four minutes, a silver layer of 100~g/cm2 is saturated in
sulphur. The diameter of the target was about 10nun.
178
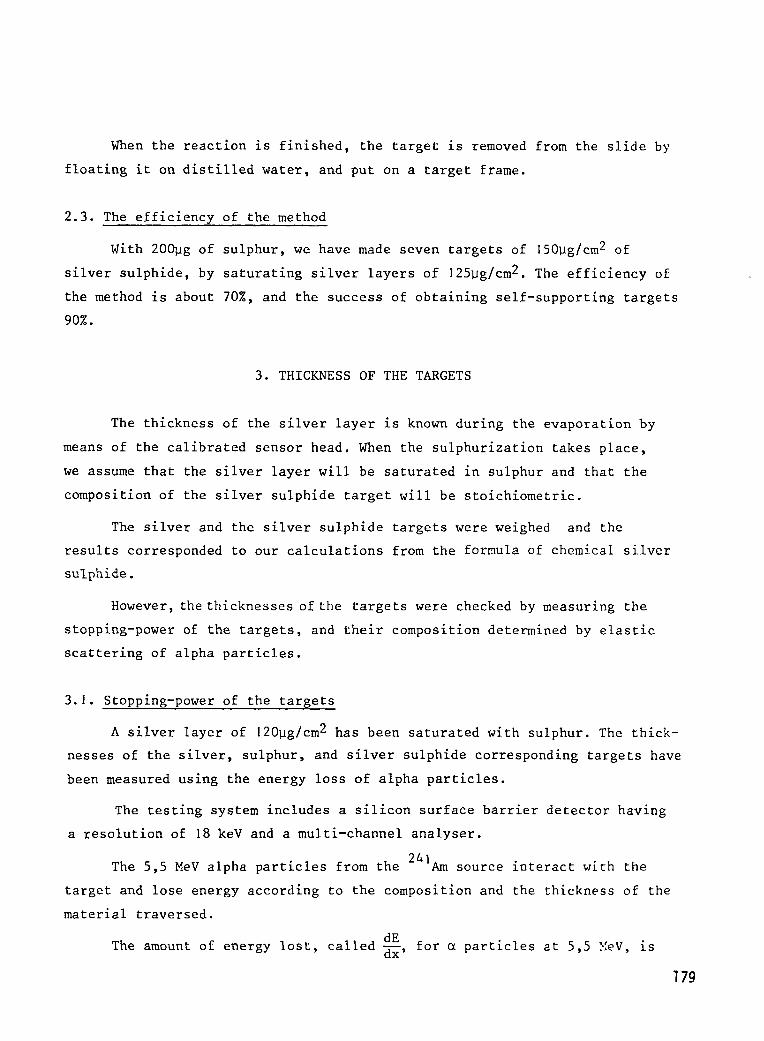
When the reaction is finished, the target is removed from the slide by
floating it on distilled water, and put on a target frame.
2.3. The efficiency of the method
With 200pg of sulphur, we have made seven targets of 150~g/cm2 of
silver sulphide, by saturating silver layers of 125Bg/cm2. The efficiency of
the method is about 70%, and the success of obtaining self-supporting targets
90%.
3. THICKNESS OF THE TARGETS
The thickness of the silver layer is known during the evaporation by
means of the calibrated sensor head. When the sulphurization takes place,
we assume that the silver layer will be saturated in sulphur and that the
composition of the silver sulphide target will be stoichiometric.
The silver and the silver sulphide targets were weighed and the
results corresponded to our calculations from the formula of chemical silver
sulphide.
However, the thicknesses of the targets were checked by measuring the
stopping-power of the targets, and their composition determined by elastic
scattering of alpha particles.
3.1. Stopping-power of the targets
A silver layer of 120~g/cm2 has been saturated with sulphur. The thick-
nesses of the silver, sulphur, and silver sulphide corresponding targets have
been measured using the energy loss of alpha particles.
The testing system includes a silicon surface barrier detector having
a resolution of 18 keV and a multi-channel analyser.
The 5,5 MeV alpha particles from the241
Am source interact with the
target and lose energy according to the composition and the thickness of the
material traversed.
The amount of energy lost, called ~, for c1particles at 5,5 YeV, is
179
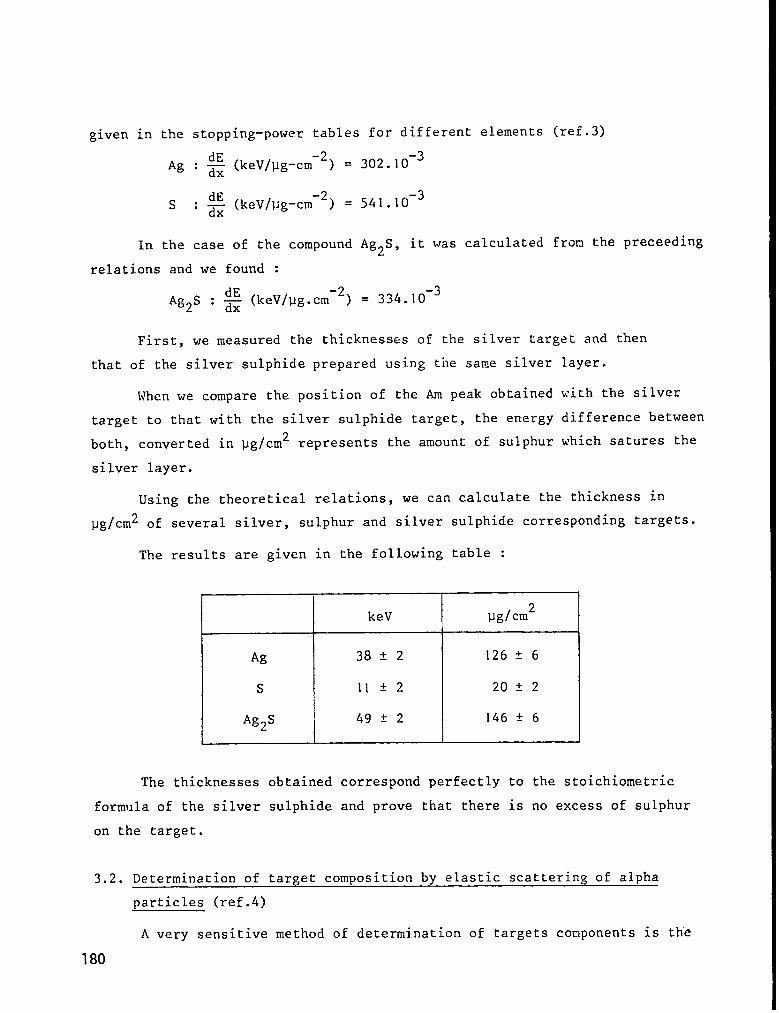
given in the stopping-power tables for different elements (ref.3)
Ag:~ (keV/pg-cm-2) =
S:g (keV/Pg-cm-2)=
In the case of the compound
relations and we found :
Ag2S : ~ (keV/pg.cm-2)
302. 10-3
541 .10-3
Ag2S , it was calculated fron the preceding
= 334. 10-3
First, we measured the thicknesses of the silver target and then
that of the silver sulphide prepared using the same silver
When we compare the position of the Am peak obtained
target to that with the silver sulphide target, the energy
both, converted in pg/cm2 represents the amount of sulphur
silver layer.
layer.
with the silver
difference between
which satures the
Using the theoretical relations, we can calculate the thickness in
pg/cm2 of several silver, sulphur and silver sulphide corresponding targets.
The results are given in the following table :
Ag
s
Ag2S
keV
38k2
II*2
49*2
pg/cm2
The thicknesses obtained correspond perfectly to the stoichiometric
formula of the silver sulphide and prove that there is no excess of sulphur
on the target.
3.2. Determination of target composition by elastic scattering of alpha
particles (ref.4)
A very sensitive method of determination of targets components is the
180

study of elastic scattering of charged particles. A knowledge of the energy
and the cross-section of the scattered particles permits qualitative and
quantitative analysis of the target. Quantities of element down to O,lpg/cmz,
as well as of trace elements can be detected through this process.
From systematic analysis of silver sulphide targets of 17 to 115 g/cm2,
we conclude that :
- the saturation of the silver layer with sulphur is independent of
the thickness of the former
- the only relative important contaminant present is 0,5pg/cxn2 of
oxygen for a target of 17Ug/cm2 on a 10pg/cm2 carbon backing
- and the targets are repro?uctible.
The energy and
alpha particles were
lisation detector in
the elastic scattering cross–section of 10 MeV incident
measured at an angle of 30° with a surface barrier loca-
the focal plane of a Buechner spectrometre.
Fig.] and 2 represent the spectra of silver sulphide targets with natural34sulphur and 80% enriched S respectively, obtained in the same experimental
conditions. That, about forty channels separate two neighboring peaks of.- .-.,3.Z
s
the
and “S, shows the precision of the method. The following table gives
values obtained :
Ag sS (theoretical
calculation)
1.Jg/cm2 Ug/cm2 ~g/cLi12 -
Spectre 1 19,9 2,9 3
I Spectre 2 I 17,2 I 2,9 \ 2,8 I
The results are compatible within IOZ of the stoichiometric composition
of the targets.
4. CONCLUSION
Unsing this method , we have made many self-supporting silver sulphide32S 34S and 36S
targets isotonically enriched with , .

The minimum
is about 60pg/cm2.
thickness Lllatis possible to proJtlctv:i:~;~utbilc;:i:ifi
of silver sulphide, which means, saturating a silver iayer
of about 50pg/cmz. Below this, the silver can be evaporated on a thin carbc~.
layer (for instance of 10Pg/Cmz) and it is sulphurized in the same \;ayas
described above. There does not seem to be an upper-limit fcr the target
thickness : self-supporting silver sulphide targets (sulphur conte~t being
3,52 enriched36
S), of 500 and 900pg/cm2 [;ereprepared witheut difficulties,
The targets were strong, stable, pure and needed for their preparaticr.,
a small amount of sulphur isotope, which in terms of the usual cost-price,
is nevertheless appreciable.
182

REFERENCES
1) G.A.P. Engelbertink and J.W Olness “Beta Decay of385,,
, Phys. Rev. C,
VO1.3, n“ 1, January 1971
2) D.D. Watson “Simple Method for Naking Sulphur targets”, Rev. of Sc. Instr.,
VO1.37, n“ 11, November 1966
3) C.F. Williamson, J.P. Boujot, J. Picard “Tables of Range and Stopping
Power of Chemical Elements for charged particles of Energy 0,05 to
500 lleV”, Rapport C.E.A., R 3042, 1966, Centre d’Etudes Sucl@aires de
Saclay.
4) The analysis of the targets was realized by B. Bilwes, Laboratoire des
Basses Energies, C R N Strasbourg
J83

FIGURE CAPTIONS
Fig.1 Position-Spectrum obtained at 30° by elastic scattering of 10 MeV
a-particles on a 17pg/cm2 natural silver sulphide target on a 10pg/cm2
carbon backing.
Fig.2 Position-Spectrum obtained at 30° by elastic scattering of 10 MeV
a-particles on 17pg/cm2 80% 34S enriched silver sulphide target on a
10pg/cm2 carbon backing.
184

150
“loo
SC
(n+ 150z30c-l
10[
5[
32~
I
1
1Ill I1500 T
II
I1
II
II
I1
II
FIG. 2 II
I
iiiii1
r
900
CtiANNEl_ NUMBER

REPRODUCIBILITY AND ACCURACY IN THE PRODUCTION AND THICKNESS MEASUREMENT
OF EVAPORATED CARBON FILMS*
John O. Stoner, Jr. and Stanley Bashkin
Physics Department, University of Arizona*
Tucson, Arizona
ABSTRACT
Although the optical and electrical properties of carbon films
evaporated from arcs in vacuo vary substantially with variations in——
technique, we have found it possible to monitor the thicknesses of
such films to indicate accurately (typically + 10%) their carbon content.
In order to develop films with surface densities greater than about
100ug/cm2, for which the optical transmittance is too small to be
used, we have used “witness” slides that indicate the amount of carbon
added to coatings initially having surface densities of 80-100 Pg/cm2.
*Supported in part by NSF, O!JR,and NASA
186
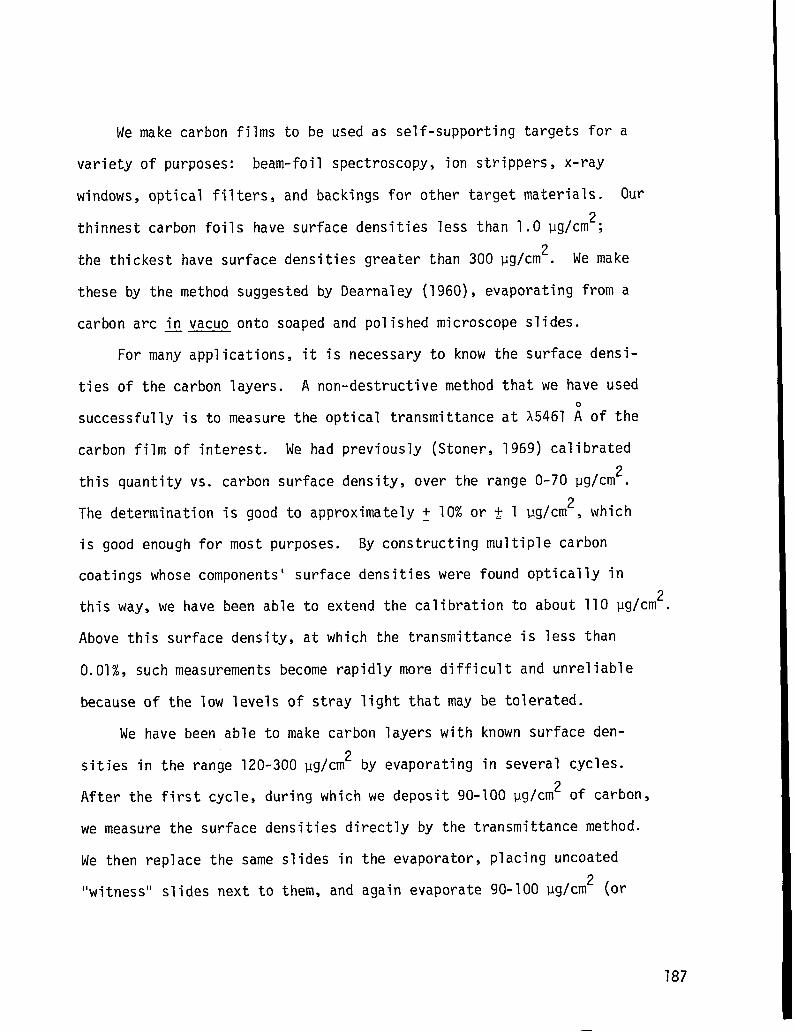
We make carbon films to be used as self-supporting targets for a
variety of purposes: beam-foil spectroscopy, ion strippers, x-ray
windows, optical filters, and backings for other target materials. Our
thinnest carbon foils have surface densities less than 1.0 vg/cm2;
the thickest have surface densities greater than 300 ~g/cm2. We make
these by the method suggested by Dearnaley (1960), evaporating from a
carbon arc in vacuo onto soaped and polished microscope slides.——
For many applications, it is necessary to know the surface densi-
ties of the carbon layers. A non-destructive method
successfully is to measure the optical transmittance
carbon film of interest. We had previously (Stoner,
that we have used
at A5461 ~ of the
1969) calibrated
this quantity vs. carbon surface density, over the range 0-70 pg/cm2.
The determination is good to approximately ~ 10% or f 1 vg/cm2, which
is good enough for most purposes. By constructing multiple carbon
coatings whose components’ surface densities were found optically in
this way, we have been able to extend the calibration to about 110 pg/cm2.
Above this surface density, at which the transmittance is less than
0.01%, such measurements become rapidly more difficult and unreliable
because of the low levels of stray light that may be tolerated.
We have been able to make carbon layers with known surface den-
sities in the range 120-300 pg/cm2 by evaporating in several cycles.
After the first cycle, during which we deposit 90-100 ~9/cm2 of carbon,
we measure the surface densities directly by the transmittance method.
We then replace the same slides in the evaporator, placing uncoated
“witness” slides next to them, and again evaporate 90-100 ug/cm2 (or
187

as needed). The original slides now have coatings that are too thick to
transmit measurable amounts of light, but the amount of carbon added to
each can be found by interpolation of measurements on the witness slides.
We expect to have cumulative errors in the resulting thickness deter-
minations, and usually estimate them as ~ 20% in the surface densities.
It was not until recently thatwe found a review (McClintock and
Orr, 1973) that points out that the optical transmittance of a carbon
film is not a reliable measure of its surface density! Presumably our
success in using this method is due to the fact that we always use the
same evaporation technique. We have sometimes obtained verifications of
our determinations-from scattering and energy-loss measurements (Fig. 1).
Although measuring the surface density of a carbon film via its
transmittance is easy when the film is outside the evaporator, it is not
so easy while the film is being formed inside the evaporator. The carbon
arc source emits both intense light and carbon vapor, and these interfere
with the monitoring process.
In order to measure the progress of evaporation
explored the possibility of measuring the electrical
in situ, we have——
resistance of a
carbon film as it is formed. For this purpose we make a monitor slide
by gluing two parallel copper wires 32 mm apart to a 25.4 x 76.2 mm
microscope slide. We then paint colloidal graphite over these wires,
leaving a square, uncoated region 25.4 x 25.4mm (Fig. 2). The resis-
tance between the wires is monitored by an ohmmeter during the evapora-
tion. This resistance is usually reliable to about ~ 20% in indicating
the carbon surface density (Fig. 3). Occasionally, we observe
188

El
140-
120-
1oo-
SURFACE 80-DENSITY
Ft30MTRANSMllTANCEMEASUREMENTS
40-
20-
●
x
e●
●
El
~: WEIGHING
x: ENERGY LOSS MEASUREMENTS
● : BACKSCATTER MEASUREMENTS
y “
●
I I I I I I I
o 20 40 60 80 100 I20 140
“ACTUAL” SURFACE DENSITY
(W/cm2)
Fig. 1 Measurements by weighing, energy losses, and backscattering rates
verify that the transmittance measurements provide useful indi-
cators of surface densities of carbon foils (from private com-
munication from B. Curnutte).
189

-COPPER WIRE!
~DMjTE pAjNT
r
/ MICROSCOPE
SLIDE
EPOXY GAJEA
..— 1
Fig. 2 Monitor slides used for resistive measurements of carbon-foil
surface densities.
100908070Go50
49
30-
xxx
xx
x
xx xxx
xxx
x xlx x
xx x
x
x x
xxxx
x xxx
xxxXxxx
x xxxx &x
x x’ xa x
xx
xx
I.01 .02 “.03 .04 .05 .06.071xI.cnO.l .2 3 4 .5 .6 .7 1? .9 LO 2 ~
RESISTA)dCE
[
MEGCNiMS/SQuARE 1(IN AIR)
Fig. 3 Resistance vs. surface density for carbon foils.
I

anomalously-high resistance values, and have in some cases been able
to associate them with pressures that were unusually high during eva-
poration. Over the range of surface density 2-100 pg/cm2, our data
are consistent with an approximate resistivity of 1.5 ohm-cm, which
is much greater than that for carbon or graphite, and is consistent
with others’ measurements on carbon films (see McClintock and Orr, 1973).
As others have found, however, the reproducibility of such measure-
ments depends ‘critically on the conditions of evaporation, and the re-
sistance method does not appear to be a precise way of providing surface-
density values.
Below about 2 ~g/cm2 the resistance monitor fails. Its behavior
is erratic and suggests reaction of the freshly-deposited films with
residual gas in the evaporator. Since carbon is known to evaporate as
c’ C2’ and C3’ all highly reactive (Schaeffer and Pearson, 1969), this
is not surprising. It may also help explain why “carbon” films have
a hydrogen component, typically 1.2 g/cm2, roughly independent of total
thickness (Stoner, 1969 and Curnutte, private communication).
References
G. Dearnaley, 1960, Rev. Sci. Instrum. 31, 197 .—
I. S. McClintock and J. C. Orr, 1973, Chemistry and Physics of Carbon,
P. L. Walker and P. A. Thrower, ed
R. Schaeffer and R. K. Pearson, 1969, J
J. O. Stoner, Jr., 1969, J. Appl. Phys.
tors, Vol. 11, (Marcel Dekker).
Am. Chem. Sot. Sll_,2153.
Q, 707.
191

Ahlethod for the Preparatioil of Selenium I?oi.ls
J.L. Gallant
Atomic Energy of Canada Limited
Chalk River Nuclear Laboratories
Chalk River, Ontario, Canada KOJ 2.JO
ABSTRACT
A characteristic of allotropic selenium is its brittleness
at room temperature. It is therefore impossible to prepare foils CJf
this metalloid by conventional means. However when immersed in dis-
tilled water at 80°C selenium becomes very soft and can be rolled.
An evaporated film can be released from its substrate by this pro-
cedure.
192

DISCUSSION SUMMARY
VAPOR DEPOSI.TION OF LARGE AREA Np02 AND UOZ DEPOSITS - H. L. Adai.r
The substrate for U02 was 0.015-in.-thick titanium at 200°C heatedby quartz iodide lamps. The bonding of actinide oxide deposits to ti-tanium is good when Ti is heated to - 200”C.
Synchronization of evaporation rates from the two guns: a quartz
crystal monitor calibration was established for the deposits on therotating drum. When the lower end of the desired range was reached,
the evaporation was stopped, and the test plates at each side of the
drum were weighed. Compensation was then made by heating whichever
gun needed to evaporate more.
The U@ system is in an open lab, not in a glove box. The rough-ing pump exhausts to an absolute filter. Respirators are worn when thesystem is opened. The systems have to be decontaminated for differentisotopes.
Electron gun power i.s -100 mA at 6 to 7 kV for UG. Rotating
drum speed is 50 rpm. U30g is heated in vacuum to convert to UOz and
outgas at the same time.
ALTERNATIVES TO THIN CARBON FOILS FOR USE IN STRIPPING HEAVY ION BEAMSD. Ramsay
There are discrepancies in the data on heating of stripper foils.Some experiments use a furnace, some radiant heating. A hot tungstenfilament near the carbon would cause electron flow through the targetfoil. The increased current density could offset an effect due toheating.
Annealing of damage does not occur at the beam spot temperatures
normally reached.
Experiments with liquid strippers at the Univ. of Washington weredescribed. A rapidly rotating wheel is dipped into diffusion pump oil,throwing up a continuous hydrocarbon film. Five to ten pg/c# hasbeen reached.
THE PREP~TION OF NITROGEN-15 TARGETS - J. D. Stinson
Less carbon contamination than reported is indicated when thetargets are analyzed by spark spectroscopy. The reported carbon is
from Van de Graaff experiments where carbon is always present.
Alloying of Ti with the W boat is not a problem in this casebecause of the small loadings required.
193

REDUCTION TECHNIQUES FOR ISOTOPIC MATERIALS - J. M. Heagney
Hydrogen reduction of chromium oxide is fairly difficult. Thehydrogen must be pure, and a high temperature, > 1350”C, is required.Most reductions require at least 1 hr; possibly 2 hrs are needed
for Cr. Reoxidation of Cr may occur on cooling if any water vaporis present in the hydrogen. Carbon can be used for simultaneousreduction-evaporation of Cr. The carbon used is filings from spec-troscopic carbon rod.
A method reported for lead oxide is to heat it with rice starch.The starch decomposes to make carbon, which reduces the oxide to lead.
Lead nitrate can be simultaneously reduced and evaporated in apinhole boat, but the substrate has to take a fairly high temperature.
Cadmium has been simultaneously reduced with carbon and evaporatedonto a substrate seeded with a very thin layer of Be or other materialthat matches the crystal structure of Cd.
Rare earth oxides are often reduced with thorium reductant. Afterone redistillation lanthanum may be a worse contaminant from reductionthan Th. To use La successfully, use a low temperature and long time.
Zinc may be cleaned up with white silver solder flux. Zinc withflux on top is heated in a conical tube to the flux melting point. Theflux is washed off after cooling.
DEUTERATED TITANIUM TARGETS ON THIN BACKINGS - A. M6ens
Source to substrate distance was 15 cm.
TARGETS OF SILICON OXIDE AND”VANADIUM OXIDE ENRICHED IN 180 ON VARIOUSBACKINGS - A. M&ens
The silane is at atmospheric pressure. Cleaning of silane fromthe vacuum system must be complete before admitting air because silaneis highly explosive. s
Anodic oxidation makes stronger targets. The described method isnot for self-supporting foils.
Direct oxidation of silicon with 180 might be done, but a temper-
ature > 1000°C is required.
PREPARATION OF ISOTOPICALLY ENRICHED MERCURY TARGETS - H. J. Maier
Targets can be made up to 15 to 20 mm in diameter.
The targets are cooled while in use. (Amalgam targets are evenmore sensitive to warm-up dissociation.) They are cooled from theedges by connecting to a copper block with silver paint. The copperblock is cooled to -80”c; the target is probably at about -50”C.
194
I
4
1

A METHOD FOR STRETCHING ULTRATHIN POLYPROPYLENE FILMS - D. M. Barrus
Thickness of the films is measured by x-ray transmission and bythe weighing of a known area on a microbalance. Uniformity is accu-rately observed by visual examination of color fringes.
Conduction of nichrome coating begins at 50 A.
The films suffer radiation dsmage in about 1 hr in a flux of 107photons/see.
PREPARATION OF ULTRATHIN POLYETHYLENE FILMS BY FILM CASTING -B. S. Cranfill
Standard pre-cleaned slides are used. No special cleaning isneeded except wiping free of dust.
PLASTIC-BONDED TARGETS OF CARBON 13 AND SILICON - R. K. Rohwer
The 8% binder required for carbon is probably inherent for carbon.The binder amount for silicon might be reduced to 3% if the particleswere carefully screened. The amount needed depends on particle sur-face area, with 3% binder routine.
THICK TARGETS FOR IN–BEAM HYPERFINE STRUCTURE STUDY - D. RamSay
The holder ring was split to prevent eddy currents in the ringfrom rf. There was no problem with the sheet foil.
A RAPID AND ACCURATE METHOD FOR MEASURING THE THICKNESS OF EXTREMELYTHIN TARGETS - P. Maier-Komor
Sodium fluoride was used as a parting agent because of high humid-ity, which causes difficulty with Teepol. NaF isevaporated in vacuumfollowed by the carbon evaporation. The carbon films must be pinholefree. Uniformity is not crucial because the beam spot is 5 to 8 mmin diameter. A laser of the appropriate wavelength is recommended formeasuring uniformity in small areas.
This method is feasible for metal foils (Au, Al, Ag), but surfaceeffects cause a problem. Nitrogen and oxygen are adsorbed on the metalsurface in thicknesses dependent on the history of the foil. In carbonthe gas content is all the way through the foil.
PRODUCTION OF FRACTIONAL ATOMIC LAYER STANDARDS OF NIOBIUM AND VANADIUM
G. E. Thomas
There is too little material present for activation analysis.
The question was raised of the significance of 0.001 monolayer.It might be in islands rather than in a uniform layer. It could be
scanned with an ion microprobe.
195

THE ROLE OF AUGER ELECTRON SPECTROSCOPY AND SECONDARY ION MASSSPECTROSCOPY IN THIN FILM COMPOSITION ANALYSIS - R. W. Springer
The beam profile is approximately Gaussian, with a spot variablefrom 100 pm to a few mm. Argon and xenon ions are produced in a sim-ple ion gun and focused by an einzel lens.
In using SIMS, the ion beam and electron beam must be in perfectregistry. If they are not, the electron beam hits the wrong part ofthe crater. A technique to eliminate the problem is to put deflectorplates on the guns. The spectrometer is gated only when the beam isat the center of the crater.
If there is a question that preferential sputtering is takingplace, an electron microprobe will show if the film is uniform to adepth of 1 p. Then you can decide if preferential sputtering isoccurring.
FOCUSED ION BEAM SPUTTERING APPARATUS - W. D. Rid
Commercial units are available from General Ionex and Danphysik.The reasons for the attractiveness of the process are as follows.
For high-vacuum evaporation of refractories or low-vapor pressurematerials, sputtering will deposit without high temperature. stan-dard sputtering operates in a fairly high pressure with chance of con-tamination, using large amounts of sputtering material.
The focused beam system has a duoplasmatron source operating withAr+ or Kr+, followed by an einzel lens that focuses the beam to a spot2 to 5 mm in diameter. It operates at 10-6 torr or better and requiresonly small quantities of material. The beam is about 2 mA at 8000 to20000 v.
The tradeoff for these advantages is speed. Deposition times arefrom one or two to many hours.
The isotopic material is placed in a beam stop of spectrographicgrade graphite. Although the beam strikes only the charge, a halostrikes the graphite. In spite of carbon’s low sputtering yield,considerable material is deposited, such as carbon and possibly con-
taminants adsorbed on the graphite. Duoplasmatrons are finicky andsometimes hard to operate stably for many hours. Tungsten filamentsfrequently burn out before the end of a long deposition. The methodis promising but still has many problems.
The following comments were added in discussion.
Some materials, which would not make a self-supporting film, benefitfrcm carbon deposition from the graphite stop because carbon contentmakes them self–supporting. Films may also be made of metals that arehighly stressed when vacuum evaporated.
196

The tungsten contamination transferred to the substrate appearsto be about 1%.
There is no alternative for this method for rare actinide oxides,which are available only in very small quantities.
Another possible method for beam generation is the Penning iongauge source (PIG). This has a cold cathode, probably reducing thecontamimtion problem. Beam spots of 1 mm are reported and morestable operation for long periods. The more finely focused beamshould have less halo and less destruction of carbon substrate films.
The General Ionex machine has an ion-exchange canal that producesa neutral beam. This prevents charge build–up on nonconducting sput-tering materials.
Technics, Inc., makes a micro-ion milling machine for the semi-conductor hdustry. It uses a cold cathode ion source , and the beamcomes out focused to 1 mm without additional focusing. It is intendedto operate at a high rate for secondary ion deposition.
Another possible alternative ion source is the high temperaturesurface ionization source developed at Livermore. The tip of a tungstencrucible is heated by electron bombardment. The temperature profilealong the crucible axis regulates the rate of evaporation of the chargematerial. The load is about 2 mg of rare earth oxides, actinides, etc.It could be used with a simple extraction device and retardation lensand could deposit directly onto a substrate.
ROLLING OF METAL TARGETS - W. Perry
Large and expensive rolling mills are not required to make usefultargets. one can roll many useful foils down to the 1 to 5 mg/c#region with a small bench-type manually operated mill.
Molybdenum: Powder can be used to roll targets 25 to 30 mg/cm2.For thinner foils, machine a carbon crucible, melt Mo powder into aball with an electron gun, crack off the carbon crucible. The ballis good feed stock for rolling. Hand mill rolls to less than 1 mg.
The following results were added in discussion.
Cadmium: Can be rolled down to 5 to 6 mg/cn? between 20-to 25-roilmylar sheets.
Calcium: Can be rolled to 700 Pg/cm2 in a mill in a glove boxwith flowing filtered argon. The foils are good at 1 mg/cm2, somewhatoxidized at 700 pg/cm2.
In addition to stainless steel, spring steel sheet has been founduseful for pack rolling.
797

Tungsten sheet, 0.003 to 0.005 in., is good for pack rolling, isvery hard with a good polish, and can be used many times. Tungsten isnot suitable for rolling very thin targets because of its crystalstructure.
Palladium: A problem is welding of palladium to the pack whentrying for less than 500 pg/cm2. This can be avoided by making threeto five passes at the same setting before going thinner.
Uranium: 1 mg/cm2 is about the limit. Since oxidation of Ulimits its rollability, it is useful to roll, electropolish (sulf-
uric acid removes oxide), roll again (or roll in Ar). Be carefulnot to generate too much heat in rolling”.
Uniformity may be poor in rolling a small quantity of a separatedisotope with few passes-- the target is thick in the center, thinnerat the edges. Instead of rolling, the material can be pressed be-tween two highly polished flats of cobalt tungsten carbide from amachine shop.
PREVENTION OF STRESS IN FOILS BY SUBSTRATE HEATING - J. C. Gursky
Some information on this topic is available in Thin Film Phenomenaby Chopra. Tensile stress causes fracture of thin films and compres-
— —
sive stress causes buckling. Tension decreases with increasing sub-
strate temPerature~ goes to zero) and in some cases changes to compres–sion with still higher temperature. The temperature referred to isthat of the substrate at the time of deposition. Later annealing inthis range of 400”C and less does not seem to affect the residualstresses.
The crossover from ten~ile to compressive stress is related tomelting point. It occurs at lower temperatures for lower meltingmaterials. Thus, from the limited experimental evidence available, thecrossover point is about 21O”C for nickel, 100”C for copper, and about300”C for iron. This is roughly correlated with empirical results ofunstressed or less stressed films deposited on substrates heated tothese temperatures. The following table gives some temperatures thathave produced good films. Since the stripping agent also :influencesfilm structure, this is also given, along with the method of evapora-tion. Substrates are 1“ x 3“ glass microscope slides. The electrongun evaporations usually require a minimum ball size of 200 to 300 mg,which is feasible for inexpensive isotopes but not for rare ones.Inorganic stripping agents are vacuum evaporated, 20 to 40 pg/cm2.
Radiant heating of the substrate from 5 cm or so distance can bedone with a semi-cylindrical furnace heater element or a flat diffu-sion pump heater element.
1
tii
1
198

Element
Chromium
Cobalt
Copper
Gold
Iron
Manganese
Molybdenum
Nickel
Palladium
Platinum
Titanium
SubstrateTemp. , ‘c
375 - 400
300
100
100
No heat
325s
100
300
250- 300
200
350 - 400
230 - 260
(Following results were
Pd 350 - 400
B 250
Ge No heat
Ge No heat
Si 360
TABLE I
StrippingAgent
KC1
KI
Contrad, KI
Contrad
CsI
KI
KI or NaCl
KI
CSI
KI
KI
Method of
Evaporation
e-gun, sublimes
e-gun
Mo boat
Mo boat
Mo boat
e-gun or
AlzOs-coatedMo boat
e-gun
e-gun.
e-gun, min.ball 50 mg
e-gun
e-gun
added in discussion)
NaCl
NaCl
Betaine e-gun
NaCl W boat
BaC12 onNickel plate
Minimum
Thickness, pg/cl#
60
100
50
70
45
70 - 80
100 on
carbon backing
100
40
80
150
50
70 - 80
50 or less
70 - 300
30 - 250
199

One possible alternative to substrate heating is a very slowevaporation rate that has given unstressed films of W03 and Ti (30
Pg/cm2 with Betaine parting agent).
Another is to coat the slide with parlodion. This permits theevaporated film to move and relieve stress.
Another suggestion was to evaporate directly onto a formvarother film mounted on a target frame. This was successful withstrontium.
WHAT ARE YOU WORKING ON? - W. D. Riel
or
This is a compendium of actual or possible solutions to specifictarget problems.
Irving Feigenbaum reported that in a study of fluorine in foodand other organic materials, the ground-up powders were pressed inaluminum cups at about 15 tons and made useable Van de Graaff targets.
Laszlo Csihas described a system for making isotopic oxygen tar-gets. The isotopic gas is introduced into a small chamber containing30 pg/cm2 nickel foils mounted on target frames. The gas is frozenby introduction of liquid nitrogen, then the chamber is pumped out andthe oxygen permitted to warm up by removing the liquid nitrogen. Asmall projector light with focal length of 1-1/2 in. is shined on thecenter of a nickel foil and oxidation proceeds, leaving a supportingarea of nickel around the edges.
A problem exists with evaporating LiF so that it bonds with anybase layer such as carbon. It flakes badly when the thickness isthree to four mg/cm2 on stainless steal. Etching of the surface andglow discharge cleaning don’t improve the sticking. One possibilityis sputtering, which inherently produces a better-adhering film. Athin layer of LiF might be sputtered, followed by vacuum evaporationof the rest of the thick layer. It might also be possible to bondLiF to stainless steel by pressure. Another suggestion that helpsbonding with thinner LiF is to do all parts of the process slowly--slow cooldown, vent to about 1/3 atmosphere of inert gas for an houror so, vent slowly to atmosphere.
The sticking ofthickness by heating
calcium fluoride was improved in 200 pg/cm2the substrate to 150”C.
200

ATTENDEE S - VISITORS
H. L. AdairIsotope Research MaterialsOak Ridge National LaboratoryOak Ridge, Tennessee 37830
Robert B. AnderlEG&G Idaho, Inc.Idaho National Engineering Lab.Idaho Falls, Idaho 83401
Laszlo CsihasUniversity of Pennsylvania -209 S. 33 St. E-1Philadelphia, Pennsylvania 19174
Edith B. FehrPhysics DepartmentNuclear Structure LaboratoryYale UniversityNew Haven, Connecticut 06511
Irving L. FeigenbaumBldg. 901ATandem Van de GraaffBrookhaven National LaboratoryUpton, L.I., New York 11973
Donald J. HannnondMedi-Physics, Inc.5801 Christie AvenueEmeryville, California 94608
Joanne M. HeagneyMicro Matter Company197 - 34th EastSeattle, Washington 98112
Joseph S. HeagneyMicro Matter Company197 - 34th EastSeattle, Washington 9B11.2
Joaqufn HernZindezCyclotron InstituteTexas A and M UniversityCollege Station, Texas 77843
T. A. HodgesTRIUMFUniversity of VictoriaVictoria, B.C., Canada
Frank J. KarasekMSD 212 H-118Argonne National Laboratory9700 S. Cass AvenueArgonne, Illinois 60439
Charles 1. KriegerBldg. 362 BO02Argonne National Laboratory9700 S. Cass AvenueArgonne, Illinois 60439
Bill LozowskiIndiana UniversityCyclotron FacilityMilo B. Sampson LaneBloomington, Indiana 47401
Hans-J&g MaierSektion Physik4ER Universitat Munchen8046 Garching-Am coulombwall 1West Germany
Peter Maier-KomorTechn. Universitat MunchenD 8046 Garching Bei MunchenWest Germany
Andr6e M6ensCentre de Recherches Nuc16aireLaboratoire PNPA67037 Strasbourg - C~DEXFrance
Wayne L. Perry, Station 49Atomic Energy of Canada Ltd.Chalk River Nuclear Labs.Chalk River, OntarioCanada
201