Field Test Analysis Report: SAS Macro and Item/Distractor/DIF Analyses Prepared by Yi-Hsin Chen,...
96
Field Test Analysis Report: SAS Macro and Item/Distractor/DIF Analyses Prepared by Yi-Hsin Chen, Chunhua Cao, and Stephanie Green College of Education at USF Presented at the meeting of the Central Florida Assessment Collaborative (CFAC)
-
Upload
kathleen-blankenship -
Category
Documents
-
view
219 -
download
0
Transcript of Field Test Analysis Report: SAS Macro and Item/Distractor/DIF Analyses Prepared by Yi-Hsin Chen,...

Field Test Analysis Report:SAS Macro and
Item/Distractor/DIF Analyses
Prepared by Yi-Hsin Chen, Chunhua Cao, and Stephanie
GreenCollege of Education at USFPresented at the meeting of
the Central Florida Assessment Collaborative (CFAC)
May 20th, 2014, Orlando Florida

Agenda of This Presentation
SAS macro for CTT test/item analysis, IRT 2PL model, and Mantel-Haenszel differential item functioning (DIF) analysis
Introduction of statistical concepts for test/item development
Item Analyses: CTT and IRT Distractor Analysis DIF Analysis

SAS macro for test/item, 2PL, DIF analyses

SAS Macro Outputs
A SAS macro developed for this project
There are six excel outputs Test score statistics Frequencies of options for each item Item analysis statistics Distractor analysis DIF 2PL item parameter
Available upon request at [email protected]

Test Score Statistics
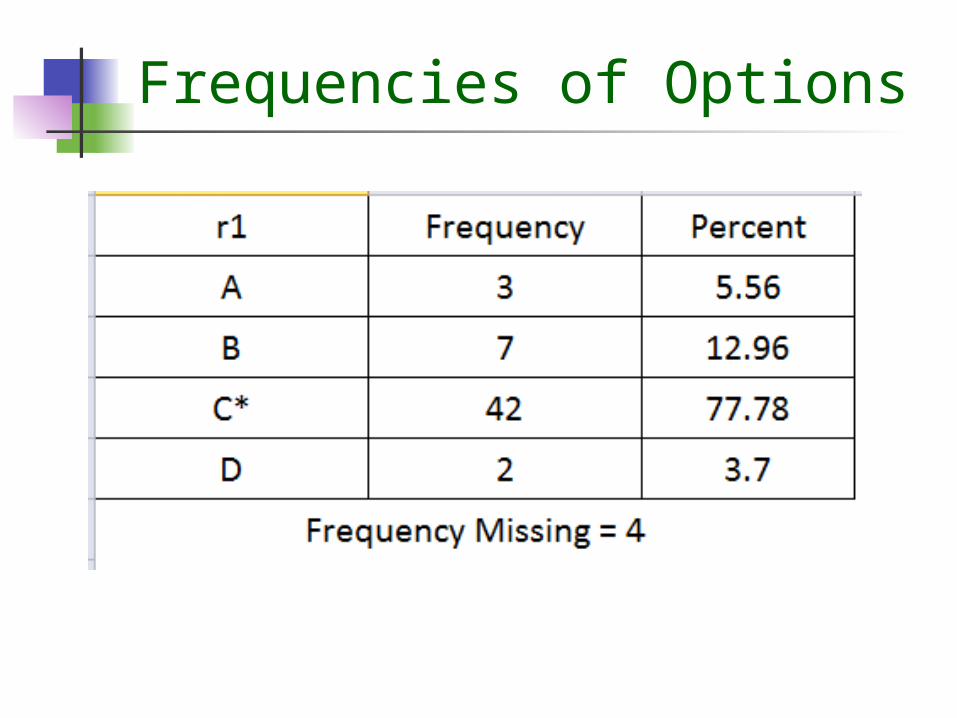
Frequencies of Options

Item Analysis Statistics

Item Analysis Statistics

Distractor Analysis
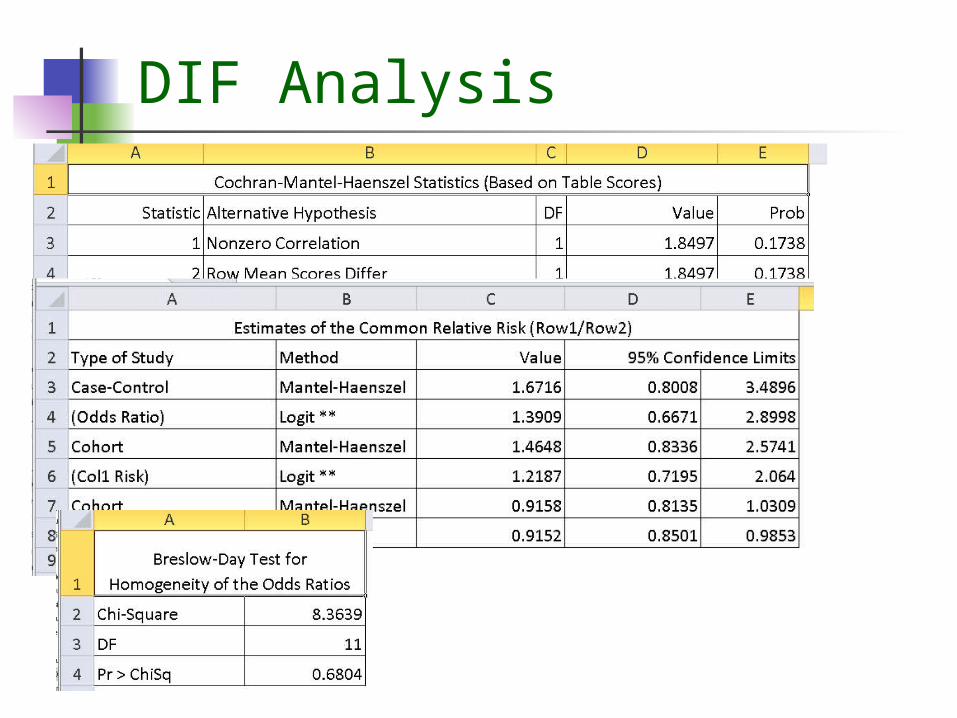
DIF Analysis
Statistical Concepts
of Test Scores
Sample size
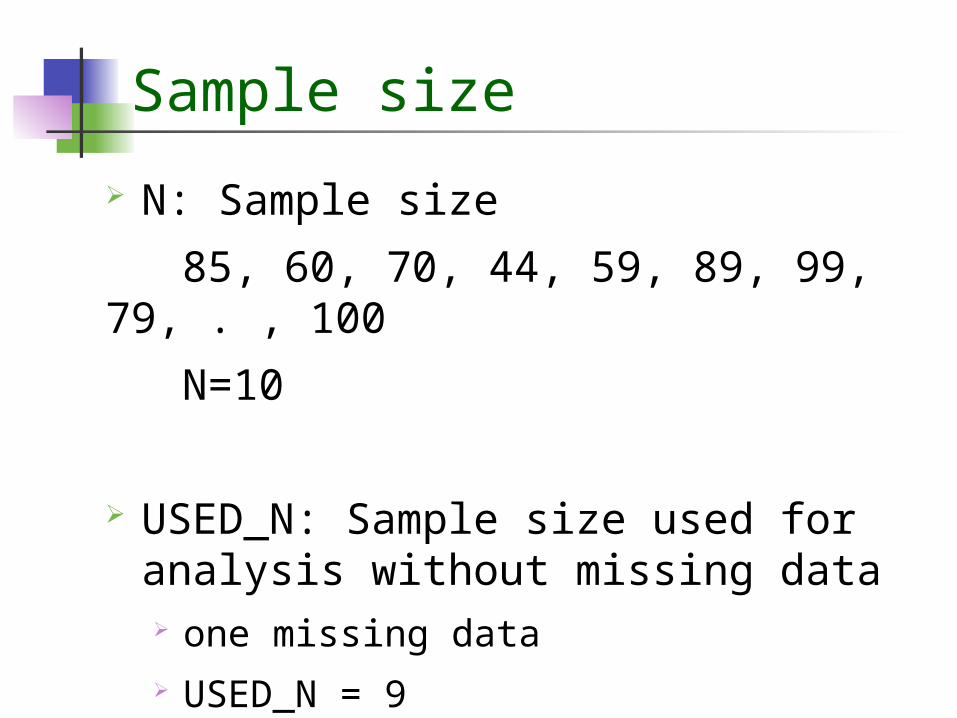
N: Sample size
85, 60, 70, 44, 59, 89, 99, 79, . , 100
N=10
USED_N: Sample size used for analysis without missing data one missing data USED_N = 9
Central Tendency
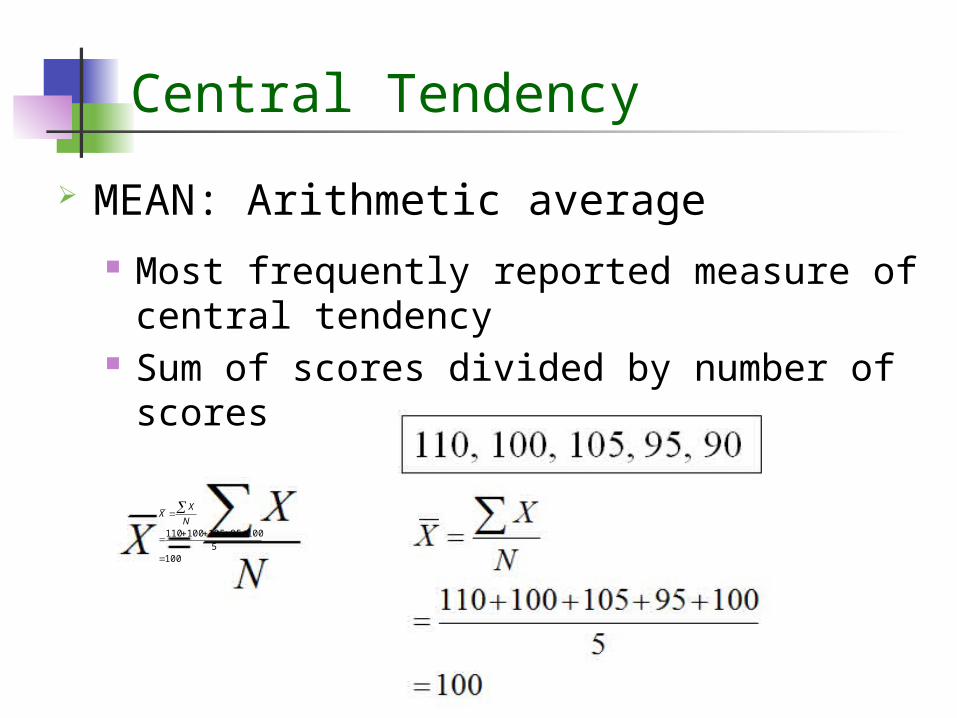
MEAN: Arithmetic average Most frequently reported measure of
central tendency Sum of scores divided by number of
scores
1005
10095105100110
N
XX

Test Statistics: Central Tendency
MEDIAN (Q2): the score at the 50th percentile half of the examinees score above
median, and half score below median110
105
100
95
90
Median = 100
110
105
100
95
95
90
Median = 95+100 / 2 = 97.5
Percentiles
Percentile is considered when we consider the percentage of scores that fall below a given point
They are very useful for interpreting an individual student’s performance
Q1: The score is at the 25th percentile Q1 = 10, indicating 25 percent of the
students’ scores below 10 points
Q3: The score is at the 75th percentile
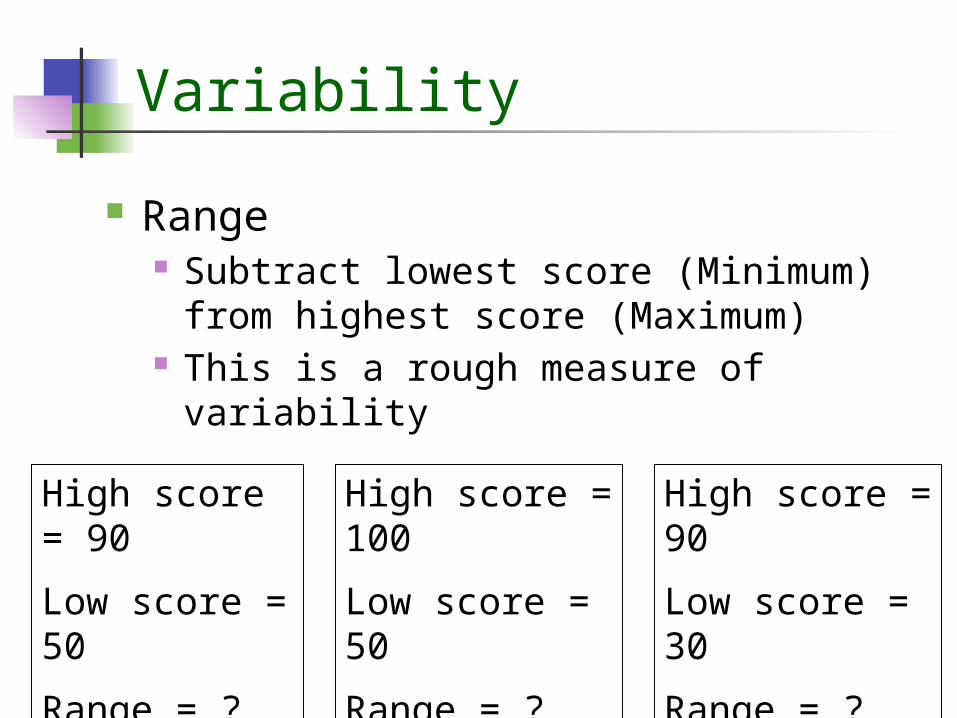
Variability
Range Subtract lowest score (Minimum) from
highest score (Maximum) This is a rough measure of variability
High score = 90
Low score = 50
Range = ? (40)
High score = 100
Low score = 50
Range = ? (50)
High score = 90
Low score = 30
Range = ? (60)

Variability
Standard Deviation (SD): an average points that deviates from
the mean score A measure of the amount of variability
in examinees’ total scores Large SD = large variability
(heterogeneity) Small SD = small variability
(homogeneity) (scores cluster closer to the mean)

VariabilityDeviation Scores Squared
100-92= 8 82 = 64
96-92 = 4 42 = 16
94-92 = 2 22 = 4
92-92 = 0 02 = 0
90-92 = -2 (-2)2 = 4
80-92 = -12 (-12)2 = 144
232 = (X-Mean)2
SD = (X-Mean)2 = 232 =
N 6
Scores
100
96
94
92
90
80
Mean = 92 6.22
Skewness and Kurtosis
SKEWNESS: a measure to tell the shape of the score
distribution, such as positive or negative skewness or symmetry
KURTOSIS: a measure of the "peakedness" of
the score distribution
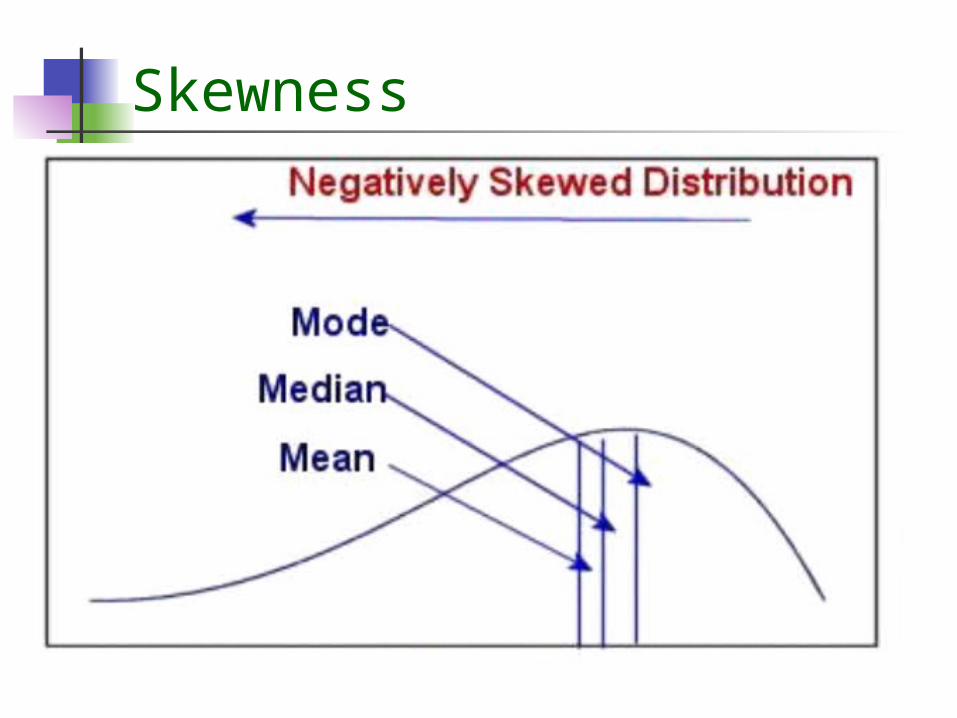
Skewness
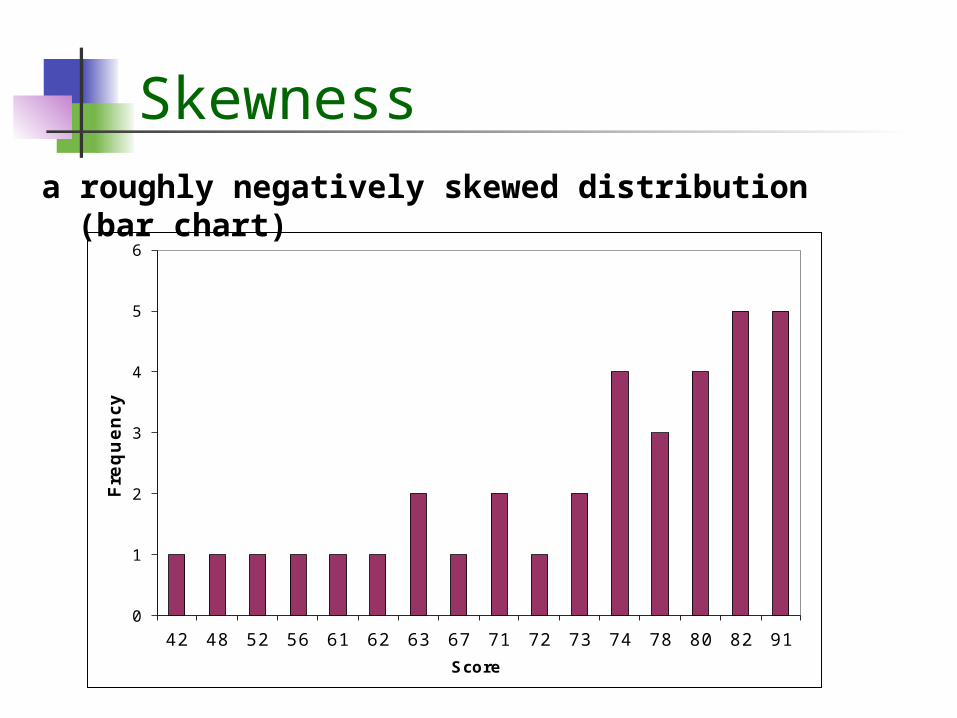
Skewnessa roughly negatively skewed distribution (bar
chart)
0
1
2
3
4
5
6
42 48 52 56 61 62 63 67 71 72 73 74 78 80 82 91
Fre
qu
en
cy
Score

Skewness
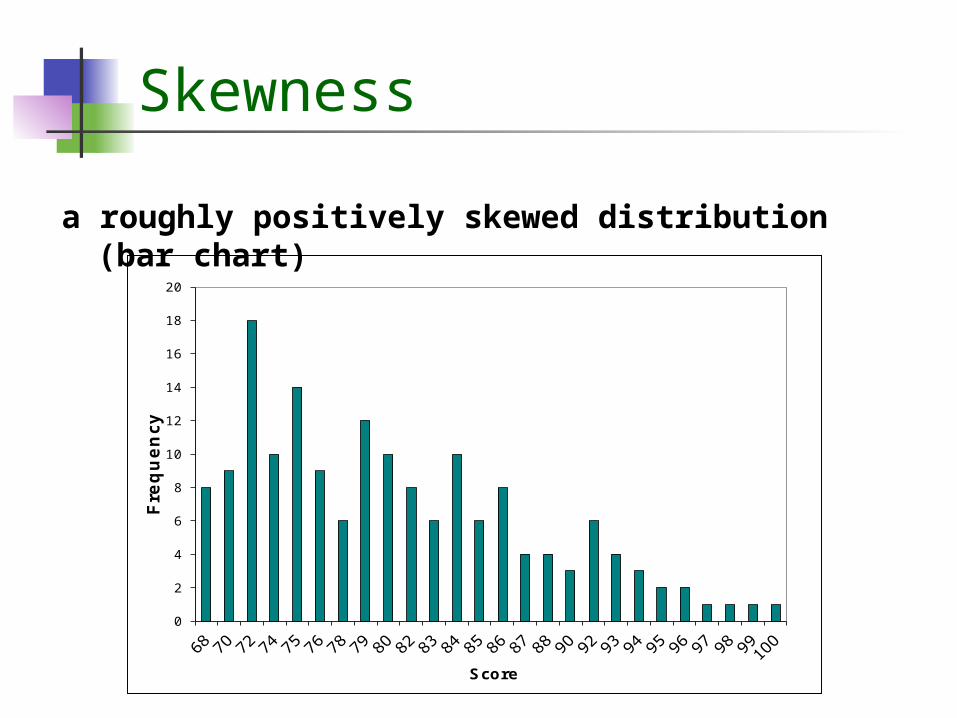
Skewness
a roughly positively skewed distribution (bar chart)
0
2
4
6
8
10
12
14
16
18
20
Fre
qu
en
cy
Score
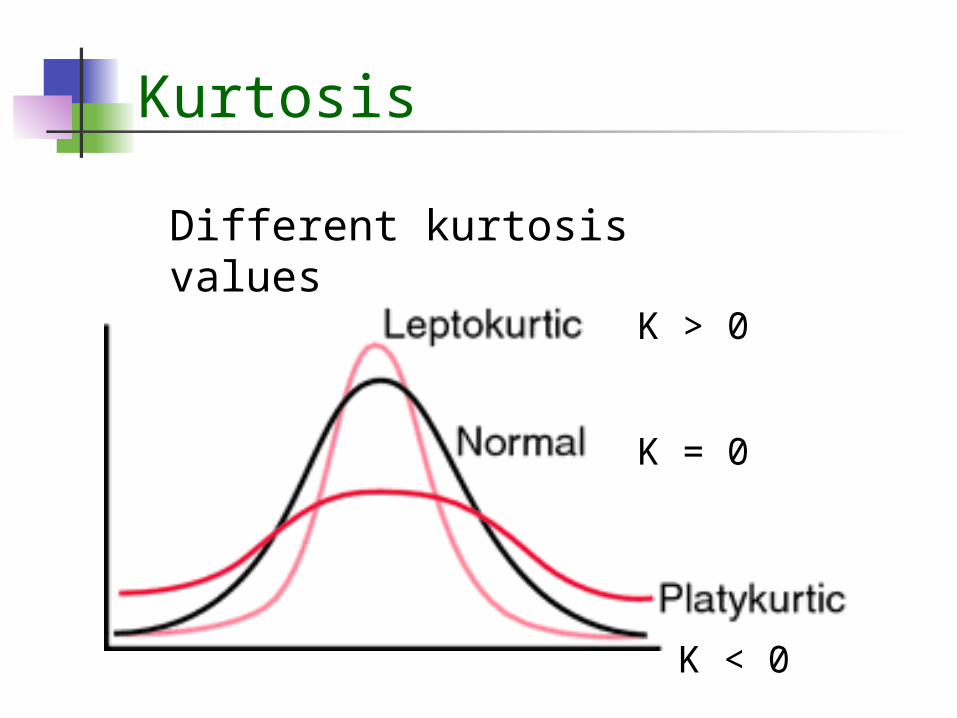
Kurtosis
Different kurtosis values
K = 0
K < 0
K > 0

Reliability: Cronbach’s Alpha
A measure of the test reliability, indicating the internal consistency of the test
Sample dependent Different samples may obtain
different reliability with the same test
Ranges from 0 to 1 0.7 and above: good internal
consistency

Standard Error of Measurement
SEM (Standard Error of Measurement)
SEM = STD *
A higher reliable test can cause smaller SEM
Statistical Concepts
of Item Analysis

Item Analysis
Why care? – Item analysis helps you identify
problems with your items (or scoring)
These problems can be corrected, resulting in a better test, and better measurement

Item Analysis
When is it useful? – Item analysis is most useful when you are
developing a bank, or pool, of items that you will continue to use
It can be used when evaluating standardized tests
It is also a useful tool, anytime students have complained about an item
It can be used to identify mis-keyed items

Item Difficulty (p-value)
Item difficulty (proportion correct): the proportion of examinees tested
that answered the item correctly
# of students who responded correctly
total # of students who responded
p =
Ncorrect
Ntotal
p =

Item Difficulty (p-value)
p can range from 0 to 1.0 A rough level of item difficulty (p)
.80 and above moderately easy to very easy (mastery)
.80 - .30 moderate
.30 and below moderately difficult to very difficult
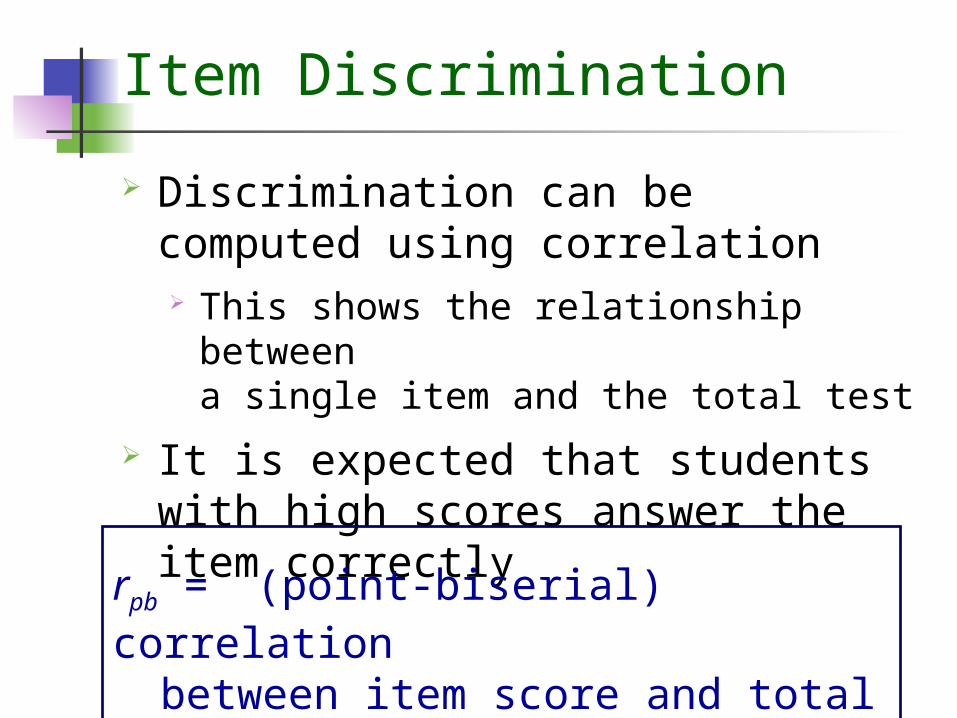
Item Discrimination
Discrimination can be computed using correlation This shows the relationship between
a single item and the total test
It is expected that students with high scores answer the item correctly
rpb = (point-biserial) correlationbetween item score and total
score
Item Discrimination
Corrected point-biserial correlation: A statistic similar to point-biserial
correlations The score of the individual item is
taken out of the total score so that the contribution of the item itself is removed from the correlation This statistic is more accurate to
represent item discrimination

Item Discrimination
Two ability groups (upper and lower) approach Median score is used to divide the students into
two groups Discrimination coefficient (D-value) =
percentage correct in the upper group – percentage correct in the lower group
Ranges from -1 to 1 An item with higher and positive D-value
indicates a good discriminating item An item with a negative D-value suggests that
the lower achieving group did better on an item than the higher achieving group, indicating a poor item

Item Discrimination
A rough scale of item discrimination (D) D can range from -1 to 1
.30 and above moderate to high discrimination
0 - .30 little to no discrimination
0 and below negative discrimination (unwanted)
Item Difficulty and Discrimination
Relationship between item difficulty and discrimination
there can be little discrimination: if nearly everyone gets the item right, or if nearly everyone gets the item wrong
there can be maximum discrimination: if about half the people got the item
right,and about half got the item wrong
Item Difficulty and Discrimination
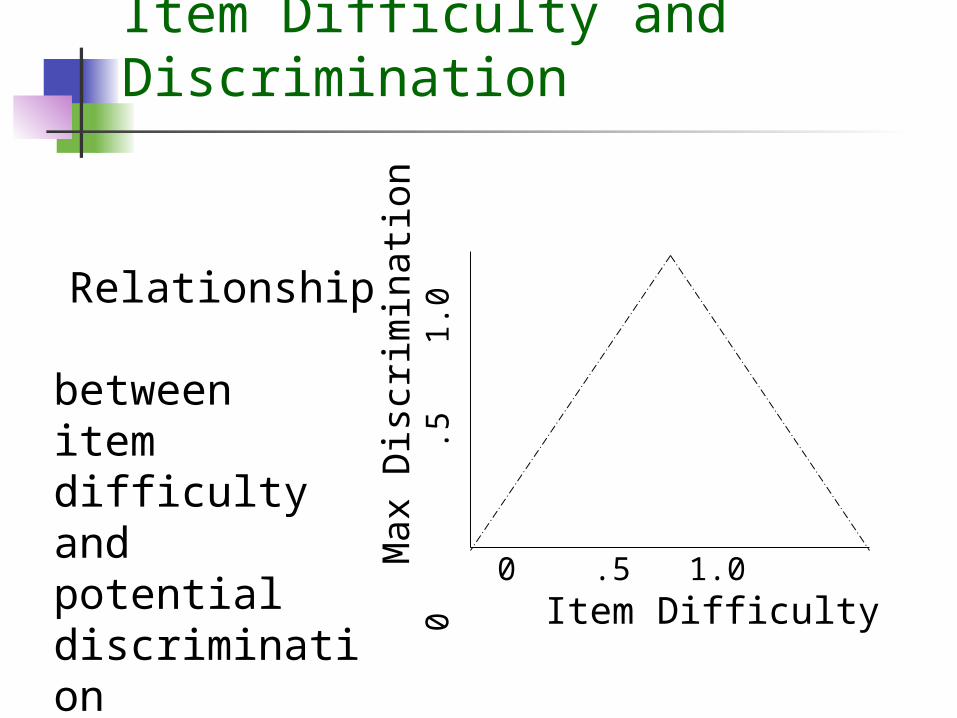
Relationship between item difficulty and potentialdiscrimination
0 .5 1.0Item Difficulty
M
ax D
iscr
i mi n
a tio
n0
.51 .
0
Alpha If an Item Deleted
“The Alpha If Deleted” shows what would happen to the internal consistency when the item is deleted When the test_alpha_deleted coefficient goes
up, compared with the original test-alpha, it indicates that without the deleted item, the test can be more reliable (that item can be removed from the test)
When the test_alpha_deleted coefficient goes down, it means that deleting that item is not a good thing and also indicates that item is a good item

Statistical Concepts of Distractor Analysis
Distractor Analysis
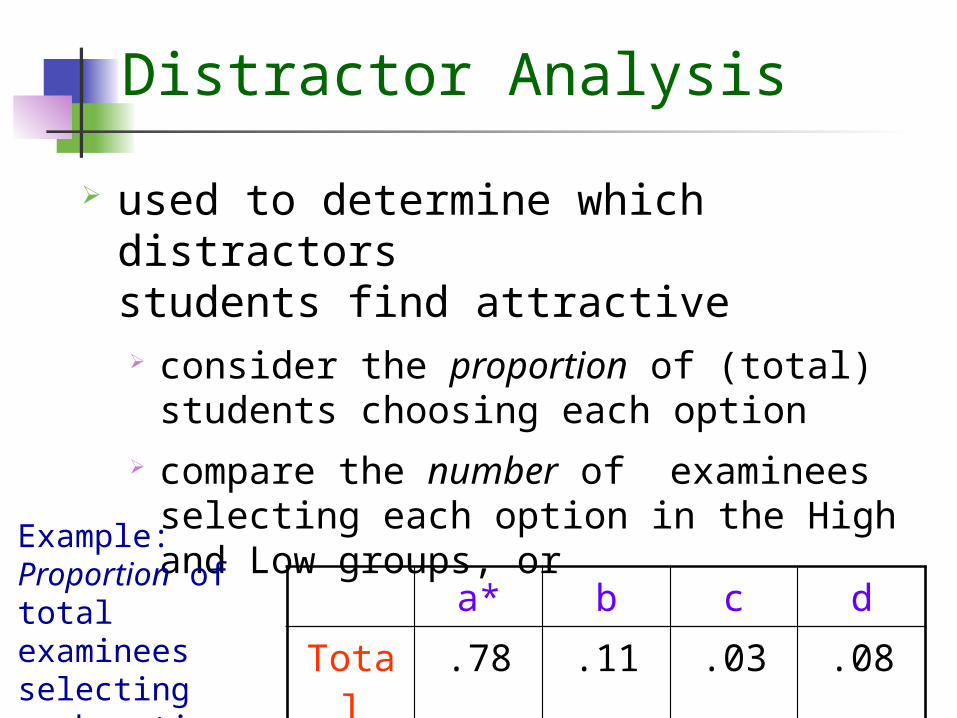
used to determine which distractors students find attractive consider the proportion of (total)
students choosing each option compare the number of examinees
selecting each option in the High and Low groups, or
a* b c d
Total .78 .11 .03 .08
Example:Proportion of total examinees selecting each option
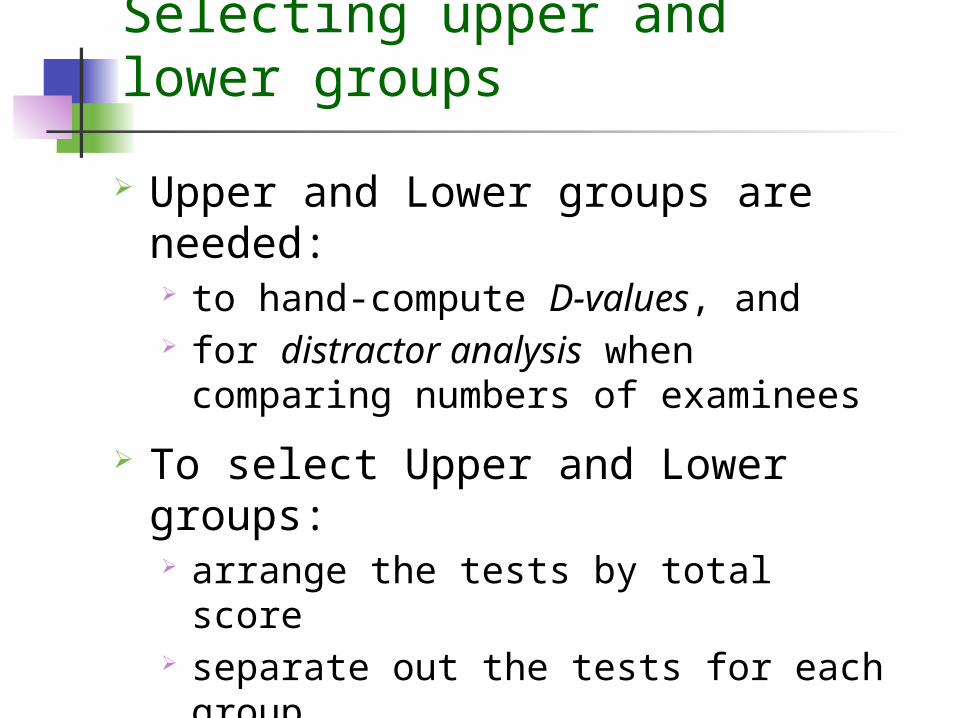
Selecting upper and lower groups
Upper and Lower groups are needed: to hand-compute D-values, and for distractor analysis when
comparing numbers of examinees
To select Upper and Lower groups: arrange the tests by total score separate out the tests for each group
top half becomes Upper group, and bottom half becomes Lower group
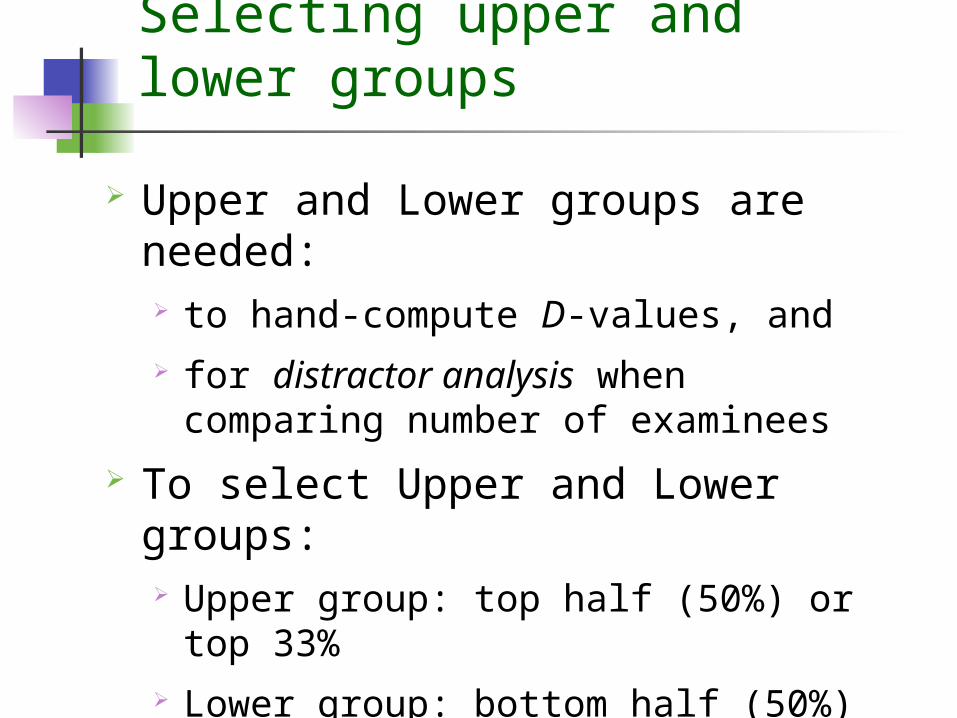
Upper and Lower groups are needed: to hand-compute D-values, and for distractor analysis when
comparing number of examinees
To select Upper and Lower groups: Upper group: top half (50%) or top
33% Lower group: bottom half (50%) or
bottom 33%
Selecting upper and lower groups
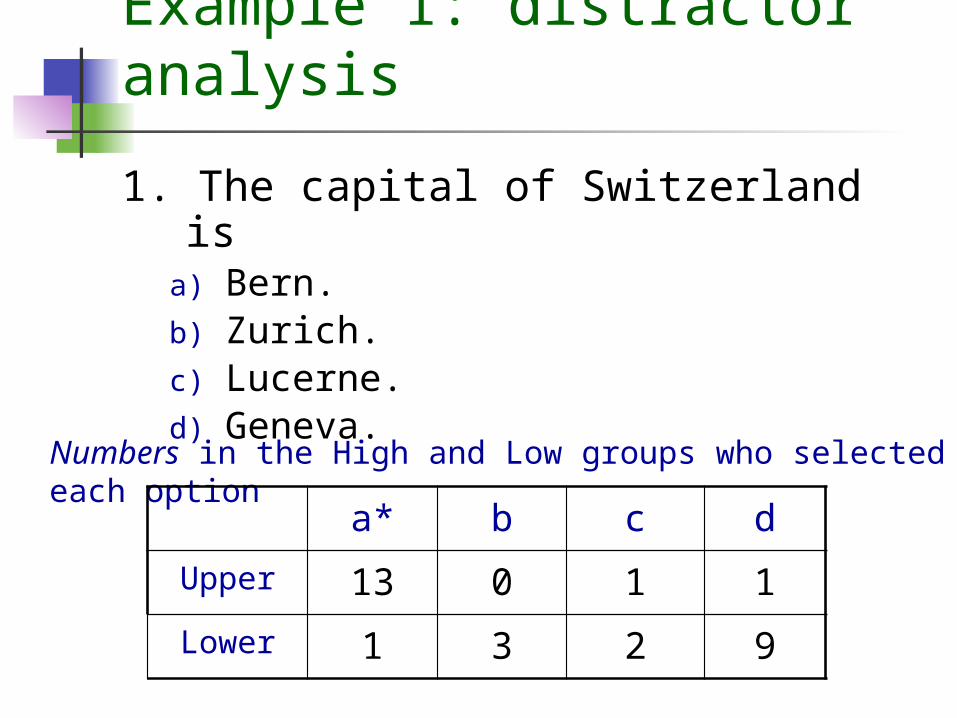
1. The capital of Switzerland isa) Bern.b) Zurich.c) Lucerne.d) Geneva.
Numbers in the High and Low groups who selected each option
Example 1: distractor analysis
a* b c d
Upper 13 0 1 1
Lower 1 3 2 9

2. The most important part of test planning is creating:
a) sound instruction.b) a test blueprint.c) an item analysis plan.d) the grading curve.
Numbers in the High and Low groups who selected each option
Example 2: distractor analysis
a b* c d
Upper 1 8 1 0
Lower 2 8 0 0

3. Which type of essay item contains the most explicit instructions to students?
a) extended responseb) fixed responsec) explicit responsed) restricted response
a b c* d
Upper 3 1 2 14
Lower 4 1 7 8
Numbers in the High and Low groups who selected each option
Example 3: distractor analysis

Statistical Concepts of 2PL IRT model Analysis

Two-Parameter Logistic Model
)](exp[1
)](exp[),,|1(
iji
ijiiijijXP
47
Alpha represents item discrimination The value is positive
Beta represents item difficulty with the mean of 0 and the SD of 1 Items with the negative values = easy items Items with the positive values = hard items

Statistical Concepts of DIF Analysis
49
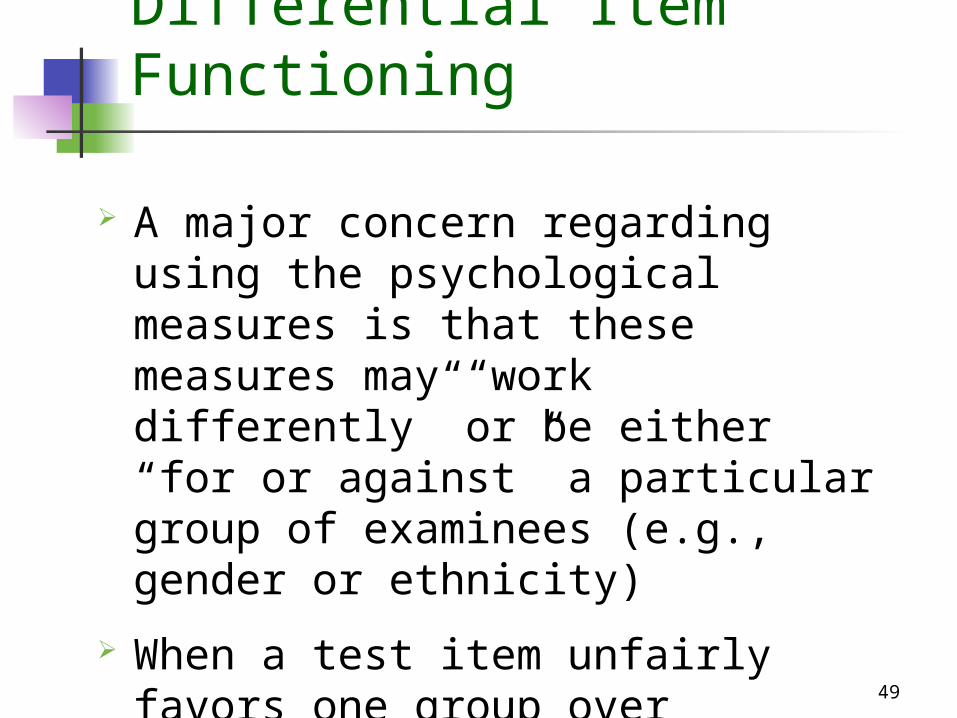
Differential Item Functioning
A major concern regarding using the psychological measures is that these measures may “work differently” or be either “for or against” a particular group of examinees (e.g., gender or ethnicity)
When a test item unfairly favors one group over another, it can be said to show differential item functioning or DIF

50
Uniform or consistent DIF

51
Non-uniform or crossing DIF

52
Mantel Haenszel chi-square
0 1 Total
Reference Bt At NRt
Focal Dt Ct NFt
Total M0t M1t Tt
1
1
1
1L
t t
tt
L
t t
tt
MH
T
CBT
DA
subscript t = individual raw score

53
Mantel Haenszel chi-square
Controlling for the observed score, we want to see if the proportion correct for the focal group is equal to that for the reference group on an item
The MH statistic consists of a series of 2x2 contingency tables MH = 1 : No DIF MH < 1: DIF and favor the focal group
(dummy=0) if p < .05 MH > 1: DIF and favor the reference group
(dummy=1) if p < .05
Field Test Analyses

Test Statistics for Three Subjects
STATISTIC AnatomyN 269
USED_N 269MEAN 12.364
STD 3.337MIN 4Q1 10
MEDIAN 12Q3 15
MAX 21SKEWNESS -0.102KURTOSIS -0.447
ALPHA 0.533SEM 2.281
STATISTIC PrecalculusN 210
USED_N 210MEAN 9.748
STD 2.978MIN 2Q1 8
MEDIAN 10Q3 11
MAX 20SKEWNESS 0.378KURTOSIS 0.679
ALPHA 0.506SEM 2.093
STATISTIC Phy-SciN 183
USED_N 183MEAN 12.852
STD 4.141MIN 4Q1 10
MEDIAN 13Q3 16
MAX 25SKEWNESS 0.088KURTOSIS -0.658
ALPHA 0.626SEM 2.531

Item difficulty
Physical Science(31 items)
0-0.10 (1 item) 22
0.11-0.20 (2 items) 11, 28
0.21-0.30 (5 items) 16, 27, 9, 6, 20
0.31-0.70 (12 items) 30, 18, 12, 25, 31, 15, 2, 19, 24, 13, 26, 29, 21, 10, 23, 8, 7, 4, 3,
17, 5, 14
0.71-0.80 (1 item) 1
0.81-0.90 0 items
0.90-1.00 0 items
Item difficulty
Anatomy(27 items)
0-0.1 (0 items)
0.1-0.2 (2 items) 13, 2
0.2-0.3 (6 items) 16, 8, 27, 3, 10, 20
0.3-0.7 (14 items) 17, 4, 9, 14, 11, 5, 18, 26, 25, 7, 15, 22, 21,
24
0.7-0.8 (3 items) 12, 19, 1
0.8-0.9 (2 items) 23, 6
0.9-1.0 (0 items)
Item DifficultyItem
difficultyPre-calculus(21 items)
0-0.1 (0 Items)
0.1-0.2 (2 Items) 19, 3
0.2-0.3 (1 Item) 14, 1
0.3-0.7 (14 Items) 21, 10, 11, 18, 12, 20, 8, 16, 17, 15, 14, 6,
13, 2 0.7-0.8 (3 Items) 7, 5, 9
0.8-0.9 (0 Items)
0.9-1.0 (0 Items)

Value Physical Science31 items
Negative Value
(6 items) 11, 22, 20, 12, 31, 1
0-0.10 (2 items) 21, 5
0.10-0.20 (8 items) 23, 19, 6, 28, 25, 18, 10, 16
0.20-0.30 (6 items) 8, 3, 15, 2, 30, 27
Above 0.30
(9 items) 13, 7, 17, 24, 29, 9, 14, 26, 4
Value Pre-calculus27 items
Negative Value
(3 items) 3, 17, 13
0-0.10 (6 items) 16, 9, 20, 10, 27, 2
0.11-0.20 (9 items) 15, 4, 11, 26, 18, 12, 5,
14, 80.21-0.30 (9 items) 7, 1,
25, 22, 23, 21, 24, 6, 19
Above 0.30
0 items
Item Discrimination (Corrected point-biserial correlation)
Value Pre-calculus21 items
Negative Value
(1 Item) 19
0-0.10 (2 Items) 11, 3
0.10-0.20 (13 Items) 9, 10, 2, 18, 8, 5, 17, 21, 1,
13, 14, 4, 120.20-0.30 (5 Items) 16, 15, 7,
6, 20
Above 0.30
(0 Items)

Value Number of items
Negative Value
(2 items) 11, 22
0-0.10 (4 items) 20, 1, 12, 31
0.11-0.20 (8 items) 28, 21, 23, 5, 19, 25, 6, 16
0.21-0.30 (6 items) 10, 3, 8, 27, 18, 9
Above 0.30 (10 items) 15, 30, 2, 17, 13, 24, 14, 7, 29, 26, 4
Value Anatomy27 items
Negative Value
(0 items)
0-0.10 (5 items) 13, 3, 16, 17,2
0.11-0.20 (7 items) 27, 9, 10, 20, 12, 6, 26
0.21-0.30 (11 items) 8, 4, 11, 1, 15, 18, 23, 15, 5, 7
Above 0.30
(5 items) 25, 24, 19, 22, 21
Item Discrimination(Two-Group Approach)
Value Pre-calculus21 items
Negative Value
(0 Items)
0-0.10 (3 Items) 19, 3, 18
0.10-0.20 (7 Items) 21, 14, 9, 17, 10, 2, 11
0.20-0.30 (7 Items) 1, 5, 12, 13, 8, 7, 16
Above 0.30
(4 Items) 15, 20, 4, 6

Alpha Difference
Physical Science31 items
Negative Value
(8 items) 11, 20, 12, 31, 22, 1, 21, 5
0-0.005 (6 items) 23, 19, 6, 28, 25, 18
0.006-0.01 (3 items) 10, 16, 8
Above 0.01 (14 items) 3, 15, 2, 27, 30, 13, 7, 17, 24, 9, 29,
14, 26, 4
Alpha Difference
Anatomy27 items
Negative Value
(7 items) 3, 17, 9, 16, 13, 20, 10
0-0.005 (3 items) 27, 2, 15
0.005-0.01
(4 items) 4, 11, 26, 18
Above 0.01
(13 items) 12, 5, 14, 8, 1, 7, 25, 23, 6, 22, 21, 19,
24
Alpha Difference(Alpha and Alpha When deleted)
Alpha Difference
Pre-Calculus21 items
Negative Value
(2 Items) 19, 11
0-0.005 (3 Items) 3, 9, 10
0.005-0.01 (5 Items) 2, 8, 18, 5, 17
Above 0.01
(14 Items) 21, 1, 13, 14, 4, 12, 16, 7, 15,
6, 20
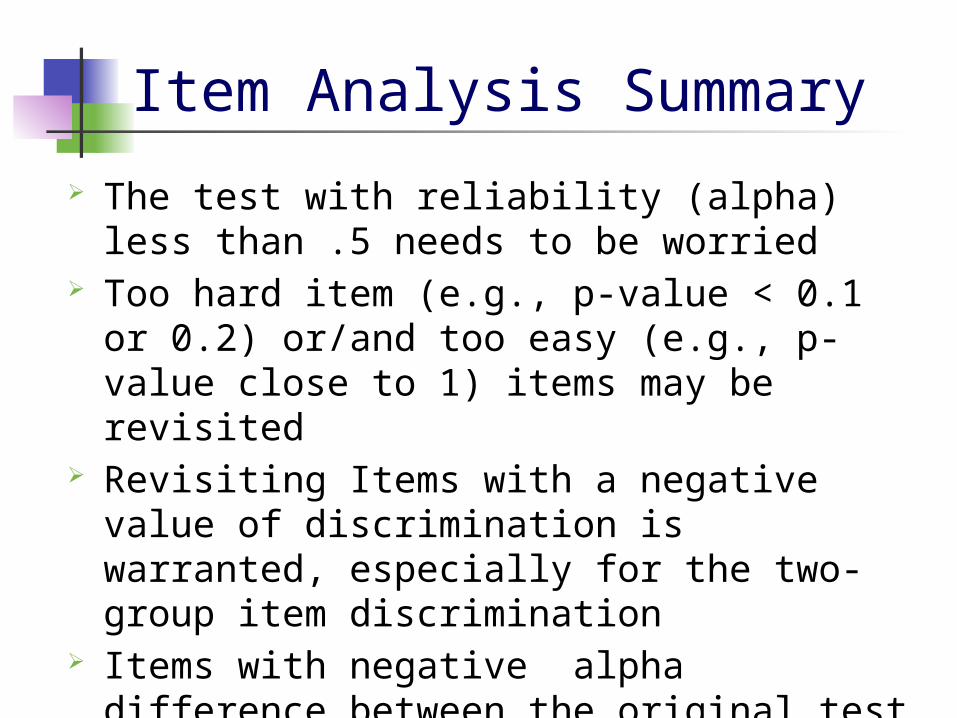
Item Analysis Summary
The test with reliability (alpha) less than .5 needs to be worried
Too hard item (e.g., p-value < 0.1 or 0.2) or/and too easy (e.g., p-value close to 1) items may be revisited
Revisiting Items with a negative value of discrimination is warranted, especially for the two-group item discrimination
Items with negative alpha difference between the original test alpha and the test alpha when deleted are not good, either

DIF Results: Precalculus
Girls = 0Boys = 1
Favor boys

DIF Results: Precalculus
Girls = 0Boys = 1
Favor girls

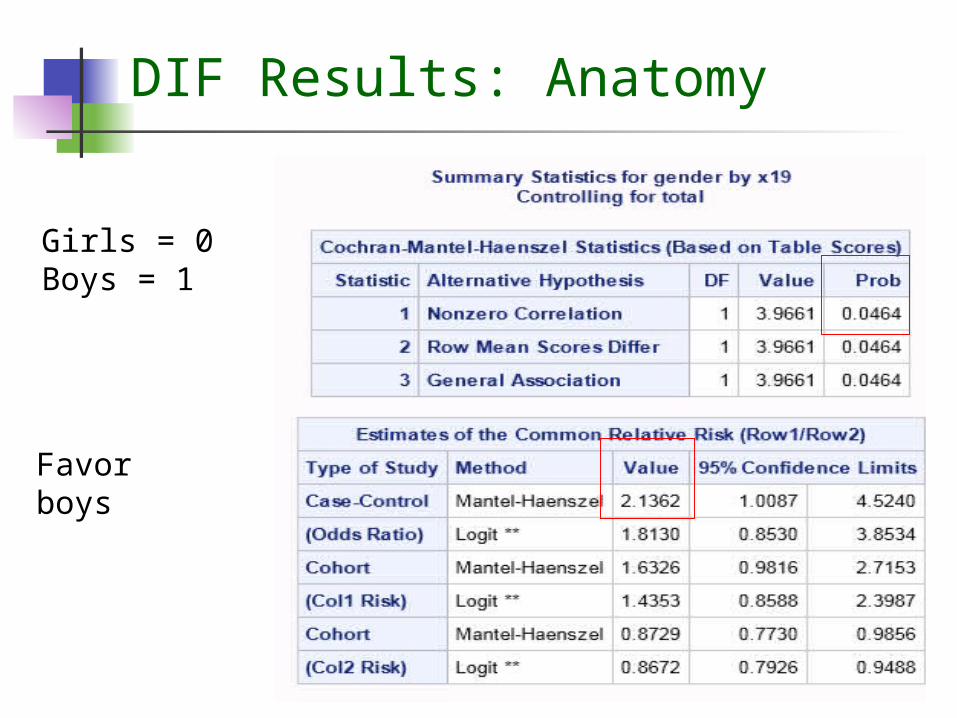
DIF Results: Anatomy
Girls = 0Boys = 1
Favor boys

DIF Results: Anatomy
Girls = 0Boys = 1
Favor girls
DIF Results: Anatomy
Girls = 0Boys = 1
Favor boys

DIF Results: Anatomy
Girls = 0Boys = 1
Favor girls

DIF Results: Anatomy
Girls = 0Boys = 1
Favor girls
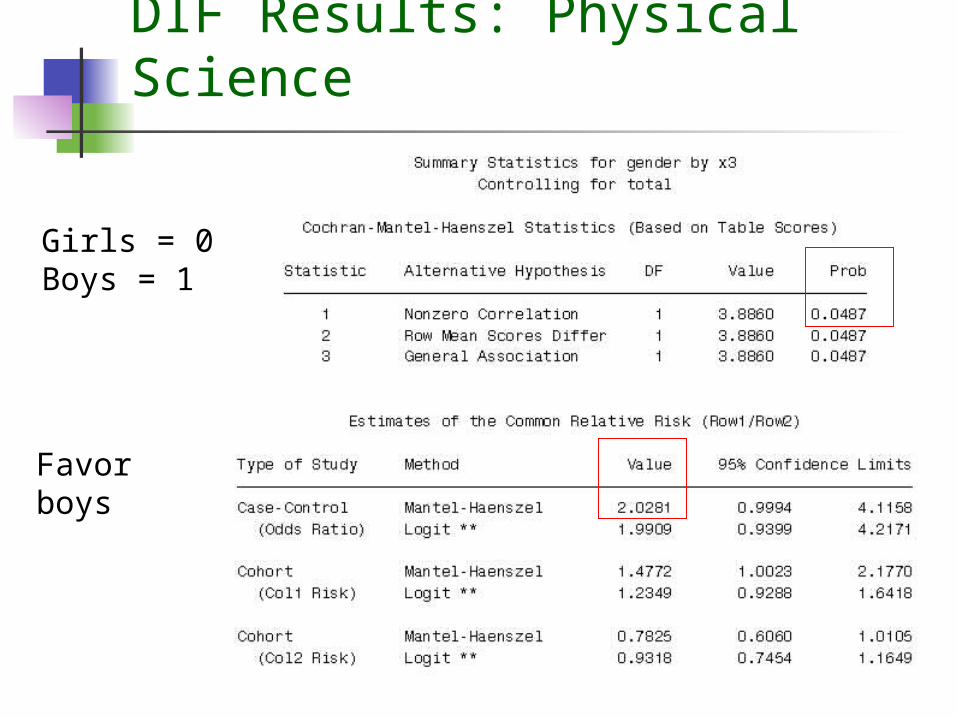
DIF Results: Physical Science
Girls = 0Boys = 1
Favor boys
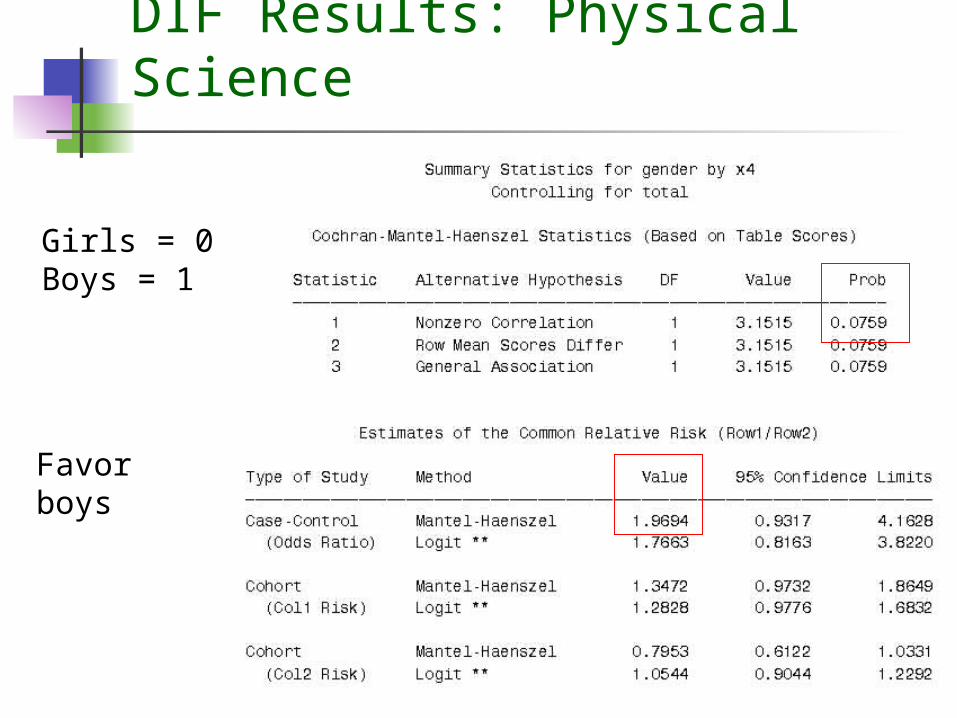
DIF Results: Physical Science
Girls = 0Boys = 1
Favor boys

DIF Results: Physical Science
Girls = 0Boys = 1
Favor girls
Distractor Analysis:Typical Problems and Solutions

Precalculus: Item 29
FrequencyRow Pct
Table of groupB by r19
groupBr19
A B C* D TotalLOWER GROUP 14
27.4521
41.1811
21.575
9.8051
UPPER GROUP 4741.23
3228.07
2723.68
87.02
114
Total 61 53 38 13 165
Frequency Missing = 76

Precalculus: Item 29
The item is a hard item (p = 0.18)

Precalculus: Item 3
The item is a hard item (p = 0.162)
FrequencyRow Pct
Table of groupB by r3
groupBr3
A B C* D TotalLOWER GROUP 20
32.2629
46.779
14.524
6.4562
UPPER GROUP 4030.30
5642.42
3022.73
64.55
132
Total 60 85 39 10 194
Frequency Missing = 47
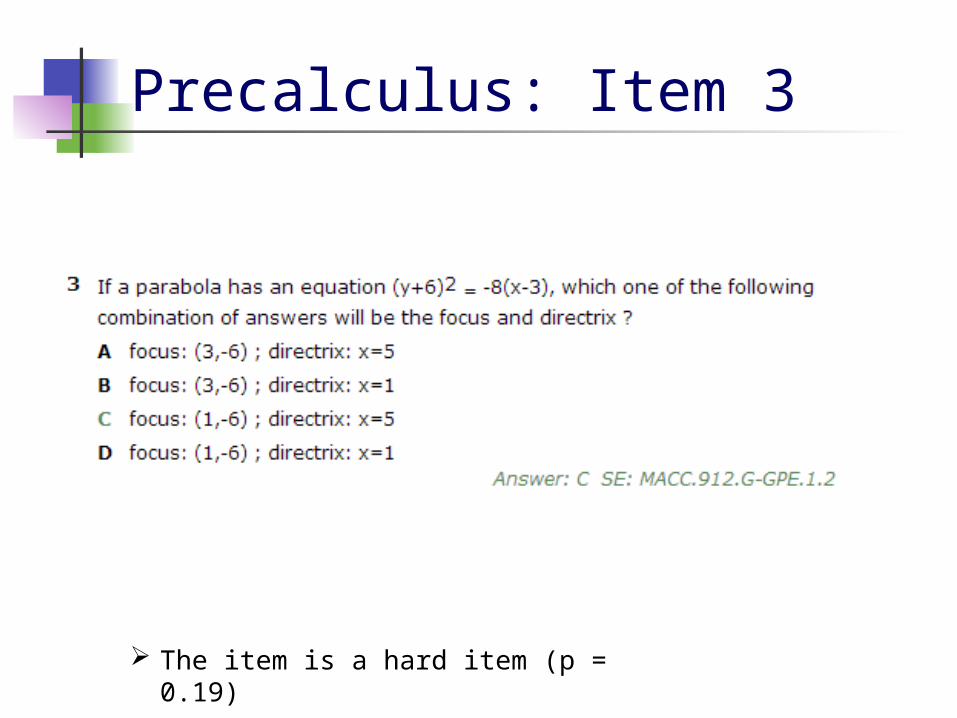
Precalculus: Item 3
The item is a hard item (p = 0.19)
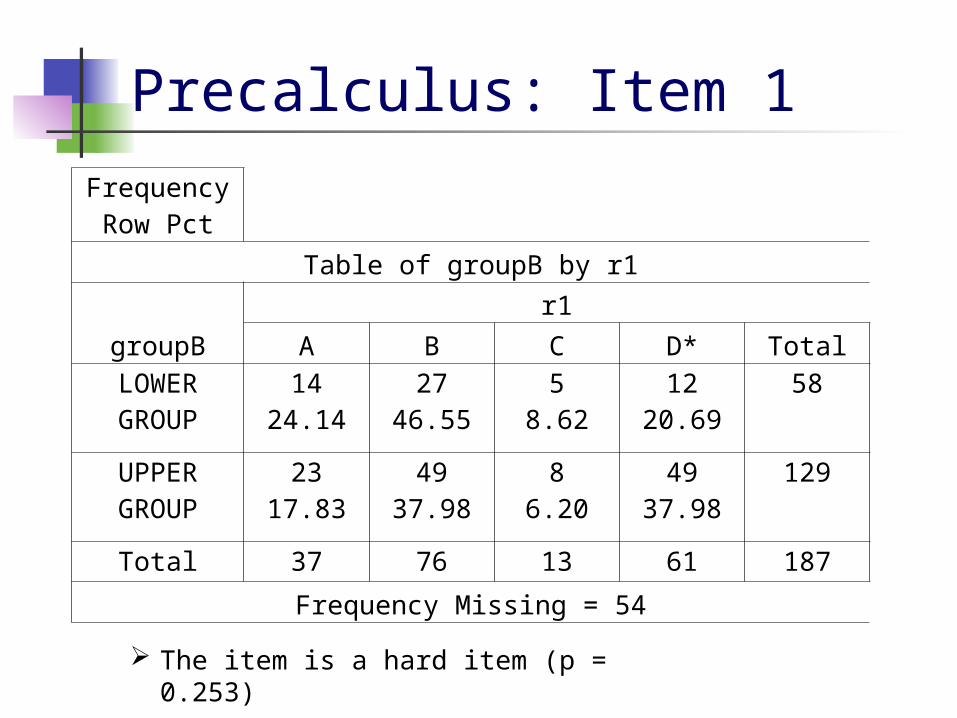
Precalculus: Item 1
The item is a hard item (p = 0.253)
FrequencyRow Pct
Table of groupB by r1
groupBr1
A B C D* TotalLOWER GROUP 14
24.1427
46.555
8.6212
20.6958
UPPER GROUP 2317.83
4937.98
86.20
4937.98
129
Total 37 76 13 61 187
Frequency Missing = 54

Precalculus: Item 1
The item is a hard item (p = 0.30)

Precalculus: Item 14
Table of groupB by r14
groupBr14
- A B C D* TotalLOWER GROUP 5
5.568
8.893
3.3357
63.3317
18.8990
UPPER GROUP 54.55
43.64
43.64
5953.64
3834.55
110
Total 10 12 7 116 55 200Frequency Missing = 10
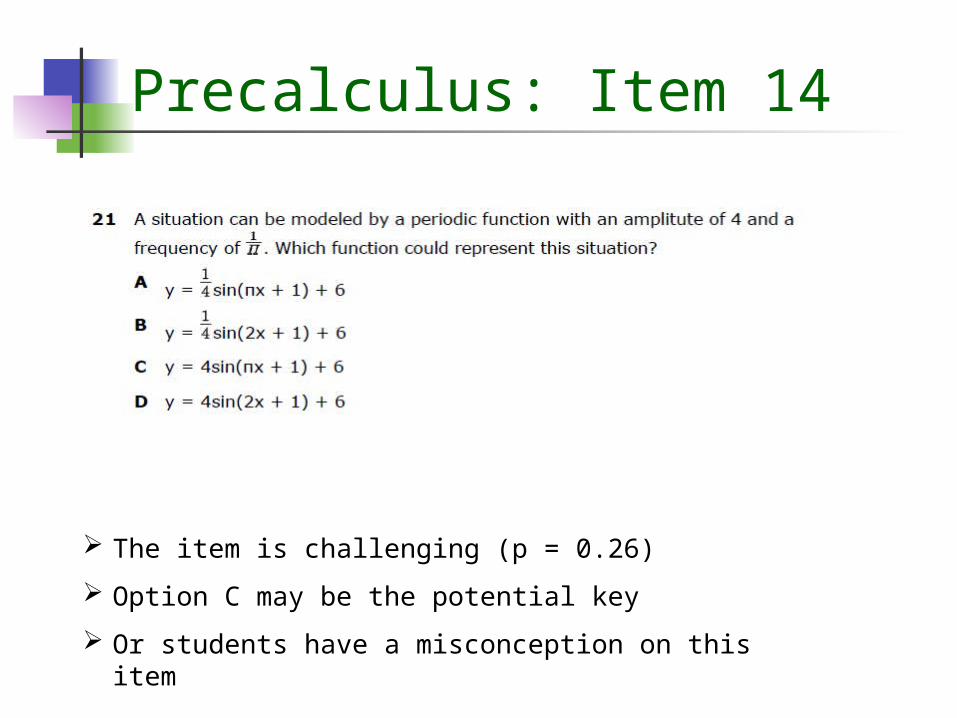
Precalculus: Item 14
The item is challenging (p = 0.26)
Option C may be the potential key
Or students have a misconception on this item

Precalculus: Good Item
The item is challenging (p = 0.266)
Discriminating well
Table of groupB by r21
groupBr21
- A B* C D TotalLOWER GROUP 33
33.3318
18.1823
23.2310
10.1015
15.1599
UPPER GROUP 2320.72
1614.41
4338.74
1816.22
119.91
111
Total 56 34 66 28 26 210

Precalculus: Good Item
The item is challenging (p = 0.31)
Discriminating well
However, this item shows DIF and favors girls

Summary for Precalculus
Some items need to revisit: Items: 19, 3, 1, and 14
Develop some easy items (p=.70-.90)
Two DIF items Items 4 and 21

Anatomy: Hard Item
The item is a hard item (p = 0.271)
Not discriminating well
Table of groupB by r3
groupB
r3
A B C* D TotalLOWER GROUP 20
18.5224
22.2225
23.1539
36.11108
UPPER GROUP 74.38
2817.50
4830.00
7748.13
160
Total 27 52 73 116 268
Frequency Missing = 1

Anatomy: Hard Item
The item is a hard item (p = 0.271)
Not discriminating well

Anatomy: Potential Miskey
The item may have a miskey of Option D
The possible correct key is Option A (Majority of the upper group chose this option)
Table of groupB by r16
groupBr16
A B C D* TotalLOWER GROUP
5248.15
2725.00
109.26
1917.59
108
UPPER GROUP 9257.50
1610.00
127.50
4025.00
160
Total 144 43 22 59 268
Frequency Missing = 1
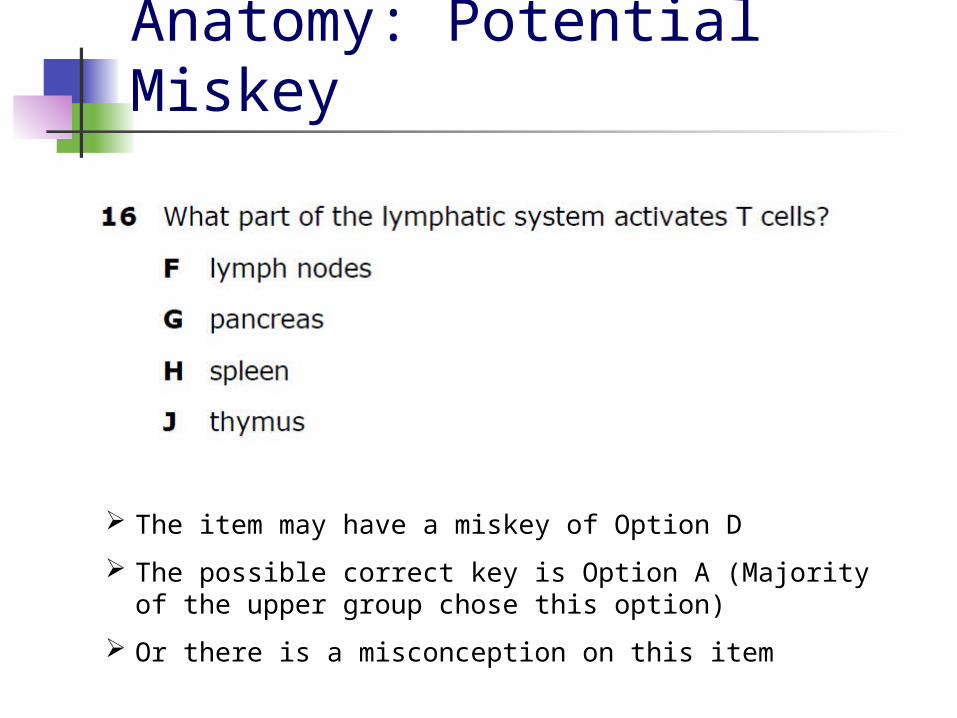
Anatomy: Potential Miskey
The item may have a miskey of Option D
The possible correct key is Option A (Majority of the upper group chose this option)
Or there is a misconception on this item

Anatomy: Good Item
Table of groupB by r25
groupBr25
A B C D* TotalLOWER GROUP
1311.93
3027.52
3229.36
3431.19
109
UPPER GROUP 85.03
2213.84
3119.50
9861.64
159
Total 21 52 63 132 268
Frequency Missing = 1
The item has moderate difficulty level(p = 0.491)
Discriminating well
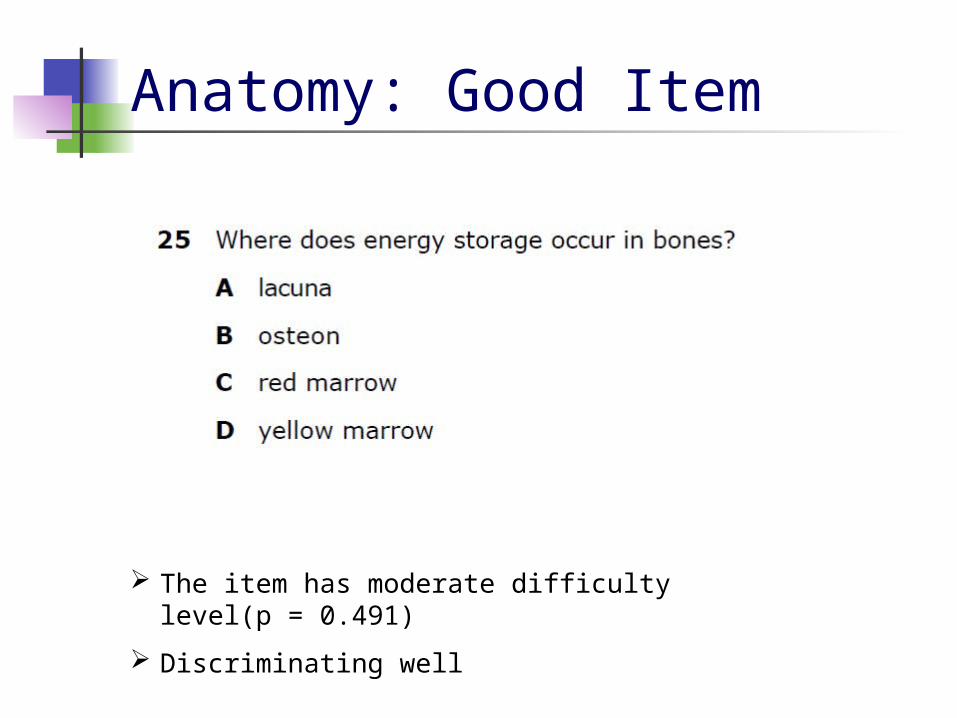
Anatomy: Good Item
The item has moderate difficulty level(p = 0.491)
Discriminating well
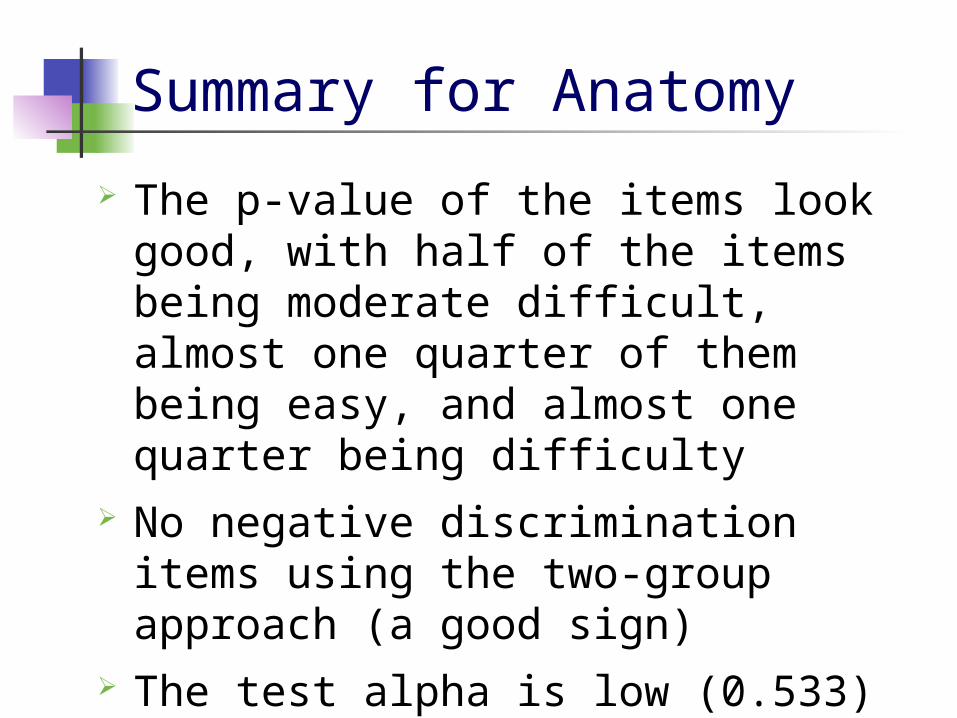
Summary for Anatomy
The p-value of the items look good, with half of the items being moderate difficult, almost one quarter of them being easy, and almost one quarter being difficulty
No negative discrimination items using the two-group approach (a good sign)
The test alpha is low (0.533) DIF: Items 14, 19 (favoring boys) and
items15, 22, 26 (favoring girls)

Physical Science: Item too hard
The item is a hard item (p = 0.164)
Table of groupB by r28
groupBr28
- A B C D* TotalLOWER GROUP
22.33
1922.09
3743.02
1922.09
910.47
86
UPPER GROUP
2020.62
44.12
4445.36
88.25
2121.65
97
Total 22 23 81 27 30 183

Physical Science: Item too hard
The item is a hard item (p = 0.164)

Physical Science: Potential Miskey
The item may have a miskey of Option C
The possible correct key is Option A (Majority of the upper group chose this option)
Table of groupB by r11
groupBr11
A B C* D TotalLOWER GROUP 35
40.7026
30.2317
19.778
9.3086
UPPER GROUP 6668.04
1111.34
1111.34
99.28
97
Total 101 37 28 17 183
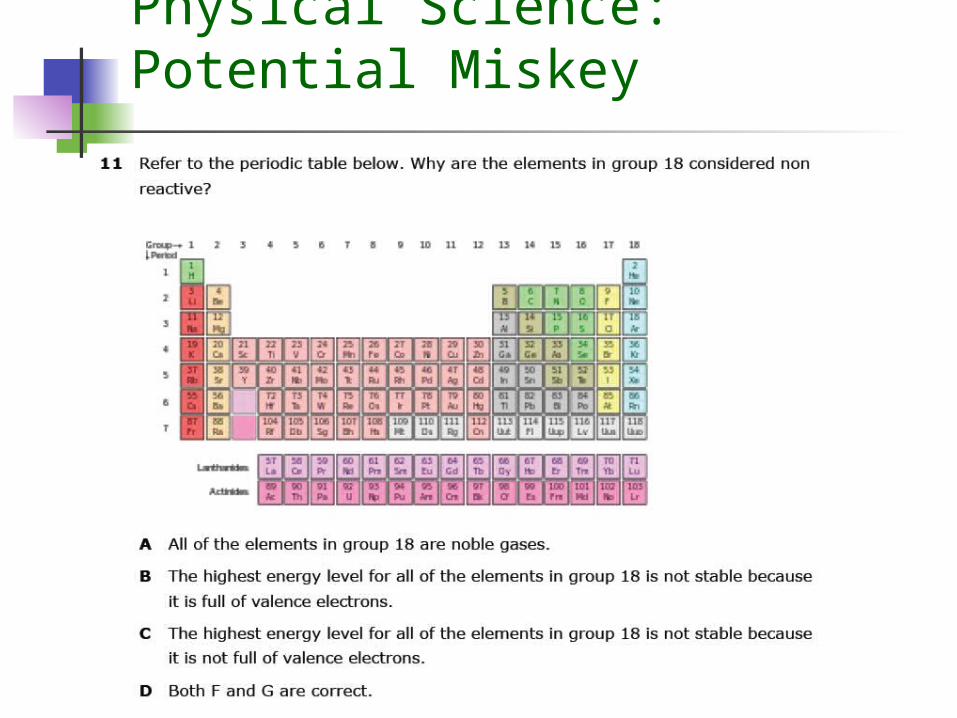
Physical Science: Potential Miskey

Physical Science: Good Item
The item has moderate difficulty level(p = 0.491)
Discriminating well
Table of groupB by r27
groupBr27
A B C D* TotalLOWER GROUP 13
15.1230
34.8834
39.539
10.4786
UPPER GROUP 99.28
1919.59
3334.02
3637.11
97
Total 22 49 67 45 183

Physical Science: Good Item
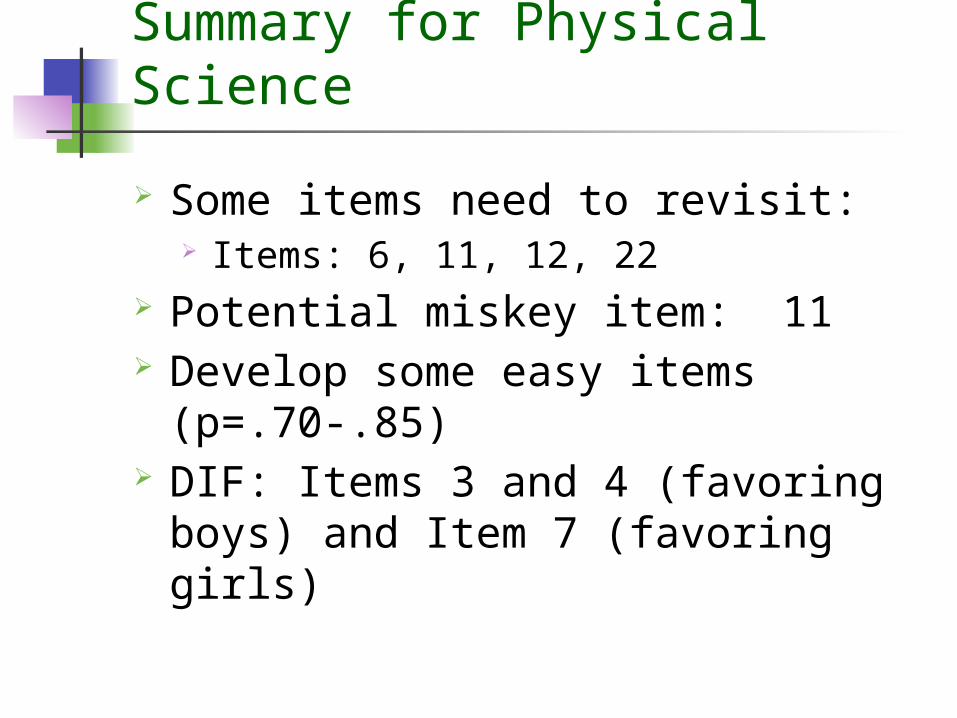
Summary for Physical Science
Some items need to revisit: Items: 6, 11, 12, 22
Potential miskey item: 11 Develop some easy items
(p=.70-.85) DIF: Items 3 and 4 (favoring boys)
and Item 7 (favoring girls)