Field Techniques forfor Measuring Vegetation Field Techniques forfor Measuring Vegetation Session...
20
1 Field Techniques Field Techniques for for Measuring Vegetation Measuring Vegetation Session Objectives Session Objectives Describe qualitative techniques suitable for plant Describe qualitative techniques suitable for plant and vegetation monitoring. and vegetation monitoring. Describe advantages, disadvantages, and uses of Describe advantages, disadvantages, and uses of meas res of density freq ency and cover meas res of density freq ency and cover measures of density, frequency, and cover. measures of density, frequency, and cover. Compare methods for measuring cover: Compare methods for measuring cover: Visual estimation in Visual estimation in quadrats quadrats Line intercepts Line intercepts Point intercepts Point intercepts Qualitative vs. Quantitative Qualitative vs. Quantitative Monitoring Monitoring Qualitative monitoring can be quite effective Qualitative monitoring can be quite effective It’s the most common monitoring approach It’s the most common monitoring approach Photographs often more effective than statistics Photographs often more effective than statistics particularly if change is obvious particularly if change is obvious Photos, presence/absence, checklists Photos, presence/absence, checklists Still need management objective Still need management objective Quantitative monitoring must be used wisely Quantitative monitoring must be used wisely Useless without good mgmt/sampling objectives and Useless without good mgmt/sampling objectives and management response management response Pilot study necessary before sinking too much $$$ Pilot study necessary before sinking too much $$$ Don’t use quantitative approach if can’t do it right Don’t use quantitative approach if can’t do it right
Transcript of Field Techniques forfor Measuring Vegetation Field Techniques forfor Measuring Vegetation Session...
1
Field TechniquesField Techniquesforfor
Measuring VegetationMeasuring Vegetation
Session ObjectivesSession Objectives
Describe qualitative techniques suitable for plant Describe qualitative techniques suitable for plant and vegetation monitoring.and vegetation monitoring.Describe advantages, disadvantages, and uses of Describe advantages, disadvantages, and uses of meas res of density freq ency and covermeas res of density freq ency and covermeasures of density, frequency, and cover.measures of density, frequency, and cover.Compare methods for measuring cover:Compare methods for measuring cover:
Visual estimation in Visual estimation in quadratsquadratsLine interceptsLine interceptsPoint interceptsPoint intercepts
Qualitative vs. Quantitative Qualitative vs. Quantitative MonitoringMonitoring
Qualitative monitoring can be quite effectiveQualitative monitoring can be quite effectiveIt’s the most common monitoring approachIt’s the most common monitoring approachPhotographs often more effective than statisticsPhotographs often more effective than statisticsparticularly if change is obviousparticularly if change is obviousPhotos, presence/absence, checklistsPhotos, presence/absence, checklistsStill need management objectiveStill need management objective
Quantitative monitoring must be used wiselyQuantitative monitoring must be used wiselyUseless without good mgmt/sampling objectives and Useless without good mgmt/sampling objectives and management responsemanagement responsePilot study necessary before sinking too much $$$Pilot study necessary before sinking too much $$$Don’t use quantitative approach if can’t do it rightDon’t use quantitative approach if can’t do it right
2
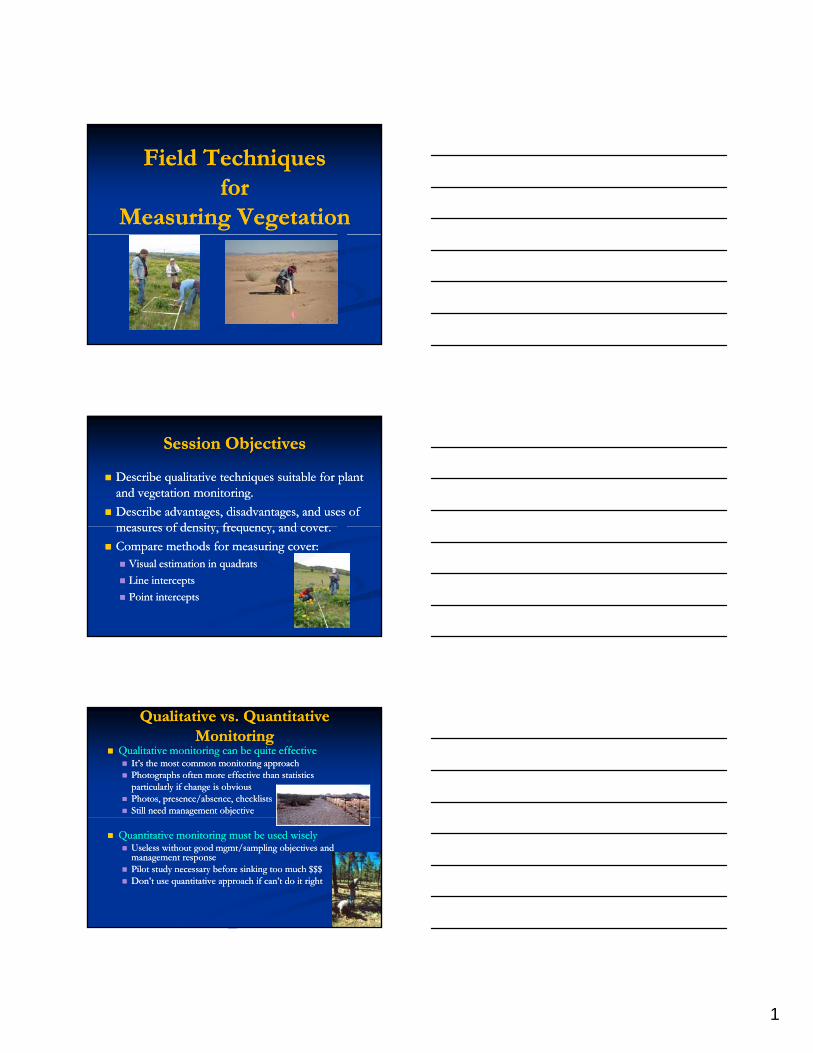
Qualitative TechniquesQualitative Techniques
Presence/absencePresence/absenceVisual estimates of population size Visual estimates of population size Estimates of population conditionEstimates of population conditionSite condition assessmentSite condition assessmentSite condition assessmentSite condition assessmentBoundary mappingBoundary mappingPhoto plotsPhoto plotsPhoto pointsPhoto points
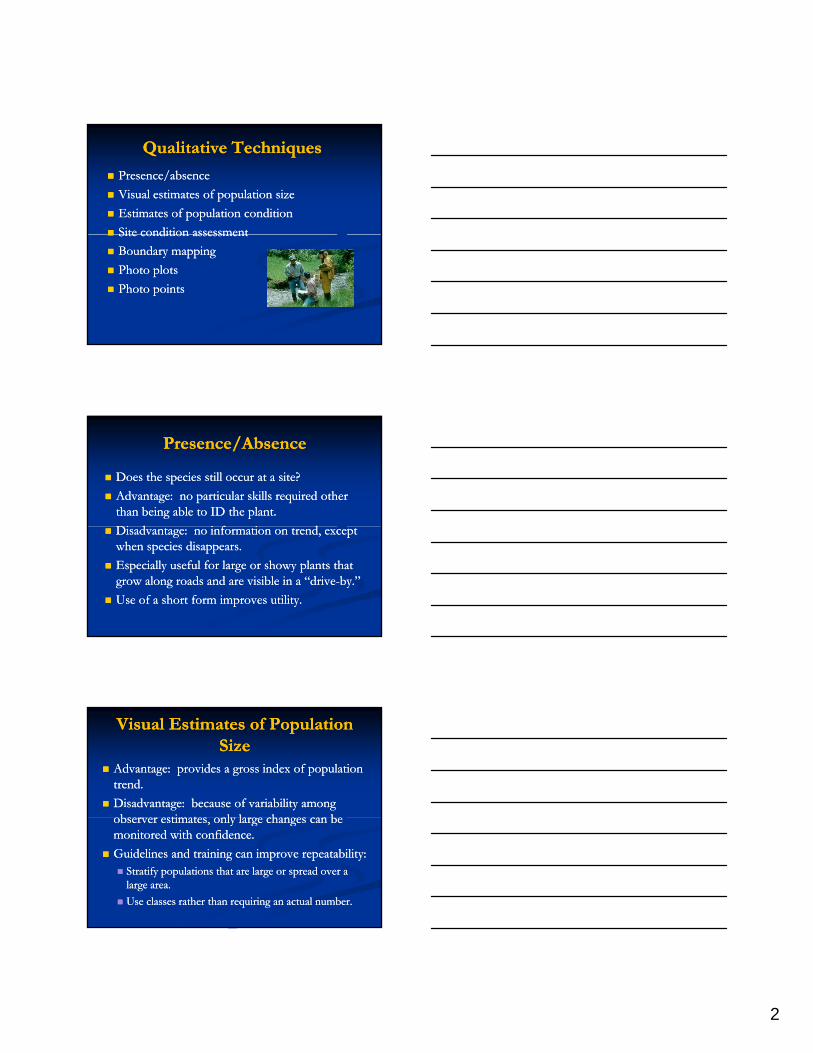
Presence/AbsencePresence/Absence
Does the species still occur at a site?Does the species still occur at a site?Advantage: no particular skills required other Advantage: no particular skills required other than being able to ID the plant.than being able to ID the plant.Di d i f i dDi d i f i dDisadvantage: no information on trend, except Disadvantage: no information on trend, except when species disappears.when species disappears.Especially useful for large or showy plants that Especially useful for large or showy plants that grow along roads and are visible in a “drivegrow along roads and are visible in a “drive--by.”by.”Use of a short form improves utility.Use of a short form improves utility.
Visual Estimates of Population Visual Estimates of Population SizeSize
Advantage: provides a gross index of population Advantage: provides a gross index of population trend.trend.Disadvantage: because of variability among Disadvantage: because of variability among observer estimates only large changes can beobserver estimates only large changes can beobserver estimates, only large changes can be observer estimates, only large changes can be monitored with confidence.monitored with confidence.Guidelines and training can improve repeatability:Guidelines and training can improve repeatability:
Stratify populations that are large or spread over a Stratify populations that are large or spread over a large area.large area.Use classes rather than requiring an actual number.Use classes rather than requiring an actual number.
3
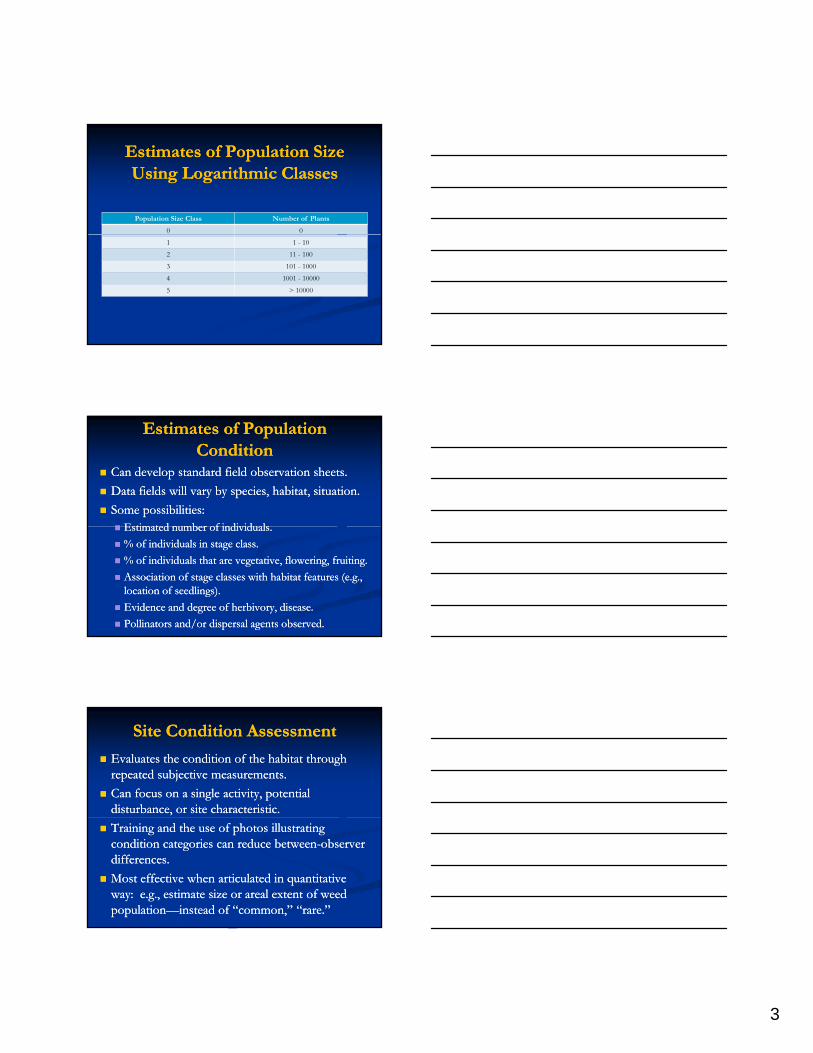
Estimates of Population Size Estimates of Population Size Using Logarithmic ClassesUsing Logarithmic Classes
Population Size Class Number of Plants
0 0
1 1 - 10
2 11 - 100
3 101 - 1000
4 1001 - 10000
5 > 10000
Estimates of Population Estimates of Population ConditionCondition
Can develop standard field observation sheets.Can develop standard field observation sheets.Data fields will vary by species, habitat, situation.Data fields will vary by species, habitat, situation.Some possibilities:Some possibilities:
Estimated n mber of indi id alsEstimated n mber of indi id alsEstimated number of individuals.Estimated number of individuals.% of individuals in stage class.% of individuals in stage class.% of individuals that are vegetative, flowering, fruiting.% of individuals that are vegetative, flowering, fruiting.Association of stage classes with habitat features (e.g., Association of stage classes with habitat features (e.g., location of seedlings).location of seedlings).Evidence and degree of Evidence and degree of herbivoryherbivory, disease., disease.Pollinators and/or dispersal agents observed.Pollinators and/or dispersal agents observed.
Site Condition AssessmentSite Condition Assessment
Evaluates the condition of the habitat through Evaluates the condition of the habitat through repeated subjective measurements.repeated subjective measurements.Can focus on a single activity, potential Can focus on a single activity, potential disturbance, or site characteristic.disturbance, or site characteristic.Training and the use of photos illustrating Training and the use of photos illustrating condition categories can reduce betweencondition categories can reduce between--observer observer differences.differences.Most effective when articulated in quantitative Most effective when articulated in quantitative way: e.g., estimate size or areal extent of weed way: e.g., estimate size or areal extent of weed populationpopulation——instead of “common,” “rare.”instead of “common,” “rare.”
4
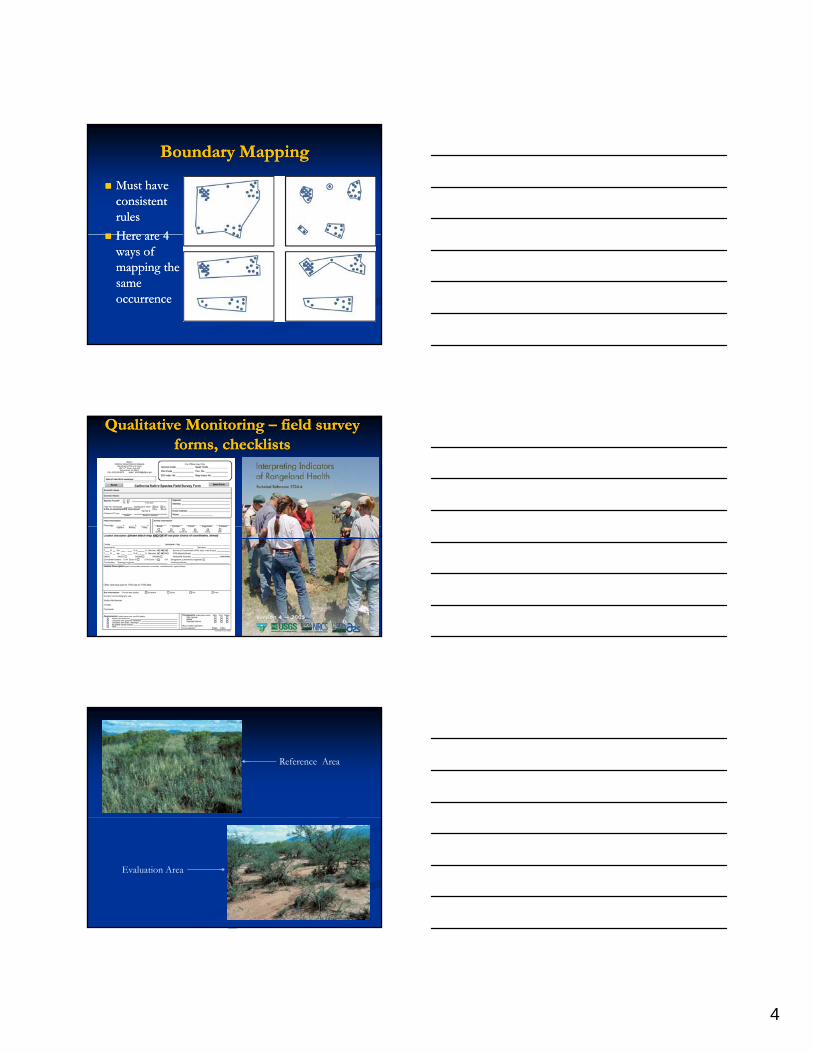
Boundary MappingBoundary Mapping
Must have Must have consistent consistent rulesrulesHere are 4Here are 4Here are 4 Here are 4 ways of ways of mapping the mapping the same same occurrenceoccurrence
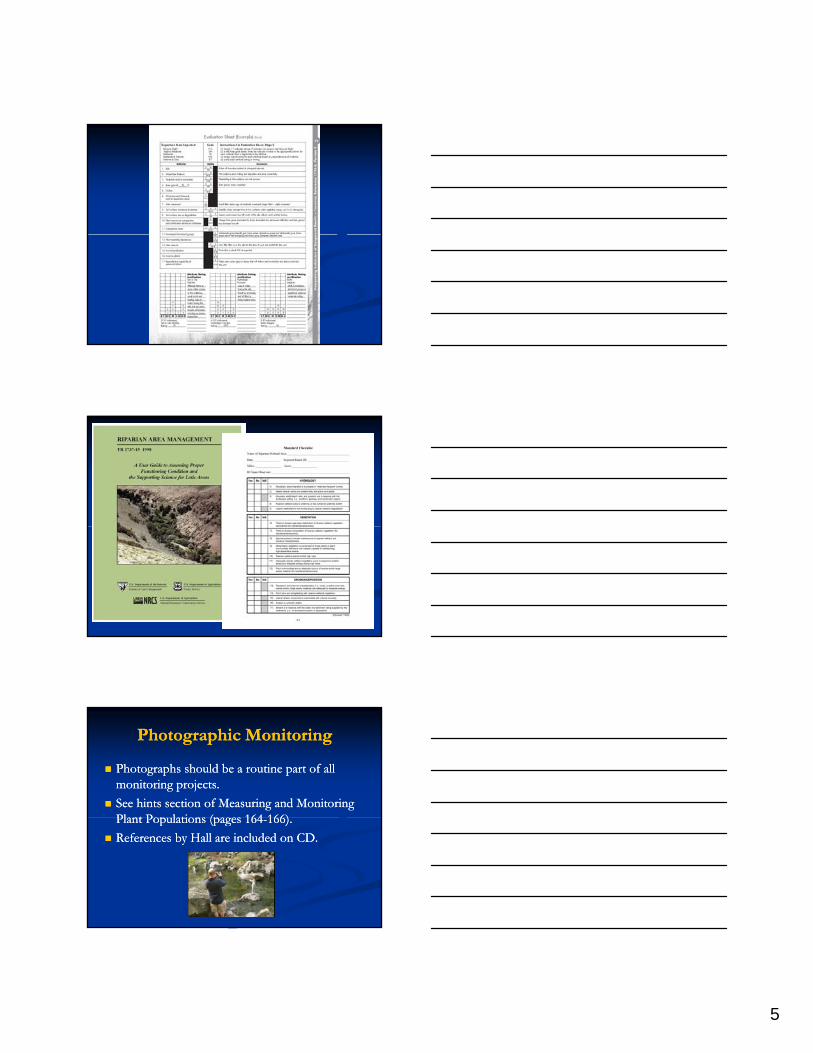
Qualitative Monitoring Qualitative Monitoring –– field survey field survey forms, checklistsforms, checklists
Reference Area
Evaluation Area
5
Photographic MonitoringPhotographic Monitoring
Photographs should be a routine part of all Photographs should be a routine part of all monitoring projects.monitoring projects.See hints section of Measuring and Monitoring See hints section of Measuring and Monitoring Plant Pop lations (pages 164Plant Pop lations (pages 164 166)166)Plant Populations (pages 164Plant Populations (pages 164--166).166).References by Hall are included on CD.References by Hall are included on CD.
6
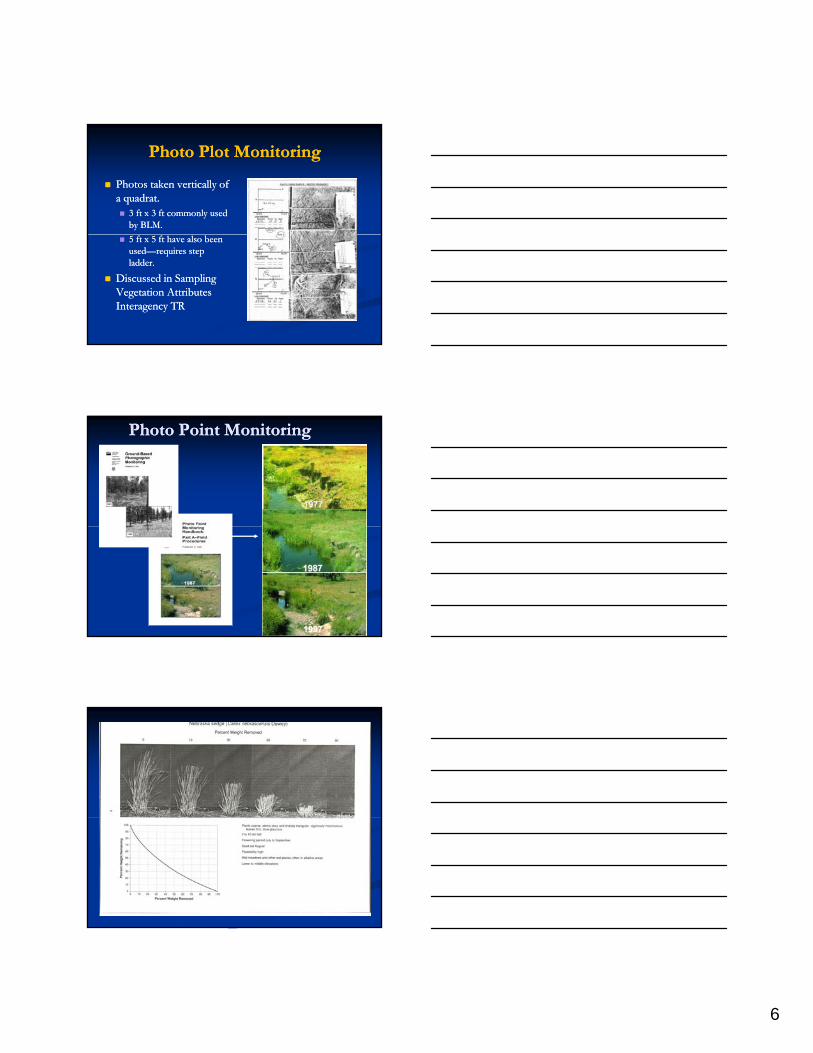
Photo Plot MonitoringPhoto Plot Monitoring
Photos taken vertically of Photos taken vertically of a a quadratquadrat..
3 ft x 3 ft commonly used 3 ft x 3 ft commonly used by BLM.by BLM.5 ft x 5 ft have also been 5 ft x 5 ft have also been usedused——requires step requires step ladder.ladder.
Discussed in Sampling Discussed in Sampling Vegetation Attributes Vegetation Attributes Interagency TRInteragency TR
Photo Point Photo Point MonitoringMonitoring
7
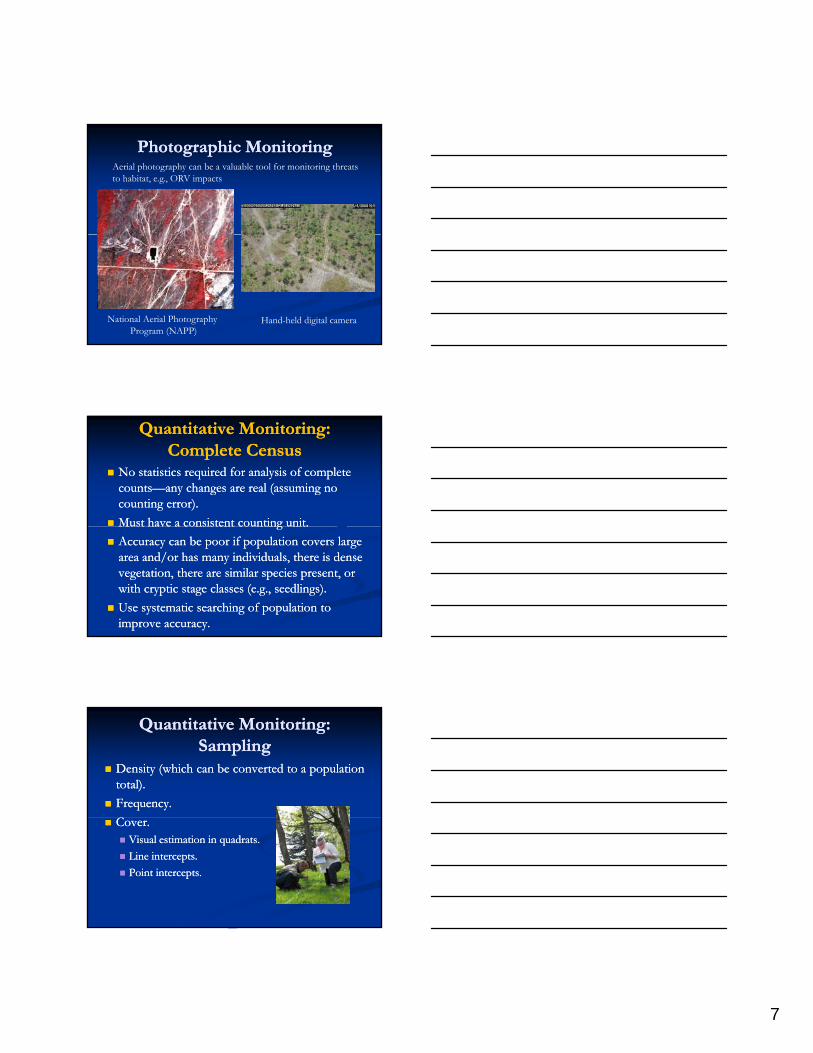
Photographic MonitoringPhotographic MonitoringAerial photography can be a valuable tool for monitoring threatsto habitat, e.g., ORV impacts
National Aerial Photography Program (NAPP)
Hand-held digital camera
Quantitative Monitoring: Quantitative Monitoring: Complete CensusComplete Census
No statistics required for analysis of complete No statistics required for analysis of complete countscounts——any changes are real (assuming no any changes are real (assuming no counting error).counting error).Must have a consistent counting unit.Must have a consistent counting unit.Must have a consistent counting unit.Must have a consistent counting unit.Accuracy can be poor if population covers large Accuracy can be poor if population covers large area and/or has many individuals, there is dense area and/or has many individuals, there is dense vegetation, there are similar species present, or vegetation, there are similar species present, or with cryptic stage classes (e.g., seedlings).with cryptic stage classes (e.g., seedlings).Use systematic searching of population to Use systematic searching of population to improve accuracy.improve accuracy.
Quantitative Monitoring: Quantitative Monitoring: SamplingSampling
Density (which can be converted to a population Density (which can be converted to a population total).total).Frequency.Frequency.CCCover.Cover.
Visual estimation in Visual estimation in quadratsquadrats..Line intercepts.Line intercepts.Point intercepts.Point intercepts.
8
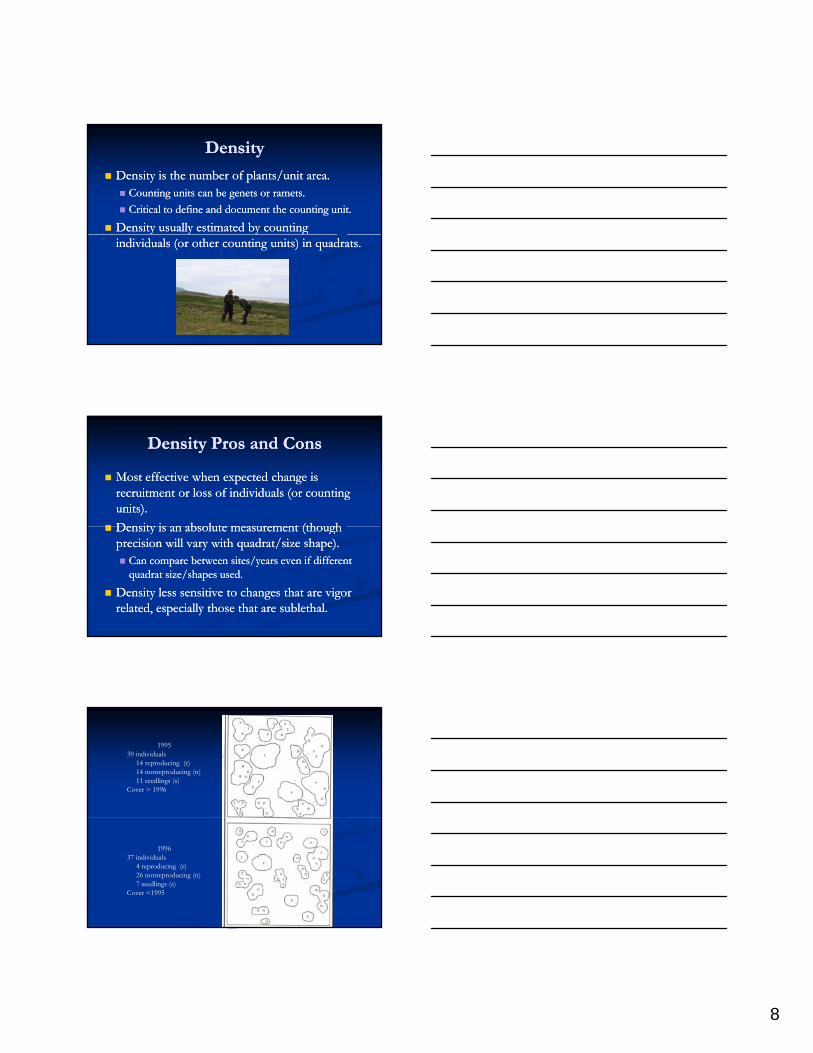
DensityDensity
Density is the number of plants/unit area.Density is the number of plants/unit area.Counting units can be genets or Counting units can be genets or rametsramets..Critical to define and document the counting unit.Critical to define and document the counting unit.
Density usually estimated by counting Density usually estimated by counting ggindividuals (or other counting units) in individuals (or other counting units) in quadratsquadrats..
Density Pros and ConsDensity Pros and Cons
Most effective when expected change is Most effective when expected change is recruitment or loss of individuals (or counting recruitment or loss of individuals (or counting units).units).Density is an absol te meas rement (tho ghDensity is an absol te meas rement (tho ghDensity is an absolute measurement (though Density is an absolute measurement (though precision will vary with precision will vary with quadratquadrat/size shape)./size shape).
Can compare between sites/years even if different Can compare between sites/years even if different quadratquadrat size/shapes used.size/shapes used.
Density less sensitive to changes that are vigor Density less sensitive to changes that are vigor related, especially those that are related, especially those that are sublethalsublethal..
199539 individuals
14 reproducing (r)14 nonreproducing (n)11 seedlings (s)
Cover > 1996
199637 individuals
4 reproducing (r)26 nonreproducing (n)7 seedlings (s)
Cover <1995
9
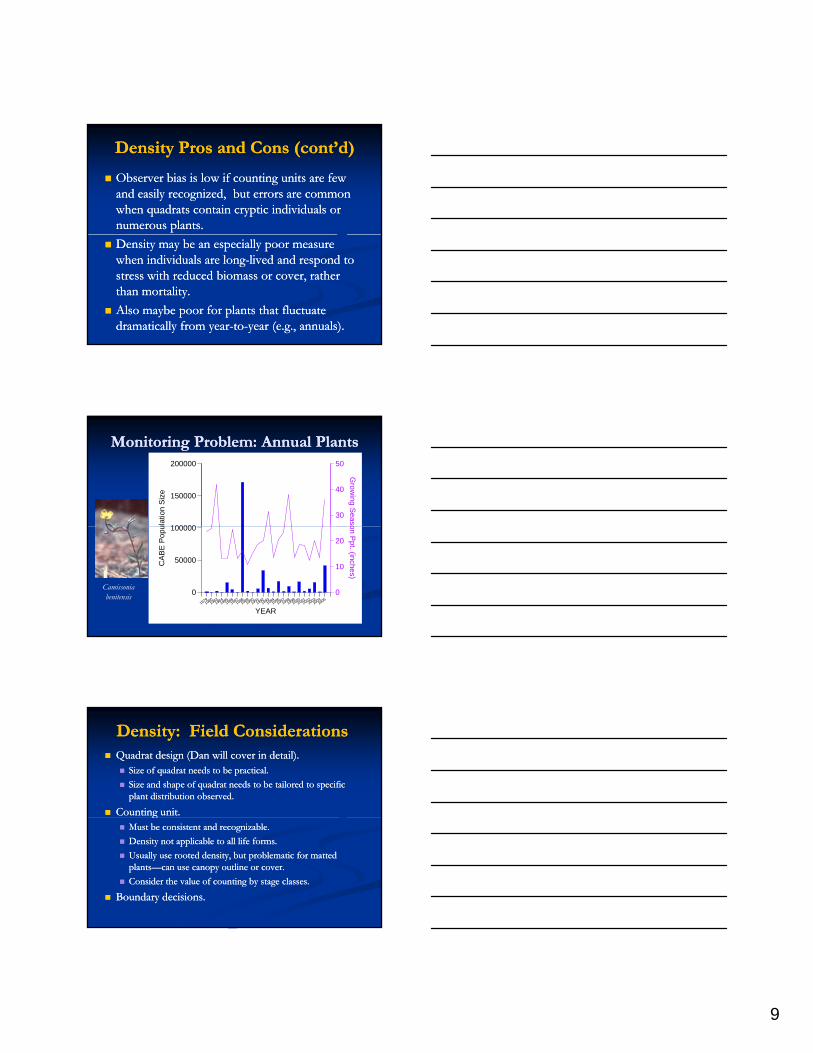
Density Pros and Cons (cont’d)Density Pros and Cons (cont’d)
Observer bias is low if counting units are few Observer bias is low if counting units are few and easily recognized, but errors are common and easily recognized, but errors are common when when quadratsquadrats contain cryptic individuals or contain cryptic individuals or numerous plants.numerous plants.Density may be an especially poor measure Density may be an especially poor measure when individuals are longwhen individuals are long--lived and respond to lived and respond to stress with reduced biomass or cover, rather stress with reduced biomass or cover, rather than mortality.than mortality.Also maybe poor for plants that fluctuate Also maybe poor for plants that fluctuate dramatically from yeardramatically from year--toto--year (e.g., annuals).year (e.g., annuals).
100000
150000
200000
ulat
ion
Siz
e
30
40
50G
rowing Seaso
Monitoring Problem: Annual PlantsMonitoring Problem: Annual Plants
19791980
19831984
19851986
19871988
19891990
19911992
19931994
19961997
19981999
20002001
20022003
20042005
YEAR
0
50000
100000
CAB
E Po
pu
0
10
20
on Ppt. (inches)
Camissoniabenitensis
Density: Field ConsiderationsDensity: Field ConsiderationsQuadratQuadrat design (Dan will cover in detail).design (Dan will cover in detail).
Size of Size of quadratquadrat needs to be practical.needs to be practical.Size and shape of Size and shape of quadratquadrat needs to be tailored to specific needs to be tailored to specific plant distribution observed.plant distribution observed.
Counting unit.Counting unit.ggMust be consistent and recognizable.Must be consistent and recognizable.Density not applicable to all life forms.Density not applicable to all life forms.Usually use rooted density, but problematic for matted Usually use rooted density, but problematic for matted plantsplants——can use canopy outline or cover.can use canopy outline or cover.Consider the value of counting by stage classes.Consider the value of counting by stage classes.
Boundary decisions.Boundary decisions.
10
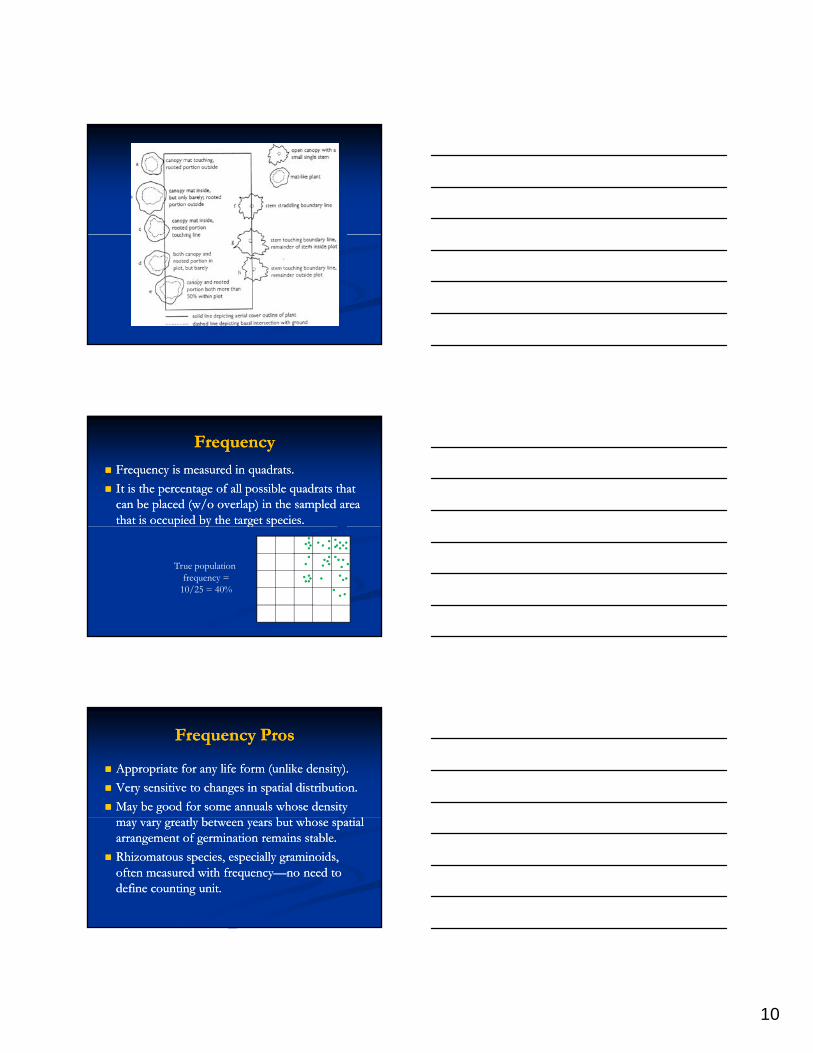
FrequencyFrequency
Frequency is measured in Frequency is measured in quadratsquadrats..It is the percentage of all possible It is the percentage of all possible quadratsquadrats that that can be placed (w/o overlap) in the sampled area can be placed (w/o overlap) in the sampled area that is occupied by the target species.that is occupied by the target species.p y g pp y g p
True population frequency =
10/25 = 40%
Frequency ProsFrequency Pros
Appropriate for any life form (unlike density).Appropriate for any life form (unlike density).Very sensitive to changes in spatial distribution.Very sensitive to changes in spatial distribution.May be good for some annuals whose density May be good for some annuals whose density
l b b h i ll b b h i lmay vary greatly between years but whose spatial may vary greatly between years but whose spatial arrangement of germination remains stable.arrangement of germination remains stable.Rhizomatous species, especially Rhizomatous species, especially graminoidsgraminoids, , often measured with frequencyoften measured with frequency——no need to no need to define counting unit.define counting unit.
11
Frequency Pros (cont’d)Frequency Pros (cont’d)
Good measure for monitoring invasions of Good measure for monitoring invasions of undesirable species.undesirable species.Longer time window for sampling than coverLonger time window for sampling than cover——cover can change dramatically from week to week.cover can change dramatically from week to week.cover can change dramatically from week to week.cover can change dramatically from week to week.The key advantage:The key advantage:
The only decision required by the observer is whether The only decision required by the observer is whether species occurs in the species occurs in the quadratquadrat..Little training required.Little training required.If species easy to spot, If species easy to spot, quadratsquadrats evaluated quickly.evaluated quickly.
Frequency ConsFrequency Cons
Frequency is a relative measure and completely Frequency is a relative measure and completely dependent on dependent on quadratquadrat size and shape.size and shape.
Can’t compare between years and sites if different Can’t compare between years and sites if different quadratquadrat sizes are usedsizes are usedquadratquadrat sizes are used.sizes are used.
Frequency is affected by both spatial distribution Frequency is affected by both spatial distribution and density of the population.and density of the population.
Changes can be difficult to interpret because we Changes can be difficult to interpret because we don’t know if change due to changes in density, don’t know if change due to changes in density, spatial distribution, or both.spatial distribution, or both.
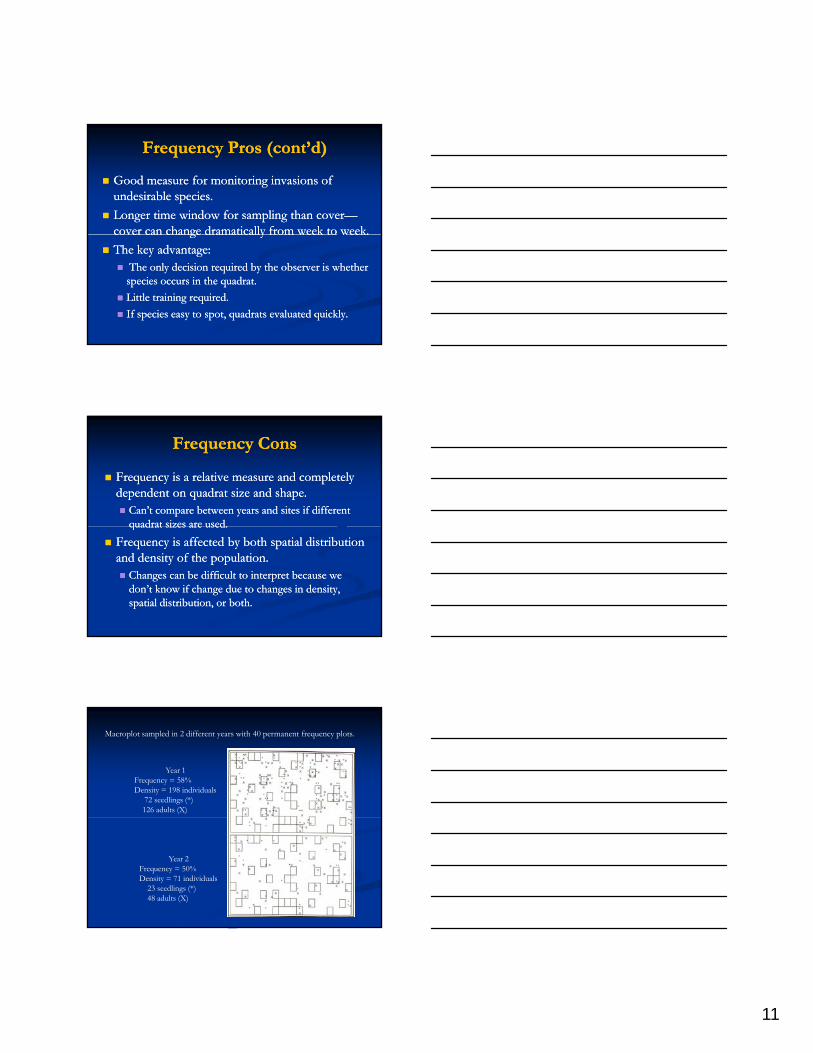
Macroplot sampled in 2 different years with 40 permanent frequency plots.
Year 1Frequency = 58%Density = 198 individuals
72 seedlings (*)126 adults (X)
Year 2Frequency = 50%Density = 71 individuals
23 seedlings (*)48 adults (X)
12
Frequency Cons (cont’d)Frequency Cons (cont’d)
Unlike other vegetation attributes such as cover Unlike other vegetation attributes such as cover or density, frequency is difficult to estimate for a or density, frequency is difficult to estimate for a whole site.whole site.Th s the biological significance of changes mayTh s the biological significance of changes mayThus, the biological significance of changes may Thus, the biological significance of changes may be difficult to convey to managers and user be difficult to convey to managers and user groups because they can’t easily visualize the groups because they can’t easily visualize the change.change.
Frequency: Field ConsiderationsFrequency: Field Considerations
Positioning of Positioning of quadratsquadrats..Simple random placement is inefficient.Simple random placement is inefficient.Usually position Usually position quadratsquadrats systematically (w/ random start) along systematically (w/ random start) along transects that are systematically (w/ random start) positioned transects that are systematically (w/ random start) positioned perpendicular from baselineperpendicular from baselineperpendicular from baseline.perpendicular from baseline.
Boundary rulesBoundary rules——usually include plant only if rooted.usually include plant only if rooted.Stage classes.Stage classes.
Consider collecting information by stage class.Consider collecting information by stage class.Conveys more information and makes changes easier to Conveys more information and makes changes easier to interpret.interpret.
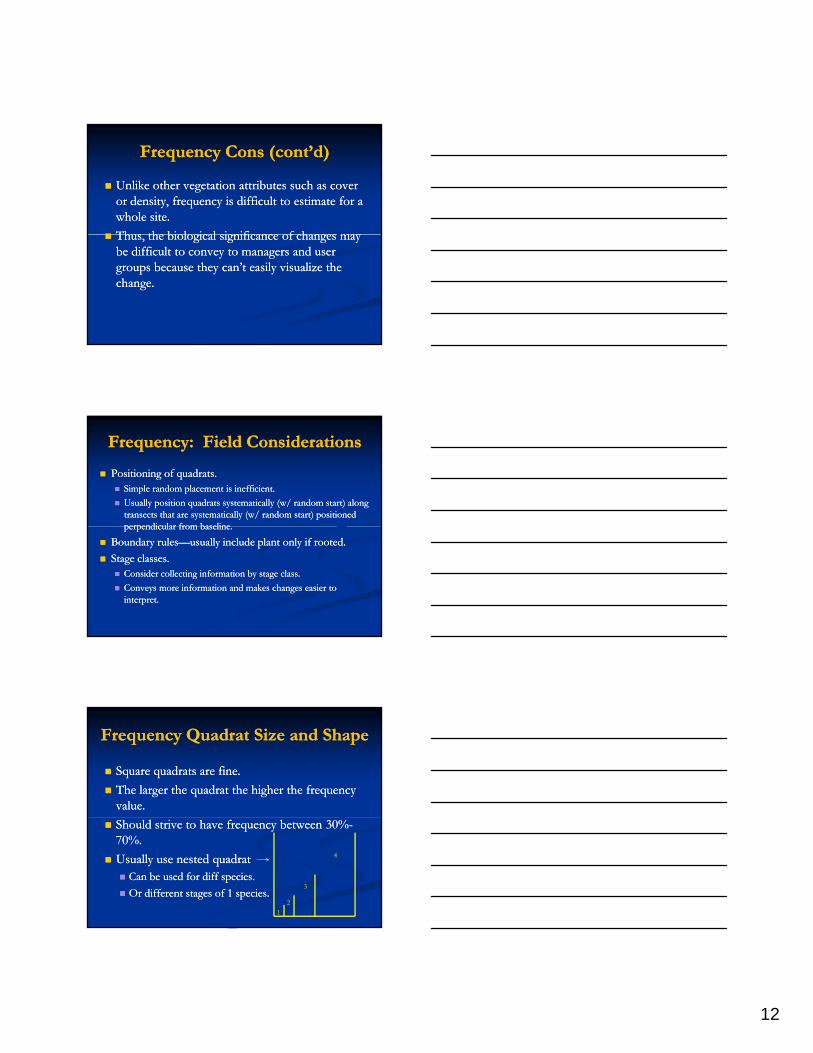
Frequency Frequency QuadratQuadrat Size and ShapeSize and Shape
Square Square quadratsquadrats are fine.are fine.The larger the The larger the quadratquadrat the higher the frequency the higher the frequency value.value.Should strive to have frequency between 30%Should strive to have frequency between 30%--70%.70%.Usually use nested Usually use nested quadratquadrat
Can be used for diff species.Can be used for diff species.Or different stages of 1 species.Or different stages of 1 species.
12
3
4
13
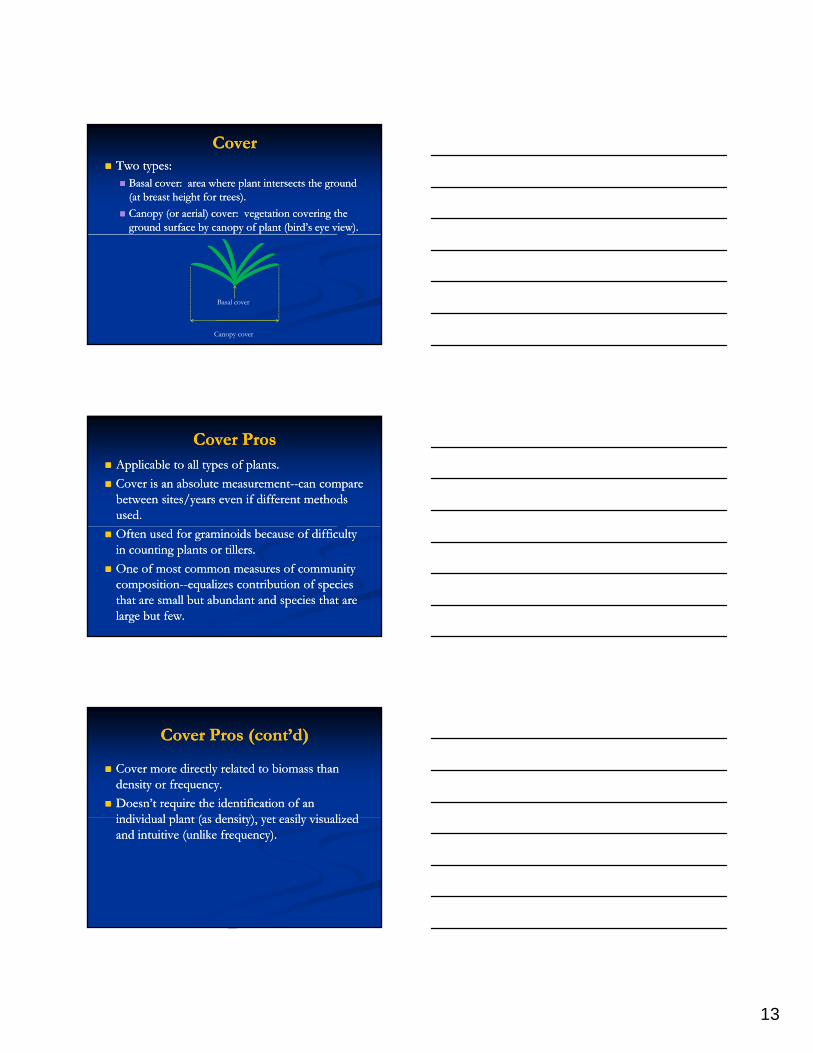
CoverCoverTwo types:Two types:
Basal cover: area where plant intersects the ground Basal cover: area where plant intersects the ground (at breast height for trees).(at breast height for trees).Canopy (or aerial) cover: vegetation covering the Canopy (or aerial) cover: vegetation covering the ground surface by canopy of plant (bird’s eye view).ground surface by canopy of plant (bird’s eye view).
Canopy cover
Basal cover
Cover ProsCover ProsApplicable to all types of plants.Applicable to all types of plants.Cover is an absolute measurementCover is an absolute measurement----can compare can compare between sites/years even if different methods between sites/years even if different methods used.used.Often used for Often used for graminoidsgraminoids because of difficulty because of difficulty in counting plants or tillers.in counting plants or tillers.One of most common measures of community One of most common measures of community compositioncomposition----equalizes contribution of species equalizes contribution of species that are small but abundant and species that are that are small but abundant and species that are large but few.large but few.
Cover Pros (cont’d)Cover Pros (cont’d)
Cover more directly related to biomass than Cover more directly related to biomass than density or frequency.density or frequency.Doesn’t require the identification of an Doesn’t require the identification of an individ al plant (as density) yet easily vis alizedindivid al plant (as density) yet easily vis alizedindividual plant (as density), yet easily visualized individual plant (as density), yet easily visualized and intuitive (unlike frequency).and intuitive (unlike frequency).
14
Cover ConsCover Cons
Canopy cover can change dramatically over the Canopy cover can change dramatically over the course of a growing season.course of a growing season.
Frequency and density measures are fairly stable in Frequency and density measures are fairly stable in the growing season after germination is completethe growing season after germination is completethe growing season after germination is complete.the growing season after germination is complete.The change during growing season may make it hard The change during growing season may make it hard to compare results from different parts of large areas to compare results from different parts of large areas when sampling is over period of weeks to months.when sampling is over period of weeks to months.
Canopy cover changes may differ greatly Canopy cover changes may differ greatly between years due to weather alone.between years due to weather alone.
Cover Cons (cont’d)Cover Cons (cont’d)
Cover is sensitive to both changes in density and Cover is sensitive to both changes in density and in vigor (annual biomass production).in vigor (annual biomass production).
This may make cover changes difficult to interpret.This may make cover changes difficult to interpret.For plants with relatively little annual variability inFor plants with relatively little annual variability inFor plants with relatively little annual variability in For plants with relatively little annual variability in canopy covercanopy cover——such as shrubs and matted such as shrubs and matted perennialsperennials——cover changes will be due primarily to cover changes will be due primarily to mortality and recruitment.mortality and recruitment.Real trends in density may be obscured in species Real trends in density may be obscured in species with highly variable annual production.with highly variable annual production.
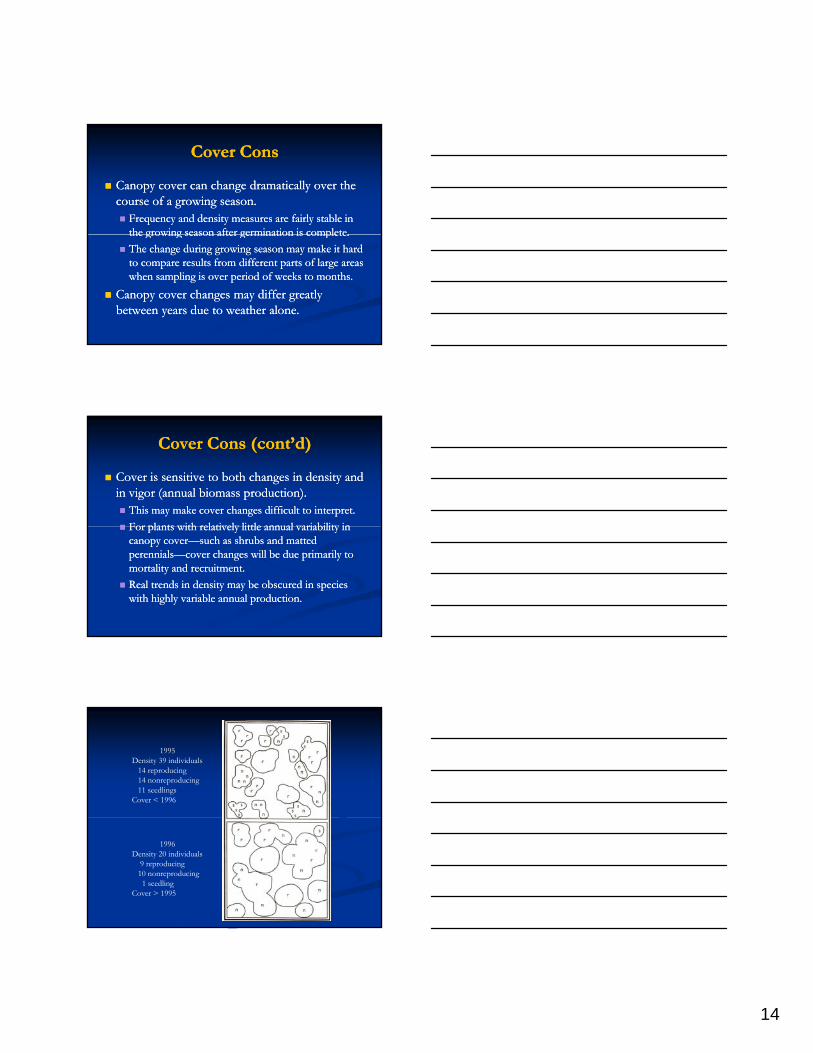
1995Density 39 individuals
14 reproducing14 nonreproducing11 seedlings
Cover < 1996
1996Density 20 individuals
9 reproducing10 nonreproducing1 seedling
Cover > 1995
15
Cover: Visual Estimation in Cover: Visual Estimation in QuadratsQuadratsOften use cover classes.Often use cover classes.
Many cover classes have been developed (page 179).Many cover classes have been developed (page 179).One example is that employed by One example is that employed by DaubenmireDaubenmire::
Cover Class Cover
1 >0 5%
Class midpoints are used in the analysisClass midpoints are used in the analysis
1 >0 – 5%
2 6% - 25%
3 26% - 50%
4 51% - 75%
5 76% - 95%
6 96% - 100%
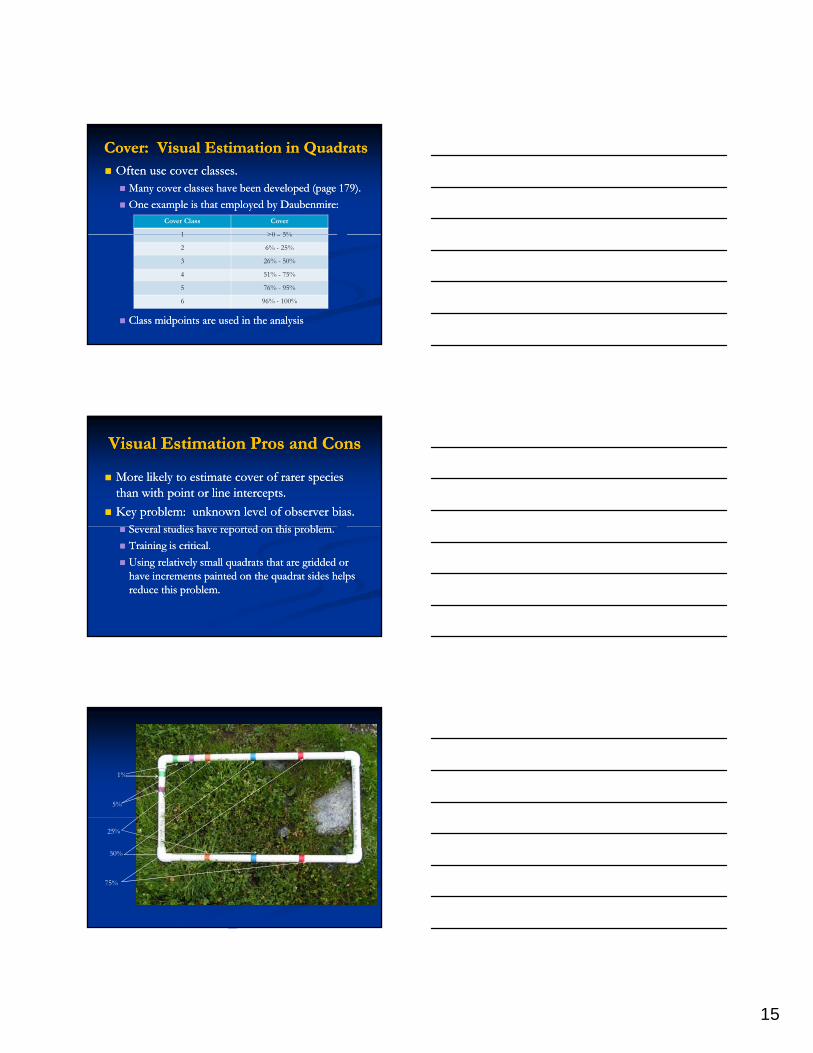
Visual Estimation Pros and ConsVisual Estimation Pros and Cons
More likely to estimate cover of rarer species More likely to estimate cover of rarer species than with point or line intercepts.than with point or line intercepts.Key problem: unknown level of observer bias.Key problem: unknown level of observer bias.
S l di h d hi blS l di h d hi blSeveral studies have reported on this problem.Several studies have reported on this problem.Training is critical.Training is critical.Using relatively small Using relatively small quadratsquadrats that are gridded or that are gridded or have increments painted on the have increments painted on the quadratquadrat sides helps sides helps reduce this problem.reduce this problem.
1%
5%
25%
50%
75%
16
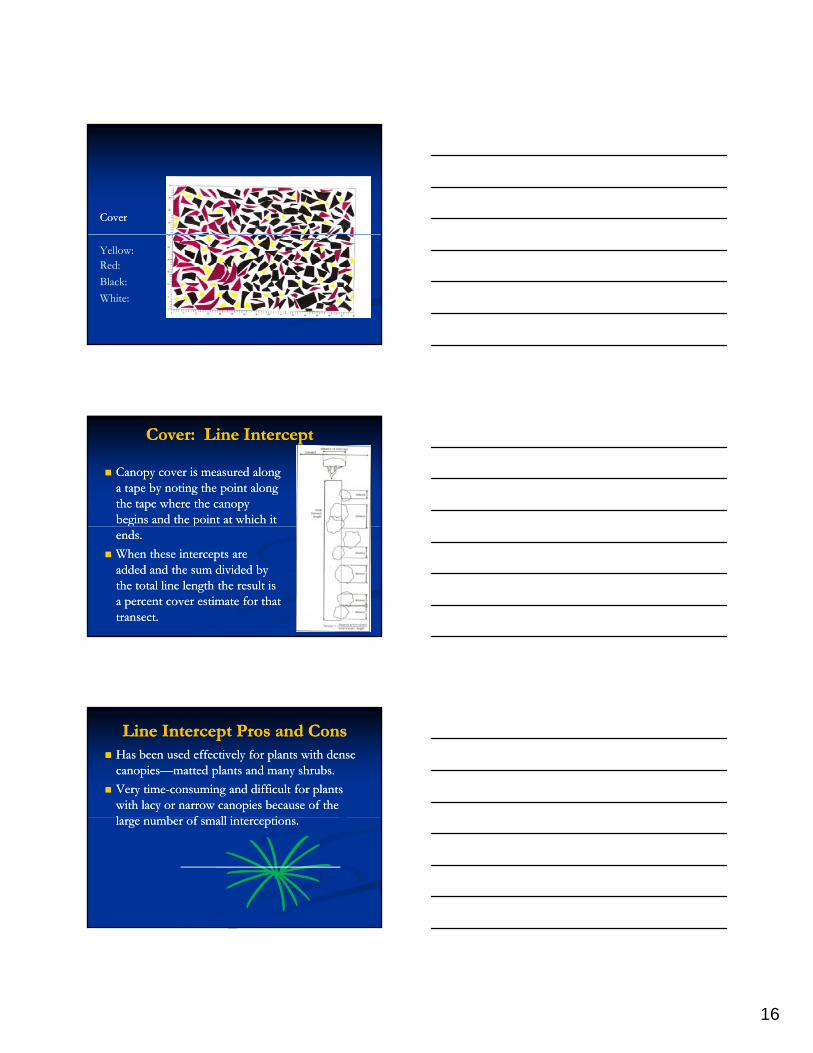
CoverCover
Yellow: Red: Black: White:
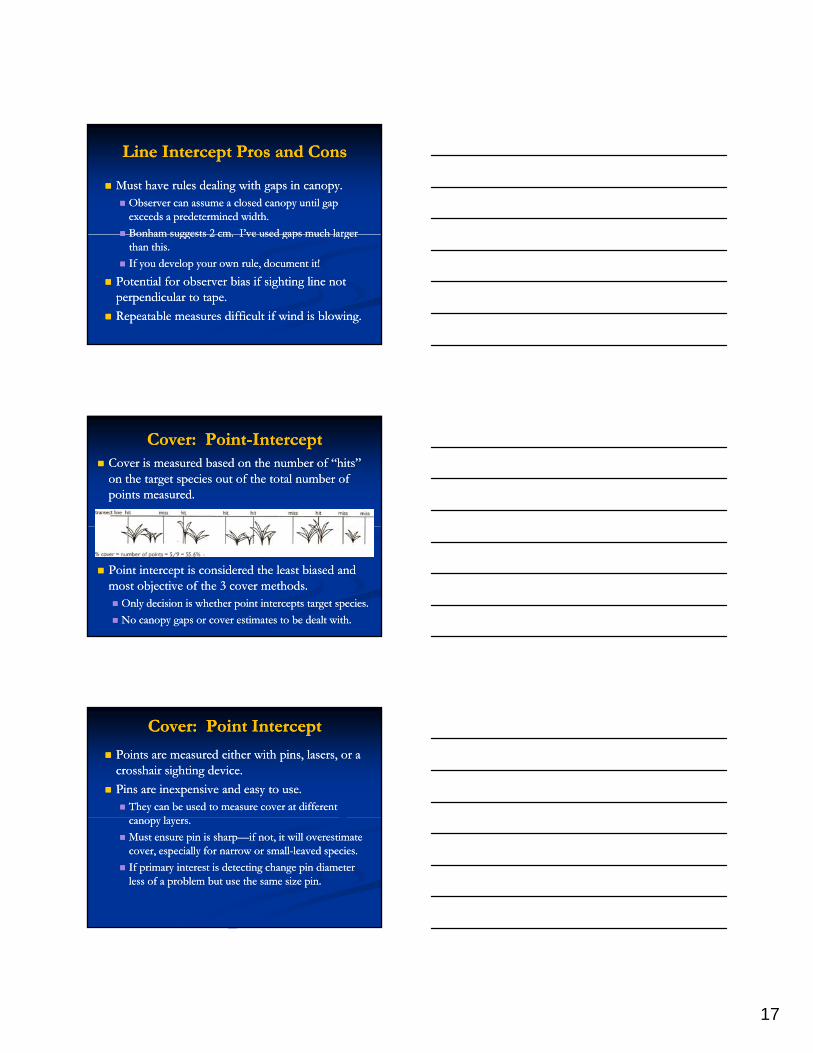
Cover: Line InterceptCover: Line Intercept
Canopy cover is measured along Canopy cover is measured along a tape by noting the point along a tape by noting the point along the tape where the canopy the tape where the canopy begins and the point at which it begins and the point at which it g pg pends.ends.When these intercepts are When these intercepts are added and the sum divided by added and the sum divided by the total line length the result is the total line length the result is a percent cover estimate for that a percent cover estimate for that transect.transect.
Line Intercept Pros and ConsLine Intercept Pros and ConsHas been used effectively for plants with dense Has been used effectively for plants with dense canopiescanopies——matted plants and many shrubs.matted plants and many shrubs.Very timeVery time--consuming and difficult for plants consuming and difficult for plants with lacy or narrow canopies because of the with lacy or narrow canopies because of the l b f ll i il b f ll i ilarge number of small interceptions.large number of small interceptions.
17
Line Intercept Pros and ConsLine Intercept Pros and Cons
Must have rules dealing with gaps in canopy.Must have rules dealing with gaps in canopy.Observer can assume a closed canopy until gap Observer can assume a closed canopy until gap exceeds a predetermined width.exceeds a predetermined width.Bonham suggests 2 cm I’ve used gaps much largerBonham suggests 2 cm I’ve used gaps much largerBonham suggests 2 cm. I ve used gaps much larger Bonham suggests 2 cm. I ve used gaps much larger than this.than this.If you develop your own rule, document it!If you develop your own rule, document it!
Potential for observer bias if sighting line not Potential for observer bias if sighting line not perpendicular to tape.perpendicular to tape.Repeatable measures difficult if wind is blowing. Repeatable measures difficult if wind is blowing.
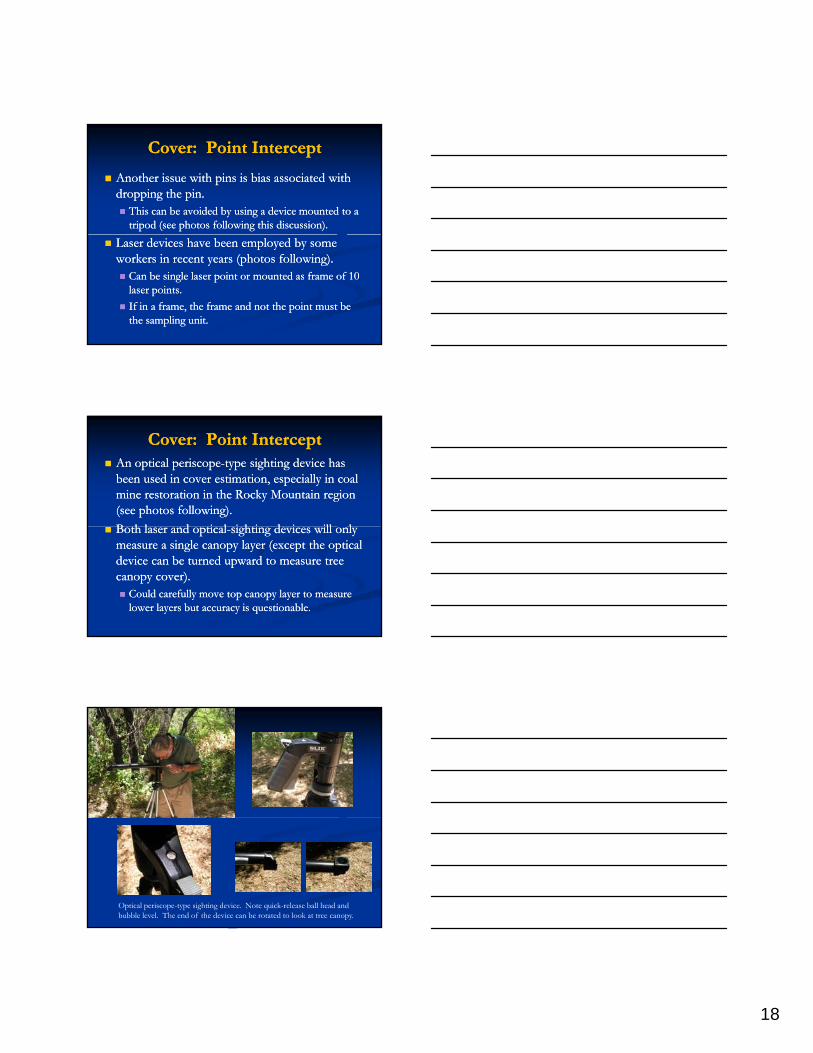
Cover: PointCover: Point--InterceptInterceptCover is measured based on the number of “hits” Cover is measured based on the number of “hits” on the target species out of the total number of on the target species out of the total number of points measured.points measured.
Point intercept is considered the least biased and Point intercept is considered the least biased and most objective of the 3 cover methods.most objective of the 3 cover methods.
Only decision is whether point intercepts target species.Only decision is whether point intercepts target species.No canopy gaps or cover estimates to be dealt with.No canopy gaps or cover estimates to be dealt with.
Cover: Point InterceptCover: Point Intercept
Points are measured either with pins, lasers, or a Points are measured either with pins, lasers, or a crosshair sighting device.crosshair sighting device.Pins are inexpensive and easy to use.Pins are inexpensive and easy to use.
They can be used to measure cover at different They can be used to measure cover at different llcanopy layers.canopy layers.
Must ensure pin is sharpMust ensure pin is sharp——if not, it will overestimate if not, it will overestimate cover, especially for narrow or smallcover, especially for narrow or small--leaved species.leaved species.If primary interest is detecting change pin diameter If primary interest is detecting change pin diameter less of a problem but use the same size pin.less of a problem but use the same size pin.
18
Cover: Point InterceptCover: Point Intercept
Another issue with pins is bias associated with Another issue with pins is bias associated with dropping the pin.dropping the pin.
This can be avoided by using a device mounted to a This can be avoided by using a device mounted to a tripod (see photos following this discussion).tripod (see photos following this discussion).
Laser devices have been employed by some Laser devices have been employed by some workers in recent years (photos following).workers in recent years (photos following).
Can be single laser point or mounted as frame of 10 Can be single laser point or mounted as frame of 10 laser points.laser points.If in a frame, the frame and not the point must be If in a frame, the frame and not the point must be the sampling unit.the sampling unit.
Cover: Point InterceptCover: Point InterceptAn optical periscopeAn optical periscope--type sighting device has type sighting device has been used in cover estimation, especially in coal been used in cover estimation, especially in coal mine restoration in the Rocky Mountain region mine restoration in the Rocky Mountain region (see photos following).(see photos following).B h l d i lB h l d i l i h i d i ill li h i d i ill lBoth laser and opticalBoth laser and optical--sighting devices will only sighting devices will only measure a single canopy layer (except the optical measure a single canopy layer (except the optical device can be turned upward to measure tree device can be turned upward to measure tree canopy cover).canopy cover).
Could carefully move top canopy layer to measure Could carefully move top canopy layer to measure lower layers but accuracy is questionable.lower layers but accuracy is questionable.
Optical periscope-type sighting device. Note quick-release ball head and bubble level. The end of the device can be rotated to look at tree canopy.
19
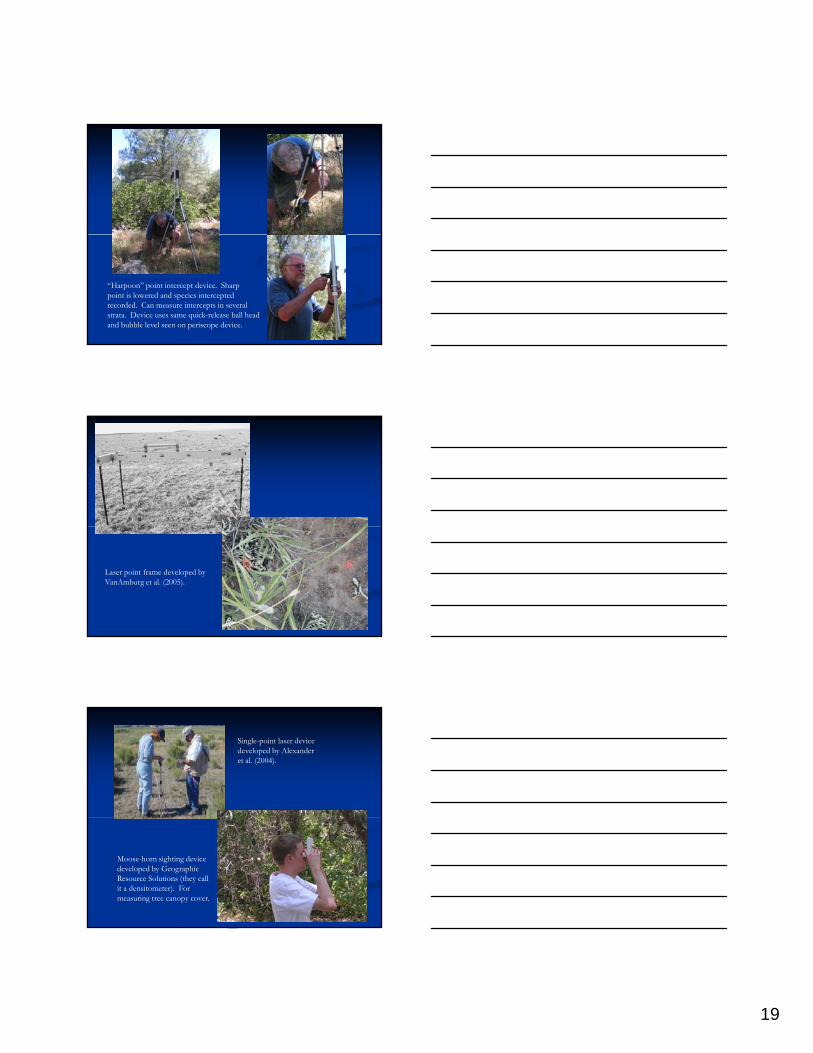
“Harpoon” point intercept device. Sharppoint is lowered and species interceptedrecorded. Can measure intercepts in several strata. Device uses same quick-release ball headand bubble level seen on periscope device.
Laser point frame developed by VanAmburg et al. (2005).
Single-point laser device developed by Alexanderet al. (2004).
Moose-horn sighting devicedeveloped by GeographicResource Solutions (they callit a densitometer). For measuring tree canopy cover.
20
Point Intercept IssuesPoint Intercept Issues
Angle of the point intercept has a big impact on Angle of the point intercept has a big impact on the cover measure:the cover measure:
Most intercepts are perpendicular to ground but Most intercepts are perpendicular to ground but species with narrow upright leaves rarely hit.species with narrow upright leaves rarely hit.Other angles have been used to increase hits.Other angles have been used to increase hits.Monitoring plan Monitoring plan must specify must specify angle used.angle used.Angles other than perpendicular difficult to interpret.Angles other than perpendicular difficult to interpret.
No longer a “birds eye view.”No longer a “birds eye view.”Also no longer a measure of degree of soil vulnerability to Also no longer a measure of degree of soil vulnerability to erosion.erosion.
Point Intercept Issues (cont’d)Point Intercept Issues (cont’d)Wind can be a problemWind can be a problem——more veg. surface area.more veg. surface area.You can record multiple interceptions at each pt.You can record multiple interceptions at each pt.
No longer true canopy coverNo longer true canopy cover——may intercept same may intercept same individual or species at each point.individual or species at each point.M l i l i i ll i d i d fM l i l i i ll i d i d fMultiple interceptions usually interpreted as index of Multiple interceptions usually interpreted as index of biomass, volume, or composition.biomass, volume, or composition.
Species with low cover values not sampled Species with low cover values not sampled efficiently unless a large number of points used.efficiently unless a large number of points used.
Not feasible in community sampling.Not feasible in community sampling.Might be feasible if sampling cover of 1 species.Might be feasible if sampling cover of 1 species.
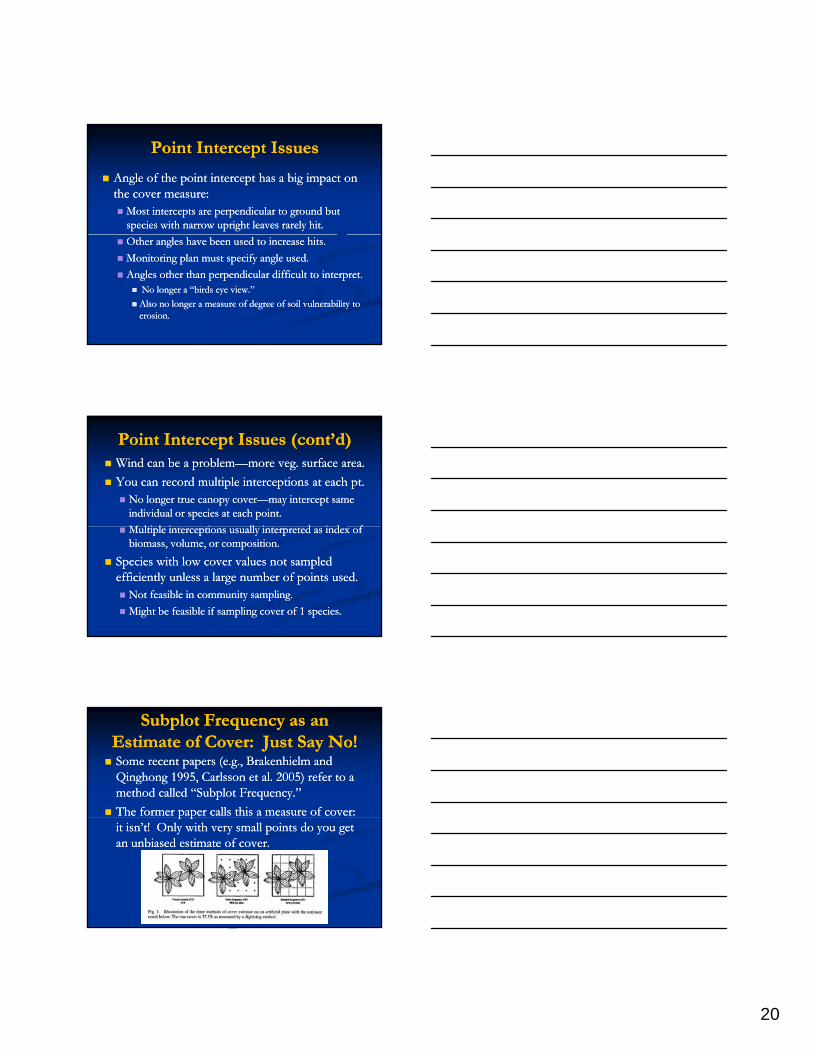
Subplot Frequency as an Subplot Frequency as an Estimate of Cover: Just Say No!Estimate of Cover: Just Say No!Some recent papers (e.g., Some recent papers (e.g., BrakenhielmBrakenhielm and and QinghongQinghong 1995, 1995, CarlssonCarlsson et al. 2005) refer to a et al. 2005) refer to a method called “Subplot Frequency.” method called “Subplot Frequency.” The former paper calls this a measure of cover: The former paper calls this a measure of cover: p pp pit isn’t! Only with very small points do you get it isn’t! Only with very small points do you get an unbiased estimate of cover. an unbiased estimate of cover.