FIELD SURVEY AND ANALYSIS - OECD › development › humanitarian-donors › docs › ... · Do not...
31
FIELD SURVEY AND ANALYSIS Survey of Affected People & Field Staff in Haiti World Humanitarian Summit June 14, 2017
Transcript of FIELD SURVEY AND ANALYSIS - OECD › development › humanitarian-donors › docs › ... · Do not...

FIELD SURVEY AND ANALYSIS
Survey of Affected People & Field Staff in Haiti
World Humanitarian Summit
June 14, 2017
INTRODUCTION 3AFFECTED PEOPLE SURVEY 3
FIELD STAFF SURVEY 3
BACKGROUND 3
SECTION 1 - AFFECTED PEOPLE SURVEY 4SUMMARY FINDINGS 4
READING THIS REPORT 5
Q1. AWARENESS 6
Q2. RELEVANCE 7
Q3. FAIRNESS 8
Q4. RESPECT 10
Q5. AWARENESS OF COMPLAINTS MECHANISMS 11
Q6. TRUST IN COMPLAINTS MECHANISMS 11
Q7. SAFETY 12
Q8. EMPOWERMENT 13
Q9. PROGRESS 13
DEMOGRAPHICS 14
SECTION 2 - FIELD STAFF SURVEY 16SUMMARY FINDINGS 16
READING THIS REPORT 17
Q1. TRANSPARENCY 18
Q2. MANAGEMENT OF AID 19
Q3. LOCALISATION 20
Q4. FEEDBACK 21
Q5. PARTICIPATION 22
Q6. CASH 23
Q7. FLEXIBILITY 25
Q8. REPORTING TIME 26
Q9. COOPERATION 27
DEMOGRAPHICS 29
RECOMMENDATIONS AND NEXT STEPS 30
NOTE ON METHODOLOGY 30BACKGROUND 30
SURVEY DEVELOPMENT 30
SAMPLE SIZE 30
SAMPLING METHODOLOGY 30
DATA DISAGGREGATION 30
LANGUAGE OF THE SURVEY 30
DATA COLLECTION 31
CONTENTS
CONTENTS
AFFECTED PEOPLE & FIELD STAFF SURVEY . HAITI 2 I 31

INTRODUCTION
INTRODUCTION
Affected People SurveyThis report includes two separate surveys. The first looks
at data collected from 599 individuals in Haiti’s North-
West, Grand’Anse, South and Nippes departments – all
of which have been hit hard by natural disasters, most
recently by Hurricane Matthew. It provides a baseline
on how affected people experience humanitarian aid by
looking at performance against a set of themes related
to the quality of services and engagement. These
performance dimensions link to affected people’s views
on progress towards the attainment of the
goals set out in the Grand Bargain and other efforts
intended to improve the effectiveness of humanitarian
action. Subsequent surveys will track how perceptions
evolve over time. Data collection took place April 9-13,
2017. Interviews were conducted face-to-face.
BackgroundOECD donors and humanitarian actors made a series
of commitments at the world humanitarian summit in
May 2016 to increase the efficiency and effectiveness of
humanitarian aid. The OECD secretariat seeks to assess
how policy changes in the global humanitarian space,
including commitments made in the Grand Bargain, affect
the quality of humanitarian action. As part of this exercise,
Ground Truth Solutions has been commissioned by the
OECD, with the support of the German Federal Foreign
Office, to track the way people affected by humanitarian
crises and field staff experience and view humanitarian
activities.
Grand’AnseNippes
South
North-West
Field Staff SurveyThis section analyses data collected from 75 humanitarian
staff members working in Haiti for 11 UN agencies and
international non-governmental organisations (INGOs).
Each organisation participated in and distributed the
online survey among their staff. Data was collected using
an online survey tool between 17 April and 18 May 2017.
For more details, see the section on methodology and
sampling at the end of the report.
AFFECTED PEOPLE & FIELD STAFF SURVEY . HAITI 3 I 31

SECTION 1 - AFFECTED PEOPLE SURVEY
SECTION 1 - AFFECTED PEOPLE SURVEY
Summary FindingsOverall, the findings are quite negative and warrant further investigation and follow-up.
Humanitarian services
There is limited awareness of the kinds of aid that are
available (Q1). People feel information about the distribution
of aid is lacking. Most people who responded negatively
say they need more precise and accurate information about
when, where and who distributes what.
The majority of respondents do not feel that the aid they
currently receive covers their basic needs (Q2). The most
pressing unmet needs are housing, financial aid, and food.
There is a prevalent sense that aid does not reach those
who need it most, notably more vulnerable or frail members
of the community (Q3).
Engagement
Respondents generally do not feel they are treated
with respect by aid providers, with over half responding
negatively (Q4). Those living in Nippes, North-West, and
in rural areas are most critical of their treatment by aid
providers.
Over two-thirds of respondents are unaware of existing
complaint mechanisms (Q5). Again, this issue is most
pronounced in Nippes and North-West and among people
in rural areas. Practically no one in these locations knows
how to make suggestions or complaints to aid providers.
In general, most respondents do not believe that their
opinions are taken into account regarding aid provision
(Q6).
Outcomes
Respondents do not feel safe (Q7). The lack of safety is
particularly acute among homeless people.
Neither respondents feel that the support they receive
will enable them to live without aid in the future nor do
they see improvements in their lives (Q8/Q9). Those
living in Nippes are the most negative.
1.4
1.3
2.2
1.5
2.4
2.1
1.7
2.6
1 2 3 4 5
Q9. Progress
Q8. Empowerment
Q7. Safety
Q6. Participation
Q4. Respect
Q3. Fairness
Q2. Relevance
Q1. Awareness
Overview of mean scores per question
negative positive
AFFECTED PEOPLE & FIELD STAFF SURVEY . HAITI 4 I 31
SECTION 1 - AFFECTED PEOPLE SURVEY
Reading this report
This report uses simple bar charts for both open and
closed questions on the Likert scale. The bar charts show
the distribution (in %) of answer options chosen for a
particular question—with colours ranging from dark red
for negative answers to dark green for positive ones. The
mean or average score is also shown for each question on
a scale of 1 to 5.
For each question, we indicate the main take-away or
conclusion drawn from the data. We also indicate issues
that require further exploration or inquiry. This can be
done either by comparing the perceptual data with other
data sets or by clarifying directly with people in the
surveyed communities what lies behind their perceptions
through, for example, focus group discussions, key
informant interviews or other forms of dialogue.
AFFECTED PEOPLE & FIELD STAFF SURVEY . HAITI 5 I 31

SECTION 1 - AFFECTED PEOPLE SURVEY
Do you feel informed about the kind of aid available to you?
Mean: 2.6 (values in %)
Q1. Awareness
SURVEY QUESTIONS1 = Not at all
2 = Not very much
3 = I know about some services
4 = I am informed about most services
5 = I am well informed about the aid available
No opinion
Do not want to answer
Respondents indicate a limited awareness about available aid, with only third feeling informed.
Scores vary significantly across departments. People
interviewed in North-West and Nippes feel least informed.
Respondents in Grand’Anse, who mostly live in urban areas,
are the most informed, with 45% of respondents answering
positively. According to OCHA’s 3W map as of March 31,
2017 these are also departments with fewer operations on
the ground.1
Awareness is lowest amongst respondents in rural areas.
1 OCHA 3W Map, “Haiti: Aperçu de Qui fait Quoi et Où (3W). Du 20 février au 31 mars 2017.”
Older respondents feel better informed about available aid
than younger respondents.
Department Mean
Grand'Anse 3.1
South 2.8
Nippes 2.4
North-West 1.7
Area Mean
MeanAge
Urban 2.7
Rural 2.3
Coastal 2.6
17-34 years 2.4
35-47 years 2.4
48-92 years 2.9
AFFECTED PEOPLE & FIELD STAFF SURVEY . HAITI 6 I 31

SECTION 1 - AFFECTED PEOPLE SURVEY
Follow-up question to those who responded 1, 2, or 3 to Q1:
What information do you need?
Respondents need more precise and accurate information
about the date, time, and place of aid distribution.
Some people mention that maps and telephone numbers
would make access to aid easier. People would like to
be contacted by telephone or to receive information on
the radio. These findings jibe with those in the Real Time
Evaluation.2
The graph shows the most common responses to this
open-ended question. The figures indicate the percentage/
number of people who gave this answer. Percentages do
not total 100% because respondents could give multiple
answers.
2 François Grünewald & Ed Schenkenberg, “Real Time Evaluation: Response to Hurricane Matthew in Haiti (RTE)”. November-December 2016, p. 42.
55% (179)
24% (79)
13% (43)
10% (34)
9% (28)
6% (21)
Exact location and time ofdistribution
What is given and how much
Better advertising of distribution
Conditions of distribution
Learning info on aid
Info on responsible NGOs,donors
Does the aid you currently receive cover your basic needs?
Q2. Relevance 1 = Not at all
2 = Not really
3 = Neutral
4 = Mostly yes
5 = Yes, very much
No opinion
Do not want to answer
Respondents indicate that the aid they receive is not sufficient to meet their basic needs.
Respondents in North-West and Grand'Anse are
overwhelmingly negative about whether their needs are
being met. Nippes is the only department with a notable
number of positive responses.
Mean: 1.7(values in %)
Department Mean
Grand'Anse 1.5
South 1.3
Nippes 2.4
North-West 1.5
AFFECTED PEOPLE & FIELD STAFF SURVEY . HAITI 7 I 31

SECTION 1 - AFFECTED PEOPLE SURVEY
Follow-up question to those who responded 1, 2, or 3 to Q2:
What are your most important needs that are not met?
52% (234)
50% (225)
48% (214)
19% (87)
11% (51)
10% (43)
8% (35)
6% (29)
6% (28)
6% (25)
4% (18)
3% (15)
4% (19)
Housing
Financial aid/credit
Food
Healthcare
Employment
Education/schooling
Trade/business
Potable water
Building materials
Infrastructure
Agricultural needs
Sanitation
Other*
Respondents identify housing, financial aid in the form
of merchant and agricultural credit, and subsidies as
their most important unmet needs. Nearly half feel food
insecure. Hygiene kits and healthcare, especially for
children, are also considered vital – but unmet – needs.
Other unmet needs mentioned relate to employment,
education, trade development, and business. Access to
potable water, infrastructure, and sanitation remain important
unmet needs.
The OCHA Situation Report No. 35 (November-December
2016), underlines that Food Security and Shelter/NFI sectors
require additional support, while the Early Recovery sector
is among the least funded, hindering access to credit and
recovery of the local economy.3
The graph shows the most common responses to this
open-ended question. The figures indicate the percentage/
number of people who gave this answer. Percentages do
not total 100% because respondents could give multiple
answers.*”Other” includes security, seeds, coal, fishing tools, clothes and shoes for children.
3 OCHA, “Haiti: Hurricane Matthew Situation Report No.35 (04 March 2017)”.
Respondents in all areas experience difficulties covering
their basic needs. Some 68% of respondents in rural areas
are particularly negative on this question.
Area Mean
Urban 1.5
Rural 1.8
Coastal 2.0
Does aid go to those who need it most in Haiti?
Q3. Fairness 1 = Not at all
2 = Not really
3 = Neutral
4 = Mostly yes
5 = Yes, very much
No opinion
Do not want to answer
There is a prevalent sense among respondents that the aid does not go to those who need it most, with over half of
the respondents answering negatively.
Mean: 2.1(values in %)
AFFECTED PEOPLE & FIELD STAFF SURVEY . HAITI 8 I 31
SECTION 1 - AFFECTED PEOPLE SURVEY
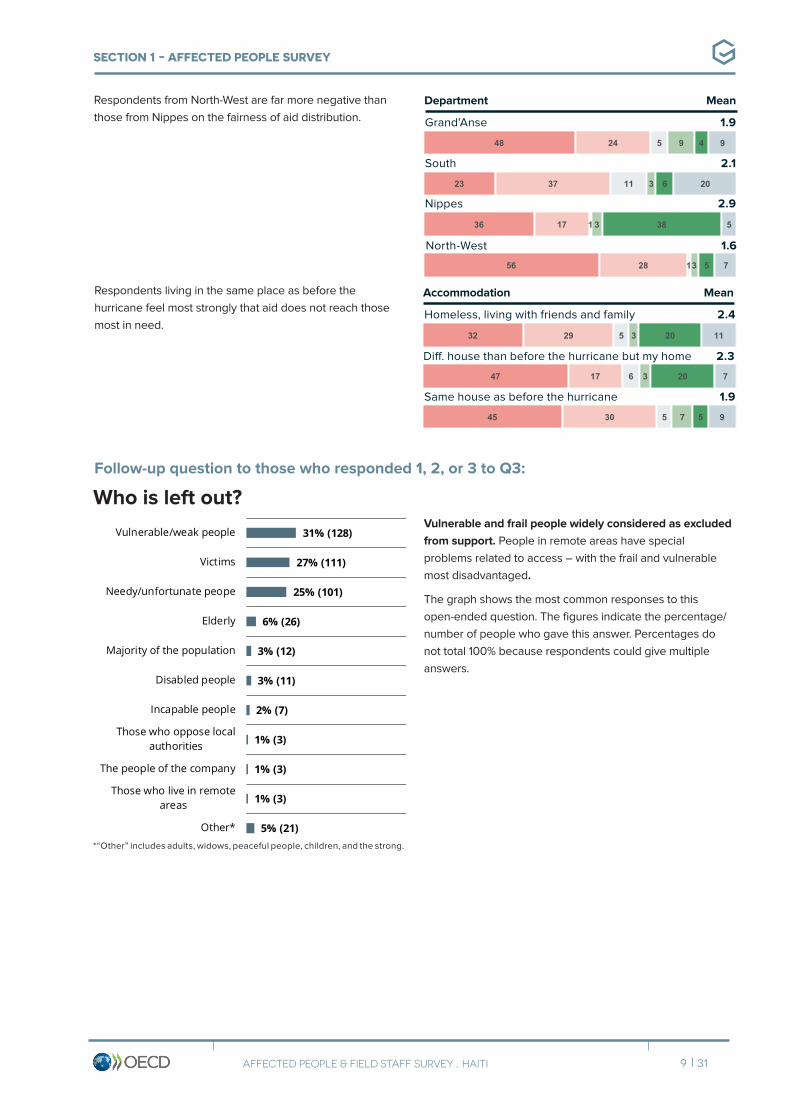
Respondents from North-West are far more negative than
those from Nippes on the fairness of aid distribution.
Department Mean
Grand'Anse 1.9
South 2.1
Nippes 2.9
North-West 1.6
Respondents living in the same place as before the
hurricane feel most strongly that aid does not reach those
most in need.
Accommodation Mean
Homeless, living with friends and family 2.4
Diff. house than before the hurricane but my home 2.3
Same house as before the hurricane 1.9
Follow-up question to those who responded 1, 2, or 3 to Q3:
Who is left out?Vulnerable and frail people widely considered as excluded
from support. People in remote areas have special
problems related to access – with the frail and vulnerable
most disadvantaged.
The graph shows the most common responses to this
open-ended question. The figures indicate the percentage/
number of people who gave this answer. Percentages do
not total 100% because respondents could give multiple
answers.
*“Other” includes adults, widows, peaceful people, children, and the strong.
31% (128)
27% (111)
25% (101)
6% (26)
3% (12)
3% (11)
2% (7)
1% (3)
1% (3)
1% (3)
5% (21)
Vulnerable/weak people
Victims
Needy/unfortunate peope
Elderly
Majority of the population
Disabled people
Incapable people
Those who oppose localauthorities
The people of the company
Those who live in remoteareas
Other*
AFFECTED PEOPLE & FIELD STAFF SURVEY . HAITI 9 I 31

SECTION 1 - AFFECTED PEOPLE SURVEY
Are you treated with respect by aid providers?
Mean: 2.4 (values in %)
Q4. Respect
Most respondents do not feel that aid providers treat them respectfully.
Respondents in South, who mostly live in urban areas, feel
more positive than those in Nippes and North-West, where
83% and 90% respectively responded negatively.
Respondents in rural areas are more critical of treatment by
aid providers than those in urban areas.
Those who continue to live in the same place as before the
hurricane view their treatment as slightly more positive than
those who either lost their home and are living with friends
or in a different home.
Department Mean
Grand'Anse 2.7
South 3.7
Nippes 1.7
North-West 1.6
Area Mean
MeanAccommodation
Urban 2.8
Rural 1.8
Coastal 2.1
Homeless, living with friends and family 2.1
Diff. house than before the hurricane but my home 2.1
Same house as before the hurricane 2.6
Half of the respondents aged 17 to 34 years do not feel they
are treated with respect “at all,” while older respondents are
slightly less negative.
MeanAge
17-34 years 2.1
35-47 years 2.2
48-92 years 2.8
1 = Not at all
2 = Not really
3 = Neutral
4 = Mostly yes
5 = Yes, very much
No opinion
Do not want to answer
AFFECTED PEOPLE & FIELD STAFF SURVEY . HAITI 10 I 31

SECTION 1 - AFFECTED PEOPLE SURVEY
Do you know how to make suggestions or compaints to aid providers?(values in %)
Q5. Awareness of compaints mechanisms (participation)
Knowledge about existing complaints mechanisms is very poor.
There seems to be a significant information gap about
how to make suggestions and complaints in Nippes and
North-West.
Respondents living in rural areas generally do not feel they
have the ability or the opportunity to voice their opinions to
aid providers.
Department
Grand'Anse
South
Nippes
North-West
Area
Urban
Rural
Coastal
No
Yes
No opinion
Do not want to answer
Do you feel aid providers take your opinion into account when providing aid?
Mean: 1.5(values in %)
Q6. Trust in complaints mechanisms (participation)
The overwhelming majority of respondents do not think that their opinions are considered regarding aid provision.
1 = Not at all
2 = Not really
3 = Neutral
4 = Mostly yes
5 = Yes, very much
No opinion
Do not want to answer
AFFECTED PEOPLE & FIELD STAFF SURVEY . HAITI 11 I 31
SECTION 1 - AFFECTED PEOPLE SURVEY
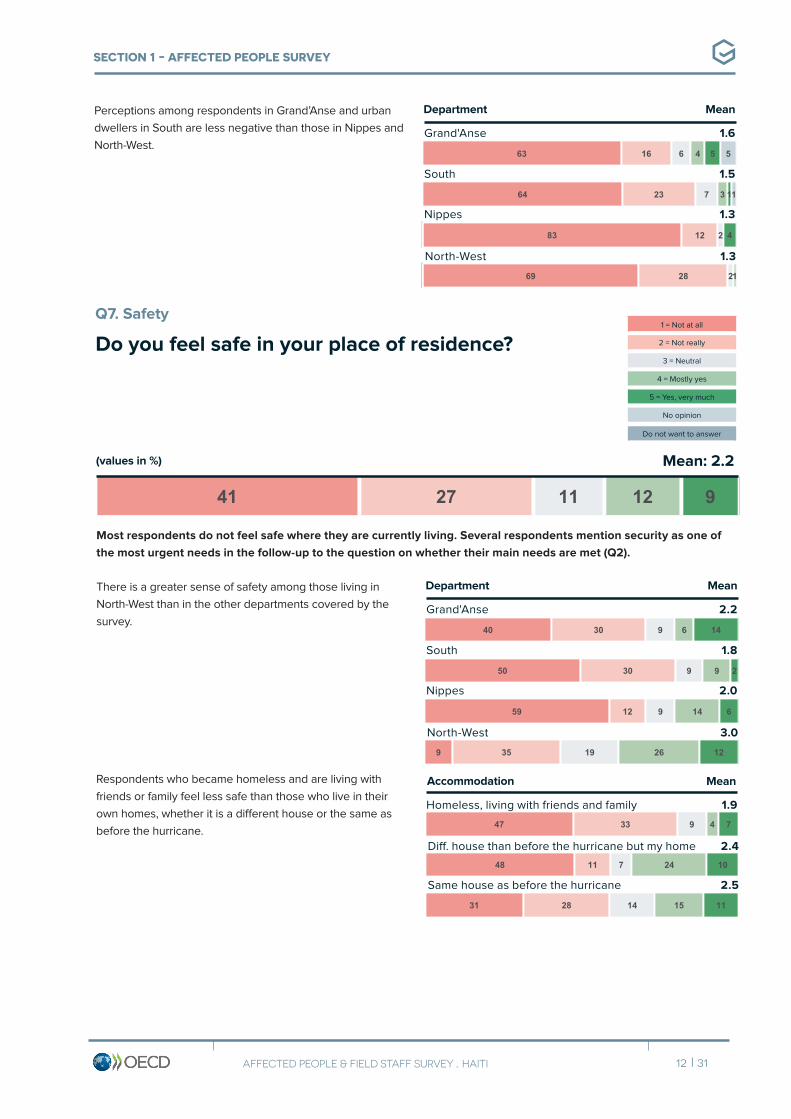
Perceptions among respondents in Grand’Anse and urban
dwellers in South are less negative than those in Nippes and
North-West.
Department Mean
Grand'Anse 1.6
South 1.5
Nippes 1.3
North-West 1.3
Do you feel safe in your place of residence?
Mean: 2.2 (values in %)
Q7. Safety
Most respondents do not feel safe where they are currently living. Several respondents mention security as one of
the most urgent needs in the follow-up to the question on whether their main needs are met (Q2).
There is a greater sense of safety among those living in
North-West than in the other departments covered by the
survey.
Respondents who became homeless and are living with
friends or family feel less safe than those who live in their
own homes, whether it is a different house or the same as
before the hurricane.
Department Mean
Grand'Anse 2.2
South 1.8
Nippes 2.0
North-West 3.0
MeanAccommodation
Homeless, living with friends and family 1.9
Diff. house than before the hurricane but my home 2.4
Same house as before the hurricane 2.5
1 = Not at all
2 = Not really
3 = Neutral
4 = Mostly yes
5 = Yes, very much
No opinion
Do not want to answer
AFFECTED PEOPLE & FIELD STAFF SURVEY . HAITI 12 I 31
SECTION 1 - AFFECTED PEOPLE SURVEY
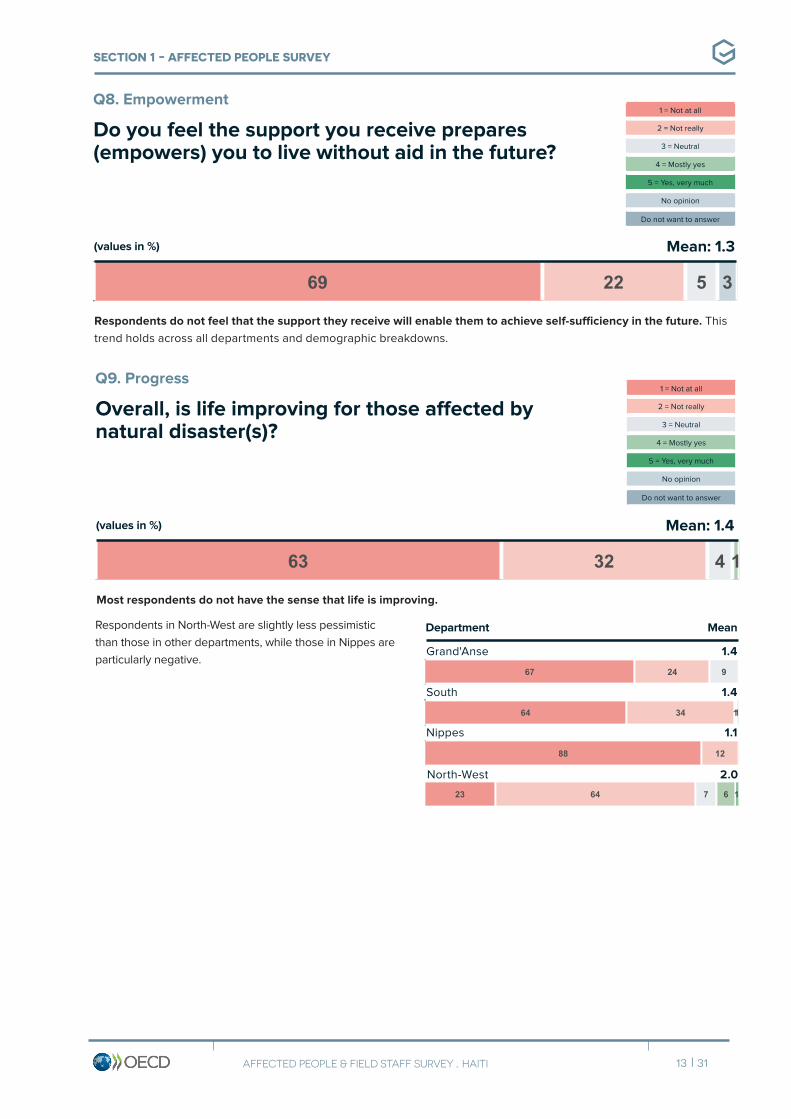
Do you feel the support you receive prepares (empowers) you to live without aid in the future?
Mean: 1.3(values in %)
Q8. Empowerment
Respondents do not feel that the support they receive will enable them to achieve self-sufficiency in the future. This
trend holds across all departments and demographic breakdowns.
Overall, is life improving for those affected by natural disaster(s)?
Mean: 1.4(values in %)
Q9. Progress
Most respondents do not have the sense that life is improving.
Respondents in North-West are slightly less pessimistic
than those in other departments, while those in Nippes are
particularly negative.
Department Mean
Grand'Anse 1.4
South 1.4
Nippes 1.1
North-West 2.0
1 = Not at all
2 = Not really
3 = Neutral
4 = Mostly yes
5 = Yes, very much
No opinion
Do not want to answer
1 = Not at all
2 = Not really
3 = Neutral
4 = Mostly yes
5 = Yes, very much
No opinion
Do not want to answer
AFFECTED PEOPLE & FIELD STAFF SURVEY . HAITI 13 I 31

SECTION 1 - AFFECTED PEOPLE SURVEY
DEMOGRAPHICS
67% (599)
YES
Department
Received aid/services Age
33% (301)
NO
Department
Overall, 900 individuals were interviewed, 33% of whom did not receive humanitarian support and hence, were excluded
from the analysis.
56% (334)
FEMALE
Gender
44% (265)
MALE
99% (592)
YES
Affected by a major natural disaster
1% (7)
NO
Area
Accommodation*
32% (189)
29% (175)
20% (121)
19% (114)
Grand'Anse
South
Nippes
North-West
*Same house as before the hurricane; homeless, living with friends and family; different house than before the hurricane, but own home
AFFECTED PEOPLE & FIELD STAFF SURVEY . HAITI 14 I 31

SECTION 1 - AFFECTED PEOPLE SURVEY
Communes
24%(46)
14%(24)
33%(40)
34%(39)
28%(53)
21%(36)
33%(40)
39%(45)
35%(67)
45%(79)
34%(41)
26%(30)
12%(23)
21%(36)
Grans'Anse
South
Nippes
North-West
Bonbon Dame-Marie Jeremie Moron
Camp-Perrin Les Anglais Les Cayes Port-Salut
Petite-Piviere Petit-Trou Plaisance du Sud
Bombardopolis Chansolme Mole Saint-Nicolas
AFFECTED PEOPLE & FIELD STAFF SURVEY . HAITI 15 I 31
SECTION 2 - FIELD STAFF SURVEY
SECTION 2 - FIELD STAFF SURVEY
Summary findings
Humanitarian services
Q1/Q2. There is a general sense that funds are used
where needs are greatest and that aid is managed well.
Some respondents identify challenges in reaching people
in remote areas, providing shelter, coordinating aid,
and offering long-term solutions. Those who see issues
in management of aid point to a lack of coordination
between local and international staff, a top down
approach, and corruption.
Engagement
Q3. Over a third of respondents do not believe that
local and national responders receive enough support.
Obstacles include limited funding, donor constraints,
government constraints, and lack of local capacity.
Suggested solutions are advocacy with donors,
more direct funding to local actors, closer long-term
cooperation between international and national
responders, long-term relations and plans, and good
governance.
Q4. The majority of staff members feel well informed
about affected people’s perceptions of aid programmes.
The few who do not point to poor feedback mechanisms,
delayed implementation of community engagement
programmes, and poor dissemination of information.
Q5. Half of the respondents feel that affected people
are able to influence programme design. Those who
perceive participation as limited mention top-down
donor-oriented design, poor feedback mechanisms, time
constraints, and lack of contribution from local actors.
Some suggest more effort in including people’s input in
programme assessment, design, and decision-making.
Outcomes
Q6. Almost a quarter of surveyed staff see no
advantages in cash programming. The indicated
problems are poor contextualisation, short-term
support, and lack of sustainability. Staff believe that cash
programmes could be more effective if they were better
targeted, controlled, and monitored; coupled with other
support; run in cooperation with local authorities and
communities; and with more attention paid to the security
of recipients.
Q9. Cooperation between humanitarian and
development actors is seen as somewhat effective.
Negative perceptions relate to lack of coordination and
shared goals, a lack of connection between the actors,
and an absence of development projects. Suggested
solutions include improving networking/coordination
systems, focusing on sustainability, and increasing
community involvement.
Donor related
Q7. Staff feel quite positive about the flexibility of
programming. The reasons for negative perceptions
are rigid donor demands and agreements with partners,
top-down programming, and time constraints.
Q8. The amount of time spent on reporting is considered
as mostly appropriate.
AFFECTED PEOPLE & FIELD STAFF SURVEY . HAITI 16 I 31

SECTION 2 - FIELD STAFF SURVEY
negative positive
Reading this reportThis report uses bar charts for closed Likert scale
questions. The charts show the distribution (in %) of
answer options chosen for a particular question – with
colours ranging from dark red for negative answers
to dark green for positive ones. The mean or average
score is also shown for each question on a scale of 1 to
5. For each question we indicate the main take-away or
conclusion drawn from the data.
Overview of mean scores per question
AFFECTED PEOPLE & FIELD STAFF SURVEY . HAITI 17 I 31

SECTION 2 - FIELD STAFF SURVEY
Do you feel aid funds go where they are most needed?
1 = Not at all
2
3
4
5 = Yes, I do
Q1. Transparency
Mean score: 3.9 (values in %)
Aid funds are regarded as well-managed and used where need is greatest. This trend holds across all demographic
breakdowns.
Follow-up to those who responded 1, 2, or 3 to Q1:
Please explain why you answered that way.
Problems in the shelter sector:
“The most vulnerable are those with houses that were
completely destroyed.”
Funds in the shelter sector also do not cover the full
reconstruction of houses, targeting only people whose
houses were lightly damaged.
Need for a long-term solution:
“It is not enough to help people in need temporarily – what
is more important is to find a way to get them out of their
need once and for all. Otherwise, the same stories are
repeated.”
Coordination problems:
“It is not easy to understand the new way of working in
terms of intersectoral and multisectoral actions.”
Field staff indicate several problems of aid distribution:
Challenge of remote areas and limited funding:
“Remote rural areas have been neglected or marginalised
by aid.”
Respondents indicate that people in remote or inaccessible
areas miss out on support and their needs are not currently
addressed. Field workers don't have the means to meet the
needs of all affected people, for example those who lost
everything in Cyclone Mathieu.
“One tries to help the most vulnerable beneficiaries, but it's
really hard to choose when the response is so limited.”
implement them.”
Please give 1 or 2 examples of how this could be improved.Field staff call for better targeting, increased funding, more cash programmes, long-term solutions, and cooperation
with local committees and communities.
Cash programmes:
“Give money for multipurpose cash so that people can buy
food production materials instead of just food. Create Cash
for Work projects with aid provided for disasters.”
Long-term solutions:
“If, after a hurricane, food and hygiene kits are brought in
and damaged roofs are covered, it does not solve anything.
The key thing is to help people to have a home that can
withstand another hurricane.”
Better targeting:
“The support period was very short and all assistance went
to accessible locations only. Donors should fund only hard-
to-reach areas promoting local community responsibility
and participation.”
Cooperation with local committees and communities:
“Define the priorities with community leaders and the local
authorities; improve coordination among cluster members
and the intersectoral group.”
AFFECTED PEOPLE & FIELD STAFF SURVEY . HAITI 18 I 31

SECTION 2 - FIELD STAFF SURVEY
Do you feel that aid is managed well by the humanitarian
community in Haiti?
1 = Not at all
2
3
4
5 = Yes, I do
Q2. Management of aid
Mean score: 3.9(values in %)
Staff interviewed are satisfied with the way aid is administered.
Follow-up to those who responded 1, 2, or 3 to Q2:
Please explain why you answered that way.
Top-down approach:
“A lot of organisations tend to prioritise themselves; their
priorities are not based on the needs of the people.”
Staff see several problems in aid management: exaggerated expenses, lack of coordination between local and
international actors, top down funding, and corruption.
Lack of coordination:
“More money should be spent on capacity building of local
actors. This would help break the cycle of dependence
on international NGOs. Furthermore, many projects are
designed without a clear understanding of the reality on the
ground. Project design should be bottom up, not top down.”
“There is a profound lack of collective, collaborative
approaches (government and non-government and private
sector) to supporting the people most at risk or vulnerable.
Reluctance of government to lead the initiative.”
Field staff team leaders are less positive about aid
management than other staff members.
Area
Field staff team leader 3.7
Field staff team member 4.1
HQ staff 4.0
Other 3.9
Role in the field Mean
AFFECTED PEOPLE & FIELD STAFF SURVEY . HAITI 19 I 31

SECTION 2 - FIELD STAFF SURVEY
Please give 1 or 2 examples of how this could be improved.A better humanitarian response would include more knowledge of the community and situation on the ground,
capacity building of local actors, and better cooperation between humanitarian actors.
Better cooperation between humanitarian actors:
“Alignment of the humanitarian actors to the national
strategy; good leadership by the government of Haiti.”
More knowledge of the situation:
“Work with local leaders, have the criteria disseminated to
the community.”
Capacity building:
“Invest in capacity building. Design the projects with a better
understanding of the reality on the ground.”
“Capacity building of national response agencies. Improved
public opinion of, and confidence in, leadership at local,
regional and national level. International organisations need
to step back.”
Do you feel there is sufficient funding for local and
national aid providers in Haiti?
1 = Not at all
2
3
4
5 = Yes, I do
Q3. Localisation
Mean score: 3.0 (values in %)
Opinions are divided as to whether local responders are adequately supported.
INGO 2.8
UN agency 3.1
Respondents from INGOs are less convinced that there is
enough support for local players than UN agency staff.
Type of organisation Mean
Field staff team leaders are less convinced than other staff
about the sufficiency of support.
Area
Field staff team leader 2.8
Field staff team member 3.0
HQ staff 3.2
Other 3.3
Role in the field Mean
No 2.9
Yes 3.1
Staff who work with affected people in urban areas feel more
positive about the support provided to local responders than
those who do not.
Work with people affected in urban areas Mean
AFFECTED PEOPLE & FIELD STAFF SURVEY . HAITI 20 I 31

SECTION 2 - FIELD STAFF SURVEY
Follow-up to those who responded 1, 2, or 3 to Q3:
Please explain why you answered that way.
Cooperation with local actors:
“There is a tendency to minimise the capacity of local
aid providers. The narrative among humanitarian actors
represents a threat for the local actors.”
“The fact that we are involved at the same time as the local
agencies reduces the funds that could be allocated to them.
The trick would be to strengthen the local and national
bodies so that they can respond effectively to any situation
that would arise.”
Localisation of the response presents issues in terms of cooperation with local actors, limited funding, donor and
government constraints, and lack of supply.
Donor constraints:
“Because of time pressure and donor constraints, there is
not sufficient space to engage with local partners. The other
problem is a lack of local partners with sufficient capacity,
which can mean we need to have many small partners,
which can be time consuming and inefficient when dealing
with rapid response.”
Please give 1 or 2 examples of how this could be improved.Suggested solutions to problems of localisation are advocacy with donors, more direct funding to local actors, closer
long-term cooperation between international and national responders, and good governance.
Closer long-term cooperation between international and
national responders:
“The existing community networks have more influence
in the localities; using them would ensure sustainability of
actions.”
“Actively involving national actors in coordination, adapting
international systems to national coordination context and
realities.”
Direct funding to local actors:
“Humanitarian partners need to work hand in hand with
local and national aid providers; support local aid providers
to improve their capacity; allocate a minimum of 15% of the
humanitarian funding of the project to reinforce locals.”
Advocacy with donors:
“Donors should include a clause in their project making
it mandatory for an international NGO to actively seek a
partnership with a local organisation – for capacity building
and to increase efficiency of the programmes.”
Do field staff like you have enough information about the
way affected people see aid programmes?
1 = Not at all
2
3
4
5 = Yes, I do
I don't know
Q4. Feedback
Mean score: 3.9(values in %)
Respondents feel well informed about people’s perceptions of aid programmes.
HQ staff lack information the most.
Area
Field staff team leader 3.9
Field staff team member 4.1
HQ staff 3.6
Other 4.2
Role in the field Mean
AFFECTED PEOPLE & FIELD STAFF SURVEY . HAITI 21 I 31

SECTION 2 - FIELD STAFF SURVEY
Follow-up to those who responded 1, 2, or 3 to Q4:
Please explain why you answered that way.
Lack of feedback mechanisms:
“Post-distribution monitoring is not sufficient to gather this
[people’s perceptions of aid programmes] information.
The survey done by Internews to help support this effort
was not helpful, in my opinion, because information was
simply collected and reported without placing it into context
or checking its veracity. Thus, overall, there is a lack of
credible and reliable information about how aid is perceived
and why.”
Lack of information among staff is due to lack of or inadequate feedback mechanisms, delayed implementation of
community engagement programmes, and poor dissemination of information.
Delayed implementation of community engagement
programmes:
“There is much more one-way communication between
the populations and the aid workers. Some efforts have
been made with the Internews project to improve it over
the past three months. In spite of it all, OCHA, which has
the mandate on CWC [communicating with communities],
does not have enough capacity to move forward. There
is an interagency group that has worked on a strategic
document, but still there is not any effort … to operationalise
it.”
Please give 1 or 2 examples of how this could be improved.Gaps in the feedback loop can be closed by two-way communication, community engagement policies, and
contextualisation of current feedback.
Contextualisation of current feedback:
“The effort from Internews was a good start, but needs to be
complemented with a second layer of questioning to better
understand why people say what they say and to provide
some context for the veracity of the statements so they are
more useful in adjusting our approach.”
Two-way communication:
“OCHA should act on its CWC mandate. Partners need
to have feedback mechanisms in place to have two-way
communication with the population.”
Engagement with communities:
“Closer engagement with affected populations and more
effort on communication with communities in all activities.”
Do affected people have enough say in the way aid
programmes are designed and implemented?
1 = Not at all
2
3
4
5 = Yes, I do
I don't know
Q5. Participation
Mean score: 3.3 (values in %)
Respondents feel that affected people are to some extent able to influence programme design. However, nearly one
third of them do not believe they are.
INGO 3.6
UN agency 3.2
Respondents from UN agencies are less convinced that
affected people have a say in how programmes are run than
INGO staff.
Type of organisation Mean
AFFECTED PEOPLE & FIELD STAFF SURVEY . HAITI 22 I 31

SECTION 2 - FIELD STAFF SURVEY
No 3.0
Yes 3.5
Respondents who work with people in urban areas feel more
optimistic about the involvement of the population than
those who do not.
Work with people affected in urban areas Mean
Follow-up to those who responded 1, 2, or 3 to Q5:
Please explain why you answered that way.
Time constraints:
“We often have 24 hours to prepare a proposal. This does
not allow for any consultation.”
Staff see poor involvement of affected populations because of top-down, donor oriented design, poor feedback
mechanisms, time constraints, and lack of contribution from local actors.
Top-down approach:
“Beneficiaries are only concerned with design and
implementation of activities that are pre-decided, and not
concerned with deciding on what exact intervention is
needed.”
“Projects are designed regarding donor’s strategy and aid
providers … do what donors are prepared to fund.”
Please give 1 or 2 examples of how this could be improved.
Inform affected people about the programmes:
“Informing the beneficiaries about their data, quantities,
coverage, etc.”
Set up inter-sector complaint mechanisms:
“Consider an inter-agency/inter-sector complaint or
feedback mechanism.”
“Articulation between donor strategy and government
strategy; flexibility of donors regarding programmes.”
Include people’s opinions in programme design:
“Representatives from affected people to be consulted on
operational set-up, delivery mechanism, etc. - which would
require a very fast activation of the mechanism (within days)
which will be a challenge.”
Consult with communities during design and assessment
stages:
“Better attention to detail when assessments are made, not
pre-prepared cookie cutter, one-size-fits-all approaches...
Better relations with people in the community.”
“Do post-distribution monitoring to know what beneficiaries
think and this will lead to improvement.”
Do you feel that cash programmes contribute to better
outcomes than other kinds of aid?
1 = Not at all
2
3
4
5 = Yes, I do
I don't know
Q6. Cash
Mean score: 3.4 (values in %)
While nearly half of the respondents feel that cash programmes lead – to varying degrees – to better outcomes,
almost a quarter do not consider cash a more effective practice.
AFFECTED PEOPLE & FIELD STAFF SURVEY . HAITI 23 I 31

SECTION 2 - FIELD STAFF SURVEY
INGO 3.5
UN agency 3.2
Respondents from UN agencies are less convinced in higher
effectiveness of cash than INGO staff.
Type of organisation Mean
Follow-up to those who responded 1, 2, or 3 to Q6:
Please explain why you answered that way.
Short-term nature:
“The temporary distribution of money for the populations
is ineffective because the beneficiaries channel their
expenditure in consumption. There is a need for sustainable
projects which will benefits the whole community.”
“The other forms of distribution are good, but if we
organised a kind of microcredit for the people affected, it
would have been very profitable.”
Some staff criticize cash transfer programmes for their lack of contextualization, short-term nature, and lack of
sustainability
Lack of contextualization:
“I like cash, as it gives people autonomy to make needs-
based decisions, but it requires a sound understanding of
their context. In some places it just doesn’t work (and we
ignore that).”
“In the case of cash distributions, there are more disorders,
thefts, and violence against beneficiaries. Even when the
distribution location is safe, there is the danger that when
a person returns home, he or she may be attacked. The
people most at risk are the elderly and women. It is like
putting people's lives at risk by helping them.”
Please give 1 or 2 examples of how this could be improved.Staff believe that cash programmes can be more effective if they are better targeted, controlled and monitored;
coupled with other support; run in cooperation with local authorities and communities; concerned with security of
recipients, and implemented in a sustainable manner.
Sustainable programming:
“People need to be recovered. The agricultural sector
needs to be reboosted [sic.] and the enterprises need to be
recovered through subventions as well. The other aspect is
related to disaster risk preparedness. There is a great need
to have actions for mitigating future negative impact on the
population. Nothing has yet really been done in terms of
recovery except cash and cash for work just for ten days.
How ten days of work for 300 gourdes can recover the
population? It is a bandage but the real causes are not even
questioned.”
Focus on security of recipients:
“The cash distribution can always be done, but instead of
giving appointments to targeted people in places that will
be seen by other people (because there will always be
intruders), it could be done door to door, to every household,
without attracting the attention of those who are not
affected. It would be much better. It should also be ensured
that the target audience will be present on the chosen date,
and increase the number of reliable agents or distributors.”
Better targeting, control, and monitoring:
“In my opinion, more reliable control mechanisms must be
found, involving local authorities and community leaders
in the targeting and validation of beneficiary lines. Then
ensure online crediting via an operator and the operator will
go into the communities to ensure payment in front of the
authorities and the leaders who had validated the lists of
beneficiaries beforehand.”
AFFECTED PEOPLE & FIELD STAFF SURVEY . HAITI 24 I 31

SECTION 2 - FIELD STAFF SURVEY
Do humanitarian organisations have the flexibility to
adjust their projects and programmes when things
change?
1 = Not at all
2
3
4
5 = Yes, I do
I don't know
Q7. Flexibility
Mean score: 3.7 (values in %)
Most of the staff are quite positive about the flexibility of programming, although 18% are not.
No 3.9
Yes 3.5
Those not working with affected people in urban areas feel
they have more room for programme adjustments.
Work with people affected in urban areas Mean
Respondents involved in management and M&E functions
are more concerned than other staff members.
Area
Field staff team leader 3.6
Field staff team member 3.9
HQ staff 3.2
Other 4.0
Role in the field Mean
Follow-up to those who responded 1, 2, or 3 to Q7:
Please explain why you answered that way.
Top-down programming:
“Many partners are limited in the way they can adapt their
projects. This is because the projects are not designed at
the grassroots level.”
“Very often, humanitarian organisations have project
models, experimented in other countries and they come to
apply them in Haiti without realising that Haiti has its own
specific issues.”
Staff mention a lack of flexibility because of rigid donor demands and agreements with partners, top-down
programming, and time constraints.
Rigid donor demands:
“This is a big issue. All partners in our sector are
complaining that donors are stuck on their programme and
they almost cannot do anything to adjust their programmes
because they have requirements and objectives. They need
to follow donors’ requirements. There is a big need to work
on this.”
AFFECTED PEOPLE & FIELD STAFF SURVEY . HAITI 25 I 31
SECTION 2 - FIELD STAFF SURVEY
Please give 1 or 2 examples of how this could be improved.More flexibility could be reached if it is included in the agreements, and based on community feedback and changing
needs.
“We know that after a disaster, the situation changes in a
fast and progressive way. Organisations should have the
right to adjust their project according to the evolution, of
course with evidence of the change in support.”
Needs-based programming:
“Demand-driven models in which the project/programme
needs are driven by realistic needs in the field (and not
pushed down from HQ) I suspect some are donor driven
and this is a compromise on decision-making.”
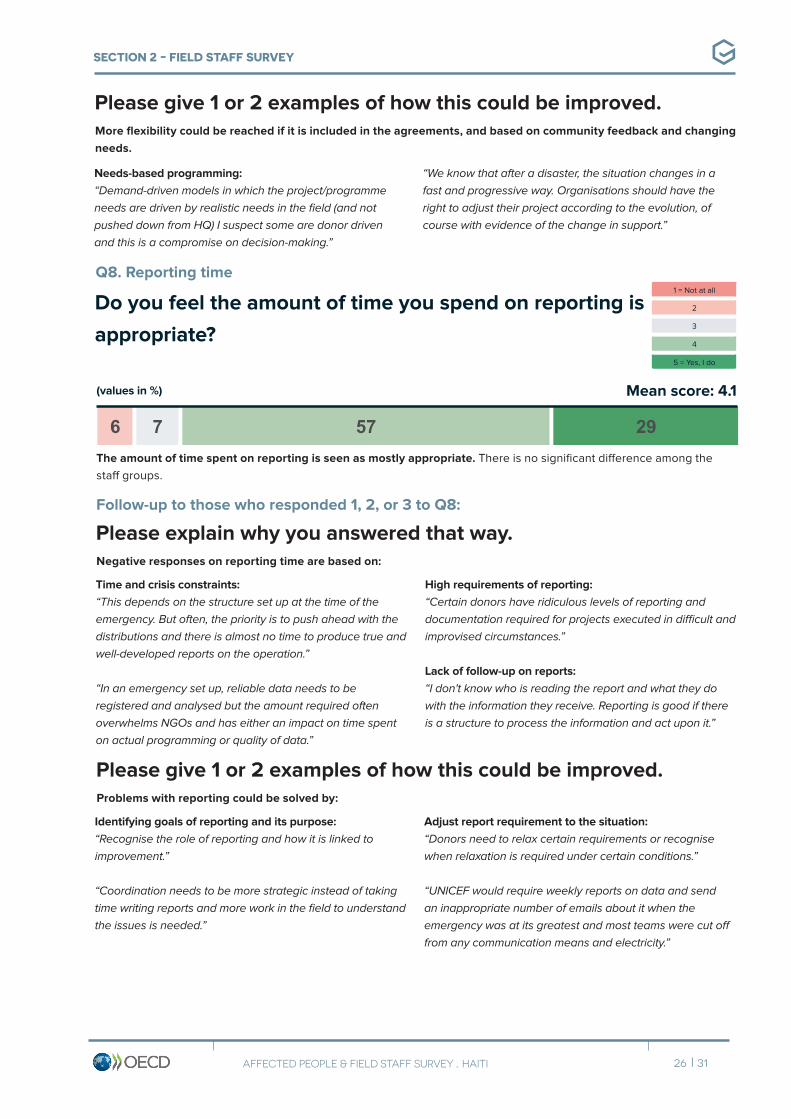
Do you feel the amount of time you spend on reporting is
appropriate?
1 = Not at all
2
3
4
5 = Yes, I do
Q8. Reporting time
Mean score: 4.1 (values in %)
The amount of time spent on reporting is seen as mostly appropriate. There is no significant difference among the
staff groups.
Follow-up to those who responded 1, 2, or 3 to Q8:
Please explain why you answered that way.
High requirements of reporting:
“Certain donors have ridiculous levels of reporting and
documentation required for projects executed in difficult and
improvised circumstances.”
Lack of follow-up on reports:
“I don't know who is reading the report and what they do
with the information they receive. Reporting is good if there
is a structure to process the information and act upon it.”
Negative responses on reporting time are based on:
Time and crisis constraints:
“This depends on the structure set up at the time of the
emergency. But often, the priority is to push ahead with the
distributions and there is almost no time to produce true and
well-developed reports on the operation.”
“In an emergency set up, reliable data needs to be
registered and analysed but the amount required often
overwhelms NGOs and has either an impact on time spent
on actual programming or quality of data.”
Please give 1 or 2 examples of how this could be improved.Problems with reporting could be solved by:
Adjust report requirement to the situation:
“Donors need to relax certain requirements or recognise
when relaxation is required under certain conditions.”
“UNICEF would require weekly reports on data and send
an inappropriate number of emails about it when the
emergency was at its greatest and most teams were cut off
from any communication means and electricity.”
Identifying goals of reporting and its purpose:
“Recognise the role of reporting and how it is linked to
improvement.”
“Coordination needs to be more strategic instead of taking
time writing reports and more work in the field to understand
the issues is needed.”
AFFECTED PEOPLE & FIELD STAFF SURVEY . HAITI 26 I 31
SECTION 2 - FIELD STAFF SURVEY
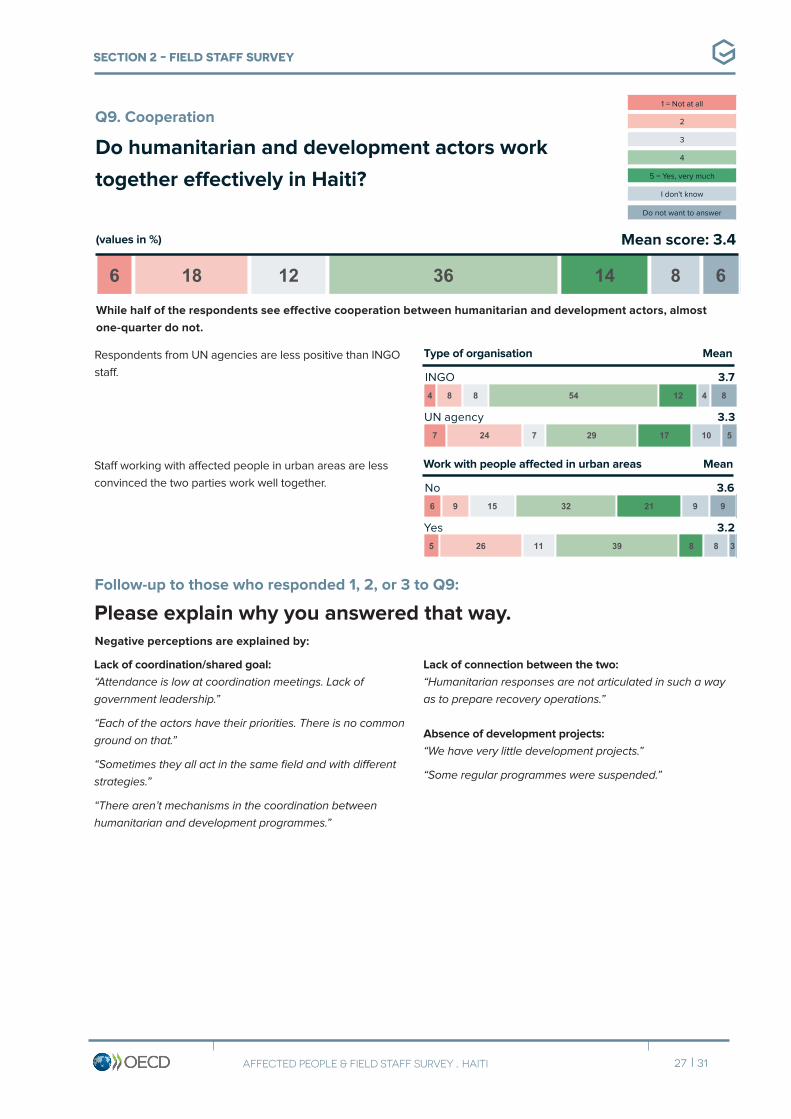
Do humanitarian and development actors work
together effectively in Haiti?
Q9. Cooperation
Mean score: 3.4 (values in %)
While half of the respondents see effective cooperation between humanitarian and development actors, almost
one-quarter do not.
INGO 3.7
UN agency 3.3
Respondents from UN agencies are less positive than INGO
staff.
Type of organisation Mean
No 3.6
Yes 3.2
Staff working with affected people in urban areas are less
convinced the two parties work well together.
Work with people affected in urban areas Mean
Follow-up to those who responded 1, 2, or 3 to Q9:
Please explain why you answered that way.
Lack of connection between the two:
“Humanitarian responses are not articulated in such a way
as to prepare recovery operations.”
Absence of development projects:
“We have very little development projects.”
“Some regular programmes were suspended.”
Negative perceptions are explained by:
Lack of coordination/shared goal:
“Attendance is low at coordination meetings. Lack of
government leadership.”
“Each of the actors have their priorities. There is no common
ground on that.”
“Sometimes they all act in the same field and with different
strategies.”
“There aren’t mechanisms in the coordination between
humanitarian and development programmes.”
1 = Not at all
2
3
4
5 = Yes, very much
I don't know
Do not want to answer
AFFECTED PEOPLE & FIELD STAFF SURVEY . HAITI 27 I 31

SECTION 2 - FIELD STAFF SURVEY
Please give 1 or 2 examples of how this could be improved.Cooperation could be improved by:
Focusing on sustainability:
“Include Development/Recovery in the Intersectoral
meetings.”
“Invest in sustainable development.”
Including communities:
“Implementation of projects directly with the communities
without the association of emergency humanitarian actors,
no visible realisation of the development as the emergency
tends towards its end.”
Organising better networking/communication/
cooperation:
“The UN agencies have a much better coordinating
structure through OCHA; they are able to make the
necessary coordination and agreement required to avoid
duplications in the actions to be carried out at the field
level.”
“Parallel coordination fora are in place, synergies need to
be created.”
AFFECTED PEOPLE & FIELD STAFF SURVEY . HAITI 28 I 31
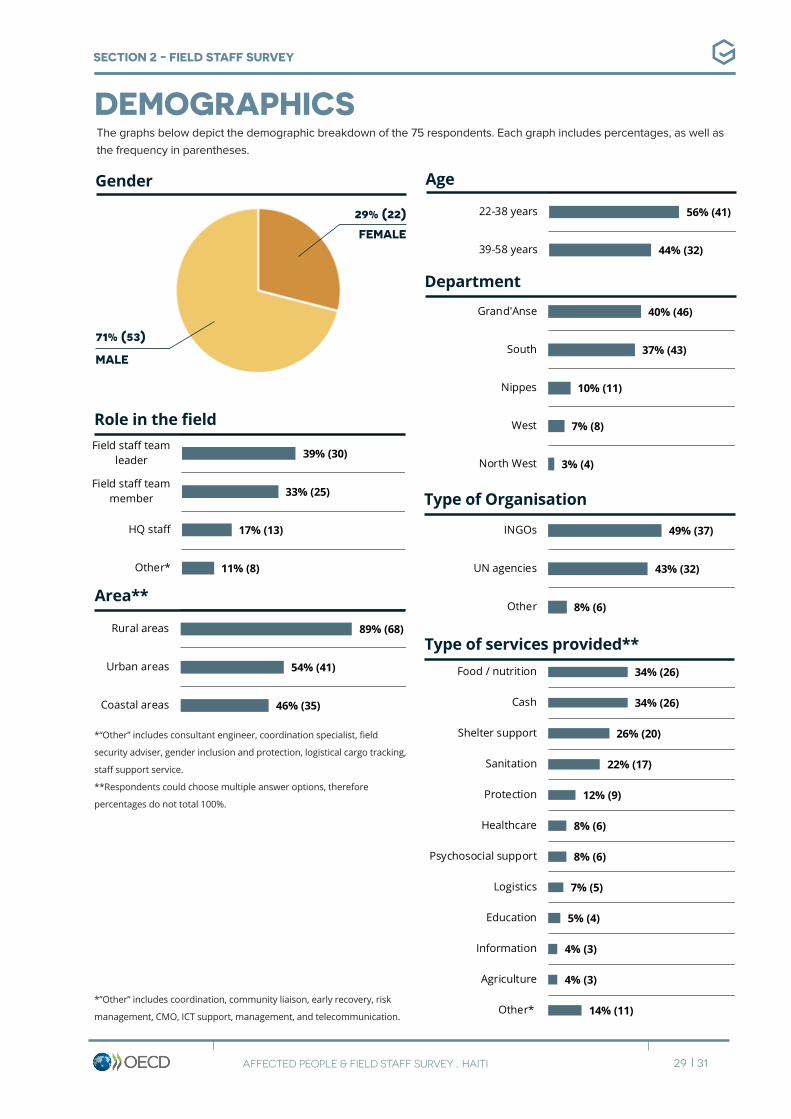
40% (46)
37% (43)
10% (11)
7% (8)
3% (4)
Grand'Anse
South
Nippes
West
North West
SECTION 2 - FIELD STAFF SURVEY
DEMOGRAPHICS
71% (53)
MALE
Gender
29% (22)
FEMALE
Type of services provided**
Area**
Age
Department
*“Other” includes consultant engineer, coordination specialist, field
security adviser, gender inclusion and protection, logistical cargo tracking,
staff support service.
**Respondents could choose multiple answer options, therefore
percentages do not total 100%.
Type of Organisation
Role in the field
*”Other” includes coordination, community liaison, early recovery, risk
management, CMO, ICT support, management, and telecommunication.
The graphs below depict the demographic breakdown of the 75 respondents. Each graph includes percentages, as well as
the frequency in parentheses.
49% (37)
43% (32)
8% (6)
INGOs
UN agencies
Other
34% (26)
34% (26)
26% (20)
22% (17)
12% (9)
8% (6)
8% (6)
7% (5)
5% (4)
4% (3)
4% (3)
14% (11)
Food / nutrition
Cash
Shelter support
Sanitation
Protection
Healthcare
Psychosocial support
Logistics
Education
Information
Agriculture
Other*
56% (41)
44% (32)
22-38 years
39-58 years
39% (30)
33% (25)
17% (13)
11% (8)
Field staff teamleader
Field staff teammember
HQ staff
Other*
89% (68)
54% (41)
46% (35)
Rural areas
Urban areas
Coastal areas
AFFECTED PEOPLE & FIELD STAFF SURVEY . HAITI 29 I 31

RECOMMENDATIONS & NOTE ON METHODOLGY
RECOMMENDATIONS AND NEXT STEPSThe following next steps are suggested for consideration by
humanitarian organisations in Haiti:
a) Dialogue. Agencies should discuss the main findings with
their staff and partners to verify and deepen the analysis.
These ”sense-making” dialogues should focus on areas
where the data suggests that further attention or course
correction may be necessary.
b) Advocacy. Consider sharing the feedback with other
agencies working in Haiti to see how, together, the
humanitarian community can address concerns or bridge
gaps.
c) Close the loop. Encourage field staff to close the
feedback loop by communicating changes or informing
affected people about how services are being adapted to
take their feedback into account.
Ground Truth would be happy to discuss these next steps
and offer advice about how to move things forward.
NOTE ON METHODOLOGYBackground OECD donors and humanitarian actors made a series
of commitments at the WHS in Istanbul to increase the
efficiency and effectiveness of humanitarian aid. The
OECD secretariat seeks to assess the policy changes in
the global humanitarian landscape as well as whether the
commitments made in the Grand Bargain are having the
intended impact. As part of this exercise, Ground Truth
Solutions has been commissioned to track the way people
affected by humanitarian crises and field staff experience
reforms set out in the Grand Bargain. The objective is to
inform implementation of the Grand Bargain and, ultimately,
to improve the effectiveness of humanitarian aid.
Survey development Ground Truth developed two survey instruments - the
affected people survey and the field staff survey - to
measure the implementation and the effects of the Grand
Bargain commitments. The goal of the first survey is to
gather feedback from affected people on the provision of
humanitarian aid and track how perceptions evolve over
time. The second survey, meanwhile, collects feedback from
field staff on the implementation of Grand Bargain themes
and provides a baseline to track progress on implementation
and impact of the commitments. Closed questions use a 1-5
Likert scale to quantify answers.
Sample sizeAffected people survey
Interviews were conducted with 599 people across four
departments in Haiti targeting people affected by recent
natural disasters who have received humanitarian support.
Field staff survey
Online surveys were conducted with 75 field staff team
members, team leaders and M&E, programme and technical
specialists from iNGOs and UN agencies. Twenty-nine
percent of respondents were female and 71% male.
Sampling methodologyAffected people survey
At least 100 people were randomly selected in each of
four departments in Haiti. The objective was to have
representative samples from each of the four most
affected regions, spread across urban, rural, and coastal
communities, split evenly between males and females.
Participants were randomly selected and interviewed in
public places in 14 different communes.
Field staff survey
Twelve organisations were approached and asked to
participate in the survey.
Eleven organisations participated and distributed the online
survey using a convenience sample of their staff.
Organisations participating were: UN agencies and
international organisations (OCHA, UNDP, UNICEF, WFP,
IOM); INGOs (CARE, CRS, IFRC, Mercy Corps, Oxfam); and
one local responder J/P HRO.
Data disaggregationAffected people survey
Data is disaggregated by department, area, age and type of
accommodation.
Field staff survey
Data is disaggregated by type of organisation, role in the
field and work with affected people in different areas. The
analysis in the report includes any significant difference
in the perceptions of different demographic groups. It
does not, however, show the full breakdown of responses
according to these categories.
Language of the survey Affected people survey
This survey was conducted in French and Haitian Creole.
Field staff survey
This survey was conducted in English, French, and Haitian
Creole.
AFFECTED PEOPLE & FIELD STAFF SURVEY . HAITI 30 I 31

NOTE ON METHODOLGY
Data collectionAffected people survey
Data was collected between 9 and 13 April 2017 by Le Fonds
de Parrainage National, an independent data collection
company contracted by Ground Truth.
Field staff survey
Data was collected between 17 April and 18 May 2017 using
an online survey tool.
For more information about Ground Truth surveys in Haiti, please contact Nick van Praag
([email protected]), Michael Sarnitz ([email protected]), or Valentina Shafina
AFFECTED PEOPLE & FIELD STAFF SURVEY . HAITI 31 I 31