
Field Data Collection Using Geographic Information … · Mark Harris Jeff Bailey Jaki McCarthy...
57
United States Department of Agriculture National Agricultural Statistics Service Research and Development Division Washington DC 20250 RDD Research Report Number: RDD 15-03 July 2015 Field Data Collection Using Geographic Information Systems Technologies and iPads on the USDA’s June Area Frame Survey Michael Gerling Linda Lawson Jillayne Weaber Alan Dotts Andrew Vardeman Eric Wilson This paper was prepared for limited distribution to the research community outside the United States Department of Agriculture. The views expressed herein are not necessarily those of the National Agricultural Statistics Service or of the United States Department of Agriculture.
Transcript of Field Data Collection Using Geographic Information … · Mark Harris Jeff Bailey Jaki McCarthy...

United States
Department of
Agriculture
National
Agricultural
Statistics
Service
Research and
Development Division
Washington DC 20250
RDD Research Report
Number: RDD 15-03
July 2015
Field Data Collection Using
Geographic Information Systems
Technologies and iPads on the
USDA’s June Area Frame Survey
Michael Gerling
Linda Lawson
Jillayne Weaber
Alan Dotts
Andrew Vardeman
Eric Wilson
This paper was prepared for limited distribution to the research community outside the United States
Department of Agriculture. The views expressed herein are not necessarily those of the National
Agricultural Statistics Service or of the United States Department of Agriculture.

i
EXECUTIVE SUMMARY
The National Agricultural Statistics Service’s (NASS) primary purpose is to provide timely,
accurate and useful statistics on United States and Puerto Rico agriculture. NASS conducts over
400 surveys annually to estimate crop and livestock production, production practices, farm
economics, etc. NASS has twelve regional field offices and thirty-three field offices across the
United States that are responsible for collecting agricultural data. These regional offices employ
various data collection methods, including: personal interview using a paper questionnaire, mail,
Computer Assisted Telephone Interviewing, self-administered web and most recently, Computer
Assisted Personal Interview (CAPI).
The June Agricultural Survey (JAS) is an annual survey that provides information on U.S. crops,
livestock, grain storage capacity, as well as number, type and size of farms. The JAS is
comprised of two components, the List Survey and the Area Survey. The List Survey is
comprised of agricultural operations known to NASS. The Area Survey is comprised of
designated land areas known as segments and is used in determining the incompleteness of the
List. This study is focused on the Area portion, which will be addressed as JAS. The JAS’s
sample is comprised of nearly 11,000 designated land areas known as segments. A typical
segment is about one square mile -- equivalent to 640 acres. Each segment is outlined on an
aerial photo (typically 2’ by 2’ in size) and provided to NASS’s field interviewers. Field
interviewers (known as enumerators) visit these segments and identify the owners/operators of
all land within the segment. Land is then categorized into agricultural or non-agricultural and
recorded on a paper form. For land where agricultural activity is occurring, a separate paper
questionnaire is completed for each agricultural operation operating on any land within the
segment.
A team composed of NASS staff and Iowa State University’s Center for Survey Statistics and
Methodology staff developed a CAPI instrument to collect data for the JAS’s aerial imagery
portion and collect field level information. The instrument was tested in Pennsylvania, Indiana
and Washington. Nine field enumerators participated in the live data collection study. Thirty-six
grid segments (a new type of segment) were field enumerated. Budgetary constraints (travel and
training funds) challenged the team, however, were overcome by developing
remote/correspondence training of field enumerators.
The study shows that the conventional JAS enumeration is possible in a CAPI environment. The
study demonstrates that the June Agricultural Survey can be collected by field enumerators via
CAPI and that the CAPI instrument can also be utilized for evaluating the impact of moving to a
permanent grid area frame. However, additional studies are required to see if both CAPI and
grid segments are cost effective and practical.
This report is for both general and technical audiences and provides an overview of the CAPI
instrument to the detailed underlying programming of the instrument. The report also shows
how remote training can be utilized in training field enumerators.

i

ii
RECOMMENDATIONS
1. Incorporate the key features of the current JAS-CAPI survey instrument into
the next version.
a. Draw out and label tracts and fields using a stylus.
b. Zoom in and out of the aerial imagery.
c. Streamline Section D (detailed field level questions of the
questionnaire) to a series of drop down menus and skip patterns.
d. Edit/data consistency checks to improve data quality and integrity.
e. Toggle between full screen mode showing the aerial imagery to split
screen mode showing both aerial imagery and Section D.
f. Aerial imagery and Section D update each other accordingly.
g. Undo and redo options.
h. Ability to fix any drawn out tract’s and field’s boundaries as needed.
i. One touch ability to go back to the segment if the interviewer loses
one location on the screen.
j. Ability to display various layers (like Cropland Data Layer) where
practical.
k. Ability to display all or particular tracts and/or fields of interest.
l. Ability to freeze the aerial imagery displayed on the screen so that a
farmer can point and touch the screen, without having any tools
activated.
m. Show the geospatial information systems calculated area for each field
as a guide for the interviewer.
n. Display grid segment’s ID, state and county.
2. Evaluate the amount of time required to conduct a JAS interview via the
iPad compared to the current aerial photo and paper questionnaire
approach.
3. Continue to research the use of grid segment frame process as a potential
replacement for the current JAS area frame process.
4. Research ways to improve the iPad’s screen visibility in direct sunlight.
5. Research the feasibility and practicality of full-scale implementation of
CAPI for the JAS.
6. Continue to research the use of remote/correspondence training in the
training of field enumerators.


iii
ACKNOWLEDGEMENTS
The authors would like to thank:
National Agricultural Statistics Service
Research and Development
Mark Harris
Jeff Bailey
Jaki McCarthy
Matt Deaton
William Jordan
Beth Edwards
Jonathan Lisic
Terry O’Connor
Irwin Anolik
Field Operations
Debbie Dunham
Greg Matli
Kevin Pautler
Sherry Deane
Eric Stebbins
Dennis Koong
Gerald Tillman
Indiana, Pennsylvania and Washington Field Enumerators
Census and Survey
Chris Messer
David Hancock
Leslee Lohrenz
Information Technology
Renato Chan
Prince Hakim
Iowa State University
Center for Survey Statistics and Methodology
Sarah Nusser


iv
Table of Contents
Abstract……………………………………………………………………………………….
1.0 Background and Modernization of the June Agricultural Survey (Area)……..…......
1.1 Reducing JAS’ Preparation Time And Expense……………………...............
1.2 Improving Cropland Data Layer Accuracy and Efficiency…………………..
1.3 Improving CAPI’s Return on Investment…………………….………………
2.0 Project’s Goals………………………………………………………………………..
2.1 Anticipated Benefits………………………………………………………….
3.0 Development of JAS-CAPI Instrument..……………………………………………..
4.0 JAS-CAPI Instrument (Features, Screen Layout and Functionality)………………...
5.0 Training - Pennsylvania and Indiana ………………………………………………...
6.0 Remote Training - Washington ………………………...……………………………
7.0 Test Segments………………………………………………………………………..
8.0 Field Data Collection…………………………………………………………………
9.0 Enumerator Feedback & Evaluation of the JAS-CAPI Instrument…………………..
9.1 Respondents’ Acceptance of this Technology and Perception of the
Interviews’ Length……………………………………………………………
9.2 Overall Feedback……………………………………………………………..
10.0 Future Direction………………………………………………………………………
11.0 Recommendations……………………………………………………………………
12.0 References……………………………………………………………………………
Appendices
A Indiana’s 2012 JAS Questionnaire Section D – Crop and Land Use on Tract .……..
B JAS-CAPI Technical Requirements And Functional Overview……………………..
C Pre-Survey Letter Provided to Agricultural Operator at the Time of Interview……..
D Data Collection Feedback Form……………………………………………………...
1
2
3
4
5
6
7
7
8
18
19
20
21
25
29
30
31
32
33
A-1
B-1
C-1
D-1


1
Field Data Collection using Geographic Information Systems Technologies
and iPads on the USDA’s June Area Frame Survey
Michael Gerling, Linda Lawson, Jillayne Weaber, Alan Dotts
Andrew Vardeman, Eric Wilson 1/
Abstract
The National Agricultural Statistics Service (NASS) surveys farmers and ranchers across the
United States and Puerto Rico in order to estimate crop production and number of livestock, to
assess production practices, and to identify economic trends. The June Agricultural Survey
(JAS) is an annual survey that provides information on U.S. crops, livestock, grain storage
capacity, and number, type and size of farms. The JAS is comprised of two components, the List
Survey and the Area Survey. The List Survey is comprised of agricultural operations known to
NASS. The Area Survey is comprised of designated land areas known as segments and is
utilized in measuring the incompleteness of the List. This study is focused on the Area portion,
which will be abbreviated as JAS. The JAS sample is comprised of nearly 11,000 designated
land areas known as segments. A typical segment is about one square mile -- equivalent to 640
acres. Each segment is outlined on an aerial photo (typically 2’ by 2’ in size) and provided to
NASS’s field interviewers. Field interviewers visit these segments and identify the
owners/operators of all land within the segment. Land is then categorized as agricultural or non-
agricultural. For land where agricultural activity is occurring, a separate paper questionnaire is
completed for each agricultural operation operating land within the segment.
A team composed of staff from NASS and Iowa State University Center for Survey Statistics and
Methodology developed a Computer Assisted Personal Interview (CAPI) instrument to conduct
the JAS aerial imagery portion and collect field level information. Also, the team was tasked
with testing field enumeration of grid segments (a new type of segment) that could make the JAS
sample preparation process more efficient. The JAS-CAPI instrument was field tested in
Pennsylvania, Indiana and Washington.
Key Words: Agriculture, CAPI, Data Collection, GIS, Area Frame Survey
__________________
1/ Michael W. Gerling - Mathematical Statistician and Eric Wilson (formerly) Agricultural Statistician for the National Agricultural Statistics
Service - Research & Development Division, located at 3251 Old Lee Highway, Fairfax, VA 22030. Alan Dotts and Andrew Vardeman (formerly) from the Iowa State University - Center for Survey Statistics and Methodology. Linda Lawson and Jillayne Weaber are from
NASS’ Great Lakes Regional Office located in East Lansing, MI, NASS’ Northeast Regional Office located in Harrisburg, PA, respectively.
2
1.0 BACKGROUND AND MODERNIZATION OF THE JUNE AGRICULTURAL
SURVEY
The National Agricultural Statistics Service’s (NASS) primary purpose is to provide timely,
accurate, and useful statistics on United States and Puerto Rico agriculture. NASS conducts over
400 surveys annually for making estimates on crops, livestock, production practices, and
identifying economic trends. Most surveys conducted during the course of the year are based on
NASS’s extensive list frame of farm and ranch operations. However, the June Agricultural
Survey (JAS) is one of the largest surveys conducted and utilizes an area sampling frame. The
area frame consists of all land in the U.S. (except Alaska), stratified by land use. The JAS is
conducted annually and provides mid-year estimates of U.S. crops, livestock, grain storage
capacity, as well as number, type and size of farms. The JAS data are also used as the basis for
several other surveys that are conducted throughout the year.
The JAS is comprised of two components, the List Survey and the Area Survey. The List Survey
component is comprised of agricultural operations known to NASS. The Area Survey is
comprised of designated land areas known as segments. This study is focused on the Area
Survey, which will be abbreviated as JAS. The JAS sample is comprised of nearly 11,000
designated land areas known as segments. A typical segment is about one square mile, (640
square acres) with identifiable boundaries such as fields, ditches, roads, railroads, streams, etc.
Each segment is outlined in red on an aerial photo (typically 2’ by 2’ in size) and provided to
NASS’s field interviewers (commonly called field enumerators). Determination and preparation
of segments is labor intensive and expensive with overall costs around 2.6 million dollars. See
Section 1.1 for additional detail.
Enumeration occurs in the first two weeks of June. Field enumerators visit these segments and
identify the agricultural operators of all land within the segment. Personal interviews are
required since operators within the selected segments are not known until the field enumerator
actually visits the area of interest.
Land is categorized into agricultural or non-agricultural tracts and recorded on a paper form. A
tract is an area of land inside a segment under one type of land operating arrangement. There are
two types of tracts: (1) agricultural tracts consisting of agricultural land; and (2) non-
agricultural tracts consisting of residential, industrial, and commercial areas, and land not
considered agricultural (i.e., lakes, woods).
The field enumerator will complete a separate paper questionnaire for each agricultural operation
operating any land within the segment on June 1st. Respondents identify each field boundary on
the aerial photo and report acreage and the crop planted or other land use (pasture, woods,
wasteland, etc.) Figure 1 shows a segment and corresponding tracts and fields drawn out.
Approximately 85,000 tracts are identified and over 35,000 personal interviews are conducted.
The JAS’s preparation annual expenses total 2.6 million dollars with another 3.6 million dollars
in data collection costs.

3
Figure 1: A Segment from Pennsylvania
The area outlined in red is the segment.
Tracts are outlined in blue and labeled with
letters. Individual fields are outlined in red
within the tracts and labeled with numbers.
1.1 REDUCING JAS PREPARATION TIME AND EXPENSE
Currently, segment selection is composed of two processes.
First, all land in a state is stratified using geographic information system (GIS) technology such
as satellite imagery, aerial photography, and a combination of aerial imagery showing various
land and crop types known as the Cropland Data Layer (CDL) (Boryan & Yang, 2012). This
step is a manual process where Primary Sampling Units (PSUs) are digitized (electronically
identified using GIS software) and classified into the defined strata for a state. The PSU refers to
the first unit of selection for the JAS. PSUs are typically four square miles in the highly
cultivated land strata. This process takes five cartographic technicians approximately 4 months
to complete one state.
Second is the selection of segments in the sampled PSUs. In general, staff divide a PSU of four
square miles into four segments, one square mile each. Next, one segment is randomly chosen
from within each sampled PSU. This process avoids segment delineation for non-selected PSUs
thereby saving resources. Eight staff working year-round are required to select the rotating
sample. Also, in the preparation of JAS segments, segment boundaries are adjusted (moved) to
natural boundaries that can be easily identified outdoors like roads, ditches, edges of fields,
rivers, tree lines, etc. This “tweaking” of boundaries is also a labor-intensive process. In the
current sampling scheme, the JAS replaces the oldest 20% of the segments with new segments
rotated in each year. A state receives a completely new area frame sample approximately every
fifteen years. This annual process takes twenty-five staff with salary and benefits totaling about
2.5 million dollars and another 100,000 dollars in equipment, software, printing, and mailing of
materials.

4
A proposed alternative sampling process is based on a permanent area frame with units having
roughly equal-sized and shaped areas, and thus lacking physically identifiable boundaries. A
prototype frame was created based on the Public Land Survey System (PLSS). PLSS is a
surveying method used over large parts of 30 states in the United States to spatially identify
parcels of land. PLSS was especially helpful in rural and undeveloped land. Land was divided
up into (mostly) rectangular areas going from a 24 mile by 24 mile quadrangle down to a one
mile by one mile square section. The PLSS began after the Revolutionary War as a way for the
government to sell land for revenue, reward soldiers for their services, and to develop a cadastral
system of land ordinance. In areas not covered by the PLSS (mainly the Northeast/Mid-Atlantic
and Texas), an analogous grid would be generated.
Hence, the United States could be divided into roughly 1 mile x 1 mile squares, (commonly
called grid segments). This grid segment construction and sampling process could then be
automated to handle stratification and sample selection of these segments using data from the
CDL. The field enumerator would then be responsible for collecting all agricultural data within
the defined grid segment. This would reduce the resources required in the preparation for the
JAS.
However, a challenge with grid area segments is that fields may not be fully contained within a
segment boundary. In these instances, information must be collected for the portion of the field
that lies within the segment. This may be difficult for an agricultural operator to report correctly
viewing a printed aerial photo. Thus, having a Computer Assisted Personal Interview (CAPI)
instrument incorporating GIS information in a geospatial display, combined with tools to
delineate fields and tracts within the grid segment, could be used to eliminate the need for
agricultural operators to report acreage for land within the segment. This report describes the
development of a GIS CAPI instrument to collect JAS data and the enumeration of grid
segments.
1.2 IMPROVING CROPLAND DATA LAYER ACCURACY AND EFFICIENCY
The Cropland Data Layer (CDL) is an annual crop specific land cover product, depicting more
than one hundred unique crop categories across the nation. NASS derived this cropland area
monitoring program via remote sensing (satellite data) using a supervised land cover
classification approach. The national CDL product (Boryan, Yang, Mueller and Craig, 2011) is
available at http://nassgeodata.gmu.edu/CropScape.
During the growing season, NASS derives monthly cropland area estimates from the CDL,
delivering robust statistical estimates using a hierarchical regression approach for the major
crops at the state, agricultural statistics district, and county levels. The CDL has classification
accuracies of 85 to 95 percent for the major crops (Boryan, Yang, Mueller and Craig, 2011).
The CDL’s primary purpose is to provide acreage estimates to the Agricultural Statistics Board

5
for each state's major commodities and to produce digital, crop-specific, categorized geo-
referenced output products.
Currently, the CDL is a component in determining the stratification for the JAS. Initial results
have shown that utilizing the CDL lends itself to better designs than in the past. The CDL relies
on additional ground truth information to improve its accuracy. This is obtained from USDA’s
Farm Service Agency and works well for the major crops. However, for quality ground truth on
minor crops, a field enumerator physically visits particular locations and determines the crops
grown. This real-time ground truth is expensive to collect.
A CAPI instrument incorporating GIS ties the agriculture information collected on the JAS to
geolocations. In the future, these geolocations could be another input into the CDL’s geospatial
statistical models, which would improve the CDL’s accuracy of determining major and
especially minor crops. These improvements to the CDL would, in turn, improve the sampling
scheme of the JAS. The JAS sample processes and systems would have to be revised to
accommodate this additional input.
1.3 IMPROVING CAPI’S RETURN ON INVESTMENT
Over the past two years, NASS has made a substantial investment in CAPI. Nearly all 1,700+
field enumerators have been provided an Apple Inc’s iPad ($750) with built in 3G/4G wireless
broadband. Also, NASS modified the pure thin-client CAPI approach (Gerling & Harris, 2010;
Gerling, 2004) where no data reside on the device to more of a thick-client. This thick client
approach allows for interviews to be conducted in those instances when a wireless broadband
signal is unavailable since the questionnaire and collected data are stored in the iPad’s memory.
Field enumerators are instructed to download that day’s questionnaires onto the iPad at the start
of the day. During the actual interviews, the instrument’s underlying technologies
(Asynchronous JavaScript and XML (AJAX)) send individual survey data responses to NASS
web servers via wireless broadband. If no usable signal is found to transmit the data, the
instrument stores the data on the iPad. When a signal is available, the data are transmitted to the
NASS web server. Thus, interviews are conducted independent of a wireless broadband signal.
Some of the potential benefits of having a JAS-CAPI are reduced mailing and printing costs of
questionnaires, real-time access to field-collected data, reduced data entry staff, and improved
data quality. Additionally, adding GIS functionality to delineate fields in the CAPI interface
could eliminate the need and expense of printing, organizing and mailing of aerial photos.
In 2011, Iowa State University’s Center for Survey Statistics and Methodology (ISU-CSSM)
developed a GIS-based CAPI instrument for the 2012 National Resources Inventory Survey and
the Conservation Effects and Assessment Program. NASS’s iPads were utilized and the
instrument displayed both aerial imagery and a questionnaire. Both of these surveys were
funded by USDA’s Natural Resources Conservation Service (NRCS) and conducted by NASS.
Federal funding of the CAPI instrument made it no longer proprietary.
6
Thus, NASS and the ISU-CSSM jointly leveraged the basic structure of the CAPI instrument to
accommodate the JAS, thereby providing the Agency with substantial savings compared to
building a CAPI instrument from scratch.
2.0 PROJECT’S GOALS
a. Develop a CAPI instrument displaying the digital aerial imagery on the iPad with
the ability to draw out and label the various tracts and fields and the ability to
complete Section D - Crop and Land Use on Tract of the paper questionnaire.
Section D is a complex multi-row-and-column table spanning two pages, focusing
on the land use occurring within the particular fields that an operator has in the
defined segment. See Appendix A for a copy of Section D.
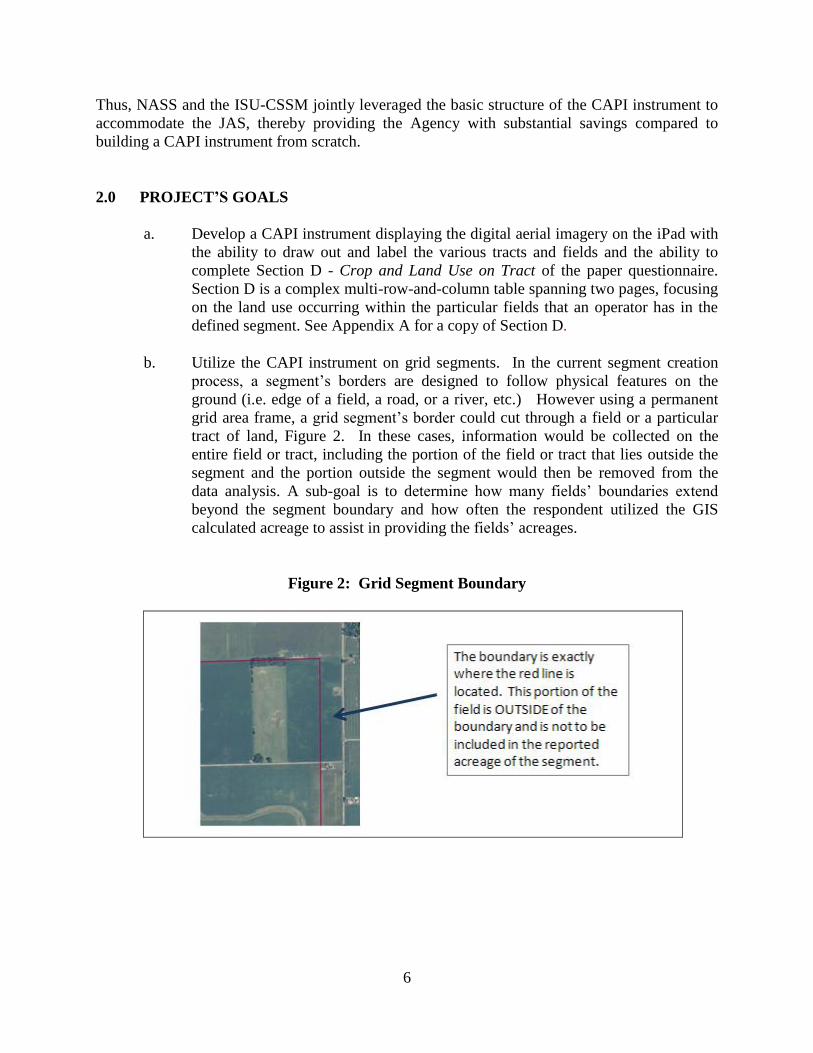
b. Utilize the CAPI instrument on grid segments. In the current segment creation
process, a segment’s borders are designed to follow physical features on the
ground (i.e. edge of a field, a road, or a river, etc.) However using a permanent
grid area frame, a grid segment’s border could cut through a field or a particular
tract of land, Figure 2. In these cases, information would be collected on the
entire field or tract, including the portion of the field or tract that lies outside the
segment and the portion outside the segment would then be removed from the
data analysis. A sub-goal is to determine how many fields’ boundaries extend
beyond the segment boundary and how often the respondent utilized the GIS
calculated acreage to assist in providing the fields’ acreages.
Figure 2: Grid Segment Boundary

7
2.1 ANITICPATED BENEFITS
1. Improved timeliness of the data.
2. Reduced printing, mailing and shipping costs of survey materials.
3. Minimized paper costs: (reduced printing of survey materials, storage and eventual
shredding of questionnaires).
4. Ability for supervisory staff to review their staff’s work throughout the data
collection process.
5. Collection of data up to the last minute.
6. Transfer of field enumerator assignments without having to mail or drive materials
between enumerators.
7. Improved data quality by having real-time edit checks.
8. Reduced data entry from the office.
9. Ability to provide the latest aerial imagery available, which may reduce errors in data
collection.
10. Reduced resources (staffing) in the sampling and preparation of segments.
3.0 DEVELOPMENT OF JAS-CAPI INSTRUMENT
A team composed of staff from NASS (Research and Development Division, Census and Survey
Division, Information and Technology Division, and the Regional Field Offices) and from ISU-
CSSM’s programmers was established. Since the regional and supporting field offices are major
stakeholders, the team’s initial task was to decide where to test in order to obtain support and
input from field staff in those offices.
Three states were selected (Indiana, Pennsylvania, and Washington).
Indiana:
a.) First state to adopt CAPI in NASS and thus had the most experience with CAPI.
b.) Staff had co-authored CAPI training manuals and various other CAPI materials and was
available.
Pennsylvania:
a.) Close proximity to Research and Development Division for accessibility of training of
field staff and for testing of the JAS-CAPI instrument.
b.) Reorganization of NASS made Pennsylvania a regional office for the northeast. A
regional office now oversees data collection for several states. Having representation of
regional office staff was beneficial since their field interviewers would be the primary
users of JAS-CAPI.
c.) Test instrument on different agriculture than IN.
8
Washington:
a.) Test different agriculture compared to IN and PA.
b.) Had initial experience with CAPI.
c.) Re-organization of NASS made Washington a regional office for the Pacific Northwest.
d.) Good working rapport on past NASS research projects.
The next step was to create initial instrument specifications to start the development process.
These are listed below:
1. Work independently of a wireless broadband connection.
2. Display the image of the segment on the iPad.
3. Draw tracts and fields in a reasonable amount of time without increasing respondent
burden.
4. Have the drawn off tracts and fields automatically be connected to the corresponding
information collected during the survey.
5. Streamline the Section D of the questionnaire that pertains to detailed questions on
the drawn off fields and tracts.
6. Incorporate best practices in interface design and functionality, (user friendly).
Over the following six months, the JAS-CAPI instrument was developed to handle current JAS
segments and evaluate grid segments. The instrument was also designed as a web application
having both client and server side components. Appendix B provides the technical details.
4.0 JAS-CAPI INSTRUMENT (Features, Screen Layout and Functionality)
This section provides detailed documentation of the operation of the JAS-CAPI instrument.
First, the field enumerator downloads the web application to the iPad from the created JAS-CAPI
website. This website also displays the enumerator’s assignment listing where the enumerator
can check out his/her designated segments and downloads the aerial imagery and questionnaires
to the iPad for that day’s work. Once a segment is checked out no one else is able to check out
the segment. This prevents another enumerator from mistakenly working on the same segment.
Pre-loading segments to the iPad allows the interview to occur regardless of an available wireless
broadband connection.
To begin the interview, the enumerator, utilizing the iPad, brings up the pre-loaded segment of
interest. The field enumerator shows the imagery with the segment already outlined in red to the
agricultural operator. Next, the enumerator asks about the land the operator operates within the
segment boundary. The enumerator draws off the various fields that the operator points out.
Tracts and fields are drawn out on the iPad using a stylus or finger. Various options (re-do, un-
do etc.) were also programmed into the instrument for improved usability.

9
The JAS-CAPI instrument can display the aerial imagery of the segment of interest in full screen
mode (Figure 3) or can show both imagery and questionnaire in split screen mode (Figure 4).
Figure: 3: Full Imagery Mode
Figure 4: Dual Screen Mode
Next, the enumerator asks detailed questions about each particular field. The enumerator pulls
up the first screen of the questionnaire and enters the tract and field names and any comments.
Also, the enumerator can view the calculated GIS acreage for any particular field. Next, the
enumerator presses a button on the application to bring up a streamlined Section D.
Section D asks for detailed information on the agricultural activity occurring for each drawn off
field. On the paper questionnaire, Section D is a multi-row and multi-column table spanning two
pages. This was condensed to 5-10 dropdowns. The form is also dynamically interactive. For
example, once the particular land use (Homestead, Cropland, Waste, etc.) is specified, the rest of
the form dynamically changes to those questions pertaining to that land use. Item non-response
was also programmed into the instrument. For example, if all questions for a particular field are
not completed, then the form cannot be marked as completed and those cells requiring
completion are highlighted. Also, basic edit checks were coded

10
into the instrument. For example, irrigated acres in a field can be no more than the total number
of field acres.
The enumerator continues to complete Section D and, if needed, can toggle back to the aerial
imagery to draw out any additional fields. The enumerator can label tracts and fields either
directly on the imagery or on the questionnaire.
Additionally, the JAS-CAPI instrument has a zoom feature to view from 2 to 32 inches per mile.
Currently, the aerial photo only provides an 8-inch per mile view. The CDL is also available and
provides functionality beyond the paper questionnaire and aerial photo. In the future, a roads
layer will be added to help in finding and discussing the segment with the respondent.
Next, the field enumerator visits any additional agricultural operators farming in the segment and
repeats the above process.
The instrument was developed to save information automatically to the iPad and, if a broadband
signal is available, the information is also saved to the NASS web server. The enumerator can
work on multiple segments and has the ability to review data at any time before final submission.
After final submission, the segment and the corresponding data are removed from the iPad
automatically.
Figure 5 shows the JAS-CAPI instrument running on an iPad. The instrument’s key features are
summarized below:
a. Draw out and label tracts and fields using a stylus.
b. Zoom in and out of the aerial imagery.
c. Streamline Section D (detailed field level questions of the questionnaire) to a series of
drop downs and skip patterns.
d. Edit/data consistency checks to improve data quality and integrity.
e. Toggle between full screen mode showing the aerial imagery to split screen mode
showing both aerial imagery and Section D.
f. Aerial imagery and Section D update each other accordingly.
g. Undo and redo options.
h. Ability to fix any drawn out tract’s and field’s boundaries as needed.
i. One touch ability to go back to the segment if the interviewer loses his/her place on
the screen.
j. Display Crop Land Data Layer as needed.
k. Ability to display all or particular tracts and or fields of interest.
l. Ability to freeze the aerial imagery displayed on the screen so that a farmer can point
and touch the screen, without having any tools activated.
m. Show the geospatial information systems calculated imagery for each field as a guide
for the interviewer.
n. Display the grid segment’s ID and the state and county.

11
Figure 5: JAS-CAPI Instrument operating on an iPad
In the current JAS’s aerial photo enumeration process, the field enumerator uses a blue grease
pencil to draw out tracts and a red grease pencil to draw out fields on the paper photo. JAS-
CAPI instrument requires “splitting” a segment into tracts and fields instead of drawing them.
Splitting ensures that every piece of the area within the segment is accounted for. Figure 6
shows splitting a segment into two tracts. Splits can take any shape. Figure 7 shows splitting out
an irregular shaped tract from the segment.

12
Figure 6: Splitting Process
:
To split this segment into two tracts, select
the Split Button tool, highlighted in yellow.
Start a new line by tapping once outside of
the red boundary and an orange-yellow
circle (vertex) will appear.
Lift finger, and tap outside the bottom edge
of the red boundary and another vertex will
appear with an orange-yellow line
connecting the two vertices.
Tap quickly twice outside of the red
boundary near the last vertex. A blue line
will now appear within the red boundary
and all vertices and lines outside the
boundary will disappear. This segment is
now split into two tracts.

13
Figure 7: Splitting Process – Irregular Shaped Tract
After selecting the Split Button tool, create
a new tract boundary line by tapping once
outside of the red boundary and an orange-
yellow vertex will appear.
Lift finger, and tap. Another vertex along
the tract boundary will appear with a line
connecting the two vertices. Repeat this
process of laying vertices to outline the
tract. Finally, lay a vertex outside of the
red segment boundary.
Tap quickly twice and the tract boundary is
completed. After tapping twice a blue line
will appear within the red boundary and all
vertices and lines outside the segment will
disappear. This irregular shaped tract has
now been split out from the segment.

14
The instrument’s screen is composed of three sections: (1) The informational bar, located at the
top of the screen, identifies the segment displayed; (2) The left side displays the aerial imagery
and various tools available; and (3) the right side displays the CAPI electronic questionnaire.
These sections will be described in greater detail below.
Figure 8: JAS-CAPI on iPad
The top of the screen (Figure 9) shows the State, County and Segment number. The items
labeled “stored locally” and “saved to server” will be marked green when the collected data has
been saved, either to the iPad or to the iPad and web server.
Figure 9: Informational Bar
The “Close” option exits the segment and returns the user to the main screen with the segment
still being checked out by the field enumerator on the server. “Close & Return” exits the
segment, returns to the main screen and “releases” the segment from the field enumerator,
allowing a field supervisor to review the work or another field enumerator to check out and
complete the segment if needed. Visualize this as a trip to a local library.

15
One can “check out” a book to read and is therefore the only person who can read that copy of
the book. After reading, the reader closes the book until the next reading time. Only when the
person “closes” the book and “returns” the book to the library, can another person check out the
book to read. This feature prevents a different field enumerator from mistakenly downloading
and working on the same segment.
On the left hand side of the imagery screen, below the zoom level option is a “+” sign. Clicking
on the “+” opens a drop down window. This allows the user to select the view or layer (NAIP,
CDL, or None) shown with the segment. None is equivalent to “no layer” which displays only
the segment’s border and any drawn tracts and fields. NAIP stands for the National Agricultural
Imagery Program, which acquires aerial imagery during the agricultural growing seasons in the
continental U.S. Typically, this digital ortho-photography is available to governmental agencies
and the public within two to four months after acquisition. The default for CAPI-JAS is NAIP,
(Figure 10). An enumerator can also view the last two years of the CDL to assist in enumeration.
Figure 10: Available Layers in JAS-CAPI
None - Screen is white. The blue lines and the
red segment line along with tract and field
labels are displayed. (Not pictured.)
NAIP Imagery - is the default showing the
NAIP aerial photography.
CDL 2010 - shows the 2010 Cropland Data
Layer.
CDL 2011 - shows the 2011 Cropland Data
Layer.
NAIP Imagery
CDL – Cropland Data Layer (2010)

16
On the right side of the screen is a vertical toolbar. Tapping the << button will display the
various tools’ definitions, Figure 11.
Figure 11: Toolbar and Explanation
Focusing on the uppermost left side of the imagery screen, there are
transparent buttons (32”, 16”, 8”, 4”, and 2”), where ”” refers to inches per
mile, Figure 12. These appear when the instrument’s screen is in imagery
mode or dual (imagery/form) mode. These buttons control the zoom level of
the imagery displayed. The number denotes the number of inches per mile.
The 8-inch zoom level is equivalent to the zoom level on the current JAS
aerial photos. Two-inch zoom is the default.
Figure 12
Freezes the screen. Used when the respondent wants to
touch the screen.
Having an internet connection, this feature downloads the
imagery to be stored in cache on the iPad.
Shows the segment displayed in the center of the map area.
Displays what has been selected on the list or map.
Select all tracts/fields in the segment.
Clear all selections.
Allows you to select the different areas.
Used to divide a tract or field.
Merges two adjacent areas together as long as they have
the same tract, field and use description.
Removes the last split or the last merge.
Removes all changes made since this session for this
particular segment.
Reverses the last undo action.
Reverses all of the last actions since start of the current
session.

17
On the right side of the instrument’s screen, the enumerator can label the tracts and fields,
Figures 13-15. In the JAS’s protocol, tracts are labeled with capital letters and fields are labeled
with numbers. The “Use” column is an area where the field enumerator can write a description
of the field. The “Area (ac)” column displays the GIS calculated acres in the area that was
drawn off. The “Form” column displays a button that brings up a streamlined, dynamic Section
D, Figure 15. Section D was transformed from a complex two pages of multiple columns and
rows into a mere series of drop downs. Three questions were added to determine how many
fields’ boundaries extended beyond the segment boundary and to determine if the respondent
needed to view the GIS calculated acreage to assist in determining field acreage.
Figures 13-15: JAS-CAPI on an iPad
Figure 14: Labeling Tracts and Fields Figure 15: Section D

18
5.0 TRAINING – PENNSYLVANIA AND INDIANA
On August 17, 2012, the introduction and training of field staff on the JAS-CAPI instrument
occurred at NASS’s Northeast Regional Office (NERO) located in Harrisburg, PA. Attendees
included nine field enumerators, three NERO staff, two staff from NASS headquarters, and two
trainers from the JAS-CAPI training team.
There were two primary goals for the training: (1) provide an overview of the instrument to the
field enumerators and (2) learn from the field enumerators what needed to be improved upon
before data collection.
The JAS-CAPI instrument, however, was still evolving during the preparation of training
materials (presentations, manual and practice exercises) and even during the actual training.
This was a challenge for both the trainers and the audience. Overall, the training was successful,
but could have been improved with additional time for applied practice and study time. The
team members learned areas to improve the JAS-CAPI instrument and that the enumerators’ skill
level of using the iPad varied from beginner to highly proficient. To keep field enumerators
active with the JAS-CAPI instrument, home study practice exercises were developed and sent to
the field enumerators.
Two weeks after the Pennsylvania training, the instrument was modified and additional
functionality added. Based on this initial training experience, the training in Indiana was
expanded to a day and a half. Seven field enumerators, two staff from the Indiana Field Office,
two staff from the training team, one staff from the Michigan Field Office and two staff from
ISU-CSSM participated in the training.
The JAS-CAPI manual and practice exercises were developed and provided to each field
enumerator. Training consisted of lecture (PowerPoint slides), chalkboard for the instructors to
write notes on, hands-on practice exercises, role-playing exercises, and question and answer
sessions. In the later afternoon, the field enumerators were provided practice exercises to
complete. These exercises were evaluated the next morning by training staff. This allowed
training staff to identify concepts that needed to be re-emphasized/clarified on the second day.
Overall, the training went smoothly. Indiana field enumerators were the first to adopt CAPI and
had the advantage of using iPads for the longest period of time. This additional experience was
seen in their overall proficiency with the iPads. However, one of the biggest challenges was
explaining the grid segment data collection method, which involves drawing out partial fields
and collecting information from the farmer on the part of the field inside the grid segment. This
grid boundary training is not necessary in current JAS practice, as segment boundaries are
modified in the segment creation to ensure no partial fields. Another challenge was when a
segment boundary fell just beyond a road. This led to several smaller fields that had to be drawn
off.

19
6.0 REMOTE TRAINING – WASHINGTON
This section provides detailed information on the use of remote training of the field enumerators
for the study. Due to limited training funds, only two supervisory field enumerators were
selected in the state of Washington. One supervisor had used an iPad for a few days. The other
supervisor had limited computer experience with no experience using the iPad. To minimize
expenses, remote/on-line training was conducted. The Indiana Field Office developed a website
to house all training materials (manuals, practice exercises and on-line training videos) for a field
enumerator to learn the iPad and the JAS-CAPI instrument. Videos were also created that
provided step by step instructions on how to complete each of the practice exercises, (Figure 16).
Figure 16: Training Website’s Home Page
Training Home Page
20
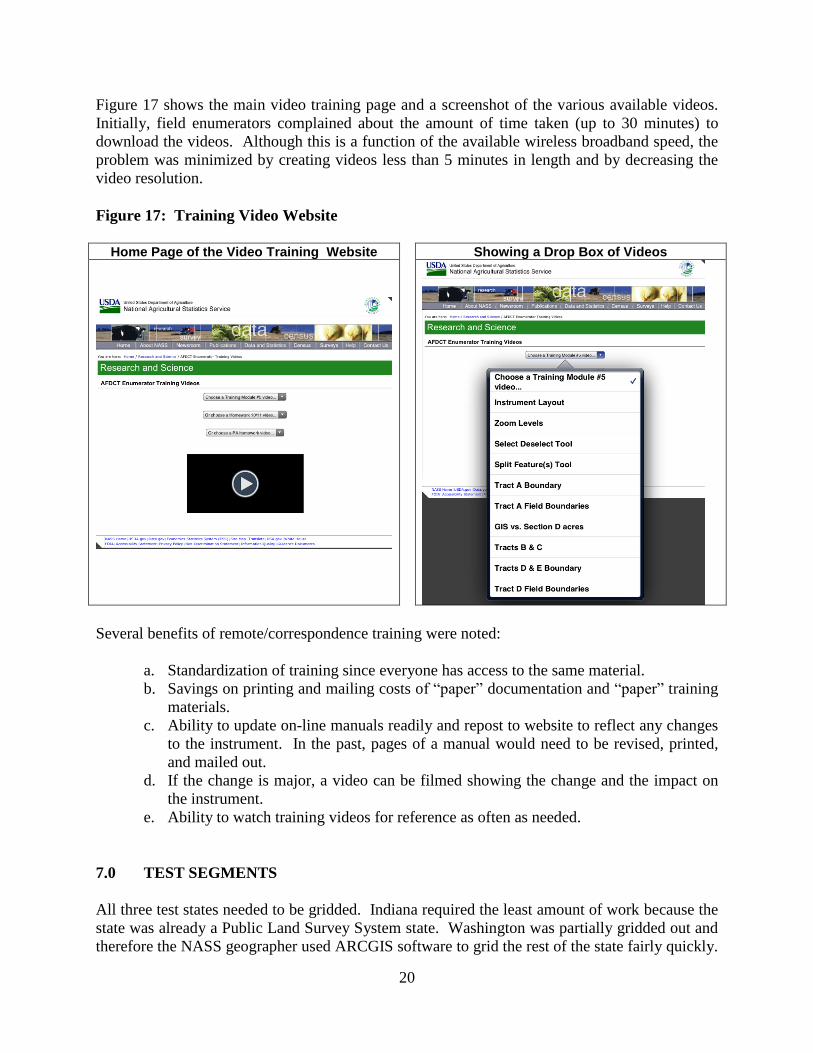
Figure 17 shows the main video training page and a screenshot of the various available videos.
Initially, field enumerators complained about the amount of time taken (up to 30 minutes) to
download the videos. Although this is a function of the available wireless broadband speed, the
problem was minimized by creating videos less than 5 minutes in length and by decreasing the
video resolution.
Figure 17: Training Video Website
Home Page of the Video Training Website Showing a Drop Box of Videos
Several benefits of remote/correspondence training were noted:
a. Standardization of training since everyone has access to the same material.
b. Savings on printing and mailing costs of “paper” documentation and “paper” training
materials.
c. Ability to update on-line manuals readily and repost to website to reflect any changes
to the instrument. In the past, pages of a manual would need to be revised, printed,
and mailed out.
d. If the change is major, a video can be filmed showing the change and the impact on
the instrument.
e. Ability to watch training videos for reference as often as needed.
7.0 TEST SEGMENTS
All three test states needed to be gridded. Indiana required the least amount of work because the
state was already a Public Land Survey System state. Washington was partially gridded out and
therefore the NASS geographer used ARCGIS software to grid the rest of the state fairly quickly.

21
Pennsylvania was not a PLSS state and had to be gridded out from scratch, which took a few
days.
Afterwards, sixty grid segments were selected for this test: 30 for Indiana, 20 for Pennsylvania,
and 10 for Washington. The segments’ locations were based on field offices’ input in
representing that state’s agriculture. Also, the field offices reviewed the aerial imagery and rated
each segment as “easy” to “challenging” in enumerating. “Challenging” was defined as a
segment having irregular shaped fields, having over fifty fields and/or several operators. The
field enumerators were instructed to start with the easier segments and then move on to the more
challenging ones. Since the test segments were not randomly selected, extrapolations or
inferences made from this study may not truly reflect the findings of a full-scale implementation.
8.0 FIELD DATA COLLECTION
Field data collection occurred from late December, 2012, through February of 2013. Overall, 36
segments were attempted, and 355 agricultural cropland fields were completed. For testing
purposes, enumerators were not required to enumerate the entire segment but to focus on the
agricultural tracts on as many segments as possible. A survey letter was developed to provide to
the agricultural operator at the beginning, to explain the purpose of the study, and to obtain
support, (Appendix C).
A total of 18 field enumerators were either trained or self-trained on the JAS-CAPI instrument.
Changes of workload and assignments (due to a two month delay of the final instrument),
personal matters and finally due to difficulty in learning the instrument, eight field enumerators
failed to complete training and were unable to conduct enumeration.
In Indiana and Pennsylvania, four field enumerators completed training and role playing, and
conducted interviews.
In Washington, one supervisory field enumerator completed training on how to use an iPad and
on the JAS-CAPI instrument.
Table 1 shows the number of segments, tracts, and fields completed by state and field
enumerators. Indiana completed the most number of segments, twenty-six. This was anticipated
since Indiana field enumerators had been using iPads for a year longer than the other states.
Despite being primarily self-trained via the training manual and the instructional videos,
Enumerator B (Table 1) was able to complete thirteen segments.

22
Table 1: Number of Attempted Segments, Tracts and Fields by State & Field Enumerator
1/ Names were removed for confidentiality purposes.
2/ Did not complete the field use portion of data collection.
3/ Based on the number of evaluation forms completed for each agricultural tract attempted.
Table 2 shows the number of completed fields that were fully and partially contained within the
grid segment’s boundary. Indiana had 18.2% of its completed fields with acreage partially
contained outside the segment. Pennsylvania had 36.2% and Washington had 15.4%.
Table 2: Number and Percentage of Partially Contained Fields1/ by State
Partially Contained Fully Contained Total
No. % No. % No. %
Indiana 63 18.2 284 81.8 347 100.0
Pennsylvania 47 36.2 83 63.8 130 100.0
Washington 2 15.4 11 84.6 13 100.0
All Three States 112 22.9 378 77.1 490 100.0
1/ Excludes Non-Ag Tracts and incomplete fields.
State
Field
Enumerator 1/
Attempted
Segments
Non-Ag
Tracts
Ag
Tracts3/
Cropland
Fields
Waste,
Woods
Fields
Permanent
Pasture
Fields
Farmstead
Fields
IN
Enumerator A 4 5 30 83 5 9 7
Enumerator B 13 61 51 103 32 5 5
Enumerator C 5 47 21 56 14 1 5
Enumerator D 4 21 10 17 3 0 2
Total 26 134 112 259 54 15 19
PA
Enumerator E 2 4 3 2 1 1 2
Enumerator F2/ 2 0 25 N/A N/A N/A N/A
Enumerator G 2 27 10 33 7 14 5
Enumerator H 2 0 13 52 7 3 3
Total 8 31 51 87 15 18 10
WA Enumerator I 2 6 5 9 2 0 2
Total 2 6 5 9 2 0 2
Total 36 171 168 355 71 33 31

23
Table 3 shows the number of completed fields fully and partially contained within the grid
segment’s boundary by State and field use type. Cropland fields had the most number of partial
fields followed by waste/woods. Indiana had 347 completed fields. Sixty-three fields (18%)
were partial fields. In Pennsylvania, 47 (36%) of the 130 completed fields were partial fields.
Table 3: Number of Completed Fields1/ Fully or Partially Contained Within the Grid
Segments’ Boundaries by State and Field Use Type
State
Indiana Pennsylvania Washington Field in Relation to Grid
Segment Boundary
Field in Relation to Grid
Segment Boundary Field in Relation to Grid
Segment Boundary Inside Partial Inside Partial Inside Partial
No. % No. % No. % No. % No. % No. %
Field Use
Cropland 210 73.9 49 77.8 51 61.4 36 76.6 7 63.6 2 100.0
Waste/Woods 43 15.1 11 17.5 10 12.0 5 10.6 2 18.2 0 0.0
Permanent
Pasture 14 4.9 1 1.6 12 14.5 6 12.8 0 0.0 0 0.0
Farmstead 17 6.0 2 3.2 10 12.0 0 0.0 2 18.2 0 0.0
Total2/ 284 99.9 63 100.1 83 99.9 47 100.0 11 100.0 2 100.0
1/ Excludes Non-Ag Tracts. 2/ Total percent may not equal 100% due to rounding.
Tables 4 and 5 show whether the respondent knew the acreage of the fields that were fully and
partially contained within the grid segment or if the respondent asked for the GIS-calculated
acreage to help them decide how much acreage was in the field. As expected, respondents relied
on the GIS calculated more often for partial fields (55/112 = 49.1%) than for fully contained
fields (78/378 = 20.6%).

24
Table 4: Acreage Response on Completed Fields1/ FULLY Contained Within the Grid
Segment
Acreage Response Full Field Containment
Respondent
Knew Acreage
Needed GIS Assistance
Didn’t Know Acreage
Refused or No Response
Total2/
No. % No. % No. % No. % No. %
Field Use
Cropland 195 72.8 42 15.7 15 5.6 16 6.0 268 100.1
Waste/Woods 18 32.7 24 43.6 7 12.7 6 10.9 55 99.9
Permanent
Pasture 18 69.2 3 11.5 4 15.4 1 3.8 26 99.9
Farmstead 15 51.7 9 31.0 2 6.9 3 10.3 29 99.9
Total 246 65.1 78 20.6 28 7.4 26 6.9 378 100.0
1/ Excludes Non-Ag Tracts. 2/ Total percent may not equal 100% due to rounding.
Table 5: Acreage Response on Completed Fields1/ PARTIALLY Contained Within the
Grid Segment.
Acreage Response Partial Field Containment
Respondent Knew
Acreage
Needed GIS Assistance
Didn’t Know Acreage
Refused or No Response
Total2/
No. % No. % No. % No. % No. %
Field Use
Cropland 31 35.6 49 56.3 5 5.7 2 2.3 87 99.9
Waste/ Woods
6 37.5 3 18.8 6 37.5 1 6.3 16 100.1
Permanent Pasture
4 57.1 2 28.6 1 14.3 0 0.0 7 100.0
Farmstead 0 0.0 1 50 1 50 0 0.0 2 100.0
Total 41 36.6 55 49.1 13 11.6 3 2.7 112 100.0
1/ Excludes Non-Ag Tracts and incomplete fields. 2/ Total percent may not equal 100% due to rounding.

25
9.0 ENUMERATOR FEEDBACK & EVALUATION OF THE JAS-CAPI
INSTRUMENT
Field enumerators completed an evaluation form for each of the 168 agricultural tracts
enumerated, (Appendix D). The field enumerators were asked if there were any problems with
the aerial imagery part of the survey instrument (including but not limited to zooming, splitting
fields, and overall functionality). Problems were experienced 15% of the time, Table 6. The
zoom feature, however, was noted most often as being a very helpful feature in viewing smaller,
detailed areas.
Indiana field enumerators commented that grid segment borders did not overlay the imagery
100% correctly. Indiana is a PLSS state that was gridded out in the 1800’s. Many roads
(especially in the rural part of the state) follow the grid lines. Confusion occurred when a road
and a grid segment’s boundary were slightly offset. For example if a grid segment boundary
runs parallel to a road and the boundary falls 20 feet beyond a road, a field enumerator might
have several partial fields. This grid segment rule differs from the current JAS rules which
assume the boundary to be the middle of the road. Upon closer examination, nearly every one of
Indiana’s segments had a small sliver of land on one edge of the segment. To minimize this
issue, field enumerators commented that grid segment boundaries need to be reviewed and
shifted slightly, as in the current JAS segment preparation process.
Table 6: Problems with Aerial Imagery (Zooming, Splitting, Overall Functionality)
Problems with Aerial
Imagery
Number of Tracts Percentage
Yes 13 7.7
Sometimes 13 7.7
None 142 84.5
Total1/ 168 99.9
1/ Total percent may not equal 100% due to rounding.

26
Table 7 shows that approximately 92% of the time field enumerators reported no problems
(navigation, questions, drop downs, etc.) with Section D.
Table 7: Problems with Section D (Navigation, Questions, Dropdowns)
Problems with Section D
Number of Tracts Percentage
Yes 5 3.0
Sometimes 6 3.6
No 154 91.7
No Answer 3 1.8
Total1/ 168 100.1
1/ Total percent may not equal 100% due to rounding.
Enumerators were also asked several questions about iPad performance outside the JAS-CAPI
instrument that may impact the effectiveness of the instrument. Connectivity problems were
experienced four percent of the time, (Table 8). Connectivity is essential to download the initial
imagery and the questionnaire. Afterwards, the field enumerator can conduct interviews
regardless of a wireless broadband signal. Additional instruction on downloading the segments
of interest ahead of time to the iPad could reduce this problem.
Table 8: Connectivity - 3G/4G Problems
Connectivity – 3G/4G
Problems
Number of Tracts Percent
Yes 2 1.2
Sometimes 5 3.0
No 158 94.0
No Answer 3 1.8
Total 168 100.0

27
Despite equipping the iPads with glare screen shields, 17% of the time screen visibility was a
problem, (Table 9). Operationally, 38,000 agricultural tracts are enumerated annually.
Extrapolating, this would equate to 6,460 agricultural tracts that might have screen visibility
issues. This issue may actually be significantly understated since the study was conducted
during the winter when most interviews are conducted indoors, (Table 12). Typically, the JAS is
conducted outdoors in early June. Thus, future research is needed to improve the iPad’s screen
visibility in direct sunlight.
Some field enumerators suggested having a device with a larger screen and others suggested
being provided a paper map on standard stock paper to accompany the instrument. These
suggestions may diminish once the field enumerators become more proficient with the
instrument and in utilizing the instrument’s zooming feature. However, this does show that some
of the interviewers were not completely comfortable using just the iPad for data collection.
Table 9: Screen Visibility Problems (glare, sunlight, etc.)
Screen Visibility
Problems
Number of Tracts Percent of Total
Frequency
Yes 11 6.5
Sometimes 17 10.1
No 137 81.5
No Answer 3 1.8
Total1/ 168 99.9
1/ Total percent may not equal 100% due to rounding.

28
Insufficient battery life of equipment (laptops, tablets, pads, netbooks, etc.) has been a major
concern since the original implementation of CAPI data collection. Table 10, however, shows
that the iPad’s battery life appears to be sufficient for a full day’s work. Instructions to
emphasize the need to charge the iPad every night should be included in interviewer training.
For those field enumerators where this solution may still not suffice, field enumerators should be
encouraged to use their supplied car charger for the iPad.
Table 10: Battery Life Problems Encountered
Battery Life Problems
Encountered
Number of Tracts Percent
Yes 3 1.8
Sometimes 1 0.6
No 161 95.8
No Answer 3 1.8
Total 168 100.0
This study was conducted over the winter months while the JAS is conducted in early June. For
this study, 66% of the interviews were conducted in the afternoon, Table 11. Also, Table 12
shows that at least 26% of the interviews were conducted outside. Based on past history of the
JAS, a greater proportion of interviews are conducted outdoors in June due to improved weather
conditions, the number of hours of daylight hours being greater, and the agricultural operator
being more likely to be working outside planting/harvesting.
Table 11: Time of Day the Interview was Conducted
Time of Day
Number of Tracts Percent
Afternoon 110 65.5
Morning 55 32.7
Evening 2 1.2
No Answer 1 0.6
Total 168 100.0
29
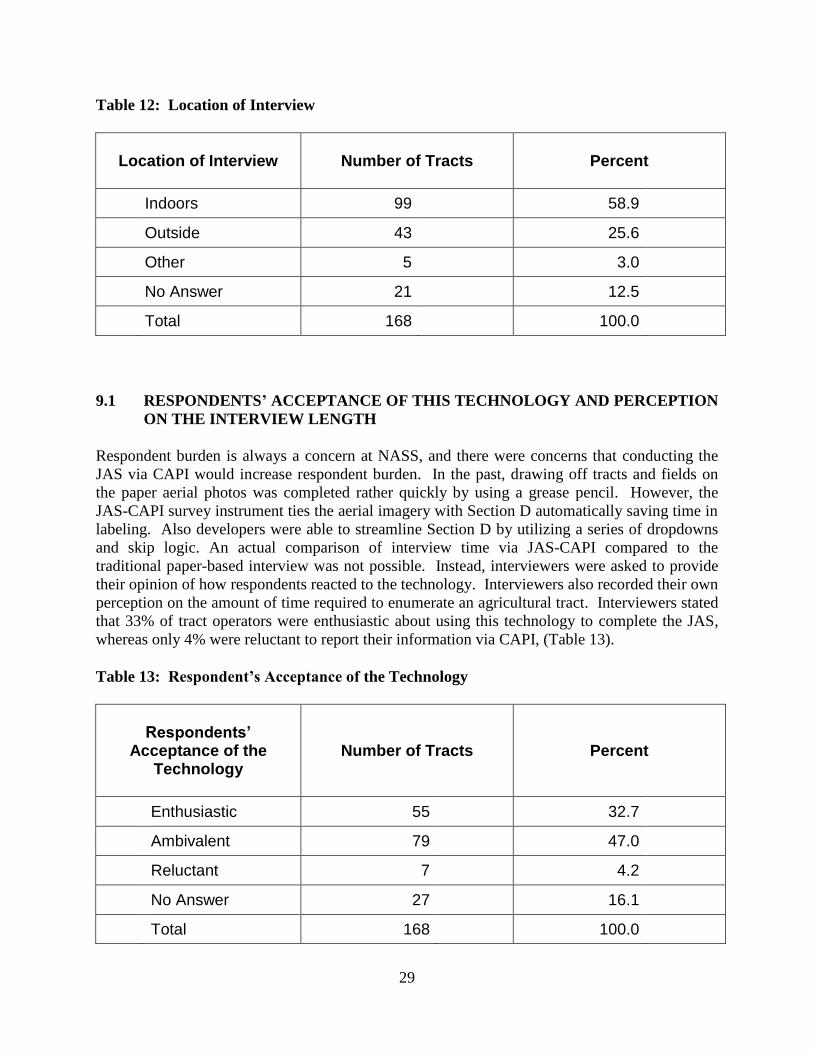
Table 12: Location of Interview
Location of Interview
Number of Tracts Percent
Indoors 99 58.9
Outside 43 25.6
Other 5 3.0
No Answer 21 12.5
Total 168 100.0
9.1 RESPONDENTS’ ACCEPTANCE OF THIS TECHNOLOGY AND PERCEPTION
ON THE INTERVIEW LENGTH
Respondent burden is always a concern at NASS, and there were concerns that conducting the
JAS via CAPI would increase respondent burden. In the past, drawing off tracts and fields on
the paper aerial photos was completed rather quickly by using a grease pencil. However, the
JAS-CAPI survey instrument ties the aerial imagery with Section D automatically saving time in
labeling. Also developers were able to streamline Section D by utilizing a series of dropdowns
and skip logic. An actual comparison of interview time via JAS-CAPI compared to the
traditional paper-based interview was not possible. Instead, interviewers were asked to provide
their opinion of how respondents reacted to the technology. Interviewers also recorded their own
perception on the amount of time required to enumerate an agricultural tract. Interviewers stated
that 33% of tract operators were enthusiastic about using this technology to complete the JAS,
whereas only 4% were reluctant to report their information via CAPI, (Table 13).
Table 13: Respondent’s Acceptance of the Technology
Respondents’
Acceptance of the Technology
Number of Tracts Percent
Enthusiastic 55 32.7
Ambivalent 79 47.0
Reluctant 7 4.2
No Answer 27 16.1
Total 168 100.0
30
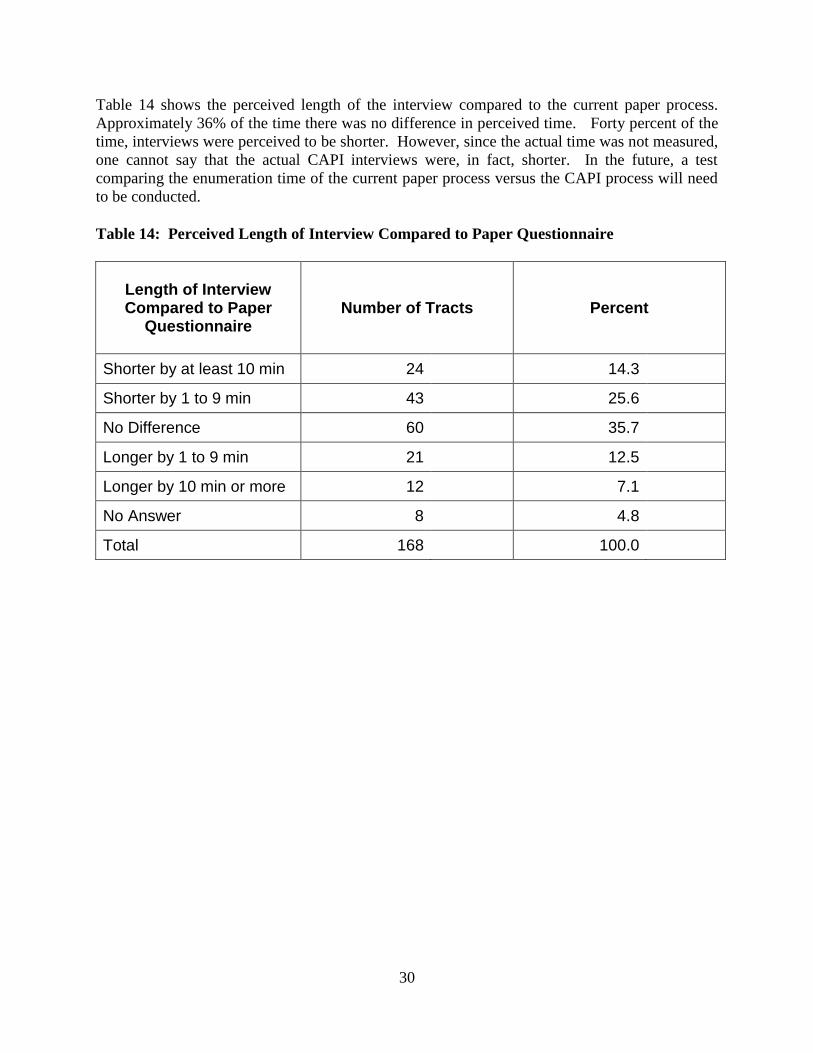
Table 14 shows the perceived length of the interview compared to the current paper process.
Approximately 36% of the time there was no difference in perceived time. Forty percent of the
time, interviews were perceived to be shorter. However, since the actual time was not measured,
one cannot say that the actual CAPI interviews were, in fact, shorter. In the future, a test
comparing the enumeration time of the current paper process versus the CAPI process will need
to be conducted.
Table 14: Perceived Length of Interview Compared to Paper Questionnaire
Length of Interview Compared to Paper
Questionnaire
Number of Tracts Percent
Shorter by at least 10 min 24 14.3
Shorter by 1 to 9 min 43 25.6
No Difference 60 35.7
Longer by 1 to 9 min 21 12.5
Longer by 10 min or more 12 7.1
No Answer 8 4.8
Total 168 100.0

31
9.2 OVERALL FEEDBACK
Pennsylvania’s experience with JAS-CAPI was mixed. This was primarily due to the field
enumerators being introduced to the iPads a few months before being shown the JAS-CAPI
instrument. Also, the initial instrument shown was a prototype. A majority of the feedback was
on the difficulty of merging fields and how to handle an operator if the operator only has five
minutes. Field enumerators noted that the fields can be drawn off relatively quickly but wanted
an improved way to readily note crops grown. Field enumerators also stated that fields in
Pennsylvania are frequently irregularly shaped and these were challenging to draw off on the
iPad. However, the field enumerators found that the JAS-CAPI instrument can handle 100+
fields and tracts with no issues. Under the current JAS paper process, ten additional
supplemental pages of Section D would be needed to handle 100 fields.
Indiana’s experience with JAS-CAPI was mainly positive. This was primarily due to the field
enumerators having used iPads for over a year and that the training lasted two days. Handling of
harsh weather conditions (primarily rain) were noted and will need to be addressed in future iPad
training.
In Washington, the supervisory field enumerator and staff from the Northwest Regional Office
thought that as familiarity with the instrument increases, conducting the JAS survey via CAPI
has the possibility of being as efficient as using the aerial photos and paper questionnaires.
10.0 FUTURE DIRECTIONS
The study shows that JAS enumeration is possible in a CAPI environment. However, additional
research is required in studying the effect and practicality of changing to grid segments. Phases
II and III are underway. Phase II focuses on evaluating whether there are any statistical
differences in the acreages between drawing the tracts and fields on the current aerial photos to
those drawn using the JAS-CAPI on an iPad. Phase III is a study similar to Phase I only in the
states of North Carolina, Pennsylvania and South Dakota.
To incorporate the rest of the questionnaire and screening form into JAS-CAPI, the developers
suggest three possible paths:
1.) Incorporate the rest of the JAS questionnaire into the current instrument with assistance from
ISU-CSSM and transfer this JAS application to NASS’s servers and systems.
2.) Modify the current instrument as a plug-in module that handles the aerial photos and Section
D, and build the rest of the JAS questionnaire using NASS’s current web survey system,
Electronic Data Reporting System (EDR). The module would open up in one browser and the
rest of the questionnaire would open up in a separate browser. The data collected from both the
module and the EDR questionnaire would then be merged into NASS’s data editing and analyses
systems. This would still require the module to be transported over to NASS’s servers and
systems. However, this provides the flexibility to incorporate a possible future developed
application/technology since it is modular based.

32
3.) Leverage the programming, functionality, and lessons learned from this study into a NASS-
developed JAS-CAPI instrument. This could involve building the instrument from the ground up
by leveraging and enhancing NASS’s current EDR system and/or building a native application.
Independent of the path selected from above, the following enhancements would improve the
JAS-CAPI instrument and associated processes.
1. JAS-CAPI Instrument
a. Add a roads layer to the aerial imagery to assist the field enumerators in locating the
grid segment and in helping the respondents orient themselves. (This feature was
incorporated in Phase III.)
b. Show the geo-location of the field enumerator in relation to the segment on the
displayed aerial imagery. (This feature was incorporated in Phase III.)
c. Add additional security requirements to meet all USDA-NASS policies.
2. Data Processing
a. Automate the process of transferring the collected data into the JAS’s editing
systems.
3. iPad
a. Reiterate to field enumerators the importance of downloading questionnaires at the
start of the day.
b. Reinforce the importance of charging the iPad overnight to field enumerators.
Supply those field enumerators with iPad car chargers on a need only basis.
c. Research and test ways to improve outdoor screen visibility of the iPad.
11.0 RECOMMENDATIONS
1. Incorporate the key features of the current JAS-CAPI survey instrument into the next
version.
a. Draw out and label tracts and fields using a stylus.
b. Zoom in and out of the aerial imagery.
c. Streamline Section D (detailed field level questions of the questionnaire) to a series of
drop down menus and skip patterns.
d. Edit/data consistency checks to improve data quality and integrity.
e. Toggle between full screen mode showing the aerial imagery to split screen mode
showing both aerial imagery and Section D.
f. Aerial imagery and Section D update each other accordingly.
g. Undo and redo options.
h. Ability to fix any drawn out tract’s and field’s boundaries as needed.

33
i. One touch ability to go back to the segment if the interviewer loses one location on
the screen.
j. Ability to display various layers (like Cropland Data Layer) where practical.
k. Ability to display all or particular tracts and/or fields of interest.
l. Ability to freeze the aerial imagery displayed on the screen so that a farmer can point
and touch the screen, without having any tools activated.
m. Show the geospatial information systems calculated area for each field as a guide for
the interviewer.
n. Display grid segment’s ID, state and county.
2. Evaluate the amount of time required to conduct a JAS interview via the iPad compared
to the current aerial photo and paper questionnaire approach.
3. Continue to research the use of grid segment frame process as a potential replacement for
the current JAS area frame process.
4. Research ways to improve the iPad’s screen visibility in direct sunlight.
5. Research the feasibility and practicality of full-scale implementation of CAPI for the
JAS.
6. Continue to research the use of remote/correspondence training in the training of field
enumerators.
12.0 REFERENCES
Boryan C., Yang Z., Mueller R., Craig M., (2011) “Monitoring US Agriculture: the U.S.
Department of Agriculture, National Agricultural Statistics Service Cropland Data Layer
Program”, Geocarto International, 26, (5): 341-358.
Boryan C., Yang Z., (2012) “A New Land Cover Classification Based Stratification Method for
Area Sampling Frame Construction,” Proc. in First Intl. Conf. on Agro-Geoinformatics,
Shanghai, China.
Gerling M., Harris J. (2010) “Technology Advancing Data Collection: Thin Client Computer
Assisted Personal Interviewing in the National Agricultural Statistics Service’s 2010 Field Data
Collection Program”, Research and Development Report RDD-10-06, United States
Department of Agriculture, National Agricultural Statistics Service.
Gerling M. (2004) “A New Look Into Portable Electronic Devices for Field Data Collection in
the National Agricultural Statistics Service”, (White Paper) United States Department of
Agriculture, National Agricultural Statistics Service.

A-1
APPENDIX A
Indiana’s 2012 JAS Questionnaire
Section D - Crops and Land Use on Tract

A-2
SECTION D – CROPS AND LAND USE ON TRACT
How many acres are inside this blue tract boundary drawn on the photo (map)?. . . . . . . . . . . . . . . . . . . . . .
. .
.
Now I would like to ask about each field inside this blue tract boundary and its use during 2012.
Field Number 01 02 03 04 05
1. Total acres in field
828
. 828
. 828
. 828
. 828
.
2. Crop or land use. [Specify]
3. Occupied farmstead or dwelling 843
.
4. Waste, unoccupied dwellings, buildings and structures, roads, ditches, etc.
841 .
841 .
841 .
841 .
841 .
5. Woodland
NP = Not Pastured
P = Pastured
[Check (√) type]
83_ .
83_ .
83_ .
83_ .
83_ .
NP P NP P NP P NP P NP P
6. Pasture Permanent (not in crop rotation)
842
. 842
. 842
. 842
. 842
.
Cropland (used only for pasture)
856
. 856
. 856
. 856
. 856
.
8. Idle cropland – idle all during 2012 857
. 857
. 857
. 857
. 857
.
9. Two crops planted in this field or two uses of the same crop. Yes No Yes No Yes No Yes No Yes No
[Specify second crop or use.]
Acres 844
. 844
. 844
. 844
. 844
.
10. Acres left to be planted 610
. 610
. 610
. 610
. 610
.
11. Acres irrigated and to be irrigated [If double cropped, include acreage of each crop irrigated.]
620 .
620 .
620 .
620 .
620 .
16.
Winter Wheat (include cover crop)
Planted 540
. 540
. 540
. 540
. 540
.
17. For grain or seed 541
. 541
. 541
. 541
. 541
.
20. Oats
(include cover crop)
Planted and to be planted 533
. 533
. 533
. 533
. 533
.
21. For grain or seed
534
. 534
. 534
. 534
. 534
.
24. Corn[exclude popcorn
and sweet corn]
Planted and to be planted 530
. 530
. 530
. 530
. 530
.
25. For grain or seed 531
. 531
. 531
. 531
. 531
.
29. Other uses of grains planted (Abandoned,silage,
green chop, etc.)
Use
Acres
.
.
.
.
.
30. Hay
[Cut and to be cut
for dry hay.]
Alfalfa and Alfalfa Mixtures 653
. 653
. 653
. 653
. 653
.
31. Grain
656
. 656
. 656
. 656
. 656
.
33. Other Hay
654
. 654
. 654
. 654
. 654
.
34. Soybeans
Planted and to be planted 600
. 600
. 600
. 600
. 600
.
35. Following another harvested crop 602
. 602
. 602
. 602
. 602
.
51. Other crops Acres planted or in use
_ _ _
.
_ _ _
.
_ _ _
.
_ _ _
.
_ _ _
.

A-2
SECTION D – CROPS AND LAND USE ON TRACT
TOTALTRACT
ACRES [Add all field acreages and record in total tract acres (item 840).]
Field Number 06 07 08 09 00
1. Total acres in field
828
. 828
. 828
. 828
. 840
.
2. Crop or land use. [Specify]
4. Waste, unoccupied dwellings, buildings and structures, roads, ditches, etc.
841 .
841 .
841 .
841 .
5. Woodland
NP = Not Pastured
P = Pastured
[Check (√) type]
83_ .
83_ .
83_ .
83_ .
NP P NP P NP P NP P
6. Pasture Permanent (not in crop rotation)
842
. 842
. 842
. 842
.
Cropland (used only for pasture)
856
. 856
. 856
. 856
.
8. Idle cropland – idle all during 2012 857
. 857
. 857
. 857
.
9. Two crops planted in this field or two uses of the same crop. Yes No Yes No Yes No Yes No
[Specify second crop or use.]
Acres 844
. 844
. 844
. 844
.
10. Acres left to be planted 610
. 610
. 610
. 610
.
11. Acres irrigated and to be irrigated [If double cropped, include acreage of each crop irrigated.]
620 .
620 .
620 .
620 .
16.
Winter Wheat
(include cover crop)
Planted 540
. 540
. 540
. 540
.
17. For grain or seed 541
. 541
. 541
. 541
.
20. Oats
(include cover crop)
Planted and to be planted 533
. 533
. 533
. 533
.
21. For grain or seed
534
. 534
. 534
. 534
.
24.
Corn
[exclude popcorn and
sweet corn]
Planted and to be planted 530
. 530
. 530
. 530
.
25. For grain or seed 531
. 531
. 531
. 531
.
29. Other uses of grains planted (Abandoned,silage,
green chop, etc.)
Use
Acres
.
.
.
.
30. Hay
[Cut and to be cut
for dry hay.]
Alfalfa and Alfalfa Mixtures 653
. 653
. 653
. 653
.
31. Grain
656
. 656
. 656
. 656
.
33. Other Hay
654
. 654
. 654
. 654
.
34. Soybeans
Planted and to be planted 600
. 600
. 600
. 600
.
35. Following another harvested crop 602
. 602
. 602
. 602
.
51. Other crops Acres planted or in use
_ _ _
.
_ _ _
.
_ _ _
.
_ _ _
.

B-1
APPENDIX B
JAS-CAPI Technical Requirements and Functional Overview
1.0 OVERVIEW
The JAS-CAPI instrument is an offline-capable web application that allows the capture of field
boundaries as non-overlapping polygons whose areas sum to the area of the JAS segment. The
instrument displays a segment boundary overlaid on NAIP imagery. The instrument is capable
of presenting additional resource material using Web Map Service (WMS) overlays. This
allowed the instrument to display NASS’s Cropland Data Layers from 2010 and 2011 to assist
the enumerator in data collection.
The instrument is based on a CATI (Computer Assisted Telephone Interview) optimized version
of the JAS’s Section D’s questions. Tabular entry of the attributes can be directly associated
with the tracts and fields delineated using the GIS portion of the instrument.
To specify skip rules and validation logic, a survey library was ported to JavaScript from a
desktop application. This library allowed the survey’s flow and edit logic to be specified per-
question dynamically. Specifications for Section D were detailed on two Excel spreadsheets:
one that demonstrated the desired behavior and one that described the validation and skip logic
per-question.
If a wireless broadband signal was available, the instrument was required to transmit a copy of
the data to the web server as the data are entered or edited by an enumerator. Else, the data
remains stored locally on the iPad. The instrument also maintains up-to-date status indicators
telling the user where data have been stored, (iPad, sever or both).
1.1 SELECTING A DEVELOPMENT APPROACH
Early in the process, research and discussion were dedicated to determining whether to
implement JAS-CAPI as a web application or as an iPad-native application. The iPad native
application provides performance and storage management advantages over web applications.
However, the web application approach was chosen because of issues with Apple’s Inc’s
developer licensing and deployment approach through the iTunes Store. The web application
approach was also preferred to be consistent with existing NASS-CAPI instruments.
The specification for the application to operate offline required researching software libraries and
writing tools that allowed spatial operations such as splitting and merging to be done entirely
client-side in JavaScript. Additional work was conducted to ensure the imagery could be cached
on the client and data could be stored locally until the collected data were transmitted to the web
server.

B-2
Initial research included computer-off-the-shelf (COTS) solutions and commercially available
application libraries. Due to the custom nature of the JAS-CAPI application pure COTS
solutions were not available while commercial software libraries to support GIS web applications
were readily available. The following options were considered:
a. Google Maps
b. Bing Maps
c. Leaflet
d. ArcGIS API for JavaScript
e. OpenLayers
Google Maps, Bing Maps, and Leaflet were rejected because of their lack of support for editing
vector features.
While ArcGIS has all of the functionality required, the systems are heavily biased toward server-
side processing and substantial work would have been required to modify the ArcGIS libraries to
work in an offline mode. Furthermore, the extensive editing of the libraries to meet the off-line
requirement would have eliminated most of the benefits provided by ArcGIS.
OpenLayers offered the best solution for on and offline operation. OpenLayers is an open-
source JavaScript mapping library and provides basic web and GIS functionality. OpenLayers
offered more client-side vector functionality and integrated easily with JavaScript Topology
Suite (JSTS), a JavaScript computational geometry library that provided the needed algorithms
for polygon splitting and merging. OpenLayers was also straightforward to modify and extend
due to its open source nature and no external dependencies.
ISU’s CSSM paid Sweco Position AB, (business solutions company located in Sweden), to port
the Polygonizer class from the Java Topology Suite (JTS) to JSTS (A Polygonizer is a tool, used
in user interfaces, for creating or editing polygons by selecting or manipulating other polygons.).
This allowed for portage of the split tool from a desktop spatial application into JAS-CAPI. A
merge tool was written using JSTS. These tools were integrated into a toolbar on an OpenLayers
map in the instrument. The map allowed a loaded segment displayed over NAIP aerial imagery
to be repeatedly split into component tracts and fields. A merge tool was also developed for
updating/fixing mistakes on drawing out tracts and fields.
Several additional tools were added to the OpenLayers map, including zoom tools, selection
tools, and undo/redo buttons. A “Cache Imagery” button was also added to automate the image
caching process so that enumerators would have imagery at the time of their interviews. The
map was integrated with a tabular list of features where users could enter the tract letter, field
number, and “field use” information. Later in development, a “Full Screen” feature was added to
hide the feature list and maximize the display of the map. Additional features were added and
refined based on feedback from field staff.

B-3
1.2 DESIGN OVERVIEW
JAS-CAPI is a web application having server side and client side components.
1.2.1 JAS-CAPI SERVER COMPONENTS
The server-side code consisted of the following components:
a. The main web page
b. User login credential storage and login validation
c. The CacheManifestServlet
d. Survey Data Storage
e. Segment List / Sample
Index.jsp is the main page of the application. Dynamic HTML and Cascading Style Sheets
(CSS) are used to show and hide the various parts of the interface without leaving the main page.
The user login credentials and the survey data are stored in a survey specific SQLite database.
SQLite is a relational database management system contained in a small (~350 KB) C
programming library. SQLite is also a popular choice as an embedded database for local/client
storage in application software such as web browsers. Each new survey year has a separate
SQLite file. The database consists of three tables which hold user authentication information,
all survey data enumerators have entered for each segment, and segment status. The segment
status table keeps track of which segments are checked out and by whom. Access to the
database is only available when the application is online. Data are transferred automatically to
the web server once a connection has been established by the client.
The segment sample is stored in a comma separated values (csv) file format on the server. This
file contains the list of segments eligible for JAS-CAPI data collection along with the associated
location and geometry of the segment. This list is only available to the application when it is
online. Thus, segments can only be checked out or checked in when a user has a network
connection.
The contents of the application cache are specified in a file called the “Cache Manifest” that is
referenced from the main page of the web application. The main page references the application
cache in its html element: <html manifest="cache.manifest">. The web application’s core
functionality is written in JavaScript that is downloaded by the browser and stored in an offline
application cache. The application’s cache also stores HTML files and other static resources,
such as stylesheets and images that are used by the application in offline mode. The
cache.manifest file is dynamically generated by the “CacheManifestServlet” from the
“cache.manifest” section of the WEB-INF/Web.xml file.
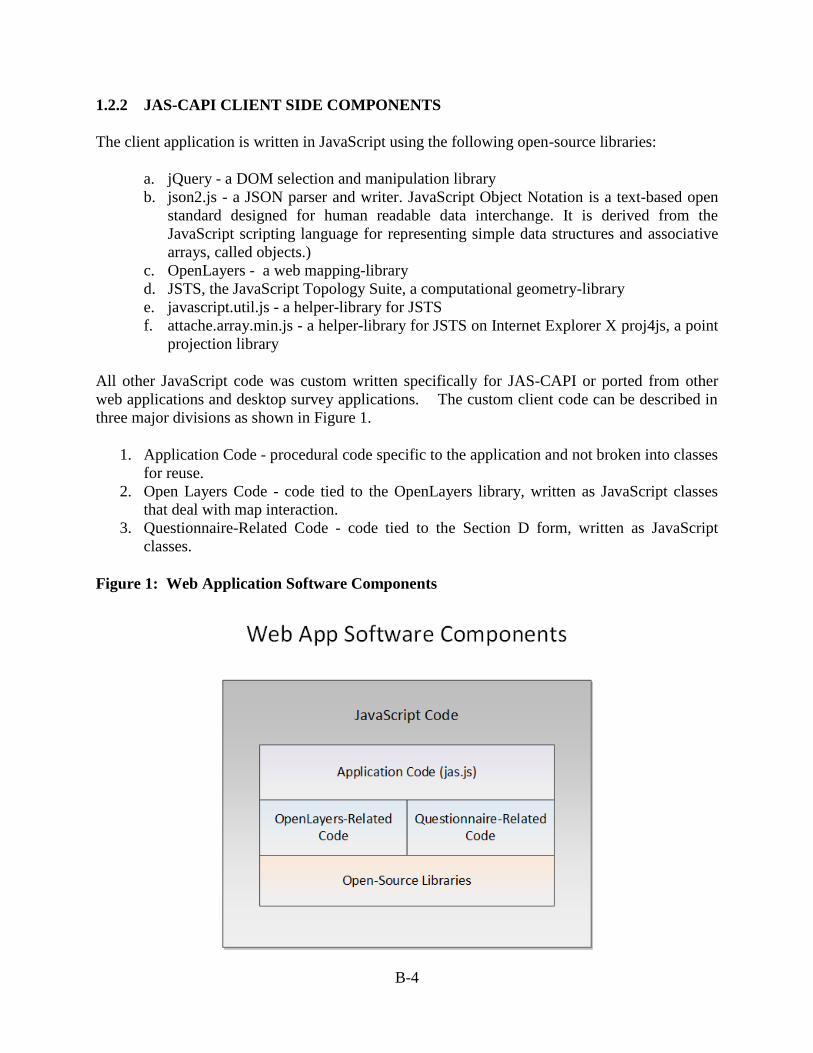
B-4
1.2.2 JAS-CAPI CLIENT SIDE COMPONENTS
The client application is written in JavaScript using the following open-source libraries:
a. jQuery - a DOM selection and manipulation library
b. json2.js - a JSON parser and writer. JavaScript Object Notation is a text-based open
standard designed for human readable data interchange. It is derived from the
JavaScript scripting language for representing simple data structures and associative
arrays, called objects.)
c. OpenLayers - a web mapping-library
d. JSTS, the JavaScript Topology Suite, a computational geometry-library
e. javascript.util.js - a helper-library for JSTS
f. attache.array.min.js - a helper-library for JSTS on Internet Explorer X proj4js, a point
projection library
All other JavaScript code was custom written specifically for JAS-CAPI or ported from other
web applications and desktop survey applications. The custom client code can be described in
three major divisions as shown in Figure 1.
1. Application Code - procedural code specific to the application and not broken into classes
for reuse.
2. Open Layers Code - code tied to the OpenLayers library, written as JavaScript classes
that deal with map interaction.
3. Questionnaire-Related Code - code tied to the Section D form, written as JavaScript
classes.
Figure 1: Web Application Software Components
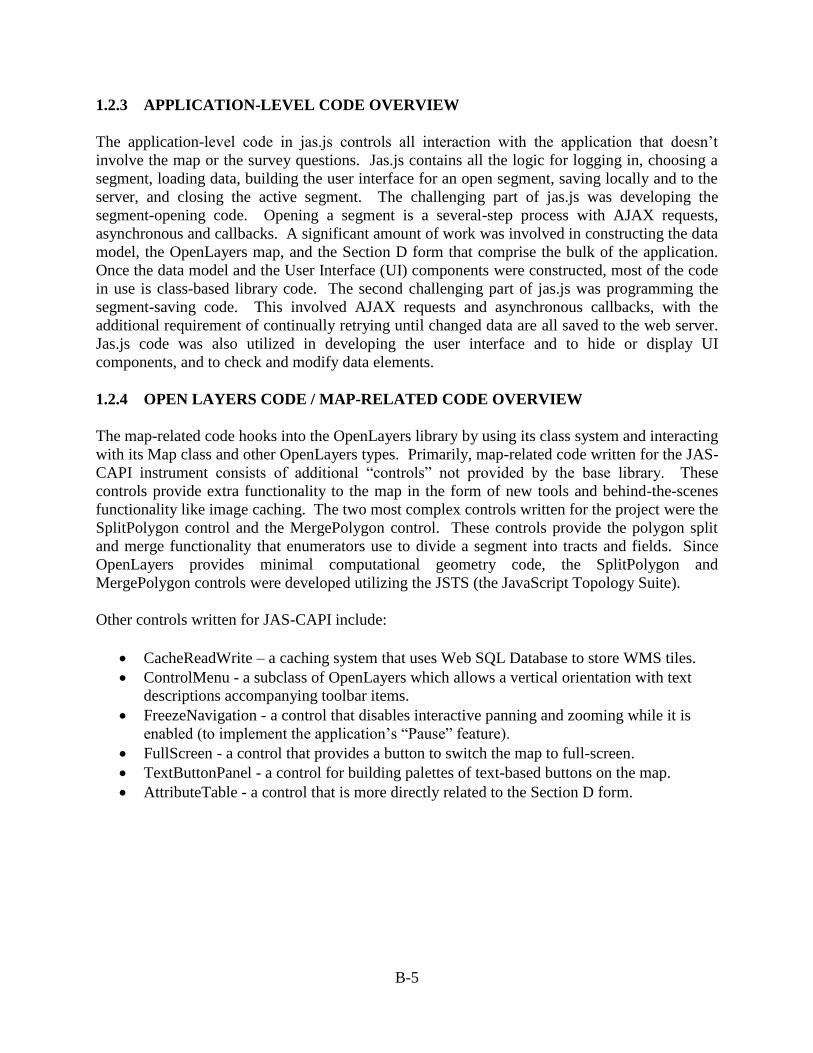
B-5
1.2.3 APPLICATION-LEVEL CODE OVERVIEW
The application-level code in jas.js controls all interaction with the application that doesn’t
involve the map or the survey questions. Jas.js contains all the logic for logging in, choosing a
segment, loading data, building the user interface for an open segment, saving locally and to the
server, and closing the active segment. The challenging part of jas.js was developing the
segment-opening code. Opening a segment is a several-step process with AJAX requests,
asynchronous and callbacks. A significant amount of work was involved in constructing the data
model, the OpenLayers map, and the Section D form that comprise the bulk of the application.
Once the data model and the User Interface (UI) components were constructed, most of the code
in use is class-based library code. The second challenging part of jas.js was programming the
segment-saving code. This involved AJAX requests and asynchronous callbacks, with the
additional requirement of continually retrying until changed data are all saved to the web server.
Jas.js code was also utilized in developing the user interface and to hide or display UI
components, and to check and modify data elements.
1.2.4 OPEN LAYERS CODE / MAP-RELATED CODE OVERVIEW
The map-related code hooks into the OpenLayers library by using its class system and interacting
with its Map class and other OpenLayers types. Primarily, map-related code written for the JAS-
CAPI instrument consists of additional “controls” not provided by the base library. These
controls provide extra functionality to the map in the form of new tools and behind-the-scenes
functionality like image caching. The two most complex controls written for the project were the
SplitPolygon control and the MergePolygon control. These controls provide the polygon split
and merge functionality that enumerators use to divide a segment into tracts and fields. Since
OpenLayers provides minimal computational geometry code, the SplitPolygon and
MergePolygon controls were developed utilizing the JSTS (the JavaScript Topology Suite).
Other controls written for JAS-CAPI include:
CacheReadWrite – a caching system that uses Web SQL Database to store WMS tiles.
ControlMenu - a subclass of OpenLayers which allows a vertical orientation with text
descriptions accompanying toolbar items.
FreezeNavigation - a control that disables interactive panning and zooming while it is
enabled (to implement the application’s “Pause” feature).
FullScreen - a control that provides a button to switch the map to full-screen.
TextButtonPanel - a control for building palettes of text-based buttons on the map.
AttributeTable - a control that is more directly related to the Section D form.

B-6
1.2.5 QUESTIONNAIRE-RELATED (SECTION D) CODE OVERVIEW
The questionnaire-related code is written as JavaScript classes based on the OpenLayers class
system and has few dependencies on OpenLayers. The only class in this collection of code that
makes direct use of OpenLayers types is the AttributeTable. This table is a custom OpenLayers
control that provides an interactive list of the features on the map. All other classes in this group
are essentially independent of OpenLayers and have to do with the questions, their interactions,
and the user-interface. Most questions in Section D are subclasses of a generic question class
ported from desktop survey software. Custom validation logic is added for the specific question
type. This validation logic contains the JAS business logic about crops, recorded acreages, and
their interdependencies. If this survey instrument was to be generalized for use in other surveys,
this business logic would have to be replaced with the business logic appropriate to each survey.
1.2.6 CLIENT-SERVER INTERACTIONS
Once the JAS-CAPI web application is loaded from the server and cached in the application’s
cache, all communication with the server occurs via AJAX calls.
AJAX is used for:
Logging in
Loading the States, Counties, and Segments lists in the Segment Chooser
Loading the data for a segment
Marking the segment as checked out
Storing the segment data
Checking in the segment
AJAX calls for the state, county, and segment lists return XML; the other AJAX calls return
JSON. These interactions are illustrated in Figure 2.

B-7
Figure 2: Client and Server Side Architecture
1.3. CHALLENGES, UNFORESEEN PROBLEMS AND SOLUTIONS
1. Substantial time was spent handling issues with HTML5 local cache size
restrictions. The Safari browser, iPad’s web browser, normally allows an
application domain to cache no more than 5 MB of data. This was not enough
space to cache images for offline use. Also, images are stored in the Web SQL
database, which Safari has a 50MB limit. Hence, a compression algorithm was
applied, allowing several segments to be stored for off-line enumeration.
2. iOS limits the amount of time a JavaScript application can use to process a
request. If an application takes longer than the iOS limit, Safari will assume the
application is hung and simply terminates the associated thread. If a thread is
terminated then it does not complete its task and the data are left in an unknown
and often broken state. The application continues to work, but data are typically
corrupt. To resolve this issue, the application had to be broken down into small
processing units that are guaranteed to return before the timeout expires. Given

B-8
the process-intensive nature of the instrument’s GIS processing this required
extensive reorganizing of code to meet this requirement.
3. Caching of image tiles was initially unreliable due to a design decision in
OpenLayers that introduced rounding error into the calculation of tile positions.
Cached tiles could not be reliably retrieved because, after zooming and panning,
the calculated URL for a tile would differ slightly from the URL of the original
request, which also served as the lookup key for the tile in the cache. As a
temporary solution until the OpenLayers code could be redesigned, a limit
was applied to the precision of calculated tile boundaries to guarantee that
calculated URLs would match.
4. Application loading time became an issue as new features and functionality were
added. This was resolved by compressing the application code sent after the
associated HTML5 request.
5. Significant effort was spent dealing with touch screen usability issues: (1) Ability
to lay down points with accuracy and (2) Where best to “double click” to finish
the split. These issues were resolved through training and the addition of controls
that did not require a double click.

C-1
APPENDIX C
Pre-Survey Letter Provided to Agricultural Operator at the Time of Interview
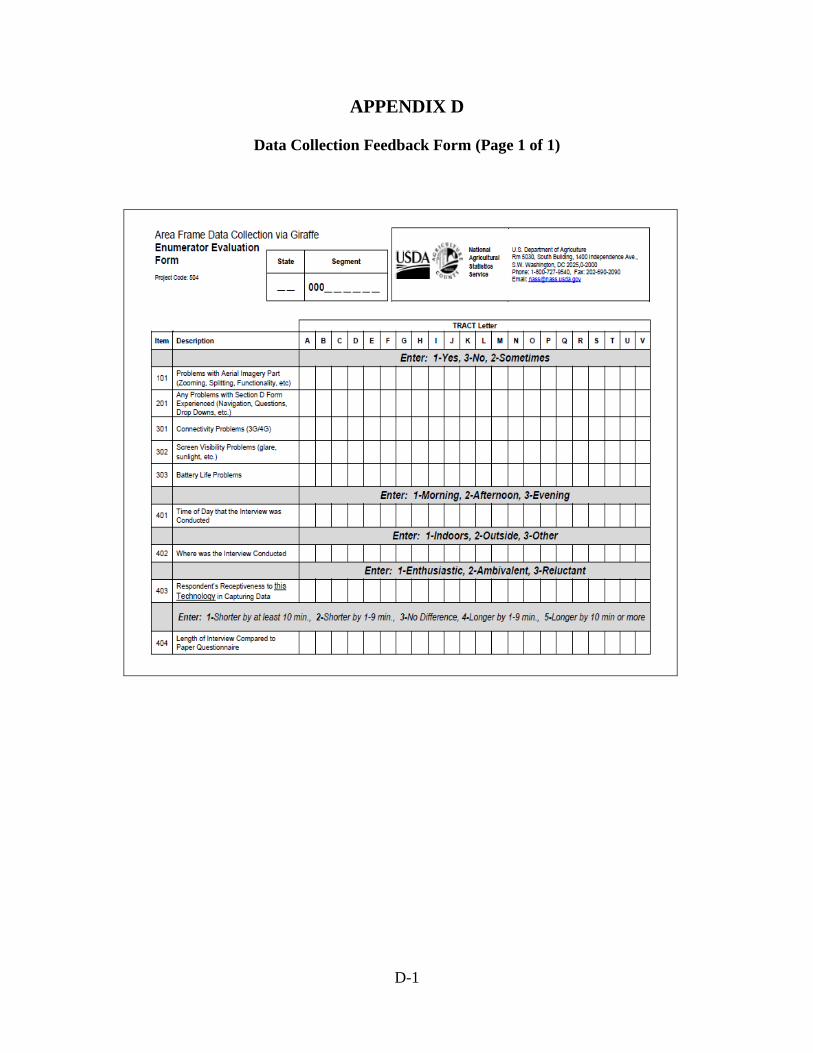
D-1
APPENDIX D
Data Collection Feedback Form (Page 1 of 1)

D-2
Data Collection Feedback Form (Page 2 of 2)