Field and Implementation of Seal Design Calibration and Implementation of the Performance-Based Chip...
90
Field Calibration and Implementation of the Performance‐Based Chip Seal Mix Design Method Y. Richard Kim, Ph.D., P.E., F. ASCE Javon Adams, Ph.D. Dept. of Civil, Construction, & Environmental Engineering North Carolina State University NCDOT Project 2013‐03 FHWA/NC/2013‐03 November 2015
Transcript of Field and Implementation of Seal Design Calibration and Implementation of the Performance-Based Chip...

Field Calibration and Implementation of the Performance‐Based Chip Seal
Mix Design Method
Y. Richard Kim, Ph.D., P.E., F. ASCEJavon Adams, Ph.D. Dept. of Civil, Construction, & Environmental Engineering North Carolina State University
NCDOT Project 2013‐03 FHWA/NC/2013‐03 November 2015

Field Calibration and Implementation of the Performance-Based Chip Seal Mix Design Method
FINAL REPORT
Submitted to the North Carolina Department of Transportation (Research Project No. HWY-2013-03)
Submitted by
Y. Richard Kim, Ph.D., P.E., F.ASCE Jimmy D. Clark Distinguished University Professor
Campus Box 7908 Department of Civil, Construction, & Environmental Engineering
North Carolina State University Raleigh, NC 27695-7908
Tel: 919-515-7758, Fax: 919-515-7908 E-mail: [email protected]
Javon Adams, Ph.D. Postdoctoral Research Associate
Department of Civil, Construction, & Environmental Engineering North Carolina State University
Raleigh, NC
November 2015
Technical Report Documentation Page 1. Report No.
FHWA/NC/2013-03 2. Government Accession No.
3. Recipient’s Catalog No.
4. Title and Subtitle Field Calibration and Implementation of the Performance-Based Chip Seal
Mix Design Method
5. Report Date November 2015
6. Performing Organization Code
7. Author(s) Y. Richard Kim and Javon Adams
8. Performing Organization Report No.
9. Performing Organization Name and Address Campus Box 7908, Dept. of Civil, Construction, & Environmental Engrg. NCSU, Raleigh, NC 27695-7908
10. Work Unit No. (TRAIS) 11. Contract or Grant No.
12. Sponsoring Agency Name and Address NC Department of Transportation Research and Analysis Group 1 South Wilmington Street Raleigh, NC 27601
13. Type of Report and Period Covered Final Report
August 2012 – August 2014 14. Sponsoring Agency Code
2013-03 15. Supplementary Notes 16. Abstract A new performance-based chip seal mix design method was developed from the HWY-2008-04 project. This report addresses a few research needs that were identified critical to implement the performance-based mix design method. The overall objectives of this research were to: (1) validate the developed chip seal mix design using analysis of field test sections constructed in different NCDOT Divisions, (2) construct single and multilayer chip seals using the developed mix design procedure, and (3) identify any adjustments and calibrations to the mix design that are necessary based on material type and/or existing surface conditions. This report presents the findings from field experimentation and analysis as well as laboratory testing of extracted field samples. The research approach involved the construction of field test sections within multiple NCDOT Bituminous Divisions using granite 78M and lightweight aggregate, both with CRS-2L emulsion. In each Division, test sections were constructed using both typical rates that had been used in the Division and the rates determined from the NCSU’s performance-based mix design method for comparative purposes. These sections were monitored by the research team to assess performance of the developed mix design under field traffic loading conditions. Three dimensional laser scan analysis was used to determine changes in the aggregate embedment depth as a function of time and traffic loading. Additionally, the tack lifter test method under development in the NCDOT HWY-2014-03 project was utilized for measuring the existing surface absorption, which is a key adjustment for the developed mix design method. From the constructed field sections, samples were extracted and taken back to the laboratory to verify that the measured material application rates for each section were reasonably close to the target design material application rates. It was found that the developed embedment depth algorithm effectively determines the embedment depth as emulsion application rate changes for a single layer of aggregate; and also captures the changes in embedment depth over time due to traffic loading. As expected, embedment depth increases as a function of traffic load until the asymptotic final embedment depth is achieved. Chip seal field validation sections constructed using the performance-based mix design performed well under field traffic and climatic conditions in multiple NCDOT Divisions after over one year in service. The performance-based mix design yields acceptable field performance while designing for less material than the existing NCDOT design approach using those same materials. This reduction in material costs in design could increase the cost-effectiveness of chip seals as a pavement preservation alternative. Construction-related material application rate variability was found to be significant in a majority of the field construction efforts and should be further evaluated in order to minimize the impact on chip seal performance. 17. Key Words
Chip seal, mix design, performance, aggregate loss, bleeding, embedment depth, laser
18. Distribution Statement
19. Security Classif. (of this report)
20. Security Classif. (of this page)
21. No. of Pages 90
22. Price
Form DOT F 1700.7 (8-72) Reproduction of completed page authorized

ii
DISCLAIMER The contents of this report reflect the views of the authors and are not necessarily the views of North Carolina State University. The authors are responsible for the facts and the accuracy of the data presented herein. The contents do not necessarily reflect the official views or policies of the North Carolina Department of Transportation at the time of publication. This report does not constitute a standard, specification, or regulation.

iii
ACKNOWLEDGEMENTS This research was sponsored by the North Carolina Department of Transportation. The Steering and Implementation Committee was comprised of Dennis Wofford (Chair), Mustan Kadibhai, P.E. (PM), Judith Corley-Lay, Ph.D., P.E., Brian Hunter, P.E., Gene Johnson, Terry C. McLaurin, H. Averette Moore, Christopher Peoples, P.E., James B. Phillips, P.E., M. Vann Price, Archie L. Smith, Jr., Brad Wall, P.E., Mrinmay Biswas, Ph.D., P.E. (Friend), Jennifer P. Brandenburg, P.E. (Friend), Scott Capps, P.E. (Friend), Jack Cowsert, P.E. (Friend), Emily O. McGraw, P.E. (Friend), Jon Nance, P.E. (Friend), David Spainhour, P.E. (Friend), David L. Thomas, P.E. (Friend), and Todd W. Whittington, P.E. (Friend). These advisors have given invaluable direction and support to the research team throughout the project.

iv
EXECUTIVE SUMMARY A series of research projects have been funded by the North Carolina Department of Transportation (NCDOT) to investigate various ways to improve chip seal performance. During the course of conducting these research projects, existing chip seal test methods and design procedures were carefully reviewed and evaluated. The review of existing design procedures revealed a clear need for a new chip seal design procedure that encompasses new materials and is based on performance. Specifically, the existing design methods did not take into consideration lightweight materials, which are used throughout the State, or the use of modified emulsions, which now the standard amongst the NCDOT Divisions. In response to these urgent needs, the NCDOT funded a research project, HWY-2008-04, Development of a New Chip Seal Mix Design Method, which was conducted by North Carolina State University (NCSU). The findings from the HWY-2008-04 project clearly demonstrate the ability of the NCSU-developed chip seal mix design to help ensure effective and consistent performance with regard to the performance parameters that are important for chip seals. However, two primary research needs were identified at the end of the HWY-2008-04 project. First, the NCSU mix design procedure calls for adjustment of the design aggregate application rates (AARs) and emulsion application rates (EARs) based on the individual job conditions. Calibration of these parameters is needed to ensure the effectiveness of the mix design procedure in field situations. Secondly, the survey results from the HWY-2008-04 project reveal that the design rates used by some Divisions are much higher than the NCSU optimal mix design rates. Therefore, if the lower NCSU rates yield satisfactory performance in the field, significant cost savings could be realized by NCDOT and NC taxpayers. The overall objectives of this research were to:
Validate the developed chip seal mix design using analysis of field test sections
constructed in different NCDOT Divisions. Construct single and multilayer chip seals using the developed mix design procedure. Identify any adjustments and calibrations to the mix design that are necessary based on
material type and/or existing surface conditions. The methodology for this research included field experimentation and analysis, as well as laboratory testing of extracted field samples. The research approach involved the construction of field test sections that were used to validate the developed chip seal mix design method. These sections were constructed in collaboration with NCDOT bituminous paving personnel and were monitored by the research team to assess performance of the developed mix design under field traffic loading conditions. Additionally, sections were constructed using typical NCDOT mix design approaches from each Division for comparative purposes. The NCSU developed mix design was completed for the specific construction materials to be used in each field chip seal section. The performance of the sections constructed using the new chip seal design approach was then evaluated on the same roadway as the NCDOT designed sections for those same construction materials. This comparison was conducted within multiple NCDOT Bituminous Divisions.
v
Three dimensional laser scan analysis was used to determine changes in the chip seal treatment as a function of time and traffic loading. From these scans, the embedment depth of each section was determined at different times in the life of the seal using a laser based procedure and algorithm developed during this research. Additionally, the tack lifter test method under development in the NCDOT HWY-2014-03 project was utilized for measuring the existing surface absorption, which is a key adjustment for the developed mix design method. This new method determines how much emulsion is lost into the existing surface, and therefore allows for an adjustment of the applied emulsion application rate to account for the absorptive characteristics of the existing pavement surface on which a chip seal will be constructed. From the constructed field sections, samples were extracted and taken back to the laboratory for further testing. The purpose of this extraction and testing was to verify that the measured material application rates for each section were reasonably close to the target design material application rates to ensure as excessive construction variability could influence field section performance. The key component of the field-based methodology was to monitor the performance of the chip seal surface treatments at different time intervals throughout the life of the seal to assess qualitative and quantitative measures of performance such aggregate retention, bleeding, and changes in embedment depth. Three dimensional laser scans and digital images of the sections were captured at different time intervals in order to assess the condition of the field test sections. For this research, the materials utilized for the field validation section construction was granite 78M and lightweight aggregate, both with CRS-2L emulsion. The granite aggregate sources used for each field construction were obtained from the typical aggregate sources used by the bituminous paving crew in each division where the construction took place. Since the source of the granite aggregate is different for each division, the aggregate obtained represented different gradations and properties (e.g., percentage of flat and elongated particles, dust proportion, etc.). By building field validation sections in different Divisions using their respective local materials, the research team sought to ensure that the developed mix design was evaluated under a wide variety of realistic conditions. The following key findings were found during this research effort:
The modified 3-D laser profiler was used to determine the appropriate design for achieving the target 50% initial embedment depth for the specific construction materials utilized in chip seal construction.
An embedment depth measurement procedure and algorithm were developed and validated using laboratory specimens with controlled aggregate geometries as well as actual chip seal specimens. The validation showed that the algorithm could properly determine the embedment depth of chip seals designed to known embedment depths, such as the mix design target initial embedment depth of 50%.

vi
The median particle size of the aggregate gradation was determined to be a required input into the embedment depth algorithm. The median particle size is the critical resolution for the analysis that finds the volume of surface voids for chip seal treatments. This volume of surface voids is inversely proportional to the embedment depth.
Comparisons of tack lifter device measurements taken on a steel plate and on the existing pavement surface indicated the amount of emulsion that was absorbed by the existing surface during the emulsion application process.
Field construction revealed that aggregate pickup is an issue with lightweight aggregate due to its lower density. Construction vehicle tires exhibited more significant aggregate pickup during construction when using lightweight aggregate as opposed to granite aggregate. An adjustment factor is needed to account for aggregate pickup potential.
During field construction efforts in four NCDOT bituminous Divisions, significant construction variability was observed in many of the constructed chip seal sections in terms of both aggregate and emulsion application rate accuracy.
Measured application rates for field sections constructed in Divisions 5 and 10 were close enough to the target design rates for those sections to be used for performance-based validation; while sections constructed in Divisions 4 and 6 could not be used for performance validation due to large variance from the target design rates.
The main conclusions from this research are as follows:
The developed embedment depth algorithm effectively determines the embedment depth as emulsion application rate changes for a single layer of aggregate; and also captures the changes in embedment depth over time due to traffic loading. As expected, embedment depth increases as a function of traffic load until the asymptotic final embedment depth is achieved.
The embedment depth algorithm works for significantly different gradations that are typically used in chip seal treatments.
Chip seal field validation sections constructed using the developed mix design performed well under field traffic and climatic conditions in multiple NCDOT Divisions after over one year in service.
The new chip seal mix design was validated for both single and double chip seal treatment types
The developed mix design yields acceptable field performance while designing for less material than the existing NCDOT design approach using those same materials. This reduction in material costs in design could increase the cost-effectiveness of chip seals as a pavement preservation alternative.
Construction-related material application rate variability was found to be significant in a majority of the field construction efforts and should be further evaluated in order to minimize the impact on chip seal performance.

vii
TABLE OF CONTENTS 1. Background .....................................................................................................................1
1.1 Research Needs and Significance ............................................................................1 1.2 Research Objectives .................................................................................................1
2. Developed Chip Seal Analysis Methods .........................................................................2 2.1 Three Dimension Laser Profiler and Embedment Depth Analysis ..........................2 2.2 Performance-Based Mix Design Adjustments for Existing Field Conditions .......12 2.3 Validation of Mix Design Method via Laboratory Performance Testing ..............19
3. Field Validation of Performance Based Mix Design ....................................................19 3.1 Division 5 Field Validation Summary ...................................................................20 3.2 Division 10 Field Validation Summary .................................................................31 3.3 Summary of Findings from Field Validation of Mix Design Procedure ...............35 3.4 Performance-Based Mix Design Validation Conclusions .....................................36
4. References .....................................................................................................................37 5. Appendices ....................................................................................................................40
5.1 Appendix A: Distresses Types and Factors Affecting Chip Seal Performance .....40 5.2 Appendix B: Existing Chip Seal Mix Design Methods .........................................50 5.3 Appendix C: Laboratory Validation of Chip Seal Mix Design Method ................54 5.4 Appendix D: Summary of Findings from Construction in Divisions 4 and 6 .......67

viii
LIST OF TABLES
Table 2.1. McLeod Method’s Qualitative Existing Pavement Surface Correction Factor (McLeod 1969) ....................................................................................................................... 13 Table 3.1 Ignition Oven Test Results for Division 5 Single Seals ......................................... 24 Table 3.2. Ignition Test Results for Double Seals .................................................................. 26 Table 3.3. Ignition Test Results for Division 10 ..................................................................... 32 Table 5.1. Summary of Existing Mix Design Methods ......................................................... 50 Table 5.2. Full Factorial Combinations of Aggregate and Emulsion. ................................... 55 Table 5.3 Ignition Test Results for Division 4 ........................................................................ 68 Table 5.4 Ignition Test Results for Lightweight Aggregate in Division 6 ............................. 74

ix
LIST OF FIGURES Figure 2.1. Photo of new 3-D laser profiler prototype used in this research project. ............... 2 Figure 2.2. Simplified model of chip seal. ................................................................................ 3 Figure 2.4. Delrin ball test sample (30% embedment). ............................................................ 4 Figure 2.5. One scan line of laser data: (a) 30% embedment and (b) 60% embedment. .......... 6 Figure 2.6. Results of Delrin sphere studies. ............................................................................ 7 Figure 2.7. One line of laser scanning using 7 subsections. ..................................................... 8 Figure 2.8. One line of laser scanning using 72 subsections. ................................................... 9 Figure 2.9. One line of laser scanning using 37 subsections. ................................................. 10 Figure 2.10. Results of embedment depth algorithm for lab-fabricated chip seal samples. ... 10 Figure 2.11. Selected aggregate gradation for study of gradation sensitivity to embedment depth.................................................................................................................................................. 11 Figure 2.12. New mix design framework. ............................................................................. 12 Figure 2.13. Image of the tack lifter test setup. ...................................................................... 14 Figure 2.14. Image of absorptive tack lifter sheet. ................................................................. 14 Figure 2.15. Tack lifter test procedure summary. ................................................................... 15 Figure 2.16. Tack lifter measured EAR’s on flat steel plate surface. ..................................... 16 Figure 2.17. Rough surface texture of existing chip seal surface at the first field section location.................................................................................................................................................. 16 Figure 2.18. Field tack lifter test layout in: (a) transverse direction and (b) longitudinal direction.................................................................................................................................................. 17 Figure 2.19. Difference in measured EAR between tack lifter on pan and tack lifter on pavement surface. .................................................................................................................................... 18 Figure 3.1. Layout of Division 5 test sections. ....................................................................... 21 Figure 3.2. Existing pavement conditions of Division 5 test sections. ................................... 22 Figure 3.3. Aggregate gradations for Division 5 test sections. ............................................... 22 Figure 3.4. Layout of Vialit and MMLS3 samples for Division 5 test sections. .................... 23 Figure 3.5. Single-seal test sections in Division 5: (a) NCDOT and (b) NCSU. .................... 23 Figure 3.6. Laser scanning of Division 5 test sections. .......................................................... 24 Figure 3.7. Embedment depth: Division 5 NCDOT section. .................................................. 25 Figure 3.8. Embedment depth: Division 5 NCSU section. ..................................................... 25 Figure 3.9. Division 5 sections after revisiting: (a) texture of NCDOT section, (b) NCDOT section shoulder, (c) texture of NCSU section, and (d) NCSU section’s shoulder. ............... 27 Figure 3.10. Visual observation of reflective cracking in Division 5. .................................... 28 Figure 3.11. Embedment depth: NCDOT and NCSU sections. .............................................. 28 Figure 3.12. Change in embedment depth: NCDOT and NCSU sections. ............................. 29 Figure 3.13. Close-up image within the wheel path of a chip seal section showing no bare spots or evidence of excessive aggregate loss. ................................................................................. 30 Figure 3.14. Longitudinal image of CRS-2L field validation section after one year in service showing no evidence of bleeding or aggregate loss issues. .................................................... 30 Figure 3.15. Aggregate gradations for Division 10 sections. ................................................. 31 Figure 3.16. Division 10 sections after construction: (a) NCDOT and (b) NCSU. ................ 32 Figure 3.17. Embedment depth: Division 10 NCDOT section. .............................................. 33

x
Figure 3.18. Embedment depth: Division 10 NCSU section. ................................................. 33 Figure 3.19. Images of the Division 10 sections one month after construction: (a) and (b) show the NCDOT section, while (c) and (d) show the NCSU section. ........................................... 35 Figure 5.1. Example of streaking of a chip seal after construction. ....................................... 42 Figure 5.2. Example of typical debonding in a chip seal. ...................................................... 42 Figure 5.3. Example of partial bleeding failure. .................................................................... 43 Figure 5.4. Bleeding due to heavy truck traffic and hot weather (Lawson et al. 2007). ........ 44 Figure 5.5. Example of a flushed pavement surface (Lawson et al. 2007). ........................... 45 Figure 5.6. Explanation of PUC parameter. ........................................................................... 48 Figure 5.7. States of embedment of chip seals (Hanson 1934). ............................................. 52 Figure 5.8. Aggregate loss performance of granite 78M aggregate. ..................................... 56 Figure 5.9. Aggregate loss performance of lightweight aggregate. ....................................... 56 Figure 5.10. Aggregate loss performance of granite 78M aggregate: (a) Gradation A, (b) Gradation B, and (c) Gradation C. .......................................................................................... 58 Figure 5.11. Aggregate loss performance of lightweight aggregate: (a) Gradation A, (b) Gradation B, and (c) Gradation C. .......................................................................................... 59 Figure 5.12. Granite 78M aggregate bleeding performance. ................................................. 60 Figure 5.13. Lightweight aggregate bleeding performance. .................................................. 61 Figure 5.14. Verification of optimal EAR for granite 78M aggregate: (a) Gradation A, (b) Gradation B, and (c) Gradation C. .......................................................................................... 62 Figure 5.15. Verification of optimal EAR for lightweight aggregate: (a) Gradation A, (b) Gradation B, and (c) Gradation C. .......................................................................................... 63 Figure 5.16. Bleeding vs. EAR for granite 78M gradation B shown along with the mix design optimum EAR. ........................................................................................................................ 65 Figure 5.17. Bleeding vs. EAR for granite 78M gradation B with additional testing. .......... 65 Figure 5.18. Aggregate gradation for Division 4 test sections. .............................................. 67 Figure 5.19. Existing conditions and layout of Vialit and MMLS3 samples in Division 4. ... 68 Figure 5.20. Vialit samples from Division 4: (a) NCSU section without any correction for aggregate pick-up, (b) NCSU section with 10% correction for aggregate pick-up, and (c) NCDOT section. ..................................................................................................................... 69 Figure 5.21. Division 4 sections after construction and sweeping: (a) NCSU section without any correction for aggregate pick-up, (b) NCSU section with 10% correction for aggregate pick-up, and (c) NCDOT section (bottom pictures show the shoulders). ............................................. 69 Figure 5.22. Embedment depth: Division 4 NCDOT section. ................................................ 70 Figure 5.23. Embedment depth: Division 4 NCSU design section. ........................................ 70 Figure 5.24. Embedment depth: Division 4 NCSU-corrected section. ................................... 71 Figure 5.25. Longitudinal view of Division 4 NCDOT section. ............................................ 72 Figure 5.26. Close view of Division 4 NCDOT section three months after construction. ..... 72 Figure 5.27. Close view of Division 4 sections three months after construction. .................. 72 Figure 5.28. Aggregate gradations for Division 6 test sections. ............................................. 73 Figure 5.29. Single seals after construction in Division 6: (a) NCDOT section and (b) NCSU section. .................................................................................................................................... 74 Figure 5.30. Pickup of aggregate by: (a) aggregate spreader and (b) roller. .......................... 75

xi
Figure 5.31. Sections after sweeping in Division 6: (a) NCDOT section’s texture after sweeping, NCDOT section’s shoulder after sweeping, (c) NCSU section’s texture after sweeping, and (d) NCSU section’s shoulder after sweeping. .............................................................................. 76 Figure 5.32. Embedment depth: Division 6 NCDOT section. ................................................ 77 Figure 5.33. Embedment depth: Division 6 NCSU section. ................................................... 77
1
1. BACKGROUND
1.1 Research Needs and Significance
Over the last decade, great emphasis has been placed on pavement preservation nationwide. One of the most cost-effective preservation treatments is the chip seal. A chip seal is an asphalt surface treatment formed by applying emulsified asphalt and aggregate. Chip seal surface treatments are currently used worldwide, and in North Carolina where the research is being conducted, over 50% of the paved road miles are covered by a chip seal surface treatment. Previous research conducted under the NCDOT HWY-2008-04 project led to the development of a new performance-based chip seal mix design procedure. The purpose of the developed mix design procedure is to provide a systematic analytical method for engineers to design consistent chip seal mixes while ensuring satisfactory performance under field traffic and environmental conditions. The mix design seeks to provide effective quantitative methods and techniques for determining the appropriate AAR and EAR for the chip seal surface treatment to be constructed. A validation of that mix design was needed in order to assess the performance of designed chip seal treatments under actual field traffic and environmental conditions. 1.2 Research Objectives
The overall objectives of the research herein are to: Validate the developed chip seal mix design using field performance testing. Construct single and multilayer seals using the developed mix design procedure Identify any adjustments and calibrations to the mix design that are necessary based on
material type and/or existing surface conditions. To accomplish these objectives, an extensive review of existing literature was conducted, followed by rigorous field work to develop the research outcomes detailed in this report. The literature review was conducted at the onset of this project in order to better understand the existing knowledge and tools available for the design of chip seal treatments, and how best to validate the developed methods. This literature review is detailed in Appendix A and B of this report. In order to properly validate the mix design, the types of distresses typical to chip seal surface treatments had to be fully understood, including the mechanisms that cause them. Thus, the major distress types that occur in chip seals, and the factors that affect seal performance, were reviewed and are summarized in Appendix A. This knowledge provided the foundation for properly assessing the performance of the developed chip seal mix design. Additionally, existing mix design methods were reviewed in order to better evaluate the developed mix design approach when compared to the existing methods. This portion of the literature review is detailed in Appendix B.

2
2. DEVELOPED CHIP SEAL ANALYSIS METHODS
This section summarizes the test methods and data analysis methodology developed in this research. 2.1 Three Dimension Laser Profiler and Embedment Depth Analysis
The three-dimensional (3-D) laser surface texture profiler used in this research is shown in Figure 2.1. This portable laser profiler was used in the field to obtain macrotexture and embedment depth data. In accordance with the ASTM E 1845 specification for calculating pavement macrotexture profile depth, the laser measures the distance between the laser sensor and the pavement surface in both the longitudinal and transverse directions of the pavement and produces a 3-D map of the pavement surface texture. More specifically, this point laser scans at a resolution as low as 0.3 mm in both the longitudinal and transverse directions across the user-definable scan area. The resulting data provides an accurate picture of occurrences at the macroscopic level of the surface level of chip seals constructed during this project. It is important to note that only wheel path data are captured during field measurements to accurately reflect changes in the condition of the pavement surface due to traffic loading. Non-wheel path data is excluded because variable loading exists outside of the wheel path.
Figure 2.1. Photo of new 3-D laser profiler prototype used in this research project.
From the laser procedure, 3-D data are obtained that are then utilized to determine the embedment depth for that particular field section or specimen. This procedure is discussed in more detail in the following section.
2.1.1 Development of a New Embedment Depth Analysis Method
The primary objective of this method is to develop a new method for measuring the embedment depth (ED) of chip seal surface treatments in the lab and in the field.

3
Inspired by the sand patch test method and considering a single-size aggregate (shown in Figure 2.2), the following Equation (1) can be used to determine the embedment depth:
Volume of Emulsion Ed Volume of Agg
EdVolume of Agg Volume of Emulsion Volume of Surface Voids
(1)
where Ed is the embedment depth and the surface voids are the air voids between chip seal surface and top of aggregate particles as shown in Figure 2.2. Simplifying Equation (1) yields Equation (2):
Volume of EmulsionEd
Volume of Emulsion Volume of Surface Voids
(2)
It is noted that Ed in Equations (1) and (2) is a fraction and needs to be multiplied by 100 to get the percentage embedment.
embe
d
top line
base lineemulsion
airaggregate
Figure 2.2. Simplified model of chip seal.
With the volume of the emulsion and the volume of the surface voids known, the ED can be calculated using Equation (2). The volume of the emulsion can be found using the EAR, which is already known for the lab-fabricated samples. In the field, in order to ensure that there is no variability between the target EAR and the measured EAR due to construction variability, the EAR can be measured using a sampling method. For this sampling method, a steel plate (with dimensions of 200 mm by 200 mm) is weighed beforehand and then placed at the end of the chip seal section to be constructed. After the emulsion distributor runs over the plate, it is removed and weighed to obtain the EAR measured directly in the field. In order to obtain the volume of the surface voids, algorithms for the three-dimensional (3-D) point laser profiler shown previously in Figure 2.1 were developed. The point laser measures the distance between the laser sensor and the pavement surface in both the longitudinal and transverse directions of the pavement and produces a set of data in a 3-D matrix in .csv format. A map of the pavement surface texture can be obtained by importing this dataset into MATLAB. A MATLAB code has been developed to determine the surface voids of the scanned pavement surface for the ED calculations.

4
2.1.1.1 Laboratory Validation Using Controlled Aggregate Geometries In order to test the algorithm and quantify the ED of the chip seal samples, chip seal specimens made of an aggregate substitute with controlled geometries and dimensions were fabricated. A specimen fabricated using a Delrin material and paint (mixed to a similar density of a typical chip seal emulsion), is shown in Figure 2.3. Delrin spheres, which are obtainable in the same sieve sizes that are used for chip seal surface treatments and also have a density similar to lightweight aggregate, were used as a substitute for the aggregate. A paint mixture was used instead of emulsion to fabricate the samples since the Delrin balls are very expensive, and the paint makes for easier cleanup of the Delrin since many repetitions were needed in this study. Using a volumetric method, the true ED was determined precisely. Then, by scanning the surface texture of the specimen using the 3-D laser profiler and processing the raw data using the embedment depth code (described later in this report) developed in MATLAB, the ED could be calculated.
Figure 2.3. Delrin ball test sample (30% embedment).
The dimensions of the testing board used for the Delrin sphere tests were 198 mm by 198 mm, and the selected Delrin sphere diameter was 12.7 mm. For the sample fabrication, it took 243 balls to achieve a single layer of Delrin balls on the test board. In order to determine a target ED percentage, the following Equations (3) through (6) were applied to obtain the appropriate volume of paint (i.e., emulsion substitute).
H D E (3) V a b H (4)
int 0paV VV n (5)
where:
H = height, D= sphere diameter, E = target embedment fraction (0.2, 0.3, 0.4, 0.5, 0.6, 0.7), ,a b = dimensions of the test board,
n= number of spheres applied,

5
intpaV = volume of paint needed for target embedment,
0V = sphere volume submerged in the paint, calculated with triple integral for each target,
calculated using Equation (6):
20
31
2 3V d E E
(6)
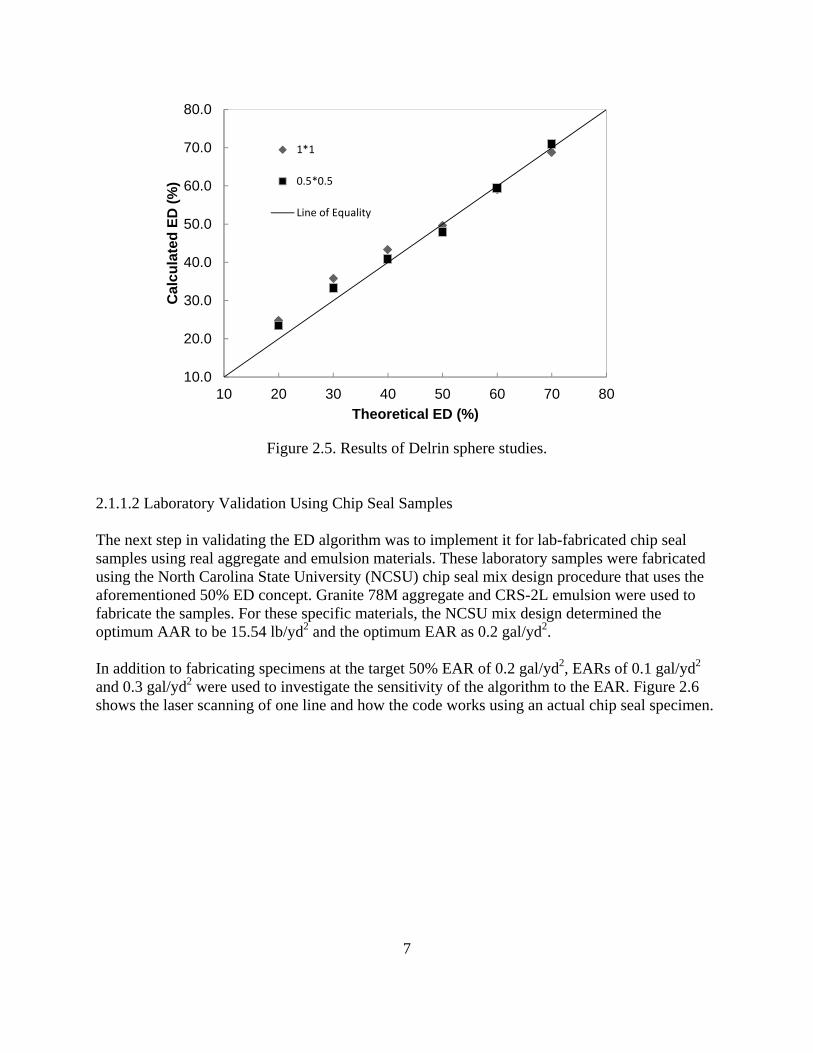
Figure 2.4 shows one scan of the laser data for target embedment depths of 30% and 60% and illustrates how the MATLAB code determines the surface voids from the scan of the surface texture. To determine the surface voids, a reference line under which air volumes could be calculated needed to be established first. At the beginning, the raw data (black dots) were filtered, because most lasers generate a few random data spikes that need to be removed (typically less than 3% of all data are removed as outliers). A signal processing technique was used to filter the data and remove the data spikes. Then, all the peaks were identified and the highest point of the peaks was determined. A horizontal line was established from this highest point and was used as the reference line. This method was considered to be adequate for the embedment study using Delrin balls because the Delrin balls all have the same diameter. It is noted that the peaks in Figure 2.4, which represent individual Delrin balls, do not have the same heights. The reason for this difference in heights is that one line scan cannot capture the highest points of all the Delrin balls together because these balls are not perfectly arranged to yield the same orientation for all the balls scanned at once. Therefore, the scan shown in Figure 2.4 captures the peaks of some Delrin balls, but for others it captures the points on the side, inclined surface of the balls. Because the volume of paint used in the Delrin ball study was based on the diameter of the Delrin ball, it was important to establish the reference line at the highest peak value, as illustrated above. It is noted here that, for real chip seal samples that have a range of aggregate particle sizes, the method of using the highest point in the scan as the reference line is inappropriate and needs to be modified. A methodology to determine the surface voids for real chip seal samples is presented later in the paper. Finally, in order to obtain the surface voids, the reference line was subtracted from the filtered data. The trapezoidal rule was used to obtain the area that represents the surface voids. This surface void area was then multiplied by the resolution (or the distance between each laser point in the line) to obtain the surface void volume. The surface void volume, along with the volume of emulsion (or paint in this case), was then input into Equation (2) to determine the ED. The results are shown in Figure 2.5.
In this study, two laser scan resolutions, 1 mm and 0.5 mm, were used. In general, the agreement between the calculated ED and the theoretical (or target) ED is good. Also, the 0.5 mm by 0.5 mm resolution gives more accurate results than the 1 mm by 1 mm resolution. It can be seen in Figure 2.5 that the discrepancy between the calculated ED and the theoretical ED is larger for the theoretical ED% lower than 50%. It is noted that, for the ED lower than 50%, there is a hidden volume of air under the balls. This volume is accounted for using simple geometric calculations in the surface voids calculation method, but this procedure causes some errors when the hidden volume of voids is determined from two-dimensional measurements.

6
Figure 2.4. One scan line of laser data: (a) 30% embedment and (b) 60% embedment.
7
Figure 2.5. Results of Delrin sphere studies.
2.1.1.2 Laboratory Validation Using Chip Seal Samples The next step in validating the ED algorithm was to implement it for lab-fabricated chip seal samples using real aggregate and emulsion materials. These laboratory samples were fabricated using the North Carolina State University (NCSU) chip seal mix design procedure that uses the aforementioned 50% ED concept. Granite 78M aggregate and CRS-2L emulsion were used to fabricate the samples. For these specific materials, the NCSU mix design determined the optimum AAR to be 15.54 lb/yd2 and the optimum EAR as 0.2 gal/yd2. In addition to fabricating specimens at the target 50% EAR of 0.2 gal/yd2, EARs of 0.1 gal/yd2 and 0.3 gal/yd2 were used to investigate the sensitivity of the algorithm to the EAR. Figure 2.6 shows the laser scanning of one line and how the code works using an actual chip seal specimen.
10.0
20.0
30.0
40.0
50.0
60.0
70.0
80.0
10 20 30 40 50 60 70 80
Ca
lcu
late
d E
D (
%)
Theoretical ED (%)
1*1
0.5*0.5
Line of Equality

8
Figure 2.6. One line of laser scanning using 7 subsections.
As mentioned earlier in the Delrin sphere case, one reference line was used to determine the sample ceiling for the surface void calculations. However, it is clear that by using just one reference line for the actual samples, the surface voids would be unreasonably sensitive to high areas of the sample where the coarser, or less flat, aggregate particles are present. So, the concept of dividing the total length of the laser scan line into small subsections was devised to obtain localized peaks for each subsection. In order to accomplish this task, the research team had to determine an appropriate length for each section. The overall chip seal sample dimensions were 175 mm by 300 mm. With a subsection length of 25 mm (for 7 total subsections per sample) and obtaining local peaks every 25 mm, the ED was found to be 31%, as shown in Figure 2.6. This resultant ED was too low, as this sample was fabricated based on the 50% ED concept. The surface voids shown in the figure were overestimated, which led to a lower ED percentage based on the relationship defined in Equation (2). That is, the greater the subsection length, the smaller the chance of capturing peaks that are representative of both the coarser sample areas and the areas with smaller/flatter particles. By properly capturing the local peaks, the appropriate ED percentage could be found for the whole sample. For example, in this case using a 25-mm subsection length, the chance of capturing the peaks associated with 6.25-mm particles (which constitutes 35% of the total aggregate gradation for the aggregate source used in this study) is extremely low. This makes 25 mm an inappropriate subsection length for characterizing ED, as the algorithm should be able to capture these coarse particle peaks. On the other hand, if a very small analysis subsection length is selected, such as a subsection length that is equal to the number 8 sieve size (2.36 mm) (or 72 subsections per sample), the ED would be 65%, as shown in Figure 2.7. This resultant ED is significantly higher than the 50% design ED for the specimen. At a subsection length this small (or fine), the algorithm simply mirrors the aggregate structure and underestimates the surface voids for the sample. This underestimation of the surface voids causes a higher ED percentage (again based on the relationship found in Equation (2)) than the design ED of 50 percent.

9
Figure 2.7. One line of laser scanning using 72 subsections.
Therefore, an appropriate number of subsections were sought for analysis that would balance the gradation variety in a real chip seal sample with not being overly sensitive to coarse or fine aggregate particles. This study led to the use of a median particle size, or the point of 50% passing for the aggregate gradation, to set the size of the surface void analysis subsections. Using the performance-based uniformity coefficient (PUC) concept for aggregate gradation, the median particle size can be related directly to the performance of chip seal surface treatments (2). Using this PUC concept prevents the ED from being biased towards either the coarser or finer sections of the sample. Therefore, the research team used a median particle size (5 mm for this gradation) to determine the subsection length to determine the surface voids for the ED analysis; the results are displayed in Figure 2.8. Using this subsection analysis length, the ED was determined to be 51% for the samples that were fabricated using the 50% ED mix design concept. Therefore, it was found that using the median particle size to determine the subsection length provides reasonable ED results. However, this criterion for surface void measurements still needed to be investigated and validated for a different aggregate gradation. This validation of the algorithm for a different gradation is detailed in the following section of this report. Figure 2.9 shows the results of the ED algorithm for the laboratory-fabricated chip seal samples. As shown in the figure, for the optimal AAR and EAR (0.2 gal/yd2), the ED is approximately 50%, which is the expected ED as the NCSU mix design is based on the 50% embedment depth design concept. Also, the ED algorithm is shown to be appropriately sensitive to the changes in EAR for a constant AAR.

10
Figure 2.8. One line of laser scanning using 37 subsections.
Figure 2.9. Results of embedment depth algorithm for lab-fabricated chip seal samples.
y = 206.05x + 7.9212R² = 0.996
20.0
30.0
40.0
50.0
60.0
70.0
80.0
0.05 0.1 0.15 0.2 0.25 0.3 0.35
Em
bed
men
t (%
)
EAR (gal/yd^2)
0.1 EAR
0.2 EAR
0.3 EAR
Average
11
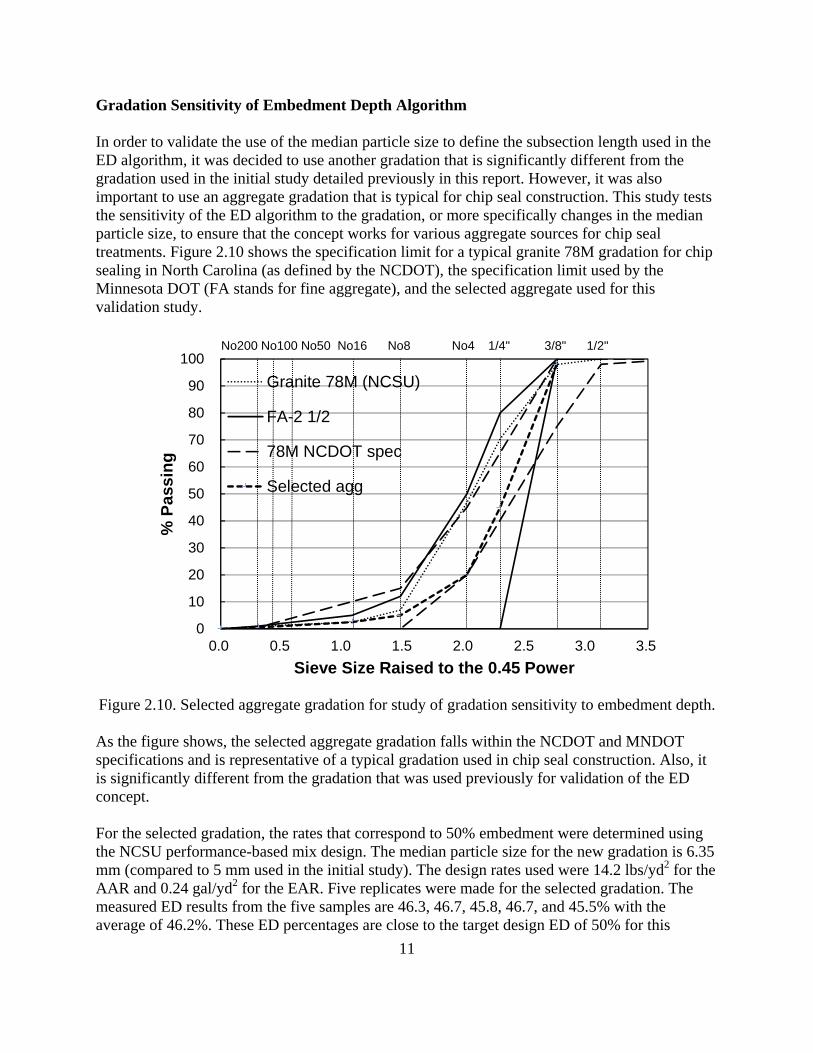
Gradation Sensitivity of Embedment Depth Algorithm In order to validate the use of the median particle size to define the subsection length used in the ED algorithm, it was decided to use another gradation that is significantly different from the gradation used in the initial study detailed previously in this report. However, it was also important to use an aggregate gradation that is typical for chip seal construction. This study tests the sensitivity of the ED algorithm to the gradation, or more specifically changes in the median particle size, to ensure that the concept works for various aggregate sources for chip seal treatments. Figure 2.10 shows the specification limit for a typical granite 78M gradation for chip sealing in North Carolina (as defined by the NCDOT), the specification limit used by the Minnesota DOT (FA stands for fine aggregate), and the selected aggregate used for this validation study.
Figure 2.10. Selected aggregate gradation for study of gradation sensitivity to embedment depth. As the figure shows, the selected aggregate gradation falls within the NCDOT and MNDOT specifications and is representative of a typical gradation used in chip seal construction. Also, it is significantly different from the gradation that was used previously for validation of the ED concept. For the selected gradation, the rates that correspond to 50% embedment were determined using the NCSU performance-based mix design. The median particle size for the new gradation is 6.35 mm (compared to 5 mm used in the initial study). The design rates used were 14.2 lbs/yd2 for the AAR and 0.24 gal/yd2 for the EAR. Five replicates were made for the selected gradation. The measured ED results from the five samples are 46.3, 46.7, 45.8, 46.7, and 45.5% with the average of 46.2%. These ED percentages are close to the target design ED of 50% for this
0
10
20
30
40
50
60
70
80
90
100
0.0 0.5 1.0 1.5 2.0 2.5 3.0 3.5
% P
ass
ing
Sieve Size Raised to the 0.45 Power
Granite 78M (NCSU)
FA-2 1/2
78M NCDOT spec
Selected agg
No200 No100 No50 No16 No8 No4 1/4" 3/8" 1/2"
12
gradation as well, which shows that using the median particle size to determine the subsection length in the ED algorithm is valid for different gradations.
2.2 Performance-Based Mix Design Adjustments for Existing Field Conditions
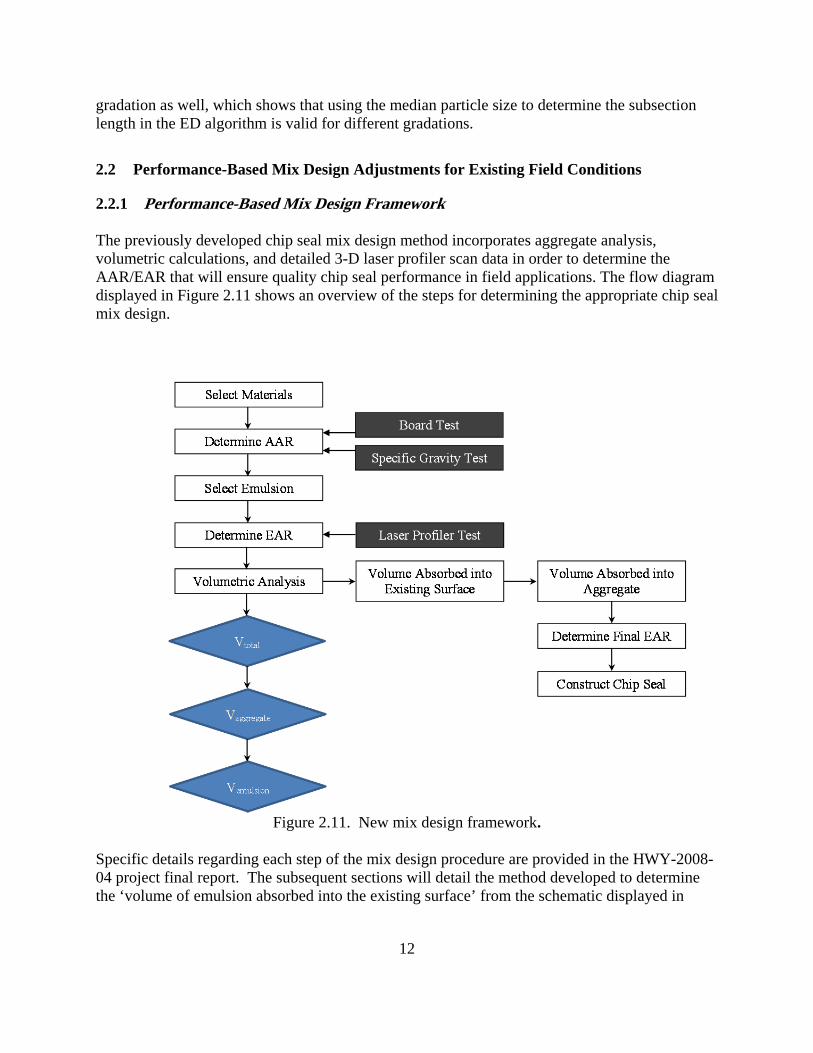
2.2.1 Performance-Based Mix Design Framework The previously developed chip seal mix design method incorporates aggregate analysis, volumetric calculations, and detailed 3-D laser profiler scan data in order to determine the AAR/EAR that will ensure quality chip seal performance in field applications. The flow diagram displayed in Figure 2.11 shows an overview of the steps for determining the appropriate chip seal mix design.
Figure 2.11. New mix design framework.
Specific details regarding each step of the mix design procedure are provided in the HWY-2008-04 project final report. The subsequent sections will detail the method developed to determine the ‘volume of emulsion absorbed into the existing surface’ from the schematic displayed in
13
Figure 2.11. This adjustment factor, defined in the next section, was developed in the laboratory and also tested in the field during actual chip seal construction efforts.
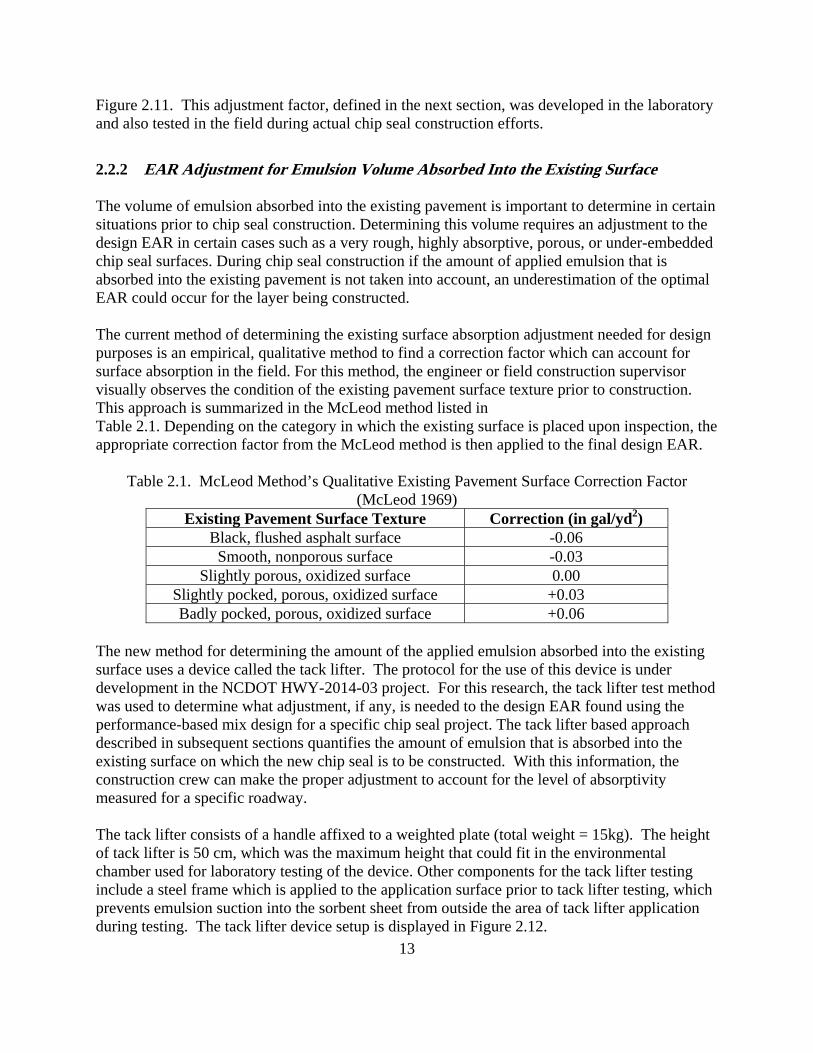
2.2.2 EAR Adjustment for Emulsion Volume Absorbed Into the Existing Surface The volume of emulsion absorbed into the existing pavement is important to determine in certain situations prior to chip seal construction. Determining this volume requires an adjustment to the design EAR in certain cases such as a very rough, highly absorptive, porous, or under-embedded chip seal surfaces. During chip seal construction if the amount of applied emulsion that is absorbed into the existing pavement is not taken into account, an underestimation of the optimal EAR could occur for the layer being constructed. The current method of determining the existing surface absorption adjustment needed for design purposes is an empirical, qualitative method to find a correction factor which can account for surface absorption in the field. For this method, the engineer or field construction supervisor visually observes the condition of the existing pavement surface texture prior to construction. This approach is summarized in the McLeod method listed in Table 2.1. Depending on the category in which the existing surface is placed upon inspection, the appropriate correction factor from the McLeod method is then applied to the final design EAR.
Table 2.1. McLeod Method’s Qualitative Existing Pavement Surface Correction Factor
(McLeod 1969) Existing Pavement Surface Texture Correction (in gal/yd2)
Black, flushed asphalt surface -0.06 Smooth, nonporous surface -0.03
Slightly porous, oxidized surface 0.00 Slightly pocked, porous, oxidized surface +0.03 Badly pocked, porous, oxidized surface +0.06
The new method for determining the amount of the applied emulsion absorbed into the existing surface uses a device called the tack lifter. The protocol for the use of this device is under development in the NCDOT HWY-2014-03 project. For this research, the tack lifter test method was used to determine what adjustment, if any, is needed to the design EAR found using the performance-based mix design for a specific chip seal project. The tack lifter based approach described in subsequent sections quantifies the amount of emulsion that is absorbed into the existing surface on which the new chip seal is to be constructed. With this information, the construction crew can make the proper adjustment to account for the level of absorptivity measured for a specific roadway. The tack lifter consists of a handle affixed to a weighted plate (total weight = 15kg). The height of tack lifter is 50 cm, which was the maximum height that could fit in the environmental chamber used for laboratory testing of the device. Other components for the tack lifter testing include a steel frame which is applied to the application surface prior to tack lifter testing, which prevents emulsion suction into the sorbent sheet from outside the area of tack lifter application during testing. The tack lifter device setup is displayed in Figure 2.12.

14
Figure 2.12. Image of the tack lifter test setup. The absorptive sheet is made of an absorbent polyurethane foam that is a 1/2 inch thick as seen in Figure 2.13, and the density of the sheet is 1.8 pounds per cubic foot. Several shipments of the sheet have been studied in this research effort, and no variability was revealed from shipment to shipment using these commercially available sheets.
Figure 2.13. Image of absorptive tack lifter sheet. The tack lifter test method consists of applying the 5.25 by 5.25 in. steel frame to a surface following emulsion application. A 5 by 5 in. foam sheet is then placed within the frame to absorb emulsion, then the tack lifter is placed on top of the absorptive sheet for 30 seconds. The sheet is then weighed to determine the amount of emulsion absorbed. The tack lifter test method is summarized in Figure 2.14.

15
Figure 2.14. Tack lifter test procedure summary. The original purpose of the tack lifter is to measure the emulsion application rate applied during chip seal construction. However, the device was used in the research for this project to measure the absorptive potential of the existing surface for adjustments to the EAR. In the field study involving the tack lifter device conducted in the summer of 2014, the tack lifter test was conducted on two different surfaces. The first surface was the existing surface of the pavement structure where emulsion was applied for a typical chip seal construction; where the existing surface would absorb some of the applied emulsion. The second surface was a steel plate which represented a surface which would absorb no emulsion, as an experimental control. The tack lifter test sheet on the steel plate has shown to absorb 100% of the applied emulsion rate in lab testing, since no emulsion could be absorbed into the flat steel plate and all of the emulsion is absorbed by the sheet over the measurement area of interest. The ability of the sheet to absorb 100% of the applied emulsion rate on a steel plate is exhibited in tests using the tack lifter on three different emulsion types of CRS-2, CRS-2L, and CRS-1H. In these experiments, the CRS-2 and CRS-2L were tested using an applied EAR of 0.25 gal/sq. yd., while the CRS-1H had an applied EAR of 0.06 gal/sq. yd.

16
Figure 2.15. Tack lifter measured EAR’s on flat steel plate surface. In this figure, the dashed horizontal line represents the 0.25 gal/sq. yd. applied EAR for the CRS-2 and CRS-2L emulsion types; as well as the 0.06 gal/sq. yd. applied EAR for the CRS-1H emulsion. Each bar in Figure 2.15 represents the measured EAR from the tack lifter test conducted on the pan. From the test results, it can be observed that the tack lifter absorbs 100% of the applied emulsion consistently for the emulsion types, and can affectively determine the applied emulsion rate. Meanwhile, for tack lifter tests conducted on an existing surface in the field, such as a chip seal surface, less than 100% can be absorbed by the tack lifter sheet as some emulsion can be absorbed into voids in the existing surface. Using the difference between the measured EAR of the steel plate and existing surface test results, the amount of emulsion absorbed into the existing surface can be determined. Field experiments using this tack lifter based approach were conducted with the help of the NCDOT Division 5 chip seal construction crew. The field trial included application of CRS-2L at a target emulsion application rate of 0.35 gal/sq. yd. The field trial was conducted during the summer of 2014 in Zebulon, North Carolina. Field construction consisted of a chip seal application on a seven year old existing chip seal surface which demonstrated significant surface roughness as shown in Figure 2.16.
Figure 2.16. Rough surface texture of existing chip seal surface at the first field section location.

17
Testing was conducted on the field sections in both the longitudinal and transverse directions as shown in Figure 2.17. Results obtained from five different locations spaced well apart indicate that in this case there was no significant difference in the results found for measurements taken in the longitudinal and transverse directions. In addition, a tack lifter test at each location was conducted on a steel pan (to find the true measured EAR) which was placed on the paving surface before the emulsion distributor applied emulsion.
(a) (b)
Figure 2.17. Field tack lifter test layout in: (a) transverse direction and (b) longitudinal direction. The pad utilized to take EAR measurements using the existing ASTM D2995 method is pictured in Figure 2.17. This data was used for comparison as part of the objectives defined for the NCDOT HWY 2014-03 project. A full report of these findings is detailed in the quarterly reporting for the NCDOT HWY 2014-03 project. Only the tack lifter data relevant to the absorption of the existing surface are provided in this report. The absorption potential of the existing surface can be found by comparing the tack lifter results applied to the surface (TL EAR) with those applied to the pan (pan EAR) for the same location. The difference in measured EAR from these two measurement methods is shown in Figure 2.18. Results indicate that on average, the tack lifter measurements applied to surface absorbs 8.8% less emulsion than the tack lifter on the pan. As observed earlier in this report, the tack lifter on the pan absorbs 100% of the emulsion applied and is representative of the true applied EAR. The tack lifter on the existing asphalt surface absorbs less than 100% as some percentage of the emulsion is absorbed into the existing asphalt surface. In these results, 8.8% of the emulsion applied is absorbed into the existing surface. If absorption is unaccounted for, there can be insufficient emulsion available to properly retain the aggregate. The results in Figure 2.18 show the tack lifter is capable of capturing the absorptive potential of the existing surface in such a way that it can be accounted for in chip seal design.

18
Figure 2.18. Difference in measured EAR between tack lifter on pan and tack lifter on pavement
surface. 2.2.2.1 Additional Site Specific Mix Design Adjustments
Aggregate Penetration
Aggregate penetration is an issue when the existing pavement substrate surface is unusually soft. Constructing a chip seal on a substrate surface that is too soft can lead to premature flushing of the chip seal surface. Aggregate penetration can be tested using the ball penetration test that is specified by TNZ P/17: 2002 (New Zealand specification for bituminous reseals). As recommended in the New Zealand specification, chip seals should not be constructed on a surface with a ball penetration test value greater than 5 mm for the aforementioned premature flushing reason. Currently, the mix design does not adjust for ball penetration values between 0 and 5 mm, although a decrease in binder, as suggested in cases where the ball penetration value is around 3 to 4 mm, should be considered based on engineering experience (New Zealand 2005). However, this issue is not known to be a significant for chip seal practitioners in North America.
Steep Grades
The engineer should be cautious when constructing chip seals on a steep grade (especially an uphill grade), because slow-moving heavy vehicles can cause premature flushing on the surface treatment as the truck tires pick up binder from the chip seal surface (New Zealand 2005). A slight reduction in the binder application rate would help remedy this problem at sites with steep grades. Currently, the mix design does not include an adjustment factor for steep grades. This adjustment should be made based on engineering experience.
0.30
0.31
0.32
0.33
0.34
0.35
0.36
0.37
0.38
0.39
0.40
Tack Lifter on Pan Tack Lifter on Surface
Mea
sure
d E
AR
19
2.3 Validation of Mix Design Method via Laboratory Performance Testing
Before validating the developed mix design method using field trial sections, the mix design was first validated using laboratory performance testing under the MMLS3 accelerated loading device. Chip seal specimens designed using the developed mix design approach performed well in terms of limiting both bleeding and aggregate loss below the respective critical failure thresholds. The experimental design and performance test findings from this laboratory validation effort conducted during the HWY-2008-04 project are revisited in Appendix C of this report for reference.
3. FIELD VALIDATION OF PERFORMANCE BASED MIX DESIGN
For this research, field sections were constructed and monitored in locations within NCDOT Divisions 4, 5, 6, and 10, respectively. Findings from the chip seal section constructions, performance monitoring visits, and laboratory testing of samples collected from the field are included in this report for each division. The field validation findings for sections constructed in Divisions 5 and 10 are included within the main body of this report in the following sections. A summary of the field validation effort on test sections constructed in Divisions 4 and 6 are included in Appendix D. In the sections constructed in Divisions 4 and 6, significant variability found between the measured material application rates and the design target application rates made these sections unable to be used definitively for mix design validation purposes. However, some useful information was gleaned from these field sections and these details are provided in the Appendix. Results from Divisions 5 and 10 also exhibited some construction variability, however the measured EAR and AAR for one section in each Division met the NCSU mix design target rates, which allowed these sections to be used for field validation. At each location, the NCDOT bituminous paving crew from each division constructed 500 ft. chip seal sections using the design EAR/AAR found from the NCSU performance-based mix design procedure developed in previous research. Field sections were also constructed along the same roadway using the target design application rates determined by the NCDOT Division for comparison purposes. Each field section location was selected so that outside sources of variability that could affect section performance (e.g., existing distresses, driveways, road curvature, significant grade changes, etc.) did not influence the experiment. Specimens were extracted after construction from each section in order to ensure the measured application rates for the section was known. After construction, the performance of the sections were evaluated during the 1st year in-service to determine if the sections performed acceptably over time. For many of the sections constructed the measured material application rates varied from the target design rates for both the NCSU and NCDOT designed sections. The research team believes this variability is important to note as future research should be aimed at minimizing this construction variability, so those findings are also included herein. This report will summarize all of the validation work completed during this research, while only the sections that were constructed close to the target design rates will be used for the validation and analysis since

20
the applied aggregate and emulsion rates are critical factors in the performance of a chip seal treatment.
3.1 Division 5 Field Validation Summary
The first construction effort was conducted in Division 5 on Knightdale Eagle Rock Rd. in Knightdale, NC. For this construction effort, granite 78M aggregate and CRS-2L emulsion were used to fabricate the field sections. The field sections were constructed on a roadway with an ADT of approximately 2000 vehicles. Rate verification of each field section was completed using the ignition oven test on the specimens extracted from the constructed field sections. One section was found to have a measured AAR and EAR that is approximately the same as the target emulsion and aggregate application rates determined by the NCSU developed mix design procedure, and therefore was deemed suitable for mix design validation purposes. The performance of this section was monitored at various time periods throughout the life of the seal for evaluation of the mix design performance. In the field construction effort, both single and double seal sections were constructed. Figure 3.1 illustrates the layout of the test sections, and Figure 3.2 shows the existing pavement conditions prior to construction. The existing pavement surface present prior to construction was a chip seal.

21
Figure 3.1. Layout of Division 5 test sections.

22
Figure 3.2. Existing pavement conditions of Division 5 test sections.
Prior to construction of the Division 5 test sections, aggregate was obtained from the quarry and the NCSU developed performance-based mix design was performed to obtain the optimal aggregate application rate (AAR) and emulsion application rate (EAR). The gradation of this aggregate source was then measured in the laboratory and compared against the current NCDOT specification defining acceptable gradation for aggregate used for chip sealing. Figure 3.3 shows the aggregate gradation measured for the aggregate as well as the established NCDOT gradation limits for chip seal treatments. Also, the specific gravity of the aggregate was needed in order to determine the optimal mix design AAR and EAR using the NCSU performance mix design method, and a specific gravity 2.48 was measured in the lab for the granite 78M aggregate.
Figure 3.3. Aggregate gradations for Division 5 test sections.
From Figure 3.3, it can be seen that the measured ‘78M’ gradation is right at the upper limit of the NCDOT gradation requirements for percent passing at two of the control sieves.
0
10
20
30
40
50
60
70
80
90
100
0 5 10 15
% P
assi
ng
Seive Size (mm)
78M
78M Lower Limit
78M Upper Limit
No200,100,50 No16 No8 No4 1/4" 3/8" 1/2"
0 1.18 2.36 4.75 6.3 9.5 12.5

23
In order to conduct laboratory testing, samples were extracted from the field for transporting back to the NCSU testing facility. Figure 3.4 shows the layout of the samples extracted at the Division 5 test sections prior to chip seal construction.
Figure 3.4. Layout of Vialit and MMLS3 samples for Division 5 test sections. 3.1.1 Field Condition and Application Rate Analysis After Construction Figure 3.5 shows the single-seal sections just hours after construction, using the NCDOT and NCSU target design rates, respectively.
Figure 3.5. Single-seal test sections in Division 5: (a) NCDOT and (b) NCSU.
By simply looking at these figures, without considering the actual rates measured for each section, the NCSU section appears to need more aggregate to cover the surface. However, laboratory testing of samples to verify the actual rates applied for these sections reveals that the measured rates varied significantly from the target design rates for both the NCDOT and NCSU

24
single seal sections. Table 3.1 shows the results of the ignition tests for the single seals which reveals the actual measured rates applied at each section. The actual AAR and EAR listed is the average of 6 specimens extracted from each field section.
Table 3.1 Ignition Oven Test Results for Division 5 Single Seals NCSU DIVISION 5
Design Actual % Diff Design Actual % Diff AAR (lb/yd2) 16 14.40 -10.0 22 16.09 -26.9
EAR (gal/yd2) 0.2 0.17 -16.7 0.35 0.20 -43.7
AAR/EAR 80.0 84.7 N/A 62.9 80.5 N/A
From the table, it can be seen that in the case of both sections, the actual rates are lower than the target design rates for both EAR and AAR. However, it was found that the actual measured application rates for the NCDOT section are very close to the NCSU target mix design rates. That is, the constructed NCDOT section turned out to be a section that represents the NCSU mix design rates. The NCDOT Division 5 section had a measured AAR of 16.09 and an EAR of 0.20, which is right at the target NCSU mix design rates. Therefore, the research team decided to use the NCDOT Division 5 section to evaluate the field performance of the NCSU mix design for field validation purposes. The constructed NCSU section had a lower AAR and EAR than the NCSU design rates, which is why the section appeared to lack sufficient cover aggregate after construction in Figure 3.5. These findings demonstrate the need to identify the causes of the lower rates in chip seal construction and to assess the impact of these construction variations on performance in future research. Laser scanning was conducted on the single-seal sections to determine the embedment depths, with three measurements taken per section, as shown in Figure 3.6.
Figure 3.6. Laser scanning of Division 5 test sections.
25
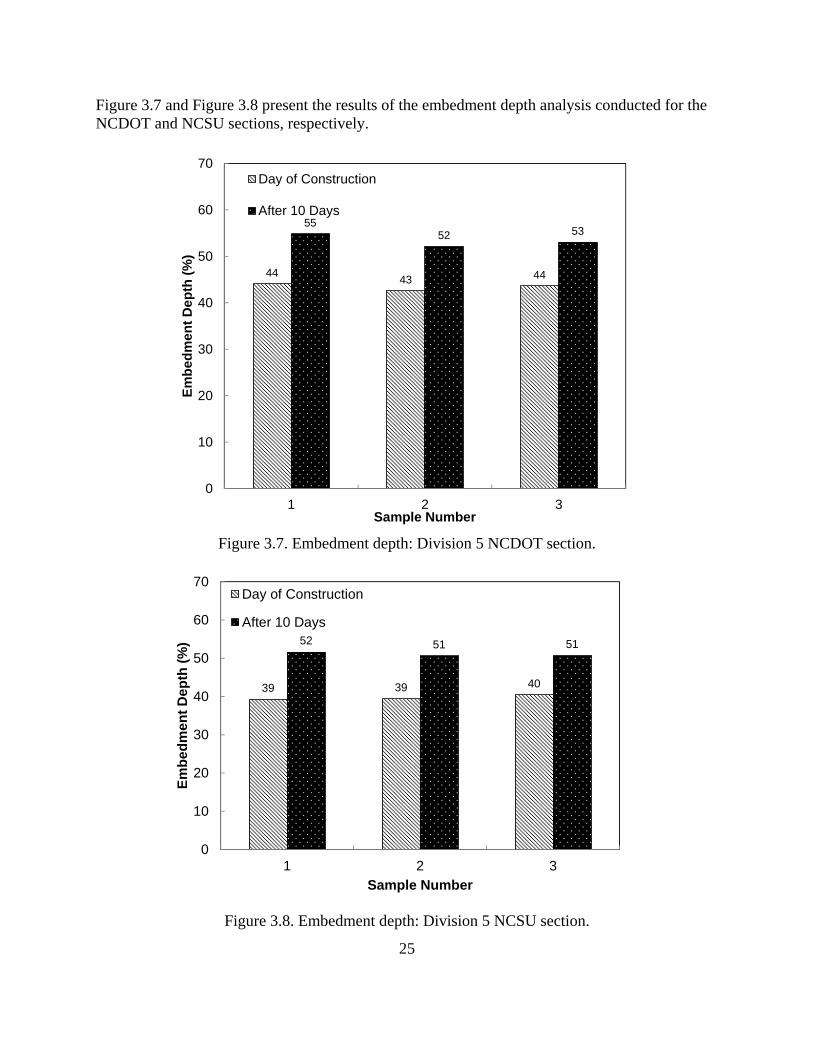
Figure 3.7 and Figure 3.8 present the results of the embedment depth analysis conducted for the NCDOT and NCSU sections, respectively.
Figure 3.7. Embedment depth: Division 5 NCDOT section.
Figure 3.8. Embedment depth: Division 5 NCSU section.
4443 44
5552 53
0
10
20
30
40
50
60
70
1 2 3
Em
be
dm
en
t D
ep
th (
%)
Sample Number
Day of Construction
After 10 Days
39 39 40
52 51 51
0
10
20
30
40
50
60
70
1 2 3
Em
be
dm
en
t D
ep
th (
%)
Sample Number
Day of Construction
After 10 Days

26
In both figures the embedment depth increases after sweeping and ten days of trafficking, as expected. Another observation to be made from these figures is that the embedment depth values on the day of construction are slightly lower than the design embedment depth of 50 percent. It should be mentioned that no sweeping was performed on the day of construction; sweeping took place ten days later. Therefore, the embedment depths determined on the day of construction may not represent the true depth of the aggregate embedment because of the presence of some excess aggregate particles. For both sections, the embedment depths after sweeping and ten days of trafficking were slightly greater than 50%, and the difference in the embedment depths between the two sections was not significant. This finding could be regarded as reasonable because while the measured EAR for the NCDOT section is higher than the rates used for the NCSU section, the AAR is also higher. It is noted that the aggregate embedment depth is affected by the magnitude of the AAR and EAR themselves as well as the ratio of AAR to the EAR. In Table 3.1, the simple ratios of actual AAR and EAR for the NCDOT and NCSU sections are 80.5 vs. 84.7, respectively. A higher AAR to EAR ratio means a “drier” chip seal and therefore a lower aggregate embedment depth would be expected for that section. The higher AAR to EAR ratio observed for the NCSU section may explain the slightly lower embedment depths than the NCDOT section. Also, these ratios from the NCDOT and NCSU sections are quite close, explaining the similar embedment depths determined from these two sections. 3.1.1.1 Double Seal Field Sections Table 3.2 shows the results of the ignition oven tests for the double seals constructed at the same field location in Division 5. It is important to note that all of the constructed double seals used the NCSU mix design target application rates. Three double seal sections were constructed using the following EAR ratios: 40/60, 50/50, and 60/40%. As observed for the single seal sections, the measured EAR/AAR rates for the double seals are also below the target design rates. The target and measured application rates are shown in Table 3.2. The measured emulsion and aggregate application rates reported are from both of the chip seal layers combined.
Table 3.2. Ignition Test Results for Double Seals
0.16-0.24 0.2-0.2 0.24-0.16
Design Actual % Diff Design Actual % Diff Design Actual % Diff
AAR(lb/yd2) 32 30.50 -4.7 32 30.34 -5.2 32 29.54 -7.7
EAR(gal/yd2) 0.4 0.35 -12.7 0.4 0.33 -16.5 0.4 0.31 -21.3
AAR/EAR 80.0 87.1 N/A 80.0 91.9 N/A 80.0 95.3 N/A
3.1.2 Field Performance Monitoring of Sections after Three Months In-Service

27
The field test sections were revisited three months after construction. Figure 3.9 shows images of each single seal section during these visits. A visual observation of the sections and a careful look at the photographs reveal that the NCDOT section was in fairly good condition three months after construction. Again, here it is important to note that the NCDOT section was determined to be constructed to the NCSU mix design rates due to construction variability. Thus, the ‘NCDOT’ section is used to validate the NCSU mix design. The other field section (named the ‘NCSU’ section, but constructed below the target EAR and AAR for the NCSU design) exhibited intermittent bare spots due to a lack of cover aggregate. One issue noted for both single seal sections was some reflective cracking which propagated from the existing surface up through the chip seal surface, as shown in Figure 3.10. This observation suggests that it is not a good practice to construct chip seals without sealing cracks on the existing surface prior to construction.
Figure 3.9. Division 5 sections after revisiting: (a) texture of NCDOT section, (b) NCDOT
section shoulder, (c) texture of NCSU section, and (d) NCSU section’s shoulder.
(a)
(b)
(c)
(d)

28
Figure 3.10. Visual observation of reflective cracking in Division 5.
Laser scanning also was performed on both single seal sections to determine the embedment depth of the sections at various times in the early life of the chip seal sections. Figure 3.11 and Figure 3.12 present the combined results and indicate an expected trend.
Figure 3.11. Embedment depth: NCDOT and NCSU sections.
4340
5351
5552
0
10
20
30
40
50
60
70
DOT NCSU
Em
bed
men
t D
ep
th (
%)
Day of ConstructionAfter 10 DaysAfter 3 Months

29
Figure 3.12. Change in embedment depth: NCDOT and NCSU sections.
These figures show that the embedment depth does not increase significantly after 10 days of field traffic loading, because most of the potential increase in embedment depth already occurred within the first days following construction. This is a reasonable finding as previous research has shown that a majority of the change in surface texture occurs within the first few days in-service, or after the first few thousand vehicles traffic the chip seal. Therefore it makes sense that changes in the embedment depth for a seal, which is related to changes in the surface texture, would exhibit similar asymptotic behavior after some short term traffic loading. 3.1.3 Field Performance Monitoring of Sections After One Year In Service The field condition of the section used for mix design validation purposes after one year is shown in Figure 3.13 through Figure 3.14. The performance after one year gives strong indication as to whether sections constructed using the developed mix design will exhibit satisfactory performance in terms of bleeding and aggregate loss under field traffic loading over a longer period of time. In this section of the report, only the field section that met the NCSU mix design target rates is shown for clarity as the performance of this section alone was used to validate the developed mix design.
40
45
50
55
60
0 30 60 90 120
Embedment Depth (%)
Number of days
DOT
NCSU

30
Figure 3.13. Close-up image within the wheel path of a chip seal section showing no bare spots
or evidence of excessive aggregate loss.
Figure 3.14. Longitudinal image of CRS-2L field validation section after one year in service
showing no evidence of bleeding or aggregate loss issues.
From Figure 3.13 it can be observed that the field validation section that met the NCSU mix design rates did not exhibit aggregate loss performance issues. Figure 3.14 exhibits that bleeding occurred as well after one year in service with the field visit occurring near the end of the second summer in service. From Figure 3.13, it can be seen that the chip seal retained sufficient surface roughness to ensure acceptable skid resistance for braking vehicles. If bleeding/flushing had occurred the residual asphalt would have risen to the surface of the chip seal decreasing the surface texture depth, and the roadway would have a smooth, shiny black surface, which is not observed in the longitudinal views of this section. The findings from this field validation effort shows that the developed mix design for chip seal surface treatments

31
performed acceptably under field traffic and climatic conditions, as it did previously during extensive laboratory testing. 3.2 Division 10 Field Validation Summary
The next single-seal test sections were constructed in Division 10. The materials used were granite aggregate and CRS-2L emulsion. Prior to construction, the aggregate was obtained from the field and brought to the NCSU laboratory for determining the NCSU mix design target application rates. Figure 3.15 shows the gradation of the aggregate used in this construction effort. The aggregate used in Division 10 has a higher flakiness index value compared to the aggregate used for all of the other sections. This means that there were more flat and elongated particles on average in this aggregate source, which is not an ideal aggregate characteristic for chip seal treatments. However, this percentage of flat and elongated particles did not exceed the 10% limit established in the NCDOT Standards and Specification for Roads and Structures (NCDOT 2012). Lastly, the specific gravity for this aggregate was measured to be 2.66 in the lab.
Figure 3.15. Aggregate gradations for Division 10 sections.
Figure 3.16 shows the sections after construction. These photographs were taken before the chip seal had dried; so, although the NCSU section appears to have some dark spots, these darker spots were just due to the uncured state of the surface layer; and in fact the conditions of both sections appeared to be good after construction. The darkened wet spots are visible in Figure 3.16 (b).

32
Figure 3.16. Division 10 sections after construction: (a) NCDOT and (b) NCSU.
Table 3.3 shows the results of the ignition oven testing for the single seals.
Table 3.3. Ignition Test Results for Division 10 NCSU Division 10
Design Actual % Diff Design Actual % Diff AAR (lb/yd2) 12.5 13.1 5.1 15 17.6 17.4 EAR (gal/yd2) 0.23 0.25 7.0 0.3 0.28 -7.5
AAR/EAR 54.3 52.4 N/A 50 62.8 N/A The results in Table 3.3 show that the actual measured field rates and the target NCSU mix design rates are similar. Here, the actual rates are just slightly over the target design rates for the NCSU section. Therefore, this section was deemed appropriate for the mix design validation. Figure 3.17 and Figure 3.18 show the embedment depth results obtained from the sections constructed in Division 10.

33
Figure 3.17. Embedment depth: Division 10 NCDOT section.
Figure 3.18. Embedment depth: Division 10 NCSU section.
53 53
0
10
20
30
40
50
60
70
1 2
Em
bed
men
t D
epth
(%
)
Sample Number
Day of Construction
50 50
0
10
20
30
40
50
60
70
1 2
Em
bed
men
t D
epth
(%
)
Sample Number
Day of Construction

34
The laser results show that the embedment depth of the NCSU section is 50%. This finding makes sense because the actual rates of the NCSU section are fairly close to the target design rates in this section, and the NCSU mix design is based on the 50% embedment depth concept. Figure 3.19 shows the field validation sections one month after construction. Both sections appear to be in relatively good condition after one month in-service. The sections did not show any signs of excessive aggregate loss or bleeding after one month in service. The NCDOT division 10 engineer constructing the sections reported that both sections performed acceptably in his opinion, providing further validation of the developed mix design procedure.
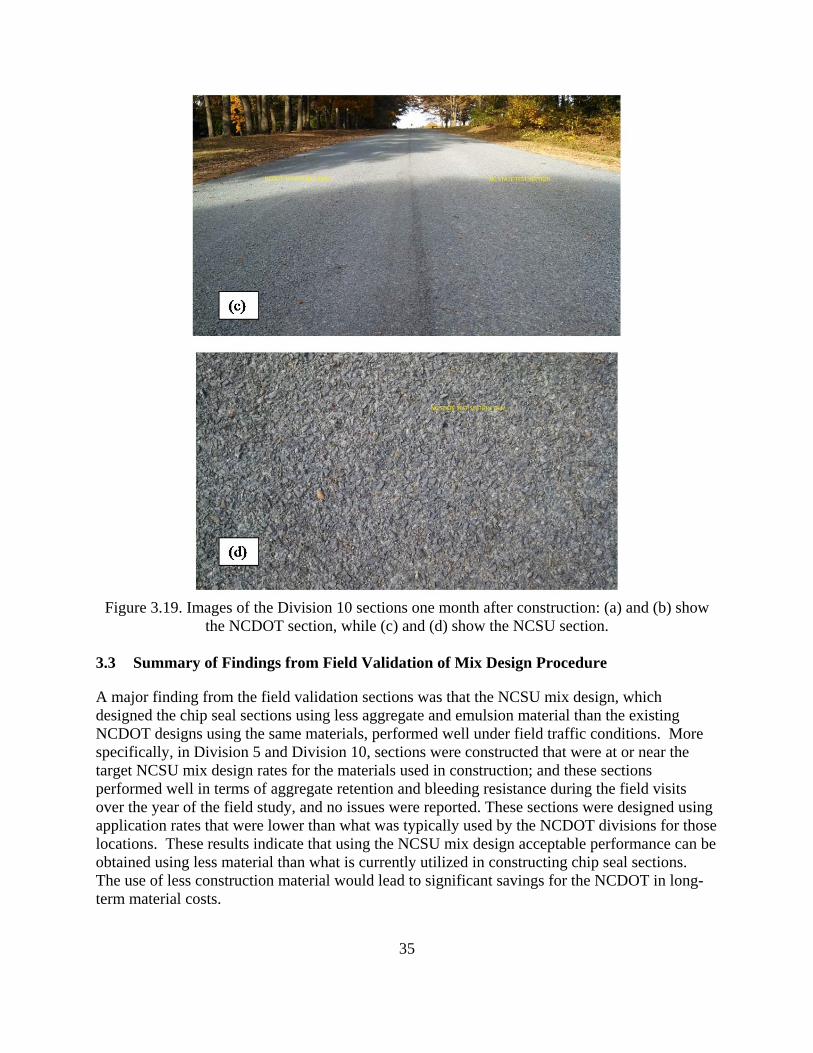
35
Figure 3.19. Images of the Division 10 sections one month after construction: (a) and (b) show
the NCDOT section, while (c) and (d) show the NCSU section. 3.3 Summary of Findings from Field Validation of Mix Design Procedure
A major finding from the field validation sections was that the NCSU mix design, which designed the chip seal sections using less aggregate and emulsion material than the existing NCDOT designs using the same materials, performed well under field traffic conditions. More specifically, in Division 5 and Division 10, sections were constructed that were at or near the target NCSU mix design rates for the materials used in construction; and these sections performed well in terms of aggregate retention and bleeding resistance during the field visits over the year of the field study, and no issues were reported. These sections were designed using application rates that were lower than what was typically used by the NCDOT divisions for those locations. These results indicate that using the NCSU mix design acceptable performance can be obtained using less material than what is currently utilized in constructing chip seal sections. The use of less construction material would lead to significant savings for the NCDOT in long-term material costs.

36
Another significant finding from this field research is that the measured material application rates varies significantly in many cases from the target application rates. This trend was observed for different construction crews in various divisions across the state. It is very important to identify the sources of variability that caused the measured emulsion and aggregate application rates to differ significantly from the target design application rates. These sources of variability should be properly investigated and the effect on the performance of chip seal surface treatments should be studied. Existing research conducted by the research team into the effect of material application rates on chip seal performance suggests that the amount of variation in application rates observed for these field sections is significant enough to effect performance. 3.4 Performance-Based Mix Design Validation Conclusions
The research detailed in this report presents the validation of the developed performance-based chip seal mix design method to be used for constructing effective chip seal surface treatments that perform well with regard to the major performance criteria for a chip seal (i.e., aggregate loss and bleeding). During this mix design validation research, the following conclusions were reached:
The modified three dimensional laser profiler can be used to conduct the performance-based mix design and determine the appropriate design for the specific construction materials to be utilized in chip seal construction.
The developed embedment depth measurement procedure and algorithms were validated using laboratory specimens with controlled geometries and actual chip seal specimens. This validation shows that the algorithm properly determines the embedment depth of chip seals designed for 50% embedment depth.
The embedment depth algorithm is found to adequately capture the embedment depth as a function of changes in material application rate in seal design, and also changes in embedment depth over time due to traffic loading.
The embedment depth algorithm works for significantly different gradations, with different median particle sizes, which are typically used for chip seals.
Comparison of tack lifter device measurements taken on the pan and the existing surface indicate the amount of emulsion that is absorbed by the existing surface after emulsion application.
The findings from the field validation sections constructed using the developed mix design show that the chip seal surface treatments perform well under field traffic and climatic conditions for multiple NCDOT Divisions after over one year in service.
The developed mix design yields acceptable performance while utilizing less material than the existing NCDOT designs for similar materials. This reduction in material cost in many cases could increase the cost-effectiveness of chip seals even further.

37
4. REFERENCES
American Association of State Highway and Transportation Officials (AASHTO). Determining Rutting Susceptibility of HMA Using the Asphalt Pavement Analyzer. AASHTO TP 63-07: Standard Specifications for Transportation Materials and Methods of Sampling and Testing, Washington, DC, 2010. Austroads Incorporated. Sprayed Sealing Guide. Publication No. AP-676/104, Sydney, Australia, 2004, p. 104. Bal, G., J. Patric, R. Stevenson, and P. Herringtong. Assessment of Temperature-Sensitive Bitumen for Chipsealing on New Zealand Roads. Research Report No. 154. Transfund New Zealand Roads, Wellington, New Zealand, 1999.
Benson, F. J. and B. M. Gallaway. Retention of Cover Stone by Asphalt Surface Treatments. Bulletin 133, Texas Engineering Experiment Station, Texas A&M University System, 1953, p. 58. Colas Solutions, Inc. Surface Defects. http://www.colassolutions.com/solutions/defects.html. Accessed November 17, 2011. D’Angelo, J. A., R. Dongre and G. Reinke. Creep and Recovery. Public Roads, Vol. 70, No.5, 2007, pp 24-30.
Estakhri, C. K. and M. A. Gonzalez. Design and Construction of Multiple Seal Coats. Texas Transportation Institute, 1998. Ferry, J. D. Viscoelastic Propertis of Polymers. New York: John Wiley and Sons, 1980. Gransberg, D. D. and D. M. B. James. Chip Seal Best Practices. NCHRP Synthesis 342. Transportation Research Board, National Research Council, Washington, D.C., 2005. Gransberg, D. D., S. Senadheera, and I. Karaca, Analysis of Statewide Seal Coat Constructability Review. Texas Department of Transportation, Publication TX-98/0-1787-1R, Texas Tech University, 1998. F. M. Hanson. Bituminous Surface Treatments on Rural Highways. Proceedings of the New Zealand Society of Civil Engineers, Vol. 21, 1934-1935: 89. Holmgreen, R. J., J. A. Epps, C. H. Hughes, and B. M. Gallaway. Field Evaluation of the Texas Seal Coat Design Method. Research Report 297-1F, Texas Transportation Institute, Texas A&M University System, 1985, p. 174. Jackson, D., N. Jackson, and J. Mahoney. Washington State Chip Seal Study. Transportation Research Record, No. 1259, Transportation Research Board, National Research Council, Washington, D.C., 1990, pp. 1-10.

38
Kearby, J.P. Tests and Theories on Penetration Surfaces. Transportation Research Record: Journal of the Transportation Research Board, No 271, TRB, National Research Council, Washington, D.C. 1953: 232-237. Kim, Y. R. and J. Adams. Development of a New Chip Seal Mix Design Method. Publication HWY-2008-04, N.C. Department of Transportation, 2011. Lawson, W. D., M. Leaverton, and S. Senadheera. Maintenance Solutions for Bleeding and Flushed Pavements Surfaced with a Seal Coat or Surface Treatment. Texas Department of Transportation Research and Technology Implementation Office, Report 0-5230-1, 2007.
Lee, J. and Y. R. Kim. Quantifying the Benefits of Improved Rolling of Chip Seals. HWY-2006-06. FHWA, U.S. Department of Transportation, 2008. Lee, J. and Y. R. Kim. Performance-Based Analysis of Polymer Modified Emulsions in Asphalt Surface Treatments. Publication FHWA-NC-07-06, FHWA, U.S. Department of Transportation, 2009. Lee, J. and Y. R. Kim. Performance-Based Uniformity Coefficient of Chip Seal Aggregate. Transportation Research Record: Journal of the Transportation Research Board, No. 2108, TRB, National Research Council, Washington, D.C. 2009: 53-60. Lee, J. and Y. R. Kim. Performance-Based Evaluation of Asphalt Surface Treatments Using the Third Scale Model Mobile Loading Simulator. North Carolina State University, Raleigh, NC. 2007. Lee, S. and Y. R. Kim. Long-Term Performance Assessment of Asphalt Concrete Pavement Using the Third Scale Model Mobile Loading Simulator and Fiber Reinforced Asphalt Concrete. North Carolina State University, Raleigh, NC. 2003. McHattie, R. L. Asphalt Surface Treatment Guide. Publication FHWA-AK-RD-01-03, Alaska Department of Transportation and Public Facilities, 2001. McLeod, N. W. A General Method of Design for Seal Coats and Surface Treatments. Association of Asphalt Pavement Technology, 1971, pp. 537-628.
North Carolina Department of Transportation. Standard Specifications for Roads and Structures. N.C. Department of Transportation Design Services Unit, 2002. Roque, R., M. Thompson, and D. Anderson. Bituminous Seal Coats: Design, Performance Measurements and Performance Prediction. Transportation Research Record 1300, Transportation Research Board, National Research Council, Washington, D.C., 1991, pp. 90-97.

39
SANRAL (South African National Roads Agency Limited). Surfacing Seals for Rural and Urban Road. Department of Transport, Technical Recommendations for Highways, Pretoria, South Africa, 1998.
Shuler, S. Chip Seals for High Traffic Pavements. Transportation Research Record 1259, TRB, National Research Council, Washington, D.C., 1991, pp. 24-34. Shuler, S. Design and Construction of Chip Seals for High Traffic Volume. Flexible Pavement Rehabilitation and Maintenance. ASTM Special Technical Publication (STP) Number 1348. ASTM, 1998. Shuler, S., P. S. Khandal, and M. Stroup-Gardiner. Flexible Pavement Rehabilitation and Maintenance: Design and Construction of Chip Seals for High Traffic Volumes. 1998, p. 98. Shuler, S., A. Lord, A. Epps-Martin, and D. Hoyt. Manual for Emulsion-Based Chip Seals for Pavement Preservation. NCHRP 14-17, National Cooperative Highway Research Program, Washington, D.C, 2010.
The Asphalt Institute. Mix Design Methods for Asphalt Concrete and Other Hot-Mix Types (MS-2), 6th Ed.,1997, pp. 141.
Transit New Zealand. Notes for the Specification for Bituminous Reseals. TNZ P17 Notes, 2002. Transit New Zealand. Chipsealing in New Zealand. Transit New Zealand, Wellington, New Zealand, 2005.
Wang, Y. Improving Pavements with Long-Term Pavement Performance (LTPP): Products for Today and Tomorrow. Publication FHWA-RD-03-049. FHWA, U.S. Department of Transportation, 2005. Wolshon, B., NCHRP Synthesis 340: Convertible Roadways and Lanes. A Synthesis of Highway Practice, Transportation Research Board, National Research Council, Washington, D.C., 2004, p. 105. Wood, T. J., D. W. Janisch, and F. S. Gaillard. 2006. Minnesota Seal Coat Handbook. Minnesota Department of Transportation, Office of Minnesota Road Research, 2006.

40
5. APPENDICES
5.1 Appendix A: Distresses Types and Factors Affecting Chip Seal Performance
5.1.1 Aggregate Loss
Aggregate loss, also commonly referred to as raveling, is one of the most critical chip seal failure distresses. Generally, most of the aggregate loss of a chip seal occurs during the initial traffic passes once a road is newly opened to traffic. Other major causes of aggregate loss include excessive aggregate application, poor traffic control during construction, inadequate embedment of the aggregate particles into the emulsion (due to hard binder material, or insufficient compaction), poor aggregate gradation qualities, and excessively dusty aggregate (Shuler 1990, Gransberg 2005). Aggregate loss issues due to construction problems usually occur within a few months, and a chip seal with this type of problem should be repaired rather than resealed because a reseal alone will not normally last the expected life of the chip seal (Transit New Zealand 2005). The aggregate properties used in the surface treatment, such as gradation, shape, moisture condition, and dust, play a major role in aggregate retention. Also, the McLeod procedure (McLeod 1969) recognizes that some of the cover aggregate will be forced to the side of the roadway by the initial passing vehicles while the newly sprayed seal coat is still in its initial curing phase. The amount of aggregate that is whipped off in this manner is related to the speed and number of vehicles on the new seal coat. To account for this occurrence, a traffic whip-off factor is included in the aggregate design equation. Reasonable values to assume are 5% for low volume residential types of traffic and 10% for higher speed roadways, such as county roads (McHattie 2001). In addition, aggregate loss reduces the frictional characteristics of the pavement surface, which can result in the loss of skid resistance and cause other associated problems, such as bleeding (Jackson et al. 1990). Although aggregate loss can occur within the wheel path, it is most common in the areas outside of the wheel path where aggregate embedment is not as deep due to less traffic loading (Senadheera and Khan 2001). Early aggregate loss is a phenomenon that occurs under early traffic loading on a newly constructed chip seal surface. Different binders have varying resistance to early aggregate loss when loaded. Though construction and mixture design factors have a large effect on early aggregate loss, this performance characteristic is also shown to be affected significantly by the emulsion type that is used (Lee 2007). Low temperature aggregate loss can occur when the pavement temperature drops and the asphalt binder becomes brittle. In this brittle state, the binder can become less able to withstand the force of traffic loading, which can lead to the loss of aggregate particles from the chip seal. This phenomenon occurs both at night when the temperature tends to drop, and during the cold winter season. Researchers have identified that low temperature raveling is a primary distress in chip
41
seal surface treatments (Walubita et al. 2005). This phenomenon is related directly to the residue characteristics of the binder used in constructing the chip seal.
5.1.2 Stripping
Stripping is defined as the loss of the adhesive bond between the asphalt binder and the aggregate. When stripping occurs, the binder generally migrates to the surface and leads to a loss of texture depth and a decrease in the frictional characteristics of the treatment surface. Essentially, trapped moisture is generally responsible for stripping in chip seal treatments. Moisture trapped within the chip seal air voids, and within the porous aggregate, separates the bond between the asphalt binder and the aggregate particles (Colas Solutions 2010). This phenomenon leads to a loss of cover aggregate and can lead to other distress types in the chip seal treatment. In short, stripping is raveling that is induced through the combined effects of moisture and traffic, and is therefore referred to as wet raveling. Some documents that discuss chip seal surface treatments utilize the term stripping to describe dry raveling. For this research, aggregate loss that can be attributed to moisture damage under loading is considered as stripping.
5.1.3 Debonding
The most common failure modes associated with chip seals are streaking (the debonding of the existing surface and the new chip seal), flushing/bleeding, and the loss of cover aggregate. Streaking is caused by the failure to apply asphalt uniformly inch by inch across the road surface, as shown in Figure 5.1. Streaking is usually caused by the asphalt sprayer’s nozzle being clogged or inoperable during the emulsion spraying phase of construction. With regard to debonding failure, a new chip seal may not have a good bond with an existing roadway surface after construction. This debonding can occur for various reasons, including the presence of high amounts of dust (fine content) on the existing surface, the existing surface being wet or too cold, or the asphalt being too hard. Normally, this failure to establish a good bond with the existing surface causes a problem on a small area of only a few square inches to a few square feet. Occasionally, however, a few square yards or even the entire surface treatment can fail for these reasons (McLeod 1969). A typical debonding failure of a chip seal is shown in Figure 5.2.

42
Figure 5.1. Example of streaking of a chip seal after construction.
Figure 5.2. Example of typical debonding in a chip seal.
5.1.4 Bleeding
Another major long-term distress that appears in chip seals is bleeding, also referred to as flushing (as seen in Figure 5.3). This failure is often caused by the application of excessive asphalt in the mix design phase, which causes the excess asphalt to rise out of the cover aggregate onto the road surface. The phenomenon of bleeding can also occur due to the deep embedment of aggregate into the chip seal or existing pavement surface (Gransberg 2005). Bleeding may also result from aggregate loss at high temperatures due to significant softening of the residual binder which can lead to binder stretching beyond its elastic limit under traffic loading. The main issue with bleeding is the loss of skid resistance associated with the distress, which in turn significantly decreases the overall safety of the road as well as the effectiveness of the chip seal (McLeod 1969, Gransberg 2005). The reduction in surface texture associated with

43
bleeding is the foundation on which the New Zealand chip seal deterioration model is based. The New Zealand specifications indicate that the texture depth after a one-year inspection is the most accurate indication of the performance of the chip seal over its expected life. The chip seal is said to have reached the end of its design life when its texture depth drops below 0.9 mm on a road where vehicles reach speeds higher than 70 km/h on average (Transit New Zealand 2002).
Figure 5.3. Example of partial bleeding failure.
Bleeding is characterized by the appearance of a reflective black surface on the chip seal (Roque 1991). In the latter scenario, aggregate particles dislodge from the chip seal and expose the underlying surface that is coated by the asphalt residue and produces the characteristic shiny surface. Bleeding most often occurs in the wheel path of the roadway where the treatment undergoes the most frequent and consistent loading (SHRP 1993). Figure 5.4 illustrates bleeding in a chip seal surface treatment.

44
Figure 5.4. Bleeding due to heavy truck traffic and hot weather (Lawson et al. 2007).
5.1.5 Flushing
Flushing is the migration of the asphalt binder to the pavement surface at high temperatures, causing a reduction in the surface texture depth of the treatment. Throughout the chip seal literature, the terms bleeding and flushing are used interchangeably to describe two separate phenomena. Therefore, it is important to define the ways these terms are interpreted and used for the purposes of this research. Both bleeding and flushing involve the same basic performance mechanism, which is the reason the terms are often loosely substituted for each other. Both distresses involve excess binder filling the voids and permeating through to the surface. The difference between the two distresses is the underlying cause for the excess binder (Lawson et al. 2007). Figure 5.5 illustrates an example of a flushed chip seal surface treatment. Like bleeding, the primary problem associated with flushing is the loss of skid resistance.

45
Figure 5.5. Example of a flushed pavement surface (Lawson et al. 2007).
5.1.6 Cracking
Cracks that develop in chip seal surface treatments allow water to infiltrate the underlying pavement layers, which can compromise the structural integrity of the pavement system. This infiltration of water into the pavement system can lead to shear failure and permanent deformation in the asphalt surface treatment over time. Cracking in chip seals often occurs during the winter season, but these cracks can, in some instances, self-heal in the summer. However, if the asphalt base layer is exposed to moisture, pavement failure can occur at accelerated rates (Transit New Zealand 2005). Cracking is a broad term that includes multiple types of mechanisms, such as fatigue, thermal/shrinkage, and reflective cracking. Although long-term aged binder performance under repeated loading can be considered a form of fatigue, it is believed that fatigue cracking is not a performance characteristic often exhibited in chip seal surface treatments due to the thin layer of the chip seal itself (Epps et al. 2005). Thermal/shrinkage cracking, also called transverse cracking, is thought to be significant in chip seals because such cracking is related to environmental effects caused by contraction of the asphalt pavement under cold weather conditions. Thermal/shrinkage cracking is associated most closely with the properties of the asphalt binder residue in the chip seal. Researchers consider transverse cracking to be related more to the underlying pavement structure than to the surface treatment itself that provides no structural strength (Walubita et al. 2005). However, some binders have material properties that are more resistant to thermal cracking than others. Another form of cracking that occurs in chip seal surface treatments is reflective cracking, whereby cracks from the underlying surface migrate up through the surface treatment. One of the main features of chip seals is their ability to help mitigate reflective cracking on the pavement surface. The ability to retard reflective cracking is related to the binder material properties of the surface treatment.

46
5.1.7 Rutting
In multilayer chip seal surface treatments, such as triple seals, permanent deformation can occur under repeated loading in the wheel path. This permanent deformation is referred to as rutting. The main problem associated with rutting is that during rainy conditions the rut fills with water, which can lead to dangerous hydroplaning issues for vehicles. Structural deficiencies in the underlying pavement layers can also lead to rutting on the asphalt pavement surface. Any structural deficiencies of the existing pavement surface should be corrected prior to fabricating a chip seal at a given location. However, rutting resistance can be related to material properties of the binder, as the recoverable strain, or high temperature viscosity of the binder, relates to the rate and overall depth of rutting.
5.1.8 Loss of Skid Resistance
Loss of skid resistance associated with an existing asphalt surface is one of the common road conditions that trigger the need for a new surface treatment. One of the major roles of surface treatments, in general, is to provide an increase in skid resistance (Gransberg 2005). Existing surface conditions that indicate that the existence of a potential safety hazard include bleeding and rutting, among others. Skid resistance changes as a function of time. Usually, skid resistance increases in the first two years following construction as the asphalt is worn away by traffic, then decreases over the remaining life of the pavement as the surface aggregate becomes more polished. Skid resistance tends to increase in winter when wet and cold weather roughens the surface, and tends to decrease in the summer. This seasonal variation in skid resistance is significant and should be taken into account when considering the skid resistance of respective locations. Additionally, it is believed that the winter recovery in skid resistance is not enough to balance out the summer polishing of the road surface (Jayawickrama and Thomas 1998, Hunter 2000). 5.1.9 Factors Affecting Chip Seal Performance 5.1.9.1 Aggregate and Emulsion Application Rates One of the most important components of chip seal design and construction is the selection of appropriate application rates. In particular, the application of an excessive amount of aggregate can be problematic in chip seal field construction. If too much aggregate is applied, excess aggregate is whipped off by rapidly moving traffic, which creates a safety hazard and wastes materials. An incorrect assumption often made regarding the over-application of aggregate is that the excess aggregate can simply be swept off the surface, leaving the correct application quantity in place. Although it is reasonable to assume that some traffic whip-off will occur during the initial traffic loading, lack of care and the application of excessive aggregate can be detrimental, resulting in at least two major forms of distress, pavement distress and vehicular distress.

47
Pavement distress occurs when more than one layer of aggregate is present and the excess aggregate on the surface is forced into the layer below. This action causes the aggregate in the first layer to dislodge, therefore leading to loss of aggregate. This dislodgement, in addition to creating early aggregate loss, can potentially lead to flushing issues as well (Shuler 1990). When large quantities of aggregate are applied, the small stones adhere and the large stones are likely to be brushed off (Benson and Gallaway 1953), which affects the grading of the aggregate layer as well. It has been reported that an excess of aggregate material is often more detrimental than a slight shortage of aggregate, in that with an excess of cover material the amount of fines applied is also increased (Kearby 1952).
5.1.9.2 Aggregate Gradation Aggregate gradation also plays an important role in the design, construction, and ultimately the performance of chip seals. Ideally, the specified gradation should be such that the texture of the seal is consistent. Tight gradation bands, which ensure a uniformly graded aggregate with minimal fines and dust, are desirable for an effective treatment. The literature and field surveys indicate that single-sized aggregate with less than 2% fine passing the No. 200 sieve is considered ideal (Gransberg 2005). One advantage of using a single-sized aggregate in a chip seal is that it maximizes the contact area between the tire and the seal surface. This contact increases the frictional area, and in effect, improves the skid resistance as long as the emulsion application rate (EAR) is appropriate (Herrin et al. 1968). Ideally, the aggregate should be as close to uniform size as possible and be economically reasonable, so that the surface treatment has a single aggregate layer. If there is a significant difference between the largest and the smallest particles, the asphalt film may completely cover the smaller aggregate and thus prevent the proper embedment of the larger particles. As a general rule, the largest size aggregate in a surface treatment should be no more than twice the smallest sized aggregate, with a reasonable allowable tolerance for both oversize and undersize to allow for economical surface treatment production (The Asphalt Institute 1964). As the magnitude of the tolerance is increased (for budgetary reasons), it is believed that overall performance quality is decreased. Therefore, depending on the economic conditions, it may be favorable to have higher initial construction costs and obtain close to one size of aggregate that performs well rather than have lower initial construction costs with poor performance. Such poor performance will ultimately lead to high annual maintenance expenses (McLeod 1960). Therefore, state agencies must find a balance between the two alternatives. Additionally, Benson and Gallaway (1959) found that an increase in the fine content from 0 to 30% of the total aggregate causes 10% more aggregate loss. This gradation issue is tied directly to economic considerations, because aggregate costs increase as the gradation requirements for chip seal construction become more restricted. However, in the case where two aggregates are otherwise the same in price and quality, the aggregate that has the uniform gradation is preferred. Kandhal (1987) also reports a reduction in the aggregate retention capabilities of a surface treatment with the use of graded aggregate. These graded stones contain additional smaller particles that tend to fill the voids between large particles and, thus, may not become effectively

48
embedded into the applied asphalt. Performance Uniformity Coefficient (PUC) The aggregate PUC is a performance indicator of aggregate gradation and gives an indication of the uniformity, or lack thereof, of the aggregate source being analyzed. In chip seal surface treatments, gradations that are more uniform perform better than those that are less uniform in terms of the aggregate loss and bleeding failure criteria. Therefore, the PUC of the aggregate source will have an effect on the bleeding and aggregate loss performance of the chip seal surface treatment being constructed (Lee and Kim 2009). The concept of the PUC is founded on principles that are based on McLeod’s chip seal failure criterion. Essentially, McLeod’s premise that 70% embedment is the ideal embedment for chip seal surface treatments is implemented in the PUC definition. The PUC is the ratio of the percentage passing at a given embedment depth (PEM) to the percentage passing at twice the same embedment depth (P2EM) in a sieve analysis curve; or by the equation PUC = PEM / P2EM. The PEM value represents the bleeding failure criterion, and the P2EM value represents the aggregate loss failure criterion with regard to the gradation. The PEM value is defined as the percentage passing that corresponds to 70% (with the subscript ‘E’ in the equation standing for ‘embedment’) of the median particle size on the gradation curve. The P2EM value is defined as the percentage passing that corresponds to 1.4 (or two times the embedment depth, E, of 0.7) times the median particle size, with the median particle size defined as the particle size of which 50% of the gradation passes through the sieve. In the case of a chip seal, the PEM value should be low, because a low percentage of the gradation passing at the bleeding failure criterion indicates that the aggregate particles in that range of the gradation are larger and less susceptible to bleeding than smaller particles would be. Conversely, for the P2EM criterion, if the value is high, the percentage of aggregate particles that do not meet the aggregate loss criterion is low, and therefore less aggregate loss is expected.
Figure 5.6. Explanation of PUC parameter.
Figure 5.6 visually displays the concept behind the PUC. In theory, if the aggregate is embedded in emulsion up to 70% of its median (M) particle size, the particles that are smaller than 0.7M will be submerged completely in the emulsion and, therefore, will experience bleeding. Ideally, then, the smaller particles should be larger than 0.7M to avoid bleeding. Conversely, the particles that are bigger than 1.4M are likely to be lost when trafficked because they will be less than 50%
49
embedded after trafficking. In this case, the larger the coarse aggregate particles, the more likely aggregate loss will occur. Thus, the closer the PUC value is to zero for a particular aggregate gradation, the more uniformly the aggregate is graded. In other words, the PEM value that is closer to 0% and the P2EM value that is closer to 100% indicate a uniform gradation that corresponds to improved chip seal performance; that is, these values indicate less bleeding and a smaller amount of aggregate loss, respectively. 5.1.9.3 Material Selection for Chip Seal Material selection for chip seal design and construction generally is based on product availability, aggregate/emulsion quality, and the climate of the potential construction site. Aggregate selection is a function of geological availability and the distance that the aggregate must be transported. The existing pavement surface, the size of the job, the aggregate gradation, and local climate must be taken into consideration for the asphalt selection process (Gransberg 2005). Typically, aggregate that is positively charge is used with negatively charged emulsion, and vice versa. As aggregate is often based on geological availability, the charge (anionic or cationic) of the emulsion is selected to fit the aggregate. There are a few main emulsion types typically used in a chip sealing application. Generally, rapid setting (RS) binders are used for chip sealing, as the curing characteristics of this binder best match the construction and traffic opening timeline for this surface treatment type. Typical emulsions used for chip sealing include, CRS-2P, CRS-2L, and CRS-2. CRS stands for “cationic rapid setting”, and the number “2” represents the viscosity of the binder (1 or 2 are the typical viscosity grades with a 2 representing a higher viscosity). The “P” and “L” designation represent polymer and latex binder modification, respectively. CRS-2P and CRS-2L are differentiated from CRS-2 in that they are modified binders to improve the performance capabilities of the material. CRS-2P is a polymer modified binder. The polymer used is usually a Styrene-Butadiene-Styrene (SBS) polymer for CRS-2P emulsion. While CRS-2L is a latex modified product. The polymer and latex modification in these binders is intended to improve the aggregate retention capabilities of the binder as the polymer modification improves the elastic range of the material under loading and help resists cohesive failure and improves the binders strain resistance. In some cases, HFRS-2 (high float rapid setting) and HFRS-2P (polymer modified high float rapid setting) emulsions are used. These high float emulsions are often used in Canada and in situations where very low temperatures are expected, as the high float emulsions are not as brittle at low temperatures due to the use of soft binders. Also, as these materials have a gel structure that prevents flow at higher temperatures, thicker films of binder can typically be applied to aggregates in chip sealing which helps with retention. The emulsion type selected for a chip seal construction is dependent upon a few main factors. One factor is the traffic demand (ADT) on the roadway where the chip seal will be applied. Most often, modified binders are used in more critical traffic applications with higher volumes, while unmodified binders are used in lower traffic volume settings. Another factor is cost, as certain polymer modified binders are more expensive to acquire than unmodified binders. Lastly,

50
availability based on location and the ability of the local emulsion suppliers to provide quality material factors into the decision on which emulsion type is used for chip sealing. The specifications for chip seals in North Carolina call for granite (No. 78M for the aggregate size) and CRS-2 or CRS-2L/2P (latex/polymer-modified emulsion) for the emulsion type (NCDOT Standard Specifications for Roads and Structures 2002). The most commonly used size of aggregate for a single seal is a nominal maximum aggregate size (NMAS) of 3/8 in. (9.525 mm) (Gransberg 2005). Lightweight aggregate is also used often as the aggregate material in chip seal construction in North Carolina because it provides a highly skid-resistant surface, good color contrast to improve visibility in daylight and at night, a surface that reduces paint striping maintenance, and it completely eliminates windshield damage caused by flying loose aggregate, which is a major concern associated with chip seal surface treatments (Epps et al. 1974).
5.2 Appendix B: Existing Chip Seal Mix Design Methods
The earliest mix design procedure for chip seals was developed originally by F. M. Hanson (1934/35) in New Zealand. The fundamentals of his mix design methodology are incorporated in all of the major chip seal mix design methods that are currently used worldwide. The newest mix design method to be developed is the 2004 Chip Seal Design Guide from New Zealand (also known as the New Zealand method). In North America, the modified Kearby method and McLeod method are the most widely used chip seal mix design methods (Gransberg 2005). A summary of the Hanson, modified Kearby, McLeod, and 2004 New Zealand design methods are provided in the Table 5.1.
Table 5.1. Summary of Existing Mix Design Methods
Modified Kearby McLeod 2004 New Zealand
Factors for AAR
Board test Aggregate gradation Flakiness index Bulk-specific gravity
of aggregate Loose unit weight of
aggregate Wastage
Aggregate gradation
Flakiness index
Bulk-specific gravity of aggregate
Wastage
Factors for EAR
AAR Bulk-specific
gravity of aggregate
Loose unit weight of aggregate
Traffic correction
Aggregate gradation Flakiness index Traffic correction Bulk-specific gravity
of aggregate Loose unit weight of
aggregate Surface condition Aggregate absorption
Aggregate gradation
Flakiness index
Average daily traffic (ADT)
Percentage of heavy commercial

51
Surface condition correction
Seasonal adjustment
Percentage of residual asphalt in emulsion
Percentage of residual asphalt in emulsion
Traffic volumes
vehicles per day
Texture depth Soft substrate Absorptive
surfaces Steep grades Aggregate
shape Traffic
volumes Embedment
depth Variable in terms of
chip seal mat thickness and aggregate type
65-80% 35%
Lightweight aggregate
Considered in EAR Not considered Not considered
Multilayer Seals
N.A. Available with empirical
guideline Available with
empirical guideline
5.2.1 Hanson Method The Hanson method was designed originally for cutback liquid asphalt, and it is based on the average least dimension (ALD) parameter of the aggregate source used in the mix. The ALD is calculated by using calipers on a representative amount of the aggregate source (at least 200 pieces or more) to obtain a value that represents the aggregate layer in essentially its rolled, compacted state. Hanson observed that when aggregate is dropped from an aggregate spreader onto newly applied fresh asphalt, the voids between the aggregate particles are approximately 50%, meaning 50% of the available aggregate voids are filled with emulsion. His theory was that when the layer is compacted, this value is reduced to 30%, and it is reduced further to 20% when the aggregate is compacted under traffic loading, as displayed in Figure 5.7. Hanson specified the percentage of voids to be filled by residual asphalt to be between 60% and 75%, depending on the type of aggregate and traffic level (Hanson 1934).

52
Figure 5.7. States of embedment of chip seals (Hanson 1934).
5.2.2 2004 New Zealand Method The Hanson method, over time, has evolved into the 2004 New Zealand Design Method. This method was developed as a performance-based chip seal design method that considers the aggregate loss during the first winter after construction as well as the chip seal voids reduction model (Transit New Zealand 2005). One of the major difficulties involved in the design of material application rates, which is addressed in the 2004 New Zealand Method, is non-uniformity of the substrate. The 2004 New Zealand employs a substrate correction factor using the sand circle (sand patch) test for the texture depth of the substrate and the ball penetration test to measure the substrate hardness. The ball penetration test involves measuring the penetration that a 19 mm ball bearing makes in a sample of the substrate after the ball is struck one time with a Marshall hot mix-compaction hammer (The Asphalt Institute 1997). New Zealand reports that, for its location, typical ball penetration values for reseal surfacing are in the range of 2 to 3 mm. In cases where the ball penetration value is greater than 5 mm, the substrate is deemed to be too soft for a chip seal to be constructed. Soft substrates are said to occur when the resealing is over a previous chip seal, or when an asphalt or pavement repair has not fully cured or hardened. The problem with substrate softness is that it can lead to a deeper embedment of the aggregate than if the surface treatment was constructed on a hard substrate. This problem increases the likelihood of premature flushing of the surface.
5.2.3 McLeod Method Throughout the 1960s, McLeod (1969) developed a chip seal design procedure based partially on Hanson’s previous work in the field, and also based on empirical relationships and observations of his own. His method covers both single and multilayer surface treatments and determines the quantity of aggregate, quantity and type of asphalt, and rate of asphalt application. These quantities are determined based on several equations McLeod developed (1969). The equations used to determine the quantity of aggregate needed for a given surface treatment
approx.20%voids
approx.30%voids
Aggregates after trafficking (some breakdown and embedment)
Aggregates after initial rolling
Aggregates dropped at random on aspahalt
Average heightof aggregates
Average heightof aggregates
Average ASTthickness equals
ALD of aggregate
approx.50%voids

53
course are based on the assumption that 80% of the aggregate will ultimately be embedded into the pavement, the aggregate is single-sized (with a slight modification to the equation for graded aggregate), and the aggregate will ultimately be arranged so that the thickness of the aggregate layer is equal to approximately the ALD of the aggregate source. With this method, additional consideration must be given to the type of aggregate, type of supporting layer, climatic variations, etc. The equation used to determine the quantity of asphalt emulsion also is based on several assumptions. One assumption is that 20% of the total surface treatment will be comprised of asphalt (80% embedment of aggregate). Also, it is assumed that the aggregate is single-sized, as with the determination of the aggregate quantity (also containing a modification to the equation for graded aggregate). Lastly, the temperature during measurement is 60°F (otherwise the value must be adjusted). The appropriate asphalt type and grade to be used depends on the aggregate size and surface temperature at the time of application, and are determined by a chart developed by McLeod. The Asphalt Emulsion Manufacturers Association and the Asphalt Institute have adapted and furthered McLeod’s work by providing recommendations for asphalt types and grades for various aggregate gradations, and for correction factors to the AAR based on existing surface conditions.
5.2.4 Kearby Method One of the initial efforts in the United States toward a chip seal mix design was made by Jerome P. Kearby (1953). Kearby developed a design method that determines both the amounts and types of asphalt and aggregate for single seal surface treatments. Kearby’s work resulted in the development of a monograph that provides an asphalt cement application rate in gallons per square yard for the input data of average thickness, percentage of aggregate embedment, and percentage of voids (Kearby 1953). Kearby recommends the use of a uniformly graded aggregate by outlining eight grades of aggregate based on gradation and associated average spread ratios. He also recommends that the combined flat and elongated particle content not exceed 10% of any aggregate gradation requirement. Furthermore, the Kearby method accounts for the effects of existing pavement conditions and traffic volume on the optimal aggregate embedment depth. The percentage of embedment should be increased for hard aggregate and reduced for soft aggregate in the case of chip seals being constructed on an existing hard surface. For chip seals under heavy traffic, the percentage of embedment should be decreased, along with the use of large-sized aggregate particles; and under low volume traffic, the percentage of embedment should be increased, with the use of mainly medium-sized aggregate particles.
5.2.5 Modified Kearby Method In 1974, Epps and his associates proposed a further change to the design curve developed by Kearby for use in chip seals by incorporating the use of synthetic aggregate such as lightweight aggregate (Epps et al. 1974). Based on the high porosity of synthetic aggregate, Epps et al. proposed a curve showing approximately 30% more embedment than the Benson–Gallaway

54
curve (Benson and Gallaway 1953). The rationale for this increase is that high friction lightweight aggregate may turn over and subsequently ravel under traffic. In a separate research effort, Epps et al. (1980) continued the work done in Texas by Kearby (1953) and Benson and Gallaway (1953) by undertaking a research program to conduct field validation of Kearby’s design method. During this study, it was observed that the Kearby design method predicted lower asphalt application rates than those used in the Texas practice, and so the Epps study proposed two changes to the design procedure. The first one was a correction to the asphalt application rates based on the level of traffic and existing pavement conditions. The second change justified the shift of the original design curve proposed by the Kearby and Benson-Gallaway methods, as suggested for lightweight aggregate (Epps et al. 1974). Since then, practitioners and researchers have labeled this design approach the modified Kearby method. In this method, the aggregate application rate (AAR) is determined using the laboratory board test method whereby only one aggregate layer is placed in a ½ yd2 area. The dry loose unit weight and the bulk-specific gravity of the aggregate are determined and used to convert the amount of aggregate to cover the ½ yd2 area to an AAR in the field. The test board is made of plywood with sides framed by 12 mm (1/2 in.) molding strips. The asphalt application rate is determined by an equation that includes the traffic level (vehicles per day per lane), the existing surface conditions, the residual quantity of asphalt in the emulsion or cutback, and field factors based on field experience. According to the study conducted by Epps (1974) on chip seals with lightweight aggregate, the modified Kearby method appears to be the most effective methodology for the prediction of the AAR.
5.3 Appendix C: Laboratory Validation of Chip Seal Mix Design Method
The purpose of performance testing validation is to determine if the proposed mix design procedure designs a chip seal that performs well in terms of aggregate loss and bleeding performance criteria, based on the design EAR and AAR. Thus, the performance testing results should provide verification of the mix design model and its determined rates for the respective material combinations. Table 5.2 gives an overview of the experimental design conducted to assess the performance of the chip seal mix design method. The first step in the experimental design involves the use of optimal AARs for both the lightweight and granite 78M aggregates used in the research. As previously mentioned, the optimal AARs are found using the modified board test described earlier in this document. These rates are 15.5 lbs/yd2 and 6 lbs/yd2 for the granite 78M and lightweight aggregate types, respectively. For each aggregate type, the gradation was varied using the PUC as the representative measure of the gradation. During the sample fabrication process, each sample was made using batched aggregate to control the gradation for that particular sample set. For both types of aggregate, the B gradation is the natural gradation of the aggregate. Gradations A and C are both reasonable gradation intervals from the original. The same PUC was not used for the lightweight and granite aggregates because the natural gradation of the two types is slightly

55
different. Nonetheless, the PUCs of both types of aggregate are close and show similar variation between gradations.
Table 5.2. Full Factorial Combinations of Aggregate and Emulsion.
Granite 78M
(AAR = 15.5 lbs/yd2) Lightweight
(AAR = 6 lbs/yd2)
Grad. A Grad. B Grad. C Grad. A Grad. B Grad.
C
CRS-2L
0.1 gal/yd2
x x x X x x
0.15 gal/yd2
x x x X x x
0.2 gal/yd2
x x x X x x
0.25 gal/yd2
x x x X x x
0.3 gal/yd2
x x x x x x
Further, the emulsion type used for these experiments is CRS-2L, which is cationic rapid setting (CRS) latex-modified emulsion. CRS-2L emulsion was used in this study as it was the main emulsion type utilized in North Carolina chip seal design. The emulsion rates were varied enough to capture the differences in performance as the emulsion rates change from dry of optimum (0.1 gal/yd2) to wet of optimum (0.3 gal/yd2) conditions. For each particular aggregate type/gradation/emulsion rate combination, a minimum of six replicates was fabricated to ensure that each condition was captured with statistical significance in the performance analysis. All samples were tested for aggregate loss and bleeding performance using the MMLS3 testing procedures (2-hour traffic loading at 25°C for aggregate loss and 3 hours at 50°C for bleeding) described earlier.
5.3.1 MMLS3 Aggregate Loss Performance Test Results
One critical performance characteristic measured by the MMLS3 is aggregate loss. The MMLS3 testing procedure involves a two-hour aggregate loss test conducted at 25°C. Prior to the test, the specimen is weighed to determine its weight prior to loading (i.e., at zero loading time). After mounting the samples and allowing the temperature chamber to reach the desired temperature, testing can begin, and the MMLS3 loading is applied for 15 minutes. Then, the test is stopped, and the specimens are removed from underneath the MMLS3 and weighed. This process is repeated at the cumulative testing times of 45 and 120 minutes. Thus, at the end of the two-hour test, specimen weights are available at 0, 15, 45, and 120 minutes. The testing and measurement is stopped after two hours because at the time, aggregate loss is no longer occurring in the seal under MMLS3 traffic loading as the aggregate loss vs. time trend always displays asymptotic behavior (Lee 2007). Thus, the specimen weights are used to determine the aggregate loss for each specimen under MMLS3 traffic loading.

56
Figure 5.8 and Figure 5.9 show the results of the testing for the granite 78M and lightweight aggregates, respectively. Each data point represents six replicate samples for each EAR/AAR combination. Each data point represents the final average cumulative aggregate loss for each sample condition after being tested for two hours under MMLS3 traffic loading.
Figure 5.8. Aggregate loss performance of granite 78M aggregate.
0.0%
1.0%
2.0%
3.0%
4.0%
5.0%
6.0%
7.0%
0.00 0.10 0.20 0.30 0.40
% A
gg
reg
ate
Lo
ss
EAR (gal/sq yd)
Gradation A
Gradation B
Gradation C
Figure 5.9. Aggregate loss performance of lightweight aggregate.
The findings in Figure 5.8 and Figure 5.9 show the effect of gradation on the aggregate loss potential in chip seals. The aggregate retention performance is the best with gradation A and the worst with gradation C. The reason for these findings is that gradation A is the most uniform gradation (i.e., has the lowest PUC), which improves chip seal aggregate loss performance, while gradation C is the least uniform (i.e., has the highest PUC). Thus, a strong relationship exists
0.0%
2.0%
4.0%
6.0%
8.0%
10.0%
12.0%
14.0%
0.00 0.10 0.20 0.30 0.40
% A
gg
reg
ate L
oss
EAR (gal/sq yd)
Gradation A
Gradation B
Gradation C

57
between the aggregate gradation (captured by the PUC parameter) and the aggregate loss performance of the chip seal surface treatment. This finding validates the use of the PUC as an indicator for chip seal performance. The aggregate loss versus EAR relationship is plotted separately for each gradation in Figure 5.10 and Figure 5.11 for the granite 78M aggregate and the lightweight aggregate, respectively. The horizontal dashed line in each graph indicates the maximum allowable aggregate loss (10%) criterion established by the Alaska Department of Transportation (McHattie 2001). Figure 5.10 and Figure 5.11 show that, for all three gradations, as the EAR increases, the aggregate loss decreases which is the expected outcome. The more emulsion in the chip seal specimen, the better the aggregate retention performance (i.e. lower % aggregate loss) as the aggregate embedment depth is higher and better for retaining aggregate particles. The second observation to be made from these two figures is that the lightweight aggregate shows better aggregate retention performance than the granite 78M aggregate for all three gradations. The superior aggregate loss performance of the lightweight aggregate is due to its more uniform natural aggregate gradation as well as the enhanced ability of the latex-modified emulsion to hold lighter weight aggregate than the granite aggregate. Also, the lower density of the lightweight aggregate, makes the aggregate particles easier to retain under traffic loading conditions.
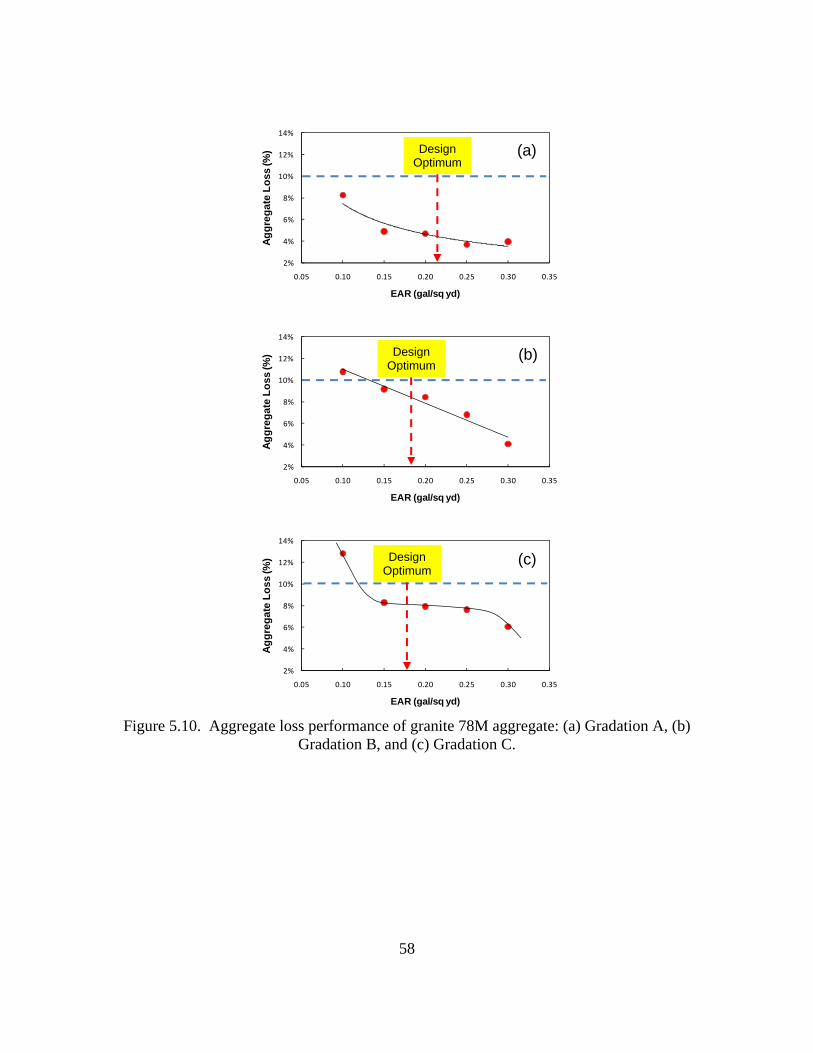
58
Figure 5.10. Aggregate loss performance of granite 78M aggregate: (a) Gradation A, (b)
Gradation B, and (c) Gradation C.
2%
4%
6%
8%
10%
12%
14%
0.05 0.10 0.15 0.20 0.25 0.30 0.35A
gg
reg
ate
Lo
ss (%
)
EAR (gal/sq yd)
2%
4%
6%
8%
10%
12%
14%
0.05 0.10 0.15 0.20 0.25 0.30 0.35
Ag
gre
gat
e L
oss
(%)
EAR (gal/sq yd)
2%
4%
6%
8%
10%
12%
14%
0.05 0.10 0.15 0.20 0.25 0.30 0.35
Ag
gre
gat
e L
oss
(%)
EAR (gal/sq yd)
(a) Design Optimum
(b) Design Optimum
(c) Design Optimum

59
Figure 5.11. Aggregate loss performance of lightweight aggregate: (a) Gradation A, (b)
Gradation B, and (c) Gradation C. In summary, the aggregate loss performance results displayed in Figure 5.10 and Figure 5.11 validate that the optimum rates, as determined by the mix design, performs very well with regard to the aggregate loss performance for all aggregate types and gradations tested. This is evidenced by the fact that the design optimum rates cross the aggregate loss vs. EAR curve below the 10% critical aggregate loss threshold indicating acceptable retention performance.
0%
2%
4%
6%
8%
10%
0.05 0.10 0.15 0.20 0.25 0.30 0.35
Ag
gre
gat
e L
oss
(%)
EAR (gal/sq yd)
0%
2%
4%
6%
8%
10%
0.05 0.10 0.15 0.20 0.25 0.30 0.35
Ag
gre
gat
e L
oss
(%)
EAR (gal/sq yd)
0%
2%
4%
6%
8%
10%
0.05 0.10 0.15 0.20 0.25 0.30 0.35
Ag
gre
gat
e L
oss
(%)
EAR (gal/sq yd)
(a) Design Optimum
(b) Design Optimum
(c) Design Optimum
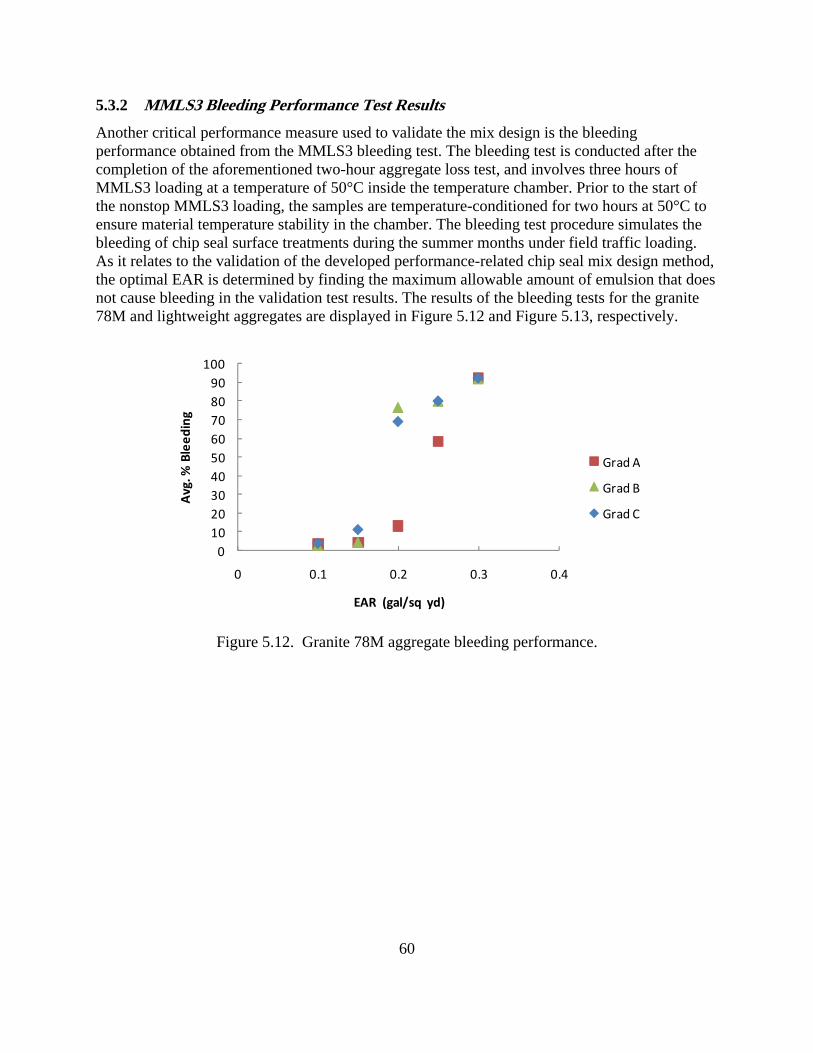
60
5.3.2 MMLS3 Bleeding Performance Test Results
Another critical performance measure used to validate the mix design is the bleeding performance obtained from the MMLS3 bleeding test. The bleeding test is conducted after the completion of the aforementioned two-hour aggregate loss test, and involves three hours of MMLS3 loading at a temperature of 50°C inside the temperature chamber. Prior to the start of the nonstop MMLS3 loading, the samples are temperature-conditioned for two hours at 50°C to ensure material temperature stability in the chamber. The bleeding test procedure simulates the bleeding of chip seal surface treatments during the summer months under field traffic loading. As it relates to the validation of the developed performance-related chip seal mix design method, the optimal EAR is determined by finding the maximum allowable amount of emulsion that does not cause bleeding in the validation test results. The results of the bleeding tests for the granite 78M and lightweight aggregates are displayed in Figure 5.12 and Figure 5.13, respectively.
0
10
20
30
40
50
60
70
80
90
100
0 0.1 0.2 0.3 0.4
Avg. %
Bleeding
EAR (gal/sq yd)
Grad A
Grad B
Grad C
Figure 5.12. Granite 78M aggregate bleeding performance.
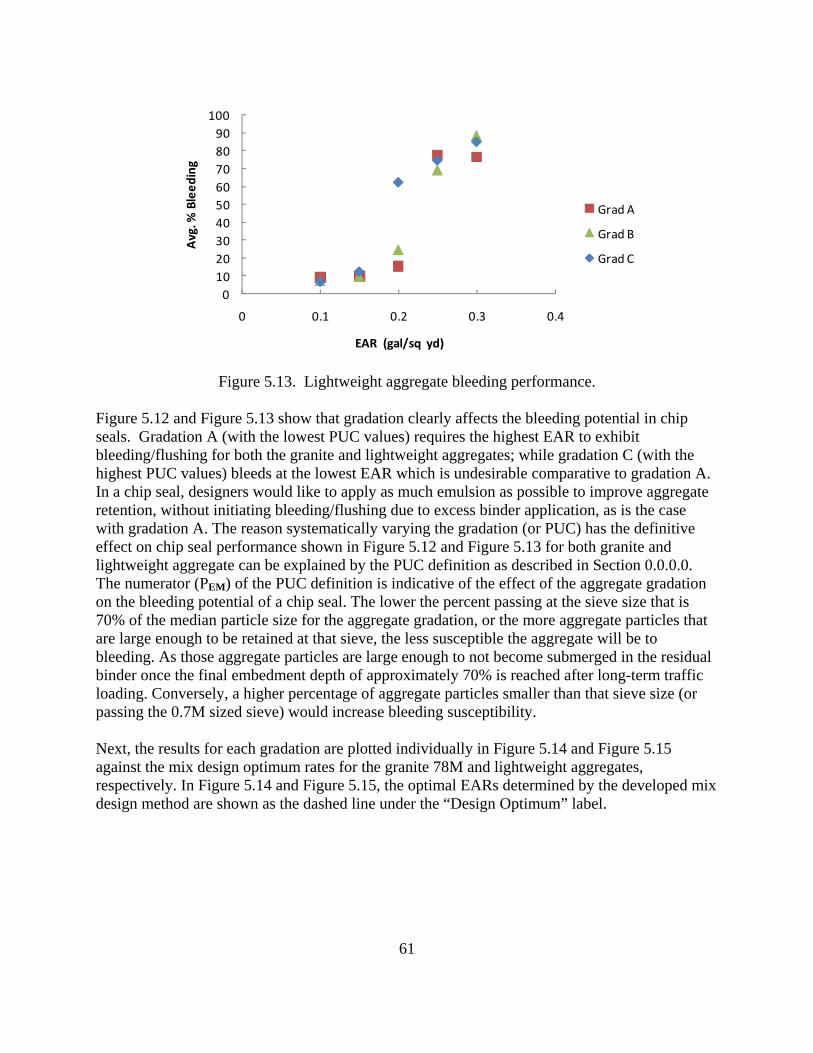
61
0
10
20
30
40
50
60
70
80
90
100
0 0.1 0.2 0.3 0.4
Avg. %
Bleeding
EAR (gal/sq yd)
Grad A
Grad B
Grad C
Figure 5.13. Lightweight aggregate bleeding performance.
Figure 5.12 and Figure 5.13 show that gradation clearly affects the bleeding potential in chip seals. Gradation A (with the lowest PUC values) requires the highest EAR to exhibit bleeding/flushing for both the granite and lightweight aggregates; while gradation C (with the highest PUC values) bleeds at the lowest EAR which is undesirable comparative to gradation A. In a chip seal, designers would like to apply as much emulsion as possible to improve aggregate retention, without initiating bleeding/flushing due to excess binder application, as is the case with gradation A. The reason systematically varying the gradation (or PUC) has the definitive effect on chip seal performance shown in Figure 5.12 and Figure 5.13 for both granite and lightweight aggregate can be explained by the PUC definition as described in Section 0.0.0.0. The numerator (PEM) of the PUC definition is indicative of the effect of the aggregate gradation on the bleeding potential of a chip seal. The lower the percent passing at the sieve size that is 70% of the median particle size for the aggregate gradation, or the more aggregate particles that are large enough to be retained at that sieve, the less susceptible the aggregate will be to bleeding. As those aggregate particles are large enough to not become submerged in the residual binder once the final embedment depth of approximately 70% is reached after long-term traffic loading. Conversely, a higher percentage of aggregate particles smaller than that sieve size (or passing the 0.7M sized sieve) would increase bleeding susceptibility. Next, the results for each gradation are plotted individually in Figure 5.14 and Figure 5.15 against the mix design optimum rates for the granite 78M and lightweight aggregates, respectively. In Figure 5.14 and Figure 5.15, the optimal EARs determined by the developed mix design method are shown as the dashed line under the “Design Optimum” label.
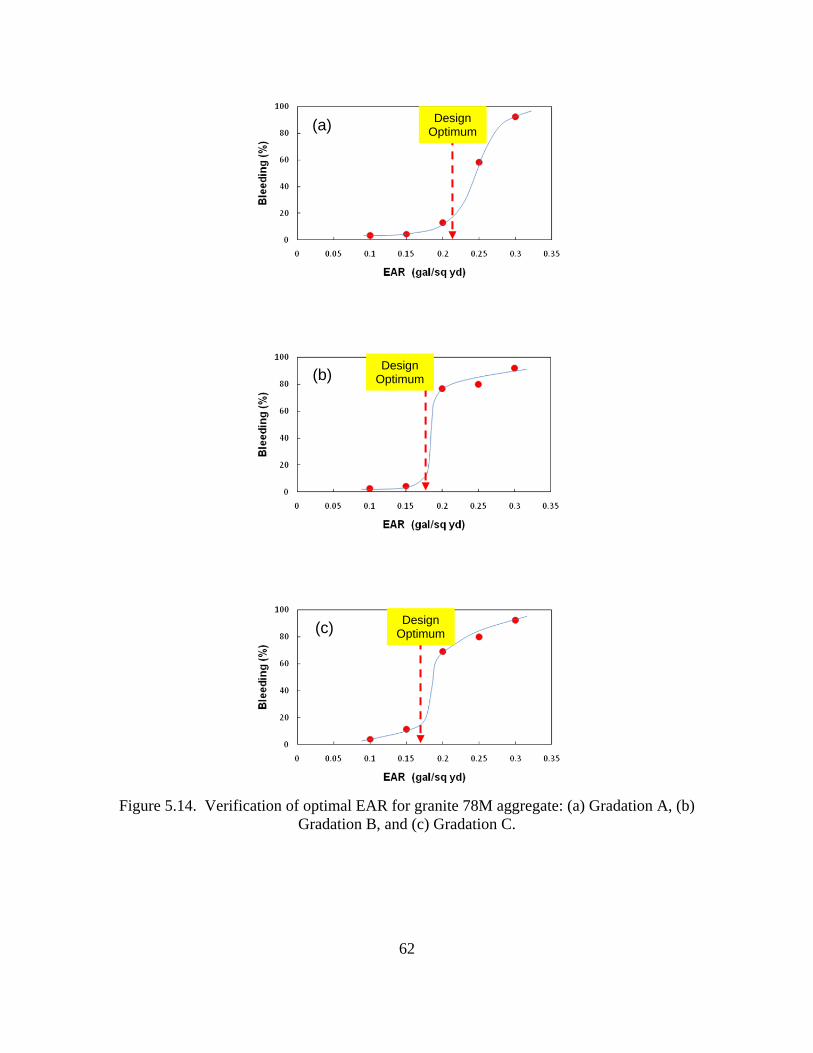
62
Figure 5.14. Verification of optimal EAR for granite 78M aggregate: (a) Gradation A, (b)
Gradation B, and (c) Gradation C.
(a)
(c)
(b)
Design Optimum
Design Optimum
Design Optimum

63
Figure 5.15. Verification of optimal EAR for lightweight aggregate: (a) Gradation A, (b)
Gradation B, and (c) Gradation C. From the bleeding performance tests it can be seen that, as expected, as the emulsion rate increases, the likelihood of the sample bleeding increases as well. Further, it can be seen that each gradation has an EAR level above which the percentage of bleeding increases dramatically,
(a)
(c)
(b)
Design Optimum
Design Optimum
Design Optimum

64
as signified by the spike in bleeding seen in each curve. The optimal EAR based on bleeding performance is determined to be the point immediately before that spike in bleeding occurs. Overall, the figures show that the developed mix design provides a design EAR that yield as much emulsion material as possible, which minimizes the possibility of aggregate loss, without raising the likelihood of bleeding. Another observation to be made is that the mix design optimal EAR decreases as the gradation moves from A to B to C (or as aggregate becomes less uniform). This trend is supported by the bleeding test performance results, shown in Figure 5.14 and Figure 5.15, which further validate the premise that gradation has an effect on chip seal performance. As expected, at extremely low EARs, bleeding does not occur, regardless of the gradation, because not enough emulsion is present to induce bleeding. Conversely, at high EARs, the chip seal will bleed for most gradations, as displayed in Figure 5.12 and Figure 5.13. Thus, for all gradations to converge at 0.1 and 0.3 is a logical occurrence. Also, all general trends with regard to the EAR and gradation effects on bleeding performance are the same for both the granite 78M and lightweight aggregate types.
5.3.2.1 Investigation into Bleeding Performance of Granite Aggregate Gradation B
Further investigation into the bleeding performance results for the granite 78M gradation B (the natural gradation of the aggregate) was needed since the design optimum EAR determined using the mix design is close to the EAR where the bleeding potential increases drastically, as shown in Figure 5.16. Therefore, additional testing was conducted to ensure that the chip seal specimens do not exhibit high measured % bleeding exactly at the design optimum EAR of 0.18 gal/yd2. The CRS-2L emulsion used for this additional testing was obtained from the same emulsion company that provided the CRS-2L emulsion used in the original testing. The only difference between these two emulsions is that they were obtained at different times, albeit from the same supplier using the same formulation. As the properties of the base asphalt manufacturers use in their emulsion formulation can change over time (even when the same PG grade of base binder is used in the emulsion formulation as in this case), the two CRS-2L emulsions are shown separately in the results. However, no existing research has been conducted that determined that any difference in the original base asphalt, due to natural variability in crude oil source from which the base asphalt is refined, has any significant effect on performance in chip seal. The asphalt supplier reported that the base asphalt for both CRS-2L emulsions acquired for this research are the same original PG grade (PG64-22), and that there have been no major changes in the emulsion formulation or fabrication method. The original emulsion is denoted at CRS-2L-1 while the emulsion used for the additional investigation into bleeding performance is designated as CRS-2L-2. The additional testing was conducted on MMLS3 specimens fabricated at EAR’s of 0.15, 0.18, and 0.21 gal/yd2; at the design optimum AAR of 15.5 lbs/yd2.

65
Figure 5.16. Bleeding vs. EAR for granite 78M gradation B shown along with the mix design
optimum EAR.
Figure 5.17. Bleeding vs. EAR for granite 78M gradation B with additional testing.
0
20
40
60
80
100
0 0.05 0.1 0.15 0.2 0.25 0.3 0.35
Ble
ed
ing
(%
)
EAR (gal/sq yd)
0
20
40
60
80
100
0 0.05 0.1 0.15 0.2 0.25 0.3 0.35
Ble
ed
ing
(%
)
EAR (gal/sq yd)
CRS-2L-1
CRS-2L-2

66
The results in Figure 5.17 show that the chip seal specimens do not exhibit bleeding behavior at the mix design EAR of 0.18 gal/yd2. This indicates that the point at which bleeding potential significantly increases is higher than the EAR yielded by the mix design, and that the mix design effectively resists bleeding/flushing in chip seal specimens.

67
5.4 Appendix D: Summary of Findings from Construction in Divisions 4 and 6
5.4.1 Division 4 Test Sections The next single seal test sections were constructed in Division 4. The materials used for constructing these sections were granite aggregate and CRS-2L emulsion. Figure 5.18 shows that the aggregate gradation fits inside the NCDOT specified gradation limits. Also, for this aggregate the specific gravity was measured to be 2.63.
Figure 5.18. Aggregate gradation for Division 4 test sections.
Figure 5.19 shows the condition of the existing surface where previous cracks had been sealed prior to the new chip seal construction. The figure also shows the layout of the Vialit and MMLS3 samples that were extracted from the field after construction. Although pick up of aggregate was not determined to be an issue for 78M aggregate based on observations made during field construction, an extra section was constructed in Division 4 to investigate the effect of extra aggregate applied to account for potential pickup. In this section, the NCSU design AAR was increased by 10% with the intent of studying the effect of that increase on the aggregate retention and resultant embedment depth.
0
10
20
30
40
50
60
70
80
90
100
0.0 5.0 10.0 15.0 20.0
% P
as
sin
g
Sieve Size (mm)
78M
78M Lower Limit
78M Upper Limit
No200 No8 No4 3/8" 1/2" 3/4"
0 2.36 4.75 9.5 12.5 19

68
Figure 5.19. Existing conditions and layout of Vialit and MMLS3 samples in Division 4.
Table 5.3 shows the results of the ignition tests for the single seal sections constructed to determine the actual application rates, and the percent difference from the target design rate.
Table 5.3 Ignition Test Results for Division 4 NCSU NCSU-AAR Adjusted +2 Division 4
Design Actual
% Diff
Design Actual % Diff Design Actual % Diff
AAR (lb/yd2) 16 15.64 -2.2 18.0 19.6 9.0 20 20.74 3.7 EAR (gal/yd2) 0.3 0.19 -36.5 0.3 0.2 -37.0 0.25 0.18 -28.8
AAR/EAR 53.3 82.3 N/A 60 98 N/A 80 115.2 N/A As indicated in this table, the construction crew from Division 4 applied an aggregate application rate that was close to the design AAR, especially in the case of the NCSU and Division 4 designs. However, the applied emulsion application rate was well under target in all cases. This variability in construction again demonstrates the need for identifying the causes of the lower rates in the emulsion application rate for chip seal construction and assessing the impact of them. Although the EAR was off target, valuable information can nonetheless be gleaned from these sections because the EARs are almost the same for the three sections and only the AAR changes. So, the effect of AAR can be investigated for Division 4. Figure 5.20 shows a single Vialit sample extracted from each of the constructed field sections.
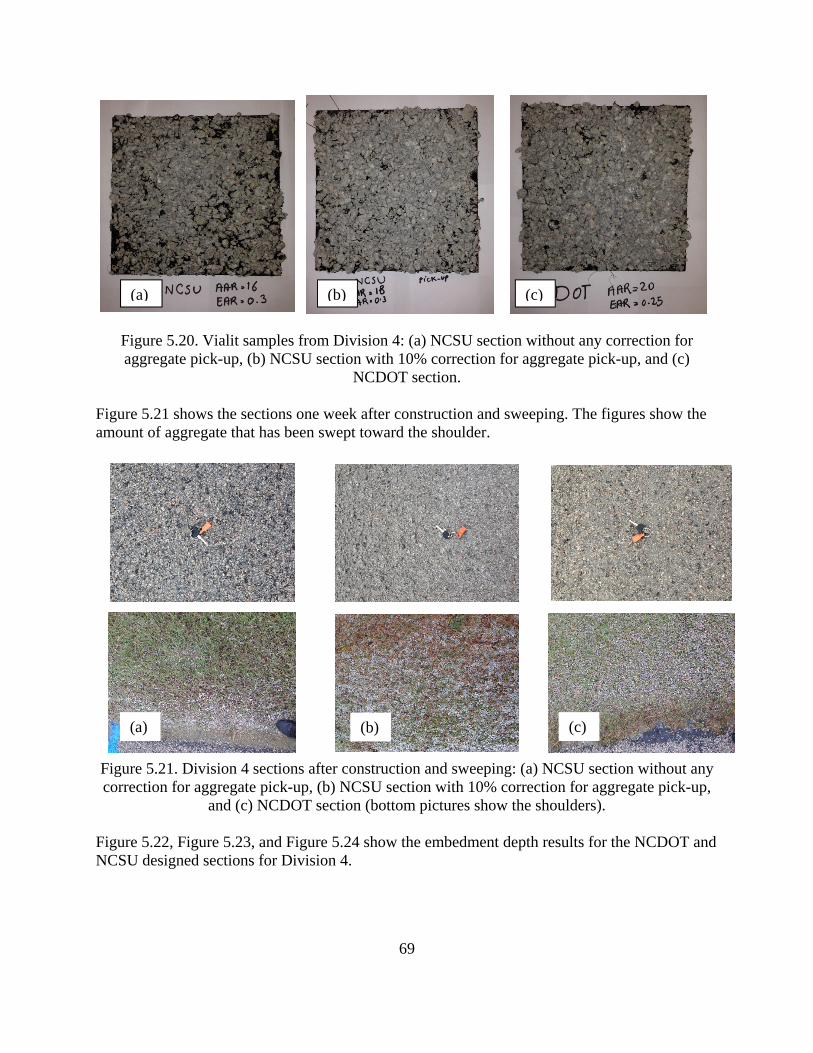
69
Figure 5.20. Vialit samples from Division 4: (a) NCSU section without any correction for aggregate pick-up, (b) NCSU section with 10% correction for aggregate pick-up, and (c)
NCDOT section.
Figure 5.21 shows the sections one week after construction and sweeping. The figures show the amount of aggregate that has been swept toward the shoulder.
Figure 5.21. Division 4 sections after construction and sweeping: (a) NCSU section without any correction for aggregate pick-up, (b) NCSU section with 10% correction for aggregate pick-up,
and (c) NCDOT section (bottom pictures show the shoulders).
Figure 5.22, Figure 5.23, and Figure 5.24 show the embedment depth results for the NCDOT and NCSU designed sections for Division 4.
(a) (b) (c)
(a) (b) (c)

70
Figure 5.22. Embedment depth: Division 4 NCDOT section.
Figure 5.23. Embedment depth: Division 4 NCSU design section.
3436
41 41
0
10
20
30
40
50
60
70
1 2
Em
bed
men
t D
ep
th (
%)
Sample Number
Day of Construction
After 7 Days
38 39
44 44
0
10
20
30
40
50
60
70
1 2
Em
be
dm
en
t D
epth
(%
)
Sample Number
Day of Construction
After 7 Days

71
Figure 5.24. Embedment depth: Division 4 NCSU-corrected section.
It should be noted that the embedment depth observed for the NCDOT designed section is lower than the NCSU designed sections. This is likely because the NCDOT designed section had the lowest measured EAR and the highest measured AAR, which means there were less voids filled with emulsion resulting in a lower embedment depth. Also, while both of the NCSU sections were designed using the 50% mix design embedment depth concept, the actual embedment depth is measured to be below 50% in both of these sections. This is believed to be due to the significant under-application of the emulsion from the mix design target, as the measured EAR were found to be approximately 35% below the target emulsion application rate for both sections, while the AAR was relatively close to the target. 5.4.1.1 Field Performance Monitoring of Sections after Three Months In Service The sections constructed in Division 4 were revisited three months later for further analysis. Figure 5.25 through Figure 5.27 displays the significant roughness for the Division 4 field test sections.
38 39
43 44
0
10
20
30
40
50
60
70
1 2
Em
be
dm
en
t D
ep
th (
%)
Sample Number
Day of Construction
7 Days later

72
Figure 5.25. Longitudinal view of Division 4 NCDOT section.
Figure 5.26. Close view of Division 4 NCDOT section three months after construction.
Figure 5.27. Close view of Division 4 sections three months after construction.
All of the constructed field sections appear to be very rough in texture, likely due to the measured EAR being significantly below the target design EAR, while the aggregate application rate is close to the target design AAR. This leads to the lower embedment depth in the seals, as shown in the previous figures, and therefore a rougher surface texture for the seals. Furthermore, all the sections looked almost the same after three months, despite the significant difference in the measured AAR between the sections. However, the amount of aggregate loss could have differed significantly, but was not captured for these sections. Laser scanning was planned for

73
these sections to obtain the three month embedment depth, but unfortunately, there were technical difficulties which prevented the data from being properly captured. 5.4.2 Division 6 Field Test Sections The next single seal test sections were constructed in Division 6. The materials used for this construction effort were lightweight aggregate and CRS-2L emulsion. Prior to construction, the aggregate was obtained from the quarry and brought to the NCSU lab for determining the mix design and appropriate application rates. Figure 5.28 shows the aggregate gradation of the lightweight aggregate plotted against the NCDOT specification upper and lower gradation limits. Also, the specific gravity of 1.65 was found for this aggregate.
Figure 5.28. Aggregate gradations for Division 6 test sections.
Figure 5.29 shows the field test sections immediately after construction. As with all the constructed sections, several Vialit samples were taken from a defined sampling area in the field sections and were used for application rate validation. Laser scanning also was performed on each section to obtain the embedment depth measurements.
0
10
20
30
40
50
60
70
80
90
100
0 2 4 6 8 10 12 14
% P
assi
ng
Sieve Size (mm)
LW
Lower Limit
Upper Limit
No100,200 No8 No.4 3/8" 1/2"
0 2.36 4.75 9.5 12.5

74
Figure 5.29. Single seals after construction in Division 6: (a) NCDOT section and (b) NCSU
section. In analyzing the images in the figure above it can be seen that the NCSU section appears to require more aggregate to cover the whole surface more evenly than the NCDOT section. However, again this is due to construction variability that caused the actual measured application rates to be less than the target design rates for both the NCDOT and NCSU designed sections. This can be observed in Figure 3.3 that lists the results of the ignition oven tests for determining the true application rates for the single seal sections.
Table 5.4 Ignition Test Results for Lightweight Aggregate in Division 6
NCSU DIVISION 6 Design Actual % Diff Design Actual % Diff
AAR (lb/yd2) 7.8 6.58 -15.6 11 8.95 -18.6 EAR (gal/yd2) 0.28 0.23 -18.4 0.35 0.27 -24.2
AAR/EAR 27.9 28.6 N/A 31.4 33.1 N/A
As was the case in Division 5 discussed previously, the actual NCDOT emulsion application rate for the Division 6 NCDOT section was close to the target emulsion application rate determined by the NCSU mix design. While the AAR for the NCDOT Division 6 section was about 1 lb/sq. yd. higher than the NCSU target design AAR. Again here, both sections had measured application rates lower than the targeted design rates. One important observation that was made during the field construction is that, due to the lower density of the lightweight aggregate as compared to the 78M aggregate, ‘pickup’ was evident on the tires of the trucks, as shown in Figure 5.30. This ‘pickup’ is defined as the aggregate being removed from the freshly constructed chip seal surface by the tires of the construction equipment. Such pickup can cause small intermittent bare spots on the seal when the seal is designed for a true single layer. Thus, some adjustment factor is needed to account for pickup of lightweight aggregate in the field.
(b) (a)
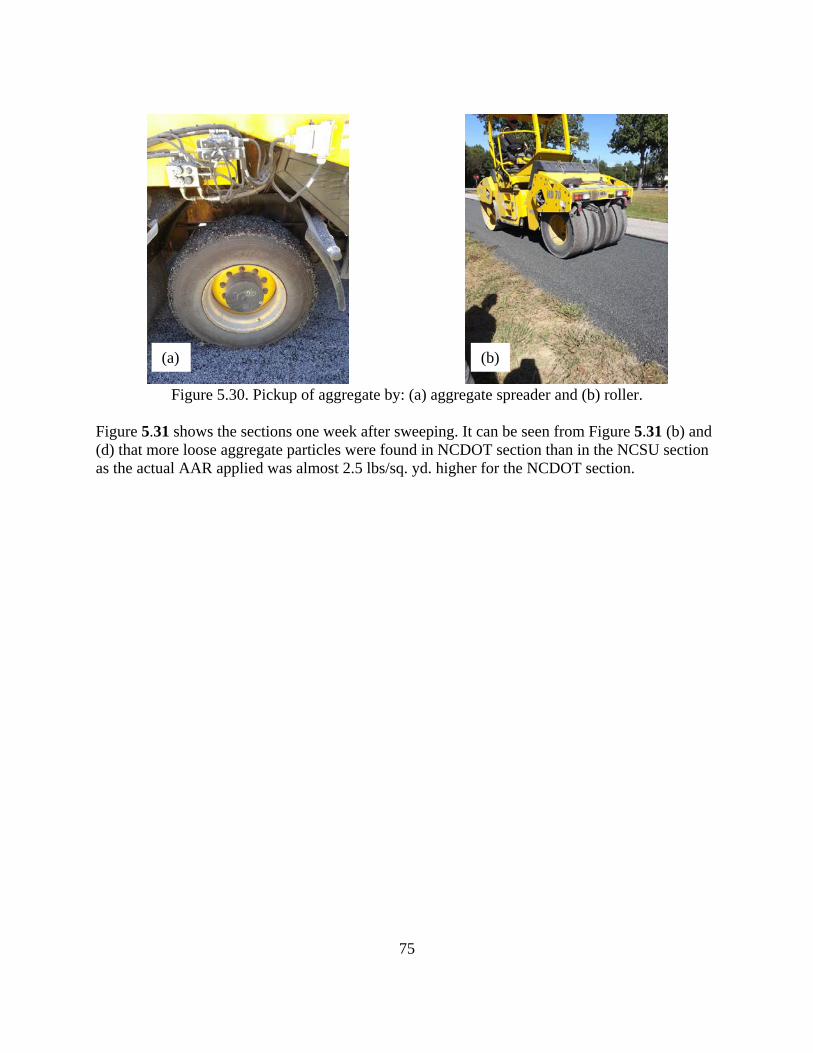
75
Figure 5.30. Pickup of aggregate by: (a) aggregate spreader and (b) roller. Figure 5.31 shows the sections one week after sweeping. It can be seen from Figure 5.31 (b) and (d) that more loose aggregate particles were found in NCDOT section than in the NCSU section as the actual AAR applied was almost 2.5 lbs/sq. yd. higher for the NCDOT section.
(b) (a)

76
Figure 5.31. Sections after sweeping in Division 6: (a) NCDOT section’s texture after sweeping, NCDOT section’s shoulder after sweeping, (c) NCSU section’s texture after sweeping, and (d)
NCSU section’s shoulder after sweeping.
Figure 5.32 and Figure 5.33 show the embedment depth results for the NCDOT and NCSU sections, respectively, for Division 6 on the day of construction and 10 days after construction.
(a)
(b)
(c)
(d)

77
Figure 5.32. Embedment depth: Division 6 NCDOT section.
Figure 5.33. Embedment depth: Division 6 NCSU section.
52 5254
56 56 57
0
10
20
30
40
50
60
70
1 2 3
Em
bed
men
t D
epth
(%
)
Sample Number
Day of Construction
After 10 Days
47 49 4852 53 52
0
10
20
30
40
50
60
70
1 2 3
Em
bed
men
t D
ep
th (
%)
Sample Number
Day of Construction
After 10 Days