Field Analytical Methods
71
Dynamic Field-Based Strategy for Dynamic Field-Based Strategy for
description
Dynamic Field-Based Strategy for. Field Analytical Methods. Start: “Define the nature and extent of contamination.”. 1. 2. 3. 2. 3. 2. 1. We need more information. 2. 1. It ends when the $$ runs out!!. EXIT ??. EXIT ??. EXIT ??. EXIT ??. Closeout. Start here. - PowerPoint PPT Presentation
Transcript of Field Analytical Methods

1
Dynamic Field-Based Strategy forDynamic Field-Based Strategy for

2
1
12
1
2
2
2
We need more information
3
3
It ends It ends when the when the $$ runs $$ runs
out!!out!!
Start: “Define the nature and extent of contamination.”Start: “Define the nature and extent of contamination.”

3
• Identify the site and Identify the site and rapidlyrapidly charge into the maze charge into the maze
• 1980s:1980s:– Work needed to be Work needed to be
accomplished right awayaccomplished right away– Limited experience, Limited experience,
knowledgeknowledge– Few tools available for Few tools available for
monitoring or cleanupmonitoring or cleanup
Starthere
Closeout EXIT ????
EXIT ????
EXIT ????
EXIT ????
The Historical Process

4
• Perspectives first--take Perspectives first--take stock of the problem; stock of the problem; define clear goalsdefine clear goals
• Chart an efficient Chart an efficient course toward goals; course toward goals; map a site strategy that map a site strategy that uses smart toolsuses smart tools
• ONLY THEN begin field ONLY THEN begin field work, and navigate work, and navigate intelligently toward intelligently toward goalsgoals
Begin Begin onlyonly when readywhen ready
Closeout EXITToday: Optimizing the Process

5
PRO
JEC
T E
XE
CU
TIO
N S
TYLE
PRO
JEC
T E
XE
CU
TIO
N S
TYLE
TIMETIME
PLANPLAN Do CheckCheckFi
nish
IDEAL COMMITMENTTO PROJECT PLANNING
Too much commitment to project planning.
Too little commitment to project planningToo little commitment to project planning
Performance ManagementPerformance ManagementEffective and Timely PlanningEffective and Timely Planning

6
SystematicPlanning
DynamicWorkplans
On-siteMeasurementTechnologies
The Triad Approach to Optimization

7
• All phases of the remedial “pipeline” can All phases of the remedial “pipeline” can benefit from the adoption of the triad benefit from the adoption of the triad approachapproach
Site InvestigationSite Investigation
Remedial ActionRemedial ActionLong Term MonitoringLong Term Monitoring
Applications to Clean-up

8
DefineDefineClean-up GoalsClean-up Goals
Select Best Select Best TechnologyTechnology
Performance ParameterSelection
Performance Evaluation
Proceed with data collection Proceed with data collection effort with end goal decision effort with end goal decision
objectives defined objectives defined
Review & OptimizeReview & Optimize• TechnologyTechnology• Monitoring PlanMonitoring Plan• Clean-Up GoalsClean-Up Goals• OperationOperation• Data IssuesData Issues
IsSystem
PerformingOK
NO
YES HaveGoalsBeenMet
YES
NO
AreObjectives
BeingMet
YES
NO
PERIODIC CONSULTATION & REVIEWPERIODIC CONSULTATION & REVIEW
Field Based Analytical Strategies

9
FewFew higher quality higher quality data data pointspoints LowerLower information value of information value of the data the data setset
ManyMany lower quality lower quality data data pointspoints HigherHigher information information value of the data value of the data setset
Goal: A defensible site decision that reflects the “true” site condition
Less likely More likely
$ $ $
$ $ $
¢ ¢ ¢ ¢ ¢ ¢ ¢ ¢ ¢ ¢ ¢ ¢ ¢ ¢ ¢ ¢ ¢ ¢ ¢ ¢ ¢ ¢ ¢ ¢ ¢ ¢ ¢ ¢ ¢ ¢ ¢ ¢
Data Quality vs. Information Value

10
• Assembling the technical Assembling the technical teamteam
• Getting the right people Getting the right people involvedinvolved
• May be outside the May be outside the “normal” field-based team“normal” field-based team
• statistician, hydrologist, statistician, hydrologist, biologist, chemistbiologist, chemist
Technical Team Development

11
• Assessing team dynamics, Assessing team dynamics, expertise, and other constraints expertise, and other constraints
• Evaluating in-house optionsEvaluating in-house options• Identification of and resources Identification of and resources
to mitigate contingencies to mitigate contingencies • Determining the budgetDetermining the budget• Establishing the scheduleEstablishing the schedule
Evaluating Resources and Constraints

12
• Determine who needs Determine who needs to give input on each to give input on each type of decisiontype of decision
• Specify lines of Specify lines of communication for communication for field decisionsfield decisions
• Assess options for Assess options for data transferdata transfer
Develop a Communications Strategy

13
• Group Similar Data NeedsGroup Similar Data Needs• Identify Data Need OverlapsIdentify Data Need Overlaps
– Balancing Sensitivity RequirementsBalancing Sensitivity Requirements– Meeting Process Requirements Meeting Process Requirements
RiskCompliance
Remedy
Responsibility
GW Data Needs
SW Data Needs
Sift and Sort Data Needs

14
Integrating New Information• Developing a Developing a
conceptual site model conceptual site model (CSM)(CSM)
• A mechanism to A mechanism to communicate key site communicate key site featuresfeatures
• A visual representation A visual representation of dataof data
Conceptual Site Model

15
• What you are going to What you are going to monitormonitor
Identifications of COCs
• ID the waste or mediumID the waste or mediumof interestof interest
• dependant on fate and transport dependant on fate and transport potential, exposure scenarios, potential, exposure scenarios, bioavailabilitybioavailability
• general chemistry:general chemistry:DO, pH, TOC, bicarbonate.. DO, pH, TOC, bicarbonate..

16
• Define Regulatory RequirementsDefine Regulatory Requirements• Establish Background and/or Establish Background and/or
Anthropogenic Levels for Anthropogenic Levels for Inorganic/Organic ParametersInorganic/Organic Parameters
• Determine Preliminary Risk-Based Determine Preliminary Risk-Based Cleanup GoalsCleanup Goals
• Evaluate Practicability to Meet Cleanup Evaluate Practicability to Meet Cleanup GoalsGoals
• Establish Clean-up Goals with Regulator Establish Clean-up Goals with Regulator ConcurrenceConcurrence
Establish Cleanup Goals/Action Levels

17
Iterative way to incorporate data into CSMIterative way to incorporate data into CSM
Data Management ToolData Management Tool
Soft ware Visual Sampling PlanSoft ware Visual Sampling Plan
Output Processing Output Processing
Spatial DepictionSpatial Depiction
Graphical DisplayGraphical Display
Data Collection and Processing Platform

18
• Define the decisions that Define the decisions that must be made must be made
• Develop decision rules Develop decision rules • ID data necessary to ID data necessary to
support decision makingsupport decision making• Determine limits on Determine limits on
decision errorsdecision errors
Determining Process End Goals

19
• Site closure is a process not an endpoint Site closure is a process not an endpoint – Institutional Controls– 5-year reviews
• Clearly identify when cleanup actions will be modified or Clearly identify when cleanup actions will be modified or stoppedstopped
Closeout 36 months
Establishing Site Closeout End Goals

20
• Using the CSM to Using the CSM to define data needsdefine data needs
• Integrating new Integrating new information into the information into the CSMCSM
Sand
Sandy Loam
450'MSL440'
430'
420'
410'
MW3
MW 6
MW 5
MW1
MW4ditch
Coarse Sand
Clay
Clay
Source ReleaseMechanism
TransportMedia
ExposurePoint
ExposureRoute Receptor
Off-Site
On-Site
Off-SiteLeaching,Percolation
Contact inRiver
Inhalation
Ingestion/Shower
AquaticLife
Workers,Wildlife
Humans
SW &Sediments
Atmosphere
ShallowGW
Desorptionin Runoff
Volatili-zation
TCE/PCEin Soil
NORTHA
A'
MW2(< 0.01)
SB3(15,000 / ND)
SB2(1,000 /
ND)SB1(3,000 /
ND)
MW4(< 0.01)
MW1(0.15)
MW3(< 0.07)
SB4(200 / ND)
Creek
Burial Trench
Drainage Pattern Potential
Potable Supplies
??
?? ??
??
??
Former Solvent Storage
Tank
Refine Field Analytical CSM

21
Small Arms Firing Ranges,Small Arms Firing Ranges,Presidio of San FranciscoPresidio of San Francisco
XRF Field Case Study - Firing Range

22
• Problem: Perform full characterization of 8 Problem: Perform full characterization of 8 historic firing ranges for heavy metals at the historic firing ranges for heavy metals at the Presidio of San Francisco.Presidio of San Francisco.
• Decisions:Decisions:– Where are the ranges?Where are the ranges?– How can time be saved using XRF?How can time be saved using XRF?– What criteria should be used in the investigation to What criteria should be used in the investigation to
determine when to halt further investigation?determine when to halt further investigation?
XRF Field Case Study - Firing Range

23
• Perform rapid and cost effective site Perform rapid and cost effective site investigation of small arms firing rangesinvestigation of small arms firing ranges
• Reduce time needed to characterize Reduce time needed to characterize rangesranges
• Location of site often not clear, based on Location of site often not clear, based on very old mapsvery old maps
• Provide high quality data setProvide high quality data set
Requirement & Challenge
24
An Innovative SolutionAn Innovative Solution• ““Traditional” (I.e. laboratory based Traditional” (I.e. laboratory based
analysis) investigation initially analysis) investigation initially consideredconsidered
• We proposed alternative innovative We proposed alternative innovative approach of using field XRF in real time approach of using field XRF in real time mode using a “dynamic work” planmode using a “dynamic work” plan
Field X-Ray Fluorescence Analysis

25
XRF Basics
– Soil sample bombarded by X-ray sourceSoil sample bombarded by X-ray source– Energy increase excites atomsEnergy increase excites atoms– Metal atoms re-radiate X-rays - unique Metal atoms re-radiate X-rays - unique
wavelengthwavelength– X-ray detector picks up emissionsX-ray detector picks up emissions– Ability to perform multi-metal analysis (e.g. Ability to perform multi-metal analysis (e.g.
lead, zinc, antimony, copper and barium)lead, zinc, antimony, copper and barium)

26
• Digitize historic mapsDigitize historic maps• Overlay on exiting post maps - locate rangesOverlay on exiting post maps - locate ranges• Field visit to verify locationField visit to verify location• Set initial 12 m x 12 m sampling grid to cover Set initial 12 m x 12 m sampling grid to cover
berm area and other areas of interestberm area and other areas of interest• Locate sample points using portable Locate sample points using portable • GPS (Global Positioning System)GPS (Global Positioning System)
XRF Sampling Protocol for the Ranges
27
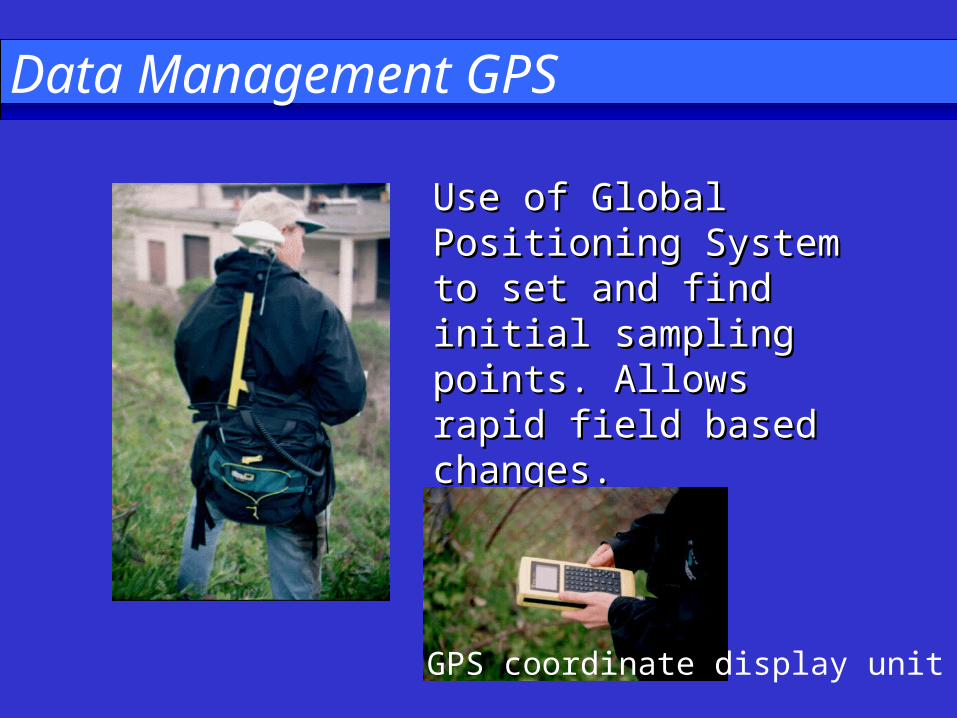
Use of Global Use of Global Positioning System to Positioning System to set and find initial set and find initial sampling points. sampling points. Allows rapid field Allows rapid field based changes.based changes.
Data Management GPS
GPS coordinate display unit

28
• Begin sampling using initial gridBegin sampling using initial grid• Analyze samples via XRF and post results on Analyze samples via XRF and post results on
site mapssite maps• Analytical results dictate vertical/horizontal Analytical results dictate vertical/horizontal
location of next samplelocation of next sample• Development of decision criteria essential to Development of decision criteria essential to
dynamic work plan approach and success of dynamic work plan approach and success of field workfield work– Use site specific levelsUse site specific levels
Dynamic Work Plan Approach

29
• If sample results indicate soil If sample results indicate soil sample has >50mg/kg lead, thensample has >50mg/kg lead, then– take next sample 30 cm deeper at take next sample 30 cm deeper at
sample location, andsample location, and– step out 10 meters and take a new step out 10 meters and take a new
surface soil sample.surface soil sample.– Reanalyze and repeat vertical and Reanalyze and repeat vertical and
horizontal sample collection until horizontal sample collection until results are less than 50 mg/kg in results are less than 50 mg/kg in both vertical and horizontal both vertical and horizontal dimensions.dimensions.
Example Decision Criteria

30
Sample Preparation Items

31
Loading Sample in XRF

32
Spectrace 6000
XRF Field Portable Lab Setup

33
20 minutes from receipt of soil sample to analysis results20 minutes from receipt of soil sample to analysis results
Quantitative resultsQuantitative results
Extremely flexible sampling and analysisExtremely flexible sampling and analysis
XRF Output Display Showing Pb Peak

34
– Excellent agreement between XRF and Excellent agreement between XRF and laboratory sampleslaboratory samples
XRF vs. Laboratory Data Correlation

35
• Detection limit for most metals <10 –30 Detection limit for most metals <10 –30 mg/kgmg/kg
• Simplified sample preparationSimplified sample preparation• Quantitative results w/in 20 minutes Quantitative results w/in 20 minutes
from receipt of soil samplefrom receipt of soil sample• Multiple metal analyte listMultiple metal analyte list• Extremely flexible sampling and Extremely flexible sampling and
analysis - can “chase contamination”analysis - can “chase contamination”
Advantages of Using XRF

36
• Traditional ApproachTraditional Approach Cost Cost• 1 work plan, 2 addenda1 work plan, 2 addenda $54,000 $54,000• 3 site mobilizations3 site mobilizations $ 9,000$ 9,000• 400 samples400 samples $40,000$40,000• 1 report, 2 addenda1 report, 2 addenda $54,000$54,000• ~ 11/2 year project management~ 11/2 year project management $ 5,000$ 5,000• TotalTotal $162,000$162,000
Cost/Time Savings

37
• XRF ApproachXRF Approach CostCost• 1 work plan1 work plan $30,000$30,000• 1 site mobilization1 site mobilization $ 3,000$ 3,000• XRF Rental (4 wks)XRF Rental (4 wks) $ 6,000$ 6,000• 400 XRF samples400 XRF samples• Included in rental costIncluded in rental cost• 70 Lab QC samples70 Lab QC samples $ 7,000$ 7,000• 1 report1 report $30,000 $30,000• Project ManagementProject Management (1/2 yr)(1/2 yr) $$ 1,000 1,000• TotalTotal $77,000$77,000
Cost/Time Savings, cont.

38
– At Presidio SF, Defense Depot Ogden At Presidio SF, Defense Depot Ogden (Utah), Santa Rosa NAAS (Calif), Santa (Utah), Santa Rosa NAAS (Calif), Santa Rosa AAF, Ft. Ord ranges and other sites, Rosa AAF, Ft. Ord ranges and other sites, have received enthusiastic acceptance have received enthusiastic acceptance from agenciesfrom agencies
– XRF plus appropriate lab QC acceptedXRF plus appropriate lab QC accepted
Regulatory Acceptance

39
• A well thought out dynamic work planA well thought out dynamic work plan• Pre-established decision criteriaPre-established decision criteria• Field personnel (including field chemist) Field personnel (including field chemist)
who fully understand the protocolswho fully understand the protocols• Large van or small office for sample Large van or small office for sample
preparation and analysispreparation and analysis
Elements of Success

40
Removal Action with Immunoassay
– Focused removal, excavate areas where bags of pesticide Focused removal, excavate areas where bags of pesticide were disposed were disposed – Characterize to determine the additional extent of pesticide contamination and excavate Characterize to determine the additional extent of pesticide contamination and excavate – Determine how to manage excavated materialDetermine how to manage excavated material
Problem: Pesticide contamination of soil in the vadose zoneProblem: Pesticide contamination of soil in the vadose zone
Decisions:Decisions:

41

42
Assemble planning Assemble planning and technical team;and technical team; Develop communication Develop communication strategy; strategy; Develop a CSM;Develop a CSM; Develop process for integrating new Develop process for integrating new
information into CSM;information into CSM; Regulators/stakeholders involved throughout Regulators/stakeholders involved throughout
process, giving input and buying into plans.process, giving input and buying into plans.
Key Planning Steps

43
• Provide analytical results for DDT, cyclodienes Provide analytical results for DDT, cyclodienes (especially dieldrin and endrin) and other identified (especially dieldrin and endrin) and other identified COCs with quantitation limits that are less than the COCs with quantitation limits that are less than the field/operational action levels in order to guide the field/operational action levels in order to guide the removal of contaminated soil from each defined removal of contaminated soil from each defined column of soil at the site such that final cleanup goals column of soil at the site such that final cleanup goals will be met within a single field mobilization.will be met within a single field mobilization.
• Ensure that the turnaround time for the field Ensure that the turnaround time for the field generated data supports the real-time decision generated data supports the real-time decision making needs of the dynamic work plan. making needs of the dynamic work plan.
Project Data Quality Objectives

44
• Remove soil in a manner that ensures soil left in place Remove soil in a manner that ensures soil left in place meets the MTCA cleanup standards such that:meets the MTCA cleanup standards such that:– no more than 10 percent of sample exceed the cleanup no more than 10 percent of sample exceed the cleanup
standard,standard,– no sample can exceed two times the cleanup standard; andno sample can exceed two times the cleanup standard; and– the true mean concentration must be below the cleanup the true mean concentration must be below the cleanup
standard as measured by a 95% upper confidence limit on the standard as measured by a 95% upper confidence limit on the mean. mean.
• Provide analytical results that can be used to segregate Provide analytical results that can be used to segregate and classify excavated soil and other remediation and classify excavated soil and other remediation wastes for management as solid, hazardous, or wastes for management as solid, hazardous, or dangerous waste according to RCRA and the WA state dangerous waste according to RCRA and the WA state Dangerous Waste Regulations.Dangerous Waste Regulations.
Project Data Quality Objectives, Cont.

45
• Cross reactivitiesCross reactivities• Demonstration of applicability - Pilot Studies using actual Demonstration of applicability - Pilot Studies using actual
field matrixfield matrix• Initial action levels set at 5 ppm for DDT and 0.1 ppm for Initial action levels set at 5 ppm for DDT and 0.1 ppm for
cyclodienescyclodienes• Action levels further refined in the field, DDT kit action level Action levels further refined in the field, DDT kit action level
raised to 10 ppm. raised to 10 ppm.
Immunoassay Selection

46
Grid O
rigin
North Drawing not to scale
x-axis
y-axis
Row C
Row B
Row APre-existing barbed wire fence
FR2/3
FR4/5
Col 1
Col 2
Col 3
Col 4
Col 5
Col 6
Col 7
Col 8
Col 9Grid of Pesticide Site

47
• Focused removal of pesticide product.Focused removal of pesticide product.• Characterization of the remediation area.Characterization of the remediation area.• Gross removal of contaminated soil.Gross removal of contaminated soil.• Final confirmation sampling for site closure.Final confirmation sampling for site closure.• Backfilling, grading, and restorationBackfilling, grading, and restoration• Characterization and disposal of Characterization and disposal of
contaminated materials. contaminated materials.
Project Phases

48
Focused Removal Activities
49
Row C
Row B
Row A
FR2/3
FR4/5
Col 1
Col 2
Col 3
Col 4
Col 5
Col 6
Col 7
Col 8
Col 9
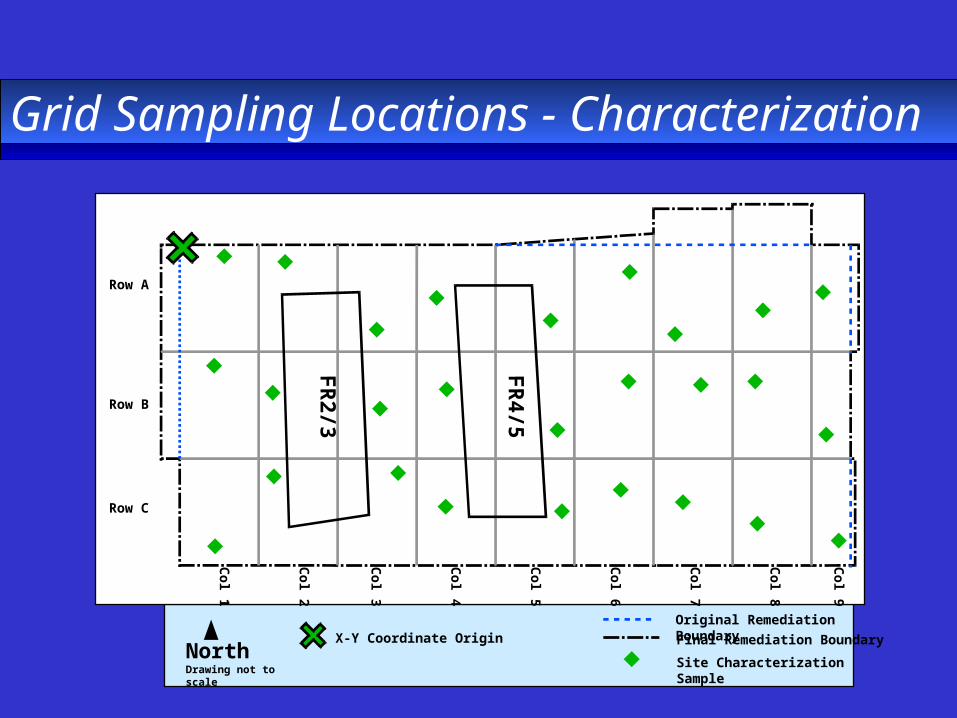
Original Remediation BoundaryFinal Remediation BoundaryNorth
Drawing not to scale
X-Y Coordinate Origin
Site Characterization Sample
Grid Sampling Locations - Characterization

50
Dividing Push Sample Core into Three 1-Foot Dividing Push Sample Core into Three 1-Foot Interval SamplesInterval Samples
Sample Preparation

51
Immunoassay vs. Fixed Lab Correlation

52
Row C
Row B
Row A
FR2/3
FR4/5
Col 1
Col 2
Col 3
Col 4
Col 5
Col 6
Col 7
Col 8
Col 9
Original Remediation Boundary
Final Remediation BoundaryNorthDrawing not to scale
X-Y Coordinate Origin
22/1
1/ 55/
11/ 4
4/ 22.5/ 2
2/ 22.5/4
4/
11/
11/
11/
11/
55/ 1
4.5/ 44/ 2
2/22/ 4
4/ 22.5/
22.5/4
4/22/2
2/4
4/
11/
55/
Top number is feet bgs planned for excavation and the bottom is feet bgs actually excavated
11/
Grid Area Planned Excavation Depths

53
Collecting Final Confirmation Sample

54
Cost ComparisonsTraditional ESC+
1. Review Existing Data $7,150 $11,0002. Design Site Characterization $0 $17,6403. Implement Site Characterization $0 $84,1344. Review Char. data $0 $10,0005. Design Remedy $16,500 $26,4606. Implement Remedy (- Disposal) $168,094 $271,1167. Waste Disposal $910,000 $153,5708. Closure report $20,305 $20,305TOTAL $1,122,049 $594,225
This traditional cost estimate assumes no characterization, only removal and incineration of the entire plot volume
DWP

55
• Cost: site was remediated/closed out for < 600k.Cost: site was remediated/closed out for < 600k.• Time: About two years from time of request; < 4 Time: About two years from time of request; < 4
months of field work using a DWP approach.months of field work using a DWP approach.• On-going regulator/stakeholder input critical to resolve On-going regulator/stakeholder input critical to resolve
problems that could have derailed project.problems that could have derailed project.• Systematic planning focused efforts on end-use of Systematic planning focused efforts on end-use of
data.data.• A regulatory focus on project outcome/performance A regulatory focus on project outcome/performance
permitted flexibility to maximize innovation and cost permitted flexibility to maximize innovation and cost savings.savings.
Observations and Lessons Learned

56
• Use of immunoassay analysis increased the number Use of immunoassay analysis increased the number and density of sampling because of cost savings.and density of sampling because of cost savings.
• The CSM was refined in the field; specific sampling The CSM was refined in the field; specific sampling strategies selected to match the specific decision.strategies selected to match the specific decision.
• A pilot study helped determineA pilot study helped determine– appropriate field sampling & measurement toolsappropriate field sampling & measurement tools– project-specific field action levels for decisionsproject-specific field action levels for decisions– project-specific SOPs and QC for field analysis project-specific SOPs and QC for field analysis
Observations, Lessons Learned Cont.

57
Umatilla Chemical Depot - LTM/RAO

58
• 1300 gal/min1300 gal/min
• Four 20,000 pound GAC unitsFour 20,000 pound GAC units
• Primary COC: RDX, TNT, HMX, TNB, DNTPrimary COC: RDX, TNT, HMX, TNB, DNT
Groundwater Treatment Plant
59
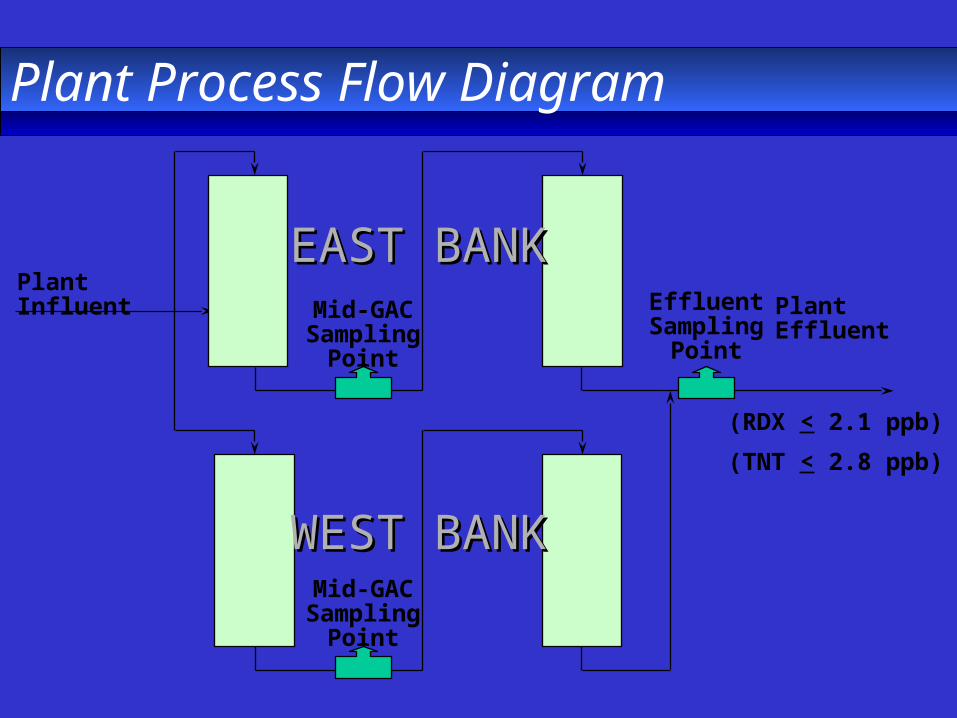
Plant InfluentPlant EffluentMid-GAC
Sampling Point
Mid-GACSampling
Point
EAST BANKEAST BANK
WEST BANKWEST BANK
EffluentSampling
Point
(RDX < 2.1 ppb)(TNT < 2.8 ppb)
Plant Process Flow Diagram

60
•Monitor groundwater cleanup progress Monitor groundwater cleanup progress
•Calculate GAC loading Calculate GAC loading
•Evaluate plant performance Evaluate plant performance
•Assure compliance with groundwater cleanup criteriaAssure compliance with groundwater cleanup criteria
Data Use Objectives

61
• Analytical sensitivity and selectivity - ROD Analytical sensitivity and selectivity - ROD cleanup levels RDX 2.1 ppb and TNT 2.8 ppb. cleanup levels RDX 2.1 ppb and TNT 2.8 ppb.
• Type and quality of data required for the Type and quality of data required for the decisions to be made.decisions to be made.
•Field colorimetric methods selected.Field colorimetric methods selected.
Analytical Method Selection

62
On-Site Explosives Measurement

63
• Nitrate interference, matrix problems identified.Nitrate interference, matrix problems identified.
• Identified appropriate technical supportIdentified appropriate technical supportpersonnel to bring into the team - CRREL staff used.personnel to bring into the team - CRREL staff used.
• Method modifications established to overcome Method modifications established to overcome matrix interference.matrix interference.
Refinement of Field Method
64
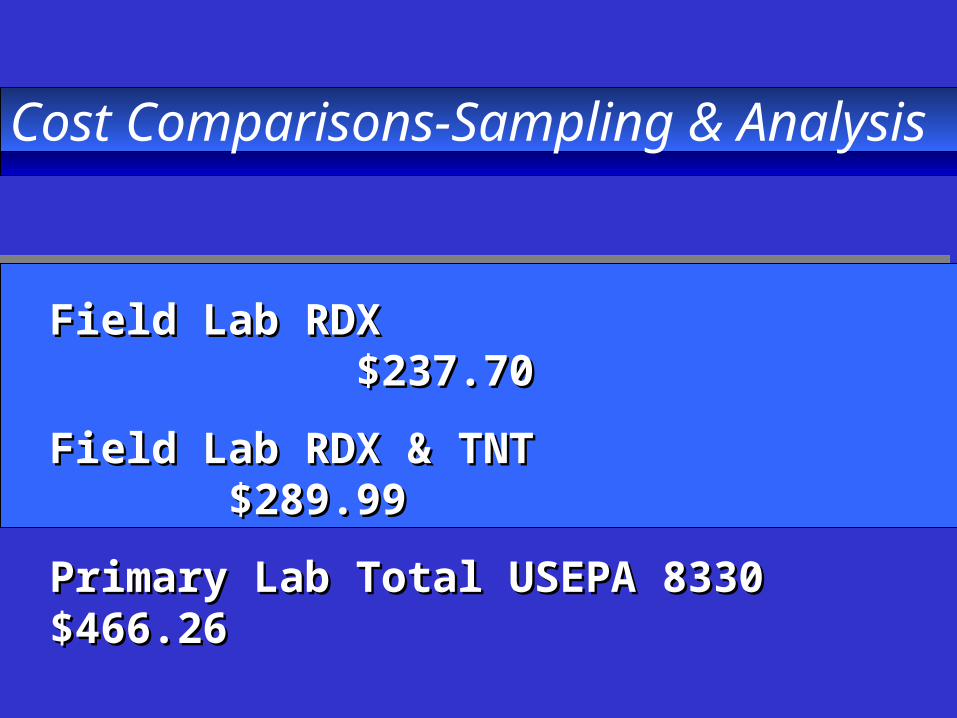
Field Lab RDX $237.70Field Lab RDX $237.70
Field Lab RDX & TNT $289.99Field Lab RDX & TNT $289.99
Primary Lab Total USEPA 8330 $466.26Primary Lab Total USEPA 8330 $466.26
Cost Comparisons-Sampling & Analysis

65
• Three carbon cycles examinedThree carbon cycles examined• Carbon breakthrough curves prepared Carbon breakthrough curves prepared
for each cyclefor each cycle• Suitability of carbon in each cycle Suitability of carbon in each cycle
evaluatedevaluated• Cycle data used to calculate a unit volume Cycle data used to calculate a unit volume
treatment costtreatment cost
Treatment System Optimization Study
66
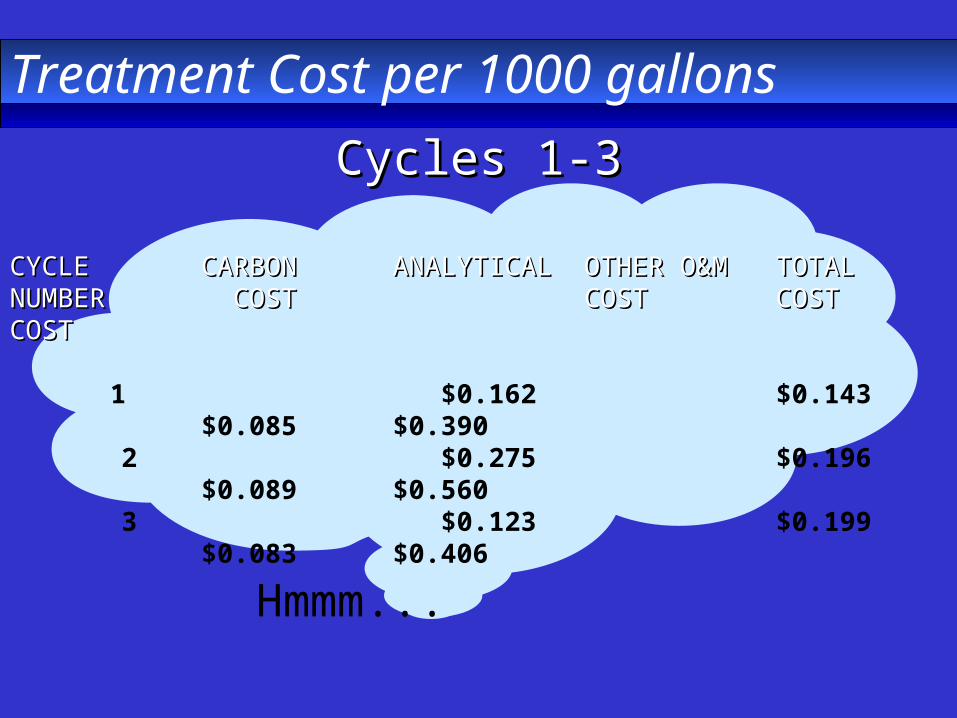
Cycles 1-3Cycles 1-3
CYCLECYCLE CARBON CARBON ANALYTICALANALYTICAL OTHER O&M OTHER O&M TOTALTOTALNUMBERNUMBER COSTCOST COST COST COST COST COST COST
1 $0.162 $0.143 $0.085$0.390 2 $0.275 $0.196 $0.089$0.560 3 $0.123 $0.199 $0.083$0.406
Hmmm...
Treatment Cost per 1000 gallons

67
• Continue to operate carbon cycles until Continue to operate carbon cycles until effluent RDX breakthrough.effluent RDX breakthrough.
• Utilize a dynamic monitoring approach Utilize a dynamic monitoring approach that changes as influent chemistry and that changes as influent chemistry and carbon loading capacity changes. carbon loading capacity changes.
Optimization Recommendations

68
• The benefits of having data available in The benefits of having data available in the field are many when conducting the field are many when conducting remedial system optimization studies.remedial system optimization studies.
• Field measurement technologies can be Field measurement technologies can be used for long-term RA monitoring. used for long-term RA monitoring.
• Significant cost savings can be realized Significant cost savings can be realized by utilizing field measurement by utilizing field measurement techniques for long-term RA monitoring.techniques for long-term RA monitoring.
Case Study Conclusions

69
• Not limited to characterization alone.Not limited to characterization alone.• Many different types of sampling and analysis efforts Many different types of sampling and analysis efforts
can be accompanied with field based technologiescan be accompanied with field based technologies– Conducting all types of site characterization effortsConducting all types of site characterization efforts– Confirming cleanup of sitesConfirming cleanup of sites– Managing emergency response actionsManaging emergency response actions– Guiding remedial action decisions Guiding remedial action decisions – Monitoring treatment processesMonitoring treatment processes– Monitoring long-term complianceMonitoring long-term compliance
Summary: Applications of Field-Based Measurement Technologies

70
• Superfund HQ management buy-in is being Superfund HQ management buy-in is being broadenedbroadened
• Informational “Handbooks” (“how-to” guides) are Informational “Handbooks” (“how-to” guides) are being developed in conjunction with the USACE being developed in conjunction with the USACE HTRW CX and other expert practitionersHTRW CX and other expert practitioners
• We We allall will need to work together to push from many will need to work together to push from many angles if modernization of site cleanup practice is to angles if modernization of site cleanup practice is to be achievedbe achieved
Conclusions