FIDELITY BANK PLC Bank Plc June 2018 AFS.pdf · 2 Summary of significant accounting policies 40 30...
141
FIDELITY BANK PLC INTERIM REPORT AND FINANCIAL STATEMENTS FOR THE SIX MONTHS ENDED JUNE 30 2018
Transcript of FIDELITY BANK PLC Bank Plc June 2018 AFS.pdf · 2 Summary of significant accounting policies 40 30...

FIDELITY BANK PLC
INTERIM REPORT AND FINANCIAL STATEMENTS
FOR THE SIX MONTHS ENDED
JUNE 30 2018
FIDELITY BANK PLC
Table of contents
for the Period ended 30 June 2018
Note CONTENTS Page Note Page
Directors' report 2 19 Cash and cash equivalents 105
Statement of directors' responsibilities in relation to
the preparation of the interim financial statements
15 20 Due to banks 105
Independent auditors' report 16 21 Loans and advances to customers 106
Statutory audit committee's report 21 22 Investments 111
Corporate governance report 22 23 Property, plant and equipment 115
Interim statement of profit or loss and other
comprehensive income
36 24 Intangible assets 116
Interim statement of financial position 37 25 Deferred taxation 116
Interim statement of changes in equity 38 26 Other assets 117
Interim statement of cash flows 39 27 Deposit from customers 117
Notes to the interim financial statements 40 28 Other liabilities 117
1 General information 40 29 Provisions 118
2 Summary of significant accounting policies 40 30 Debts issued and Other borrowed funds 121
3 Financial risk management and fair value
measurement and disclosure
72 31 Share capital 122
4 Capital management 98 32 Other equity accounts 122
5 Segment analysis 100 33 Cash flow from operations 123
6 Interest and similar income 101 34 Contingent liabilities and commitments 124
7 Interest and similar expense 101 35 Related party transactions 125
8 Credit loss expense 101 36 Employees 127
9 Net fee and commission income 102 37 Directors' emoluments 128
10 Other operating income 102 38 Compliance with banking regulations 129
11 Net (losses)/gains from financial instruments
classified as held for trading through profit and loss
102 39 Gender diversity 130
12 Personnel expenses 103 40 Statement of prudential adjustments 130
13 Depreciation and amortisation 103 41 Maturity analysis of assets and liabilities 131
14 Other operating expenses 103 42 Reclassifications 132
15 Taxation 104 43 Events after the reporting period 132
16 Net reclassification adjustments for realised net
(gains)/ losses
104 Statement of value added 133
17 Earnings per share 104 Five-period financial summary 134
18 Cash and balances with central bank 105
1
FIDELITY BANK PLC
Directors’ Report
For the period ended 30 June 2018
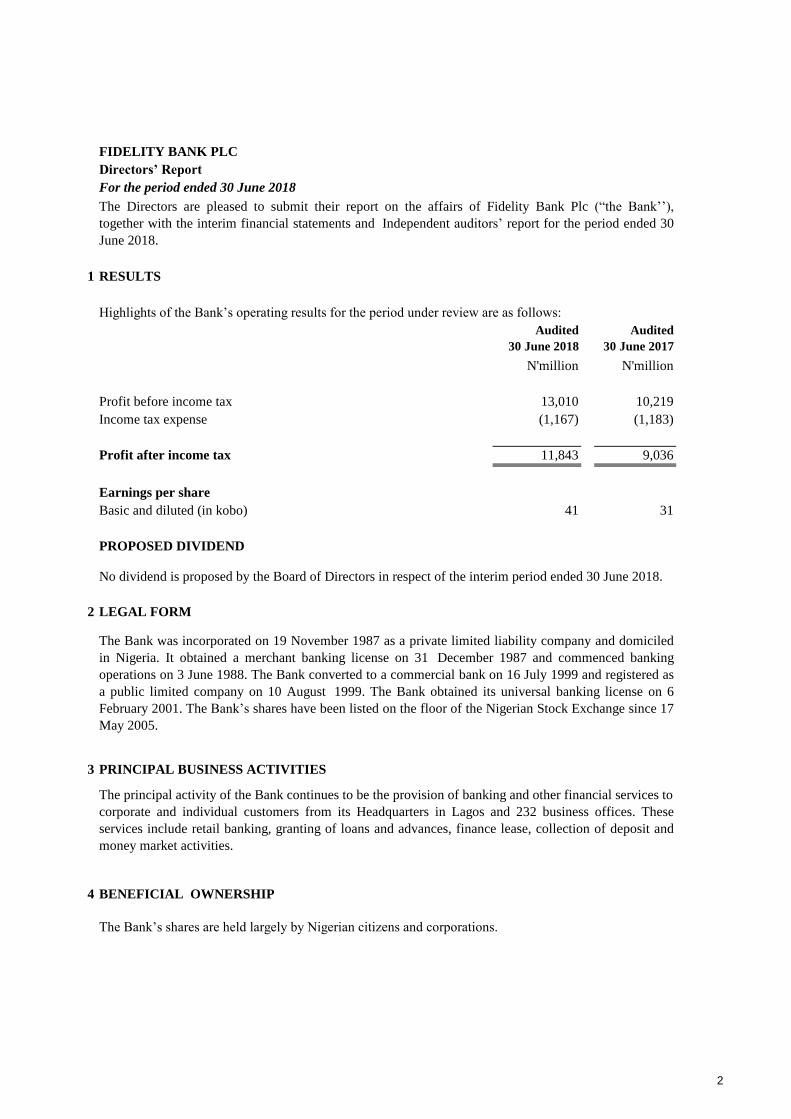
1 RESULTS
Audited Audited
30 June 2018 30 June 2017
N'million N'million
Profit before income tax 13,010 10,219
Income tax expense (1,167) (1,183)
Profit after income tax 11,843 9,036
Earnings per share
Basic and diluted (in kobo) 31
PROPOSED DIVIDEND
2 LEGAL FORM
3 PRINCIPAL BUSINESS ACTIVITIES
4 BENEFICIAL OWNERSHIP
The principal activity of the Bank continues to be the provision of banking and other financial services to
corporate and individual customers from its Headquarters in Lagos and 232 business offices. These
services include retail banking, granting of loans and advances, finance lease, collection of deposit and
money market activities.
The Bank’s shares are held largely by Nigerian citizens and corporations.
The Directors are pleased to submit their report on the affairs of Fidelity Bank Plc (“the Bank’’),
together with the interim financial statements and Independent auditors’ report for the period ended 30
June 2018.
Highlights of the Bank’s operating results for the period under review are as follows:
41
No dividend is proposed by the Board of Directors in respect of the interim period ended 30 June 2018.
The Bank was incorporated on 19 November 1987 as a private limited liability company and domiciled
in Nigeria. It obtained a merchant banking license on 31 December 1987 and commenced banking
operations on 3 June 1988. The Bank converted to a commercial bank on 16 July 1999 and registered as
a public limited company on 10 August 1999. The Bank obtained its universal banking license on 6
February 2001. The Bank’s shares have been listed on the floor of the Nigerian Stock Exchange since 17
May 2005.
2
FIDELITY BANK PLC
Directors’ Report- continued
For the period ended 30 June 2018
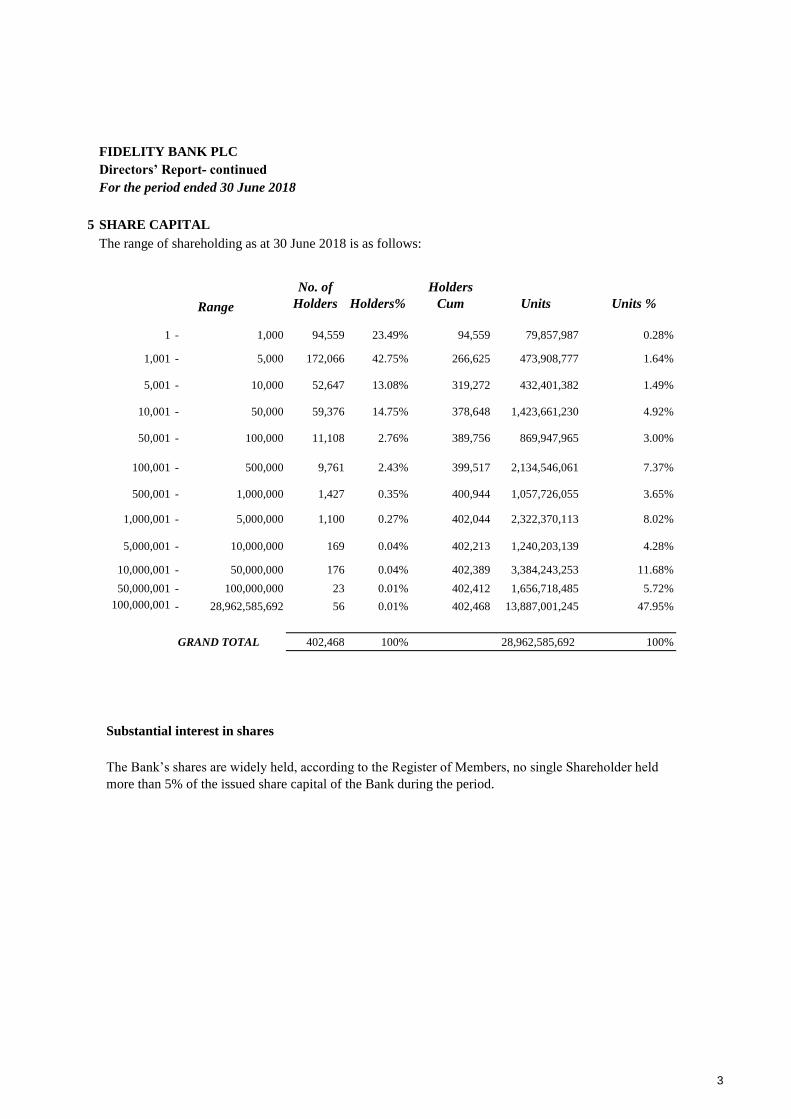
5 SHARE CAPITAL
The range of shareholding as at 30 June 2018 is as follows:
Range
No. of
Holders Holders%
Holders
Cum Units UnitsUnits %
1 - 1,000 94,559 23.49% 94,559 79,857,987 0.28%
1,001 - 5,000 172,066 42.75% 266,625 473,908,777 1.64%
5,001 - 10,000 52,647 13.08% 319,272 432,401,382 1.49%
10,001 - 50,000 59,376 14.75% 378,648 1,423,661,230 4.92%
50,001 - 100,000 11,108 2.76% 389,756 869,947,965 3.00%
100,001 - 500,000 9,761 2.43% 399,517 2,134,546,061 7.37%
500,001 - 1,000,000 1,427 0.35% 400,944 1,057,726,055 3.65%
1,000,001 - 5,000,000 1,100 0.27% 402,044 2,322,370,113 8.02%
5,000,001 - 10,000,000 169 0.04% 402,213 1,240,203,139 4.28%
10,000,001 - 50,000,000 176 0.04% 402,389 3,384,243,253 11.68%
50,000,001 - 100,000,000 23 0.01% 402,412 1,656,718,485 5.72%
100,000,001 - 28,962,585,692 56 0.01% 402,468 13,887,001,245 47.95%
GRAND TOTAL 402,468 100% 28,962,585,692 100%
Substantial interest in shares
The Bank’s shares are widely held, according to the Register of Members, no single Shareholder held
more than 5% of the issued share capital of the Bank during the period.
3

FIDELITY BANK PLC
Directors’ Report- continued
For the year ended 30 June 2018
6 DIRECTORS AND THEIR INTEREST
SN Name Date
1
2
Changes on the Board
The Board is in the process of appointing another Independent Director and will notify the investing public once
the process is concluded.
Retirement by Rotation
In accordance with Article 95(1)(a) of the Articles of Association of the Bank which requires one-third (or the
number closest to one-third), of the Non-Executive Directors to retire by rotation at each Annual General
Meeting, the Directors retiring by rotation are Mr. Robert Nnana-Kalu and Otunba Seni Adetu, being eligible,
they offer themselves for re-election and were duly re-elected by the Shareholders at the Annual General Meeting
of 25 May 2018.
The detailed profile of all the Directors is on the Bank’s website- www.fidelitybank.ng.
24 January 2018
15 February 2018
Designation
Directors and their Interests
The Directors who held office during the period together with their interests in the issued share capital of the
Bank as recorded in the Register of Directors’ Shareholding and as notified by the Directors for the purpose of
Sections 275 and 276 of the Companies and Allied Matters Act (CAMA), CAP C20, Laws of the Federation of
Nigeria, 2004 and the listing requirements of the Nigerian Stock Exchange are as detailed below:
The following retirements took effect on the Board of your Bank since the last Annual General Meeting:
Mr. Adeyeye Adepegba
Alhaji Bashari Gumel Independent Non-Executive Director
Executive Director
4

FIDELITY BANK PLC
Directors’ Report - continued
For the period ended 30 June 2018
NAME OF
DIRECTORDIRECT INDIRECT TOTAL DIRECT INDIRECT TOTAL
Units Units Units Units Units Units
Mr. Ernest Ebi,
MFR, FCIB8,755,163 NIL 8,755,163 1,185,000 NIL 1,185,000
Mr. Robert Nnana-
Kalu2,030,000 NIL 2,030,000 1,000,000 NIL 1,000,000
Mr. Alex Ojukwu 3,530,000 NIL 3,530,000 NIL NIL NIL
Mr. Michael
Ezechukwu Okeke2,311,500 NIL 2,311,500 NIL NIL NIL
Pastor Akuma King 27,700 NIL 27,700 27,700 NIL 27,700
Chief. Charles
Umolu20,870,000 NIL 20,870,000 NIL NIL NIL
Otunba Seni Adetu NIL NIL NIL NIL NIL NIL
Mr. Nnamdi
Okonkwo102,000,000 NIL 102,000,000 101,000,000 NIL 101,000,000
Mrs. Chijioke
Ugochukwu74,178,823 NIL 74,178,823 70,645,080 NIL 70,645,080
Mr. Mohammed
Balarabe 69,081,467 NIL 69,081,467 67,079,246 NIL 67,079,246
Mrs. Aku
Odinkemelu44,958,500 NIL 44,958,500 44,958,500 NIL 44,958,500
Mrs. Nneka Chinwe
Onyeali-Ikpe52,456,000 NIL 52,456,000 52,456,000 NIL 52,456,000
30 June 2018 31 December 2017
5
FIDELITY BANK PLC
Directors’ Report - continued
For the period ended 30 June 2018
Related Director
Interest in
entity
Director
Director
a.
b.
c.
d.
e.
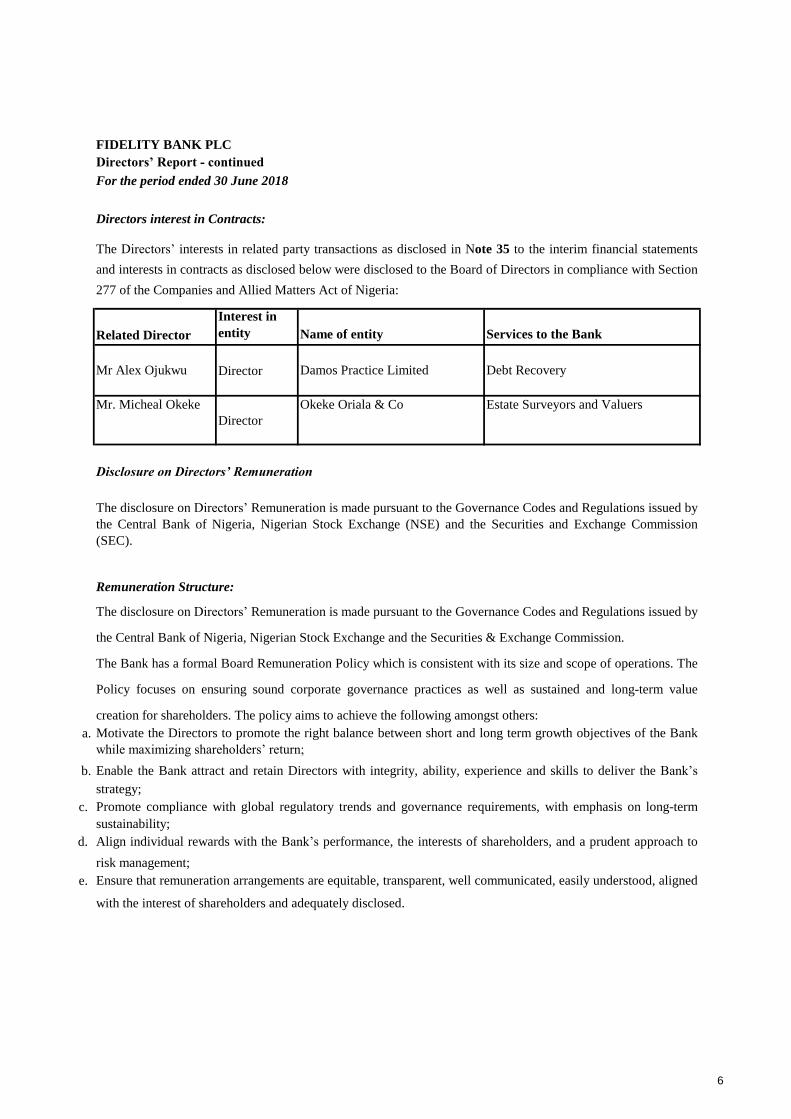
The Directors’ interests in related party transactions as disclosed in Note 35 to the interim financial statements
and interests in contracts as disclosed below were disclosed to the Board of Directors in compliance with Section
277 of the Companies and Allied Matters Act of Nigeria:
Name of entity Services to the Bank
Mr Alex Ojukwu Damos Practice Limited Debt Recovery
Directors interest in Contracts:
The disclosure on Directors’ Remuneration is made pursuant to the Governance Codes and Regulations issued by
the Central Bank of Nigeria, Nigerian Stock Exchange and the Securities & Exchange Commission.
The Bank has a formal Board Remuneration Policy which is consistent with its size and scope of operations. The
Policy focuses on ensuring sound corporate governance practices as well as sustained and long-term value
creation for shareholders. The policy aims to achieve the following amongst others:
Motivate the Directors to promote the right balance between short and long term growth objectives of the Bank
while maximizing shareholders’ return;
Enable the Bank attract and retain Directors with integrity, ability, experience and skills to deliver the Bank’s
strategy;
Promote compliance with global regulatory trends and governance requirements, with emphasis on long-term
sustainability;
Align individual rewards with the Bank’s performance, the interests of shareholders, and a prudent approach to
risk management;
Ensure that remuneration arrangements are equitable, transparent, well communicated, easily understood, aligned
with the interest of shareholders and adequately disclosed.
Mr. Micheal Okeke Okeke Oriala & Co Estate Surveyors and Valuers
Disclosure on Directors’ Remuneration
The disclosure on Directors’ Remuneration is made pursuant to the Governance Codes and Regulations issued by
the Central Bank of Nigeria, Nigerian Stock Exchange (NSE) and the Securities and Exchange Commission
(SEC).
Remuneration Structure:
6

FIDELITY BANK PLC
Directors’ Report - continuedFor the period ended 30 June 2018
Executive remuneration at Fidelity Bank is structured to provide a solid basis for succession planning and to
attract, retain and motivate the right calibre of staff required to achieve the Bank’s business objectives.
The Board sets operational targets consisting of a number of Key Performance Indicators (KPI’s) covering both
financial and non-financial measures of performance for the executives at the beginning of each year.
Executive compensation is therefore tied to specific deliverables and includes fixed and variable pay
components. Fixed pay includes basic salary, transport, housing and other allowances.
These are paid monthly, quarterly or annually as appropriate. Variable pay represents pay at risk and is
dependent on achievement of pre-set targets.
The Board Corporate Governance Committee (a Committee comprised of only Non-Executive Directors) makes
recommendations to the Board on all matters relating to Directors remuneration. The Executive Directors are not
involved in decisions on their own remuneration.
7
FIDELITY BANK PLC
Directors’ Report - continued
For the period ended 30 June 2018
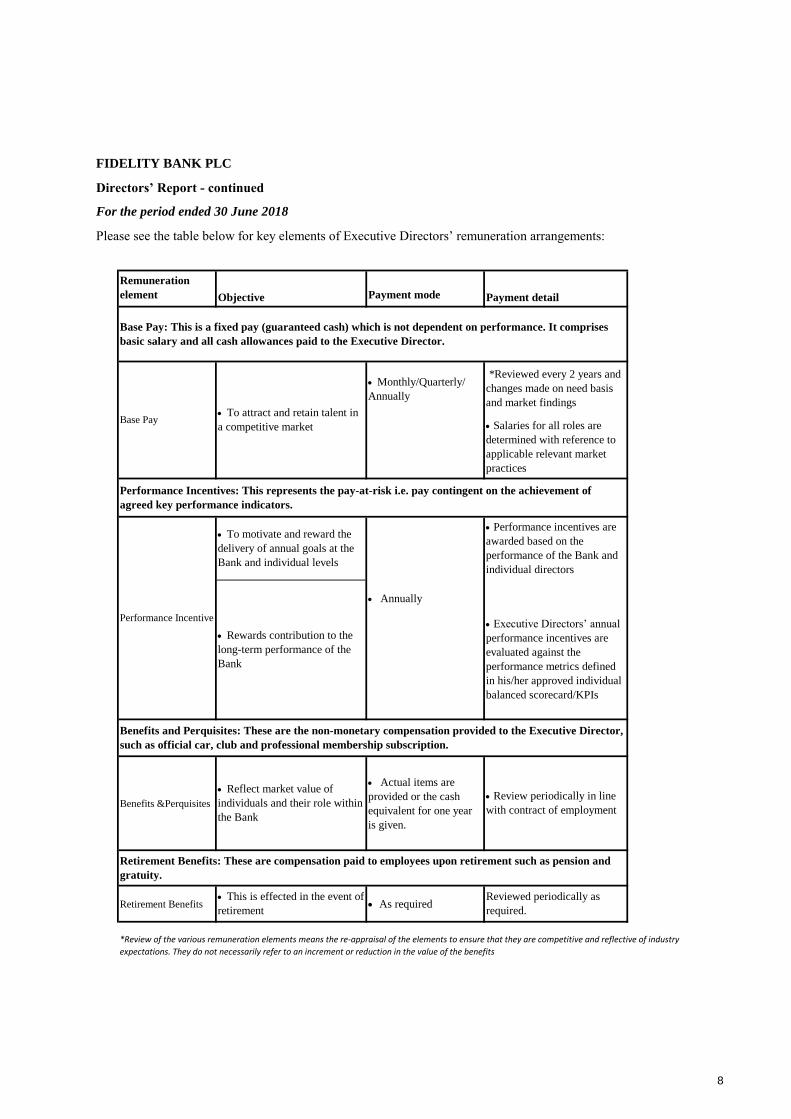
Please see the table below for key elements of Executive Directors’ remuneration arrangements:
Remuneration
element Payment mode
Monthly/Quarterly/
Annually
Annually
Benefits &Perquisites
Actual items are
provided or the cash
equivalent for one year
is given.
Retirement Benefits As required
Objective Payment detail
Base Pay: This is a fixed pay (guaranteed cash) which is not dependent on performance. It comprises
basic salary and all cash allowances paid to the Executive Director.
Base Pay To attract and retain talent in
a competitive market
*Reviewed every 2 years and
changes made on need basis
and market findings
Salaries for all roles are
determined with reference to
applicable relevant market
practices
Benefits and Perquisites: These are the non-monetary compensation provided to the Executive Director,
such as official car, club and professional membership subscription.
Reflect market value of
individuals and their role within
the Bank
Review periodically in line
with contract of employment
Retirement Benefits: These are compensation paid to employees upon retirement such as pension and
gratuity.
This is effected in the event of
retirement
Reviewed periodically as
required.
Performance Incentives: This represents the pay-at-risk i.e. pay contingent on the achievement of
agreed key performance indicators.
Performance Incentive
To motivate and reward the
delivery of annual goals at the
Bank and individual levels
Performance incentives are
awarded based on the
performance of the Bank and
individual directors
Rewards contribution to the
long-term performance of the
Bank
Executive Directors’ annual
performance incentives are
evaluated against the
performance metrics defined
in his/her approved individual
balanced scorecard/KPIs
*Review of the various remuneration elements means the re-appraisal of the elements to ensure that they are competitive and reflective of industry
expectations. They do not necessarily refer to an increment or reduction in the value of the benefits
8

FIDELITY BANK PLC
Directors’ Report - continued
For the period ended 30 June 2018
Remuneration
ElementPayment Mode
Programme
Detail
Annual Fees Quarterly
Sitting Allowances Per meeting
Objective
To attract individuals with
relevant skills, knowledge and
experience
Reviewed every 2 years and
changes made on need basis
subject to shareholder
approval at the Annual
General Meeting.
To recognise the
responsibilities of the Non-
executive Directors
Reviewed every 2 years and
changes made on need basis
subject to shareholder
approval at the Annual
General Meeting.
To encourage attendance and
participation at designated
committees assigned to them
Non-Executive Directors Remuneration:
Non-Executive Directors remuneration is structured to conform to prevailing regulations and is set at a level
that is at par with market developments, reflects their qualifications, the contributions required and the extent
of their responsibilities and liabilities.
Non-Executive Directors are paid an annual fee in addition to reimbursable expenses incurred in the course of
their role as Board members, where not provided directly by the Bank. The annual fee is approved by
Shareholders at the Annual General Meeting in each year and is paid quarterly in arrears.
They also receive a sitting allowance for each meeting attended by them but do not receive any performance
incentive payments.
Table 2: Key elements of Non-Executive Directors’ remuneration arrangements:
*Review of the various remuneration elements means the re-appraisal of the elements to ensure that they are competitive and reflective of industry
expectations. They do not necessarily refer to an increment or reduction in the value of the benefits
The Bank periodically benchmarks its remuneration practices against peer organizations whose business profiles
are similar to that of the Bank.
9
FIDELITY BANK PLC
Directors’ Report - continued
For the period ended 30 June 2018
7 EVENTS AFTER THE REPORTING PERIOD
8 PROPERTY, PLANT AND EQUIPMENT
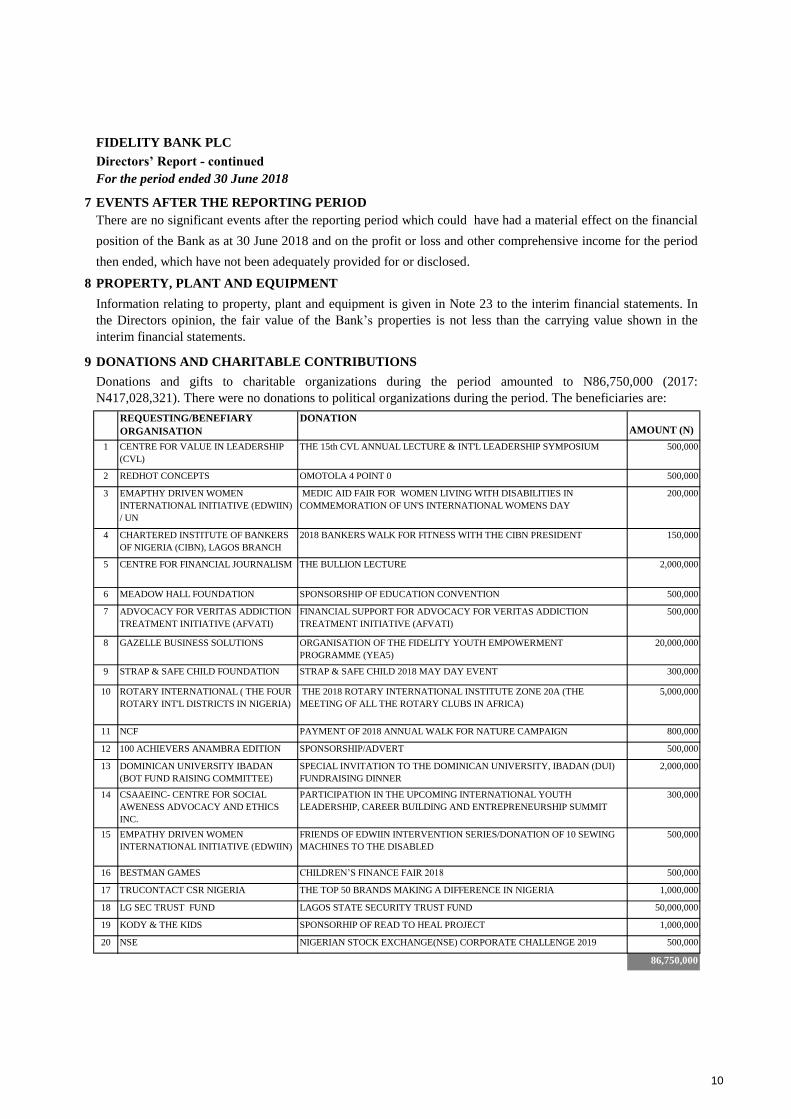
9 DONATIONS AND CHARITABLE CONTRIBUTIONS
AMOUNT (N)
1 500,000
2 500,000
3 200,000
4 150,000
5 2,000,000
6 500,000
7 500,000
8 20,000,000
9 300,000
10 5,000,000
11 800,000
12 500,000
13 2,000,000
14 300,000
15 500,000
16 500,000
17 1,000,000
18 50,000,000
19 1,000,000
20 500,000
86,750,000
CENTRE FOR VALUE IN LEADERSHIP
(CVL)
THE 15th CVL ANNUAL LECTURE & INT'L LEADERSHIP SYMPOSIUM
REDHOT CONCEPTS OMOTOLA 4 POINT 0
EMAPTHY DRIVEN WOMEN
INTERNATIONAL INITIATIVE (EDWIIN)
/ UN
MEDIC AID FAIR FOR WOMEN LIVING WITH DISABILITIES IN
COMMEMORATION OF UN'S INTERNATIONAL WOMENS DAY
There are no significant events after the reporting period which could have had a material effect on the financial
position of the Bank as at 30 June 2018 and on the profit or loss and other comprehensive income for the period
then ended, which have not been adequately provided for or disclosed.
Information relating to property, plant and equipment is given in Note 23 to the interim financial statements. In
the Directors opinion, the fair value of the Bank’s properties is not less than the carrying value shown in the
interim financial statements.
Donations and gifts to charitable organizations during the period amounted to N86,750,000 (2017:
N417,028,321). There were no donations to political organizations during the period. The beneficiaries are:
REQUESTING/BENEFIARY
ORGANISATION
DONATION
ADVOCACY FOR VERITAS ADDICTION
TREATMENT INITIATIVE (AFVATI)
FINANCIAL SUPPORT FOR ADVOCACY FOR VERITAS ADDICTION
TREATMENT INITIATIVE (AFVATI)
GAZELLE BUSINESS SOLUTIONS ORGANISATION OF THE FIDELITY YOUTH EMPOWERMENT
PROGRAMME (YEA5)
STRAP & SAFE CHILD FOUNDATION STRAP & SAFE CHILD 2018 MAY DAY EVENT
CHARTERED INSTITUTE OF BANKERS
OF NIGERIA (CIBN), LAGOS BRANCH
2018 BANKERS WALK FOR FITNESS WITH THE CIBN PRESIDENT
CENTRE FOR FINANCIAL JOURNALISM THE BULLION LECTURE
MEADOW HALL FOUNDATION SPONSORSHIP OF EDUCATION CONVENTION
ROTARY INTERNATIONAL ( THE FOUR
ROTARY INT'L DISTRICTS IN NIGERIA)
THE 2018 ROTARY INTERNATIONAL INSTITUTE ZONE 20A (THE
MEETING OF ALL THE ROTARY CLUBS IN AFRICA)
NCF PAYMENT OF 2018 ANNUAL WALK FOR NATURE CAMPAIGN
100 ACHIEVERS ANAMBRA EDITION SPONSORSHIP/ADVERT
DOMINICAN UNIVERSITY IBADAN
(BOT FUND RAISING COMMITTEE)
SPECIAL INVITATION TO THE DOMINICAN UNIVERSITY, IBADAN (DUI)
FUNDRAISING DINNER
CSAAEINC- CENTRE FOR SOCIAL
AWENESS ADVOCACY AND ETHICS
INC.
PARTICIPATION IN THE UPCOMING INTERNATIONAL YOUTH
LEADERSHIP, CAREER BUILDING AND ENTREPRENEURSHIP SUMMIT
EMPATHY DRIVEN WOMEN
INTERNATIONAL INITIATIVE (EDWIIN)
FRIENDS OF EDWIIN INTERVENTION SERIES/DONATION OF 10 SEWING
MACHINES TO THE DISABLED
BESTMAN GAMES CHILDREN’S FINANCE FAIR 2018
TRUCONTACT CSR NIGERIA THE TOP 50 BRANDS MAKING A DIFFERENCE IN NIGERIA
LG SEC TRUST FUND LAGOS STATE SECURITY TRUST FUND
KODY & THE KIDS SPONSORHIP OF READ TO HEAL PROJECT
NSE NIGERIAN STOCK EXCHANGE(NSE) CORPORATE CHALLENGE 2019
10
FIDELITY BANK PLC
Directors’ Report - continued
For the period ended 30 June 2018
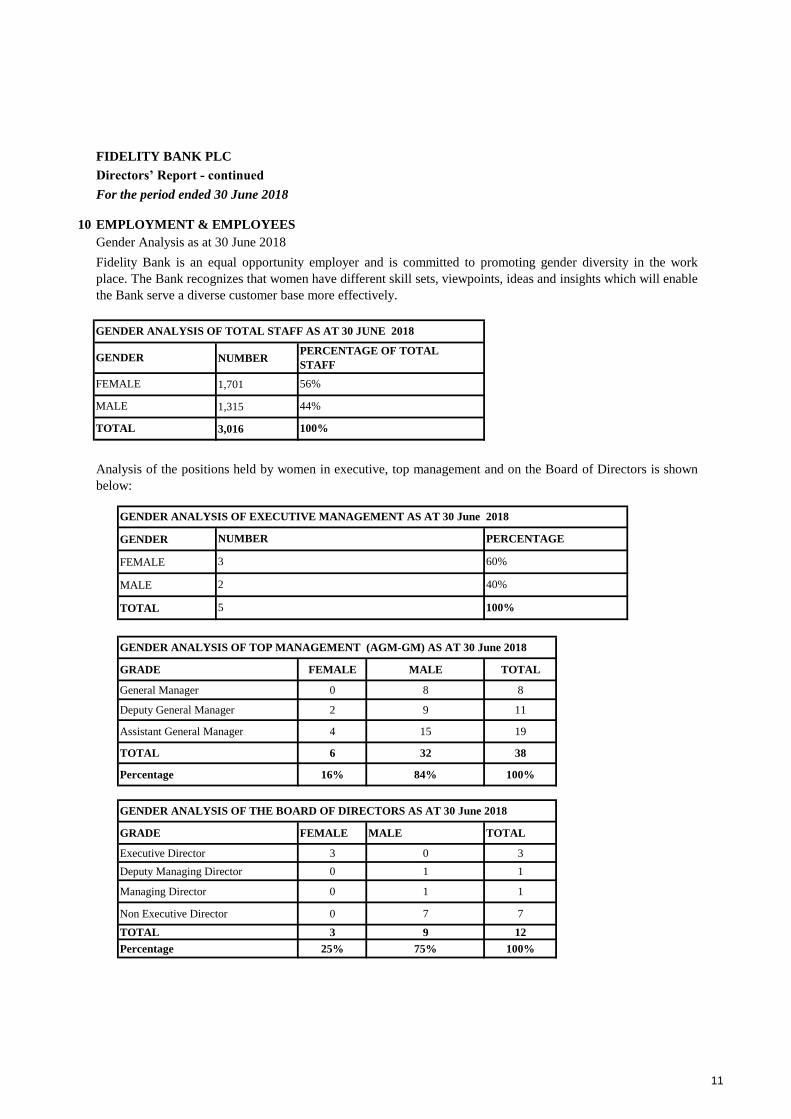
10 EMPLOYMENT & EMPLOYEES
NUMBER
1,701
1,315
3,016
GENDER
FEMALE
MALE
TOTAL
GRADE FEMALE MALE TOTAL
General Manager 0 8 8
Deputy General Manager 2 9 11
Assistant General Manager 4 15 19
TOTAL 6 32 38
Percentage 16% 84% 100%
GRADE FEMALE MALE TOTAL
Executive Director 3 0 3
Deputy Managing Director 0 1 1
Managing Director 0 1 1
Non Executive Director 0 7 7
TOTAL 3 9 12
Percentage 25% 75% 100%
Gender Analysis as at 30 June 2018
Fidelity Bank is an equal opportunity employer and is committed to promoting gender diversity in the work
place. The Bank recognizes that women have different skill sets, viewpoints, ideas and insights which will enable
the Bank serve a diverse customer base more effectively.
GENDER ANALYSIS OF TOTAL STAFF AS AT 30 JUNE 2018
TOTAL 100%
Analysis of the positions held by women in executive, top management and on the Board of Directors is shown
below:
GENDER ANALYSIS OF EXECUTIVE MANAGEMENT AS AT 30 June 2018
NUMBER PERCENTAGE
GENDERPERCENTAGE OF TOTAL
STAFF
FEMALE 56%
MALE 44%
GENDER ANALYSIS OF TOP MANAGEMENT (AGM-GM) AS AT 30 June 2018
GENDER ANALYSIS OF THE BOARD OF DIRECTORS AS AT 30 June 2018
3 60%
2 40%
5 100%
11

FIDELITY BANK PLC
Directors’ Report - continued
For the period ended 30 June 2018
Employment of disabled persons
Fidelity Bank’s policy ensures that there is no discrimination in considering applications for employment
including those from physically challenged persons. The policy also ensures that disadvantaged persons are
afforded, as far as it is practicable, identical opportunities with other employees. Although no physically
challenged person was employed during the year, the Bank currently has in her employment four physically
challenged persons and ensures that the work environment is accessible and conducive for them.
Health, Safety and Welfare of Employees
The health, safety and wellbeing of all employees both in and outside the workplace places is top of the priorities
of Fidelity Bank. The Bank also has not relented but continues to make significant investments along these lines.
Fidelity Bank’s employees are provided with comprehensive healthcare coverage through a health management
scheme with over 1,270 hospitals across the country. The scheme covers each staff, his/her spouse and four
biological children.
The Bank also has an International Health Insurance Scheme which provides staff with a personal health
insurance plan and emergency medical evacuation support.
These healthcare facilities are actively enhanced with annual health screening exercises that have in recent years
included mammograms, prostate screening, eye screening, cardiovascular and tuberculosis screening and
immunizations for cerebrospinal meningitis and Hepatitis B.
Beyond direct clinical healthcare support, staff members also benefit from deliberate and structured preventive
health awareness programmes across the Bank. In this regard, the Bank carries out well articulated awareness
sessions on topical health issues including preventing the spread of malaria, diabetes, hypertension and kidney
disease as well as tips for preventing ill-health during inclement weather conditions like harmattan and rainy
season.
The Bank has a defined process for preventing the spread of communicable diseases including HIV/AIDS
through health campaigns that encourage improvement in personal hygiene and ensures that no person living
with HIV/AIDS is discriminated against.
Through regular medical updates from the in-house Medical Doctor, emails, text messages and yearic “Health
Awareness” presentations staff members are frequently educated on how to take personal responsibility for their
health by consciously making better lifestyle choices.
All staff of Fidelity Bank are insured under the Group Life Insurance Scheme. The scheme caters for staff
members that die while in the service of the Bank. Entitlements are processed, received and given to the
deceased staff’s next of kin as stated in the personnel records.
There were no workplace related fatalities during the review period.
12
FIDELITY BANK PLC
Directors’ Report - continued
For the period ended 30 June 2018
Fidelity Bank is also actively involved in the Nigerian Bankers Games (NBG), the biggest and most popular
sporting event in Corporate Nigeria. In 2017 Fidelity Bank successfully defended its medal table position whilst
retaining the football trophy. The Bank has now won the football trophy three consecutive times thus becoming
the first bank to do so in the 18-year history of the tournament. With this performance, the Bank now has the
trophy for keeps. Overall, the Bank won a total of sixteen (16) medals (7 - Gold; 7 – Silver; and 2 – Bronze) in
the 2017 games.
Winning the 2017 football trophy at the Bankers’ Games also qualified the Bank to participate in the Remitta
Champions Cup in which only the champions in the various corporate games (insurance, telecoms, FMCG and
Bankers Games) participate.
Employee involvement and training
The Bank is committed to keeping employees fully informed of its corporate objectives and the progress made
thus far in achieving same. The opinions and suggestions of members of staff are valued and considered not only
on matters affecting them as employees, but also on the general business of the Bank.
Management operates an open communication policy and employees are encouraged to communicate with
Management through various media.
Sound management and professional expertise are considered to be the Bank’s major assets, and investment in
employees’ future development continues to be a top priority. Fidelity Bank is a learning organization and
believes in the development of her employees, irrespective of their job roles and responsibilities in the Bank.
As an institution committed to maintaining its competitive edge, Fidelity Bank ensures that employees receive
qualitative training within and outside the country. Staff Training Plans are drawn up yearly and hinged on grade
specific base-line and function specific programmes. These include local, offshore and in-house programmes.
Worthy of particular mention, are the Weekly Thursday Lecture Series, the Fidelity Business School with its
various academies and the E-Learning Management System (LMS) Platform, all of which are designed to deepen
staff members’ knowledge, skills and productivity.
The Bank currently has Nine modern learning centres in Lagos, Ibadan, Benin, Port-Harcourt, Owerri, Awka,
Enugu, Abuja and Kano with robust plans to build a similar centre in the North East location of Bauchi. A total
of 2,656 (core) staff members participated in various training programs in 2017; and 1,810 (Non-core) staff were
also trained in the same financial year.
13

FIDELITY BANK PLC
Directors’ Report - continued
For the period ended 30 June 2018
Ezinwa Unuigboje
Company Secretary
FRC/2015/NBA/00000006957
2 Fidelity Close
Off Kofo Abayomi Street
Victoria Island
Lagos
Date: 6 September 2018
One of the joint external auditors, PKF Professional Services’ (whose appointment was approved by
Shareholders at the Annual General Meeting of 6 November 2008), will complete the maximum ten (10) year
tenure for external auditors in 2018, in line with the provisions of the Central Bank of Nigeria’s Code of
Corporate Governance. The firm has indicated its interest to continue in office until the expiration of its tenure
on 5 November 2018.
The other external auditor, Ernst & Young, has indicated its willingness to continue in office in accordance with
Section 357(2) of the Companies and Allied Matters Act, CAP C20 Laws of the Federation of Nigeria (LFN)
2004.
Consequently, the 2018 annual financial year audit shall be handled solely by Ernst & Young.
Auditors
14

FIDELITY BANK PLC
FOR THE PERIOD ENDED 30 JUNE 2018
Director Director
6 September 2018
STATEMENT OF DIRECTORS’ RESPONSIBILITIES IN RELATION TO THE PREPARATION OF THE
INTERIM FINANCIAL STATEMENTS
In accordance with the provisions of Sections 334 and 335 of the Companies and Allied Matters Act, CAP C20 Laws
of the Federation of Nigeria 2004, Sections 24 and 28 of the Banks and Other Financial Institutions Act, CAP B3 Laws
of the Federation of Nigeria 2004, and the Financial Reporting Council Act No. 6, 2011, the Directors are responsible
for the preparation of financial statements which give a true and fair view of the state of affairs of the Bank, and of the
financial performance for the year. The responsibilities include ensuring that:
(a) appropriate internal controls are established both to safeguard the assets of the Bank and to prevent and detect fraud
and other irregularities;
(b) the Bank keeps accounting records which disclose with reasonable accuracy the financial position of the Bank and
which ensure that the financial statements comply with requirements of International Financial Reporting Standards
and the Companies and Allied Matters Act, CAP C20 Laws of the Federation of Nigeria 2004, Banks and Other
Financial Institutions Act, CAP B3 Laws of the Federation of Nigeria 2004, the Financial Reporting Council Act No. 6,
2011, Revised Prudential Guidelines and relevant circulars issued by the Central Bank of Nigeria;
(c) the Bank has used appropriate accounting policies, consistently applied and supported by reasonable and prudent
judgments and estimates, and that all applicable accounting standards have been followed; and
(d) it is appropriate for the financial statements to be prepared on a going concern basis unless it is presumed that the
Bank will not continue in business.
The Directors accept responsibility for the interim financial statements, which have been prepared using appropriate
accounting policies supported by reasonable and prudent judgments and estimates in conformity with International
Financial Reporting Standards, the requirements of the Companies and Allied Matters Act, CAP C20 Laws of the
Federation of Nigeria 2004, Banks and Other Financial Institutions Act, CAP B3 Laws of the Federation of Nigeria
2004, the Financial Reporting Council Act No. 6, 2011, Revised Prudential Guidelines, and relevant circulars issued by
the Central Bank of Nigeria.
The Directors are of the opinion that the interim financial statements give a true and fair view of the state of the
financial affairs of the Bank and its financial performance for the period.
The Directors further accept responsibility for the maintenance of accounting records that may be relied upon in the
preparation of the interim financial statements, as well as adequate systems of financial control.
Nothing has come to the attention of the Directors to indicate that the Bank will not remain a going concern for at least
twelve months from the date of this statement.
Signed on behalf of the Directors by:
15
Chartered Accountants
PKF House
10th and 13th Floor, UBA House 205, Ikorodu Road
57, Marina Obanikoro
Lagos, Nigeria G.P.O. Box 2047 Marina
Tel: +234 (01) 844 996 2/3 Tel: +234 9030001351
Fax:+234 (01) 463 0481 Fax: +234 1 7734940
website: www.ey.com email: lagos@ pkf-ng.com
INDEPENDENT AUDITORS’ REPORT
Opinion
Report on the Audit of the Financial Statements
TO THE MEMBERS OF FIDELITY BANK PLC
We have audited the interim financial statements of Fidelity Bank PLC ("the Bank") which comprise the statement
of financial position as at 30 June 2018, and the statement of profit or loss and other comprehensive income,
statement of changes in equity and statement of cash flows for the period then ended, and notes to the financial
statements, including a summary of significant accounting policies and other explanatory notes.
Basis for Opinion
Key Audit Matters
Key audit matters are those matters that, in our professional judgement, were of most significance in our audit of the
financial statements of the current year. These matters were addressed in the context of our audit of the financial
statements as a whole, and in forming our opinion thereon, and we do not provide a separate opinion on these
matters.
In our opinion, the accompanying interim financial statements present fairly, in all material respects, the financial
position of the Bank as at 30 June 2018, and its financial performance and its cash flows for the period then ended in
accordance with International Financial Reporting Standards and the relevant provisions of the Companies and
Allied Matters Act, CAP C20 Laws of the Federation of Nigeria 2004, the Banks and Other Financial Institutions
Act, CAP B3, Laws of the Federation of Nigeria 2004, the Financial Reporting Council Act No. 6, 2011 and CBN
Circulars.
We conducted our audit in accordance with International Standards on Auditing (ISAs). Our responsibilities under
those standards are further described in the Auditors Responsibilities for the Audit of the Financial Statements
section of our report. We are independent of the Bank in accordance with the International Ethics Standards Board
for Accountants (IESBA), the provisions of the Companies and Allied Matters Act, CAP C20 Laws of the
Federation of Nigeria 2004 (CAMA) and other independence requirements applicable to performing audits of
financial statements of Fidelity Bank PLC. We have fulfilled our other ethical responsibilities in accordance with the
IESBA Code and CAMA applicable to performing the audits of Fidelity Bank PLC. We believe that the audit
evidence we have obtained is sufficient and appropriate to provide a basis for our opinion.
16
Loans and advances constitute a significant portion of the bank's
statement of financial position, as a major component of the bank’s
financial intermediation function revolves round granting of loans.
The adoption of the International Financial Reporting Standards
(IFRS 9) -Financial Instrument recognition and measurement
effective 01 January 2018 introduced an expected credit loss model
(ECL) for recognizing impairments for financial instruments
different from the incurred loss model under IAS 39.
The ECL model involves the application of considerable level of
judgement and estimation in determining inputs for ECL calculation
such as:
• determining criteria for significant increase in credit risk (SICR)
for staging purpose. (At origination, loan is classified under stage 1,
when there is significant increase in credit risk, the loan is migrated
to stage 2 and subsequently to stage 3 when there is default).
• assessing the relationship between the quantitative factors such as
default and qualitative factors such as macro-economic variables.
Our audit approach was a mix of both control and substantive procedures.
We reviewed the Application and IT General Controls governing the IFRS
reporting application deployed by the bank; such as data migration from the
core banking application to the IFRS reporting application for processing
the IFRS numbers, access controls over inputs into the system, change
management controls and staging configuration within the system.
We gained an understanding of how the PD’s and LGD’s were derived by
the system by performing a walkthrough using live data
For loans classified under stages 1 & 2, we selected material loans and
reviewed the repayment history for possible repayment default. We
challenged the various factors considered in classifying the loans within
stage 1 & 2 and in the measurement of ECL.
• incorporating forward looking information in the model building
process
• factors incorporated in determining the Probability of Default
(PD) , the Loss Given Default (LGD), the Recovery Rate and the
Exposure at Default (EAD)
• factors considered in cash flow estimation including timing and
amount
• factors considered in collateral valuation
Adopting IFRS 9 for the first time also requires some judgements in
taking certain key decisions which will impact the transitional
disclosures as at 01 January 2018.
Refer to notes: 2.1.2a, 2.1.3, 8 and 21.
This is considered a key audit matter in the interim financial
statements given the level of complexity and judgement involved in
the process which required considerable audit time and expertise.
For stage 3 loans, we challenged all the assumptions considered in the
estimation of recovery cash flows, the discount factor, collateral valuation
and timing of realization. In instances where we were not satisfied with the
assumptions used by the management in its cash flow estimation and
discounting, we challenged management assumptions by re-computing the
cash flows to determine the recoverable amounts.
Lastly, we reviewed the qualitative and quantitative disclosures for
reasonableness to ensure conformity with the IFRS 7- Financial Instruments:
Disclosures.
Key Audit Matter How the matter was addressed in the audit
Loans and advances - Impairment
INDEPENDENT AUDITORS’ REPORT
TO THE MEMBERS OF FIDELITY BANK PLC - Continued
17

The Directors are responsible for the preparation and fair presentation of these financial statements in accordance
with International Financial Reporting Standards and the provisions of the Companies and Allied Matters Act, CAP
C20 Laws of the Federation of Nigeria 2004, the Banks and Other Financial Institutions Act, CAP B3, Laws of the
Federation of Nigeria 2004, the Financial Reporting Council Act No. 6, 2011 and for such internal control as the
Directors determine is necessary to enable the preparation of financial statements that are free from material
misstatement, whether due to fraud or error.
INDEPENDENT AUDITORS’ REPORT
TO THE MEMBERS OF FIDELITY BANK PLC - Continued
Other Information
The Directors are responsible for the other information. The other information comprises the Statement of Value
added tax, the Five year Financial Summary and the Directors’ Report as required by Section 342 of the Companies
and Allied Matters Act, CAP C20 Laws of the Federation of Nigeria 2004, which we obtained prior to the date of
this report, and the Interim Report, which is expected to be made available to us after that date. Other information
does not include the financial statements and our auditor’s report thereon. Our opinion on the financial statements
does not cover the other information and we do not express an audit opinion or any form of assurance conclusion
thereon. In connection with our audit of the financial statements, our responsibility is to read the other information
and, in doing so, consider whether the other information is materially inconsistent with the financial statements or
our knowledge obtained in the audit, or otherwise appears to be materially misstated. If, based on the work we have
performed on the other information obtained prior to the date of this auditor’s report, we conclude that there is a
material misstatement of this other information, we are required to report that fact. We have nothing to report in this
regard.
Responsibilities of the Directors for the Financial Statements
In preparing the financial statements, the Directors are responsible for assessing the Bank’s ability to continue as a
going concern, disclosing, as applicable, matters related to going concern and using the going concern basis of
accounting unless the Directors either intend to liquidate the Bank or to cease operations, or have no realistic
alternative but to do so.
Auditor’s Responsibilities for the Audit of the Financial Statements
Our objectives are to obtain reasonable assurance about whether the financial statements as a whole are free from
material misstatement, whether due to fraud or error, and to issue an auditor’s report that includes our opinion.
Reasonable assurance is a high level of assurance, but is not a guarantee that an audit conducted in accordance with
ISAs will always detect a material misstatement when it exists. Misstatements can arise from fraud or error and are
considered material if, individually or in the aggregate, they could reasonably be expected to influence the economic
decisions of users taken on the basis of these financial statements.
As part of an audit in accordance with ISAs, we exercise professional judgement and maintain professional
skepticism throughout the audit. We also:
18

• Evaluate the overall presentation, structure and content of the financial statements, including the disclosures, and
whether the financial statements represent the underlying transactions and events in a manner that achieves fair
presentation.
• Obtain sufficient appropriate audit evidence regarding the financial information of the entities or business activities
from the Bank to express an opinion on the financial statements. We are responsible for the direction, supervision
and performance of the audit. We remain solely responsible for our audit opinion.
Auditor’s Responsibilities for the Audit of the Financial Statements - Continued
• Obtain an understanding of internal control relevant to the audit in order to design audit procedures that are
appropriate in the circumstances, but not for the purpose of expressing an opinion on the effectiveness of the Bank’s
internal control.
INDEPENDENT AUDITORS’ REPORT
TO THE MEMBERS OF FIDELITY BANK PLC - Continued
• Identify and assess the risks of material misstatement of the financial statements, whether due to fraud or error,
design and perform audit procedures responsive to those risks, and obtain audit evidence that is sufficient and
appropriate to provide a basis for our opinion. The risk of not detecting a material misstatement resulting from fraud
is higher than for one resulting from error, as fraud may involve collusion, forgery, intentional omissions,
misrepresentations, or the override of internal control.
• Evaluate the appropriateness of accounting policies used and the reasonableness of accounting estimates and
related disclosures made by the Directors.
• Conclude on the appropriateness of the directors’ use of the going concern basis of accounting and based on the
audit evidence obtained, whether a material uncertainty exists related to events or conditions that may cast
significant doubt on the Bank’s ability to continue as a going concern. If we conclude that a material uncertainty
exists, we are required to draw attention in our auditors report to the related disclosures in the financial statements
or, if such disclosures are inadequate, to modify our opinion. Our conclusions are based on the audit evidence
obtained up to the date of our auditors report. However, future events or conditions may cause the Bank to cease to
continue as a going concern.
19

i)
ii)
iii)
i)
ii)
iii)
Signed: Signed:
Jamiu Olakisan, FCA, Najeeb A. Abdussalaam, FCA
FRC/2013/ICAN/00000003918 FRC/2013/ICAN/00000000753
For: Ernst & Young For: PKF Professional Services
Chartered Accountants Chartered Accountants
Lagos, Nigeria Lagos, Nigeria
Date: 18 September 2018 Date: 18 September 2018
Returns on customers’ complaints are disclosed in Note 38.2 to the financial statements in compliance with
Central Bank of Nigeria circular PDR/DIR/CIR/01/20.
As stated in Note 38.1 to the financial statements, the Bank paid penalties for contraventions of certain sections of
the Banks and Other Financial Institutions Act CAP B3, Laws of the Federation of Nigeria 2004 and relevant
Central Bank of Nigeria Circulars during the period ended 30 June 2018.
Report on Other Legal and Regulatory Requirements
In accordance with the requirement of Schedule 6 of the Companies and Allied Matters Act, CAP C20 Laws of the
Federation of Nigeria 2004, we confirm that:
We have obtained all the information and explanations which to the best of our knowledge and belief were
necessary for the purpose of our audit;
In our opinion proper books of account have been kept by the Bank, in so far as it appears from our examination
of those books;
We also provide the Directors with a statement that we have complied with relevant ethical requirements regarding
independence, and to communicate with them all relationships and other matters that may reasonably be thought to
bear on our independence, and where applicable, related safeguards.
From the matters communicated with the Directors, we determine those matters that were of most significance in the
audit of the financial statements of the current year and are therefore the key audit matters. We describe these
matters in our auditor report unless law or regulation precludes public disclosure about the matter or when, in
extremely rare circumstances, we determine that a matter should not be communicated in our report because the
adverse consequences of doing so would reasonably be expected to outweigh the public interest benefits of such
communication.
Related party transactions and balances are disclosed in Note 35 of the financial statements in compliance with
Central Bank of Nigeria circular BSD/1/2004.
the Bank’s statement of financial position and statement of profit or loss and other comprehensive income are in
agreement with the books of account.
In compliance with the Banks and Other Financial Institutions Act, CAP B3 Laws of the Federation of Nigeria 2004
and circulars issued by Central Bank of Nigeria, we confirm that:
INDEPENDENT AUDITORS’ REPORT
TO THE MEMBERS OF FIDELITY BANK PLC - Continued
20

FIDELITY BANK PLC
INTERIM STATEMENT OF PROFIT OR LOSS AND OTHER COMPREHENSIVE INCOME
FOR THE PERIOD ENDED 30 JUNE 2018
Notes 2018 2017
N'million N'million
Gross Earnings 88,917 85,821
Interest and similar income 6 72,876 71,097
Interest and similar expense 7 (41,989) (38,153)
Net interest income 30,887 32,944
Credit loss expense 8 (2,593) (4,812)
Net interest income after credit loss expense 28,294 28,132
Fee and commission income 9 13,703 9,411
Fee and commission expense 9 (1,759) (1,988)
Other operating income 10 2,338 3,557
Net gains from financial assets at fair value through profit or loss 11 3,093 2,006
Personnel expenses 12 (10,499) (11,074)
Depreciation and amortisation 13 (2,816) (1,855)
Other operating expenses 14 (19,344) (17,972)
Profit before income tax 13,010 10,217
Income tax expense 15 (1,167) (1,183)
PROFIT FOR THE PERIOD 11,843 9,034
Other comprehensive income:
Items that will not be reclassified subsequently to profit or loss
Revaluation gains on equity instruments at fair value through other
comprehensive income* 32 103 -
Total items that will not be reclassified to profit or loss in subsequent period 103 -
Items that will be reclassified subsequently to profit or loss
Debt instruments at fair value through other comprehensive income*:
- Net change in fair value during the period (3,059) -
- Changes in allowance for expected credit losses (1) -
- Reclassification adjustments to profit or loss 16 (372) -
Net losses on debt instruments at fair value through other comprehensive
income (3,432) -
Available-for-sale financial assets*:
- Unrealised net gains arising during the period - 1,976
- Net reclassification adjustments for realised net gains 16 - (19)
Net gains on available-for-sale financial assets - 1,957
Total items that will be reclassified to profit or loss in subsequent period (3,432) 1,957
Other comprehensive (loss)/income for the year, net of tax (3,329) 1,957
TOTAL COMPREHENSIVE INCOME FOR THE PERIOD, NET OF TAX 8,514 10,991
* Income from these instruments is exempted from tax
Earnings per share
Basic and diluted (in kobo) 17 41 31
The accompanying notes to the interim financial statements are an integral part of these interim financial statements.
Audited
Six months ended 30 June

Fidelity Bank Plc
Corporate Governance Report
For The Half Year Ended 30 June 2018
Introduction
Corporate Governance Framework
This Report is designed to update stakeholders on how Fidelity Bank Plc (“Fidelity” or “the Bank”) discharged its fiduciary
responsibilities in relation to governance as well as its level of compliance with relevant statutory and regulatory requirements
during the review period.
The Board of Directors is committed to ensuring sustainable long term success for the Bank and is mindful that best practice in
corporate governance is essential for ensuring accountability, fairness and transparency in a company’s relationship with all
its stakeholders.
The Bank’s Shared Values of Customer First, Respect, Excellence, Shared Ambition and Tenacity (CREST) continue to be the
guiding principles which we believe are necessary to sustain the growth of the business and our relationship with
stakeholders, while keeping faith with our Vision to be “No. 1 in every market we serve and every branded product we offer”.
Fidelity Bank has a structured corporate governance framework which supports the Board’s objective of achieving
sustainable value. This is reinforced by the right culture, values and actions at the Board and Management level and
throughout the entire organization.
The Board of Directors is the principal driver of corporate governance and has overall responsibility for ensuring that the
tenets of good corporate governance are adhered to in the management of the Bank. In the Bank’s pursuit to achieve long-
term shareholder value, we constantly strive to maintain the highest standards of corporate governance, which are the
foundation on which we manage risk and build the trust of all our stakeholders.
The Board continues to comply with the Bank’s internal governance policies and the provisions of the Companies and Allied
Matters Act (CAMA) Cap C.20 Laws of the Federation of Nigeria, 2004. The Bank’s governance framework is also designed to
ensure on-going compliance with applicable governance codes: Central Bank of Nigeria’s (CBN) Code of Corporate
Governance for Banks and Discount Houses in Nigeria (“the CBN Code”), the Securities & Exchange Commission’s Code of
Corporate Governance (“the SEC Code”), the Post-Listing Requirements as well as the Rules issued from time to time by the
Nigerian Stock Exchange (NSE).
The Bank undertakes frequent internal assessment of its compliance with the Codes/Rules and submits periodic compliance
reports to the CBN, SEC, NSE and the Nigeria Deposit Insurance Corporation (NDIC).
The Codes and Rules are quite detailed and cover a wide range of issues, including Board and Management, Shareholders,
Rights of other Stakeholders, Disclosure Requirements, Risk Management, Organizational Structure, Quality of Board
Membership, Board Performance Appraisal, Reporting Relationship, Ethics and Professionalism, Conflict of Interest,
Sustainability, Whistle-blowing, Code of Ethics, Complaints Management Processes and the Role of Auditors. These, in addition
to the Bank’s Memorandum and Articles of Association, Board, Board Committees and Management Committee Charters,
collectively constitute the basis of the Bank’s corporate governance framework.
The Bank’s governance structure is hinged on its internal governance framework, which is executed through the following
principal organs:
(a) The Board of Directors
(b) Board Committees
(c) Statutory Audit Committee
(d) General Meetings
(e) Management Committees
22
Fidelity Bank Plc
Corporate Governance Report
For The Half Year Ended 30 June 2018
Key Governance Development
Retirement of Joint External Auditor
The Board of Directors
Board Size
Board Structure and Responsibilities
Responsibility for the day-to-day management of the Bank resides with the Managing Director/Chief Executive Officer
(MD/CEO), who carries out his functions in accordance with guidelines approved by the Board of Directors. The MD/CEO is
ably assisted by the four (4) Executive Directors. In line with best practice and requisite regulations, the roles of the Chairman
of the Bank and the MD/CEO are assumed by different individuals to ensure that the right balance of power and authority is
maintained.
The effectiveness of the Board is derived from the broad range of skills and competencies of the Directors, who are persons of
high integrity and seasoned professionals and are competent, knowledgeable and proficient in their professional career,
business and/or vocation.
The Directors bring to the Board their diverse experience in several fields ranging from business, corporate finance,
accounting, management, banking operations, risk management, project finance, leasing, law, and treasury management.
The diverse professional backgrounds of the Directors reflects a balanced mix of skills, experiences and competencies that
impacts positively on the Board’s activities. No individual dominates the decision making process and the Board operated
effectively throughout the period and continues to do so.
Total Board size during the Half Year ended 30 June 2018 was Twelve (12), comprising five (5) Executive Directors including the
Managing Director/CEO and seven (7) Non-Executive Directors.
The Board is responsible for creating and delivering sustainable value to all stakeholders through efficient management of
the business. The Board is also responsible for determining the strategic direction of the Bank, which said strategy is
implemented through Executive Management, within a framework of rewards, incentives and controls.
Executive Management, led by the MD/CEO, constitute the key management organ of the Bank and is primarily responsible
for achieving performance expectations and increasing shareholder value. Executive Management reports regularly to the
Board on issues relating to the growth and development of the Bank. The Board plays a major supportive and
complementary role in ensuring that the Bank is well managed and that appropriate controls are in place and fully
operational.
The Board is accountable to the Bank’s stakeholders and continues to play a key role in governance. It is the responsibility of
the Board of Directors to approve the Bank’s organizational strategy, develop directional policy, appoint, supervise and
remunerate senior executives and ensure accountability of the Bank to its owners, stakeholders and the regulatory authorities.
The Board is also responsible for providing stable and effective leadership for the Bank, to facilitate achievement of its
corporate operating objectives.
One of the joint external auditors, PKF Professional Services’ (whose appointment was approved by Shareholders at the
Annual General Meeting of November 6, 2008), will complete the maximum ten (10) year tenure for external auditors in line
with the provisions of the Central Bank of Nigeria’s Code of Corporate Governance. The firm has indicated its interest to
continue in office until the expiration of its tenure on November 5, 2018.
The second external auditor, Ernst & Young, has indicated its willingness to continue in office in accordance with Section
357(2) of the Companies and Allied Matters Act, CAP C20 Laws of the Federation of Nigeria (LFN) 2004.
Consequently, the June 2018 half year audit will be handled by both auditors, while the 2018 financial year audit shall be
handled solely by Ernst & Young.
23
Fidelity Bank Plc
Corporate Governance Report
For The Half Year Ended 30 June 2018
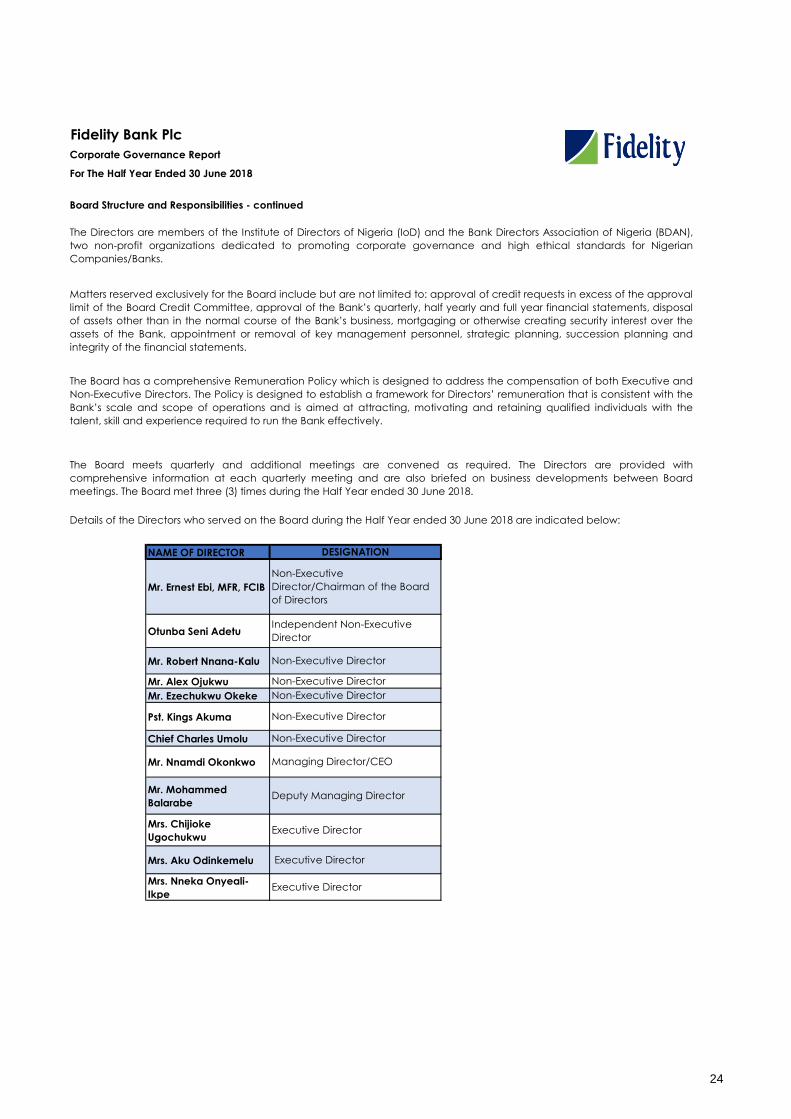
NAME OF DIRECTOR
Mr. Ernest Ebi, MFR, FCIB
Otunba Seni Adetu
Mr. Robert Nnana-Kalu
Mr. Alex Ojukwu
Mr. Ezechukwu Okeke
Pst. Kings Akuma
Chief Charles Umolu
Mr. Nnamdi Okonkwo
Mr. Mohammed
Balarabe
Mrs. Chijioke
Ugochukwu
Mrs. Aku Odinkemelu
Mrs. Nneka Onyeali-
Ikpe
DESIGNATION
Non-Executive Director
Non-Executive Director
Non-Executive Director
Managing Director/CEO
Deputy Managing Director
Executive Director
Executive Director
Executive Director
Non-Executive
Director/Chairman of the Board
of Directors
Independent Non-Executive
Director
Non-Executive Director
Non-Executive Director
The Directors are members of the Institute of Directors of Nigeria (IoD) and the Bank Directors Association of Nigeria (BDAN),
two non-profit organizations dedicated to promoting corporate governance and high ethical standards for Nigerian
Companies/Banks.
Matters reserved exclusively for the Board include but are not limited to: approval of credit requests in excess of the approval
limit of the Board Credit Committee, approval of the Bank’s quarterly, half yearly and full year financial statements, disposal
of assets other than in the normal course of the Bank’s business, mortgaging or otherwise creating security interest over the
assets of the Bank, appointment or removal of key management personnel, strategic planning, succession planning and
integrity of the financial statements.
The Board has a comprehensive Remuneration Policy which is designed to address the compensation of both Executive and
Non-Executive Directors. The Policy is designed to establish a framework for Directors’ remuneration that is consistent with the
Bank’s scale and scope of operations and is aimed at attracting, motivating and retaining qualified individuals with the
talent, skill and experience required to run the Bank effectively.
The Board meets quarterly and additional meetings are convened as required. The Directors are provided with
comprehensive information at each quarterly meeting and are also briefed on business developments between Board
meetings. The Board met three (3) times during the Half Year ended 30 June 2018.
Details of the Directors who served on the Board during the Half Year ended 30 June 2018 are indicated below:
Board Structure and Responsibilities - continued
24

Fidelity Bank Plc
Corporate Governance Report
For The Half Year Ended 30 June 2018
Directors’ Appointments, Retirements and Re-elections
Board Induction and Continuous Education
COURSE START DATE END DATE
COMPLIAINCE RISK
MAGAGEMENT18-Apr-18 20-Apr-18
McGILL EXECUTIVE
LEADERSHIP EXPERIENCE14-May-18 19-May-18
EFFECTIVE BOARD RISK
OVERSIGHT COURSE21-May-18 23-May-18
EFFECTIVE BOARD RISK
OVERSIGHT COURSE21-May-18 23-May-18
EFFECTIVE BOARD RISK
OVERSIGHT COURSE21-May-18 23-May-18
EFFECTIVE BOARD RISK
OVERSIGHT COURSE21-May-18 23-May-18
EFFECTIVE BOARD RISK
OVERSIGHT COURSE21-May-18 23-May-18
LEADING DIGITAL BUSINESS
TRANSFORMATION11-Jun-18 15-Jun-18
FITC
FITC
IMD
FACILITATOR
EUROMONEY TRAINING
MCGILL EXECUTIVE INSTITUTE, MCGILL
UNIVERSITY, MONTREAL, QUEBEC,
CANADA
FITC
FITC
FITC
Directors’ appointments, retirements and re-elections are effected in accordance with the provisions of the Bank’s
Memorandum and Articles of Association, the Directors’ Selection Criteria Policy, the Central Bank’s Assessment Criteria for
Approved Persons Regime in Nigeria as well as other relevant laws, to ensure a balanced and experienced Board.
The Bank has a Directors Training Policy which provides for formal induction programmes for newly appointed Directors and
bespoke training programmes for serving Directors. The Directors also participate in Regulator initiated training programmes.
An induction plan is designed for all new Directors and involves both personalized in-house orientation including individual
meetings with Executive Management and Senior Executives responsible for the Bank’s key business areas, and external
training. The induction programme includes an overview of the Bank’s operations, risk management, treasury operations,
internal audit, compliance, corporate governance framework and Board processes. Board development programmes also
involve a combination of executive coaching sessions and annual Board strategy retreats.
New Directors also receive a comprehensive induction pack which includes copies of Board/ Board Committee Charters,
annual goals, relevant legislations and calendar of Board activities. The induction and training programmes are robust and
designed to equip all Directors to effectively discharge their responsibilities whilst improving overall board effectiveness. The
Bank renders periodic returns on training programmes attended by Directors to the Central Bank.
During the period under review, the Directors attended the training courses indicated below:
The Board Corporate Governance Committee is charged with the responsibility of leading the process for Board
appointments and for ascertaining and recommending suitable candidates for the approval of the Board. The process is
transparent and may involve external consultants, particularly for executive positions. The importance of achieving the right
balance of skills, experience and diversity is also taken into consideration in making Board appointments.
Given the increasing complexity of banking transactions, the demands of the operating environment and their weighty
oversight responsibilities, the Board of Fidelity Bank acknowledges that its ability to effectively discharge its functions can only
be enhanced by qualitative training programs. Training of individual Directors and the Board as a whole are important
investments for every organization, given the strong correlation between qualitative Board training programmes and sound
corporate governance practices, growth and profitability.
25

Fidelity Bank Plc
Corporate Governance Report
For The Half Year Ended 30 June 2018
Access to independent advice:
No Consultant
1. KPMG Professional
Services
2.
PricewaterhouseCoo
pers
3 IBFCAlliance Limited
Board Performance Appraisal:
Board Appraisal
Strategy and Management
Brief
The appraisal enables the Board to identify future developmental needs, while also benchmarking its performance against
global best practices and enhancing board effectiveness.
Board Meetings
To ensure its effectiveness throughout the year, the Board develops an Annual Agenda Cycle, Annual Goals and Calendar of
Board activities at the beginning of each year. These not only focus the activities of the Board, but also establish benchmarks
against which its performance can be evaluated at the end of the year.
While a detailed forward agenda is available, same is periodically updated to reflect contemporary issues that may arise,
which may be of interest to the Bank in particular and the finance industry or national/global economies. The Board meets
quarterly or as the need arises.
(a) Defining strategy and management of the Board’s own activities.
(b) Monitoring Management and evaluating its performance against defined objectives.
(c) Implementing effective internal control systems.
(d) Communicating standards of ethical organizational behaviour by setting the tone at the top.
The independent consultant’s report on the Board appraisal is presented to Shareholders at the Annual General Meeting in
each year and also submitted to the Central Bank of Nigeria.
In compliance with the Codes and global best practices, the Board ensures that the Directors have access to independent
professional advice where they deem same necessary to discharge their responsibilities as Directors. The Bank also provides
the Directors with sufficient resources to enable them execute their oversight responsibilities.
Independent consultants engaged during the review period include:
The Board, recognizing the need to maintain an energized, proactive and effective Board, adopted a formal Board and
Board Committees’ Evaluation Policy in April 2012. To give effect to the provisions of the Policy and comply with the Codes,
the Board engages an independent consultant to conduct an annual appraisal of the Board’s performance and highlight
any issues that require remedial action.
Business Process Re-
engineering
Board Training and
Development
The appraisal is extensive and covers the Board, Board Committees and individual Directors, focusing on strategy, corporate
culture, monitoring, evaluation, performance and stewardship. A governance survey is also occasionally administered on
senior management staff of the Bank and the result of the survey is presented to the Board.
Amongst other indices the annual assessment focuses on the Board’s role in the following key areas:
26
Fidelity Bank Plc
Corporate Governance Report
For The Half Year Ended 30 June 2018
A. Board Committees
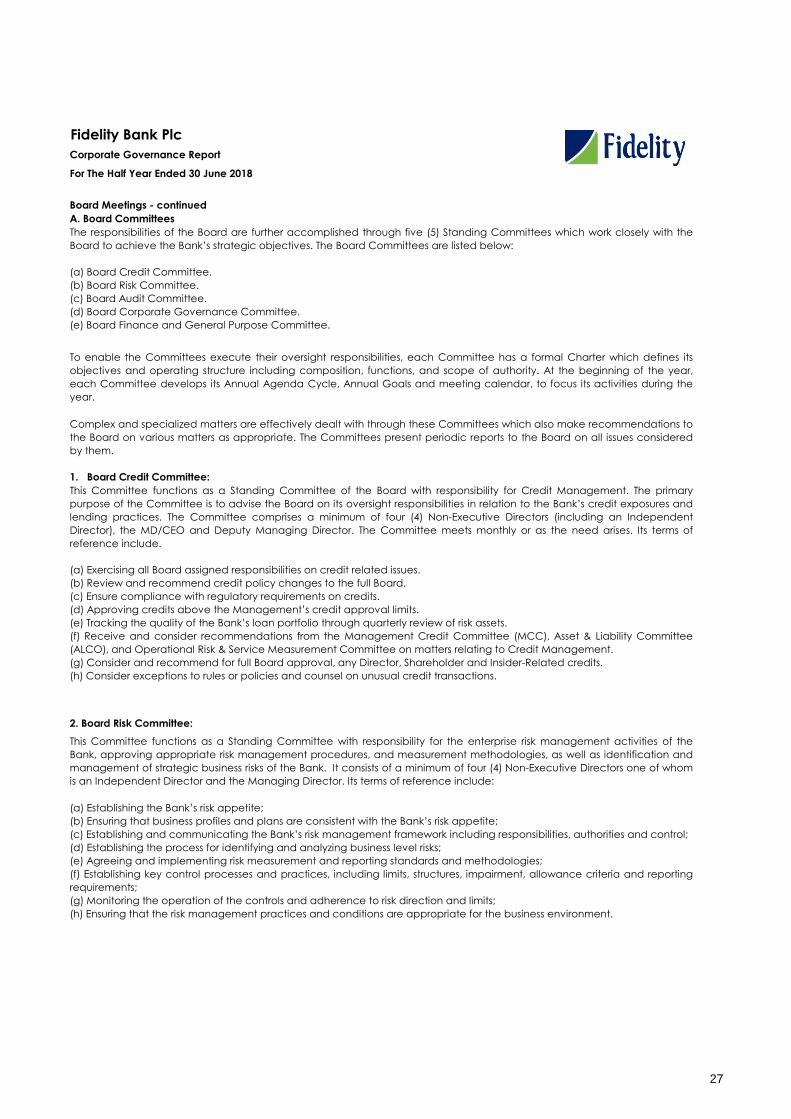
This Committee functions as a Standing Committee of the Board with responsibility for Credit Management. The primary
purpose of the Committee is to advise the Board on its oversight responsibilities in relation to the Bank’s credit exposures and
lending practices. The Committee comprises a minimum of four (4) Non-Executive Directors (including an Independent
Director), the MD/CEO and Deputy Managing Director. The Committee meets monthly or as the need arises. Its terms of
reference include.
(a) Exercising all Board assigned responsibilities on credit related issues.
(b) Review and recommend credit policy changes to the full Board.
(c) Ensure compliance with regulatory requirements on credits.
(d) Approving credits above the Management’s credit approval limits.
(e) Tracking the quality of the Bank’s loan portfolio through quarterly review of risk assets.
(f) Receive and consider recommendations from the Management Credit Committee (MCC), Asset & Liability Committee
(ALCO), and Operational Risk & Service Measurement Committee on matters relating to Credit Management.
(g) Consider and recommend for full Board approval, any Director, Shareholder and Insider-Related credits.
(h) Consider exceptions to rules or policies and counsel on unusual credit transactions.
2. Board Risk Committee:
This Committee functions as a Standing Committee with responsibility for the enterprise risk management activities of the
Bank, approving appropriate risk management procedures, and measurement methodologies, as well as identification and
management of strategic business risks of the Bank. It consists of a minimum of four (4) Non-Executive Directors one of whom
is an Independent Director and the Managing Director. Its terms of reference include:
(a) Establishing the Bank’s risk appetite;
(b) Ensuring that business profiles and plans are consistent with the Bank’s risk appetite;
(c) Establishing and communicating the Bank’s risk management framework including responsibilities, authorities and control;
(d) Establishing the process for identifying and analyzing business level risks;
(e) Agreeing and implementing risk measurement and reporting standards and methodologies;
(f) Establishing key control processes and practices, including limits, structures, impairment, allowance criteria and reporting
requirements;
(g) Monitoring the operation of the controls and adherence to risk direction and limits;
(h) Ensuring that the risk management practices and conditions are appropriate for the business environment.
To enable the Committees execute their oversight responsibilities, each Committee has a formal Charter which defines its
objectives and operating structure including composition, functions, and scope of authority. At the beginning of the year,
each Committee develops its Annual Agenda Cycle, Annual Goals and meeting calendar, to focus its activities during the
year.
Complex and specialized matters are effectively dealt with through these Committees which also make recommendations to
the Board on various matters as appropriate. The Committees present periodic reports to the Board on all issues considered
by them.
1. Board Credit Committee:
The responsibilities of the Board are further accomplished through five (5) Standing Committees which work closely with the
Board to achieve the Bank’s strategic objectives. The Board Committees are listed below:
(a) Board Credit Committee.
(b) Board Risk Committee.
(c) Board Audit Committee.
(d) Board Corporate Governance Committee.
(e) Board Finance and General Purpose Committee.
Board Meetings - continued
27

Fidelity Bank Plc
Corporate Governance Report
For The Half Year Ended 30 June 2018
The Committee meets quarterly or as the need arises. Occasionally, a joint meeting is held between the Board Credit
Committee and the Board Risk Committee to review credit risk related issues.
28

Fidelity Bank Plc
Corporate Governance Report
For The Half Year Ended 30 June 2018
3. Board Audit Committee:
4. Board Corporate Governance Committee:
5. Board Finance & General Purpose Committee:
The Committee functions as a Standing Committee of the Board with responsibility for internal control over financial reporting,
including internal and external audit. The Committee is composed of a minimum of four (4) Non-Executive Directors
(including an Independent Director). The Committee meets quarterly or as the need arises. Its terms of reference include:
The Board Corporate Governance Committee comprises a minimum of four (4) Non- Executive Directors (including an
Independent Director). The Managing Director (and in his absence, the Deputy Managing Director, or an Executive Director
nominated by him) and the Executive Director, Shared Services & Products are required to be in attendance at the
Committee’s meetings. The Board Committee has oversight responsibility for issues relating to the Bank’s Corporate
Governance Framework. The Committee meets quarterly or as the need arises. Its terms of reference include:
The Board Finance & General Purpose Committee has oversight responsibility for issues relating to the Bank’s budgetary
process, procurements and strategic planning. The Committee is comprised of a minimum of four (4) Non-Executive Directors
(including an Independent Director). The Committee meets quarterly or as the need arises. Its terms of reference include:
(a) Review major expense lines periodically and approve expenditure within the approval limit of the Committee as
documented in the financial manual of authorities;
(b) Participate in and lead an annual strategy retreat for the Board.
(c) Review annually, the Bank’s financial projections, as well as capital and operating budgets and review on a quarterly
basis with Management, the progress of key initiatives, including actual financial results against targets and projections.
(d) Make recommendations to the Board regarding the Bank’s investment strategy, policy and guidelines, its implementation
and compliance with those policies and guidelines and the performance of the Bank’s investment portfolios.
(e) Ensure a transparent and competitive tendering process on major contracts to guarantee the best value for the Bank.
(f) Review and recommend to the Board for approval, the procurement strategy and policy for the Bank.
(g) Ensure that all major contracts are carried out according to the terms and conditions of the contract agreement.
(h) Other finance matters including recommending for Board approval, the Bank’s dividend policy, including amount, nature
and timing and other corporate actions.
(i) Recommend a comprehensive framework for delegation of authority on financial matters and ensure compliance with
same.
(a) Ensuring the integrity of the Bank’s financial reporting system.
(b) Ensuring the existence of independent internal and external audit functions.
(c) Ensuring the effectiveness of the internal control system, prudence and accountability in significant contracts and
compliance with regulatory requirements.
(d) Effectiveness of accounting and operating procedures, and
(e) Ensuring compliance with legal and regulatory requirements.
(a) Review and make recommendations for improvements to the Bank’s Corporate Governance Framework.
(b) Recommend membership criteria for the Board and its Committees.
(c) Review and make recommendations on the Bank’s key human capital policies.
(d) Review and make recommendations on Key Performance Indicators for the Managing Director and Executive Directors.
(e) Ensure that an independent Board evaluation exercise is undertaken annually.
(f) Provide oversight for Directors’ orientation and continuing education programmes.
(g) Ensure proper reporting and disclosure of the Bank’s corporate governance procedures to stakeholders.
(h) Ensure proper succession planning for the Bank.
29
Fidelity Bank Plc
Corporate Governance Report
For The Half Year Ended 30 June 2018
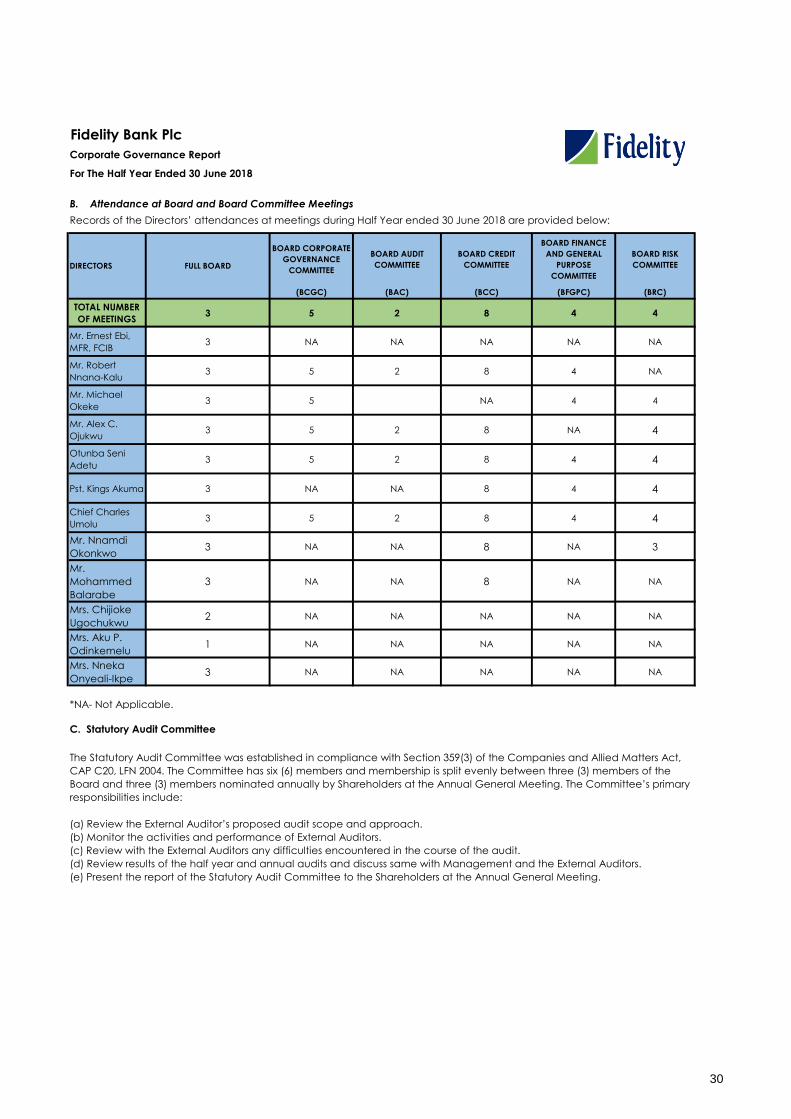
B. Attendance at Board and Board Committee Meetings
Records of the Directors’ attendances at meetings during Half Year ended 30 June 2018 are provided below:
BOARD CORPORATE
GOVERNANCE
COMMITTEE
BOARD AUDIT
COMMITTEE
BOARD CREDIT
COMMITTEE
BOARD FINANCE
AND GENERAL
PURPOSE
COMMITTEE
BOARD RISK
COMMITTEE
(BCGC) (BAC) (BCC) (BFGPC) (BRC)
TOTAL NUMBER
OF MEETINGS3 5 2 8 4 4
Mr. Ernest Ebi,
MFR, FCIB3 NA NA NA NA NA
Mr. Robert
Nnana-Kalu3 5 2 8 4 NA
Mr. Michael
Okeke 3 5 NA 4 4
Mr. Alex C.
Ojukwu 3 5 2 8 NA 4
Otunba Seni
Adetu 3 5 2 8 4 4
Pst. Kings Akuma 3 NA NA 8 4 4
Chief Charles
Umolu3 5 2 8 4 4
Mr. Nnamdi
Okonkwo3 NA NA 8 NA 3
Mr.
Mohammed
Balarabe
3 NA NA 8 NA NA
Mrs. Chijioke
Ugochukwu2 NA NA NA NA NA
Mrs. Aku P.
Odinkemelu 1 NA NA NA NA NA
Mrs. Nneka
Onyeali-Ikpe 3 NA NA NA NA NA
*NA- Not Applicable.
C. Statutory Audit Committee
The Statutory Audit Committee was established in compliance with Section 359(3) of the Companies and Allied Matters Act,
CAP C20, LFN 2004. The Committee has six (6) members and membership is split evenly between three (3) members of the
Board and three (3) members nominated annually by Shareholders at the Annual General Meeting. The Committee’s primary
responsibilities include:
(a) Review the External Auditor’s proposed audit scope and approach.
(b) Monitor the activities and performance of External Auditors.
(c) Review with the External Auditors any difficulties encountered in the course of the audit.
(d) Review results of the half year and annual audits and discuss same with Management and the External Auditors.
(e) Present the report of the Statutory Audit Committee to the Shareholders at the Annual General Meeting.
DIRECTORS FULL BOARD
30

Fidelity Bank Plc
Corporate Governance Report
For The Half Year Ended 30 June 2018
C. Statutory Audit Committee - continued
S/N NAME DESIGNATIONNUMBER OF
MEETINGS
1. Mr Chidi AgbapuChairman/
Shareholder Rep.2
2. Dr. Christian NwiniaShareholder
Representative2
3. Mr Frank OnwuShareholder
Representative2
4. Mr Michael OkekeNon-Executive
Director2
5. Mr Alex OjukwuNon-Executive
Director2
6. Pst.Kings AkumaNon-Executive
Director2
D. General Meetings
The meetings are convened and conducted in a transparent manner and also attended by representatives of the Central
Bank of Nigeria, Securities & Exchange Commission, Nigerian Stock Exchange, Corporate Affairs Commission, Nigeria Deposit
Insurance Corporation and various Shareholders’ Associations.
The Board takes a keen interest in its responsibility to ensure that material developments (financial and non-financial) are
promptly communicated to shareholders. The Board is also conscious of regulatory reporting requirements and routinely
discloses material information to all stakeholders. To achieve this, the Bank has developed formal structures for information
dissemination via direct communication to all interested parties using electronic and print media as well as its website,
www.fidelitybank.ng
The Bank’s Company Secretariat is well equipped to handle enquiries from shareholders in a timely manner. The Company
Secretary also ensures that any concerns expressed by investors, are communicated to Management and the Board as
appropriate.
In addition to the Board, Board Committees, Statutory Audit Committee and the Shareholders in General Meeting, the Bank’s
governance objectives are also met through the Management Committees. Each Management Committee has a formal
Charter which guides its purpose, composition, responsibilities and similar matters. Fuller details on the operations of the
Committees are detailed below:
E. Management Committees
Notes- The Charter of the Statutory Audit Committee requires that at least two (2) representatives of the Shareholders are
present at every meeting.
Fidelity Bank recognizes that its shareholders are major stakeholders in the enterprise and that General Meetings are the
primary avenue for interaction between the shareholders, Management and the Board. Since shareholders collectively
constitute the highest decision making organ in the Company, the Bank complies strictly with regulatory requirements and
convenes at least one General Meeting (the Annual General Meeting) each financial year, to give all shareholders the
opportunity to participate in governance.
Membership and attendance at the Statutory Audit Committee meetings during the Half Year ended 30 June 2018 is as
indicated below:
31
Fidelity Bank Plc
Corporate Governance Report
For The Half Year Ended 30 June 2018
2. Asset & Liability Committee:
Membership of the Asset & Liability Committee is derived mainly from the asset and liability generation divisions of the Bank.
The Committee meets fortnightly or as required and has the following key objectives:
(a) Review the economic outlook and its impact on the Bank’s strategy.
(b) Ensure adequate liquidity.
(c) Ensure that interest rate risks are within acceptable parameters.
(d) Maintain and enhance the capital position of the Bank.
(e) Maximize risk adjusted returns to stakeholders over the long term.
3. Management Credit Committee:
The primary purpose of the Committee is to advise the Board of Directors on its oversight responsibilities in relation to the
Bank’s credit exposures and lending practices. The Committee also provides guidance on development of the Bank’s credit
and lending objectives. The Committee meets once a week or as necessary and its key responsibilities include the following:
(a) Establishing the Minimum Lending Rate and Prime Lending Rate (PLR).
(b) Recommending Target Market Definition (TMD) and Risk Assets Acceptance Criteria (RAAC).
(c) Pre-approval of Platform Credits (Product Papers).
(d) Recommend Inter-Bank and Discount House Placement Limits.
(e) Review the policies and the methodologies for assessing the Bank’s credit risks and recommend appropriate exposure
limits.
(f) Approve credit facilities within the Committee’s approval limits and recommend for approval as appropriate, credit
facilities above its approval limit.
(g) Review and recommend the Bank’s loan portfolio limits and classifications.
(h) Review and recommend changes to credit policy guidelines for Board approval.
The Executive Committee (EXCO) is charged with overseeing the business of the Bank within agreed financial and other limits
set by the Board from time to time. This Committee is comprised of the Managing Director and the Executive Directors of the
Bank. The Committee meets monthly or as required and has the following key objectives:
(a) Ensure implementation of the Bank’s Business Plan and Strategy upon approval of same by the Board;
(b) Review budget presentations for each financial year ahead of presentation to the Board;
(c) Evaluate the Bank’s strategy at quarterly intervals and update the Board on same;
(d) Review the Bank’s Budget performance at quarterly intervals and update the Board on same at bi-annual intervals;
(e) Review the Bank’s Quarterly, Half-Yearly and Full Year financial statements ahead of presentation to the Board and the
Regulators;
(f) Review and approve proposals for capital expenditure and acquisitions within its approval limit;
(g) Make recommendations to the Board on dividend and/or corporate actions for each financial year; and
(h) Any other matter as the Board may direct.
1. Executive Committee:
4. Criticized Assets Committee:
The Criticized Assets Committee is responsible for the review and coverage of the Bank’s total risk assets portfolio for quality.
It also ensures that approved facilities are operated in accordance with approved terms and conditions and accelerates
collection/recovery of non-performing loans. This Committee is comprised of the Managing Director and all the Executive
Directors of the Bank and key management personnel including the Chief Risk Officer. The Committee meets monthly or as
required and has the following key objectives:
32
Fidelity Bank Plc
Corporate Governance Report
For The Half Year Ended 30 June 2018
5. Quarterly Business Review Committee:
6. Operational Risk & Service Measurement Committee:
Except for the Board Credit Committee, which meets monthly or as the need arises, all other Board and Board Committee
meetings are held quarterly or as the need arises. The Chairman is not a member of any Board Committee. Each Board
Committee Chairman presents a formal report on the Committee’s deliberations at subsequent Board meetings.
Management Committee Meetings are held weekly, fortnightly, monthly or quarterly per the terms of reference of each
Committee or as the need arises. The Bank diligently submits its financial reports quarterly, half yearly and annually to the
Securities & Exchange Commission and the Nigerian Stock Exchange for publication following approval by the Central Bank
of Nigeria.
The Operational Risk & Service Measurement Committee meets monthly or as necessary and over sees all matters related to
operational risk and service delivery in the Bank. The Committee is charged with the following key responsibilities:
(a) Ensuring full implementation of the risk management framework approved by the Board of Directors.
(b) Monitoring the implementation of policies, processes and procedures for managing operational risk in all of the Bank’s
material products, activities, processes and systems.
(c) Ensuring that clear roles and responsibilities are defined for the management of operational risks throughout all levels of
the Bank, including all Business and Support Units.
(d) Providing support to the Chief Risk Officer and Chief Compliance Officer to ensure that a culture of compliance is
entrenched throughout the Bank.
Notes
This Committee meets quarterly or as necessary and has the following key objectives:
(a) Review the Bank’s quarterly performance.
(b) Monitor budget achievement.
(c) Assess efficiency of resource deployment in the Bank.
(d) Review product performance.
(e) Reappraise cost management initiatives.
(f) Develop and implement a framework for measuring performance in the Bank.
(g) Develop Key Performance Indicators (KPI) for business and support units within the Bank.
(h) Determine the basis for rewards and consequence management.
4. Criticized Assets Committee - continued
(a) Review of individual credit facilities based on their risk rating and exceptions.
(b) Review of the loan portfolio of Business Divisions/Groups/Units bank-wide.
(c) Review the activities and oversee the effectiveness of the Regional Criticized Assets Committees.
(d) Review of collateral documentation to ensure compliance with approvals.
(e) Approval of portfolio classification/reclassification and level of provisioning.
(f) Approval of loan transfers to any committee or persons for recovery action.
(g) Continuously review and evaluate recovery strategies on each account, and recommend alternative strategies on an
account-by-account basis.
(h) Review performance of loan recovery agents, and other third party agents assigned recovery briefs with the objective of
delisting non-performers.
(i) Consider and recommend collateral realization on defaulting accounts.
(j) Recommend for EXCO or Board approval, waivers and concessions and propose amounts to be paid as full and final
settlement by defaulting borrowers.
(k) Recommend interest suspension for non-performing accounts on a case-by-case basis.
33
Fidelity Bank Plc
Corporate Governance Report
For The Half Year Ended 30 June 2018
Directors’ Code of Conduct Policy
Insider Trading Policy (Dealing in the Company’s Securities)
(a) Demonstrate the Bank’s commitment to the highest standards of ethics and business conduct; and
(b) Govern the Bank’s relationship with employees, customers, suppliers, shareholders, competitors, the communities in which
it operates and the relationship with each other as employees.
The Code requires all Directors, significant shareholders, officers and employees of the Bank to avoid taking actions or
placing themselves in positions that create or could create the appearance of conflict of interest, corruption or impropriety.
The Bank must also protect the privacy of its customers’ financial and other personal information. The Code provides basic
guidelines of business practice, professional and personal conduct that the Bank expects all employees to adopt and uphold
as members of Team Fidelity. Employees are also expected to comply with other policies referred to in the Code, additional
policies that apply to their specific job functions, and the spirit and letter of all laws and regulations.
At the beginning of each year and upon resumption, all employees are required to formally disclose that they have no
material or any other conflicting interests as well as declare their interest in any account, customer, transaction or person who
is a party to a material contract or proposed contract with the Bank.
Governance and Management
Fidelity has adopted various policies which define acceptable standards of behavior in the organization. These include the
following:
The Chief Internal Auditor has the primary responsibility of enforcing the Code subject to the supervision of the Ethics
Committee and the Board Audit Committee. The execution of disciplinary actions and sanctions for infringement of the Code
are guided by the Bank’s disciplinary procedure as documented in the Staff Handbook.
At the Board level, the Board of Directors adopted the Directors’ Code of Conduct Policy, which sets out the ethical
standards that each Director is expected to adhere to. Directors have a duty to oversee the management of the business
and affairs of the Bank. In carrying out this duty, Directors are expected to act honestly, in good faith and in the best interest
of the Bank at all times. All Directors are expected to adhere strictly to the Code and formally declare their interest, if any, in
any contract or transaction to which the Bank is a party.
The Bank has a formal Insider Trading Policy that prohibits all “Insiders” and their “Connected Persons” (as defined in the
Policy) from dealing in the Company’s securities at certain times. The provisions of the Policy are based on terms no less
exacting than the standards defined in the Listing Rules of the Nigerian Stock Exchange. The objectives of the Policy include
the following:
(a) Promote compliance with the provisions of the Investments and Securities Act (ISA) 2007, the Securities and Exchange
Commission Code of Corporate Governance and the Listing Rules of the Nigerian Stock Exchange;
(b) Ensure that all persons to whom the policy applies (affected persons), who possess material non-public information do not
engage in insider trading or tipping.
(c) Ensure that all the Bank’s employees and Directors comply with utmost secrecy and confidentiality on all information
which they receive as a result of their position within the Bank; and
(d) Protect the Bank and its staff from reputational damage and penalties that may be imposed by regulators as a result of
improper identification, disclosure and management of insider trading activities.
(a) Code of Business Conduct and Ethics Policy.
(b) Directors Code of Conduct Policy.
(c) Insider Trading Policy.
(d) Whistle-blowing Policy; and,
(e) Shareholders Complaints Management Policy.
Code of Business Conduct and Ethics Policy
The Code of Business Conduct and Ethics (“the Code”) is an expression of the Bank’s core values and represents a framework
for guidance in decision-making. The main objectives of the Policy are to:
34

Fidelity Bank Plc
Corporate Governance Report
For The Half Year Ended 30 June 2018
Insider Trading Policy (Dealing in the Company’s Securities) - continued
Whistle-blowing Policy
The Policy has been communicated to all persons to whom it is applicable including Employees, Directors and members of
the Statutory Audit Committee. The Company Secretary periodically notifies affected persons of when trading in the Bank’s
securities is either permitted (Open Periods) or prohibited (Blackout Periods).
The Bank has established a mechanism for monitoring compliance with the Policy and affected persons are required to notify
the Company Secretary of transactions undertaken on their accounts in the Bank’s securities. Enquiries are also made to
confirm the Directors compliance with the Policy and in event of non-compliance, the reasons for same and the remedial
steps taken. In addition to being hosted on the Bank’s website and Share Points Portal (an internal web-based application),
the Policy is circulated to all affected persons on a regular basis.
Fidelity Bank is committed to ensuring that Shareholders complaints are dealt with in a responsive, efficient and effective
manner. To this end, the Bank adopted a Shareholders’ Complaints Management Policy in July 2015. The Company
Secretary is vested with the responsibility for implementation of the Policy, resolution of complaints and achievement of
outcomes.
Fidelity Bank Plc requires all Employees, Directors, Vendors and other Stakeholders to conduct themselves with the utmost
fidelity and good faith in their dealings with the Bank and its stakeholders at all times. The Bank’s Whistle-Blowing Policy and
Procedures therefore aim to strengthen its corporate governance and risk management architecture whilst enhancing value
for all stakeholders.
The Bank recognizes the need for protection of whistle-blowers and takes all reasonable steps to protect their identity. The
Bank also appreciates the importance of utmost confidentiality in these situations and has developed various anonymous
channels for reporting unethical behaviour.
The Bank has provided the following reporting channels to ensure that all ethical issues can be reported to the Ethics
Committee directly or anonymously, through the following media:
i. Email to [email protected]
ii. Click on www.fidelitybank.ng/index.php/contact/whistle-blowing-form/
iii. Call 01-448-5252 (Fidelity True Serve)
A policy statement on whistle-blowing is available on the Bank’s website along with a whistle-blowing form, to ease the
reporting process. This can be accessed at:
https://www.fidelitybank.ng/index.php/contact/whistle-blowing-form
The Board is responsible for implementation of the Policy and communication of same to stakeholders. To facilitate
implementation of the Policy, the Bank has established an Ethics Committee comprised of staff drawn from key areas of the
Bank including Operations, Legal, and Human Resources.
The Ethics Committee is responsible for receiving and evaluating whistle-blowing reports, deciding the nature of the action to
be taken, reviewing the report of any enquiry arising from a whistle-blowing report, providing feedback on the outcome of
investigations to the whistle-blower (where the whistle-blower has provided a means of communicating with him/her).
The Ethics Committee also provides updates on whistle-blowing incidents to the Board Audit Committee on a quarterly basis,
through the Chief Internal Auditor. In addition, the Chief Compliance Officer renders periodic returns on whistle-blowing
incidents to the Central Bank of Nigeria and Nigeria Deposit Insurance Corporation as appropriate.
To this end, internal and external stakeholders are encouraged to report their concerns about any ostensibly unethical
behaviour to enable the Bank investigate and address same appropriately.
Shareholders’ Complaints Management Policy
The Complaints Management framework includes the process for receiving, addressing, managing and resolving complaints
from Shareholders on issues covered by the Investments and Securities Act (ISA), 2007; Rules and Regulations made pursuant
to the ISA, Rules and Regulations of the Securities and Exchange Commission (SEC), and the Nigerian Stock Exchange (NSE)
on the trading of the Bank’s securities and guidelines of recognized Trade Associations.
35
Fidelity Bank Plc
Corporate Governance Report
For The Half Year Ended 30 June 2018
The objectives of the Policy include:
The Company Secretary
(a) Ensure compliance with the provisions of the SEC Rules relating to Complaints Management Framework, the Rules and
Regulations made pursuant to the ISA, the rules and regulations of Securities Exchanges and guidelines of public
companies/recognized trade associations as well as other applicable regulatory requirements.
(b) Handle complaints by Shareholders, Stakeholders, and Customers in relation to Fidelity Bank’s shares.
(c) Provide an avenue for Shareholder communication and feedback.
(d) Recognize, promote and protect Shareholders rights, including the right to comment and provide feedback on service.
(e) Provide an efficient, fair and accessible framework for resolving Shareholder complaints and feedback to improve service
delivery.
(f) Inform Shareholders on the Shareholder feedback handling processes.
(g) Establish a framework to guide against trade manipulation, accounting frauds, Ponzi schemes and such other complaints
as may be determined by the SEC from time to time.
(h) Establish and maintain an electronic complaints register and provide information on a quarterly basis to the NSE in line
with regulations.
(i) Protect the Bank from sanctions from regulatory bodies and ensure strict compliance by the responsible parties.
The Company Secretary plays a key role in ensuring that Board procedures are complied with and that Board members are
aware of and provided with guidance as to their duties and responsibilities. The Company Secretary is responsible for the
following:
(a) Ensuring that the applicable rules and regulations for the conduct of the affairs of the Board are complied with.
(b) Provision of facilities associated with maintenance of the Board or otherwise required for its efficient operation.
(c) Provide a central source of guidance and advice to the Board on matters of ethics and implementation of the Codes of
Corporate Governance, as well as providing administrative support to the Board and Board Committees.
(d) Coordinating the orientation, induction and training of new Directors, and the continuous training of existing Directors.
(e) Assist the Chairman and Managing Director/CEO to formulate the annual Board Plan and administration of other strategic
issues at the Board level.
(f) Organize Board/General meetings and properly record and communicate the decisions for implementation.
(g) Update the Board and or Management on contemporary developments in corporate governance.
The Company Secretary also acts as a liaison between the Shareholders, the Bank’s Registrars and the Investor Relations Desk
and ensures timely communication with Shareholders in relation to issuance of shares, calls on shares, replacement of share
certificates, managing of shareholding accounts, dividend payment, production and distribution of annual reports amongst
others. The Board is responsible for the appointment and disengagement of the Company Secretary.
The Chief Compliance Officer of the Bank is charged with the responsibility of monitoring the Bank’s compliance with all
applicable legislation including the Code of Corporate Governance issued by the Central Bank of Nigeria. The Chief
Compliance Officer and the Company Secretary forward periodic returns on the various governance Codes to the Central
Bank, Nigerian Stock Exchange, Securities & Exchange Commission and Nigerian Deposit Insurance Corporation as
appropriate.
Shareholders’ Complaints Management Policy - continued
Governance and Compliance
36
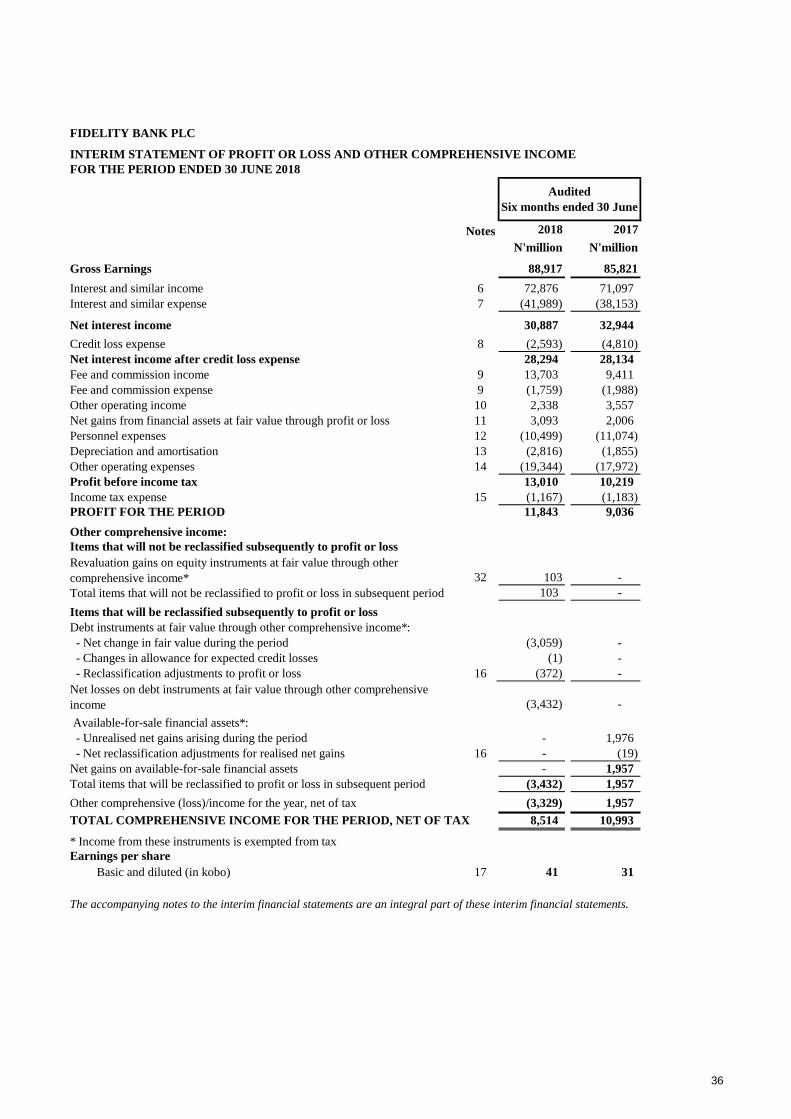
FIDELITY BANK PLC
INTERIM STATEMENT OF PROFIT OR LOSS AND OTHER COMPREHENSIVE INCOME
FOR THE PERIOD ENDED 30 JUNE 2018
Notes 2018 2017
N'million N'million
Gross Earnings 88,917 85,821
Interest and similar income 6 72,876 71,097
Interest and similar expense 7 (41,989) (38,153)
Net interest income 30,887 32,944
Credit loss expense 8 (2,593) (4,810)
Net interest income after credit loss expense 28,294 28,134
Fee and commission income 9 13,703 9,411
Fee and commission expense 9 (1,759) (1,988)
Other operating income 10 2,338 3,557
Net gains from financial assets at fair value through profit or loss 11 3,093 2,006
Personnel expenses 12 (10,499) (11,074)
Depreciation and amortisation 13 (2,816) (1,855)
Other operating expenses 14 (19,344) (17,972)
Profit before income tax 13,010 10,219
Income tax expense 15 (1,167) (1,183)
PROFIT FOR THE PERIOD 11,843 9,036
Other comprehensive income:
Items that will not be reclassified subsequently to profit or loss
Revaluation gains on equity instruments at fair value through other
comprehensive income* 32 103 -
Total items that will not be reclassified to profit or loss in subsequent period 103 -
Items that will be reclassified subsequently to profit or loss
Debt instruments at fair value through other comprehensive income*:
- Net change in fair value during the period (3,059) -
- Changes in allowance for expected credit losses (1) -
- Reclassification adjustments to profit or loss 16 (372) -
Net losses on debt instruments at fair value through other comprehensive
income (3,432) -
Available-for-sale financial assets*:
- Unrealised net gains arising during the period - 1,976
- Net reclassification adjustments for realised net gains 16 - (19)
Net gains on available-for-sale financial assets - 1,957
Total items that will be reclassified to profit or loss in subsequent period (3,432) 1,957
Other comprehensive (loss)/income for the year, net of tax (3,329) 1,957
TOTAL COMPREHENSIVE INCOME FOR THE PERIOD, NET OF TAX 8,514 10,993
* Income from these instruments is exempted from tax
Earnings per share
Basic and diluted (in kobo) 17 41 31
The accompanying notes to the interim financial statements are an integral part of these interim financial statements.
Audited
Six months ended 30 June
36
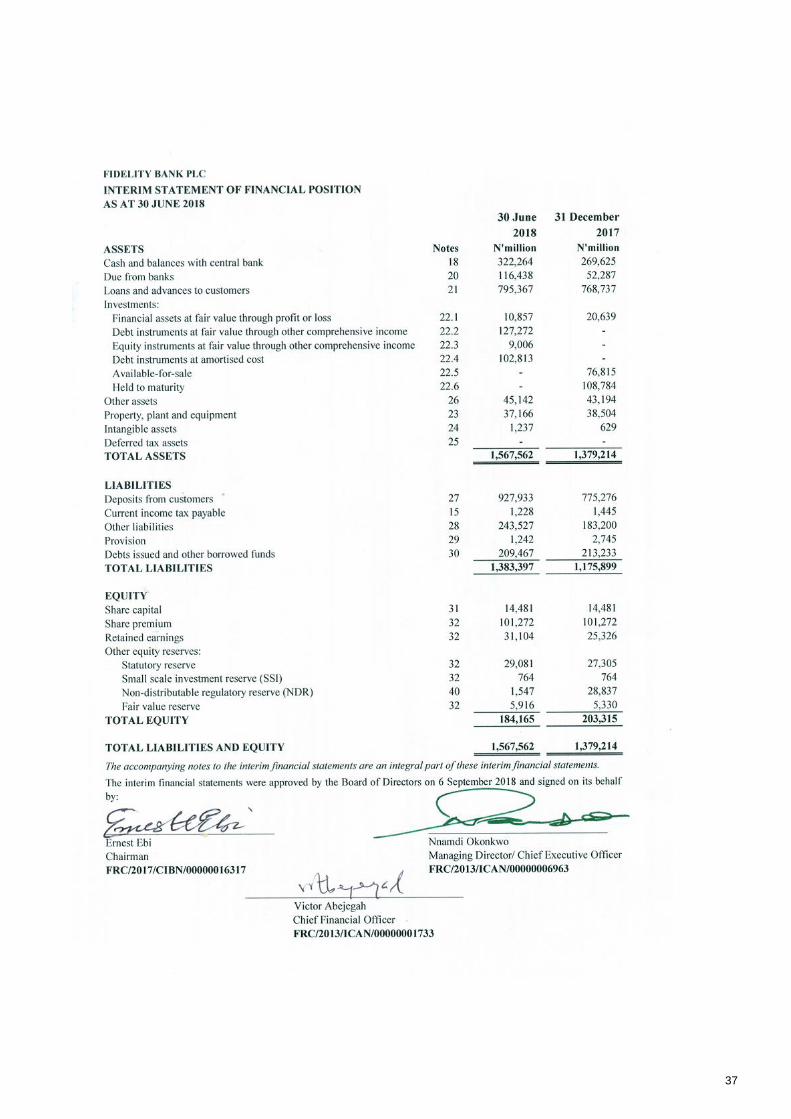
FIDELITY BANK PLC
INTERIM STATEMENT OF FINANCIAL POSITION
AS AT 30 JUNE 2018
30 June 31 December
2018 2017
ASSETS Notes N'million N'million
Cash and balances with central bank 18 322,264 269,625
Due from banks 20 116,438 52,287
Loans and advances to customers 21 795,367 768,737
Investments:
Financial assets at fair value through profit or loss 22.1 10,857 20,639
Debt instruments at fair value through other comprehensive income 22.2 127,272 -
Equity instruments at fair value through other comprehensive income 22.3 9,006 -
Debt instruments at amortised cost 22.4 102,813 -
Available-for-sale 22.5 - 76,815
Held to maturity 22.6 - 108,784
Other assets 26 45,142 43,194
Property, plant and equipment 23 37,166 38,504
Intangible assets 24 1,237 629
Deferred tax assets 25 - -
TOTAL ASSETS 1,567,562 1,379,214
LIABILITIES
Deposits from customers 27 927,933 775,276
Current income tax payable 15 1,228 1,445
Other liabilities 28 243,527 183,200
Provision 29 1,242 2,745
Debts issued and other borrowed funds 30 209,467 213,233
TOTAL LIABILITIES 1,383,397 1,175,899
EQUITY
Share capital 31 14,481 14,481
Share premium 32 101,272 101,272
Retained earnings 32 31,104 25,326
Other equity reserves:
Statutory reserve 32 29,081 27,305
Small scale investment reserve (SSI) 32 764 764
Non-distributable regulatory reserve (NDR) 40 1,547 28,837
Fair value reserve 32 5,916 5,330
TOTAL EQUITY 184,165 203,315
TOTAL LIABILITIES AND EQUITY 1,567,562 1,379,214
_______________________________ _________________________________
Ernest Ebi Nnamdi Okonkwo
Chairman Managing Director/ Chief Executive Officer
FRC/2017/CIBN/00000016317 FRC/2013/ICAN/00000006963
________________________________________
Victor Abejegah
Chief Financial Officer
FRC/2013/ICAN/00000001733
The accompanying notes to the interim financial statements are an integral part of these interim financial statements.
The interim financial statements were approved by the Board of Directors on 6 September 2018 and signed on its behalf by:
37
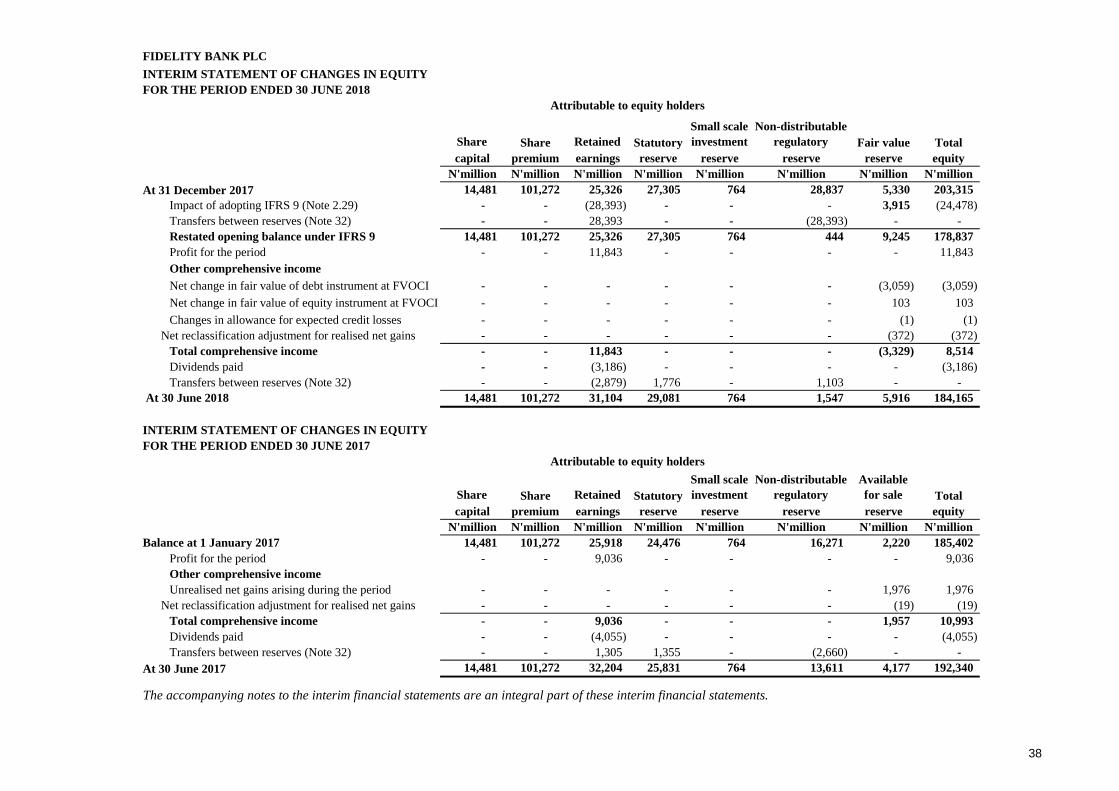
FIDELITY BANK PLC
INTERIM STATEMENT OF CHANGES IN EQUITY
FOR THE PERIOD ENDED 30 JUNE 2018
Share Share Retained Statutory
Small scale
investment
Non-distributable
regulatory Fair value Total
capital premium earnings reserve reserve reserve reserve equity
N'million N'million N'million N'million N'million N'million N'million N'million
At 31 December 2017 14,481 101,272 25,326 27,305 764 28,837 5,330 203,315
Impact of adopting IFRS 9 (Note 2.29) - - (28,393) - - - 3,915 (24,478)
Transfers between reserves (Note 32) - - 28,393 - - (28,393) - -
Restated opening balance under IFRS 9 14,481 101,272 25,326 27,305 764 444 9,245 178,837
Profit for the period - - 11,843 - - - - 11,843
Other comprehensive income
Net change in fair value of debt instrument at FVOCI - - - - - - (3,059) (3,059)
Net change in fair value of equity instrument at FVOCI - - - - - - 103 103
Changes in allowance for expected credit losses - - - - - - (1) (1)
Net reclassification adjustment for realised net gains - - - - - - (372) (372)
Total comprehensive income - - 11,843 - - - (3,329) 8,514
Dividends paid - - (3,186) - - - - (3,186)
Transfers between reserves (Note 32) - - (2,879) 1,776 - 1,103 - -
At 30 June 2018 14,481 101,272 31,104 29,081 764 1,547 5,916 184,165
INTERIM STATEMENT OF CHANGES IN EQUITY
FOR THE PERIOD ENDED 30 JUNE 2017
Share Share Retained Statutory
Small scale
investment
Non-distributable
regulatory
Available
for sale Total
capital premium earnings reserve reserve reserve reserve equity
N'million N'million N'million N'million N'million N'million N'million N'million
Balance at 1 January 2017 14,481 101,272 25,918 24,476 764 16,271 2,220 185,402
Profit for the period - - 9,036 - - - - 9,036
Other comprehensive income
Unrealised net gains arising during the period - - - - - - 1,976 1,976
Net reclassification adjustment for realised net gains - - - - - - (19) (19)
Total comprehensive income - - 9,036 - - - 1,957 10,993
Dividends paid - - (4,055) - - - - (4,055)
Transfers between reserves (Note 32) - - 1,305 1,355 - (2,660) - -
At 30 June 2017 14,481 101,272 32,204 25,831 764 13,611 4,177 192,340
The accompanying notes to the interim financial statements are an integral part of these interim financial statements.
Attributable to equity holders
Attributable to equity holders
38
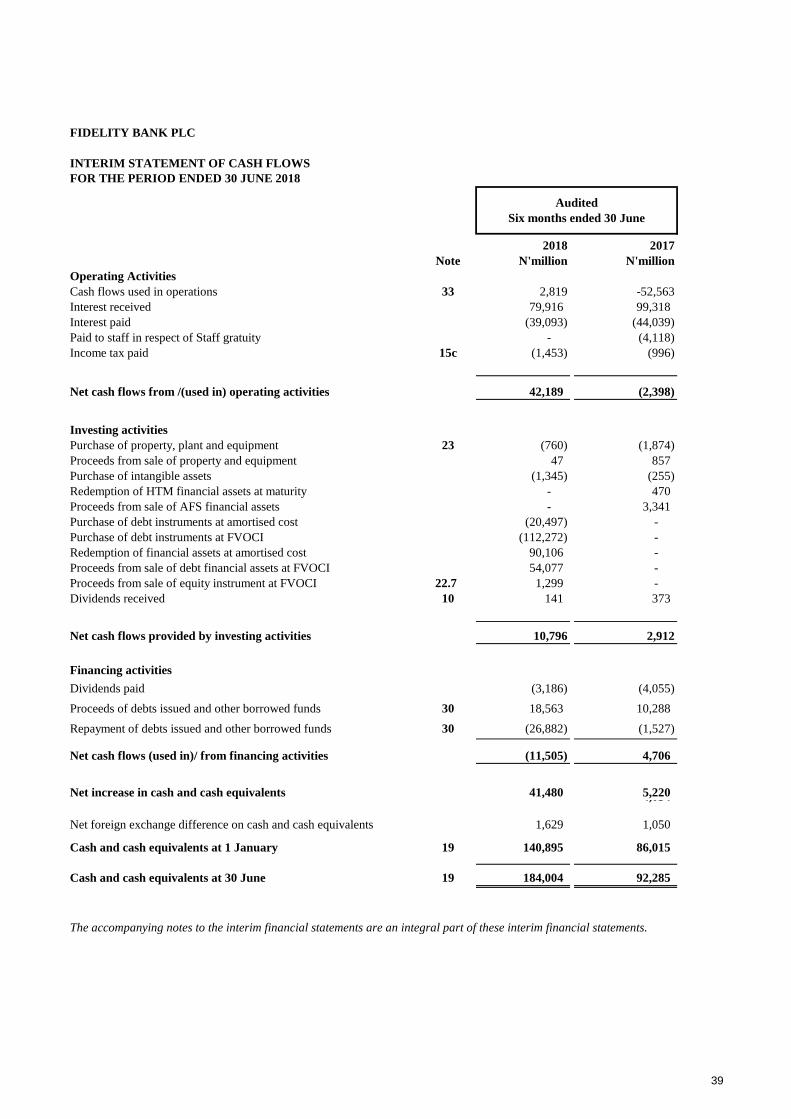
FIDELITY BANK PLC
INTERIM STATEMENT OF CASH FLOWS
FOR THE PERIOD ENDED 30 JUNE 2018
2018 2017
Note N'million N'million
Operating Activities
Cash flows used in operations 33 2,819 -52,563
Interest received 79,916 99,318
Interest paid (39,093) (44,039)
Paid to staff in respect of Staff gratuity - (4,118)
Income tax paid 15c (1,453) (996)
Net cash flows from /(used in) operating activities 42,189 (2,398)
Investing activities
Purchase of property, plant and equipment 23 (760) (1,874)
Proceeds from sale of property and equipment 47 857
Purchase of intangible assets (1,345) (255)
Redemption of HTM financial assets at maturity - 470
Proceeds from sale of AFS financial assets - 3,341
Purchase of debt instruments at amortised cost (20,497) -
Purchase of debt instruments at FVOCI (112,272) -
Redemption of financial assets at amortised cost 90,106 -
Proceeds from sale of debt financial assets at FVOCI 54,077 -
Proceeds from sale of equity instrument at FVOCI 22.7 1,299 -
Dividends received 10 141 373
Net cash flows provided by investing activities 10,796 2,912
Financing activities
Dividends paid (3,186) (4,055)
Proceeds of debts issued and other borrowed funds 30 18,563 10,288
Repayment of debts issued and other borrowed funds 30 (26,882) (1,527)
Net cash flows (used in)/ from financing activities (11,505) 4,706
Net increase in cash and cash equivalents 41,480 5,220 4,054
Net foreign exchange difference on cash and cash equivalents 1,629 1,050
Cash and cash equivalents at 1 January 19 140,895 86,015
Cash and cash equivalents at 30 June 19 184,004 92,285
The accompanying notes to the interim financial statements are an integral part of these interim financial statements.
Audited
Six months ended 30 June
39

Fidelity Bank Plc
NOTES TO THE INTERIM FINANCIAL STATEMENTS
1. General information
2. Summary of significant accounting policies
2.1 Introduction to summary of significant accounting policies
2.1.1 Basis of preparation
2.1.2 Changes on accounting policies and disclosures
New and amended standards and interpretations
a IFRS 9 - Financial instruments: Impact on adoption
The half-year interim financial statements comprise the interim statement of profit or loss and other comprehensive
income, the interim statement of financial position, the interim statement of changes in equity, interim statement
of cashflows, significant accounting policies and the notes to the interim financial statements.
The half-year interim financial statements have been prepared in accordance with the going concern principle
under the historical cost convention, except for financial assets and financial liabilities measured at fair value.
The half-year interim financial statements are presented in Naira, which is the Bank’s presentation currency. The
figures shown in the interim financial statements are stated in Naira millions.
The Bank has adopted IFRS 9 as issued by the IASB in July 2014 with a date of transition of 1 January 2018, which
resulted in changes in accounting policies and adjustments to the amounts previously recognised in the financial
statements. The Bank did not early adopt any earlier versions of IFRS 9 in previous periods. IFRS 9 replaces IAS 39 for
annual periods on or after 1 January 2018.
These financial statements are the interim financial statements of Fidelity Bank Plc (the "Bank"), a company
incorporated in Nigeria on 19 November 1987.
The registered office address of the Bank is at Fidelity Place, 1 Fidelity Bank Close Off Kofo Abayomi Street, Victoria-
Island, Lagos, Nigeria.
The principal activity of the Bank is the provision of banking and other financial services to corporate and
individual customers. Fidelity Bank Plc provides a full range of financial services including investment, commercial
and retail banking.
The principal accounting policies adopted in the preparation of these financial statements are set out below.
These policies have been consistently applied to the period presented, unless otherwise stated.
Statement of compliance
The Bank’s interim financial statements for the six months ended 30 June 2018 have been prepared in
accordance with International Financial Reporting Standards ("IFRS") as issued by the International Accounting
Standards Board ("IASB"). The Bank has applied IAS 34 - Interim Financial Reporting in preparing its interim financial
statements.
Additional information required by national regulations is included where appropriate.
Several other amendments and interpretations apply for the first time in 2018, but do not have an impact
on the interim financial statements of the Bank.
In these interim financial statements, the Bank has applied IFRS 9, IFRS 7R (Revised) and IFRS 15, effective for
annual periods beginning on or after 1 January 2018, for the first time. The Bank has not early adopted any other
standard, interpretation or amendment that has been issued but is not yet effective.
40

Fidelity Bank Plc
NOTES TO THE INTERIM FINANCIAL STATEMENTS
a IFRS 9 - Financial instruments: Impact on adoption - continued
Changes to classification and measurement
Changes to the impairment calculation
b IFRS 7 Revised (IFRS 7R)
As permitted by the transitional provisions of IFRS 9, the Bank has not restated comparative information for 2017 for
financial instruments in the scope of IFRS 9. Therefore, the comparative information for 2017 is reported under IAS
39 and is not comparable to the information presented for 2018. Differences arising from the adoption of IFRS 9
have been recognised directly in retained earnings as at 1 January 2018 and are disclosed in Note 2.18 (i.e.
Transitional disclosures). Consequently, for notes disclosures, the amendments to IFRS 7 disclosures have also only
been applied to the current period. The comparative period notes disclosures repeat those disclosures made in
the prior year.
The adoption of IFRS 9 has fundamentally changed the Bank’s accounting for loan loss impairments by replacing
IAS 39’s incurred loss approach with a forward-looking expected credit loss (ECL) approach. IFRS 9 requires the
Bank to record an allowance for ECLs for all loans and other debt financial assets not held at FVPL, together with
loan commitments and financial guarantee contracts. The allowance is based on the ECLs associated with the
probability of default in the next twelve months unless there has been a significant increase in credit risk since
origination. If the financial asset meets the definition of purchased or originated credit impaired (POCI), the
allowance is based on the change in the ECLs over the life of the asset.
Details of the Bank’s impairment method are disclosed in Note 2.4.3. The quantitative impact of applying IFRS 9 as
at 1 January 2018 is disclosed in Note 2.18 (i.e. Transitional disclosures).
To reflect the differences between IFRS 9 and IAS 39, IFRS 7 Financial Instruments: Disclosures was updated and the
Bank has adopted it, together with IFRS 9, for the year beginning 1 January 2018. Changes include transition
disclosures as shown in Note 2.18, detailed qualitative and quantitative information about the ECL calculations
such as the assumptions and inputs used are set out in Note 3.
Reconciliations from opening to closing ECL allowances are presented in Notes 2.18 (Transitional disclosures).
To determine their classification and measurement category, IFRS 9 requires all financial assets, except equity
instruments and derivatives, to be assessed based on a combination of the entity’s business model for managing
the assets and the instruments’ contractual cash flow characteristics.
The IAS 39 measurement categories of financial assets (fair value through profit or loss (FVPL), available for sale
(AFS), held-to-maturity and loans have been replaced by:
• Debt instruments at amortised cost
• Debt instruments at fair value through other comprehensive income (FVOCI), with gains or losses recycled
to profit or loss on derecognition
• Equity instruments at FVOCI, with no recycling of gains or losses to profit or loss on derecognition
• Financial assets at FVTPL
The accounting for financial liabilities remains largely the same as it was under IAS 39.
The Bank’s classification of its financial assets and liabilities is explained in Notes 2.18. The quantitative impact of
applying IFRS 9 as at 1 January 2018 is disclosed in Note 2.18.
41
Fidelity Bank Plc
NOTES TO THE INTERIM FINANCIAL STATEMENTS
c IFRS 15 Revenue from contracts with customers
d Impact of adoption of new standard on the third statement of financial position
2.1.3
The preparation of the Bank’s interim financial statements requires management to make judgements, estimates
and assumptions that affect the reported amount of revenues, expenses, assets and liabilities and the
accompanying disclosure, as well as the disclosure of contingent liability about these assumption and estimates
that could result in outcome that require a material adjustment to the carrying amount of assets and liabilities
affected in future periods.
Management discusses with the Audit Committee the development, selection and disclosure of the Bank’s critical
accounting policies and estimates, and the application of these policies and estimates.
ESTIMATES AND ASSUMPTIONS
The key assumption concerning the future and other key sources of estimation uncertainly at the reporting date,
that have a significant risk of causing a material adjustment to the carrying amounts of assets and liabilities within
the next financial period, are described below. The Bank based its assumption and estimates on parameters
available when the interim financial statements were prepared. Existing circumstances and assumption about
future developments, however, may change due to market changes or circumstances beyond the control of the
Bank. Such changes are reflected in the assumptions when they occur.
Going Concern
The Bank’s management has made an assessment of its ability to continue as a going concern and is satisfied that
it has the resources to continue in the business for the foreseeable future. Furthermore, management is not aware
of any material uncertainties that may cast significant doubt upon the Bank’s ability to continue as a going
concern. Therefore, the financial statements continue to be prepared on the going concern basis.
Significant accounting judgements, estimates and assumptions
The Bank adopted IFRS 15 Revenue from contracts with customers on its effective date of 1 January 2018. IFRS 15
replaces IAS 18 Revenue and establishes a five-step model to account for revenue arising from contracts with
customers. It applies to all contracts with customers except leases, financial instruments and insurance contracts.
The standard establishes a more systematic approach for revenue measurement and recognition by introducing
a five-step model governing revenue recognition. The five-step model requires the Bank to (i) identify the contract
with the customer, (ii) identify each of the performance obligations included in the contract, (iii) determine the
amount of consideration in the contract, (iv) allocate the consideration to each of the identified performance
obligations and (v) recognise revenue as each performance obligation is satisfied.
There are no significant impacts from the adoption of IFRS 15 in relation to the timing of when the Bank recognises
revenues or when revenue should be recognised gross as a principal or net as an agent. Therefore, Fidelity Bank
will continue to recognise fee and commission income charged for services provided by the Bank as the services
are provided (for example on completion of the underlying transaction). Revenue recognition for trading income
and net investment income are recognised based on requirements of IFRS 9. In addition, guidance on interest
and dividend income have been moved from IAS 18 to IFRS 9 without significant changes to the requirements.
The Bank adopted new IFRS standards during the period which led to changes in its accounting policies. The Bank
applied these changes in accounting policies retrospectively and as such it is expected to present a third
statement of financial position as at the beginning of the preceding period in addition to the minimum
comparative financial statements as required by IAS 1.40A. However, the third statement of financial position is not
presented because the retrospective adjustments have no impact on the third statement of financial position. This
is because the Bank opted not to restate the comparative figures as permitted by IFRS 9.
42

Fidelity Bank Plc
NOTES TO THE INTERIM FINANCIAL STATEMENTS
2.1.3
Allowances for credit losses
Measurement of the expected credit loss allowance
Measurement of the expected credit loss allowance - continued
· Determining criteria for significant increase in credit risk;
· Choosing appropriate models and assumptions for the measurement of ECL;
· Establishing groups of similar financial assets for the purposes of measuring ECL.
Fair value measurement of financial instruments
When the fair values of financial asaets and financial liabilities recorded in the statement ot financial position
cannot be measured based on quoted prices in active markets, their fair values are measured using valuation
techniques including the discounted cash flow (DCF) model. The inputs to these models are taken from
observable markets where possible, but where this is not feasible, a degree of judgement is required in
establishing fair values. Judgements include considerations of inputs such as liquidity risk, credit risk and volatility
changes in assumptions about these factors could affect the reported fair value of financial instruments. See Note
3 for further disclosures.
The measurement of the expected credit loss allowance for financial assets measured at amortised cost and
FVOCI is an area that requires the use of complex models and significant assumptions about future economic
conditions and credit behaviour (e.g. the likelihood of customers defaulting and the resulting losses). Explanation
of the inputs, assumptions and estimation techniques used in measuring ECL is further detailed in Note 3, which
also sets out key sensitivities of the ECL to changes in these elements.
SIGNIFICANT ACCOUNTING JUDGEMENTS, ESTIMATES AND ASSUMPTIONS - continued
The estimation of the useful lives of assets is based on management’s judgement. Any material adjustment to the
estimated useful lives of items of property and equipment will have an impact on the carrying value of these
items.
Determination of collateral Value
Management monitors market value of collateral in a regular basis. Management uses its experienced judgement
on independent opinion to adjust the fair value to reflect the current circumstances. The amount and collateral
required depend on the assessment of credit risk of the counterpart.
The Directors believes that the underlying assumptions are appropriate and that the Bank’s interim financial
statements therefore present the financial position and results fairly. The areas involving a higher degree of
judgement or complexity, or areas where assumptions and estimates are significant to the financial statements,
are disclosed in the notes.
A number of significant judgements are also required in applying the accounting requirements for measuring ECL,
· Establishing the number and relative weightings of forward-looking scenarios for each type of
product/market and the associated ECL; and
JUDGEMENTS
In the process of applying the Bank’s accounting policies, management has made the following judgements,
which have significant effect on the amount recognised in the interim financial statements:
Depreciation and carrying value of property, plant and equipment
43
Fidelity Bank Plc
NOTES TO THE INTERIM FINANCIAL STATEMENTS
2.2
IFRS 16 Leases
IFRS 17 Insurance Contracts
Standards Issued But Not Yet Effective
The new and amended standards and interpretations that are issued, but not yet effective, up to the date of
issuance of the Bank’s interim financial statements are disclosed below. The Bank intends to adopt these new and
amended standards and interpretations, if applicable, when they become effective.
IFRS 16 was issued in January 2016 and it replaces IAS 17 Leases, IFRIC 4 Determining whether an Arrangement
contains a Lease, SIC-15 Operating Leases-Incentives and SIC-27 Evaluating the Substance of Transactions
Involving the Legal Form of a Lease. IFRS 16 sets out the principles for the recognition, measurement, presentation
and disclosure of leases and requires lessees to account for all leases under a single on-balance sheet model
similar to the accounting for finance leases under IAS 17. The standard includes two recognition exemptions for
lessees – leases of ’low-value’ assets (e.g., personal computers) and short-term leases (i.e., leases with a lease term
of 12 months or less). At the commencement date of a lease, a lessee will recognise a liability to make lease
payments (i.e., the lease liability) and an asset representing the right to use the underlying asset during the lease
term (i.e., the right-of-use asset). Lessees will be required to separately recognise the interest expense on the lease
liability and the depreciation expense on the right-of-use asset.
Lessees will also be required to remeasure the lease liability upon the occurrence of certain events (e.g., a
change in the lease term, a change in future lease payments resulting from a change in an index or rate used to
determine those payments). The lessee will generally recognise the amount of the remeasurement of the lease
liability as an adjustment to the right-of-use asset.
Lessor accounting under IFRS 16 is substantially unchanged from today’s accounting under IAS 17. Lessors will
continue to classify all leases using the same classification principle as in IAS 17 and distinguish between two types
of leases: operating and finance leases.
IFRS 16, which is effective for annual periods beginning on or after 1 January 2019, requires lessees and lessors to
make more extensive disclosures than under IAS 17.
The Bank plans to adopt IFRS 16 on the required effective date, as the Bank has leases that qualify to be treated in
line with this standard. The Bank is currently assessing the impact of this standard.
In May 2017, the IASB issued IFRS 17 Insurance Contracts (IFRS 17), a comprehensive new accounting standard for
insurance contracts covering recognition and measurement, presentation and disclosure. Once effective, IFRS 17
will replace IFRS 4 Insurance Contracts (IFRS 4) that was issued in 2005. IFRS 17 applies to all types of insurance
contracts (i.e., life, non-life, direct insurance and re-insurance), regardless of the type of entities that issue them, as
well as to certain guarantees and financial instruments with discretionary participation features.
A few scope exceptions will apply. The overall objective of IFRS 17 is to provide an accounting model for
insurance contracts that is more useful and consistent for insurers. In contrast to the requirements in IFRS 4, which
are largely based on grandfathering previous local accounting policies, IFRS 17 provides a comprehensive model
for insurance contracts, covering all relevant accounting aspects. The core of IFRS 17 is the general model,
supplemented by:
• A specific adaptation for contracts with direct participation features (the variable fee approach)
• A simplified approach (the premium allocation approach) mainly for short-duration contracts
IFRS 17 is effective for reporting periods beginning on or after 1 January 2021, with comparative figures required.
Early application is permitted, provided the entity also applies IFRS 9 and IFRS 15 on or before the date it first
applies IFRS 17.
IFRS 17 will have no impact on the Bank, as it does not issue insurance contract.
44
Fidelity Bank Plc
NOTES TO THE INTERIM FINANCIAL STATEMENTS
Amendments to IFRS 9: Prepayment Features with Negative Compensation
Under IFRS 9, a debt instrument can be measured at amortised cost or at fair value through other comprehensive
income, provided that the contractual cash flows are ‘solely payments of principal and interest on the principal
amount outstanding’ (the SPPI criterion) and the instrument is held within the appropriate business model for that
classification. The amendments to IFRS 9 clarify that a financial asset passes the SPPI criterion regardless of the
event or circumstance that causes the early termination of the contract and irrespective of which party pays or
receives reasonable compensation for the early termination of the contract.
The amendments should be applied retrospectively and are effective from 1 January 2019, with earlier
application permitted. The Bank is still assessing the impact of these amendments.
Amendments to IFRS 10 and IAS 28: Sale or Contribution of Assets between an Investor and its Associate or Joint
Venture
The amendments address the conflict between IFRS 10 and IAS 28 in dealing with the loss of control of a subsidiary
that is sold or contributed to an associate or joint venture. The amendments clarify that the gain or loss resulting
from the sale or contribution of assets that constitute a business, as defined in IFRS 3, between an investor and its
associate or joint venture, is recognised in full. Any gain or loss resulting from the sale or contribution of assets that
do not constitute a business, however, is recognised only to the extent of unrelated investors’ interests in the
associate or joint venture. The IASB has deferred the effective date of these amendments indefinitely, but an
entity that early adopts the amendments must apply them prospectively. These amendments will currently have
no impact on the financial statements of the Bank.
The Bank will apply these amendments when they become effective.
Amendments to IAS 19: Plan Amendment, Curtailment or Settlement
The amendments to IAS 19 address the accounting when a plan amendment, curtailment or settlement occurs
during a reporting period. The amendments specify that when a plan amendment, curtailment or settlement
occurs during the annual reporting period, an entity is required to:
• Determine current service cost for the remainder of the period after the plan amendment, curtailment or
settlement, using the actuarial assumptions used to remeasure the net defined benefit liability (asset) reflecting
the benefits offered under the plan and the plan assets after that event
• Determine net interest for the remainder of the period after the plan amendment, curtailment or settlement
using: the net defined benefit liability (asset) reflecting the benefits offered under the plan and the plan assets
after that event; and the discount rate used to remeasure that net defined benefit liability (asset).
The amendments also clarify that an entity first determines any past service cost, or a gain or loss on settlement,
without considering the effect of the asset ceiling. This amount is recognised in profit or loss.
An entity then determines the effect of the asset ceiling after the plan amendment, curtailment or settlement.
Any change in that effect, excluding amounts included in the net interest, is recognised in other comprehensive
income.
IFRIC Interpretation 23 Uncertainty over Income Tax Treatment
The Interpretation addresses the accounting for income taxes when tax treatments involve uncertainty that
affects the application of IAS 12 and does not apply to taxes or levies outside the scope of IAS 12, nor does it
specifically include requirements relating to interest and penalties associated with uncertain tax treatments.
The Interpretation specifically addresses the following:
• Whether an entity considers uncertain tax treatments separately
• The assumptions an entity makes about the examination of tax treatments by taxation authorities
• How an entity determines taxable profit (tax loss), tax bases, unused tax losses, unused tax credits and
tax rates
• How an entity considers changes in facts and circumstances
An entity has to determine whether to consider each uncertain tax treatment separately or together with one or
more other uncertain tax treatments. The approach that better predicts the resolution of the uncertainty should be
followed. The interpretation is effective for annual reporting periods beginning on or after 1 January 2019, but
certain transition reliefs are available. The Bank will apply the interpretation from its effective date. Since the Bank
operates in a complex multinational tax environment, applying the Interpretation may affect its financial
statements. In addition, the Bank may need to establish processes and procedures to obtain information that is
necessary to apply the Interpretation on a timely basis. The Bank is still assessing the impact of these
ammendaments.
45
Fidelity Bank Plc
NOTES TO THE INTERIM FINANCIAL STATEMENTS
These improvements include:
• IFRS 3 Business Combinations
• IFRS 11 Joint Arrangements
• IAS 12 Income Taxes
• IAS 23 Borrowing Costs
The amendments clarify that, when an entity obtains control of a business that is a joint operation, it applies the
requirements for a business combination achieved in stages, including remeasuring previously held interests in the
assets and liabilities of the joint operation at fair value. In doing so, the acquirer remeasures its entire previously
held interest in the joint operation.
An entity applies those amendments to business combinations for which the acquisition date is on or after the
beginning of the first annual reporting period beginning on or after 1 January 2019, with early application
permitted. These amendments do not have any impact on the Bank.
A party that participates in, but does not have joint control of, a joint operation might obtain joint control of the
joint operation in which the activity of the joint operation constitutes a business as defined in IFRS 3.
The amendments clarify that the previously held interests in that joint operation are not remeasured.
An entity applies those amendments to transactions in which it obtains joint control on or after the beginning of
the first annual reporting period beginning on or after 1 January 2019, with early application permitted. These
amendments are currently not applicable to the Bank but may apply to future transactions.
The amendments clarify that the income tax consequences of dividends are linked more directly to past
transactions or events that generated distributable profits than to distributions to owners. Therefore, an entity
recognises the income tax consequences of dividends in profit or loss, other comprehensive income or equity
according to where the entity originally recognised those past transactions or events.
An entity applies those amendments for annual reporting periods beginning on or after 1 January 2019, with early
application is permitted. When an entity first applies those amendments, it applies them to the income tax
consequences of dividends recognised on or after the beginning of the earliest comparative period. The Bank is
still assessing the impact of these amendments.
The amendments clarify that an entity treats as part of general borrowings any borrowing originally made to
develop a qualifying asset when substantially all of the activities necessary to prepare that asset for its intended
use or sale are complete.
An entity applies those amendments to borrowing costs incurred on or after the beginning of the annual reporting
period in which the entity first applies those amendments. An entity applies those amendments for annual
reporting periods beginning on or after 1 January 2019, with early application permitted. Since the Bank’s current
practice is in line with these amendments, the Bank does not expect any effect on its financial statements.
Amendments to IAS 28: Long-term interests in associates and joint ventures
The amendments clarify that an entity applies IFRS 9 to long-term interests in an associate or joint venture to which
the equity method is not applied but that, in substance, form part of the net investment in the associate or joint
venture (long-term interests). This clarification is relevant because it implies that the expected credit loss model in
IFRS 9 applies to such long-term interests.
The amendments also clarified that, in applying IFRS 9, an entity does not take account of any losses of the
associate or joint venture, or any impairment losses on the net investment, recognised as adjustments to the net
investment in the associate or joint venture that arise from applying IAS 28 Investments in Associates and Joint
Ventures.
The amendments should be applied retrospectively and are effective from 1 January 2019, with early application
permitted. Since the Bank does not have such long-term interests in its associate and joint venture, the
amendments will not have an impact on its financial statements.
Annual Improvements 2015-2017 Cycle (issued in December 2017)
The amendments apply to plan amendments, curtailments, or settlements occurring on or after the beginning of
the first annual reporting period that begins on or after 1 January 2019, with early application permitted. The Bank
does not expect any effect on its financial statements.
These amendments will not have any impact on the Bank.
Amendments to IAS 19: Plan Amendment, Curtailment or Settlement - continued
46
Fidelity Bank Plc
NOTES TO THE INTERIM FINANCIAL STATEMENTS
2.3 Foreign currency translation and transaction
2.4
2.4.1 Initial recognition
Monetary items denominated in foreign currency are translated with the closing rate as at the reporting date. Non-
monetary items measured at historical cost denominated in a foreign currency are translated with the exchange
rate as at the date of initial recognition; non-monetary items in a foreign currency that are measured at fair value
are translated using the exchange rates at the date when the fair value was determined.
Foreign exchange gains and losses resulting from the settlement of foreign currency transactions and from the
translation at period-end exchange rates of monetary assets and liabilities denominated in foreign currencies are
recognised in the profit or loss.
In the case of changes in the fair value of monetary assets denominated in foreign currency classified as fair
value through other comprehensive income (FVOCI), a distinction is made between translation differences
resulting from changes in amortised cost of the security and other changes in the carrying amount of the security.
Translation differences related to changes in the amortised cost are recognised in profit or loss, and other changes
in the carrying amount, except impairment, are recognised in other comprehensive income.
Translation differences on non-monetary financial instruments, such as equities held at fair value through profit or
loss, are reported as part of the fair value gain or loss. Translation differences on non-monetary financial
instruments, such as equities classified as FVOCI financial assets, are included in other comprehensive income.
Financial assets and liabilities (Policy applicable for financial instruments from 1 January 2018)
The Bank initially recognises loans and advances, deposits and debt securities issued on the date on which they
are originated. All other financial instruments (including regular-way purchases and sales of financial assets) are
recognised on the trade date, which is the date on which the Bank becomes a party to the contractual provisions
of the instrument.
A financial asset or financial liability is measured initially at fair value plus, (for an item not at fair value through
profit or loss), transaction costs that are directly attributable to its acquisition or issue. Transaction costs of financial
assets carried at fair value through profit or loss are expensed in profit or loss.
(a) Functional and presentation currency
Items included in the interim financial statements of the Bank are measured using the currency of the primary
economic environment in which the entity operates ("the functional currency").
The interim financial statements are presented in Naira, which is the Bank’s presentation currency.
(b) Transactions and balances
Foreign currency transactions (i.e. transactions denominated, or that require settlement, in a currency other than
the functional currency) are translated into the functional currency using the exchange rates prevailing at the
dates of the transactions or valuation where items are re-measured.
47
Fidelity Bank Plc
NOTES TO THE INTERIM FINANCIAL STATEMENTS
Day 1 profit or loss
Amortised cost and gross carrying amount
Effective interest method
Interest income
When the transaction price of the instrument differs from the fair value at origination and the fair value is based on
a valuation technique using only inputs observable in market transactions, the Bank recognises the difference
between the transaction price and fair value in Net gains/(losses) from financial instruments. In those cases where
fair value is based on models for which some of the inputs are not observable, the difference between the
transaction price and the fair value is deferred and is only recognised in profit or loss when the inputs become
observable, or when the instrument is derecognised.
The effective interest rate is the rate that exactly discounts estimated future cash payments or receipts through the
expected life of the financial asset or financial liability to the gross carrying amount of a financial asset (i.e. its
amortised cost before any impairment allowance) or to the amortised cost of a financial liability. The calculation
does not consider expected credit losses and includes transaction costs, premiums or discounts and fees and
points paid or received that are integral to the effective interest rate, such as origination fees.
For purchased or originated credit-impaired (`POCI') financial assets — assets that are credit-impaired at initial
recognition — the Bank calculates the credit-adjusted effective interest rate, which is calculated based on the
amortised cost of the financial asset instead of its gross carrying amount and incorporates the impact of expected
credit losses in estimated future cash flows.
When the Bank revises the estimates of future cash flows, the carrying amount of the respective financial assets or
financial liability is adjusted to reflect the new estimate discounted using the original effective interest rate. Any
changes are recognised in profit or loss.
Interest income and expenses are recognised in profit or loss using the effective interest method. The effective
interest rate is the rate that exactly discounts estimated future cash payments or receipts through the expected
life of the financial instrument to:
• the gross carrying amount of the financial asset; or
• the amortised cost of the financial liability.
When calculating the effective interest rate for financial instruments other than credit-impaired financial assets,
the Bank estimates future cash flows considering all contractual terms of the financial instrument, but not
expected credit losses. For credit-impaired financial assets, a credit-adjusted effective interest rate is calculated
using estimated future cash flows including expected credit losses.
The calculation of the effective interest rate includes transaction costs and fees and points paid or received that
are an integral part of the effective interest rate. Transaction costs include incremental costs that are directly
attributable to the acquisition or issue of a financial asset or financial liability.
The amortised cost of a financial asset or financial liability is the amount at which the financial asset or financial
liability is measured on initial recognition minus the principal repayments, plus or minus the cumulative
amortisation using the effective interest method of any difference between the initial amount and the maturity
amount and, for financial assets, adjusted for any expected credit loss allowance.
The gross carrying amount of a financial asset is the amortised cost of a financial asset before adjusting for any
expected credit loss allowance.
48

Fidelity Bank Plc
NOTES TO THE INTERIM FINANCIAL STATEMENTS
2.4.2 Financial assets - Subsequent measurement
a) Debt instruments
Fair value through other comprehensive income (FVOCI): Financial assets that are held within a business model
whose objective is achieved both by collection of contractual cash flows and by selling the assets, where those
cash flows represent solely payments of principal and interest, and are not designated at fair value through profit
or loss, are measured at fair value through other comprehensive income. Movements in the carrying amount are
taken through OCI, except for recognition of impairment gains and losses, interest revenue and foreign exchange
gains and losses on the instrument’s amortised cost which are recognised in profit or loss.
When the financial asset is derecognised, the cumulative gain or loss previously recognised in OCI is reclassified
from equity to profit or loss and recognised in "Other operating income". Interest income from these financial
assets is included in "Interest and similar income" using the effective interest rate method.
Fair value through profit or loss (FVTPL): Assets that do not meet the criteria for amortised cost or FVOCI are
measured at fair value through profit or loss. A gain or loss on a debt investment that is subsequently measured at
fair value through profit or loss is recognised in profit or loss and presented in the profit or loss statement within “Net
gains/(losses) from financial instruments classified as held for trading” in the period in which it arises. Interest
income from these financial assets is included in "Interest and similar income".
Business Model assessment
The Bank makes an assessment of the objective of a business model in which an asset is held at a portfolio level
because this best reflects the way the business is managed and information is provided to management. The
information considered includes:
• the stated policies and objectives for the portfolio and the operation of those policies in practice. In particular,
whether management's strategy focuses on earning contractual interest revenue, maintaining a particular interest
rate profile, matching the duration of the financial assets to the duration of the liabilities that are funding those
assets or realising cash flows through the sale of the assets;
• how the performance of the portfolio is evaluated and reported to the Bank's management;
• the risks that affect the performance of the business model (and the financial assets held within that business
model) and how those risks are managed;
• how managers of the business are compensated - e.g. whether compensation is based on the fair value of the
assets managed or the contractual cash flows collected.
• the frequency, volume and timing of sales in prior periods, the reasons for such sales and its expectations about
future sales activity. However, information about sales activity is not considered in isolation, but as part of an
overall assessment of how the Bank's stated objective for managing financial assets is achieved and how cash
flows are realized.
The classification and subsequent measurement of debt instruments depend on the Bank’s business model for
managing the financial assets and the contractual terms of the cash flows. Based on these factors, the Bank
classifies its debt instruments into one of the following measurement categories:
Amortised cost: Financial assets that are held within a business model whose objective is collection of contractual
cash flows and where such cash flows represent solely payments of principal and interest are measured at
amortised cost. A gain or loss due to impairment or upon derecognition of a debt investment that is subsequently
measured at amortised cost is recognised in profit or loss. Interest income from these financial assets is included in
"Interest and similar income" using the effective interest rate method.
49
Fidelity Bank Plc
NOTES TO THE INTERIM FINANCIAL STATEMENTS
b) Equity instruments
Solely payments of principal and interest (SPPI) assessment
Principal is defined as the fair value of the financial asset on initial recognition. Interest is defined as consideration
for the time value of money and for the credit risk associated with the principal amount outstanding during a
particular period of time and for other basic lending risks and costs (e.g. liquidity risk and administrative costs), as
well as profit margin.
In assessing whether the contractual cash flows are solely payments of principal and interest, the Bank considers
the contractual terms of the instrument. This includes assessing whether the financial asset contains a contractual
term that could change the timing or amount of contractual cash flows such that it would not meet this condition.
In making the assessment, the Bank considers:
• contingent events that would change the amount and timing of cash flows;
• leverage features;
• prepayment and extension terms;
• terms that limit the Bank's claim to cash flows from specified assets (e.g. non-recourse asset arrangements); and
• features that modify consideration of the time value of money - e.g. periodical rate of interest
Financial assets with embedded derivatives are considered in their entirety when determining whether their cash
flows are solely payments of principal and interest.
Reclassifications
The Bank reclassifies debt investments when and only when its business model for managing those assets changes.
Modifications
If the terms of a financial asset are modified, the Bank evaluates whether the cash flows of the modified asset are
substantially different. If the cash flows are substantially different, then the contractual rights to cash flows from the
original financial asset are deemed to have expired. In this case, the original financial asset is derecognised and
a new financial asset is recognised at fair value.
If the cash flows of the modified asset carried at amortised cost are not substantially different, then the
modification does not result in derecognition of the financial asset. In this case, the Bank recalculates the gross
carrying amount of the financial asset and recognises the amount arising from adjusting the gross carrying
amount as a modification gain or loss in profit or loss.
If such a modification is carried out because of financial difficulties of the borrower, then the gain or loss is
presented together with impairment losses.
The Bank subsequently measures all unquoted equity investments at fair value through other comprehensive
income. Where the Bank has elected to present fair value gains and losses on equity investments in other
comprehensive income, there is no subsequent reclassification of fair value gains and losses to profit or loss.
Dividends from such investments continue to be recognised in profit or loss as other income when the right to
receive payments is established.
50
Fidelity Bank Plc
NOTES TO THE INTERIM FINANCIAL STATEMENTS
2.4.3
Overview of the ECL principles
The calculation of ECLs
The Bank assesses on a forward looking basis the expected credit losses (ECL) associated with its loans and other
debt financial assets not held at FVPL, together with loan commitments and financial guarantee contracts, in this
section all referred to as 'financial instruments'. The impairment methodology applied depends on whether there
has been a significant increase in credit risk since initial recognition.
The measurement of ECL reflects an unbiased and probability-weighted amount that is determined by evaluating
a range of possible outcomes, time value of money and reasonable and supportable information that is
available without undue cost or effort at the reporting date about past events, current conditions and forecasts of
future economic conditions. Equity instruments are not subject to impairment under IFRS 9.
Impairment of financial assets
The Bank has established a policy to perform an assessment, at the end of each reporting period, of whether a
financial instrument’s credit risk has increased significantly since initial recognition, by considering if it is 30 days
past due. Based on the above process, the Bank groups its loans into Stage 1, Stage 2 and Stage 3, as described
below:
• Stage 1: When loans are first recognised, the Bank recognises an allowance based on 12 months expected
credit losses (12mECLs). Stage 1 loans also include facilities where the credit risk has improved and the loan has
been reclassified from Stage 2.
• Stage 2: When a loan has shown a significant increase in credit risk since origination, the Bank records an
allowance for the lifetime expected credit losses (LTECLs). Stage 2 loans also include facilities, where the credit risk
has improved and the loan has been reclassified from Stage 3.
• Stage 3: These are loans considered as credit-impaired.The bank records an allowance for the LTECLs.
POCI: Purchased or originated credit impaired (POCI) assets are financial assets that are credit impaired on initial
recognition. POCI assets are recorded at fair value at original recognition and interest income is subsequently
recognised based on a credit-adjusted EIR. ECLs are only recognised or released to the extent that there is a
subsequent change in the expected credit losses
The ECL allowance is based on the credit losses expected to arise over the life of the asset (the lifetime expected
credit loss or LTECL), unless there has been no significant increase in credit risk since origination, in which case, the
allowance is based on the 12 months’ expected credit loss (12mECL). The 12mECL is the portion of LTECLs that
represent the ECLs that result from default events on a financial instrument that are possible within the 12 months
after the reporting date.
Both LTECLs and 12mECLs are calculated on either an individual basis or a collective basis, depending on the
nature of the underlying portfolio of financial instruments.
The Bank calculates ECLs based on a single scenario to measure the expected cash shortfalls, discounted at an
approximation to the EIR. A cash shortfall is the difference between the cash flows that are due to an entity in
accordance with the contract and the cash flows that the entity expects to receive.
The mechanics of the ECL calculations are outlined below and the key elements are, as follows:
PD: The Probability of Default is an estimate of the likelihood of default over a given time horizon. A default may
only happen at a certain time over the assessed period, if the facility has not been previously derecognised and is
still in the portfolio. The concept of PDs is further explained in Note 3.2.4 (c).
51
Fidelity Bank Plc
NOTES TO THE INTERIM FINANCIAL STATEMENTS
The calculation of ECLs - continued
The mechanics of the ECL method are summarised below:
Stage 1
• The 12mECL is calculated as the portion of LTECLs that represent the ECLs that result from default events on a
financial instrument that are possible within the 12 months after the reporting date. The Bank calculates the
12mECL allowance based on the expectation of a default occurring in the 12 months following the reporting
date.
• These expected 12-month default probabilities are applied to a forecast EAD and multiplied by the expected
LGD and discounted by an approximation to the original EIR.
Stage 2
• When a financial instruments has shown a significant increase in credit risk since origination, the Bank records an
allowance for the LTECLs. The mechanics are similar to those explained above but PDs and LGDs are estimated
over the lifetime of the instrument. The expected cash shortfalls are discounted by an approximation to the
original EIR.
Stage 3
• For financial instruments considered credit-impaired (as defined in Note 3), the Bank recognises the lifetime
expected credit losses for these loans. The method is similar to that for Stage 2 assets, with the PD set at 100%.
Loan commitments and letters of credit
• When estimating LTECLs for undrawn loan commitments, the Bank estimates the expected portion of the loan
commitment that will be drawn down over its expected life. The ECL is then based on the present value of the
expected shortfalls in cash flows if the loan is drawn down. The expected cash shortfalls are discounted at an
approximation to the expected EIR on the loan.
POCI
• POCI assets are financial assets that are credit impaired on initial recognition. The Bank only recognises the
cumulative changes in lifetime ECLs since initial recognition, discounted by the credit-adjusted EIR.
EAD: The Exposure at Default is an estimate of the exposure at a future default date, taking into account
expected changes in the exposure after the reporting date, including repayments of principal and interest,
whether scheduled by contract or otherwise, expected drawdowns on committed facilities, and accrued interest
from missed payments. The EAD is further explained in Note 3.2.4 (c).
LGD: The Loss Given Default is an estimate of the loss arising in the case where a default occurs at a given time. It
is based on the difference between the contractual cash flows due and those that the lender would expect to
receive, including from the realisation of any collateral. It is usually expressed as a percentage of the EAD. The
LGD is further explained in Note 3.2.4 (c).
When estimating the ECLs, the Bank considers only a single scenario which is considered to be the most likely
scenario. When relevant, the assessment also incorporates how defaulted loans are expected to be recovered,
including the probability that the loans will cure and the value of collateral or the amount that might be received
for selling the asset.
The maximum period for which the credit losses are determined is the contractual life of a financial instrument
unless the Bank has the legal right to call it earlier, with the exception of revolving facilities which could extend
beyond the contractual life.
Provisions for ECLs for undrawn loan commitments are assessed as set out in Note 2.20. The calculation of ECLs
(including the ECLs related to the undrawn element) for revolving facilities is explained in Note 3.2.4 (c).
52
Fidelity Bank Plc
NOTES TO THE INTERIM FINANCIAL STATEMENTS
Loan commitments and letters of credit - continued
Bank overdraft and other revolving facilities
The Bank’s product offering includes a variety of corporate and retail overdraft and credit cards facilities, in which
the Bank has the right to cancel and/or reduce the facilities with one day’s notice. The Bank does not limit its
exposure to credit losses to the contractual notice period, but, instead calculates ECL over a period that reflects
the Bank’s expectations of the customer behaviour, its likelihood of default and the Bank’s future risk mitigation
procedures, which could include reducing or cancelling the facilities.
• For revolving facilities that include both a loan and an undrawn commitment, ECLs are calculated and
presented together with the loan. For loan commitments and letters of credit, the ECL is recognised within
Provisions.
Financial guarantee contracts
• The Bank’s liability under each guarantee is measured at the higher of the amount initially recognised less
cumulative amortisation recognised in the profit or loss, and the ECL provision. For this purpose, the Bank estimates
ECLs based on the present value of the expected payments to reimburse the holder for a credit loss that it incurs.
The shortfalls are discounted by the risk-adjusted interest rate relevant to the exposure. The ECLs related to
financial guarantee contracts are recognised within Provisions.
Restructured financial assets
If the terms of a financial asset are renegotiated or modified or an existing financial asset is replaced with a new
one due to financial difficulties of the borrower, then an assessment is made of whether the financial asset should
be derecognised and ECL is measured as follows:
• if the expected restructuring will not result in derecognition of the existing asset, then the expected cash flows
arising from the modified financial asset are included in calculating cash shortfalls from the existing asset.
• if the expected restructuring will result in derecognition of the existing asset, then the expected fair value of the
new asset is treated as the final cash flow from the existing financial asset at the time of its derecognition. This
amount is included in calculating the cash shortfalls from the existing financial asset that are discounted from the
expected date of derecognition to the reporting date using the original effective interest rate of the existing
financial asset.
Credit-impaired financial assets
At each reporting date, the Bank assesses whether financial assets carried at amortised cost and debt instruments
carried at FVOCI are credit-impaired. Financial assets are credit-impaired when one or more events that have a
detrimental impact on the estimated future cash flows of the financial asset have occurred.
Evidence that a financial asset is credit-impaired includes the following:
• there is significant financial difficulty of a customer/issuer/obligor (potential bad debt indicator);
• there is a breach of contract, such as a default or delinquency in interest or principal payments;
• the Bank, for economic or legal reasons relating to the borrower’s financial difficulty, granting to the borrower a
concession that the Bank would not otherwise consider.
• it becomes probable that a counterparty/borrower may enter bankruptcy or other financial reorganisation;
• there is the disappearance of an active market for a financial asset because of financial difficulties; or
• observable data indicates that there is a measurable decrease in the estimated future cash flows from a group
of financial assets.
• the financial asset is 90 days past due
A loan that has been renegotiated due to a deterioration in the borrower's financial condition is usually
considered to be credit-impaired unless there is evidence that the risk of not receiving contractual cash flows has
reduced significantly and there are no other indicators of impairment. In addition, a loan that is overdue for 90
days or more is considered impaired.
53
Fidelity Bank Plc
NOTES TO THE INTERIM FINANCIAL STATEMENTS
2.4.4
Collateral valuation
To mitigate its credit risks on financial assets, the Bank seeks to use collateral, where possible. The collateral comes
in various forms, such as cash, securities, letters of credit/guarantees, real estate, receivables, inventories, other
non-financial assets and credit enhancements such as netting agreements. The Bank’s accounting policy for
collateral assigned to it through its lending arrangements under IFRS 9 is the same is it was under IAS 39. Collateral,
unless repossessed, is not recorded on the Bank’s statement of financial position. However, the fair value of
collateral affects the calculation of ECLs. It is generally assessed, at a minimum, at inception and re-assessed on a
quarterly basis. However, some collateral, for example, cash or securities relating to margining requirements, is
valued daily. Details of the impact of the Bank’s various credit enhancements are disclosed in Note 3.
To the extent possible, the Bank uses active market data for valuing financial assets held as collateral. Other
financial assets which do not have readily determinable market values are valued using models. Non-financial
collateral, such as real estate, is valued based on data provided by third parties such as mortgage brokers, or
based on housing price indices.
Collateral repossessed
The Bank’s accounting policy under IFRS 9 remains the same as it was under IAS 39. The Bank’s policy is to
determine whether a repossessed asset can be best used for its internal operations or should be sold. Assets
determined to be useful for the internal operations are transferred to their relevant asset category at the lower of
their repossessed value or the carrying value of the original secured asset. Assets for which selling is determined to
be a better option are transferred to assets held for sale at their fair value (if financial assets) and fair value less
cost to sell for non-financial assets at the repossession date in, line with the Bank’s policy.
In its normal course of business, the Bank does not physically repossess properties or other assets in its retail
portfolio, but engages external agents to recover funds, generally at auction, to settle outstanding debt. Any
surplus funds are returned to the customers/obligors. As a result of this practice, the residential properties under
legal repossession processes are not recorded on the statement of financial position.
Presentation of allowance for ECL
Loan allowances for ECL are presented in the statement of financial position as follows:
• financial assets measured at amortised cost: as a deduction from the gross carrying amount of the assets;
• loan commitments and financial guarantee contracts: the loss allowance is recognised as a provision;
• where a financial instrument includes both a drawn and an undrawn component, and the Bank cannot identify
the ECL on the loan commitment component separately from those on the drawn component: the Bank presents
a combined loss allowance for both components. The combined amount is presented as a deduction from the
gross carrying amount of the drawn component. Any excess of the loss allowance over the gross amount of the
drawn component is presented as a provision; and
• debt instruments measured at FVOCI: no loss allowance is recognised in the statement of financial position
because the carrying amount of these assets is their fair value. However, the loss allowance is disclosed and is
recognised in the fair value reserve.
Write-off
54

Fidelity Bank Plc
NOTES TO THE INTERIM FINANCIAL STATEMENTS
The Bank writes off financial assets, in whole or part, when it has exhausted all practical recovery efforts and has
concluded there is no reasonable expectation of recovery. Indicators that there is no reasonable expectation of
recovery include ceasing enforcement activity and where the Bank’s recovery method is foreclosing on collateral
and the value of the collateral is such that there is no reasonable expectation of recovering in full.
The Bank may write-off financial assets that are still subject to enforcement activity.
55
Fidelity Bank Plc
NOTES TO THE INTERIM FINANCIAL STATEMENTS
2.4.5
Financial guarantee contracts and loan commitments
Derecognition
Financial liabilities are derecognised when they are extinguished (i.e. when the obligation specified in the
contract is discharged, cancelled or expires).
The exchange between the Bank and its original lenders of debt instruments with substantially different terms, as
well as substantial modifications of the terms of existing financial liabilities, is accounted for as an extinguishment
of the original financial liability and the recognition of a new financial liability. The terms are substantially different
if the discounted present value of the cash flows under the new terms, including any fees paid net of any fees
received and discounted using the original effective interest rate, is at least 10% different from the discounted
present value of the remaining cash flows of the original financial liability. In addition, other qualitative factors,
such as the currency that the instrument is denominated in, changes in the type of interest rate, new conversion
features attached to the instrument and change in covenants are also taken into consideration.
If an exchange of debt instruments or modification of terms is accounted for as an extinguishment, any costs or
fees incurred are recognised as part of the gain or loss on the extinguishment. If the exchange or modification is
not accounted for as an extinguishment, any costs or fees incurred adjust the carrying amount of the liability and
are amortised over the remaining term of the modified liability.
Financial guarantees contracts are contracts that require the Bank to make specified payments to reimburse the
holder for a loss that it incurs because a specified debtor fails to make payment when it is due in accordance with
the terms of the debt instrument. Such financial guarantees are given to banks, financial institutions and others on
behalf of customers to secure loans, overdrafts and other banking facilities.
Loan commitments are firm commitments to provide credit under pre-specified terms and conditions.
Financial guarantees issued or commitments to provide a loan at below-market interest rate are initially measured
at fair value and the initial fair value is amortised over the life of the guarantee or the commitment. Subsequently,
they are measured at the higher of the amount of loss allowance and the premium received on initial recognition
less income recognised in accordance with the principles of IFRS 15.
For loan commitments and financial guarantee contracts, the loss allowance is recognised as a provision.
However, for contracts that include both a loan and an undrawn commitment and the Bank cannot separately
identify the expected credit losses on the undrawn commitment component from those on the loan component,
the expected credit losses on the undrawn commitment are recognised together with the loss allowance for the
loan. To the extent that the combined expected credit losses exceed the gross carrying amount of the loan, the
expected credit losses are recognised as a provision.
Financial liabilities
In both the current and prior period, all financial liabilities are classified and subsequently measured at amortised
cost.
Initial and subsequent measurement
Financial liabilities are initially measured at their fair value, except in the case of financial liabilities recorded at
FVPL, transaction costs are added to, or subtracted from, this amount. Financial liabilities, other than loan
commitments and financial guarantees, are measured at amortised cost or at FVPL when they are held for trading
and derivative instruments or the fair value designation is applied.
After initial measurement, debt issued and other borrowed funds are subsequently measured at amortised cost.
Amortised cost is calculated by taking into account any discount or premium on issue funds, and costs that are an
integral part of the EIR. The Bank classifies financial liabilities as held for trading when they have been purchased
or issued primarily for short-term profit making through trading activities or form part of a portfolio of financial
instruments that are managed together, for which there is evidence of a recent pattern of short-term profit taking.
Held-for-trading liabilities are recorded and measured in the statement of financial position at fair value.
56
Fidelity Bank Plc
NOTES TO THE INTERIM FINANCIAL STATEMENTS
2.5 Accounting policy applicable for financial instruments before 1 January 2018
2.5.1 Financial assets and liabilities
2.5.1 Financial assets and liabilities - continued
a) Initial recognition and measurement
b) Subsequent measurement
c) Classification and related measurement
i) Financial assets
Financial assets at fair value through profit or loss
In accordance with IAS 39, all financial assets and liabilities - which include derivative financial instruments - have
to be recognised in the statement of financial position and measured in accordance with their assigned
category.
Financial instruments at fair value through profit or loss are initially recognised at fair value while transaction costs,
which are directly attributable to the acquisition or issue of the financial instruments, are recognised immediately
through profit or loss. Financial instruments that are not carried at fair value through profit or loss are initially
measured at fair value plus transaction costs that are directly attributable to the acquisition or issue of the
financial instruments.
Subsequent to initial measurement, financial instruments are measured either at fair value or amortised cost
depending on their classification.
Management determines the classification of its financial instruments at initial recognition. Reclassification of
financial assets are permitted in certain instances as discussed below;
The Bank classifies its financial assets in terms of the following IAS 39 categories: financial assets at fair value
through profit or loss; loans and receivables; held-to-maturity financial assets; and available-for-sale financial
assets.
This category comprises two sub-categories: financial assets classified as held for trading, and financial assets
designated by the Bank as fair value through profit or loss upon initial recognition (the so-called "fair value
option"). At the reporting dates covered by these financial statements, financial assets at fair value through profit
or loss comprise financial assets classified as held for trading only. Management did not apply the fair value
option to any financial assets existing at these dates.
A financial asset is classified as held for trading if it is acquired or incurred principally for the purpose of selling or
repurchasing it in the near term or if it is part of a portfolio of identified financial instruments that are managed
together and for which there is evidence of a recent actual pattern of short-term profit-taking.
Financial instruments included in this category are subsequently measured at fair value with gains and losses
arising from changes in fair value recognised in 'Net gains/(losses) from financial instruments at fair value' in profit
or loss. Interest and similar income and dividend income on financial assets held for trading are included in
'Interest and similar income' and 'Other operating income' respectively.
57

Fidelity Bank Plc
NOTES TO THE INTERIM FINANCIAL STATEMENTS
Loans and receivables
Held-to-maturity financial assets
Available-for-sale financial assets
ii) Financial liabilities
Financial liabilities are classified as at fair value through profit or loss (including financial liabilities held for trading
and those designated at fair value through profit or loss) and financial liabilities at amortised cost. The Bank only
has financial liabilities at amortised cost.
Financial liabilities that are not classified as at fair value through profit or loss are measured at amortised cost
using the effective interest method. Interest expense is included in 'Interest & similar expense' in the profit or loss.
Loans and receivables are non-derivative financial assets with fixed or determinable payments that are not
quoted in an active market, other than:
• those that the Bank intends to sell immediately or in the short term, which are classified as held for trading,
and those that the entity upon initial recognition designates as fair value through profit or loss;
• those that the Bank upon initial recognition designates as available-for-sale; or
• those for which the holder may not recover substantially all of its initial investment, other than because of
credit deterioration.
Loans and receivables are subsequently measured at amortised cost using the effective interest rate method.
Interest income is included in 'Interest & similar income' in the profit or loss.
Held-to-maturity financial assets are non-derivative financial assets with fixed or determinable payments and fixed
maturities that the Bank's management has the positive intention and ability to hold to maturity, other than:
• those that the Bank upon initial recognition designates as fair value through profit or loss;
• those that the Bank upon initial recognition designates as available-for-sale; or
• those that meet the definition of loans and receivables.
These financial assets are subsequently measured at amortised cost using the effective interest rate method.
Interest income is included in 'Interest & similar income' in profit or loss.
Available-for-sale financial assets are non-derivatives that are either designated in this category or not classified
as loans and receivables, held-to-maturity financial assets or financial assets at fair value through profit or loss.
Available-for-sale financial assets are subsequently measured at fair value with fair value gains and losses
recognised in other comprehensive income. Interest calculated using the effective interest method is recognised
in 'Interest and similar income', with dividend income included in 'Other operating income'. When available-for-
sale financial assets are sold or impaired, the cumulative gain or loss recognised in a separate reserve in equity
are reclassified to profit or loss.
58
Fidelity Bank Plc
NOTES TO THE INTERIM FINANCIAL STATEMENTS
d) Reclassification of financial assets
e) Derecognition
f) Offsetting financial instruments
g) Renegotiated loans
The Bank may choose to reclassify a non-derivative financial asset held for trading out of the held for trading
category if the financial asset is no longer held for the purpose of selling it in the near term. Financial assets other
than loans and receivables are permitted to be reclassified out of the held for trading category only in rare
circumstances arising from a single event that is unusual and highly unlikely to recur in the near-term. In addition,
the Bank may choose to reclassify financial assets that would meet the definition of loans and receivables out of
the held for trading or available-for-sale categories if the Bank has the intention and ability to hold these financial
assets for the foreseeable future or until maturity at the date of reclassification.
Reclassifications are made at fair value as of the reclassification date. Fair value becomes the new cost or
amortised cost as applicable, and no reversals of fair value gains or losses recorded before reclassification date
are subsequently made. Effective interest rates for financial assets reclassified to loans and receivables and held-
to-maturity categories are determined at the reclassification date. Further increases in estimates of cash flows
adjust effective interest rates prospectively.
On reclassification of a financial asset out of the fair value through profit or loss category, all embedded
derivatives are re-assessed and, if necessary, separately accounted for.
Financial assets are derecognised when the contractual rights to receive the cash flows from these assets have
ceased to exist or the assets have been transferred and substantially all the risks and rewards of ownership of the
assets are also transferred (that is, if substantially all the risks and rewards have not been transferred, the Bank tests
control to ensure that continuing involvement on the basis of any retained powers of control does not prevent
derecognition). Financial liabilities are derecognised when they have been redeemed or otherwise extinguished.
Collateral (shares and bonds) furnished by the Bank under standard repurchase agreements and securities
lending and borrowing transactions is not derecognised because the Bank retains substantially all the risks and
rewards on the basis of the predetermined repurchase price, and the criteria for derecognition are therefore not
met.
Financial assets that are transferred to a third party but do not qualify for derecognition are presented in the
Statement of financial position as 'Assets pledged as collateral', if the transferee has the right to sell or repledge
them.
Financial assets and liabilities are offset and the net amount reported in the statement of financial position when
there is a legally enforceable right to offset the recognised amounts and there is an intention to settle on a net
basis or realise the asset and settle the liability simultaneously.
Where possible, the Bank seeks to restructure loans rather than to take possession of collateral. This may involve
extending the payment arrangements and the agreement of new loan conditions. Once the terms have been
renegotiated, any impairment is measured using the original effective interest rate (EIR) as calculated before the
modification of terms and the loan is no longer considered past due. Management continually reviews
renegotiated loans to ensure that all criteria are met and that future payments are likely to occur. The loans
continue to be subject to an individual or collective impairment assessment, calculated using the loan’s original
EIR.
59

Fidelity Bank Plc
NOTES TO THE INTERIM FINANCIAL STATEMENTS
h) Impairment of financial assets
Assets carried at amortised cost
The Bank assesses at the end of each reporting period whether there is objective evidence that a financial asset
or a group of financial assets is impaired. A financial asset or group of financial assets is impaired and impairment
losses are incurred only if there is objective evidence of impairment as a result of one or more events that
occurred after the initial recognition of the asset (a 'loss event') and that loss event (or events) has an impact on
the estimated future cash flows of the financial asset or group of financial assets that can be reliably estimated.
The criteria that the Bank uses to determine that there is objective evidence of an impairment loss include:
· Delinquency in contractual payments of principal or interest;
· Cash flow difficulties experienced by the borrower (for example, equity ratio, net income percentage of sales);
· Breach of loan covenants or conditiodns;
· Initiation of bankruptcy proceedings;
· Deterioration of the borrower’s competitive position;
· Deterioration in the value of collateral;
· Downgrading below investment grade level;
· Significant financial difficulty of the issuer or obligor;
· A breach of contract, such as a default or delinquency in interest or principal payments;
· The lender, for economic or legal reasons relating to the borrower’s financial difficulty, granting to the borrower
a concession that the lender would not otherwise consider;
· It becomes probable that the borrower will enter bankruptcy or other financial reorganisation;
The Bank first assesses whether objective evidence of impairment exists individually for financial assets that are
individually significant, and individually or collectively for financial assets that are not individually significant. If the
Bank determines that no objective evidence of impairment exists for an individually assessed financial asset,
whether significant or not, it includes the asset in a group of financial assets with similar credit risk characteristics
and collectively assesses them for impairment. Assets that are individually assessed for impairment and for which
an impairment loss is or continues to be recognised are not included in a collective assessment of impairment.
The amount of the loss is measured as the difference between the asset’s carrying amount and the present value
of estimated future cash flows (excluding future credit losses that have not been incurred) discounted at the
financial asset’s original effective interest rate. The carrying amount of the asset is reduced through the use of an
allowance account and the amount of the loss is recognised in profit or loss. If a financial instrument has a
variable interest rate, the discount rate for measuring any impairment loss is the current effective interest rate
determined under the contract.
The calculation of the present value of the estimated future cash flows of a collateralised financial asset reflects
the cash flows that may result from foreclosure less costs for obtaining and selling the collateral, whether or not
foreclosure is probable.
· The disappearance of an active market for that financial asset because of financial difficulties; and
· Observable data indicating that there is an measurable decrease in the estimated future cash flows from a
portfolio of financial assets since the initial recognition of those assets although the decrease cannot yet be
identified with the individual financial assets in the portfolio, including: adverse changes in the payment status of
borrowers in the portfolio; and national or local economic conditions that correlate with defaults on the assets in
the portfolio.
60
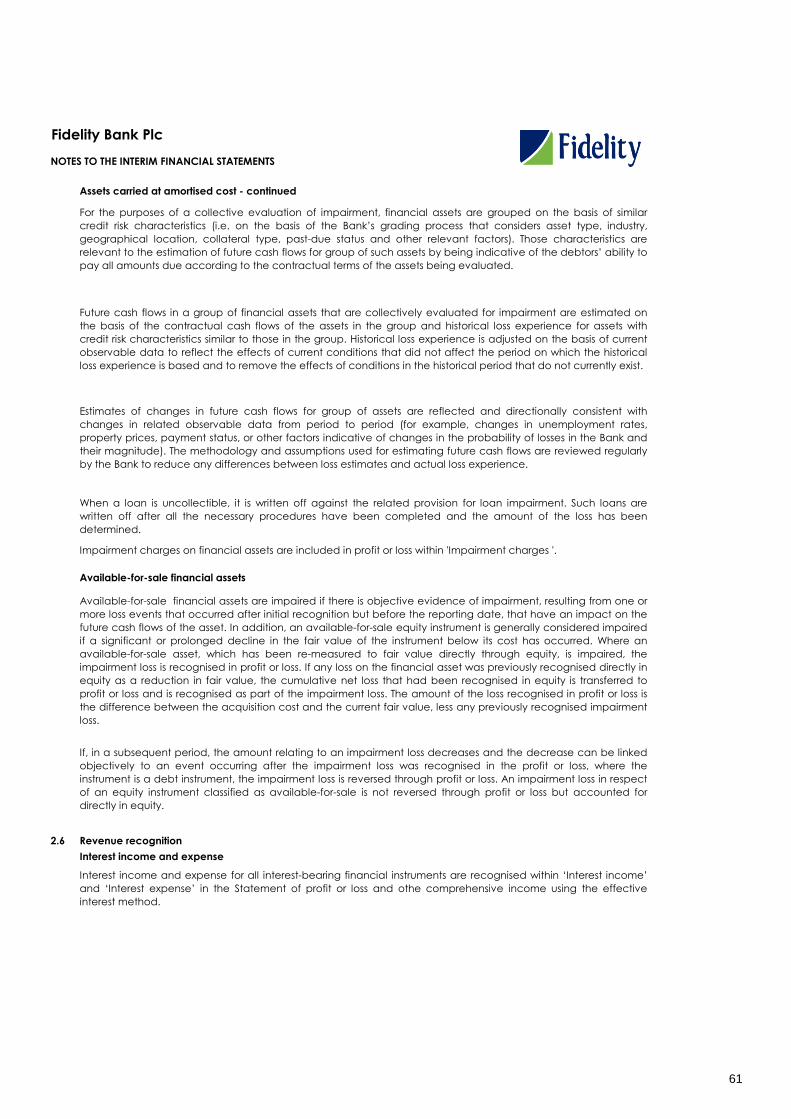
Fidelity Bank Plc
NOTES TO THE INTERIM FINANCIAL STATEMENTS
Assets carried at amortised cost - continued
Available-for-sale financial assets
2.6
Estimates of changes in future cash flows for group of assets are reflected and directionally consistent with
changes in related observable data from period to period (for example, changes in unemployment rates,
property prices, payment status, or other factors indicative of changes in the probability of losses in the Bank and
their magnitude). The methodology and assumptions used for estimating future cash flows are reviewed regularly
by the Bank to reduce any differences between loss estimates and actual loss experience.
When a loan is uncollectible, it is written off against the related provision for loan impairment. Such loans are
written off after all the necessary procedures have been completed and the amount of the loss has been
determined.
Impairment charges on financial assets are included in profit or loss within 'Impairment charges '.
Available-for-sale financial assets are impaired if there is objective evidence of impairment, resulting from one or
more loss events that occurred after initial recognition but before the reporting date, that have an impact on the
future cash flows of the asset. In addition, an available-for-sale equity instrument is generally considered impaired
if a significant or prolonged decline in the fair value of the instrument below its cost has occurred. Where an
available-for-sale asset, which has been re-measured to fair value directly through equity, is impaired, the
impairment loss is recognised in profit or loss. If any loss on the financial asset was previously recognised directly in
equity as a reduction in fair value, the cumulative net loss that had been recognised in equity is transferred to
profit or loss and is recognised as part of the impairment loss. The amount of the loss recognised in profit or loss is
the difference between the acquisition cost and the current fair value, less any previously recognised impairment
loss.
If, in a subsequent period, the amount relating to an impairment loss decreases and the decrease can be linked
objectively to an event occurring after the impairment loss was recognised in the profit or loss, where the
instrument is a debt instrument, the impairment loss is reversed through profit or loss. An impairment loss in respect
of an equity instrument classified as available-for-sale is not reversed through profit or loss but accounted for
directly in equity.
Revenue recognition
For the purposes of a collective evaluation of impairment, financial assets are grouped on the basis of similar
credit risk characteristics (i.e. on the basis of the Bank’s grading process that considers asset type, industry,
geographical location, collateral type, past-due status and other relevant factors). Those characteristics are
relevant to the estimation of future cash flows for group of such assets by being indicative of the debtors’ ability to
pay all amounts due according to the contractual terms of the assets being evaluated.
Future cash flows in a group of financial assets that are collectively evaluated for impairment are estimated on
the basis of the contractual cash flows of the assets in the group and historical loss experience for assets with
credit risk characteristics similar to those in the group. Historical loss experience is adjusted on the basis of current
observable data to reflect the effects of current conditions that did not affect the period on which the historical
loss experience is based and to remove the effects of conditions in the historical period that do not currently exist.
Interest income and expense
Interest income and expense for all interest-bearing financial instruments are recognised within ‘Interest income’
and ‘Interest expense’ in the Statement of profit or loss and othe comprehensive income using the effective
interest method.
61

Fidelity Bank Plc
NOTES TO THE INTERIM FINANCIAL STATEMENTS
2.7
2.8
Fees and commissions are generally recognised on an accrual basis when the service has been provided in line
with the requirement of IFRS 15 - Revenue from Contracts with Customers. Loan commitment fees for loans that
are likely to be drawn down are deferred (together with related direct costs) and recognised as an adjustment to
the effective interest rate on the loan. Loan syndication fees are recognised as revenue when the syndication has
been completed and the Bank has retained no part of the loan package for itself or has retained a part at the
same effective interest rate as the other participants. Commission and fees arising from negotiating, or
participating in the negotiation of, a transaction for a third party, are recognised on completion of the underlying
transaction.
Income from bonds or guarantees and letters of credit
Income from bonds or guarantees and letters of credit are recognised on a straight line basis over the life of the
bond or guarantee in accordance with the requirement of IFRS 15.
Dividend income
Dividends are recognised in profit or loss when the entity’s right to receive payment is established.
Fees and commission income
Statement of cash flows
The Statement of cash flows shows the changes in cash and cash equivalents arising during the period from
operating activities, investing activities and financing activities. Cash and cash equivalents include highly liquid
investments.
The cash flows from operating activities are determined by using the indirect method. Net income is therefore
adjusted by non-cash items, such as measurement gains or losses, changes in provisions, as well as changes from
receivables and liabilities. In addition, all income and expenses from cash transactions that are attributable to
investing or financing activities are eliminated.
The Bank’s assignment of the cash flows to operating, investing and financing category depends on the Bank's
business model (management approach). Interest received and interest paid are classified as operating cash
flows, while dividends received and dividends paid are included in investing and financing activities respectively.
Impairment of non-financial assets
Assets are reviewed for impairment whenever events or changes in circumstances indicate that the carrying
amount may not be recoverable. Additionally, intangible assets that have an indefinite useful life and are not
subject to amortisation are tested annually for impairment. An impairment loss is recognised for the amount by
which the asset’s carrying amount exceeds its recoverable amount. The recoverable amount is the higher of an
asset’s fair value less costs to sell and value in use. For the purpose of assessing impairment, assets are grouped at
the lowest levels for which there are separately identifiable cash inflows (cash-generating units). The impairment
test may also be performed on a single asset when the fair value less cost to sell or the value in use can be
determined reliably. Non-financial assets other than goodwill that suffered impairment are reviewed for possible
reversal of the impairment at each reporting date.
Impairment losses recognised in prior periods are assessed at each reporting date for any indications that the loss
has decreased or no longer exists. An impairment loss is reversed if there has been a change in the estimates used
to determine the recoverable amount. An impairment loss is reversed only to the extent that the asset’s carrying
amount does not exceed the carrying amount that would have been determined, net of depreciation or
amortisation, if no impairment loss had been recognised. An impairment loss in respect of goodwill is not reversed.
62
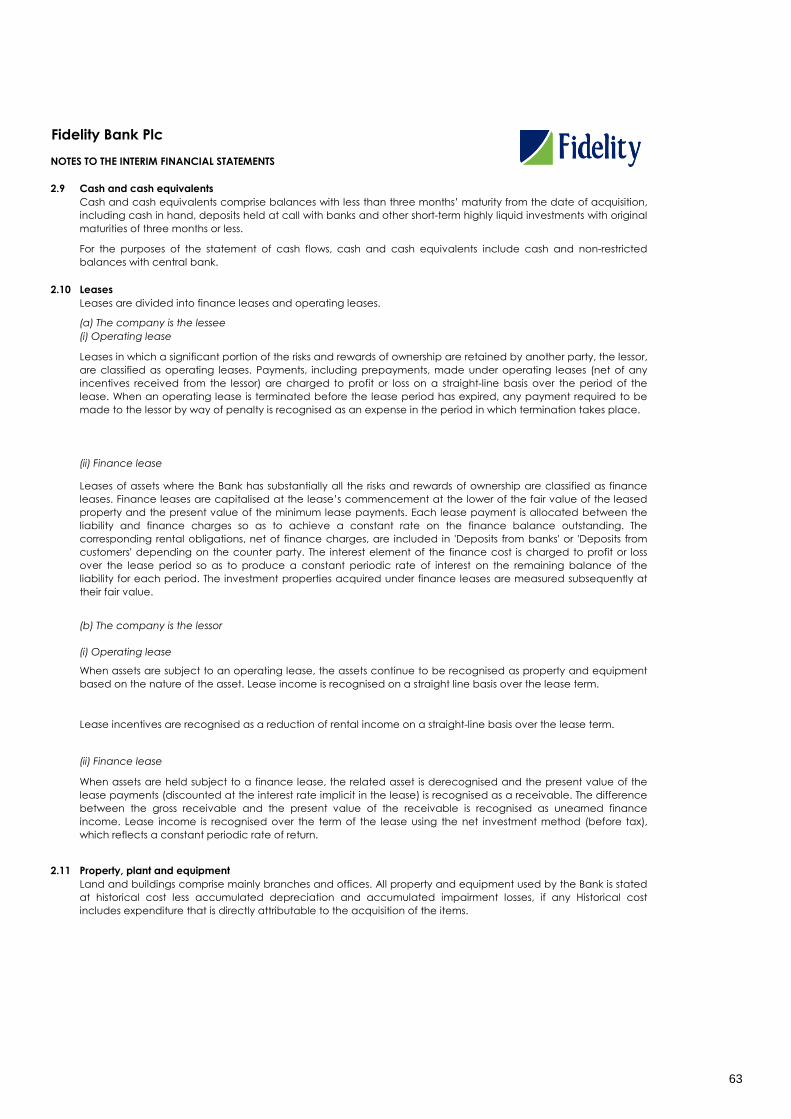
Fidelity Bank Plc
NOTES TO THE INTERIM FINANCIAL STATEMENTS
2.9
2.10
2.11
(a) The company is the lessee
(i) Operating lease
Leases in which a significant portion of the risks and rewards of ownership are retained by another party, the lessor,
are classified as operating leases. Payments, including prepayments, made under operating leases (net of any
incentives received from the lessor) are charged to profit or loss on a straight-line basis over the period of the
lease. When an operating lease is terminated before the lease period has expired, any payment required to be
made to the lessor by way of penalty is recognised as an expense in the period in which termination takes place.
Cash and cash equivalents
Cash and cash equivalents comprise balances with less than three months’ maturity from the date of acquisition,
including cash in hand, deposits held at call with banks and other short-term highly liquid investments with original
maturities of three months or less.
For the purposes of the statement of cash flows, cash and cash equivalents include cash and non-restricted
balances with central bank.
Leases
Leases are divided into finance leases and operating leases.
(ii) Finance lease
When assets are held subject to a finance lease, the related asset is derecognised and the present value of the
lease payments (discounted at the interest rate implicit in the lease) is recognised as a receivable. The difference
between the gross receivable and the present value of the receivable is recognised as unearned finance
income. Lease income is recognised over the term of the lease using the net investment method (before tax),
which reflects a constant periodic rate of return.
(ii) Finance lease
Leases of assets where the Bank has substantially all the risks and rewards of ownership are classified as finance
leases. Finance leases are capitalised at the lease’s commencement at the lower of the fair value of the leased
property and the present value of the minimum lease payments. Each lease payment is allocated between the
liability and finance charges so as to achieve a constant rate on the finance balance outstanding. The
corresponding rental obligations, net of finance charges, are included in 'Deposits from banks' or 'Deposits from
customers' depending on the counter party. The interest element of the finance cost is charged to profit or loss
over the lease period so as to produce a constant periodic rate of interest on the remaining balance of the
liability for each period. The investment properties acquired under finance leases are measured subsequently at
their fair value.
(b) The company is the lessor
(i) Operating lease
Property, plant and equipment
Land and buildings comprise mainly branches and offices. All property and equipment used by the Bank is stated
at historical cost less accumulated depreciation and accumulated impairment losses, if any Historical cost
includes expenditure that is directly attributable to the acquisition of the items.
When assets are subject to an operating lease, the assets continue to be recognised as property and equipment
based on the nature of the asset. Lease income is recognised on a straight line basis over the lease term.
Lease incentives are recognised as a reduction of rental income on a straight-line basis over the lease term.
63

Fidelity Bank Plc
NOTES TO THE INTERIM FINANCIAL STATEMENTS
Property, plant and equipment - continued
2.12
· there is an ability to use or sell the software product;
· it can be demonstrated how the software product will generate probable future economic benefits;
· adequate technical, financial and other resources to complete the development and to use or sell the
software product are available; and
Construction cost and improvements in respect of offices is carried at cost as capital work in progress. On
completion of construction or improvements, the related amounts are transferred to the appropriate category of
property and equipment. Payments in advance for items of property and equipment are included as
Prepayments in “Other Assets” and upon delivery are reclassified as additions in the appropriate category of
property and equipment.
Intangible assets
Costs associated with maintaining computer software programmes are recognised as an expense as incurred.
Development costs that are directly attributable to the design and testing of identifiable and unique software
products controlled by the Bank, are recognised as intangible assets when the following criteria are met:
· it is technically feasible to complete the software product so that it will be available for use;
· management intends to complete the software product and use or sell it;
· the expenditure attributable to the software product during its development can be reliably
measured.
Subsequent expenditure on computer software is capitalised only when it increases the future economic benefits
embodied in the specific asset to which it relates.
Direct computer software costs recognised as intangible assets are amortised on the straight-line basis over 3
years and are carried at cost less any accumulated amortisation and any accumulated impairment losses.
Subsequent expenditures are included in the asset’s carrying amount or are recognised as a separate asset, as
appropriate, only when it is probable that future economic benefits associated with the item will flow to the Bank
and the cost of the item can be measured reliably. The carrying amount of the replaced part is derecognised. All
other repair and maintenance costs are charged to 'Other operating expenses' during the financial period in
which they are incurred.
Land included in leasehold land and buildings is not depreciated. Depreciation of other assets is calculated using
the straight-line method to allocate their cost to their residual values over their estimated useful lives, as follows:
- Leasehold buildings: Depreciated over the lease period
- Leasehold improvements: The lower of useful life and lease period
- Motor vehicles: 4 years
- Furniture and fittings: 5 years
- Computer equipment: 3 years
-Office equipment: 5 years
The assets’ residual values and useful lives are reviewed annually, and adjusted if appropriate.
Gains and losses on disposals are determined by comparing the proceeds with the carrying amount. These are
included in 'Other operating expenses' in profit or loss.
64

Fidelity Bank Plc
NOTES TO THE INTERIM FINANCIAL STATEMENTS
2.13
(a) Current income tax
(b) Deferred income tax
2.14 Provisions
2.15 Share capital
(a) Share issue costs
(b) Dividends on ordinary shares
Incremental costs directly attributable to the issue of new shares or options or to the acquisition of a business are
shown in equity as a deduction, net of tax, from the proceeds.
Dividends on ordinary shares are recognised in equity in the period in which they are approved by the Bank’s
shareholders.
Dividends for the period that are declared after the reporting date are dealt with in the subsequent events note.
Dividends proposed by the Directors but not yet approved by members are disclosed in the interim financial
statements in accordance with the requirements of the Company and Allied Matters Act.
Deferred income tax is recognised, using the liability method, on temporary differences arising between the tax
bases of assets and liabilities and their carrying amounts in the interim financial statements. Deferred income tax
is determined using tax rates (and laws) that have been enacted or substantially enacted by the reporting date
and are expected to apply when the related deferred income tax asset is realised or the deferred income tax
liability is settled.
Deferred income tax assets are recognised only to the extent that it is probable that future taxable profit will be
available against which the temporary differences can be utilised.
Deferred income tax is provided on temporary differences arising from investments in subsidiaries and associates,
except where the timing of the reversal of the temporary difference is controlled by the Bank and it is probable
that the difference will not reverse in the foreseeable future.
Deferred income tax assets and liabilities are offset when there is a legally enforceable right to offset current tax
assets against current tax liabilities and when the deferred income tax assets and liabilities relate to income taxes
levied by the same taxation authority on either the same taxable entity or different taxables entities where there is
an intention to settle the balance on a net basis.
Provisions for restructuring costs and legal claims are recognised when: the Bank has a present legal or
constructive obligation as a result of past events; it is more likely than not that an outflow of resources will be
required to settle the obligation; and the amount has been reliably estimated. The Bank recognises no provisions
for future operating losses.
If the effect of the time value of money is material, provisions are discounted using a current pre-tax rate that
reflects, when appropriate, the risks specific to the liability. When discounting is used, the increase in the provision
due to the passage of time is recognised as a finance cost.
Income taxation
The tax expense for the period comprises current and deferred tax. Tax is recognised in arriving at profit or loss,
except to the extent that it relates to items recognised in other comprehensive income or directly in equity. In this
case, the tax is also recognised in other comprehensive income or directly in equity, respectively.
The current income tax charge is calculated on the basis of the applicable tax laws enacted or substantively
enacted at the reporting date in the respective jurisdiction.
65

Fidelity Bank Plc
NOTES TO THE INTERIM FINANCIAL STATEMENTS
2.16 Comparatives
2.17 Segment Reporting
Retail banking
Corporate banking
Investment banking
Public Sector
The Public sector offers a wide variety to governments of various levels including parastatals, ministries,
departments and other agencies.
Except when a standard or an interpretation permits or requires otherwise, all amounts are reported or disclosed
with comparative information. Where IAS 8 applies, comparative figures have been adjusted to conform with
changes in presentation in the current year.
IFRS 8 requires an entity to report financial and descriptive information about its reportable segments, which are
operating segments or aggregations of operating segments that meet specified criteria. Operating segments are
components of an entity about which seperate financial information is availble that is evaluated regularly by the
chief operating decision-maker in deciding how to allocate resources and in assessing performance. The bank
has determined the (Executive Committe) as its chief operating decision maker.
IFRS 8.20 states that an entity shall diclose information to enable users of its financial statements to evaluate the
nature and financial effects of the types of business activities in which it engages and the economic environments
in which it operates. Following the management approach to IFRS 8, operating segments are reported in
accordance with the internal reports provided to the Bank's Managing Director (the chief operating decision
maker). The following summary describes each of the bank's reportable segments.
The retail banking segment offers a comprehensive range of retail, personal and commercial services to
individuals, small and medium business customers including a variety of E-Business products to serve the retail
banking segment.
The corporate banking segment offers a comprehensive range of commercial and corporate banking services to
the corporate business customers including other meduim and large business customers. The segment covers
Power and infrastructure, Oil and Gas Upstream and Downstream, Real Estate, Agro-Allied and other industries.
The bank's investment banking segment is involved in the funding and management of the bank's securities,
trading and investment decisions on asset management with a view of maximising the bank's shareholders returns.
66

Fidelity Bank Plc
NOTES TO THE INTERIM FINANCIAL STATEMENTS
2.18
Notes Category Amount Reclassification ECL Other Amount Category
Financial assets N'million N'million N'million N'million N'million
1 Total Financial assets measured at amortised cost
Cash and balances with central bank cLoans and
receivables 269,625 - - - 269,625 Amortised cost
Due from banks cLoans and
receivables 52,287 - - - 52,287 Amortised cost
Loans and advances to customers cLoans and
receivables 768,737 - (27,924) - 740,813 Amortised cost
Debt instruments at amortised cost: 116,117 (11) (80) 116,026 Amortised cost
From: Investments - held to maturity (HTM) 108,784
From: Investments -Available-for-sale(AFS) a 7,333 (80)
Other assets cLoans and
receivables 33,955 33,955 Amortised cost
Total Financial assets measured at amortised
cost 1,124,604 116,117 (27,935) (80) 1,212,706 Amortised cost
2Equity instruments at fair value through other
comprehensive income (FVOCI)N/A 5,888 - 3986 9,874
Fair value
through OCI
(FVOCI)
From: Investment securities - Available for
sale (AFS)b 5,888
Total equity instruments at fair value through
other comprehensive income (FVOCI)5,888 3,986 9,874
Fair value
through OCI
(FVOCI)
TRANSITION DISCLOSURES
The following pages set out the impact of adopting IFRS 9 on the interim statement of financial position, and retained earnings including the effect of
replacing IAS 39’s incurred credit loss calculations with IFRS 9's ECLs. A reconciliation between the carrying amounts under IAS 39 to the balances
reported under IFRS 9 as of 1 January 2018 is, as follows:
IAS 39 measurement Re-measurement IFRS 9
66
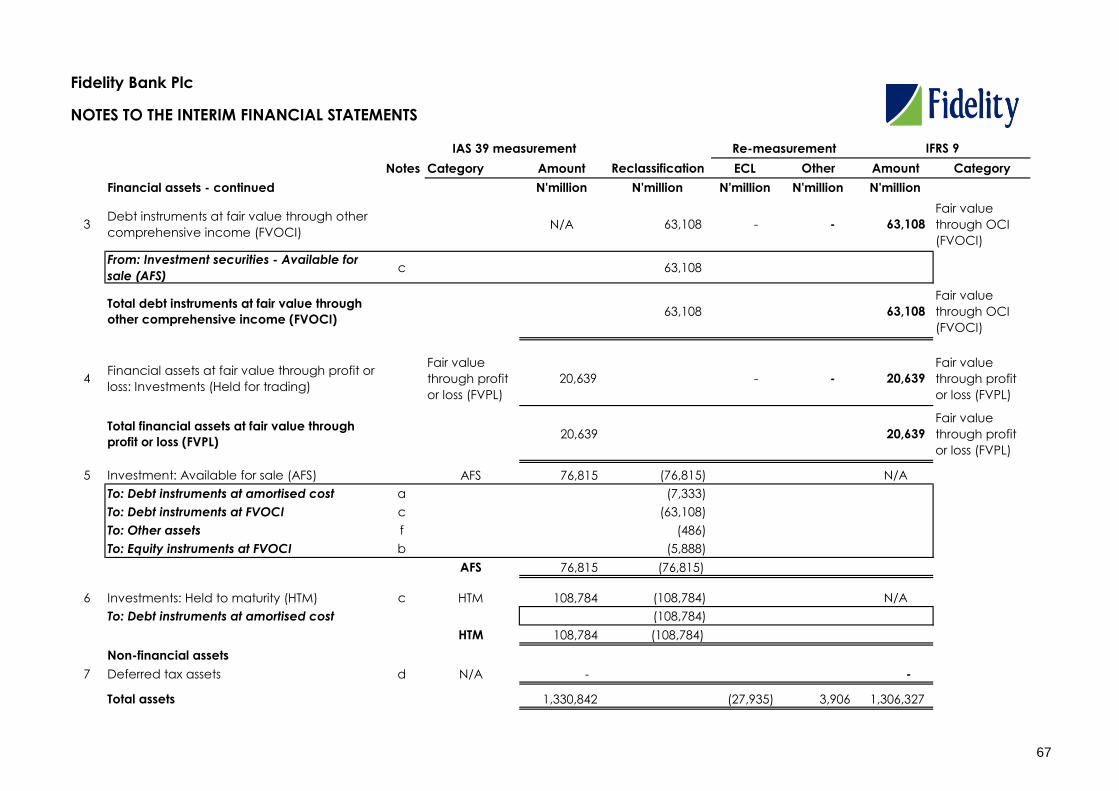
Fidelity Bank Plc
NOTES TO THE INTERIM FINANCIAL STATEMENTS
Notes Category Amount Reclassification ECL Other Amount Category
Financial assets - continued N'million N'million N'million N'million N'million
3Debt instruments at fair value through other
comprehensive income (FVOCI)N/A 63,108 - - 63,108
Fair value
through OCI
(FVOCI)
From: Investment securities - Available for
sale (AFS)c 63,108
Total debt instruments at fair value through
other comprehensive income (FVOCI)63,108 63,108
Fair value
through OCI
(FVOCI)
4Financial assets at fair value through profit or
loss: Investments (Held for trading)
Fair value
through profit
or loss (FVPL)
20,639 - - 20,639
Fair value
through profit
or loss (FVPL)
Total financial assets at fair value through
profit or loss (FVPL) 20,639 20,639
Fair value
through profit
or loss (FVPL)
5 Investment: Available for sale (AFS) AFS 76,815 (76,815) N/A
To: Debt instruments at amortised cost a (7,333)
To: Debt instruments at FVOCI c (63,108)
To: Other assets f (486)
To: Equity instruments at FVOCI b (5,888)
AFS 76,815 (76,815)
6 Investments: Held to maturity (HTM) c HTM 108,784 (108,784) N/A
To: Debt instruments at amortised cost (108,784)
HTM 108,784 (108,784)
Non-financial assets
7 Deferred tax assets d N/A - -
Total assets 1,330,842 (27,935) 3,906 1,306,327
IAS 39 measurement Re-measurement IFRS 9
67
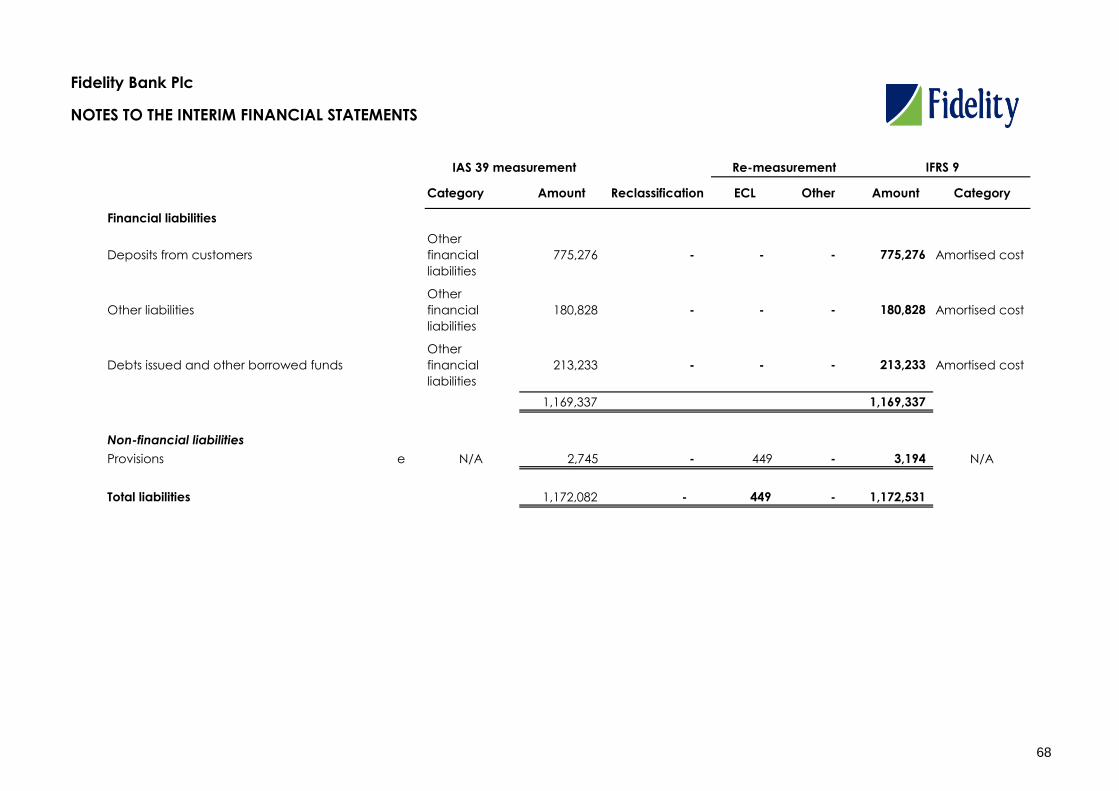
Fidelity Bank Plc
NOTES TO THE INTERIM FINANCIAL STATEMENTS
Category Amount Reclassification ECL Other Amount Category
Financial liabilities
Deposits from customers
Other
financial
liabilities
775,276 - - - 775,276 Amortised cost
Other liabilities
Other
financial
liabilities
180,828 - - - 180,828 Amortised cost
Debts issued and other borrowed funds
Other
financial
liabilities
213,233 - - - 213,233 Amortised cost
1,169,337 1,169,337
Non-financial liabilities
Provisions e N/A 2,745 - 449 - 3,194 N/A
Total liabilities 1,172,082 - 449 - 1,172,531
IAS 39 measurement Re-measurement IFRS 9
68
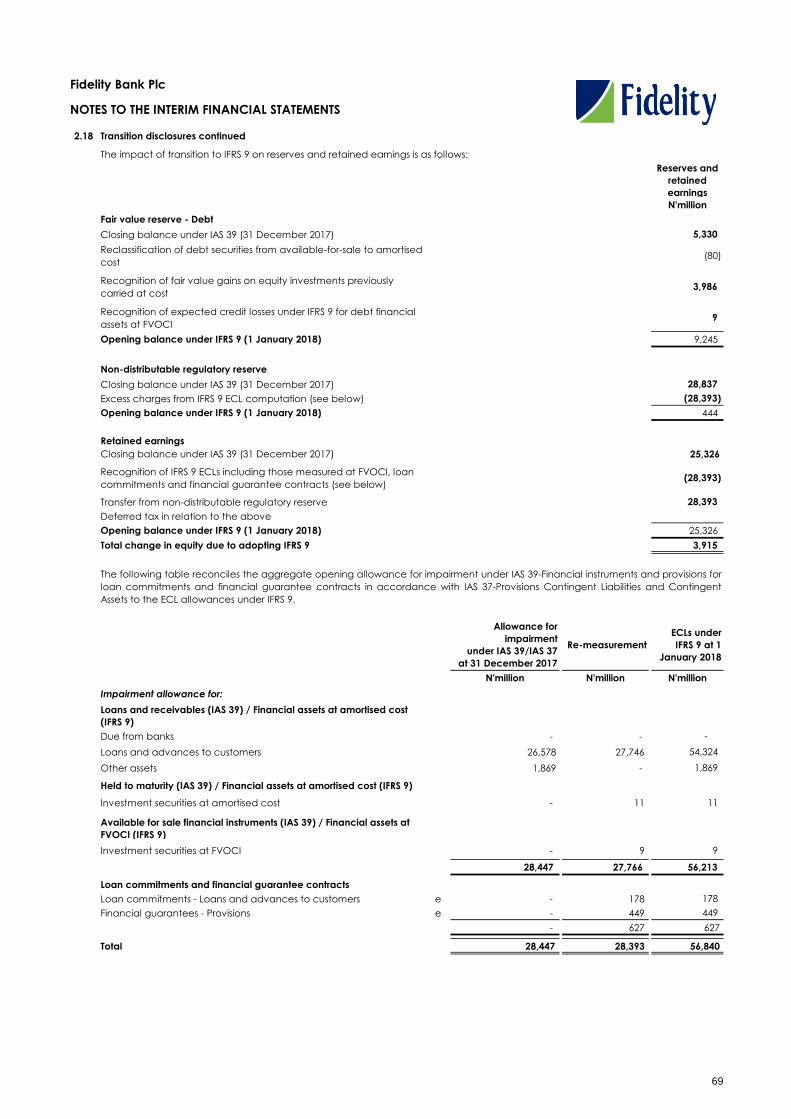
Fidelity Bank Plc
NOTES TO THE INTERIM FINANCIAL STATEMENTS
2.18 Transition disclosures continued
Reserves and
retained
earnings
N'million
Fair value reserve - Debt
Closing balance under IAS 39 (31 December 2017) 5,330
Reclassification of debt securities from available-for-sale to amortised
cost(80)
Recognition of fair value gains on equity investments previously
carried at cost3,986
Recognition of expected credit losses under IFRS 9 for debt financial
assets at FVOCI9
Opening balance under IFRS 9 (1 January 2018) 9,245
Non-distributable regulatory reserve
Closing balance under IAS 39 (31 December 2017) 28,837
Excess charges from IFRS 9 ECL computation (see below) (28,393)
Opening balance under IFRS 9 (1 January 2018) 444
Retained earnings
Closing balance under IAS 39 (31 December 2017) 25,326
Recognition of IFRS 9 ECLs including those measured at FVOCI, loan
commitments and financial guarantee contracts (see below)(28,393)
Transfer from non-distributable regulatory reserve 28,393
Deferred tax in relation to the above
Opening balance under IFRS 9 (1 January 2018) 25,326
Total change in equity due to adopting IFRS 9 3,915
Allowance for
impairment
under IAS 39/IAS 37
at 31 December 2017
Re-measurement
ECLs under
IFRS 9 at 1
January 2018
N'million N'million N'million
Impairment allowance for:
Loans and receivables (IAS 39) / Financial assets at amortised cost
(IFRS 9)
Due from banks - - -
Loans and advances to customers 26,578 27,746 54,324
Other assets 1,869 - 1,869
Held to maturity (IAS 39) / Financial assets at amortised cost (IFRS 9)
Investment securities at amortised cost - 11 11
Available for sale financial instruments (IAS 39) / Financial assets at
FVOCI (IFRS 9)
Investment securities at FVOCI - 9 9
28,447 27,766 56,213
Loan commitments and financial guarantee contracts
Loan commitments - Loans and advances to customers e - 178 178
Financial guarantees - Provisions e - 449 449
- 627 627
Total 28,447 28,393 56,840
The impact of transition to IFRS 9 on reserves and retained earnings is as follows:
The following table reconciles the aggregate opening allowance for impairment under IAS 39-Financial instruments and provisions for
loan commitments and financial guarantee contracts in accordance with IAS 37-Provisions Contingent Liabilities and Contingent
Assets to the ECL allowances under IFRS 9.
69

Fidelity Bank Plc
NOTES TO THE INTERIM FINANCIAL STATEMENTS
2.18. Transition disclosures - continued
a. Classification of debt instrument at amortised cost
b. Designation of equity instruments at FVOCI
c. Reclassification from retired categories with no change in measurement
(i) Those previously classified as available for sale and now classified as measured at FVOCI;
(ii) Those previously classified as held to maturity and now classified as measured at amortised cost; and
(iii) Those previously classified as loans and receivables and now classified as measured at amortised cost.
d. Deferred tax implication of IFRS 9
e. ECL computaion on loan commitment and financial guarantee contracts under IFRS 9
This relates to reclassification of deposit for investment in AGSMEIS from available-for-sale investments to Other assets pending actual
treatment by the regulator.
The following explains how applying the new classification requirements of IFRS 9 led to changes in classification of certain financial
assets held by the Bank as detailed below:
After assessing the Bank's business model for securities within it's available for sale portfolio, which are mostly held to collect the
contractual cash flows and sell, the Bank has identified certain securities which are managed separately and for which the past
practice has been (and the Bank's intention remains) to hold to collect the contractual cash flows. Consequently, the Bank assessed
that the appropriate business model for this group of securities is hold to collect. These securities, which amounted to N7.3 billion and
which were previously classified as available-for-sale, are classified as being measured at amortised cost from the date of initial
application. The remainder of the available for sale portfolio is held to collect contractual cash flows and sell.
The cumulative fair value gains of N79.7 milllion has been reclassified against the carrying value at 1 January 2018.
The Bank has elected to irrevocably designate investments in equity of N5.9 billion in a portfolio of non-trading equity securities at
FVOCI as permitted under IFRS 9. These securities were previously classified as available-for-sale with some measured at cost less
impairment and others carried at fair value. The changes in fair value of such securities will no longer be reclassified to profit or loss
when they are disposed of.
The cumulative fair value gains of N3.9 billlion has been recognised at 1 January 2018 for those previously measured at cost less
impairment.
In addition to the above, the following debt instruments have been reclassified to new categories under IFRS 9, as their previous
categories under IAS 39 were 'retired', with no changes to their measurement basis:
Provision for financial guarantee contracts and other contingent liabilities were previosuly determined in accordance with IAS 37-
Provisions Contingent Liabilities and Contingent Assets. The impairment computation for loan commitments and financial guarantee
contracts is now in accordance with IFRS 9. As at 1 January 2018, the Bank recognise additional impairment of N627million on these
instruments in accordance with IFRS 9.
Deferred tax assets have not been recognised in respect of the impact of IFRS 9 at the date of initial application; as there is no
evidence that there will be sufficient taxable profits available to the Bank in future periods to utilize the asset and the Bank has a
recent history of making tax losses, and there are no other tax planning opportunities or other evidence of recoverability in the near
future. If the Bank were able to recognise all deferred tax assets related to the impact of transition, the Bank’s equity would increase
by N9.1 million.
f. Reclassification of deposit for investment in Agri-business/Small and Medium Enterprise Investment Scheme (AGSMEIS) from AFS
investments to Other assets
70

Fidelity Bank Plc
NOTES TO THE INTERIM FINANCIAL STATEMENTS
2.19. Transition disclosures - continued
Reclassifications to amortised cost N'million
From available-for-sale (IAS 39 classification)
Fair value-closing balance 9236
Fair value loss that would have been recognised during the period if the financial asset had not been reclassified -8
For financial assets and liabilities that have been reclassified to the amortised cost category, the following table shows their fair value
as at 30 June 2018 and the fair value gain or loss that would have been recognised if these financial assets and liabilities had not
been reclassified as part of the transition to IFRS 9:
71

FIDELITY BANK PLC
NOTES TO THE INTERIM FINANCIAL STATEMENTS - continued
3.
3.1 Introduction and overview
Enterprise Risk Management
i)
ii)
iii)
iv)
Risk Management Governance Structure
Financial risk management and fair value measurement and disclosure
IFRS 7 par 31: An entity shall disclose information that enables users of its financial statements to evaluate the nature and extent of risks
arising from financial instruments to which the entity is exposed at the end of the reporting period.
Fidelity Bank runs an Enterprise-wide Risk Management system which is governed by the following key principles:
Comprehensive and well defined policies and procedures designed to identify, assess, measure, monitor and report
significant risk exposures of the entity. These policies are clearly communicated throughout the Bank and are reviewed
annually.
Clearly defined governance structure.
Clear segregation of duties within the Risk Management Division and also between them and the business groups.
Management of all classes of banking risk broadly categorized into credit, market, liquidity, operational risk independently
but in a co-coordinated manner at all relevant levels within the Bank.
Enterprise-wide risk management roles and responsibilities are assigned to stakeholders in the Bank at three levels as follows:
Level 1 - Board/Executive Management oversight is performed by the Board of Directors, Board Audit Committee, Board Risk
Committee, Board Credit Committee (BCC), Board Finance & General Purpose Committee and Executive Management Committee
(EXCO).
Level 2 - Senior Management function is performed by the Management Credit Committee (MCC), Criticised Assets Committee (CAC),
Asset and Liability Management Committee (ALCO), Operational Risk & Service Measurements Committee (ORSMC), Management
Performance Reporting Committee (MPR), The Chief Risk Officer (CRO) and Heads of Enterprise Risk Strategy, Loan Processing,
Credit Administration, Remedial Assets Management, Market Risk Management & ALM and IT & Operational Risk Management.
Level 3 - This is performed by all enterprise-wide Business and Support Units. Business and Support Units are required to comply with
all risk policies and procedures and to manage risk exposures that arise from daily operations.
The Bank's Corporate Audit Division assists the Board Risk Committee by providing independent appraisal of the Bank’s risk framework
for internal risk assurance. The Division assesses compliance with established controls and enterprise-wide risk management
methodologies. Significant risk related infractions and recommendations for improvement in processes are escalated to relevant
Management and Board committees.
72
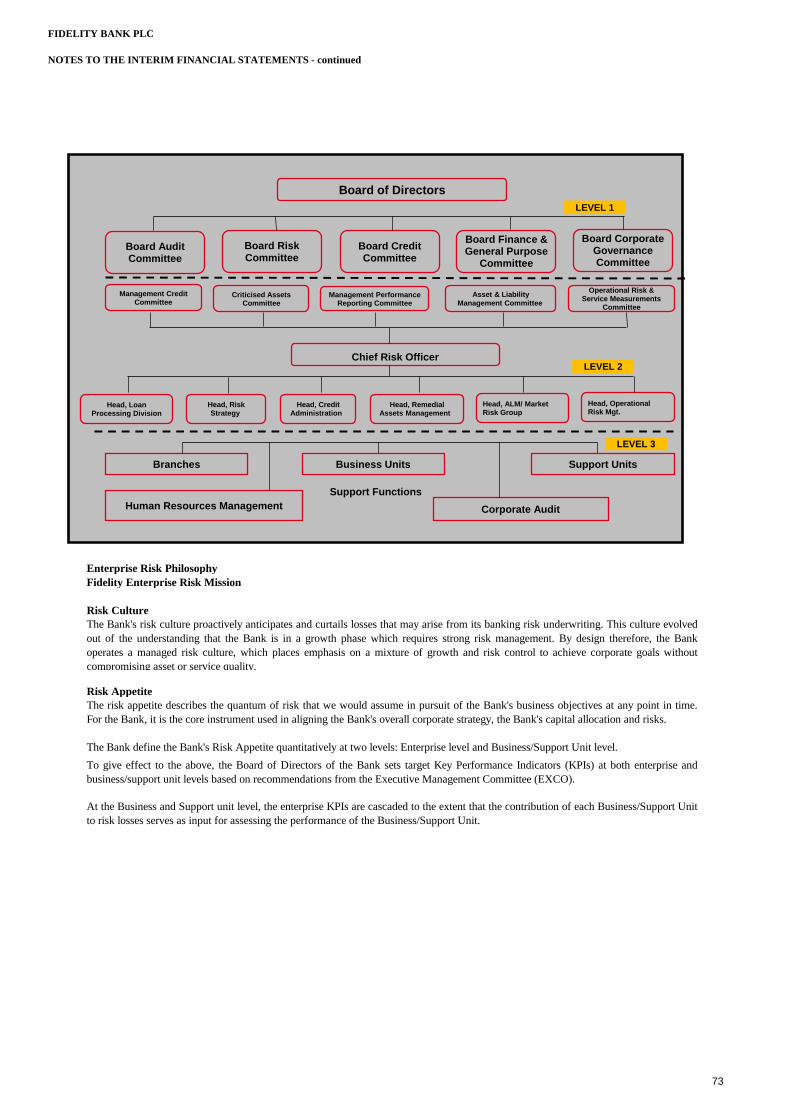
FIDELITY BANK PLC
NOTES TO THE INTERIM FINANCIAL STATEMENTS - continued
The risk appetite describes the quantum of risk that we would assume in pursuit of the Bank's business objectives at any point in time.
For the Bank, it is the core instrument used in aligning the Bank's overall corporate strategy, the Bank's capital allocation and risks.
The Bank define the Bank's Risk Appetite quantitatively at two levels: Enterprise level and Business/Support Unit level.
To give effect to the above, the Board of Directors of the Bank sets target Key Performance Indicators (KPIs) at both enterprise and
business/support unit levels based on recommendations from the Executive Management Committee (EXCO).
At the Business and Support unit level, the enterprise KPIs are cascaded to the extent that the contribution of each Business/Support Unit
to risk losses serves as input for assessing the performance of the Business/Support Unit.
Enterprise Risk Philosophy
Fidelity Enterprise Risk Mission
Risk Culture
The Bank's risk culture proactively anticipates and curtails losses that may arise from its banking risk underwriting. This culture evolved
out of the understanding that the Bank is in a growth phase which requires strong risk management. By design therefore, the Bank
operates a managed risk culture, which places emphasis on a mixture of growth and risk control to achieve corporate goals without
compromising asset or service quality.
Risk Appetite
Management Credit Committee
Board Audit Committee
Board of Directors
Branches
Criticised Assets Committee
Asset & Liability Management Committee
Business Units Support Units
Corporate Audit Human Resources Management
Support Functions
Board Credit Committee
Board Finance & General Purpose
Committee
Management Performance Reporting Committee
Operational Risk & Service Measurements
Committee
Head, Loan Processing Division
Chief Risk Officer
Board Risk Committee
Board Corporate Governance Committee
Head, Risk Strategy
Head, Credit Administration
Head, Remedial Assets Management
Head, ALM/ Market Risk Group
Head, Operational Risk Mgt.
LEVEL 1
LEVEL 2
LEVEL 3
73
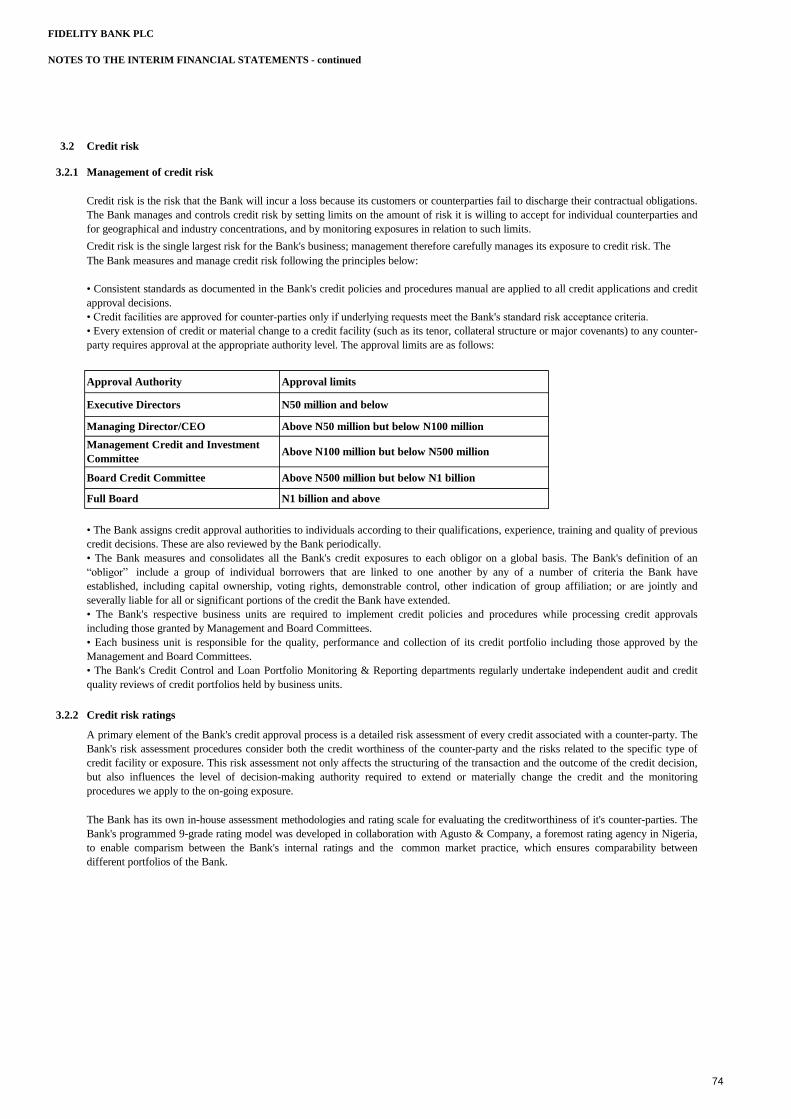
FIDELITY BANK PLC
NOTES TO THE INTERIM FINANCIAL STATEMENTS - continued
3.2 Credit risk
3.2.1 Management of credit risk
3.2.2 Credit risk ratings
A primary element of the Bank's credit approval process is a detailed risk assessment of every credit associated with a counter-party. The
Bank's risk assessment procedures consider both the credit worthiness of the counter-party and the risks related to the specific type of
credit facility or exposure. This risk assessment not only affects the structuring of the transaction and the outcome of the credit decision,
but also influences the level of decision-making authority required to extend or materially change the credit and the monitoring
procedures we apply to the on-going exposure.
The Bank has its own in-house assessment methodologies and rating scale for evaluating the creditworthiness of it's counter-parties. The
Bank's programmed 9-grade rating model was developed in collaboration with Agusto & Company, a foremost rating agency in Nigeria,
to enable comparism between the Bank's internal ratings and the common market practice, which ensures comparability between
different portfolios of the Bank.
Management Credit and Investment
CommitteeAbove N100 million but below N500 million
Board Credit Committee Above N500 million but below N1 billion
Full Board N1 billion and above
Managing Director/CEO Above N50 million but below N100 million
Credit risk is the risk that the Bank will incur a loss because its customers or counterparties fail to discharge their contractual obligations.
The Bank manages and controls credit risk by setting limits on the amount of risk it is willing to accept for individual counterparties and
for geographical and industry concentrations, and by monitoring exposures in relation to such limits.
Credit risk is the single largest risk for the Bank's business; management therefore carefully manages its exposure to credit risk. The
N50 million and below
• The Bank assigns credit approval authorities to individuals according to their qualifications, experience, training and quality of previous
credit decisions. These are also reviewed by the Bank periodically.
• The Bank measures and consolidates all the Bank's credit exposures to each obligor on a global basis. The Bank's definition of an
“obligor” include a group of individual borrowers that are linked to one another by any of a number of criteria the Bank have
established, including capital ownership, voting rights, demonstrable control, other indication of group affiliation; or are jointly and
severally liable for all or significant portions of the credit the Bank have extended.
• The Bank's respective business units are required to implement credit policies and procedures while processing credit approvals
including those granted by Management and Board Committees.
• Each business unit is responsible for the quality, performance and collection of its credit portfolio including those approved by the
Management and Board Committees.
• The Bank's Credit Control and Loan Portfolio Monitoring & Reporting departments regularly undertake independent audit and credit
quality reviews of credit portfolios held by business units.
The Bank measures and manage credit risk following the principles below:
• Consistent standards as documented in the Bank's credit policies and procedures manual are applied to all credit applications and credit
approval decisions.
• Credit facilities are approved for counter-parties only if underlying requests meet the Bank's standard risk acceptance criteria.
• Every extension of credit or material change to a credit facility (such as its tenor, collateral structure or major covenants) to any counter-
party requires approval at the appropriate authority level. The approval limits are as follows:
Approval Authority Approval limits
Executive Directors
74

FIDELITY BANK PLC
NOTES TO THE INTERIM FINANCIAL STATEMENTS - continued
3.2.2
Bank ratingApplicable
score bandAgusto & Co. Limited
AAA 90% - 100% AAA
AA 80% - 89% AA
A 70% - 79% A
BBB 60%- 69% BBB
BB 50% - 59% BB
B 40% - 49% B
CCC 30% - 39% CCC
CC 20% - 29% CC
C 0% - 19% C
Internal
Rating
Categories
Interpretation
Mapping to
External
Rating (S&P)
AAA AAA
AA Very good financial condition and very low likelihood of default AA
A Good financial condition and low likelihood of default A
BBB to BB Satisfactory financial condition and adequate capacity to meet obligations BBB to BB
B to CCC B to D
Credit risk ratings - continued
Imminent Solvency
We generally rate all the Bank's credit exposures individually. The rating scale and its mapping to the Standard and Poors agency rating
scale is as follows:
Impeccable financial condition and overwhelming capacity to meet
obligations in a timely manner
Weak financial condition and capacity to repay is in doubt and may be
contingent upon refinancing
Satisfactory business fundamentals and
adequate capacity to meet obligations
Satisfactory business fundamentals but
ability to repay may be contingent upon
refinancing.
Weak business fundamentals and capacity to
repay is contingent upon refinancing.
Very weak business fundamentals and
capacity to repay is contingent upon
refinancing.
Very weak business fundamentals and
capacity to repay in a timely manner may be
in doubt.
Default
Investment grade
Exceptionally strong business fundamentals
and overwhelming capacity to meet
obligations in a timely manner.
Standard Monitoring
Very good business fundamentals and very
strong capacity to meet obligations
Good business fundamentals and strong
capacity to meet obligations
Description of the grade
75
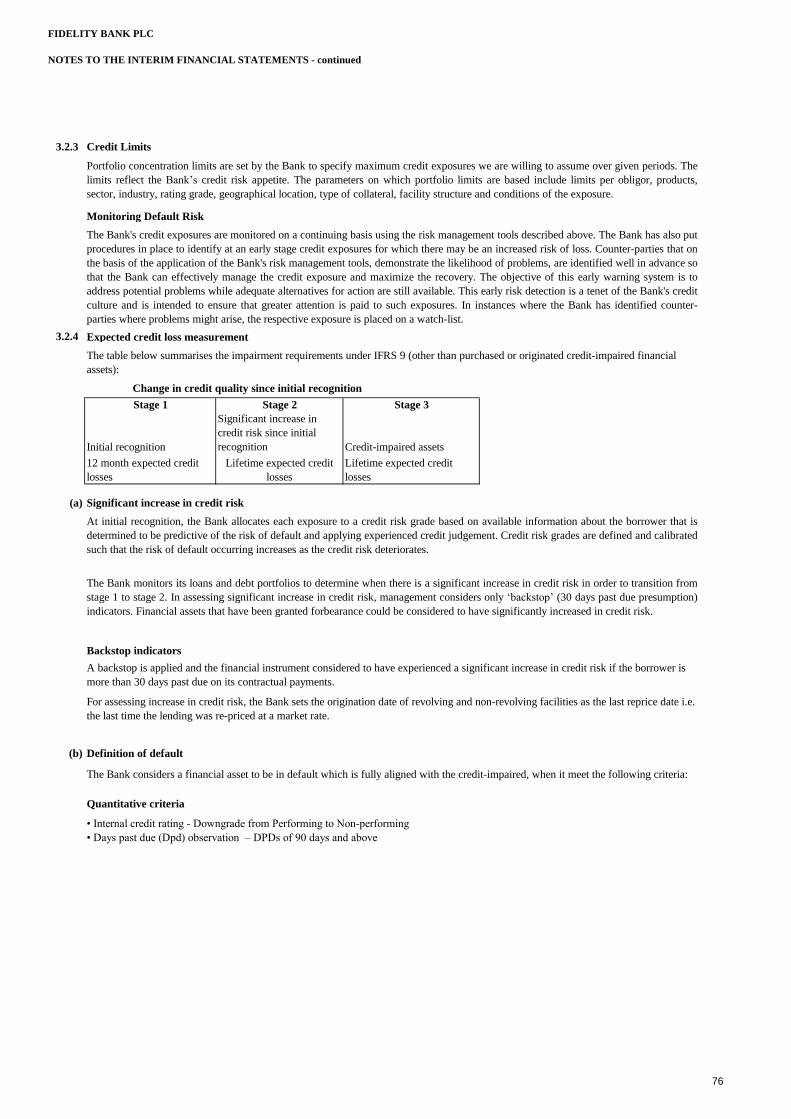
FIDELITY BANK PLC
NOTES TO THE INTERIM FINANCIAL STATEMENTS - continued
3.2.3 Credit Limits
Monitoring Default Risk
3.2.4 Expected credit loss measurement
(a) Significant increase in credit risk
Backstop indicators
(b) Definition of default
Quantitative criteria
For assessing increase in credit risk, the Bank sets the origination date of revolving and non-revolving facilities as the last reprice date i.e.
the last time the lending was re-priced at a market rate.
The Bank considers a financial asset to be in default which is fully aligned with the credit-impaired, when it meet the following criteria:
• Internal credit rating - Downgrade from Performing to Non-performing
• Days past due (Dpd) observation – DPDs of 90 days and above
At initial recognition, the Bank allocates each exposure to a credit risk grade based on available information about the borrower that is
determined to be predictive of the risk of default and applying experienced credit judgement. Credit risk grades are defined and calibrated
such that the risk of default occurring increases as the credit risk deteriorates.
The Bank monitors its loans and debt portfolios to determine when there is a significant increase in credit risk in order to transition from
stage 1 to stage 2. In assessing significant increase in credit risk, management considers only ‘backstop’ (30 days past due presumption)
indicators. Financial assets that have been granted forbearance could be considered to have significantly increased in credit risk.
A backstop is applied and the financial instrument considered to have experienced a significant increase in credit risk if the borrower is
more than 30 days past due on its contractual payments.
Initial recognition
Significant increase in
credit risk since initial
recognition Credit-impaired assets
12 month expected credit
losses
Lifetime expected credit
losses
Lifetime expected credit
losses
The table below summarises the impairment requirements under IFRS 9 (other than purchased or originated credit-impaired financial
assets):
Change in credit quality since initial recognition
Stage 1 Stage 2 Stage 3
Portfolio concentration limits are set by the Bank to specify maximum credit exposures we are willing to assume over given periods. The
limits reflect the Bank’s credit risk appetite. The parameters on which portfolio limits are based include limits per obligor, products,
sector, industry, rating grade, geographical location, type of collateral, facility structure and conditions of the exposure.
The Bank's credit exposures are monitored on a continuing basis using the risk management tools described above. The Bank has also put
procedures in place to identify at an early stage credit exposures for which there may be an increased risk of loss. Counter-parties that on
the basis of the application of the Bank's risk management tools, demonstrate the likelihood of problems, are identified well in advance so
that the Bank can effectively manage the credit exposure and maximize the recovery. The objective of this early warning system is to
address potential problems while adequate alternatives for action are still available. This early risk detection is a tenet of the Bank's credit
culture and is intended to ensure that greater attention is paid to such exposures. In instances where the Bank has identified counter-
parties where problems might arise, the respective exposure is placed on a watch-list.
76

FIDELITY BANK PLC
NOTES TO THE INTERIM FINANCIAL STATEMENTS - continued
(c)
(d) Grouping financial instruments for collective assessment
The ECL is determined by projecting the PD, LGD and EAD for each future month and for each individual exposure or collective
segment. These three components are multiplied together and adjusted for the likelihood of survival (i.e. the exposure has not prepaid or
defaulted in an earlier month). This effectively calculates an ECL for each future month, which is then discounted back to the reporting
date and summed. The discount rate used in the ECL calculation is the original effective interest rate or an approximation thereof.
For expected credit loss provisions modelled on a collective basis, a grouping of exposures is performed on the basis of shared risk
characteristics, such that risk exposures within a group are homogeneous.
In performing this grouping, there must be sufficient information for the group to be statistically credible. Where sufficient information is
not available internally, the Bank has considered benchmarking internal/external supplementary data to use for modelling purposes. The
characteristics used to determine groupings include instrument type, credit risk ratings and industry.
The aggregation of financial instruments may change over time as new information becomes available.
The assumptions underlying the ECL calculation – such as how the maturity profile of the PDs and how collateral values change etc. –
are monitored and reviewed on a regular basis.
There have been no significant changes in estimation techniques or significant assumptions made during the reporting period.
Measuring ECL – Explanation of inputs, assumptions and estimation techniques
The Expected Credit Loss (ECL) is measured on either a 12-month (12M) or lifetime basis depending on whether a significant increase
in credit risk has occurred since initial recognition or whether an asset is considered to be credit-impaired. Expected credit losses are the
discounted product of the Probability of Default (PD), Exposure at Default (EAD), and Loss Given Default (LGD), defined as follows:
• The PD represents the likelihood of a borrower defaulting on its financial obligation (as per “Definition of default and credit-
impaired” above), either over the next 12 months (12M PD), or over the remaining lifetime (Lifetime PD) of the obligation.
• EAD is based on the amounts the Bank expects to be owed at the time of default, over the next 12 months (12M EAD) or over the
remaining lifetime (Lifetime EAD). For a revolving commitment, the Bank includes the current drawn balance plus any further amount
that is expected to be drawn up to the current contractual limit by the time of default, should it occur.
• Loss Given Default (LGD) represents the Bank’s expectation of the extent of loss on a defaulted exposure. LGD varies by type of
counterparty, type and seniority of claim and availability of collateral or other credit support. LGD is expressed as a percentage loss per
unit of exposure at the time of default (EAD). LGD is calculated on a 12-month or lifetime basis, where 12-month LGD is the percentage
of loss expected to be made if the default occurs in the next 12 months and Lifetime LGD is the percentage of loss expected to be made if
the default occurs over the remaining expected lifetime of the loan.
The Lifetime PD is derived by using historical data to develop specific lifetime PD models for all asset classes. The long term span of
historical data is then used to directly model the PD across the life of a exposure. For debt instruments that are not internally rated , the
Bank obtains the issuer ratings of such instruments and matches them to its internal rating framework to determine the equivalent rating.
The lifetime PD curves developed for that rating band will then be used.
The 12-month and lifetime EADs are determined based on the expected payment profile, which varies by product type.
77
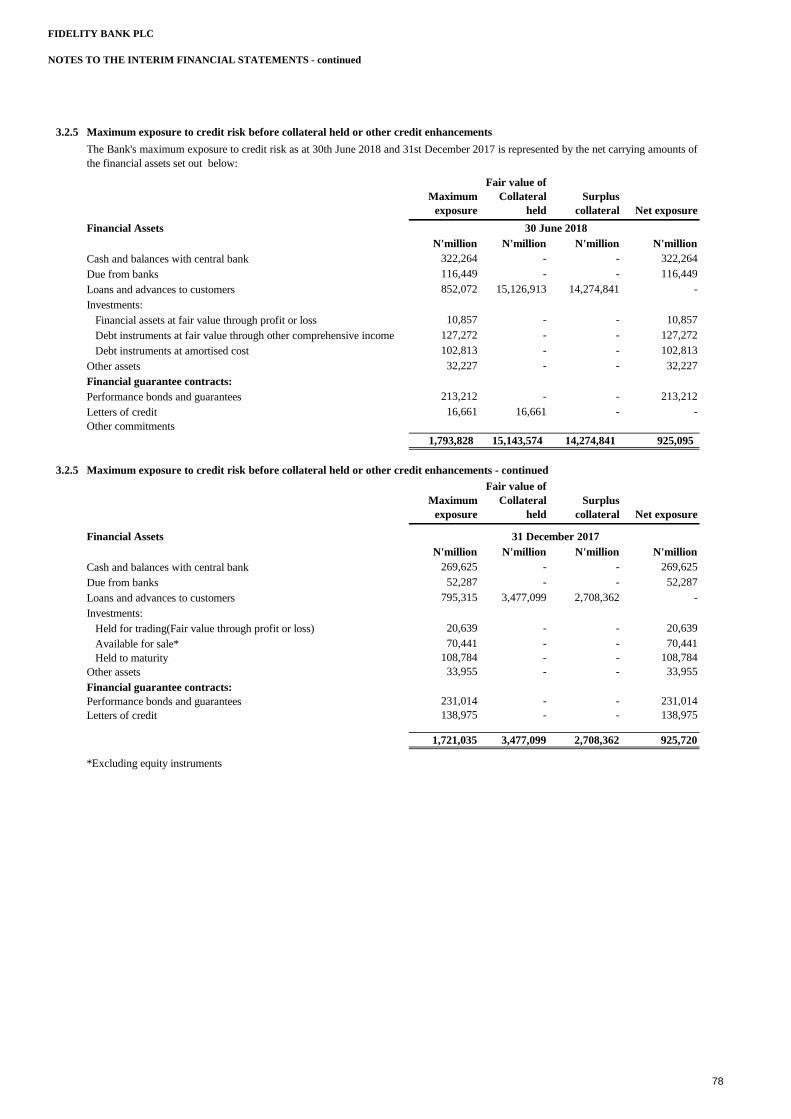
FIDELITY BANK PLC
NOTES TO THE INTERIM FINANCIAL STATEMENTS - continued
3.2.5 Maximum exposure to credit risk before collateral held or other credit enhancements
Maximum
exposure
Fair value of
Collateral
held
Surplus
collateral Net exposure
Financial Assets
N'million N'million N'million N'million
Cash and balances with central bank 322,264 - - 322,264
Due from banks 116,449 - - 116,449
Loans and advances to customers 852,072 15,126,913 14,274,841 -
Investments:
Financial assets at fair value through profit or loss 10,857 - - 10,857
Debt instruments at fair value through other comprehensive income 127,272 - - 127,272
Debt instruments at amortised cost 102,813 - - 102,813
Other assets 32,227 - - 32,227
Financial guarantee contracts:
Performance bonds and guarantees 213,212 - - 213,212
Letters of credit 16,661 16,661 - -
Other commitments
1,793,828 15,143,574 14,274,841 925,095
3.2.5 Maximum exposure to credit risk before collateral held or other credit enhancements - continued
Maximum
exposure
Fair value of
Collateral
held
Surplus
collateral Net exposure
Financial Assets
N'million N'million N'million N'million
Cash and balances with central bank 269,625 - - 269,625
Due from banks 52,287 - - 52,287
Loans and advances to customers 795,315 3,477,099 2,708,362 -
Investments:
Held for trading(Fair value through profit or loss) 20,639 - - 20,639
Available for sale* 70,441 - - 70,441
Held to maturity 108,784 - - 108,784
Other assets 33,955 - - 33,955
Financial guarantee contracts:
Performance bonds and guarantees 231,014 - - 231,014
Letters of credit 138,975 - - 138,975
1,721,035 3,477,099 2,708,362 925,720
*Excluding equity instruments
The Bank's maximum exposure to credit risk as at 30th June 2018 and 31st December 2017 is represented by the net carrying amounts of
the financial assets set out below:
30 June 2018
31 December 2017
78

FIDELITY BANK PLC
NOTES TO THE INTERIM FINANCIAL STATEMENTS - continued
3.2.6 Credit concentrations
30 June 2018
Financial assets with credit risk:
Cash and
balance
with
Central
bank
Due from
banks
Loans and
advances to
customers
Investment
securities Other assets
N'million N'million N'million N'million N'million
Carrying amount 297,370 116,449 852,072 240,942 32,227
Concentration by sector
Agriculture - - 9,704 - -
Oil and gas - - 198,294 - -
Consumer credit - - 39,261 - -
Manufacturing - - 96,935 - -
Mining and Quarrying - - 1,327 - -
Mortgage - - - - -
Real estate - - 26,528 - -
Construction - - 29,081 - -
Finance and insurance 116,449 3,825 3,561 -
Government - - 116,290 237,381 -
Power - - 107,672 - -
Other public utilities - - 6,362 - -
Transportation - - 86,272 - -
Communication - - 40,614 - -
Education - - 3,420 - -
Other 297,370 - 86,487 - 32,227
Total gross amount 297,370 116,449 852,072 240,942 32,227
Concentration by location N'million N'million N'million N'million N'million
Abroad - 116,449 - - -
Nigeria:
North East - - 11,493 - -
North Central 297,370 - 60,981 - -
North West - - 20,298 - -
South East - - 37,978 - -
South South - - 77,608 - -
South West - - 643,714 240,942 32,227
Total gross amount 297,370 116,449 852,072 240,942 32,227
The Bank monitors concentrations of credit risk by sector and by geographical location. An analysis of concentrations of credit risk at
30 June 2018, is set out below:
79
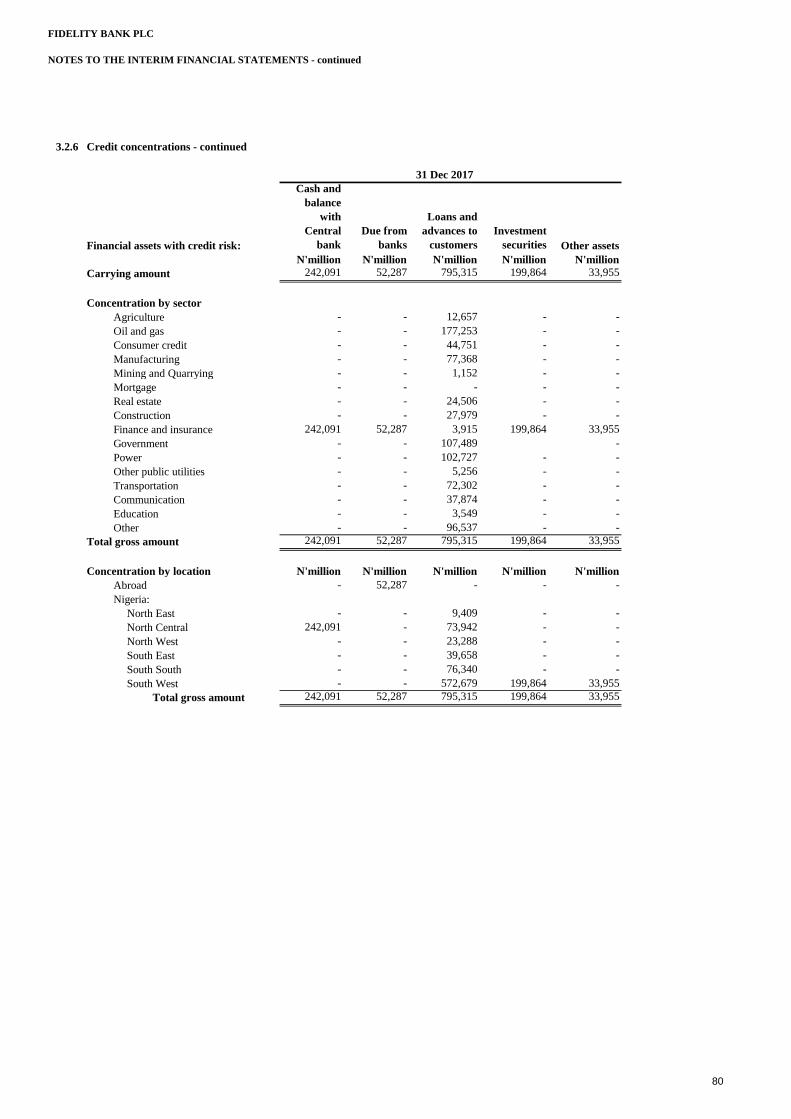
FIDELITY BANK PLC
NOTES TO THE INTERIM FINANCIAL STATEMENTS - continued
3.2.6 Credit concentrations - continued
31 Dec 2017
Financial assets with credit risk:
Cash and
balance
with
Central
bank
Due from
banks
Loans and
advances to
customers
Investment
securities Other assets
N'million N'million N'million N'million N'million
Carrying amount 242,091 52,287 795,315 199,864 33,955
Concentration by sector
Agriculture - - 12,657 - -
Oil and gas - - 177,253 - -
Consumer credit - - 44,751 - -
Manufacturing - - 77,368 - -
Mining and Quarrying - - 1,152 - -
Mortgage - - - - -
Real estate - - 24,506 - -
Construction - - 27,979 - -
Finance and insurance 242,091 52,287 3,915 199,864 33,955
Government - - 107,489 -
Power - - 102,727 - -
Other public utilities - - 5,256 - -
Transportation - - 72,302 - -
Communication - - 37,874 - -
Education - - 3,549 - -
Other - - 96,537 - -
Total gross amount 242,091 52,287 795,315 199,864 33,955
Concentration by location N'million N'million N'million N'million N'million
Abroad - 52,287 - - -
Nigeria:
North East - - 9,409 - -
North Central 242,091 - 73,942 - -
North West - - 23,288 - -
South East - - 39,658 - -
South South - - 76,340 - -
South West - - 572,679 199,864 33,955
Total gross amount 242,091 52,287 795,315 199,864 33,955
80

FIDELITY BANK PLC
NOTES TO THE INTERIM FINANCIAL STATEMENTS - continued
3.2.7 Credit quality
A Maximum exposure to credit risk – Financial instruments subject to impairment
Code
Portfolio 1 Agriculture, Energy, Manufacturing, Construction & Real Estate
Portfolio 2
Portfolio 3
Portfolio 4
Portfolio 5
Portfolio 6
a) Agriculture, Energy, Manufacturing, Construction & Real Estate Portfolio
2017
Stage 1 Stage 2 Stage 3 Total Total
12-month
ECL Lifetime ECL Lifetime ECL
N'million N'million N'million N'million N'million
Credit grade
- - - - -
303,055 101,863 3,117 408,035 418,182
Default - 149 26,658 26,807 16,518
Gross carrying amount 303,055 102,012 29,775 434,842 434,700
(3,713) (8,096) (15,786) (27,595) (10,260)
299,342 93,916 13,989 407,247 424,441
b) Government, Public Sector & NBFIs portfolio
2017
Stage 1 Stage 2 Stage 3 Total Total
12-month
ECL Lifetime ECL Lifetime ECL
N'million N'million N'million N'million N'million
Credit grade
- - - - -
90,777 17,842 2 108,620 102,369
Default - - 38 38 49
Gross carrying amount 90,777 17,842 40 108,658 102,418
(42) (29) (26) (97) (365)
90,735 17,812 14 108,561 102,053
Standard monitoring
Loss allowance
Carrying amount
Loss allowance
Carrying amount
2018
Investment grade
2018
Investment grade
Standard monitoring
The credit risk model is applied as per homogeneous group of risk assets which can be a portfolio or a rating model (e. g. Master Rating).
The bank set up 6 portfolios three of which are a mix of Corporate and Commercial Accounts segregated on the basis of related
economic sectors. The other three portfolios are made up of retails accounts segregated on the basis of similarity of risk characteristics.
Details of the portfolios are shown below:
Description
Government, Public Sector & NBFIs
Transport, Communication, Commerce & General
Automobile, Equipment & Mortgage Loans
Medium and Small Scale Enterprises
Personal & Employee Loans
The following table contains an analysis of the credit risk exposure of financial instruments for which an ECL allowance is recognised.
The gross carrying amount of financial assets below also represents the Bank’s maximum exposure to credit risk on these assets.
81
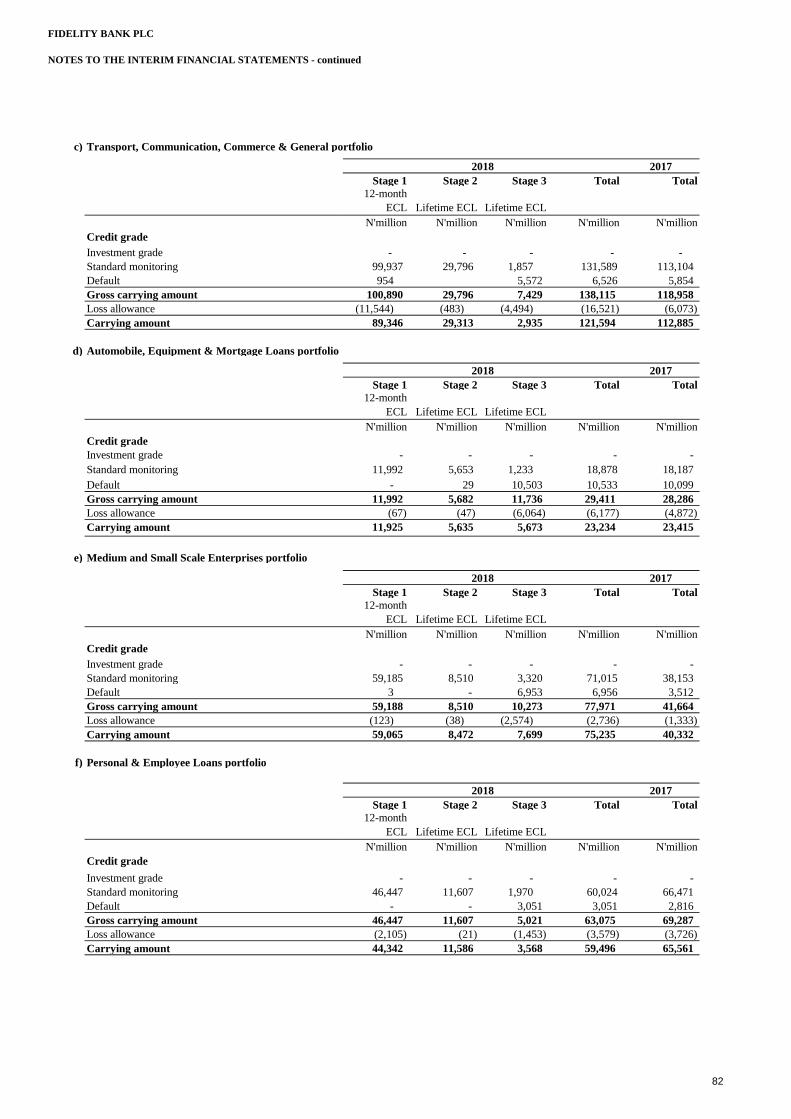
FIDELITY BANK PLC
NOTES TO THE INTERIM FINANCIAL STATEMENTS - continued
c) Transport, Communication, Commerce & General portfolio
2017
Stage 1 Stage 2 Stage 3 Total Total
12-month
ECL Lifetime ECL Lifetime ECL
N'million N'million N'million N'million N'million
Credit grade
- - - - -
99,937 29,796 1,857 131,589 113,104
Default 954 5,572 6,526 5,854
Gross carrying amount 100,890 29,796 7,429 138,115 118,958
(11,544) (483) (4,494) (16,521) (6,073)
89,346 29,313 2,935 121,594 112,885
d) Automobile, Equipment & Mortgage Loans portfolio
2017
Stage 1 Stage 2 Stage 3 Total Total
12-month
ECL Lifetime ECL Lifetime ECL
N'million N'million N'million N'million N'million
- - - - -
11,992 5,653 1,233 18,878 18,187
Default - 29 10,503 10,533 10,099
Gross carrying amount 11,992 5,682 11,736 29,411 28,286
(67) (47) (6,064) (6,177) (4,872)
11,925 5,635 5,673 23,234 23,415
e) Medium and Small Scale Enterprises portfolio
2017
Stage 1 Stage 2 Stage 3 Total Total
12-month
ECL Lifetime ECL Lifetime ECL
N'million N'million N'million N'million N'million
Credit grade
- - - - -
59,185 8,510 3,320 71,015 38,153
Default 3 - 6,953 6,956 3,512
Gross carrying amount 59,188 8,510 10,273 77,971 41,664
(123) (38) (2,574) (2,736) (1,333)
59,065 8,472 7,699 75,235 40,332
f) Personal & Employee Loans portfolio
2017
Stage 1 Stage 2 Stage 3 Total Total
12-month
ECL Lifetime ECL Lifetime ECL
N'million N'million N'million N'million N'million
Credit grade
- - - - -
46,447 11,607 1,970 60,024 66,471
Default - - 3,051 3,051 2,816
Gross carrying amount 46,447 11,607 5,021 63,075 69,287
(2,105) (21) (1,453) (3,579) (3,726)
44,342 11,586 3,568 59,496 65,561 Carrying amount
Carrying amount
2018
Investment grade
Standard monitoring
Loss allowance
Carrying amount
2018
Investment grade
Standard monitoring
Loss allowance
2018
Credit grade
Investment grade
Standard monitoring
Loss allowance
Investment grade
Standard monitoring
Loss allowance
Carrying amount
2018
82
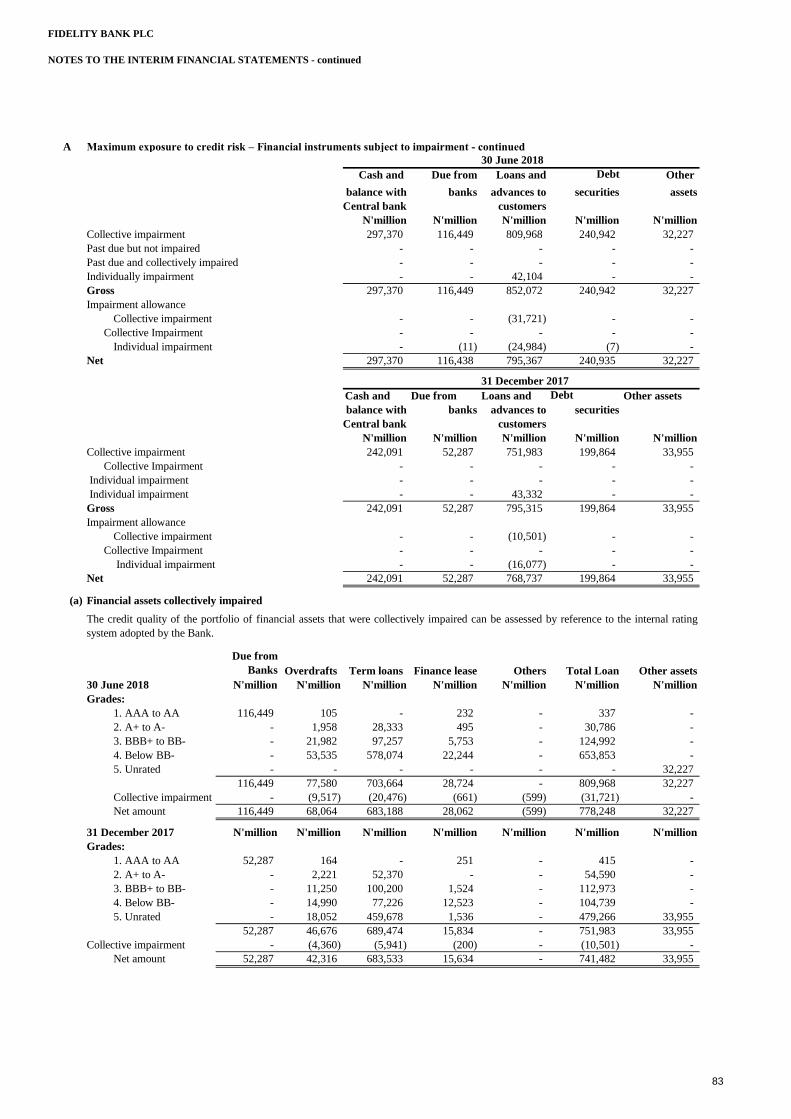
FIDELITY BANK PLC
NOTES TO THE INTERIM FINANCIAL STATEMENTS - continued
A Maximum exposure to credit risk – Financial instruments subject to impairment - continued
30 June 2018
Cash and Due from Loans and Debt Other
balance with banks advances to securities assets
Central bank customers
N'million N'million N'million N'million N'million
Collective impairment 297,370 116,449 809,968 240,942 32,227
Past due but not impaired - - - - -
Past due and collectively impaired - - - - -
Individually impairment - - 42,104 - -
Gross 297,370 116,449 852,072 240,942 32,227
Impairment allowance
Collective impairment - - (31,721) - -
Collective Impairment - - - - -
Individual impairment - (11) (24,984) (7) -
Net 297,370 116,438 795,367 240,935 32,227
31 December 2017
Cash and Due from Loans and Debt Other assets
balance with banks advances to securities
Central bank customers
N'million N'million N'million N'million N'million
Collective impairment 242,091 52,287 751,983 199,864 33,955
Collective Impairment - - - - -
Individual impairment - - - - -
Individual impairment - - 43,332 - -
Gross 242,091 52,287 795,315 199,864 33,955
Impairment allowance
Collective impairment - - (10,501) - -
Collective Impairment - - - - -
Individual impairment - - (16,077) - -
Net 242,091 52,287 768,737 199,864 33,955
(a) Financial assets collectively impaired
Due from
Banks Overdrafts Term loans Finance lease Others Total Loan Other assets
30 June 2018 N'million N'million N'million N'million N'million N'million N'million
Grades:
1. AAA to AA 116,449 105 - 232 - 337 -
2. A+ to A- - 1,958 28,333 495 - 30,786 -
3. BBB+ to BB- - 21,982 97,257 5,753 - 124,992 -
4. Below BB- - 53,535 578,074 22,244 - 653,853 -
5. Unrated - - - - - - 32,227
116,449 77,580 703,664 28,724 - 809,968 32,227
Collective impairment - (9,517) (20,476) (661) (599) (31,721) -
Net amount 116,449 68,064 683,188 28,062 (599) 778,248 32,227
31 December 2017 N'million N'million N'million N'million N'million N'million N'million
Grades:
1. AAA to AA 52,287 164 - 251 - 415 -
2. A+ to A- - 2,221 52,370 - - 54,590 -
3. BBB+ to BB- - 11,250 100,200 1,524 - 112,973 -
4. Below BB- - 14,990 77,226 12,523 - 104,739 -
5. Unrated - 18,052 459,678 1,536 - 479,266 33,955
52,287 46,676 689,474 15,834 - 751,983 33,955
Collective impairment - (4,360) (5,941) (200) - (10,501) -
Net amount 52,287 42,316 683,533 15,634 - 741,482 33,955
The credit quality of the portfolio of financial assets that were collectively impaired can be assessed by reference to the internal rating
system adopted by the Bank.
83
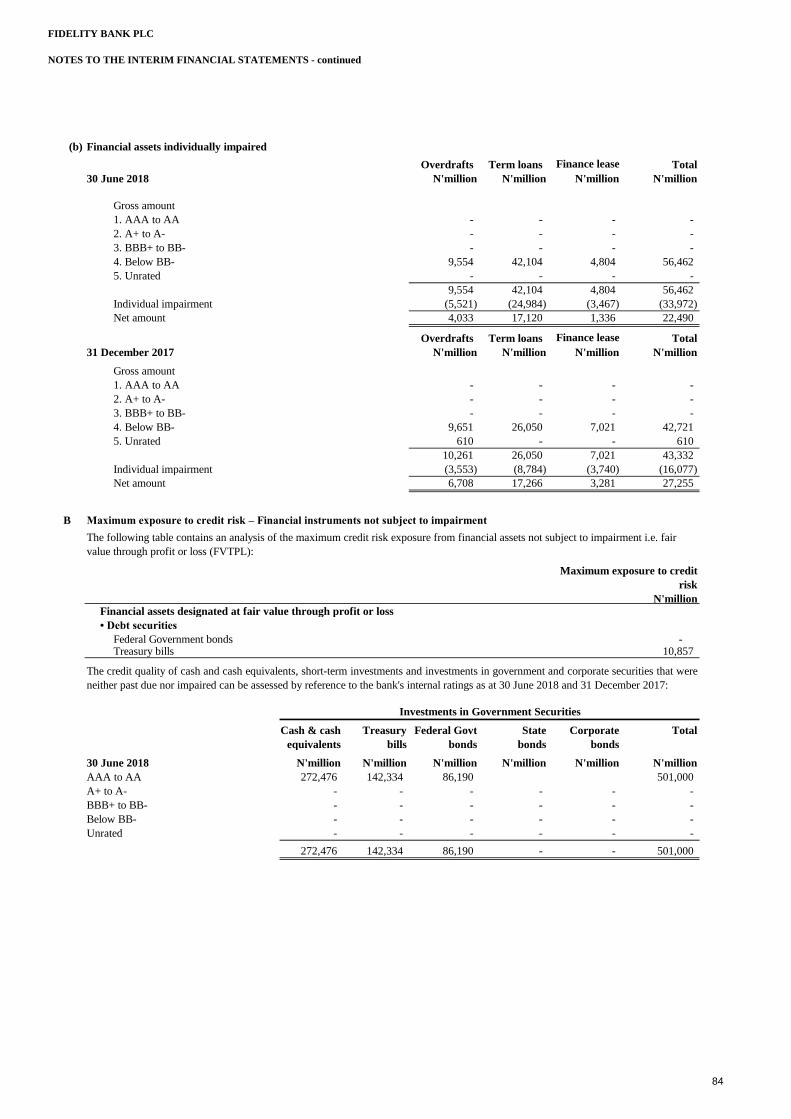
FIDELITY BANK PLC
NOTES TO THE INTERIM FINANCIAL STATEMENTS - continued
(b) Financial assets individually impaired
Overdrafts Term loans Finance lease Total
30 June 2018 N'million N'million N'million N'million
Gross amount
1. AAA to AA - - - -
2. A+ to A- - - - -
3. BBB+ to BB- - - - -
4. Below BB- 9,554 42,104 4,804 56,462
5. Unrated - - - -
9,554 42,104 4,804 56,462
Individual impairment (5,521) (24,984) (3,467) (33,972)
Net amount 4,033 17,120 1,336 22,490
Overdrafts Term loans Finance lease Total
31 December 2017 N'million N'million N'million N'million
Gross amount
1. AAA to AA - - - -
2. A+ to A- - - - -
3. BBB+ to BB- - - - -
4. Below BB- 9,651 26,050 7,021 42,721
5. Unrated 610 - - 610
10,261 26,050 7,021 43,332
Individual impairment (3,553) (8,784) (3,740) (16,077)
Net amount 6,708 17,266 3,281 27,255
B Maximum exposure to credit risk – Financial instruments not subject to impairment
Financial assets designated at fair value through profit or loss
• Debt securities
Federal Government bondsTreasury bills
Cash & cash Treasury Federal Govt State Corporate Total
equivalents bills bonds bonds bonds
30 June 2018 N'million N'million N'million N'million N'million N'million
AAA to AA 272,476 142,334 86,190 501,000
A+ to A- - - - - - -
BBB+ to BB- - - - - - -
Below BB- - - - - - -
Unrated - - - - - -
272,476 142,334 86,190 - - 501,000
Investments in Government Securities
The following table contains an analysis of the maximum credit risk exposure from financial assets not subject to impairment i.e. fair
value through profit or loss (FVTPL):
Maximum exposure to credit
risk
N'million
- 10,857
The credit quality of cash and cash equivalents, short-term investments and investments in government and corporate securities that were
neither past due nor impaired can be assessed by reference to the bank's internal ratings as at 30 June 2018 and 31 December 2017:
84
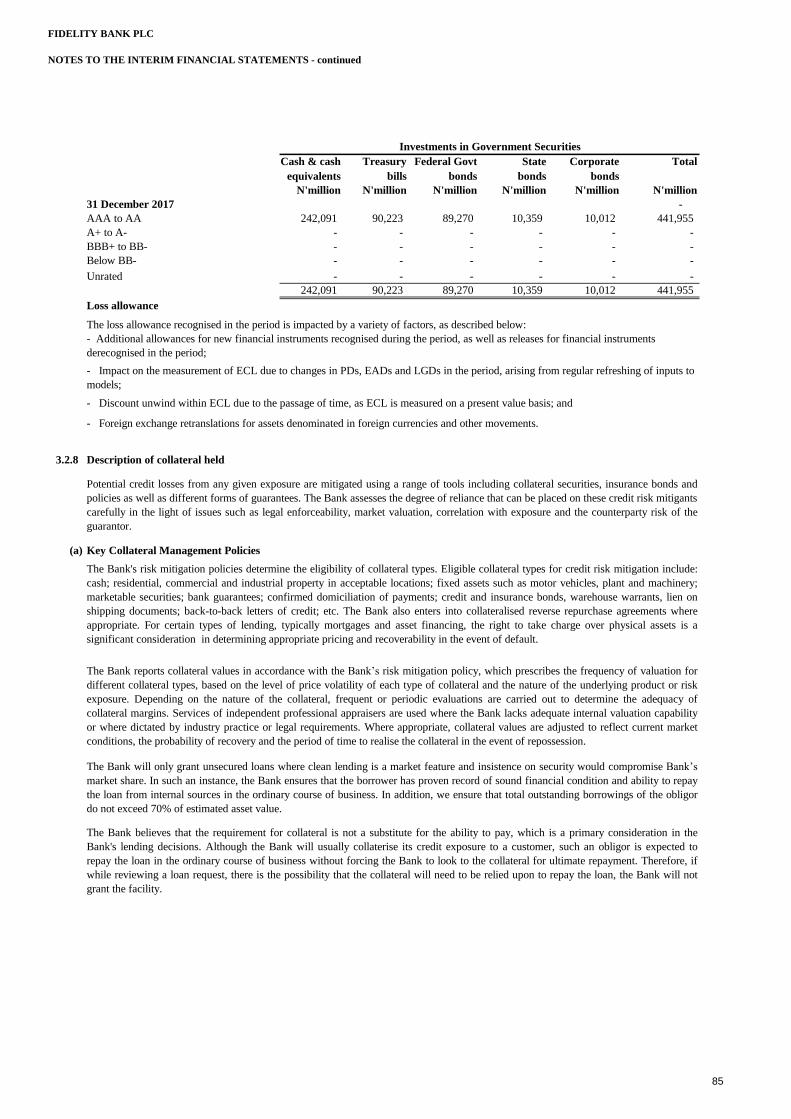
FIDELITY BANK PLC
NOTES TO THE INTERIM FINANCIAL STATEMENTS - continued
Cash & cash Treasury Federal Govt State Corporate Total
equivalents bills bonds bonds bonds
N'million N'million N'million N'million N'million N'million
31 December 2017 -
AAA to AA 242,091 90,223 89,270 10,359 10,012 441,955
A+ to A- - - - - - -
BBB+ to BB- - - - - - -
Below BB- - - - - - -
Unrated - - - - - -
242,091 90,223 89,270 10,359 10,012 441,955
Loss allowance
- Discount unwind within ECL due to the passage of time, as ECL is measured on a present value basis; and
- Foreign exchange retranslations for assets denominated in foreign currencies and other movements.
3.2.8 Description of collateral held
(a) Key Collateral Management Policies
Potential credit losses from any given exposure are mitigated using a range of tools including collateral securities, insurance bonds and
policies as well as different forms of guarantees. The Bank assesses the degree of reliance that can be placed on these credit risk mitigants
carefully in the light of issues such as legal enforceability, market valuation, correlation with exposure and the counterparty risk of the
guarantor.
The Bank's risk mitigation policies determine the eligibility of collateral types. Eligible collateral types for credit risk mitigation include:
cash; residential, commercial and industrial property in acceptable locations; fixed assets such as motor vehicles, plant and machinery;
marketable securities; bank guarantees; confirmed domiciliation of payments; credit and insurance bonds, warehouse warrants, lien on
shipping documents; back-to-back letters of credit; etc. The Bank also enters into collateralised reverse repurchase agreements where
appropriate. For certain types of lending, typically mortgages and asset financing, the right to take charge over physical assets is a
significant consideration in determining appropriate pricing and recoverability in the event of default.
The Bank reports collateral values in accordance with the Bank’s risk mitigation policy, which prescribes the frequency of valuation for
different collateral types, based on the level of price volatility of each type of collateral and the nature of the underlying product or risk
exposure. Depending on the nature of the collateral, frequent or periodic evaluations are carried out to determine the adequacy of
collateral margins. Services of independent professional appraisers are used where the Bank lacks adequate internal valuation capability
or where dictated by industry practice or legal requirements. Where appropriate, collateral values are adjusted to reflect current market
conditions, the probability of recovery and the period of time to realise the collateral in the event of repossession.
The Bank will only grant unsecured loans where clean lending is a market feature and insistence on security would compromise Bank’s
market share. In such an instance, the Bank ensures that the borrower has proven record of sound financial condition and ability to repay
the loan from internal sources in the ordinary course of business. In addition, we ensure that total outstanding borrowings of the obligor
do not exceed 70% of estimated asset value.
The Bank believes that the requirement for collateral is not a substitute for the ability to pay, which is a primary consideration in the
Bank's lending decisions. Although the Bank will usually collaterise its credit exposure to a customer, such an obligor is expected to
repay the loan in the ordinary course of business without forcing the Bank to look to the collateral for ultimate repayment. Therefore, if
while reviewing a loan request, there is the possibility that the collateral will need to be relied upon to repay the loan, the Bank will not
grant the facility.
The loss allowance recognised in the period is impacted by a variety of factors, as described below:
- Additional allowances for new financial instruments recognised during the period, as well as releases for financial instruments
derecognised in the period;
- Impact on the measurement of ECL due to changes in PDs, EADs and LGDs in the period, arising from regular refreshing of inputs to
models;
Investments in Government Securities
85
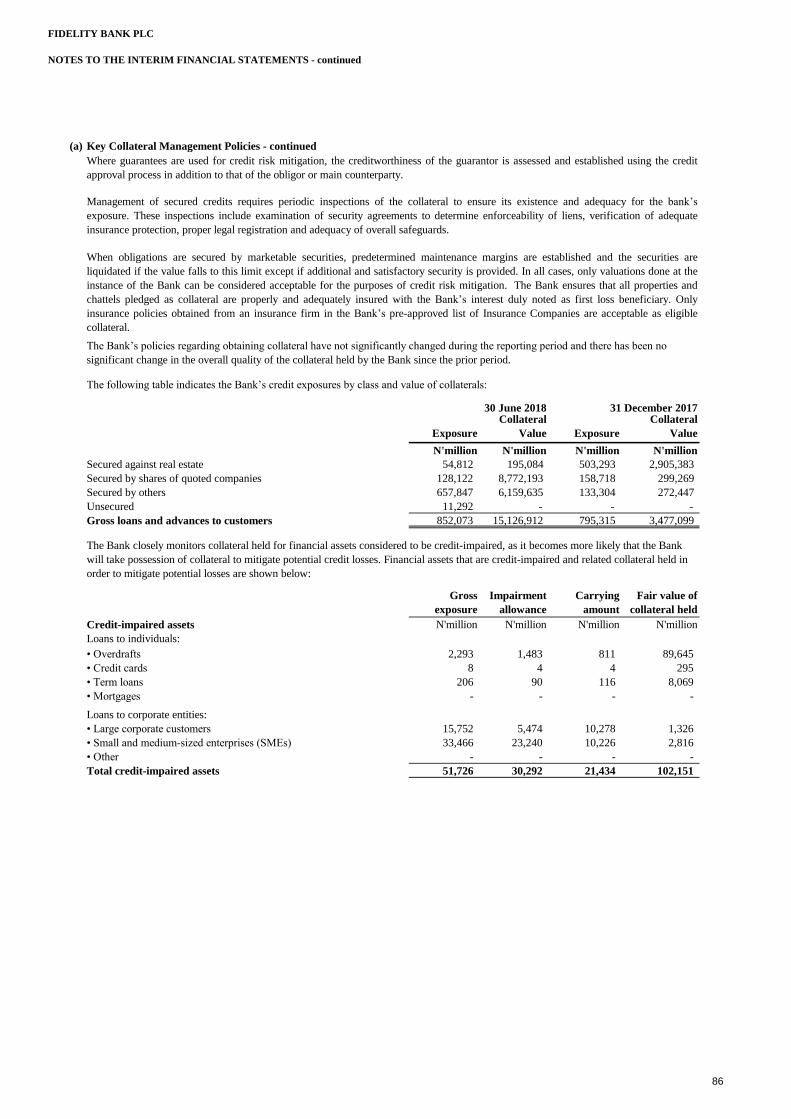
FIDELITY BANK PLC
NOTES TO THE INTERIM FINANCIAL STATEMENTS - continued
(a) Key Collateral Management Policies - continued
The following table indicates the Bank’s credit exposures by class and value of collaterals:
Exposure
Collateral
Value Exposure
Collateral
Value
N'million N'million N'million N'million
Secured against real estate 54,812 195,084 503,293 2,905,383
Secured by shares of quoted companies 128,122 8,772,193 158,718 299,269
Secured by others 657,847 6,159,635 133,304 272,447
Unsecured 11,292 - - -
Gross loans and advances to customers 852,073 15,126,912 795,315 3,477,099
Gross
exposure
Impairment
allowance
Carrying
amount
Fair value of
collateral held
Credit-impaired assets N'million N'million N'million N'million
2,293 1,483 811 89,645
8 4 4 295
206 90 116 8,069
- - - -
- Loans to corporate entities:
• Large corporate customers 15,752 5,474 10,278 1,326
• Small and medium-sized enterprises (SMEs) 33,466 23,240 10,226 2,816
• Other - - - -
Total credit-impaired assets 51,726 30,292 21,434 102,151
The Bank closely monitors collateral held for financial assets considered to be credit-impaired, as it becomes more likely that the Bank
will take possession of collateral to mitigate potential credit losses. Financial assets that are credit-impaired and related collateral held in
order to mitigate potential losses are shown below:
Loans to individuals:
• Overdrafts
• Credit cards
• Term loans
• Mortgages
Where guarantees are used for credit risk mitigation, the creditworthiness of the guarantor is assessed and established using the credit
approval process in addition to that of the obligor or main counterparty.
Management of secured credits requires periodic inspections of the collateral to ensure its existence and adequacy for the bank’s
exposure. These inspections include examination of security agreements to determine enforceability of liens, verification of adequate
insurance protection, proper legal registration and adequacy of overall safeguards.
When obligations are secured by marketable securities, predetermined maintenance margins are established and the securities are
liquidated if the value falls to this limit except if additional and satisfactory security is provided. In all cases, only valuations done at the
instance of the Bank can be considered acceptable for the purposes of credit risk mitigation. The Bank ensures that all properties and
chattels pledged as collateral are properly and adequately insured with the Bank’s interest duly noted as first loss beneficiary. Only
insurance policies obtained from an insurance firm in the Bank’s pre-approved list of Insurance Companies are acceptable as eligible
collateral.
The Bank’s policies regarding obtaining collateral have not significantly changed during the reporting period and there has been no
significant change in the overall quality of the collateral held by the Bank since the prior period.
30 June 2018 31 December 2017
86
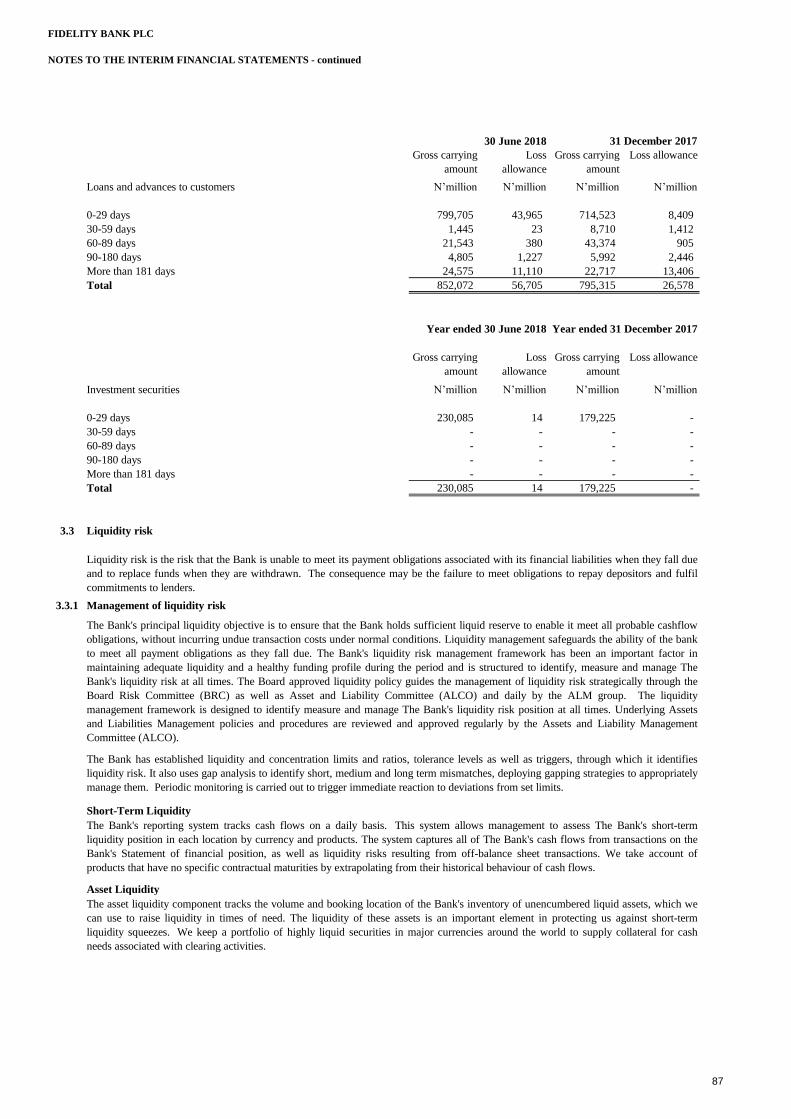
FIDELITY BANK PLC
NOTES TO THE INTERIM FINANCIAL STATEMENTS - continued
Gross carrying
amount
Loss
allowance
Gross carrying
amount
Loss allowance
Loans and advances to customers N’million N’million N’million N’million
0-29 days 799,705 43,965 714,523 8,409
30-59 days 1,445 23 8,710 1,412
60-89 days 21,543 380 43,374 905
90-180 days 4,805 1,227 5,992 2,446
More than 181 days 24,575 11,110 22,717 13,406
Total 852,072 56,705 795,315 26,578
Gross carrying
amount
Loss
allowance
Gross carrying
amount
Loss allowance
Investment securities N’million N’million N’million N’million
0-29 days 230,085 14 179,225 -
30-59 days - - - -
60-89 days - - - -
90-180 days - - - -
More than 181 days - - - -
Total 230,085 14 179,225 -
3.3 Liquidity risk
3.3.1 Management of liquidity risk
Short-Term Liquidity
Asset Liquidity
Liquidity risk is the risk that the Bank is unable to meet its payment obligations associated with its financial liabilities when they fall due
and to replace funds when they are withdrawn. The consequence may be the failure to meet obligations to repay depositors and fulfil
commitments to lenders.
The Bank's principal liquidity objective is to ensure that the Bank holds sufficient liquid reserve to enable it meet all probable cashflow
obligations, without incurring undue transaction costs under normal conditions. Liquidity management safeguards the ability of the bank
to meet all payment obligations as they fall due. The Bank's liquidity risk management framework has been an important factor in
maintaining adequate liquidity and a healthy funding profile during the period and is structured to identify, measure and manage The
Bank's liquidity risk at all times. The Board approved liquidity policy guides the management of liquidity risk strategically through the
Board Risk Committee (BRC) as well as Asset and Liability Committee (ALCO) and daily by the ALM group. The liquidity
management framework is designed to identify measure and manage The Bank's liquidity risk position at all times. Underlying Assets
and Liabilities Management policies and procedures are reviewed and approved regularly by the Assets and Liability Management
Committee (ALCO).
The Bank has established liquidity and concentration limits and ratios, tolerance levels as well as triggers, through which it identifies
liquidity risk. It also uses gap analysis to identify short, medium and long term mismatches, deploying gapping strategies to appropriately
manage them. Periodic monitoring is carried out to trigger immediate reaction to deviations from set limits.
The Bank's reporting system tracks cash flows on a daily basis. This system allows management to assess The Bank's short-term
liquidity position in each location by currency and products. The system captures all of The Bank's cash flows from transactions on the
Bank's Statement of financial position, as well as liquidity risks resulting from off-balance sheet transactions. We take account of
products that have no specific contractual maturities by extrapolating from their historical behaviour of cash flows.
The asset liquidity component tracks the volume and booking location of the Bank's inventory of unencumbered liquid assets, which we
can use to raise liquidity in times of need. The liquidity of these assets is an important element in protecting us against short-term
liquidity squeezes. We keep a portfolio of highly liquid securities in major currencies around the world to supply collateral for cash
needs associated with clearing activities.
30 June 2018 31 December 2017
Year ended 30 June 2018 Year ended 31 December 2017
87
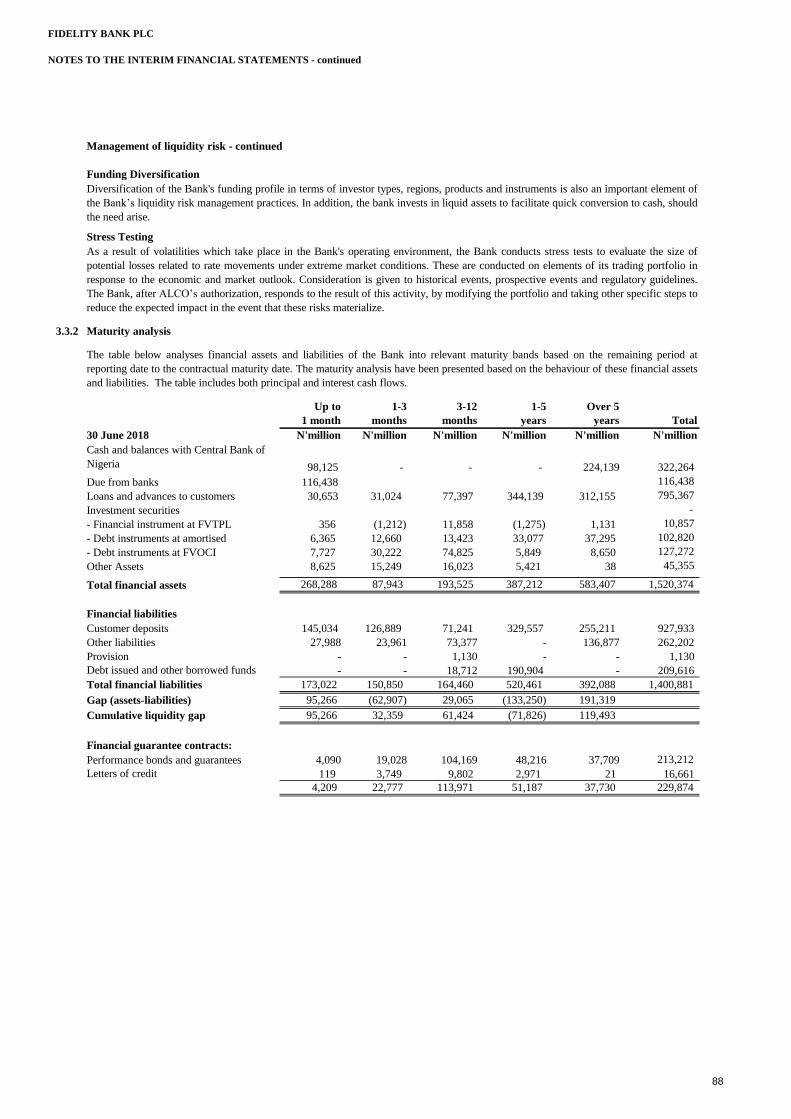
FIDELITY BANK PLC
NOTES TO THE INTERIM FINANCIAL STATEMENTS - continued
Management of liquidity risk - continued
Funding Diversification
Stress Testing
3.3.2 Maturity analysis
Up to 1-3 3-12 1-5 Over 5
1 month months months years years Total
30 June 2018 N'million N'million N'million N'million N'million N'million
98,125 - - - 224,139 322,264
Due from banks 116,438 116,438
Loans and advances to customers 30,653 31,024 77,397 344,139 312,155 795,367
Investment securities -
- Financial instrument at FVTPL 356 (1,212) 11,858 (1,275) 1,131 10,857
- Debt instruments at amortised 6,365 12,660 13,423 33,077 37,295 102,820
- Debt instruments at FVOCI 7,727 30,222 74,825 5,849 8,650 127,272
Other Assets 8,625 15,249 16,023 5,421 38 45,355 -
Total financial assets 268,288 87,943 193,525 387,212 583,407 1,520,374
Financial liabilities
Customer deposits 145,034 126,889 71,241 329,557 255,211 927,933
Other liabilities 27,988 23,961 73,377 - 136,877 262,202
Provision - - 1,130 - - 1,130
- - 18,712 190,904 - 209,616
Total financial liabilities 173,022 150,850 164,460 520,461 392,088 1,400,881
95,266 (62,907) 29,065 (133,250) 191,319
Cumulative liquidity gap 95,266 32,359 61,424 (71,826) 119,493
Financial guarantee contracts:
Performance bonds and guarantees 4,090 19,028 104,169 48,216 37,709 213,212
Letters of credit 119 3,749 9,802 2,971 21 16,661
4,209 22,777 113,971 51,187 37,730 229,874
As a result of volatilities which take place in the Bank's operating environment, the Bank conducts stress tests to evaluate the size of
potential losses related to rate movements under extreme market conditions. These are conducted on elements of its trading portfolio in
response to the economic and market outlook. Consideration is given to historical events, prospective events and regulatory guidelines.
The Bank, after ALCO’s authorization, responds to the result of this activity, by modifying the portfolio and taking other specific steps to
reduce the expected impact in the event that these risks materialize.
The table below analyses financial assets and liabilities of the Bank into relevant maturity bands based on the remaining period at
reporting date to the contractual maturity date. The maturity analysis have been presented based on the behaviour of these financial assets
and liabilities. The table includes both principal and interest cash flows.
Cash and balances with Central Bank of
Nigeria
Debt issued and other borrowed funds
Gap (assets-liabilities)
Diversification of the Bank's funding profile in terms of investor types, regions, products and instruments is also an important element of
the Bank’s liquidity risk management practices. In addition, the bank invests in liquid assets to facilitate quick conversion to cash, should
the need arise.
88
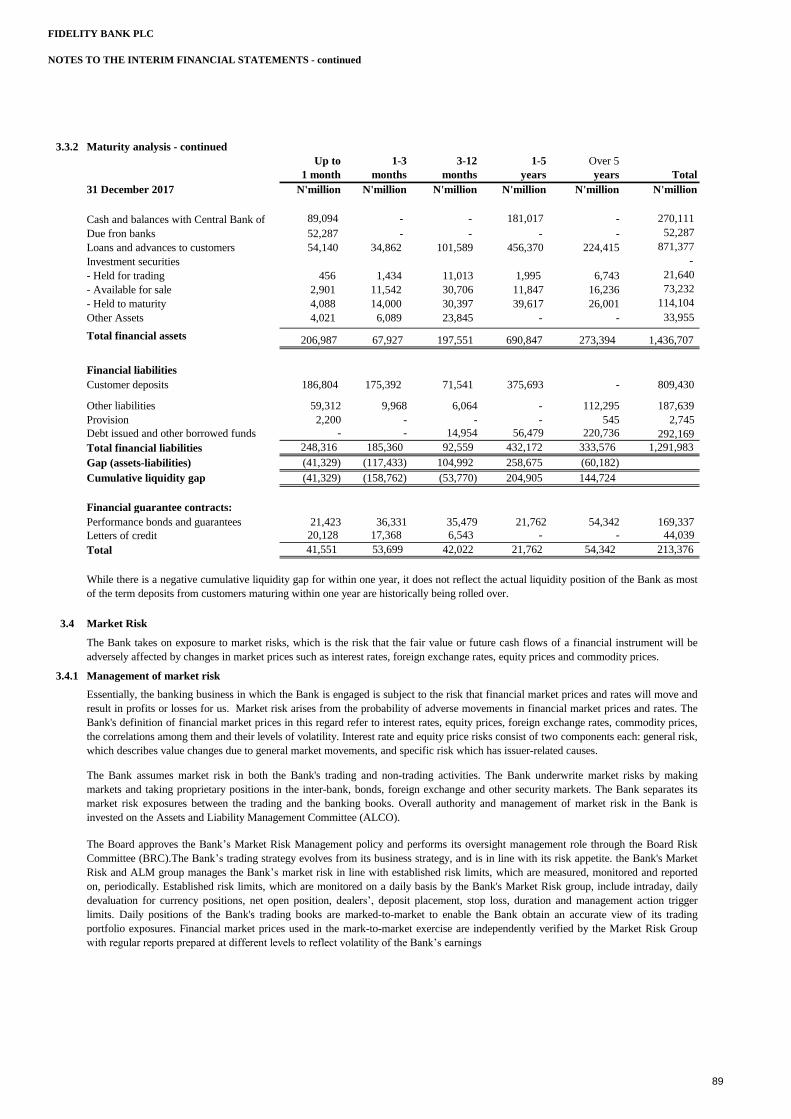
FIDELITY BANK PLC
NOTES TO THE INTERIM FINANCIAL STATEMENTS - continued
3.3.2 Maturity analysis - continued
Up to 1-3 3-12 1-5 Over 5
1 month months months years years Total
31 December 2017 N'million N'million N'million N'million N'million N'million
89,094 - - 181,017 - 270,111
Due fron banks 52,287 - - - - 52,287
Loans and advances to customers 54,140 34,862 101,589 456,370 224,415 871,377
Investment securities -
- Held for trading 456 1,434 11,013 1,995 6,743 21,640
- Available for sale 2,901 11,542 30,706 11,847 16,236 73,232
- Held to maturity 4,088 14,000 30,397 39,617 26,001 114,104
Other Assets 4,021 6,089 23,845 - - 33,955
Total financial assets 206,987 67,927 197,551 690,847 273,394 1,436,707
Financial liabilities
Customer deposits 186,804 175,392 71,541 375,693 - 809,430
Other liabilities 59,312 9,968 6,064 - 112,295 187,639
Provision 2,200 - - - 545 2,745
- - 14,954 56,479 220,736 292,169
Total financial liabilities 248,316 185,360 92,559 432,172 333,576 1,291,983
(41,329) (117,433) 104,992 258,675 (60,182)
Cumulative liquidity gap (41,329) (158,762) (53,770) 204,905 144,724
Financial guarantee contracts:
Performance bonds and guarantees 21,423 36,331 35,479 21,762 54,342 169,337
Letters of credit 20,128 17,368 6,543 - - 44,039
Total 41,551 53,699 42,022 21,762 54,342 213,376
3.4 Market Risk
3.4.1 Management of market risk
The Bank assumes market risk in both the Bank's trading and non-trading activities. The Bank underwrite market risks by making
markets and taking proprietary positions in the inter-bank, bonds, foreign exchange and other security markets. The Bank separates its
market risk exposures between the trading and the banking books. Overall authority and management of market risk in the Bank is
invested on the Assets and Liability Management Committee (ALCO).
The Board approves the Bank’s Market Risk Management policy and performs its oversight management role through the Board Risk
Committee (BRC).The Bank’s trading strategy evolves from its business strategy, and is in line with its risk appetite. the Bank's Market
Risk and ALM group manages the Bank’s market risk in line with established risk limits, which are measured, monitored and reported
on, periodically. Established risk limits, which are monitored on a daily basis by the Bank's Market Risk group, include intraday, daily
devaluation for currency positions, net open position, dealers’, deposit placement, stop loss, duration and management action trigger
limits. Daily positions of the Bank's trading books are marked-to-market to enable the Bank obtain an accurate view of its trading
portfolio exposures. Financial market prices used in the mark-to-market exercise are independently verified by the Market Risk Group
with regular reports prepared at different levels to reflect volatility of the Bank’s earnings
Cash and balances with Central Bank of
Debt issued and other borrowed funds
Gap (assets-liabilities)
While there is a negative cumulative liquidity gap for within one year, it does not reflect the actual liquidity position of the Bank as most
of the term deposits from customers maturing within one year are historically being rolled over.
The Bank takes on exposure to market risks, which is the risk that the fair value or future cash flows of a financial instrument will be
adversely affected by changes in market prices such as interest rates, foreign exchange rates, equity prices and commodity prices.
Essentially, the banking business in which the Bank is engaged is subject to the risk that financial market prices and rates will move and
result in profits or losses for us. Market risk arises from the probability of adverse movements in financial market prices and rates. The
Bank's definition of financial market prices in this regard refer to interest rates, equity prices, foreign exchange rates, commodity prices,
the correlations among them and their levels of volatility. Interest rate and equity price risks consist of two components each: general risk,
which describes value changes due to general market movements, and specific risk which has issuer-related causes.
89
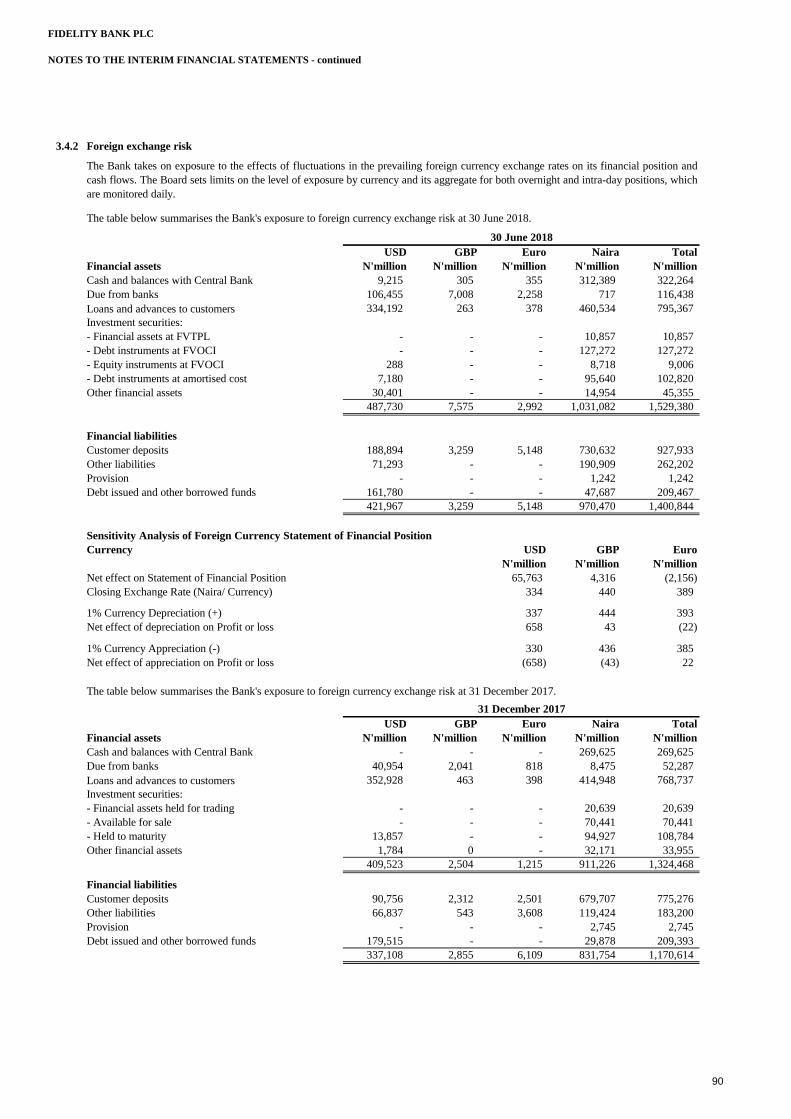
FIDELITY BANK PLC
NOTES TO THE INTERIM FINANCIAL STATEMENTS - continued
3.4.2 Foreign exchange risk
USD GBP Euro Naira Total
Financial assets N'million N'million N'million N'million N'million
9,215 305 355 312,389 322,264
Due from banks 106,455 7,008 2,258 717 116,438
Loans and advances to customers 334,192 263 378 460,534 795,367
- Financial assets at FVTPL - - - 10,857 10,857
- Debt instruments at FVOCI - - - 127,272 127,272
- Equity instruments at FVOCI 288 - - 8,718 9,006
- Debt instruments at amortised cost 7,180 - - 95,640 102,820
Other financial assets 30,401 - - 14,954 45,355
487,730 7,575 2,992 1,031,082 1,529,380
Financial liabilities
188,894 3,259 5,148 730,632 927,933
Other liabilities 71,293 - - 190,909 262,202
Provision - - - 1,242 1,242
Debt issued and other borrowed funds 161,780 - - 47,687 209,467
421,967 3,259 5,148 970,470 1,400,844
Sensitivity Analysis of Foreign Currency Statement of Financial Position
Currency USD GBP Euro
N'million N'million N'million
Net effect on Statement of Financial Position 65,763 4,316 (2,156)
Closing Exchange Rate (Naira/ Currency) 334 440 389
1% Currency Depreciation (+) 337 444 393
658 43 (22)
1% Currency Appreciation (-) 330 436 385
(658) (43) 22
USD GBP Euro Naira Total
Financial assets N'million N'million N'million N'million N'million
- - - 269,625 269,625
Due from banks 40,954 2,041 818 8,475 52,287
Loans and advances to customers 352,928 463 398 414,948 768,737
- Financial assets held for trading - - - 20,639 20,639
- - - 70,441 70,441
- Held to maturity 13,857 - - 94,927 108,784
Other financial assets 1,784 0 - 32,171 33,955
409,523 2,504 1,215 911,226 1,324,468
Financial liabilities
90,756 2,312 2,501 679,707 775,276
Other liabilities 66,837 543 3,608 119,424 183,200
Provision - - - 2,745 2,745
Debt issued and other borrowed funds 179,515 - - 29,878 209,393
337,108 2,855 6,109 831,754 1,170,614
Cash and balances with Central Bank
Investment securities:
- Available for sale
Customer deposits
Investment securities:
Customer deposits
Net effect of depreciation on Profit or loss
Net effect of appreciation on Profit or loss
The table below summarises the Bank's exposure to foreign currency exchange risk at 31 December 2017.
The Bank takes on exposure to the effects of fluctuations in the prevailing foreign currency exchange rates on its financial position and
cash flows. The Board sets limits on the level of exposure by currency and its aggregate for both overnight and intra-day positions, which
are monitored daily.
The table below summarises the Bank's exposure to foreign currency exchange risk at 30 June 2018.
Cash and balances with Central Bank
30 June 2018
31 December 2017
90
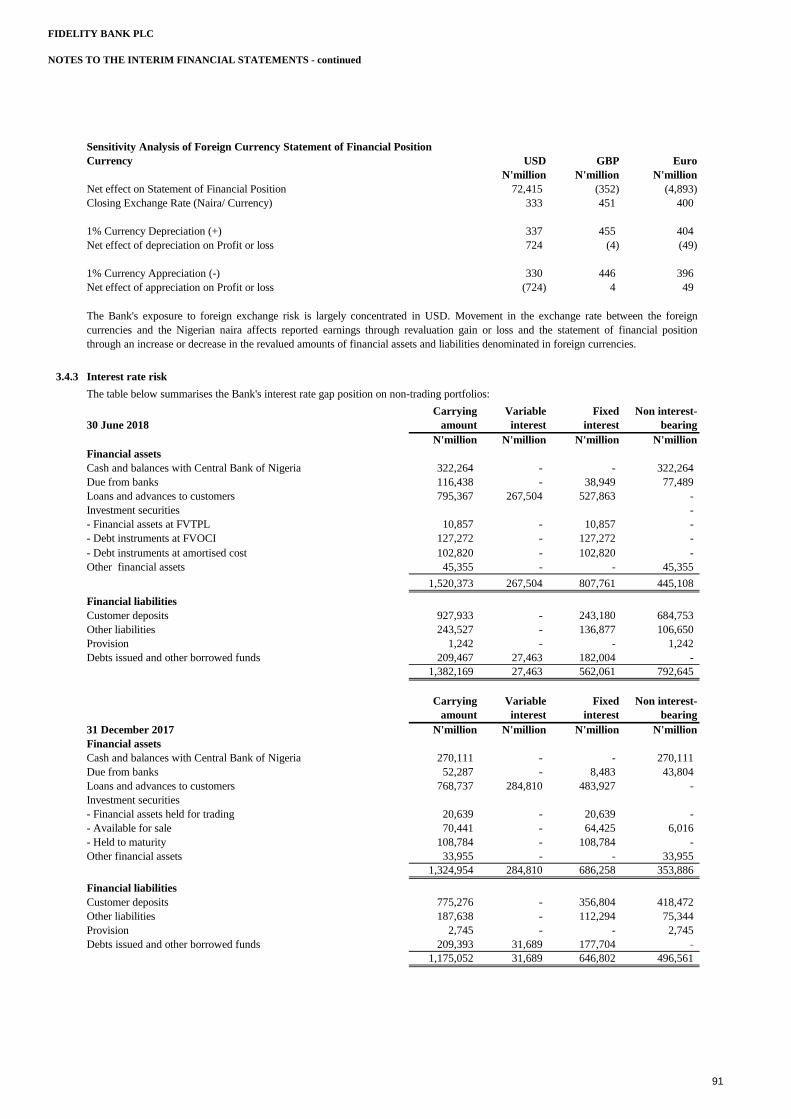
FIDELITY BANK PLC
NOTES TO THE INTERIM FINANCIAL STATEMENTS - continued
Sensitivity Analysis of Foreign Currency Statement of Financial Position
Currency USD GBP Euro
N'million N'million N'million
Net effect on Statement of Financial Position 72,415 (352) (4,893)
Closing Exchange Rate (Naira/ Currency) 333 451 400
1% Currency Depreciation (+) 337 455 404
724 (4) (49)
1% Currency Appreciation (-) 330 446 396
(724) 4 49
3.4.3 Interest rate risk
The table below summarises the Bank's interest rate gap position on non-trading portfolios:
Carrying Variable Fixed Non interest-
30 June 2018 amount interest interest bearing
N'million N'million N'million N'million
Financial assets
Cash and balances with Central Bank of Nigeria 322,264 - - 322,264
Due from banks 116,438 - 38,949 77,489
Loans and advances to customers 795,367 267,504 527,863 -
Investment securities -
- Financial assets at FVTPL 10,857 - 10,857 -
- Debt instruments at FVOCI 127,272 - 127,272 -
- Debt instruments at amortised cost 102,820 - 102,820 -
Other financial assets 45,355 - - 45,355
1,520,373 267,504 807,761 445,108
Financial liabilities
Customer deposits 927,933 - 243,180 684,753
Other liabilities 243,527 - 136,877 106,650
Provision 1,242 - - 1,242
Debts issued and other borrowed funds 209,467 27,463 182,004 -
1,382,169 27,463 562,061 792,645
Carrying Variable Fixed Non interest-
amount interest interest bearing
31 December 2017 N'million N'million N'million N'million
Financial assets
Cash and balances with Central Bank of Nigeria 270,111 - - 270,111
Due from banks 52,287 - 8,483 43,804
Loans and advances to customers 768,737 284,810 483,927 -
Investment securities
- Financial assets held for trading 20,639 - 20,639 -
- Available for sale 70,441 - 64,425 6,016
- Held to maturity 108,784 - 108,784 -
Other financial assets 33,955 - - 33,955
1,324,954 284,810 686,258 353,886
Financial liabilities
Customer deposits 775,276 - 356,804 418,472
Other liabilities 187,638 - 112,294 75,344
Provision 2,745 - - 2,745
Debts issued and other borrowed funds 209,393 31,689 177,704 -
1,175,052 31,689 646,802 496,561
The Bank's exposure to foreign exchange risk is largely concentrated in USD. Movement in the exchange rate between the foreign
currencies and the Nigerian naira affects reported earnings through revaluation gain or loss and the statement of financial position
through an increase or decrease in the revalued amounts of financial assets and liabilities denominated in foreign currencies.
Net effect of depreciation on Profit or loss
Net effect of appreciation on Profit or loss
91
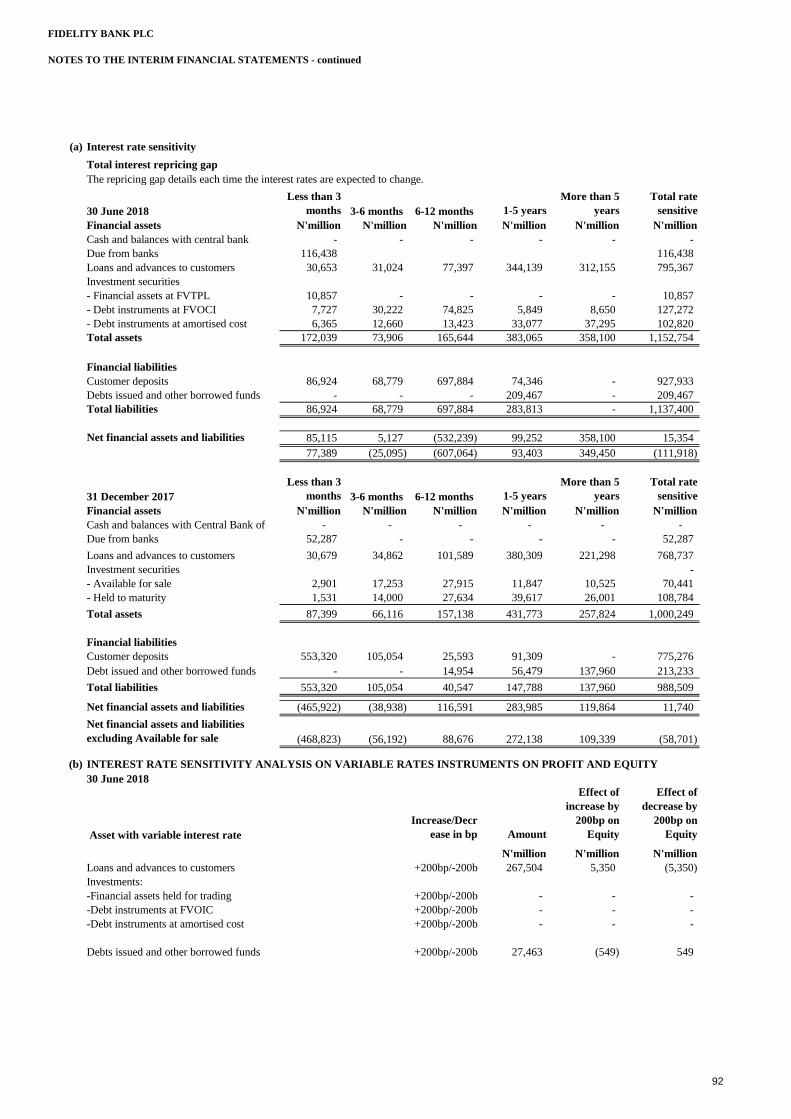
FIDELITY BANK PLC
NOTES TO THE INTERIM FINANCIAL STATEMENTS - continued
(a) Interest rate sensitivity
Total interest repricing gap
30 June 2018
Less than 3
months 3-6 months 6-12 months 1-5 years
More than 5
years
Total rate
sensitive
Financial assets N'million N'million N'million N'million N'million N'million
- - - - - -
Due from banks 116,438 116,438
Loans and advances to customers 30,653 31,024 77,397 344,139 312,155 795,367
Investment securities
- Financial assets at FVTPL 10,857 - - - - 10,857
- Debt instruments at FVOCI 7,727 30,222 74,825 5,849 8,650 127,272
- Debt instruments at amortised cost 6,365 12,660 13,423 33,077 37,295 102,820
Total assets 172,039 73,906 165,644 383,065 358,100 1,152,754
Financial liabilities
Customer deposits 86,924 68,779 697,884 74,346 - 927,933
Debts issued and other borrowed funds - - - 209,467 - 209,467
Total liabilities 86,924 68,779 697,884 283,813 - 1,137,400
85,115 5,127 (532,239) 99,252 358,100 15,354
77,389 (25,095) (607,064) 93,403 349,450 (111,918)
31 December 2017
Less than 3
months 3-6 months 6-12 months 1-5 years
More than 5
years
Total rate
sensitive
Financial assets N'million N'million N'million N'million N'million N'million
- - - - - -
Due from banks 52,287 - - - - 52,287
Loans and advances to customers 30,679 34,862 101,589 380,309 221,298 768,737
Investment securities -
- Available for sale 2,901 17,253 27,915 11,847 10,525 70,441
- Held to maturity 1,531 14,000 27,634 39,617 26,001 108,784
Total assets 87,399 66,116 157,138 431,773 257,824 1,000,249
Financial liabilities
Customer deposits 553,320 105,054 25,593 91,309 - 775,276
Debt issued and other borrowed funds - - 14,954 56,479 137,960 213,233
Total liabilities 553,320 105,054 40,547 147,788 137,960 988,509
(465,922) (38,938) 116,591 283,985 119,864 11,740
(468,823) (56,192) 88,676 272,138 109,339 (58,701)
(b) INTEREST RATE SENSITIVITY ANALYSIS ON VARIABLE RATES INSTRUMENTS ON PROFIT AND EQUITY
30 June 2018
Increase/Decr
ease in bp Amount
Effect of
increase by
200bp on
Equity
Effect of
decrease by
200bp on
Equity
N'million N'million N'million
Loans and advances to customers +200bp/-200bp 267,504 5,350 (5,350)
Investments:
-Financial assets held for trading +200bp/-200bp - - -
-Debt instruments at FVOIC +200bp/-200bp - - -
-Debt instruments at amortised cost +200bp/-200bp - - -
+200bp/-200bp 27,463 (549) 549
Net financial assets and liabilities
Net financial assets and liabilities
excluding Available for sale
Asset with variable interest rate
Debts issued and other borrowed funds
The repricing gap details each time the interest rates are expected to change.
Cash and balances with central bank
Net financial assets and liabilities
Cash and balances with Central Bank of
92
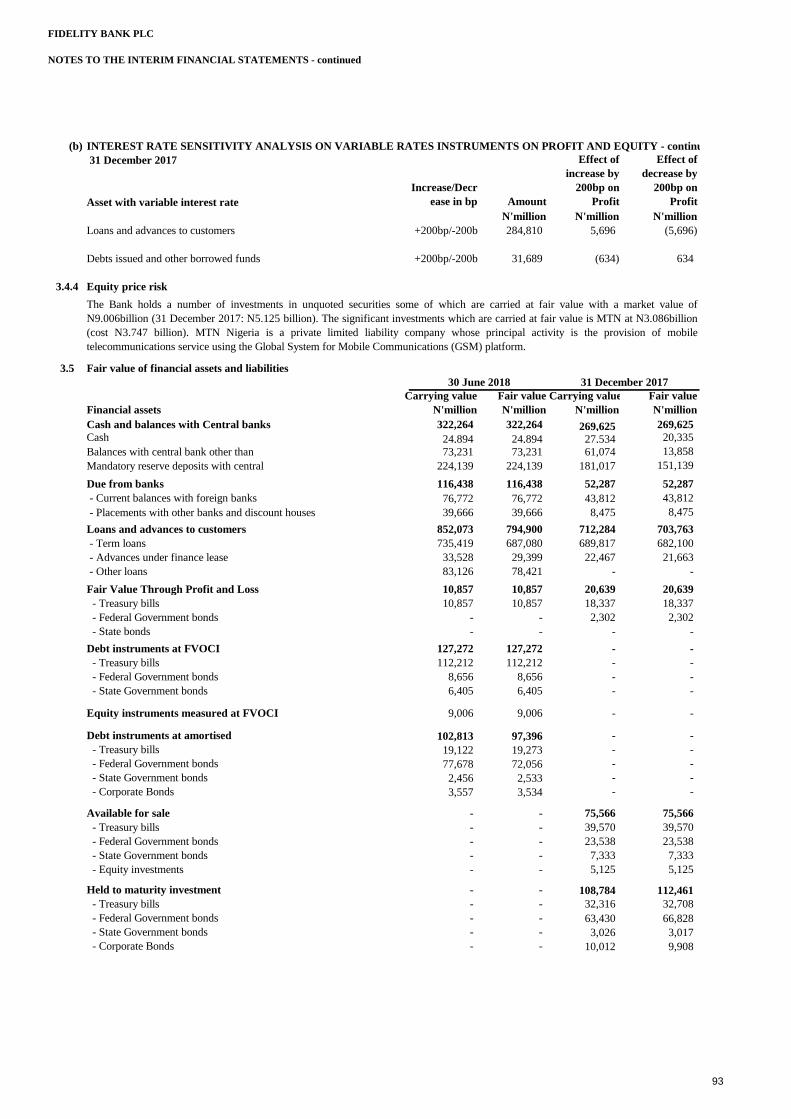
FIDELITY BANK PLC
NOTES TO THE INTERIM FINANCIAL STATEMENTS - continued
(b) INTEREST RATE SENSITIVITY ANALYSIS ON VARIABLE RATES INSTRUMENTS ON PROFIT AND EQUITY - continued
Increase/Decr
ease in bp Amount
Effect of
increase by
200bp on
Profit
Effect of
decrease by
200bp on
Profit
N'million N'million N'million
Loans and advances to customers +200bp/-200bp 284,810 5,696 (5,696)
+200bp/-200bp 31,689 (634) 634
3.4.4 Equity price risk
3.5 Fair value of financial assets and liabilities
Carrying value Fair value Carrying value Fair value
Financial assets N'million N'million N'million N'million
Cash and balances with Central banks 322,264 322,264 269,625 269,625
Cash 24,894 24,894 27,534 20,335
73,231 73,231 61,074 13,858
224,139 224,139 181,017 151,139
Due from banks 116,438 116,438 52,287 52,287
- Current balances with foreign banks 76,772 76,772 43,812 43,812
- Placements with other banks and discount houses 39,666 39,666 8,475 8,475
Loans and advances to customers 852,073 794,900 712,284 703,763
- Term loans 735,419 687,080 689,817 682,100
- Advances under finance lease 33,528 29,399 22,467 21,663
- Other loans 83,126 78,421 - -
Fair Value Through Profit and Loss 10,857 10,857 20,639 20,639
- Treasury bills 10,857 10,857 18,337 18,337
- Federal Government bonds - - 2,302 2,302
- State bonds - - - -
Debt instruments at FVOCI 127,272 127,272 - -
- Treasury bills 112,212 112,212 - -
- Federal Government bonds 8,656 8,656 - -
- State Government bonds 6,405 6,405 - -
Equity instruments measured at FVOCI 9,006 9,006 - -
Debt instruments at amortised 102,813 97,396 - -
- Treasury bills 19,122 19,273 - -
- Federal Government bonds 77,678 72,056 - -
- State Government bonds 2,456 2,533 - -
- Corporate Bonds 3,557 3,534 - -
Available for sale - - 75,566 75,566
- Treasury bills - - 39,570 39,570
- Federal Government bonds - - 23,538 23,538
- State Government bonds - - 7,333 7,333
- Equity investments - - 5,125 5,125
Held to maturity investment - - 108,784 112,461
- Treasury bills - - 32,316 32,708
- Federal Government bonds - - 63,430 66,828
- State Government bonds - - 3,026 3,017
- Corporate Bonds - - 10,012 9,908
The Bank holds a number of investments in unquoted securities some of which are carried at fair value with a market value of
N9.006billion (31 December 2017: N5.125 billion). The significant investments which are carried at fair value is MTN at N3.086billion
(cost N3.747 billion). MTN Nigeria is a private limited liability company whose principal activity is the provision of mobile
telecommunications service using the Global System for Mobile Communications (GSM) platform.
Balances with central bank other than
Mandatory reserve deposits with central
31 December 2017
Asset with variable interest rate
Debts issued and other borrowed funds
31 December 201730 June 2018
93
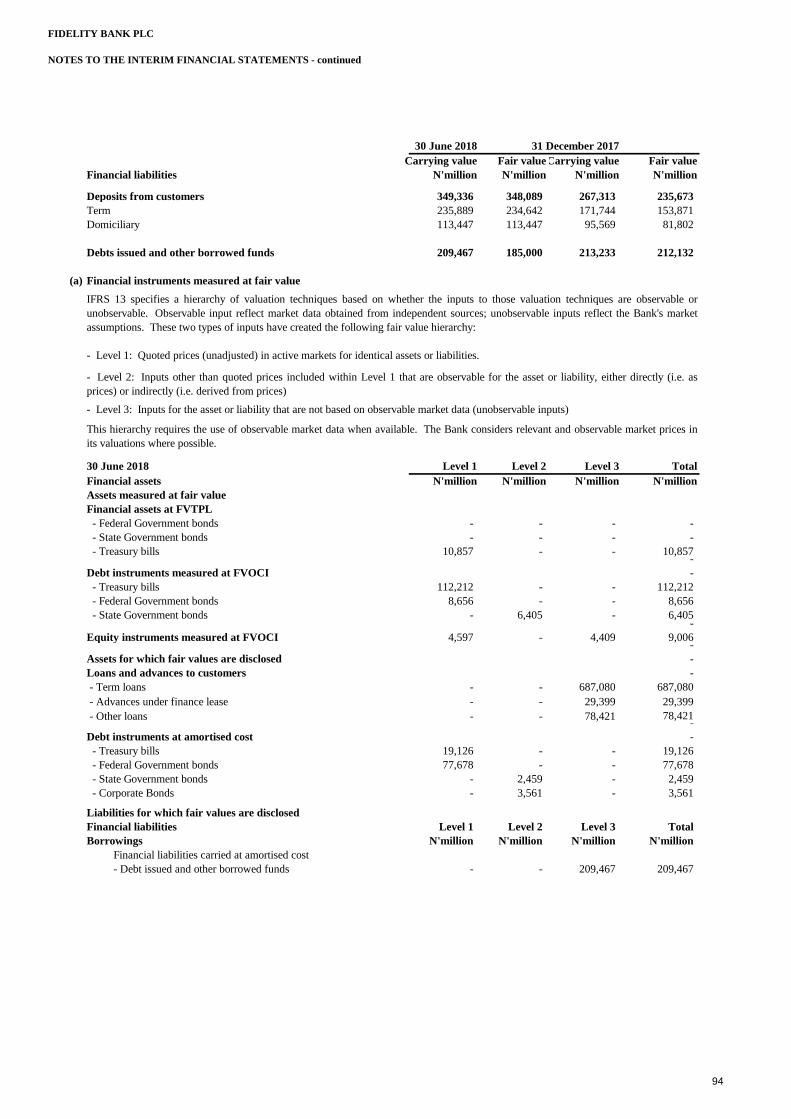
FIDELITY BANK PLC
NOTES TO THE INTERIM FINANCIAL STATEMENTS - continued
30 June 2018 31 December 2017
Carrying value Fair valueCarrying value Fair value
Financial liabilities N'million N'million N'million N'million
Deposits from customers 349,336 348,089 267,313 235,673
Term 235,889 234,642 171,744 153,871
Domiciliary 113,447 113,447 95,569 81,802
Debts issued and other borrowed funds 209,467 185,000 213,233 212,132
(a) Financial instruments measured at fair value
30 June 2018 Level 1 Level 2 Level 3 Total
Financial assets N'million N'million N'million N'million
Assets measured at fair value
Financial assets at FVTPL
- Federal Government bonds - - - -
- State Government bonds - - - -
- Treasury bills 10,857 - - 10,857 -
Debt instruments measured at FVOCI -
- Treasury bills 112,212 - - 112,212
- Federal Government bonds 8,656 - - 8,656
- State Government bonds - 6,405 - 6,405 -
Equity instruments measured at FVOCI 4,597 - 4,409 9,006 -
Assets for which fair values are disclosed -
Loans and advances to customers -
- Term loans - - 687,080 687,080
- Advances under finance lease - - 29,399 29,399
- Other loans - - 78,421 78,421 -
Debt instruments at amortised cost -
- Treasury bills 19,126 - - 19,126
- Federal Government bonds 77,678 - - 77,678
- State Government bonds - 2,459 - 2,459
- Corporate Bonds - 3,561 - 3,561
Liabilities for which fair values are disclosed
Financial liabilities Level 1 Level 2 Level 3 Total
Borrowings N'million N'million N'million N'million
Financial liabilities carried at amortised cost
- Debt issued and other borrowed funds - - 209,467 209,467
- Level 2: Inputs other than quoted prices included within Level 1 that are observable for the asset or liability, either directly (i.e. as
prices) or indirectly (i.e. derived from prices)
- Level 3: Inputs for the asset or liability that are not based on observable market data (unobservable inputs)
This hierarchy requires the use of observable market data when available. The Bank considers relevant and observable market prices in
its valuations where possible.
IFRS 13 specifies a hierarchy of valuation techniques based on whether the inputs to those valuation techniques are observable or
unobservable. Observable input reflect market data obtained from independent sources; unobservable inputs reflect the Bank's market
assumptions. These two types of inputs have created the following fair value hierarchy:
- Level 1: Quoted prices (unadjusted) in active markets for identical assets or liabilities.
94

FIDELITY BANK PLC
NOTES TO THE INTERIM FINANCIAL STATEMENTS - continued
(a) Financial instruments measured at fair value - continued
31 December 2017 Level 1 Level 2 Level 3 Total
Financial assets N'million N'million N'million N'million
Assets measured at fair value
Held for trading
- Treasury bills 10,857 - - 10,857
- Federal Government bonds 2,302 - - 2,302
- State Government bonds - - - -
-
Available for sale -
- Treasury bills 39,570 - - 39,570
- Federal Government bonds 23,538 - - 23,538
- State Government bonds - 7,333 - 7,333
- Equity investments - - 5,125 5,125 -
Assets for which fair values are disclosed - -
Financial assets carried at amortised cost -
Loans and Advances -
- Term loans - - 689,817 689,817
- Advances under finance lease - - 22,467 22,467
-
Held to maturity investment -
- Treasury bills 32,316 - - 32,316
- Federal Government bonds 63,430 - - 63,430
- State Government bonds - - 3,026 3,026
- Corporate bonds - - 10,012 10,012
Level 1 Level 2 Level 3 Total
Financial liabilities N'million N'million N'million N'million
Liabilities for which fair value are disclosed
Borrowings
Financial liabilities carried at amortised cost
- Debt issued and other borrowed funds - 185,000 - 185,000
(b) Reconciliation of Level 3 items
N'million
At 1 January 2018 9,875
Disposal During the Period (1,299)
Total Gains (Losses) 431
At 30 June 2018 9,006
N'million
At 1 January 2017 4,846
Total gains 279
At 31 December 2017 5,125
Unlisted equity
securities
Total gains or losses for the year is included in Net gains/(losses) on Available-for-sale financial assets recognised in other
comprehensive income as at 31 December 2017.
Unlisted equity
securities
Total gains or losses for the period is included in Net gains/(losses) on financial investments at fair value through other comprehensive
income recognised in other comprehensive income as at 30 June 2018.
95

FIDELITY BANK PLC
NOTES TO THE INTERIM FINANCIAL STATEMENTS - continued
Financial Range
assets in (weighted
unquoted average)
equity
shares
- Financial
services
sector
5% - 10%
(7%)
15% - 25%
(20%)
(c) Fair valuation methods and assumptions
(i) Cash and balances with central banks
(ii) Due from other banks
(iii) Treasury bills and bonds
(iv) Equity securities
(v) Loans and advances to customers
Cash and balances with central bank represent cash held with central banks of the various jurisdictions in which the Bank operates. The
fair value of these balances approximates their carrying amounts.
Due from other banks represents balances with local and correspondence banks, inter-bank placements and items in the course of
collection. The fair value of the current account balances, floating placements and overnight deposits approximates their carrying
amounts.
Treasury bills represent short term instruments issued by the Central banks of the jurisdiction where the Bank operates. The fair value of
treasury bills are derived from the quoted yields,while the fair value of bonds are determined with reference to quoted prices in active
markets for identical assets. For certain securities market prices cannot be readily obtained especially for illiquid Federal Government
Bonds, State Government and Corporate Bonds. The positions was marked-to-model at June 30 2018 and 31 December 2017 based on
yields for identical assets. Fair value is determined using discounted cashflow model.
The fair value of quoted equity securities are determined by reference to quoted prices (unadjusted) in active markets for identical
instruments. The fair value of unquoted equity securities are determined based on the level of information available. The investment in
AFC and similar smaller holdings in various unquoted entities is carried at fair value. The investment in MTN Nigeria was valued by
reference to recent market transaction price (unadjusted). The investment in Unified Payment System( formely Valuecard Nigeria) is fair
valued using the P/E multiple.
Loans and advances are carried at amortised cost net of allowance for impairment. The estimated fair value of loans and advances
represents the discounted amount of estimated future cash flows expected to be received. Expected cash flows are discounted at current
market rates to determine fair value.
The fair value of equity security (for investment in quoted company) categorised as Level 1 was determined by applying the closing price
of relevant equity security as at the reporting date. For unquoted equity investments categorised within Level 3, the Discounted Cash
Flow (DCF) valuation method was adopted in determining the fair value reported in the financial statement. The valuation approach
involves discounting the Free Cash Flow available to equity holders after all operating expenses, interest and principal payments, and
necessary investments in working and fixed capital have been made. The FCFE is discounted at the company’s required rate of return to
arrive at the equity value. The equity value is then divided by the number of outstanding shares determine the value per share which is
multiplied by the number of the Bank’s holding in the firm.
DCF Method Growth rate
Required rate of return
technique unobservable input to fair value
inputs
5% increase
(decrease) in the
growth rate would
result in an increase
(decrease) in fair value
by N1.37 billion
(N1.01 million).
5% increase
(decrease) in the
required rate of return would
result in a decrease
(increase) in fair value
by N1.37 million
(N2.03 billion).
Description of significant unobservable inputs to valuation:
The significant unobservable inputs used in the fair value measurement categorised within Level 3 of the fair value hierarchy together
with a quantitative sensitivity analysis as at 30 June 2018 and 31 December 2017 are as shown below:
Valuation Significant Sensitivity of the
96

FIDELITY BANK PLC
NOTES TO THE INTERIM FINANCIAL STATEMENTS - continued
(c) Fair valuation methods and assumptions - continued
(vi) Overdraft
(vii) Other assets
(viii) Deposits from banks and due to customers
(ix) Other liabilities
(x) Debt issued and other borrowed funds
3.6 OPERATIONAL RISK MANAGEMENT
Organizational Set-up
Operational Risk Framework
Loss Data Collection
Risk and Control Self Assessments (RCSA)
Operational Risk Management is an independent risk management function within Fidelity Bank. The Operational Risk & Service
Measurements Committee is the main decision-making committee for all operational risk management matters and approves the Bank's
standards for identification, measurement, assessment, reporting and monitoring of operational risk. Operational Risk Management is
responsible for defining the operational risk framework and related policies while the responsibility for implementing the framework day-
to-day operational risk management lies with the Bank's business and support units. Based on this business partnership model the Bank
ensures close monitoring and high awareness of operational risk.
As is common with all businesses, operational risk is inherent in all operations and activities of the Bank. We therefore carefully manage
operational risk based on a consistent framework that enables us to determine the Bank's operational risk profile in comparison to the
Bank's risk appetite and to define risk mitigating measures and priorities. We apply a number of techniques to efficiently manage
operational risk in the Bank's business, for example: as part of the Bank's strategy for making enterprise risk management the Bank's
discriminating competence, the Bank has redefined business requirements across all networks and branches using the following tools:
The Bank implements an event driven Loss Data Collection (LDC) system designed to facilitate collection of internal loss data triggered
at the occurrence of a loss event anywhere within the divisions of the Bank. The LDC system captures data elements, which discriminate
between boundary events related to credit, market and operational risk. The system facilitates collection of loss data arising from actual
losses, potential losses and near misses. Work-flow capabilities built within the Bank's predefined Event Escalation Matrix enable risk
incidents to be reported to designated Event Identifiers, Event Managers, Event Approvers and Action Owners that manage each risk
incident from point of occurrence to closure.
The Bank implement a quantitative methodology for the Bank's Risk and Control Self Assessments, which supports collection of
quantitative frequency and severity estimates. Facilitated top-down RCSA workshops are used by the bank to identify key risks and
related controls at business unit levels. During these workshops business experts and senior management identify and discuss key risks,
controls and required remedial actions for each respective business unit and the results captured within the operational risk database for
action tracking.
Other assets represent monetary assets which usually has a short recycle period and as such the fair values of these balances approximate
their carrying amount.
The estimated fair value of deposits with no stated maturity, which includes non-interest bearing deposits, is the amount repayable on
demand. The estimated fair values of fixed interest-bearing deposits and borrowings are determined using a discounted cash flow model
based on a current yield curve appropriate for the remaining term to maturity.
Other liabilities represent monetary assets which usually has a short recycle period and as such the fair values of these balances
approximate their carrying amount.
The fair of the Bank's Eurobond issued is derived from quoted market prices in active markets. The fair values of the Bank’s interest-
bearing borrowings and loans are determined by using the DCF method using discount rate that reflects the issuer’s borrowing rate as at
the end of the reporting period. The fair value is determined by using discounted cashflow method.
Operational risk is the potential for loss arising from inadequate or failed internal processes, people and systems or from external events.
This definition includes legal and regulatory risk, but excludes strategic and reputational risk.
The scope of operational risk management in the Bank covers risk exposures that may lead to unavailability of service, information
deficiency, financial loss, increased costs, loss of professional reputation, failure to keep or increase market share, risks which result in
the imposition of sanctions on the Bank by regulators or legal proceedings against the Bank by third parties.
The management assessed that the fair value of Overdrafts approximate their carrying amounts largely due to the short-term maturities of
these instruments.
97

FIDELITY BANK PLC
NOTES TO THE INTERIM FINANCIAL STATEMENTS - continued
3.6 OPERATIONAL RISK MANAGEMENT - contnued
Key Risk Indicators (KRIs)
Business Continuity Management (BCM)
4.
1
2
3
The Regulatory Risk Reserve created pursuant to Section 12.4 (a) of the Prudential Guidelines which was effective on 1
July 2010 is excluded from regulatory capital for the purposes of capital adequacy assessment;
Collective impairment on loans and receivables and other financial assets no longer forms part of Tier 2 capital; and
Other Comprehensive Income (OCI) Reserves is recognized as part of Tier 2 capital subject to the limits on the
Calculation of Regulatory Capital.
The CBN requires each bank to: (a) hold the minimum level of the regulatory capital of N25 billion and (b) maintain a ratio of total
regulatory capital to the risk-weighted asset at or above the minimum of 15% for an internatiional licensed Bank.
In 2016, the Central Bank of Nigeria issued circular BSD/DIR/CIR/GEN/LAB/06/03 to all Bank's and discount houses on the
implementation of Basel II/III issued 10 December 2013 and guidance notes to the regulatory capital measurement and management for
the Nigerian Banking System for the implementation of Basel II/III in Nigeria. The capital adequacy ratio for the period ended 30 June
2018 and the comparative period 31 December 2017 is in line with the new circular. The computations are consistent with the
requirements of Pillar I of Basel II ACord (Interenal Convergence of capital measurement and Capital Standards. Although the guidelines
comply with the requirement of the Basel II accord certain sections were adjusted to reflect the peculiarities of the Nigerian enviroment.
The Bank’s regulatory capital as managed by its Financial Control and Treasury Units is made up of Tier 1 and Tier 2 capital as follows:
Tier 1 capital: This includes only permanent shareholders' equity (issued and fully paid ordinary shares/common stock and perpetual non-
cumulative preference shares) and disclosed reserves (created or increased by appropriations of retained earnings or other surpluses).
There is no limit on the inclusion of Tier 1 capital for the purpose of calculating regulatory capital.
Tier 2 capital: This includes revaluation reserves, general provisions/general loan loss reserves, Hybrid (debt/equity), capital instruments
and subordinated debt. Tier 2 capital is limited to a maximum of 33.3% of the total of Tier 1 capital.
The CBN excluded the following reserves in the computation of total qualifying capital:
Capital management
The Bank’s objectives when managing capital, which is a broader concept than the ‘equity’ on the face of statement of financial position,
are:
a. To comply with the capital requirements set by the regulators of the banking markets where the entities within the Bank operate;
b. To safeguard the Bank’s ability to continue as a going concern so that it can continue to provide returns for shareholders and benefits
for other stakeholders; and
c. To maintain a strong capital base to support the development of its business.
Capital adequacy and the use of regulatory capital are monitored daily by the Bank’s management, employing techniques based on the
guidelines developed by the Central Bank of Nigeria (CBN), for supervisory purposes. The required information is filed with the CBN on
a monthly basis.
The Bank has measures quantifiable risk statistics or metrics that provide warning signals of risk hotspots in the Bank's entity. The Bank
has established key risk indicators with tolerance limits for core operational goups of the Bank. The Bank's KPI database integrates with
the Loss Data Collection and Risk & Control Self Assessment models and systems to provide red flags that typically inform initiatives for
risk response actions in the Bank.
The Bank recognises that adverse incidences such as technology failure, natural and man-made disasters could occur and may affect the
Bank's critical resources leading to significant business disruption. To manage this risk, our BCM plans assits is in building resilience for
effective response to catastrophoc events. In broad categories, the plans which are tested periodically, cover disaster recovery, business
resumption, contingency planning and crisis management.
98

FIDELITY BANK PLC
NOTES TO THE INTERIM FINANCIAL STATEMENTS - continued
4.
30 June 31 December
2018 2017
N'million N'million
Tier 1 capital
Share capital 14,481 14,481
Share premium 101,272 101,272
Retained earnings (2017: less proposed dividend) 31,104 22,140
Statutory reserve 29,081 27,305
Small scale investment reserve 764 764
Tier 1 Deductions - Intangible Assets (1,237) (629)
Total qualifying Tier 1 capital 175,465 165,333
Regulatory adjustment 17,970 15,224
Adjusted qualifying Tier 1 capital 157,495 150,109
Tier 2 capital
Eurobond Issue - -
Local Bond Issue ( Discounted at 60%) 17,927 23,902
Revaluation reserve - -
Fair value reserve (2017: Available-for-sale (AFS) reserve) 5,916 5,330
Total Tier 2 capital 23,843 29,232
Less other deductions
Excess exposure over single obligor without CBN approval - -
23,843 29,232
23,843 29,232
Total Tier 1 & Tier 2 Capital 181,338 179,341
Risk-weighted assets:
Credit Risk Weighted Assets 818,963 869,324
Market Risk Weighted Assets 76,151 77,786
Operational Risk Weighted Assets 171,676 171,676
Total risk-weighted assets 1,066,789 1,118,786
Capital Adequacy Ratio (CAR) 17% 16%
Minimum Capital Adequacy Ratio 15% 15%
Capital management - continued
The table below summarises the composition of regulatory capital and the ratios of the Bank as at 30 June 2018 and as at 31 December
2017. During those two periods, the Bank as an entity complied with all of the externally imposed capital requirements to which it is
subject to.
Qualifying Tier 2 Capital restricted to lower of Tier 2 and 33.33% of Tier 1
Capital
99

FIDELITY BANK PLC
NOTES TO THE INTERIM FINANCIAL STATEMENTS - continued
5 SEGMENT ANALYSIS
Segment result of operations - IFRS 8.23
For the six months ended
30 June 2018
Retail
banking
Corporate
banking
Investment
banking Combined
N 'millions N 'millions N 'millions N 'millions
Revenue derived from external customers 26,388 32,790 29,739 88,917
Revenues from other segments - - - -
Total 26,388 32,790 29,739 88,917
Interest income 25,742 33,449 13,685 72,876
Interest expense (10,549) (21,724) (9,716) (41,989)
Profit before tax 6,958 4,352 1,701 13,010
Income tax expense (763) (217) (187) (1,167)
Profit for the year 6,195 4,135 1,514 11,843
30 June 2018
Total segment assets 763,546 104,284 699,733 1,567,562
Total segment liabilities 443,973 547,803 391,622 1,383,397
Other segment information
Depreciation/Amortization (1,331) (192) (8) (1,530)
Retail
banking
Corporate
banking
Investment
banking Combined
N 'millions N 'millions N 'millions N 'millions
30 June 2017
Revenue derived from external customers 23,727 30,214 31,880 85,821
Revenues from other segments - - - -
Total 23,727 30,214 31,880 85,821
Interest income 21,408 25,407 26,037 72,853
Interest expense (14,321) (11,874) (11,958) (38,153)
Profit before tax 7,182 2,372 665 10,219
Income tax expense (832) (274) (77) (1,183)
Profit for the year 6,350 2,098 588 9,036
31 December 2017
Total segment assets 673,514 447,675 258,025 1,379,214
Total segment liabilities 869,209 97,297 209,393 1,175,899
Other segment information
Depreciation/Amortization (1,304) (431) (121) (1,855)
No revenue from transactions with a single external customer or counterparty amounted to 10% or more of the Bank's total revenue in
30 June 2018 and 30 June 2017.
Following the management approach of IFRS 8, operating segments are reported in accordance with the internal reports provided to
the Bank's Executive Committee (the chief operating decision maker). In 2018, Management prepared its financial records in
accordance with International Financial Reporting Standards issued by the International Accounting Standards Board. This segment
is what the Bank's Executive Committee reviews in assessing performance, allocating resources and making investment decisions.
The public sector segment of the Bank was shut down in the year 2017 due to the Treasury Single Account (TSA) directive from the
Federal Govenment of Nigeria in 2016, that all Ministries, Departments and Agencies (MDAs) start paying all government revenues,
incomes and other receipts into a unified pool of single account with the Central Bank of Nigeria (CBN). Banks were directed to return
all MDAs funds to the CBN, hence the Asset and liabilities from the public sector segment shrunk significantly, staff and other
resources in the segment where re-assigned to the retail banking segment. Management ceases to have a public sector segment for
decision making purposes.
Transactions between the business segments are on normal commercial terms and conditions.
The segment information provided to the Executive Committee for the reportable segments for the period ended 30 June 2018 is as
follows:
The segment information provided to the Executive Committee for the reportable segments for the period ended 30 June 2017 is as
follows:
100

FIDELITY BANK PLC
NOTES TO THE INTERIM FINANCIAL STATEMENTS - continued
6 Interest and similar income
2018 2017
N'million N'million
Loans and advances to customers (see note 6.1) 47,943 51,050
Treasury bills and other investment securities:
-Fair value through other comprehensive income 12,026 -
-Amortised cost 9,259 -
-Available for sale - 9,019
-Held to maturity - 8,512
Advances under finance lease 2,741 2,411
Placements and short term funds 907 105
72,876 71,097
6.1
7 Interest and similar expense
2018 2017
N'million N'million
Term deposits 26,279 26,297
Debts issued and other borrowed funds 11,277 6,864
Savings deposits 3,031 2,995
Current accounts 1,401 1,793
Inter-bank takings 1 204
41,989 38,153
8 Credit loss expense
NoteStage 1
Individual
Stage 1
Collective
Stage 2
Individual
Stage 2
CollectiveStage 3
POCI Total
Balances with Central Bank of Nigeria - - - - - - -
Due from banks 11 - - - - 11
Loans and advances tocustomers - 4,008 - 1,659 (3,336) - 2,331
Debt instruments measured at FVOCI - (4) - - - - (4)
Debt instruments measured at amortised costs - (1) - - - - (1)
Financial guarantees - 135 - - - - 135
Loan commitments - 120 - - - - 120
Letters of credit - - - - - - -
Total impairment loss 11 4,258 - 1,659 (3,336) - 2,593
The table below shows the impairment charges recorded in profit or loss under IAS 39 for the period ended 30 June 2017:
Impairment charge/(reversal) on loans and advances:
- Overdrafts 6,536
- Term loans (2,509)
- Finance leases 619
- Others (16)
Impairment charge on other assets 181
4,810
Six months ended
30 June
Six months ended
30 June
The table below shows the ECL charges on financial instruments for the year recorded in profit or loss for the period ended 30 June
2018:
Interest and similar income on loans and advances to customers
Interest income on loans and advances to customers of N51.05 billion in 2017 includes interest income on impaired financial assets
of N0.5 billion and Nil for 2018, recognised using the rate of interest used to discount the future cash flows for the purpose of
measuring the impairment loss.
101
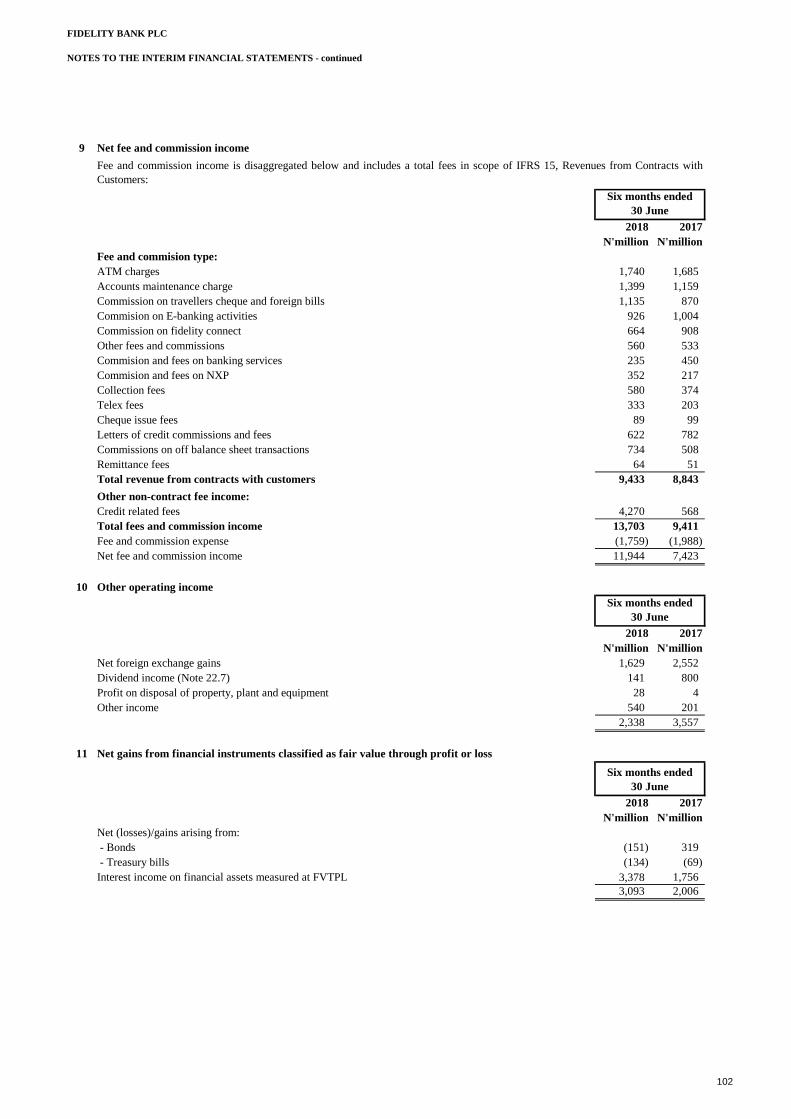
FIDELITY BANK PLC
NOTES TO THE INTERIM FINANCIAL STATEMENTS - continued
9 Net fee and commission income
2018 2017
N'million N'million
Fee and commision type:
ATM charges 1,740 1,685
Accounts maintenance charge 1,399 1,159
Commission on travellers cheque and foreign bills 1,135 870
Commision on E-banking activities 926 1,004
Commission on fidelity connect 664 908
Other fees and commissions 560 533
Commision and fees on banking services 235 450
Commision and fees on NXP 352 217
Collection fees 580 374
Telex fees 333 203
Cheque issue fees 89 99
Letters of credit commissions and fees 622 782
Commissions on off balance sheet transactions 734 508
Remittance fees 64 51
Total revenue from contracts with customers 9,433 8,843
Other non-contract fee income:
Credit related fees 4,270 568
Total fees and commission income 13,703 9,411
Fee and commission expense (1,759) (1,988)
Net fee and commission income 11,944 7,423
10 Other operating income
2018 2017
N'million N'million
Net foreign exchange gains 1,629 2,552
Dividend income (Note 22.7) 141 800
Profit on disposal of property, plant and equipment 28 4
Other income 540 201
2,338 3,557
11 Net gains from financial instruments classified as fair value through profit or loss
2018 2017
Net losses from financial instruments classified as held for trading N'million N'million
Net (losses)/gains arising from:
- Bonds (151) 319
- Treasury bills (134) (69)
Interest income on financial assets measured at FVTPL 3,378 1,756
3,093 2,006
Six months ended
30 June
Six months ended
30 June
Six months ended
30 June
Fee and commission income is disaggregated below and includes a total fees in scope of IFRS 15, Revenues from Contracts with
Customers:
102
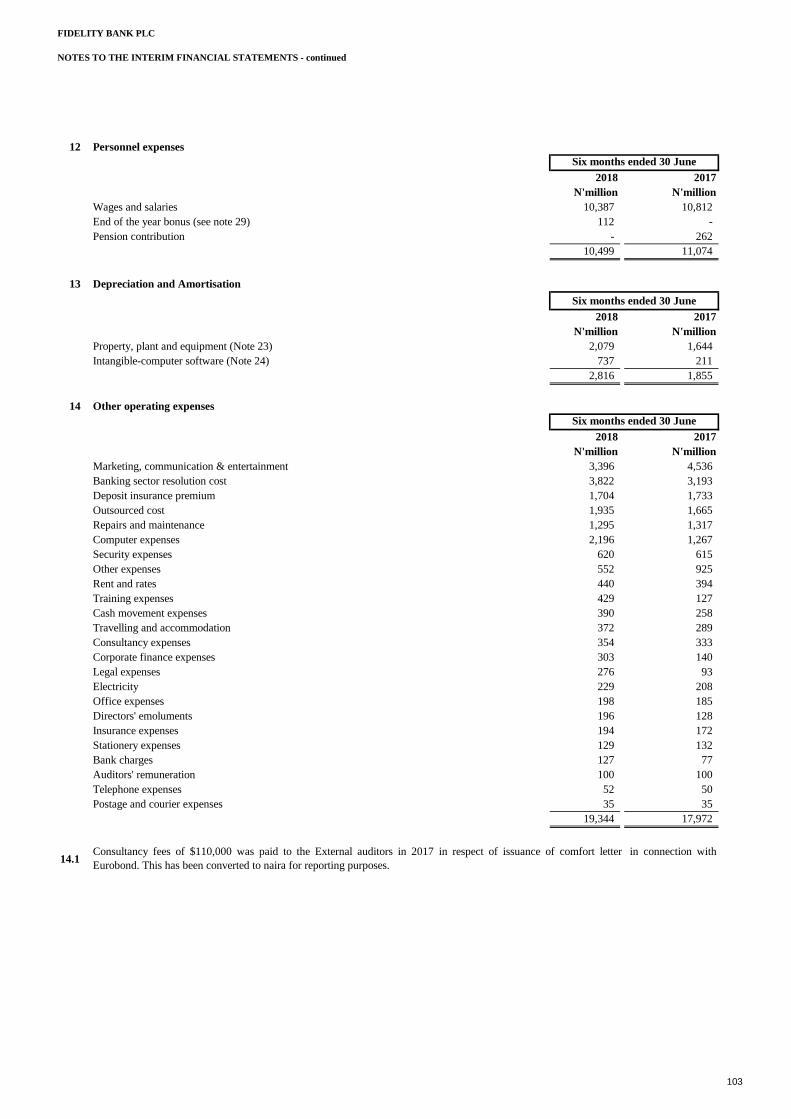
FIDELITY BANK PLC
NOTES TO THE INTERIM FINANCIAL STATEMENTS - continued
12 Personnel expenses
2018 2017
N'million N'million
Wages and salaries 10,387 10,812
End of the year bonus (see note 29) 112 -
Pension contribution - 262
10,499 11,074
13 Depreciation and Amortisation
2018 2017
N'million N'million
Property, plant and equipment (Note 23) 2,079 1,644
Intangible-computer software (Note 24) 737 211
2,816 1,855
14 Other operating expenses
2018 2017
N'million N'million
Marketing, communication & entertainment 3,396 4,536
Banking sector resolution cost 3,822 3,193
Deposit insurance premium 1,704 1,733
Outsourced cost 1,935 1,665
Repairs and maintenance 1,295 1,317
Computer expenses 2,196 1,267
Security expenses 620 615
Other expenses 552 925
Rent and rates 440 394
Training expenses 429 127
Cash movement expenses 390 258
Travelling and accommodation 372 289
Consultancy expenses 354 333
Corporate finance expenses 303 140
Legal expenses 276 93
Electricity 229 208
Office expenses 198 185
Directors' emoluments 196 128
Insurance expenses 194 172
Stationery expenses 129 132
Bank charges 127 77
Auditors' remuneration 100 100
Telephone expenses 52 50
Postage and courier expenses 35 35
19,344 17,972
14.1
Six months ended 30 June
Six months ended 30 June
Six months ended 30 June
Consultancy fees of $110,000 was paid to the External auditors in 2017 in respect of issuance of comfort letter in connection with
Eurobond. This has been converted to naira for reporting purposes.
103

FIDELITY BANK PLC
NOTES TO THE INTERIM FINANCIAL STATEMENTS - continued
15 Taxation
2018 2017
N'million N'milliona Current taxes on income for the reporting period 1,037 1,081
Technology levy 130 102
Current income tax expense 1,167 1,183
Deferred tax expense - -
Income tax expense 1,167 1,183
2018 2017
b Total income tax expense in profit or loss N'million N'million
Profit before income tax 13,010 10,219
Income tax using the domestic corporation tax rate of 30% 3,903 3,066
Non-deductible expenses 6,310 791
Tax exempt income (10,213) (3,857)
Income Tax expense based on minimum tax (note 15d) 1,037 1,081
Technology levy (note 15e) 130 102
1,167 1,183
The effective income tax rate is 9% for 30 June 2018 (2017:12%).
2018 2017
c The movement in the current income tax payable is as follows: N'million N'million
At 1 January 1,445 1,327
Income tax paid (1,453) (996)
WHT recovered 69 (331)
Current income tax expense 1,167 1,445
At 31 December 1,228 1,445
Reconciliation of effective tax rate
d
e
16 Net reclassification adjustments for realised net gains
17 Earnings per share (EPS)
Basic and Dilluted
2018 2017
N'million N'million
Profit attributable to equity holders of the Bank 11,843 9,036
million million
Weighted average number of ordinary shares in issue 28,963 28,963
Basic & diluted earnings per share (expressed in kobo per share) 41 31
Six months ended 30 June
Six months ended 30 June
Six months ended 30 June
The basis of income tax is based on minimum tax assessment as there is no taxable profit to charge tax. (2017: The basis of income tax is
minimum tax assessment).
The National Information Technology Agency Act (NITDA) 2007, stipulates that specified companies contribute 1% of their profit before
tax to National Information Development Agency. In line with the Act, the Bank has provided for Information technology levy at the
specified rate and recognised it as part of income tax for the period.
Basic earnings per share is calculated by dividing the net profit attributable to equity holders of the Bank by the weighted average number of
ordinary shares in issue during the period. The diluted earnings per share is the same as basic EPS because there are no potential ordinary
shares outstanding during the reporting period.
The net reclassification adjustments for realised net (gains)/ losses from other comprehensive income to profit or loss are in respect of debt
instruments measured at fair value through other comprehensive income (2017: available-for-sale financial assets) which were sold during
the period.
Six months ended 30 June
104
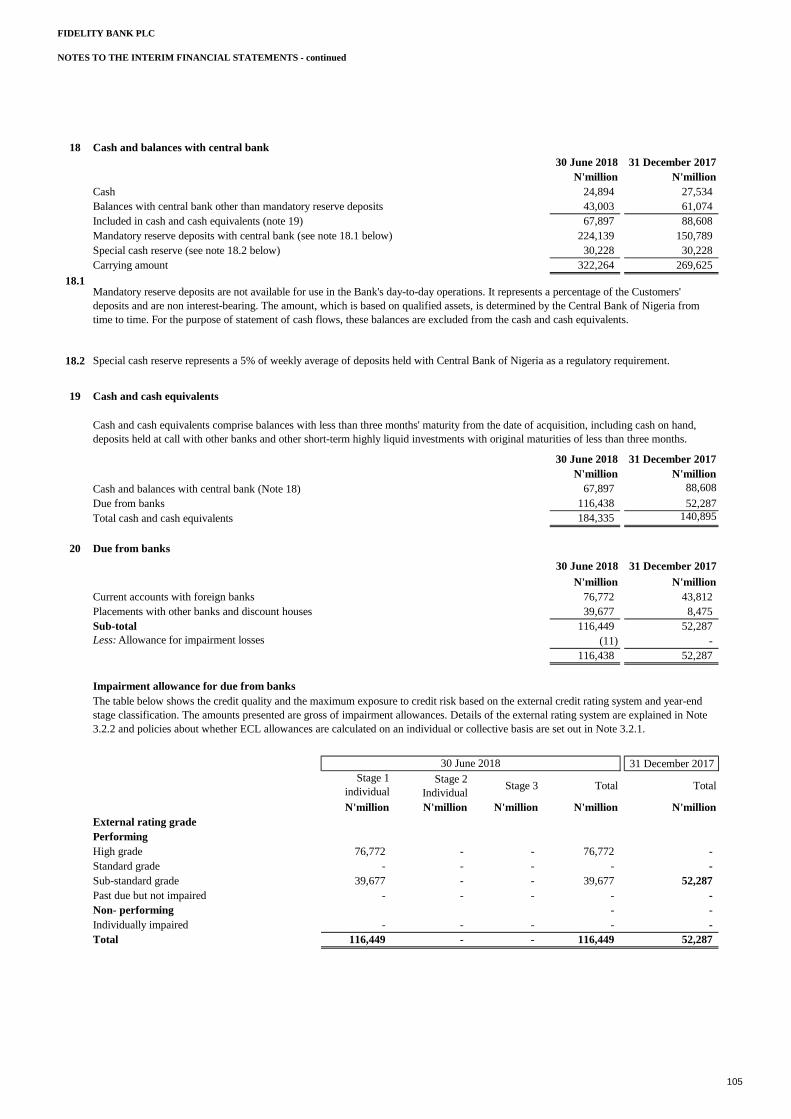
FIDELITY BANK PLC
NOTES TO THE INTERIM FINANCIAL STATEMENTS - continued
18 Cash and balances with central bank
30 June 2018 31 December 2017
N'million N'million
Cash 24,894 27,534
Balances with central bank other than mandatory reserve deposits 43,003 61,074
Included in cash and cash equivalents (note 19) 67,897 88,608
Mandatory reserve deposits with central bank (see note 18.1 below) 224,139 150,789
Special cash reserve (see note 18.2 below) 30,228 30,228
Carrying amount 322,264 269,625
18.1
18.2
19 Cash and cash equivalents
30 June 2018 31 December 2017
N'million N'million
Cash and balances with central bank (Note 18) 67,897 88,608
Due from banks 116,438 52,287
Total cash and cash equivalents 184,335 140,895
20 Due from banks
30 June 2018 31 December 2017
N'million N'million
Current accounts with foreign banks 76,772 43,812
Placements with other banks and discount houses 39,677 8,475
Sub-total 116,449 52,287
Less: Allowance for impairment losses (11) -
116,438 52,287
Impairment allowance for due from banks
31 December 2017
Stage 1
individual
Stage 2
IndividualStage 3 Total Total
N'million N'million N'million N'million N'million
External rating grade
Performing
High grade 76,772 - - 76,772 -
Standard grade - - - - -
Sub-standard grade 39,677 - - 39,677 52,287
Past due but not impaired - - - - -
Non- performing - -
Individually impaired - - - - -
Total 116,449 - - 116,449 52,287
Mandatory reserve deposits are not available for use in the Bank's day-to-day operations. It represents a percentage of the Customers'
deposits and are non interest-bearing. The amount, which is based on qualified assets, is determined by the Central Bank of Nigeria from
time to time. For the purpose of statement of cash flows, these balances are excluded from the cash and cash equivalents.
Cash and cash equivalents comprise balances with less than three months' maturity from the date of acquisition, including cash on hand,
deposits held at call with other banks and other short-term highly liquid investments with original maturities of less than three months.
Special cash reserve represents a 5% of weekly average of deposits held with Central Bank of Nigeria as a regulatory requirement.
The table below shows the credit quality and the maximum exposure to credit risk based on the external credit rating system and year-end
stage classification. The amounts presented are gross of impairment allowances. Details of the external rating system are explained in Note
3.2.2 and policies about whether ECL allowances are calculated on an individual or collective basis are set out in Note 3.2.1.
30 June 2018
105
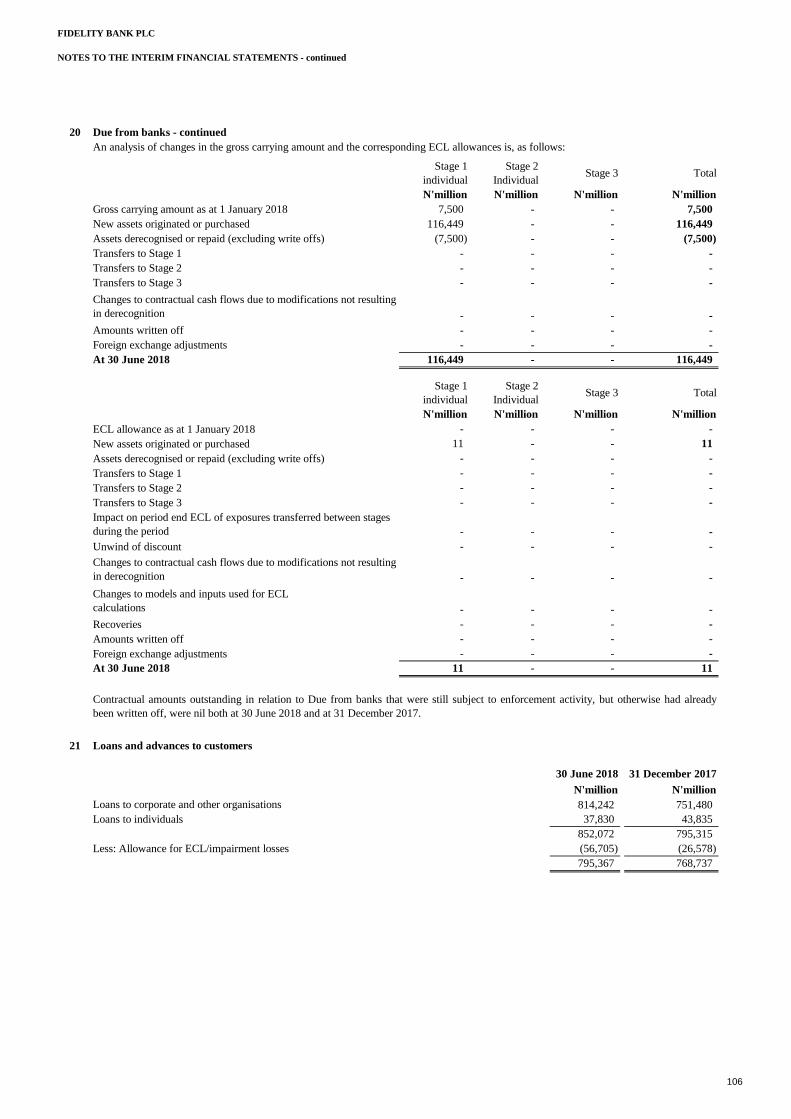
FIDELITY BANK PLC
NOTES TO THE INTERIM FINANCIAL STATEMENTS - continued
20 Due from banks - continued
An analysis of changes in the gross carrying amount and the corresponding ECL allowances is, as follows:
Stage 1
individual
Stage 2
IndividualStage 3 Total
N'million N'million N'million N'million
Gross carrying amount as at 1 January 2018 7,500 - - 7,500
New assets originated or purchased 116,449 - - 116,449
Assets derecognised or repaid (excluding write offs) (7,500) - - (7,500)
Transfers to Stage 1 - - - -
Transfers to Stage 2 - - - -
Transfers to Stage 3 - - - -
- - - -
Amounts written off - - - -
Foreign exchange adjustments - - - -
At 30 June 2018 116,449 - - 116,449
Stage 1
individual
Stage 2
IndividualStage 3 Total
N'million N'million N'million N'million
ECL allowance as at 1 January 2018 - - - -
New assets originated or purchased 11 - - 11
Assets derecognised or repaid (excluding write offs) - - - -
Transfers to Stage 1 - - - -
Transfers to Stage 2 - - - -
Transfers to Stage 3 - - - -
- - - -
Unwind of discount - - - -
- - - -
- - - -
Recoveries - - - -
Amounts written off - - - -
Foreign exchange adjustments - - - -
At 30 June 2018 11 - - 11
21 Loans and advances to customers
30 June 2018 31 December 2017
N'million N'million
Loans to corporate and other organisations 814,242 751,480
Loans to individuals 37,830 43,835
852,072 795,315
Less: Allowance for ECL/impairment losses (56,705) (26,578)
795,367 768,737
Changes to contractual cash flows due to modifications not resulting
in derecognition
Impact on period end ECL of exposures transferred between stages
during the period
Changes to contractual cash flows due to modifications not resulting
in derecognition
Changes to models and inputs used for ECL
calculations
Contractual amounts outstanding in relation to Due from banks that were still subject to enforcement activity, but otherwise had already
been written off, were nil both at 30 June 2018 and at 31 December 2017.
106

FIDELITY BANK PLC
NOTES TO THE INTERIM FINANCIAL STATEMENTS - continued
21 Loans and advances to customers - continued
30 June 2018 31 December 2017
N'million N'million
Loans to corporate entities and other organisations
Overdrafts 78,529 56,000
Term loans 702,443 669,444
Advance under finance lease 33,270 26,035
814,242 751,479
Less: Allowance for ECL/impairment losses (45,231) (23,337)
769,011 728,142
Loans to individuals
Overdrafts 4,597 4,045
Term loans 32,976 39,498
Advance under finance lease 258 292
37,831 43,835
Less: Allowance for ECL/impairment losses (11,473) (3,241)
26,357 40,594
Net loans and advances include 795,368 768,736
21.1 Impairment allowance for loans and advances to customers
21.1.1 Corporate and other organisations
31 December 2017Stage 1
Individual
Stage 2
Individual Stage 3 POCI Total TotalN'million N'million N'million N'million N'million N'million
Internal rating grade
Performing
High grade (AAA - A) 47,778 1,390 - - 49,168 31,458
Standard grade (BBB - B) 522,382 145,073 4,087 - 671,542 653,831
Sub-standard grade (CCC - CC) 34,928 2,319 584 - 37,830 16,897
Past due but not impaired (C) - - 21,126 - 21,126 5,964
Non- performing: - -
Individually impaired - - 34,575 - 34,575 43,328
Total 605,088 148,782 60,372 - 814,242 751,479
Stage 1
Individual
Stage 2
Individual Stage 3 POCI Total
N'million N'million N'million N'million N'million
Gross carrying amount as at1 January 2018 570,494 46,705 134,280 - 751,479
New assets originated or purchased 177,681 - - - 177,681
(3,182) (199) (111,537) - (114,919)
Transfers to Stage 1 5,917 (5,748) (169) - (0)
Transfers to Stage 2 (140,803) 109,519 31,283 - -
Transfers to Stage 3 (5,020) (1,495) 6,515 - (0)
- - - - -
Foreign exchange adjustments - - - - -
At 30 June 2018 605,088 148,782 60,372 - 814,242
The table below shows the credit quality and the maximum exposure to credit risk based on the Bank’s internal credit rating system and year-
end stage classification. The amounts presented are gross of impairment allowances. Details of the Bank’s internal grading system are
explained in Note 3.2.2 and policies on whether ECL allowances are calculated on an individual or collective basis are set out in Note 3.2.1.
30 June 2018
30 June 2018
An analysis of changes in the gross carrying amount and the corresponding ECL allowances in relation to Corporate lending is, as follows:
Assets derecognised or repaid (excluding write
offs)
Changes to contractual cash flows due to
modifications not resulting in derecognition
107
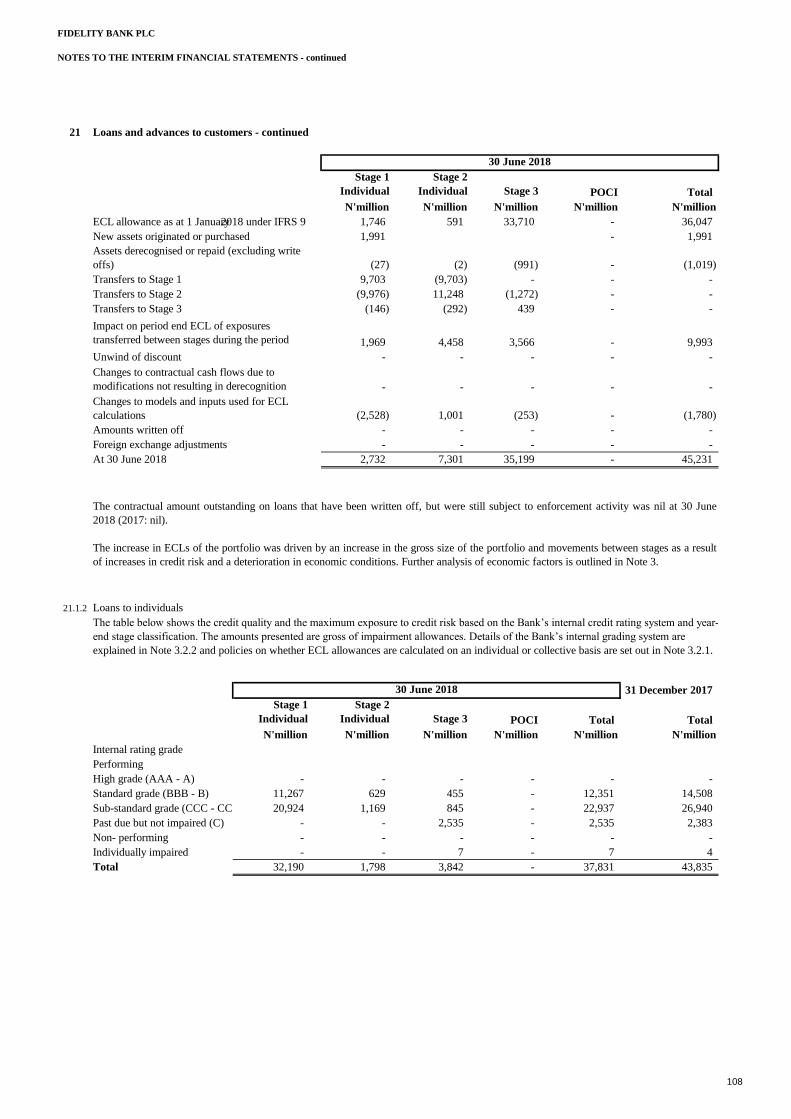
FIDELITY BANK PLC
NOTES TO THE INTERIM FINANCIAL STATEMENTS - continued
21 Loans and advances to customers - continued
Stage 1
Individual
Stage 2
Individual Stage 3 POCI Total
N'million N'million N'million N'million N'million
ECL allowance as at 1 January2018 under IFRS 9 1,746 591 33,710 - 36,047
New assets originated or purchased 1,991 - 1,991
(27) (2) (991) - (1,019)
Transfers to Stage 1 9,703 (9,703) - - -
Transfers to Stage 2 (9,976) 11,248 (1,272) - -
Transfers to Stage 3 (146) (292) 439 - -
1,969 4,458 3,566 - 9,993
Unwind of discount - - - - -
- - - - -
(2,528) 1,001 (253) - (1,780)
Amounts written off - - - - -
Foreign exchange adjustments - - - - -
At 30 June 2018 2,732 7,301 35,199 - 45,231
21.1.2 Loans to individuals
31 December 2017
Stage 1
Individual
Stage 2
Individual Stage 3 POCI Total Total
N'million N'million N'million N'million N'million N'million
Internal rating grade
Performing
High grade (AAA - A) - - - - - -
Standard grade (BBB - B) 11,267 629 455 - 12,351 14,508
Sub-standard grade (CCC - CC) 20,924 1,169 845 - 22,937 26,940
Past due but not impaired (C) - - 2,535 - 2,535 2,383
Non- performing - - - - - -
Individually impaired - - 7 - 7 4
Total 32,190 1,798 3,842 - 37,831 43,835
30 June 2018
Impact on period end ECL of exposures
transferred between stages during the period
Changes to contractual cash flows due to
modifications not resulting in derecognition
Changes to models and inputs used for ECL
calculations
The contractual amount outstanding on loans that have been written off, but were still subject to enforcement activity was nil at 30 June
2018 (2017: nil).
The increase in ECLs of the portfolio was driven by an increase in the gross size of the portfolio and movements between stages as a result
of increases in credit risk and a deterioration in economic conditions. Further analysis of economic factors is outlined in Note 3.
Assets derecognised or repaid (excluding write
offs)
The table below shows the credit quality and the maximum exposure to credit risk based on the Bank’s internal credit rating system and year-
end stage classification. The amounts presented are gross of impairment allowances. Details of the Bank’s internal grading system are
explained in Note 3.2.2 and policies on whether ECL allowances are calculated on an individual or collective basis are set out in Note 3.2.1.
30 June 2018
108
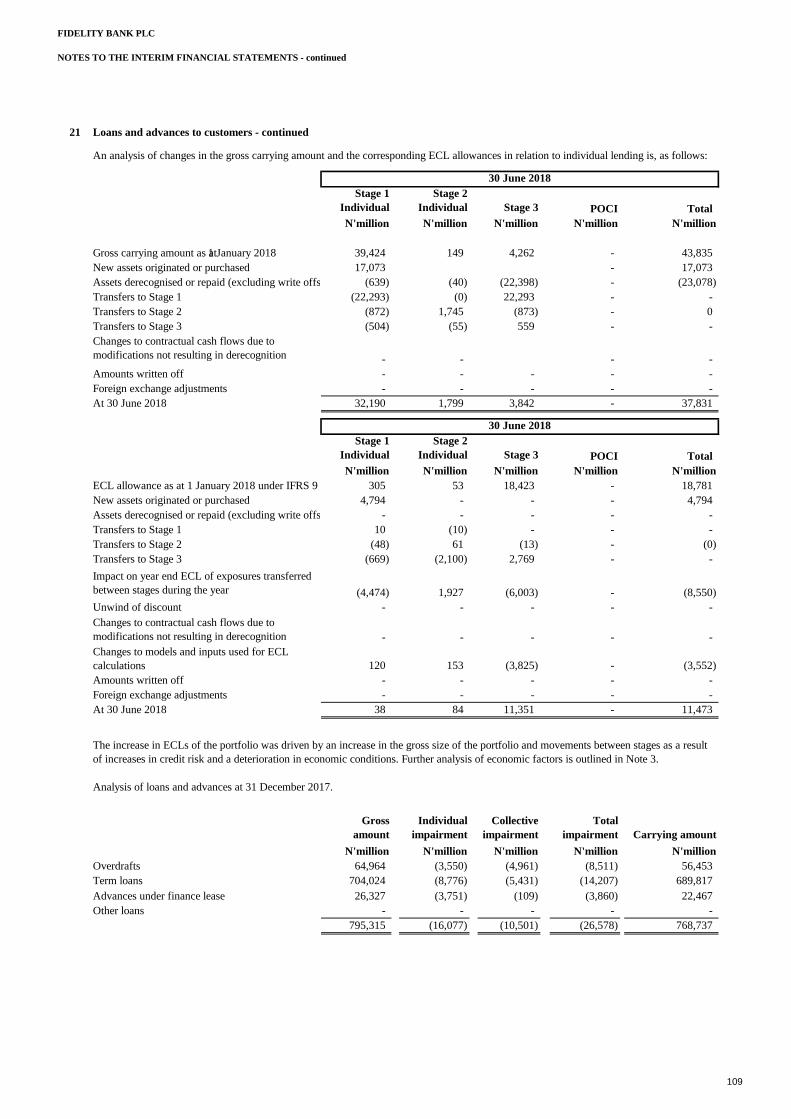
FIDELITY BANK PLC
NOTES TO THE INTERIM FINANCIAL STATEMENTS - continued
21 Loans and advances to customers - continued
Stage 1
Individual
Stage 2
Individual Stage 3 POCI Total
N'million N'million N'million N'million N'million
Gross carrying amount as at1 January 2018 39,424 149 4,262 - 43,835
New assets originated or purchased 17,073 - 17,073
Assets derecognised or repaid (excluding write offs) (639) (40) (22,398) - (23,078)
Transfers to Stage 1 (22,293) (0) 22,293 - -
Transfers to Stage 2 (872) 1,745 (873) - 0
Transfers to Stage 3 (504) (55) 559 - -
- - - -
Amounts written off - - - - -
Foreign exchange adjustments - - - - -
At 30 June 2018 32,190 1,799 3,842 - 37,831
Stage 1
Individual
Stage 2
Individual Stage 3 POCI Total
N'million N'million N'million N'million N'million
ECL allowance as at 1 January 2018 under IFRS 9 305 53 18,423 - 18,781
New assets originated or purchased 4,794 - - - 4,794
Assets derecognised or repaid (excluding write offs) - - - - -
Transfers to Stage 1 10 (10) - - -
Transfers to Stage 2 (48) 61 (13) - (0)
Transfers to Stage 3 (669) (2,100) 2,769 - -
(4,474) 1,927 (6,003) - (8,550)
Unwind of discount - - - - -
- - - - -
120 153 (3,825) - (3,552)
Amounts written off - - - - -
Foreign exchange adjustments - - - - -
At 30 June 2018 38 84 11,351 - 11,473
Analysis of loans and advances at 31 December 2017.
Gross
amount
Individual
impairment
Collective
impairment
Total
impairment Carrying amount
N'million N'million N'million N'million N'million
Overdrafts 64,964 (3,550) (4,961) (8,511) 56,453
Term loans 704,024 (8,776) (5,431) (14,207) 689,817
Advances under finance lease 26,327 (3,751) (109) (3,860) 22,467
Other loans - - - - -
795,315 (16,077) (10,501) (26,578) 768,737
Changes to contractual cash flows due to
modifications not resulting in derecognition
An analysis of changes in the gross carrying amount and the corresponding ECL allowances in relation to individual lending is, as follows:
30 June 2018
30 June 2018
Impact on year end ECL of exposures transferred
between stages during the year
Changes to contractual cash flows due to
modifications not resulting in derecognition
Changes to models and inputs used for ECL
calculations
The increase in ECLs of the portfolio was driven by an increase in the gross size of the portfolio and movements between stages as a result
of increases in credit risk and a deterioration in economic conditions. Further analysis of economic factors is outlined in Note 3.
109

FIDELITY BANK PLC
NOTES TO THE INTERIM FINANCIAL STATEMENTS - continued
21 Loans and advances to customers- continued
Reconciliation of impairment allowance on loans and advances to customers:
Overdrafts Term loans
Finance
lease Other Total
N'million N'million N'million N'million N'million
Balance at 1 January 2017
Individual impairment 3,550 8,776 3,751 - 16,077
Collective impairment 4,961 5,431 109 - 10,501
8,511 14,207 3,860 - 26,578
Impairment charge/(reversal) for the year
Individual impairment 8,166 1,279 1,043 - 10,488
Collective impairment 1,523 (579) (119) (16) 809
Total charge to profit or loss 9,689 700 924 (16) 11,297
Write off during the year
Individual impairment (9,438) - - - (9,438)
Collective impairment - - - -
(9,438) - - - (9,438)
Individual impairment 2,278 10,055 4,794 - 17,127
Collective impairment 6,484 4,852 (10) (16) 11,310
Balance at 31 December
2017 8,762 14,907 4,784 (16) 28,437
21.2 Advances under finance lease may be analysed as follows:
30 June 2018 31 December 2017
Gross investment N'million N'million
- No later than 1 year 7,219 3,219
- Later than 1 year and no later than 5 years 26,713 21,713
- Later than 5 years 3,770 1,770
37,702 26,702
Unearned future finance income on finance leases (4,432) (375)
Net investment 33,270 26,327
The net investment may be analysed as follows:
- No later than 1 year 6,057 3,115
- Later than 1 year and no later than 5 years 25,709 21,529
- Later than 5 years 1,504 1,684
33,270 26,328
21.3 Nature of security in respect of loans and advances:
30 June 2018 31 December 2017
N'million N'million
Secured against real estate 663,293 503,293
Secured by shares of quoted companies 113,475 158,718
Secured others 63,791 111,791
Advances under finance lease 11,513 21,513
Unsecured - -
Gross loans and advances to customers 852,072 795,315
110
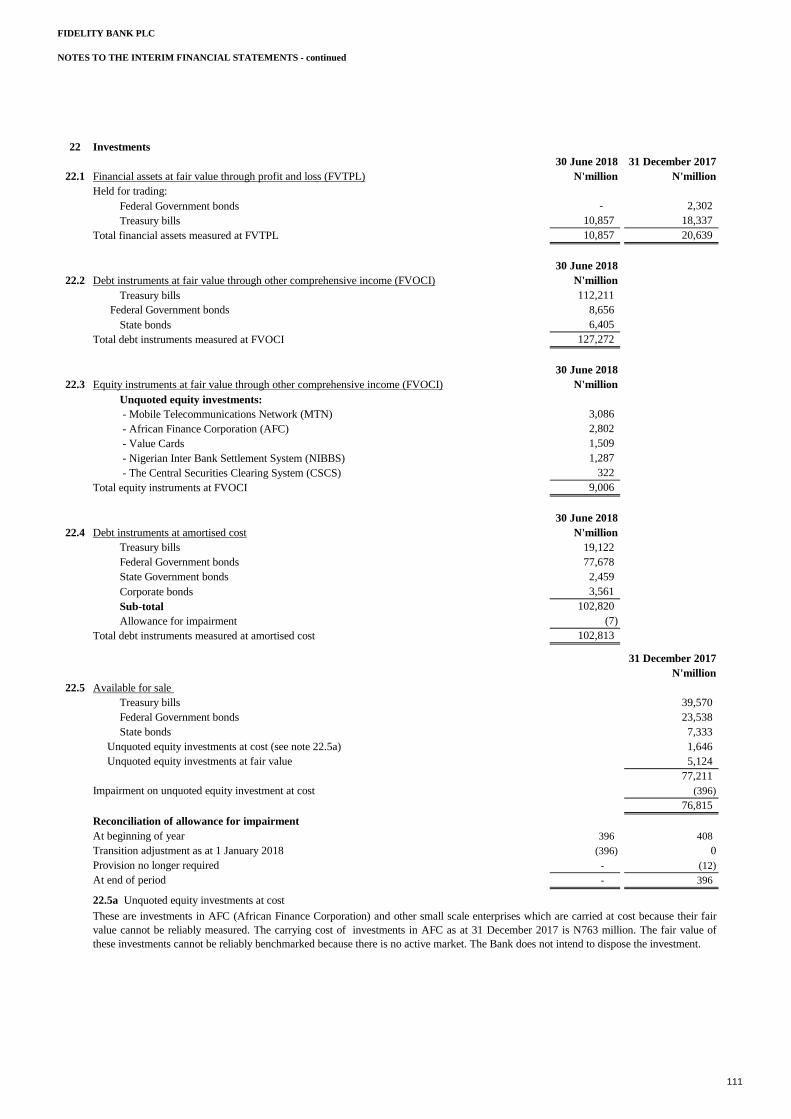
FIDELITY BANK PLC
NOTES TO THE INTERIM FINANCIAL STATEMENTS - continued
22 Investments
30 June 2018 31 December 2017
22.1 Financial assets at fair value through profit and loss (FVTPL) N'million N'million
Held for trading:
Federal Government bonds - 2,302
Treasury bills 10,857 18,337
Total financial assets measured at FVTPL 10,857 20,639
30 June 2018
22.2 Debt instruments at fair value through other comprehensive income (FVOCI) N'million
Treasury bills 112,211
Federal Government bonds 8,656
State bonds 6,405
Total debt instruments measured at FVOCI 127,272
30 June 2018
22.3 Equity instruments at fair value through other comprehensive income (FVOCI) N'million
Unquoted equity investments:
- Mobile Telecommunications Network (MTN) 3,086
- African Finance Corporation (AFC) 2,802
- Value Cards 1,509
- Nigerian Inter Bank Settlement System (NIBBS) 1,287
- The Central Securities Clearing System (CSCS) 322
Total equity instruments at FVOCI 9,006
30 June 2018
22.4 Debt instruments at amortised cost N'million
Treasury bills 19,122
Federal Government bonds 77,678
State Government bonds 2,459
Corporate bonds 3,561
Sub-total 102,820
Allowance for impairment (7)
Total debt instruments measured at amortised cost 102,813
31 December 2017
N'million
22.5 Available for sale
Treasury bills 39,570
Federal Government bonds 23,538
State bonds 7,333
Unquoted equity investments at cost (see note 22.5a) 1,646
Unquoted equity investments at fair value 5,124
77,211
Impairment on unquoted equity investment at cost (396)
76,815
Reconciliation of allowance for impairment
At beginning of year 396 408
Transition adjustment as at 1 January 2018 (396) 0
Provision no longer required - (12)
At end of period - 396
22.5a Unquoted equity investments at cost
These are investments in AFC (African Finance Corporation) and other small scale enterprises which are carried at cost because their fair
value cannot be reliably measured. The carrying cost of investments in AFC as at 31 December 2017 is N763 million. The fair value of
these investments cannot be reliably benchmarked because there is no active market. The Bank does not intend to dispose the investment.
111
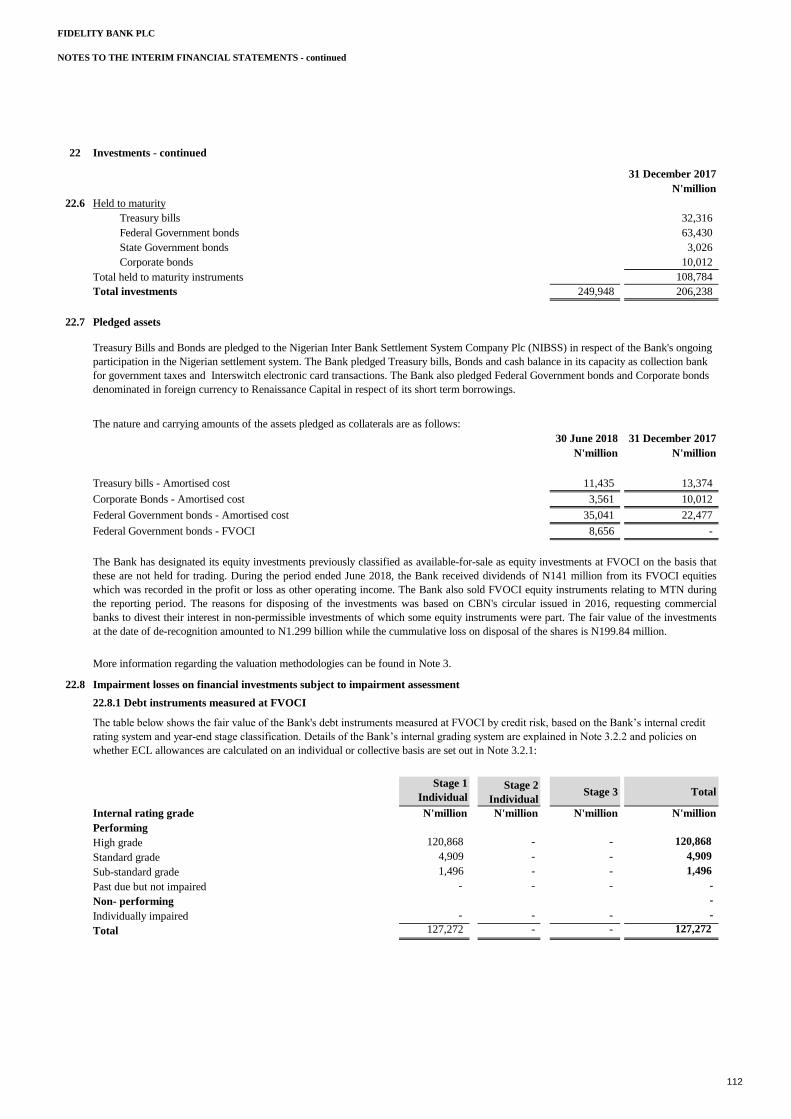
FIDELITY BANK PLC
NOTES TO THE INTERIM FINANCIAL STATEMENTS - continued
22 Investments - continued
31 December 2017
N'million
22.6 Held to maturity
Treasury bills 32,316
Federal Government bonds 63,430
State Government bonds 3,026
Corporate bonds 10,012
Total held to maturity instruments 108,784
Total investments 249,948 206,238
22.7 Pledged assets
The nature and carrying amounts of the assets pledged as collaterals are as follows:
30 June 2018 31 December 2017
N'million N'million
Treasury bills - Amortised cost 11,435 13,374
Corporate Bonds - Amortised cost 3,561 10,012
Federal Government bonds - Amortised cost 35,041 22,477
Federal Government bonds - FVOCI 8,656 -
More information regarding the valuation methodologies can be found in Note 3.
22.8 Impairment losses on financial investments subject to impairment assessment
22.8.1 Debt instruments measured at FVOCI
Stage 1
IndividualStage 2
IndividualStage 3 Total
Internal rating grade N'million N'million N'million N'million
Performing
High grade 120,868 - - 120,868
Standard grade 4,909 - - 4,909
Sub-standard grade 1,496 - - 1,496
Past due but not impaired - - - -
Non- performing -
Individually impaired - - - -
Total 127,272 - - 127,272
Treasury Bills and Bonds are pledged to the Nigerian Inter Bank Settlement System Company Plc (NIBSS) in respect of the Bank's ongoing
participation in the Nigerian settlement system. The Bank pledged Treasury bills, Bonds and cash balance in its capacity as collection bank
for government taxes and Interswitch electronic card transactions. The Bank also pledged Federal Government bonds and Corporate bonds
denominated in foreign currency to Renaissance Capital in respect of its short term borrowings.
The Bank has designated its equity investments previously classified as available-for-sale as equity investments at FVOCI on the basis that
these are not held for trading. During the period ended June 2018, the Bank received dividends of N141 million from its FVOCI equities
which was recorded in the profit or loss as other operating income. The Bank also sold FVOCI equity instruments relating to MTN during
the reporting period. The reasons for disposing of the investments was based on CBN's circular issued in 2016, requesting commercial
banks to divest their interest in non-permissible investments of which some equity instruments were part. The fair value of the investments
at the date of de-recognition amounted to N1.299 billion while the cummulative loss on disposal of the shares is N199.84 million.
The table below shows the fair value of the Bank's debt instruments measured at FVOCI by credit risk, based on the Bank’s internal credit
rating system and year-end stage classification. Details of the Bank’s internal grading system are explained in Note 3.2.2 and policies on
whether ECL allowances are calculated on an individual or collective basis are set out in Note 3.2.1:
112
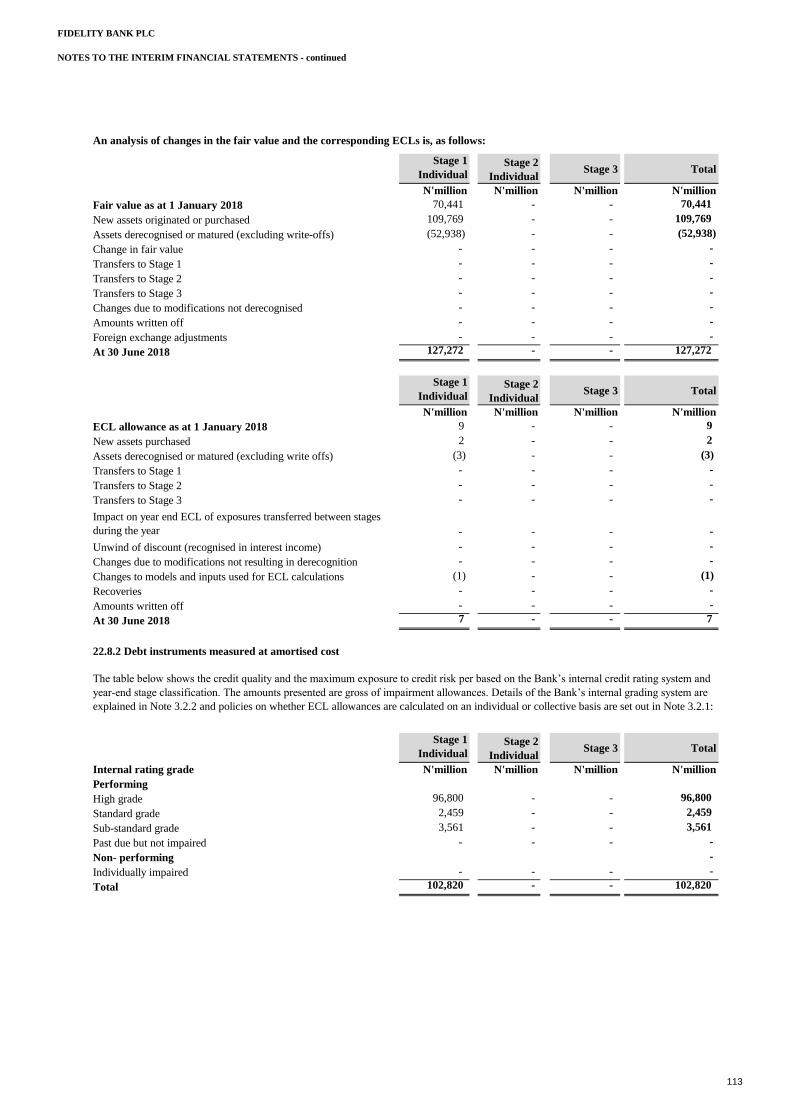
FIDELITY BANK PLC
NOTES TO THE INTERIM FINANCIAL STATEMENTS - continued
An analysis of changes in the fair value and the corresponding ECLs is, as follows:
Stage 1
IndividualStage 2
IndividualStage 3 Total
N'million N'million N'million N'million
Fair value as at 1 January 2018 70,441 - - 70,441
New assets originated or purchased 109,769 - - 109,769
Assets derecognised or matured (excluding write-offs) (52,938) - - (52,938)
Change in fair value - - - -
Transfers to Stage 1 - - - -
Transfers to Stage 2 - - - -
Transfers to Stage 3 - - - -
Changes due to modifications not derecognised - - - -
Amounts written off - - - -
Foreign exchange adjustments - - - -
At 30 June 2018 127,272 - - 127,272
Stage 1
IndividualStage 2
IndividualStage 3 Total
N'million N'million N'million N'million
ECL allowance as at 1 January 2018 9 - - 9
New assets purchased 2 - - 2
Assets derecognised or matured (excluding write offs) (3) - - (3)
Transfers to Stage 1 - - - -
Transfers to Stage 2 - - - -
Transfers to Stage 3 - - - -
- - - -
Unwind of discount (recognised in interest income) - - - -
Changes due to modifications not resulting in derecognition - - - -
Changes to models and inputs used for ECL calculations (1) - - (1)
Recoveries - - - -
Amounts written off - - - -
At 30 June 2018 7 - - 7
22.8.2 Debt instruments measured at amortised cost
Stage 1
IndividualStage 2
IndividualStage 3 Total
Internal rating grade N'million N'million N'million N'million
Performing
High grade 96,800 - - 96,800
Standard grade 2,459 - - 2,459
Sub-standard grade 3,561 - - 3,561
Past due but not impaired - - - -
Non- performing -
Individually impaired - - - -
Total 102,820 - - 102,820
Impact on year end ECL of exposures transferred between stages
during the year
The table below shows the credit quality and the maximum exposure to credit risk per based on the Bank’s internal credit rating system and
year-end stage classification. The amounts presented are gross of impairment allowances. Details of the Bank’s internal grading system are
explained in Note 3.2.2 and policies on whether ECL allowances are calculated on an individual or collective basis are set out in Note 3.2.1:
113

FIDELITY BANK PLC
NOTES TO THE INTERIM FINANCIAL STATEMENTS - continued
An analysis of changes in the gross carrying amount and the corresponding ECLs is, as follows:
Stage 1
IndividualStage 2
IndividualStage 3 Total
N'million N'million N'million N'million
Gross carrying amount as at 1 January 2018 108,784 - - 108,784
New assets originated or purchased 14,617 - - 14,617
Assets derecognised or matured (excluding write-offs) (20,582) - - (20,582)
Transfers to Stage 1 - - - -
Transfers to Stage 2 - - - -
Transfers to Stage 3 - - - -
Changes due to modifications not derecognised - - - -
Amounts written off - - - -
Foreign exchange adjustments - - - -
At 30 June 2018 102,820 - - 102,820
Stage 1
IndividualStage 2
IndividualStage 3 Total
N'million N'million N'million N'million
ECL allowance as at 1 January 2018 11 - - 11
New assets purchased - - - -
Assets derecognised or matured (excluding write offs) (3) - - (3)
Transfers to Stage 1 - - - -
Transfers to Stage 2 - - - -
Transfers to Stage 3 - - - -
- - - -
Unwind of discount (recognised in interest income) - - - -
Changes due to modifications not resulting in derecognition - - - -
Changes to models and inputs used for ECL calculations (1) - - (1)
Recoveries - - - -
Amounts written off - - - -
At 30 June 2018 7 - - 7
Impact on year end ECL of exposures transferred between stages
during the year
114
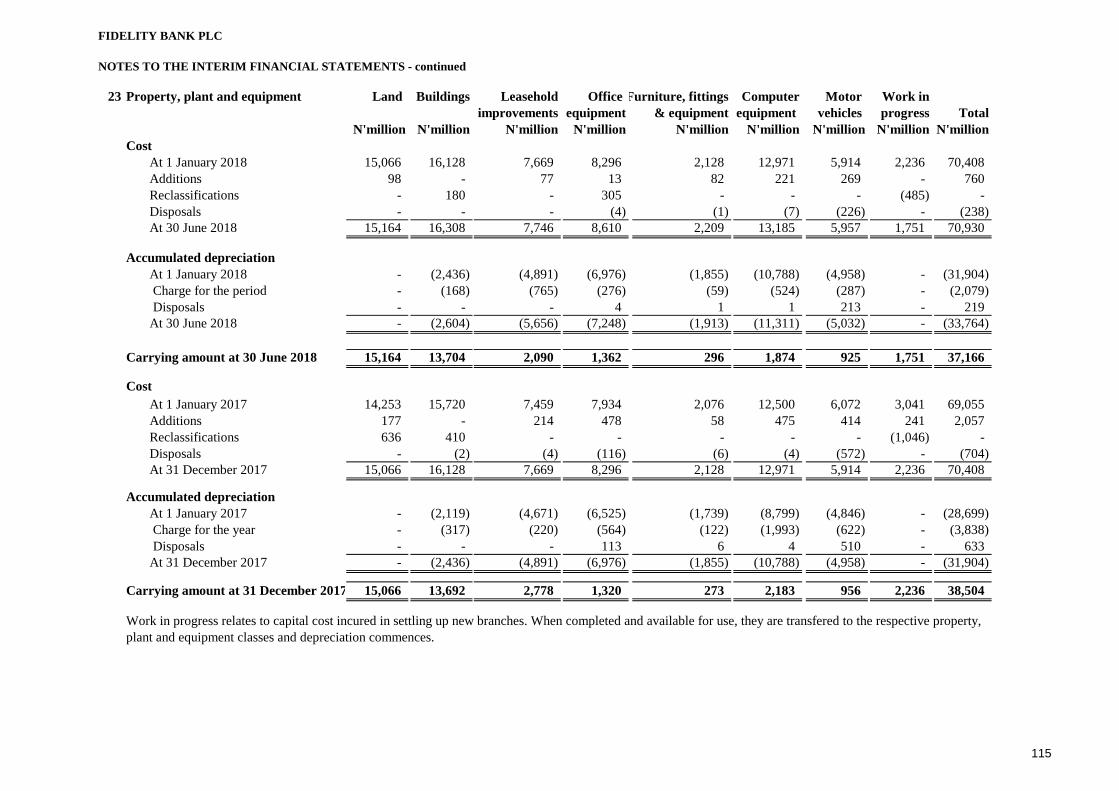
FIDELITY BANK PLC
NOTES TO THE INTERIM FINANCIAL STATEMENTS - continued
23 Property, plant and equipment Land Buildings Leasehold Office Furniture, fittings Computer Motor Work in
improvements equipment & equipment equipment vehicles progress Total
N'million N'million N'million N'million N'million N'million N'million N'million N'million
Cost
At 1 January 2018 15,066 16,128 7,669 8,296 2,128 12,971 5,914 2,236 70,408
Additions 98 - 77 13 82 221 269 - 760
Reclassifications - 180 - 305 - - - (485) -
Disposals - - - (4) (1) (7) (226) - (238)
At 30 June 2018 15,164 16,308 7,746 8,610 2,209 13,185 5,957 1,751 70,930
Accumulated depreciation
At 1 January 2018 - (2,436) (4,891) (6,976) (1,855) (10,788) (4,958) - (31,904)
Charge for the period - (168) (765) (276) (59) (524) (287) - (2,079)
Disposals - - - 4 1 1 213 - 219
At 30 June 2018 - (2,604) (5,656) (7,248) (1,913) (11,311) (5,032) - (33,764)
Carrying amount at 30 June 2018 15,164 13,704 2,090 1,362 296 1,874 925 1,751 37,166
Cost
At 1 January 2017 14,253 15,720 7,459 7,934 2,076 12,500 6,072 3,041 69,055
Additions 177 - 214 478 58 475 414 241 2,057
Reclassifications 636 410 - - - - - (1,046) -
Disposals - (2) (4) (116) (6) (4) (572) - (704)
At 31 December 2017 15,066 16,128 7,669 8,296 2,128 12,971 5,914 2,236 70,408
Accumulated depreciation
At 1 January 2017 - (2,119) (4,671) (6,525) (1,739) (8,799) (4,846) - (28,699)
Charge for the year - (317) (220) (564) (122) (1,993) (622) - (3,838)
Disposals - - - 113 6 4 510 - 633
At 31 December 2017 - (2,436) (4,891) (6,976) (1,855) (10,788) (4,958) - (31,904)
Carrying amount at 31 December 2017 15,066 13,692 2,778 1,320 273 2,183 956 2,236 38,504
Work in progress relates to capital cost incured in settling up new branches. When completed and available for use, they are transfered to the respective property,
plant and equipment classes and depreciation commences.
115

FIDELITY BANK PLC
NOTES TO THE INTERIM FINANCIAL STATEMENTS - continued
24 Intangible assets - Computer software
30 June 31 December
2018 2017
N'million N'million
Cost
Balance at beginning of year 3,361 2,992
Additions 1,345 369
Disposal during the period (30) -
Balance 4,676 3,361
Accumulated amortization
Balance at beginning of year 2,732 2,197
Amortisation for the period/year 737 535
Disposal during the period (30) -
Balance 3,439 2,732
Carrying amount 1,237 629
25 Deferred taxation
Deferred tax assets and liabilities are attributable to the following items:
25.1 Deferred tax
30 June 31 December
2018 2017
N'million N'million
Deferred tax assets
Property,plant and equipment 4,285 6,887
Allowances for loan losses 23,115 3,150
Tax loss carried forward 3,619 21,583
31,019 31,620
Unrecognised deferred tax assets (31,019) (28,377)
Net - -
25.2
The amortisation of intangible asset recognised in depreciation and amortisation in profit or loss was N737 million for the six months
ended 30 June 2018 (31 December 2017: N535).
Deferred tax assets and liabilities are offset when there is a legally enforceable right to offset current tax assets against current tax
liabilities and when the deferred income taxes relate to the same fiscal authority.
Deferred taxes are calculated on all temporary differences under the liability method using a statutory tax rate of 30% or 32% as
applicable (2017: 30% or 32%).
The Bank has unutilised capital allowance of N24.99 billion (31 Dec 2017:N23.0 billion) unused tax losses carried forward of N77.05
billion
(31 Dec 2017: N71.9 billion) and deductible temporary difference of N600 million (31 Dec 2017: N309 million) to be offset against
future taxable profits. There is no expiry date for the utilisation of these items.
The Bank has been incurring taxable losses primarily because of the tax exemption on income on government securities. The provisions
of the Companies Income Tax (Exemption of Bonds and Short Term Government Securities) Order, 2011 grants exemption to income
from bonds and treasury bills from tax for a period of 10 years. The expiry date of the circular will be in the year 2021 and this trend
would continue until the expiration of the tax holiday. Thus, the Bank has applied caution by not recognising additional deferred tax
which is not considered capable of recovery.
These relate to purchased softwares.
116
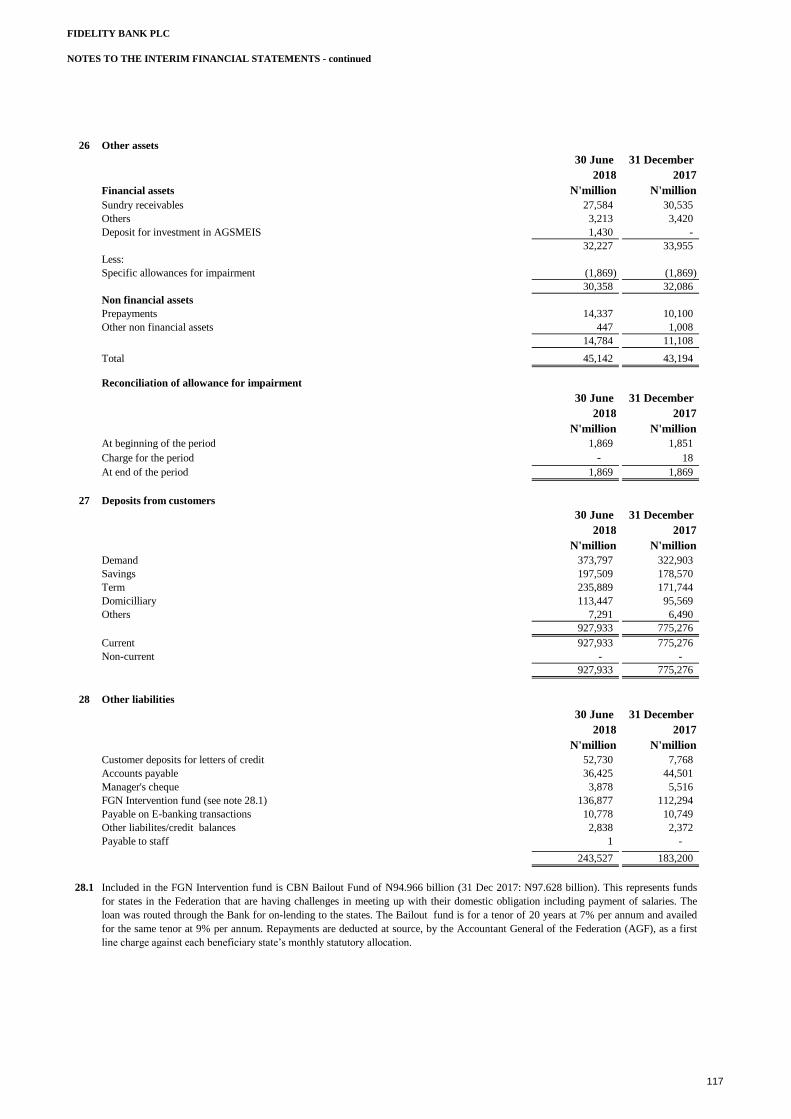
FIDELITY BANK PLC
NOTES TO THE INTERIM FINANCIAL STATEMENTS - continued
26 Other assets
30 June 31 December
2018 2017
Financial assets N'million N'million
Sundry receivables 27,584 30,535
Others 3,213 3,420
Deposit for investment in AGSMEIS 1,430 -
32,227 33,955
Less:
Specific allowances for impairment (1,869) (1,869)
30,358 32,086
Non financial assets
Prepayments 14,337 10,100
Other non financial assets 447 1,008
14,784 11,108
Total 45,142 43,194
Reconciliation of allowance for impairment
30 June 31 December
2018 2017
N'million N'million
At beginning of the period 1,869 1,851
Charge for the period - 18
At end of the period 1,869 1,869
27 Deposits from customers
30 June 31 December
2018 2017
N'million N'million
Demand 373,797 322,903
Savings 197,509 178,570
Term 235,889 171,744
Domicilliary 113,447 95,569
Others 7,291 6,490
927,933 775,276
Current 927,933 775,276
Non-current - -
927,933 775,276
28 Other liabilities
30 June 31 December
2018 2017
N'million N'million
Customer deposits for letters of credit 52,730 7,768
Accounts payable 36,425 44,501
Manager's cheque 3,878 5,516
FGN Intervention fund (see note 28.1) 136,877 112,294
Payable on E-banking transactions 10,778 10,749
Other liabilites/credit balances 2,838 2,372
Payable to staff 1 -
243,527 183,200
28.1 Included in the FGN Intervention fund is CBN Bailout Fund of N94.966 billion (31 Dec 2017: N97.628 billion). This represents funds
for states in the Federation that are having challenges in meeting up with their domestic obligation including payment of salaries. The
loan was routed through the Bank for on-lending to the states. The Bailout fund is for a tenor of 20 years at 7% per annum and availed
for the same tenor at 9% per annum. Repayments are deducted at source, by the Accountant General of the Federation (AGF), as a first
line charge against each beneficiary state’s monthly statutory allocation.
117
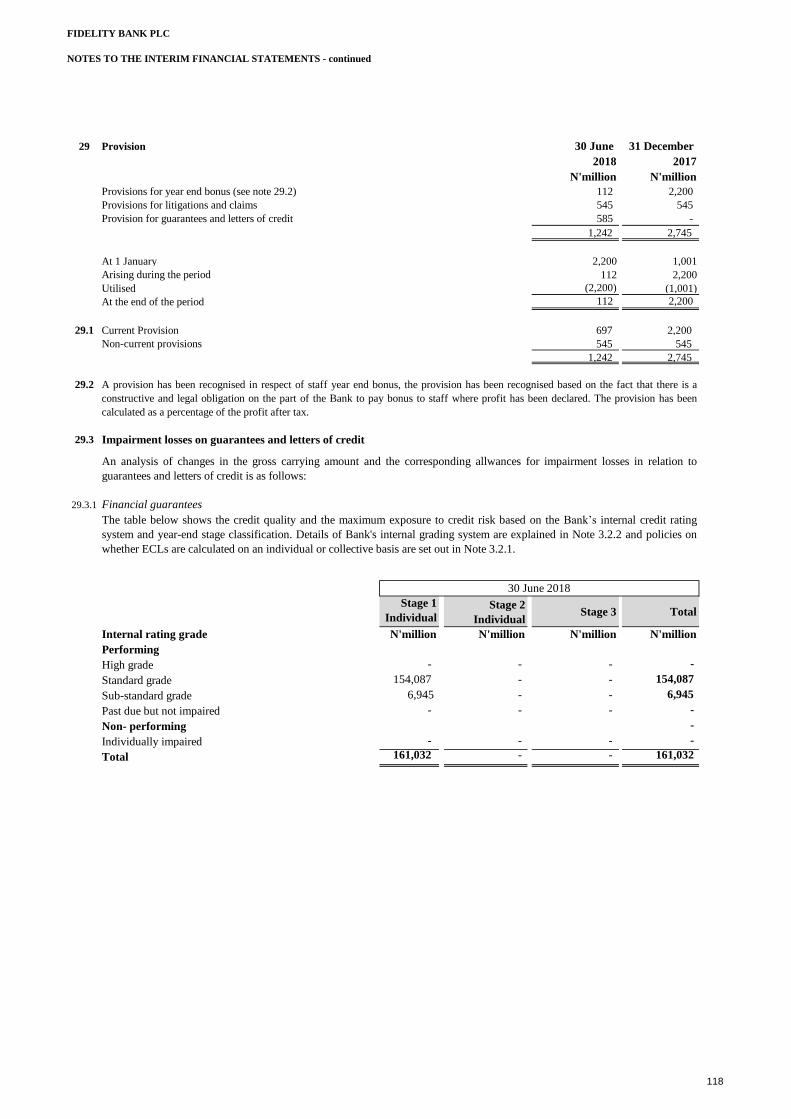
FIDELITY BANK PLC
NOTES TO THE INTERIM FINANCIAL STATEMENTS - continued
29 Provision 30 June 31 December
2018 2017
N'million N'million
Provisions for year end bonus (see note 29.2) 112 2,200
Provisions for litigations and claims 545 545
Provision for guarantees and letters of credit 585 -
1,242 2,745
At 1 January 2,200 1,001
112 2,200
Utilised (2,200) (1,001)
112 2,200
29.1 Current Provision 697 2,200
Non-current provisions 545 545
1,242 2,745
29.2
29.3 Impairment losses on guarantees and letters of credit
29.3.1 Financial guarantees
Stage 1
IndividualStage 2
IndividualStage 3 Total
Internal rating grade N'million N'million N'million N'million
Performing
High grade - - - -
Standard grade 154,087 - - 154,087
Sub-standard grade 6,945 - - 6,945
Past due but not impaired - - - -
Non- performing -
Individually impaired - - - -
Total 161,032 - - 161,032
30 June 2018
A provision has been recognised in respect of staff year end bonus, the provision has been recognised based on the fact that there is a
constructive and legal obligation on the part of the Bank to pay bonus to staff where profit has been declared. The provision has been
calculated as a percentage of the profit after tax.
Arising during the period
At the end of the period
An analysis of changes in the gross carrying amount and the corresponding allwances for impairment losses in relation to
guarantees and letters of credit is as follows:
The table below shows the credit quality and the maximum exposure to credit risk based on the Bank’s internal credit rating
system and year-end stage classification. Details of Bank's internal grading system are explained in Note 3.2.2 and policies on
whether ECLs are calculated on an individual or collective basis are set out in Note 3.2.1.
118
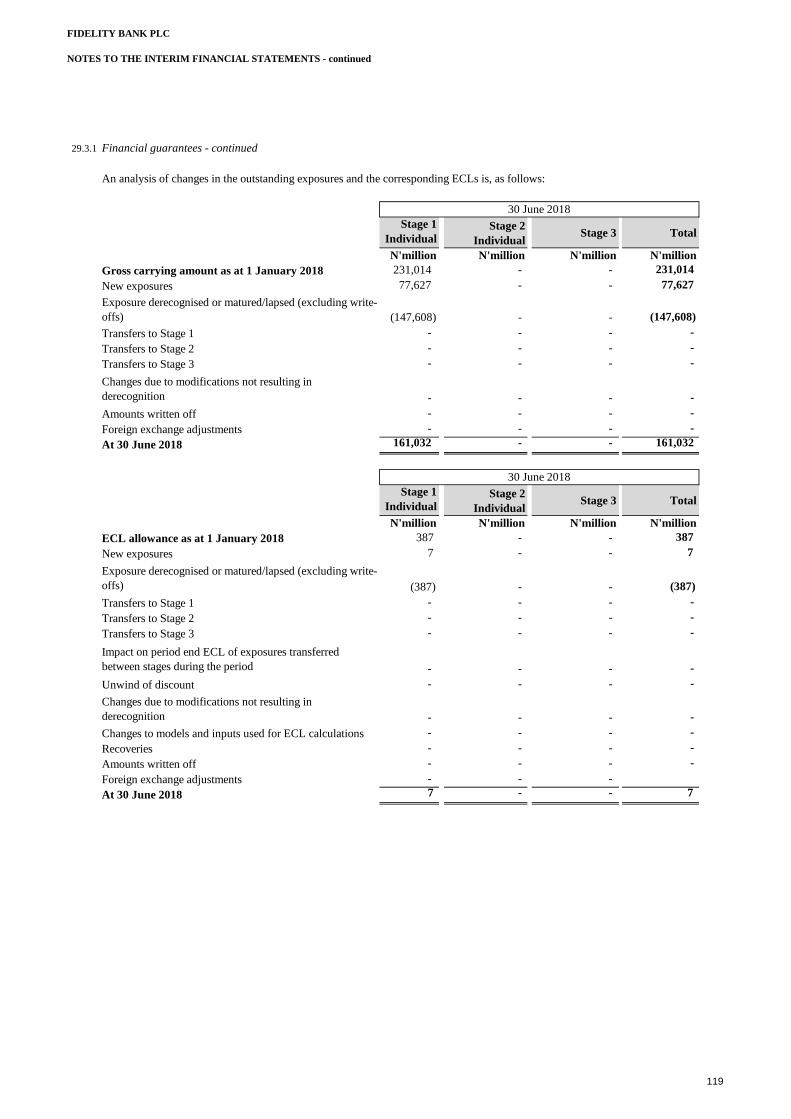
FIDELITY BANK PLC
NOTES TO THE INTERIM FINANCIAL STATEMENTS - continued
29.3.1 Financial guarantees - continued
An analysis of changes in the outstanding exposures and the corresponding ECLs is, as follows:
Stage 1
IndividualStage 2
IndividualStage 3 Total
N'million N'million N'million N'million
Gross carrying amount as at 1 January 2018 231,014 - - 231,014
New exposures 77,627 - - 77,627
(147,608) - - (147,608)
Transfers to Stage 1 - - - -
Transfers to Stage 2 - - - -
Transfers to Stage 3 - - - -
- - - -
Amounts written off - - - -
Foreign exchange adjustments - - - -
At 30 June 2018 161,032 - - 161,032
Stage 1
IndividualStage 2
IndividualStage 3 Total
N'million N'million N'million N'million
ECL allowance as at 1 January 2018 387 - - 387
New exposures 7 - - 7
(387) - - (387)
Transfers to Stage 1 - - - -
Transfers to Stage 2 - - - -
Transfers to Stage 3 - - - -
- - - -
Unwind of discount - - - -
- - - -
Changes to models and inputs used for ECL calculations - - - -
Recoveries - - - -
Amounts written off - - - -
Foreign exchange adjustments - - -
At 30 June 2018 7 - - 7
30 June 2018
30 June 2018
Changes due to modifications not resulting in
derecognition
Exposure derecognised or matured/lapsed (excluding write-
offs)
Changes due to modifications not resulting in
derecognition
Impact on period end ECL of exposures transferred
between stages during the period
Exposure derecognised or matured/lapsed (excluding write-
offs)
119
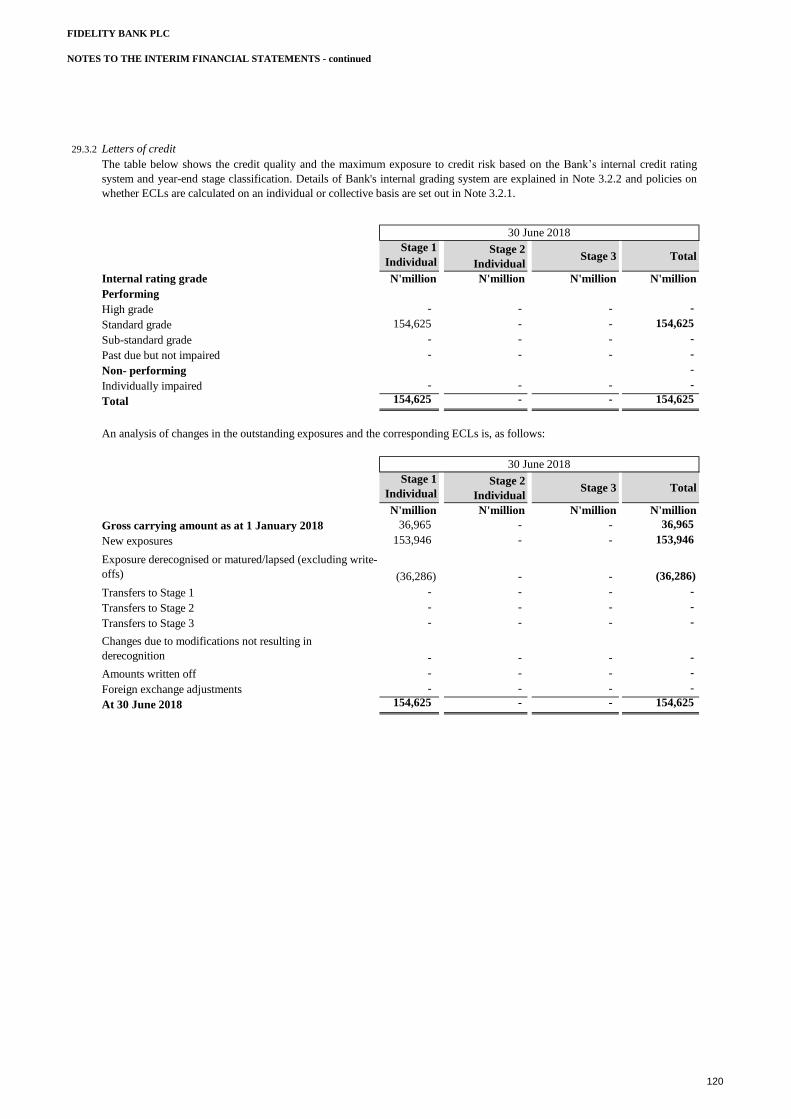
FIDELITY BANK PLC
NOTES TO THE INTERIM FINANCIAL STATEMENTS - continued
29.3.2 Letters of credit
Stage 1
IndividualStage 2
IndividualStage 3 Total
Internal rating grade N'million N'million N'million N'million
Performing
High grade - - - -
Standard grade 154,625 - - 154,625
Sub-standard grade - - - -
Past due but not impaired - - - -
Non- performing -
Individually impaired - - - -
Total 154,625 - - 154,625
An analysis of changes in the outstanding exposures and the corresponding ECLs is, as follows:
Stage 1
IndividualStage 2
IndividualStage 3 Total
N'million N'million N'million N'million
Gross carrying amount as at 1 January 2018 36,965 - - 36,965
New exposures 153,946 - - 153,946
(36,286) - - (36,286)
Transfers to Stage 1 - - - -
Transfers to Stage 2 - - - -
Transfers to Stage 3 - - - -
- - - -
Amounts written off - - - -
Foreign exchange adjustments - - - -
At 30 June 2018 154,625 - - 154,625
30 June 2018
30 June 2018
Exposure derecognised or matured/lapsed (excluding write-
offs)
Changes due to modifications not resulting in
derecognition
The table below shows the credit quality and the maximum exposure to credit risk based on the Bank’s internal credit rating
system and year-end stage classification. Details of Bank's internal grading system are explained in Note 3.2.2 and policies on
whether ECLs are calculated on an individual or collective basis are set out in Note 3.2.1.
120
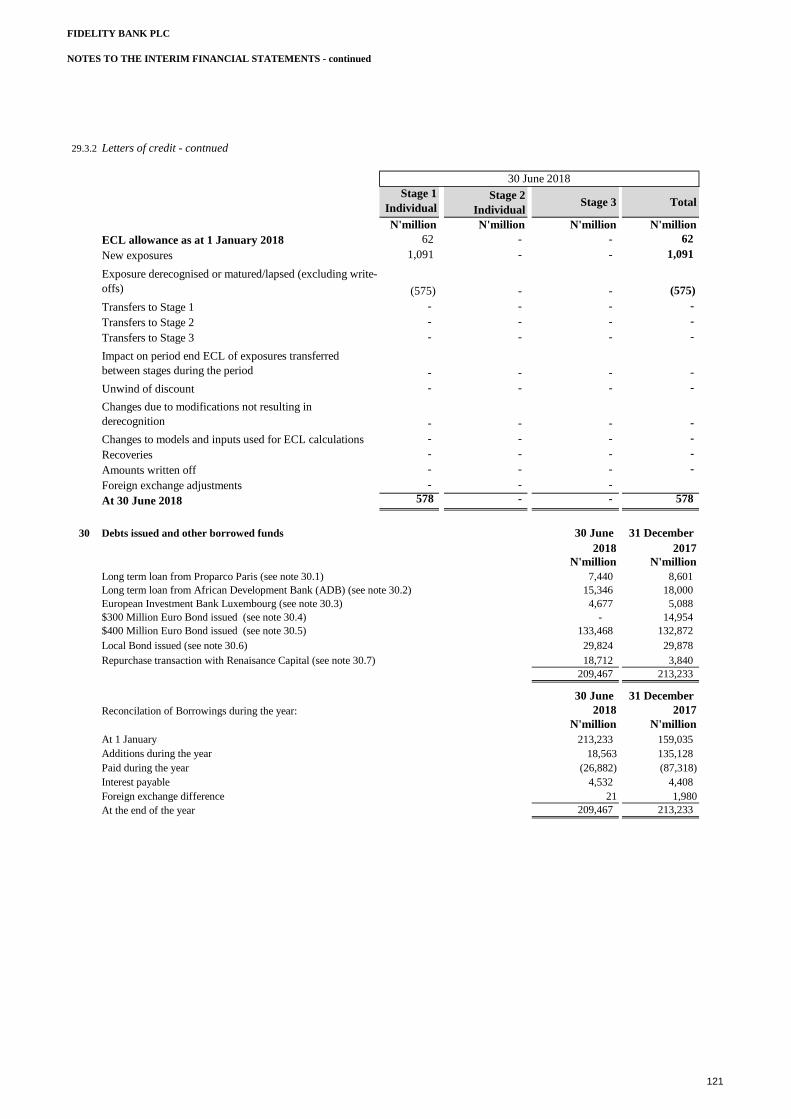
FIDELITY BANK PLC
NOTES TO THE INTERIM FINANCIAL STATEMENTS - continued
29.3.2 Letters of credit - contnued
Stage 1
IndividualStage 2
IndividualStage 3 Total
N'million N'million N'million N'million
ECL allowance as at 1 January 2018 62 - - 62
New exposures 1,091 - - 1,091
(575) - - (575)
Transfers to Stage 1 - - - -
Transfers to Stage 2 - - - -
Transfers to Stage 3 - - - -
- - - -
Unwind of discount - - - -
- - - -
Changes to models and inputs used for ECL calculations - - - -
Recoveries - - - -
Amounts written off - - - -
Foreign exchange adjustments - - -
At 30 June 2018 578 - - 578
30 Debts issued and other borrowed funds 30 June 31 December
2018 2017
N'million N'million
Long term loan from Proparco Paris (see note 30.1) 7,440 8,601
Long term loan from African Development Bank (ADB) (see note 30.2) 15,346 18,000
European Investment Bank Luxembourg (see note 30.3) 4,677 5,088
$300 Million Euro Bond issued (see note 30.4) - 14,954
$400 Million Euro Bond issued (see note 30.5) 133,468 132,872
Local Bond issued (see note 30.6) 29,824 29,878
Repurchase transaction with Renaisance Capital (see note 30.7) 18,712 3,840
209,467 213,233
30 June 31 December
Reconcilation of Borrowings during the year: 2018 2017
N'million N'million
At 1 January 213,233 159,035
Additions during the year 18,563 135,128
Paid during the year (26,882) (87,318)
Interest payable 4,532 4,408
21 1,980
209,467 213,233
Exposure derecognised or matured/lapsed (excluding write-
offs)
Changes due to modifications not resulting in
derecognition
30 June 2018
At the end of the year
Foreign exchange difference
Impact on period end ECL of exposures transferred
between stages during the period
121

FIDELITY BANK PLC
NOTES TO THE INTERIM FINANCIAL STATEMENTS - continued
30 Debts issued and other borrowed funds - continued
30.1
30.2
30.3
30.4
30.5
30.6
30.7
31 Share capital
30 June 31 December
2018 2017
Authorised N'million N'million
32 billion ordinary shares of 50k each (2017: 32 billion ordinary shares) 16,000 16,000
Issued and fully paid
28,963 million ordinary shares of 50k each (2017: 28,963 million ordinary shares) 14,481 14,481
There is no movement in the issued and fully paid shares during the period.
32 Other equity accounts
The nature and purpose of the other equity accounts are as follows:
Share premium
The amount of N7.440 billion (31 Dec 2017: N8.601 billion) represents the amortised cost balance on the syndicated on-lending facility
of $40million granted to the Bank by Proparco Paris on 4 April 2016 to mature on 4 April 2021 at an interest rate of Libor plus 4.75%
per annum. The initial loan matured on 4 April 2016 and was renewed on the same day. The Principal and Interest are repaid semi-
annually. The borrowing is an unsecured borrowing.
The amount of N15.346 billion (31 Dec 2017: N18.000 billion) represents the amortised cost balance in the on-lending facility of
$75million granted to the Bank by ADB on 6 October 2014. The first tranche of $40million was disbursed on 6 October 2014 while the
second tranche of $35million was disbursed 15 July 2015 both to mature 6 October 2021 at an interest rate of Libor plus 4.75% per
annum. Interest is repaid semi-annually, with principal repayment at maturity.The borrowing is an unsecured borrowing.
The amount of N4.677 billion (31 Dec 2017: N5.088 billion) represents the amortised cost balance in the on-lending facility of $21.946
million granted to the Bank by European Investment Bank on 13 April 2015 to mature 2 March 2023 at an interest rate of Libor plus
3.99% per annum. Interest is repaid quarterly, with principal repayment at maturity. The borrowing is an unsecured borrowing.
During the reporting period, the 5-year, 6.875% Eurobond issued at 99.48% in May 2013 by the Bank matured in May 2018. The
purpose of the debt issuance is to finance foreign currency lending to the Power and Oil sectors of the economy of Nigeria.
On 11 October 2017, Fidelity Bank PLC issued a $400 million five year Eurobond at a 10.50 percent coupon. The Bond was used to
finance the existing bondholders who subscribed to the tender offer of $256 million, while the balance (net of issuance costs) will be used
to support the trade finance business of Fidelity Bank. The issuance of the Bond was part of a strategic liability management exercise
designed to extend, Fidelity Bank's debt maturity profile and proactively refinance the maturing 2018 Eurobond. The amount of
N133.468 billion (31 Dec 2017 : N132.872 billion) represents the amortised cost of $400 million, 5- year, 10.50% Eurobond issued at
99.48% in October 2017. The principal amount is repayable in October 2022, while the coupon is paid semi annually.
The amount of N29.824 billion, (31 Dec 2017: N29.878 billion) represents the amortised cost of a N30 billion, 6.5- year, 16.48% Local
bond issued at 96.5% in May 2015. The principal amount for the Local bonds is repayable in Nov 2021. The coupon is paid semi
annually. The purpose of the Local bond issuance is to finance the SME business of the economy of Nigeria.
The amount of N18.712 billion, (31 Dec 2017: N3.840 billion) represents a $33million dollar borrowing under a repurchase agreement
from Renaissance Capital, with Fidelity Bank pledging its USD denominated Eurobond and FGN, which the Bank has the right to buy at
a later date.
Retained earnings
Premiums from the issue of shares are reported in share premium.
122

FIDELITY BANK PLC
NOTES TO THE INTERIM FINANCIAL STATEMENTS - continued
Retained earnings comprise the undistributed profits from previous years and current year, which have not been reclassified to the other
reserves noted below. 5% of 2016 & 2017 PAT (N1.43Bn) relates to AGSMEIS; Agri-Business/Small and Medium Enterprises
Investment Scheme (AGSMEIS), the AGSMEIS is maintained to support the Federal Government's effort at promoting Agricultural
businesses and Small and Medium Enterprises. Effective 2017 all Deposit Money Banks (DMBs) are required to set aside 5% of their
Profit After Tax for equity investment in permissible activities as stipulated in the scheme guidelines. The fund is domiciled with CBN.
123
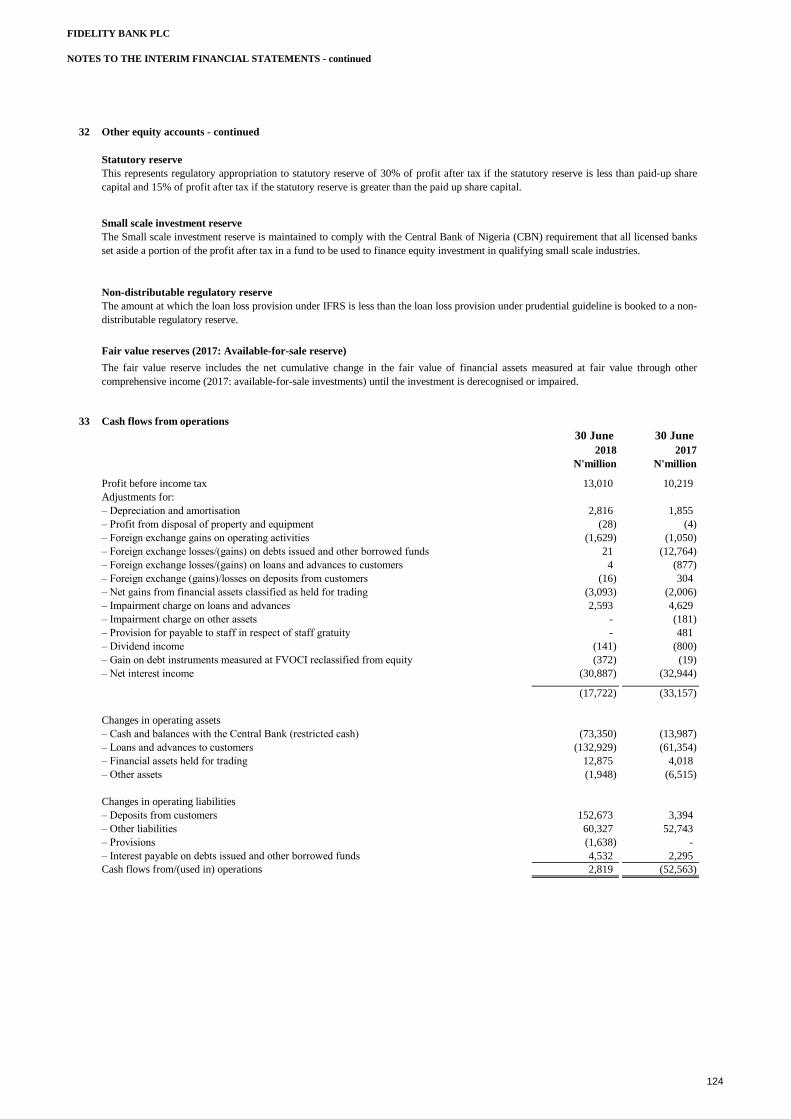
FIDELITY BANK PLC
NOTES TO THE INTERIM FINANCIAL STATEMENTS - continued
32 Other equity accounts - continued
33 Cash flows from operations
30 June 30 June
2018 2017
N'million N'million
Profit before income tax 13,010 10,219
Adjustments for:
– Depreciation and amortisation 2,816 1,855
– Profit from disposal of property and equipment (28) (4)
– Foreign exchange gains on operating activities (1,629) (1,050)
– Foreign exchange losses/(gains) on debts issued and other borrowed funds 21 (12,764)
– Foreign exchange losses/(gains) on loans and advances to customers 4 (877)
– Foreign exchange (gains)/losses on deposits from customers (16) 304
– Net gains from financial assets classified as held for trading (3,093) (2,006)
– Impairment charge on loans and advances 2,593 4,629
– Impairment charge on other assets - (181)
– Provision for payable to staff in respect of staff gratuity - 481
– Dividend income (141) (800)
– Gain on debt instruments measured at FVOCI reclassified from equity (372) (19)
– Net interest income (30,887) (32,944)
(17,722) (33,157)
Changes in operating assets
– Cash and balances with the Central Bank (restricted cash) (73,350) (13,987)
– Loans and advances to customers (132,929) (61,354)
– Financial assets held for trading 12,875 4,018
– Other assets (1,948) (6,515)
Changes in operating liabilities
– Deposits from customers 152,673 3,394
– Other liabilities 60,327 52,743
– Provisions (1,638) -
– Interest payable on debts issued and other borrowed funds 4,532 2,295
Cash flows from/(used in) operations 2,819 (52,563)
Non-distributable regulatory reserve
Fair value reserves (2017: Available-for-sale reserve)
Small scale investment reserve
The fair value reserve includes the net cumulative change in the fair value of financial assets measured at fair value through other
comprehensive income (2017: available-for-sale investments) until the investment is derecognised or impaired.
This represents regulatory appropriation to statutory reserve of 30% of profit after tax if the statutory reserve is less than paid-up share
capital and 15% of profit after tax if the statutory reserve is greater than the paid up share capital.
The Small scale investment reserve is maintained to comply with the Central Bank of Nigeria (CBN) requirement that all licensed banks
set aside a portion of the profit after tax in a fund to be used to finance equity investment in qualifying small scale industries.
The amount at which the loan loss provision under IFRS is less than the loan loss provision under prudential guideline is booked to a non-
distributable regulatory reserve.
Statutory reserve
124
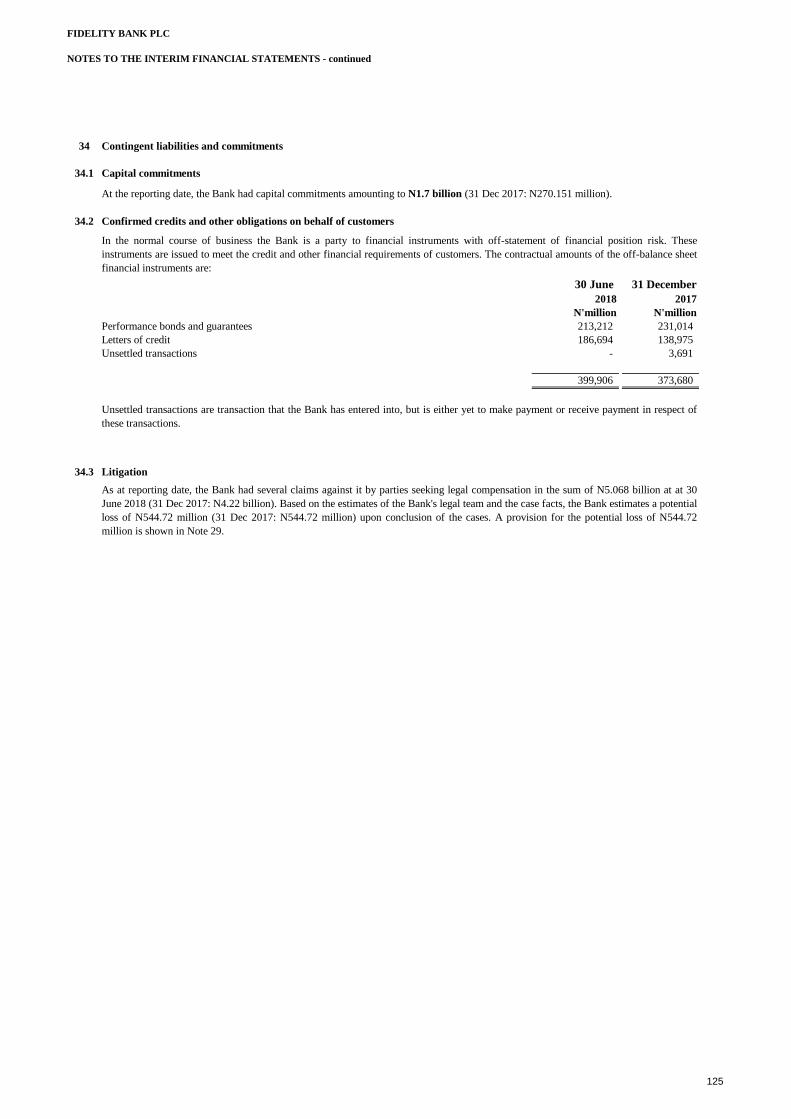
FIDELITY BANK PLC
NOTES TO THE INTERIM FINANCIAL STATEMENTS - continued
34 Contingent liabilities and commitments
34.1 Capital commitments
At the reporting date, the Bank had capital commitments amounting to N1.7 billion (31 Dec 2017: N270.151 million).
34.2 Confirmed credits and other obligations on behalf of customers
30 June 31 December
2018 2017
N'million N'million
Performance bonds and guarantees 213,212 231,014
Letters of credit 186,694 138,975
Unsettled transactions - 3,691
399,906 373,680
34.3 Litigation
As at reporting date, the Bank had several claims against it by parties seeking legal compensation in the sum of N5.068 billion at at 30
June 2018 (31 Dec 2017: N4.22 billion). Based on the estimates of the Bank's legal team and the case facts, the Bank estimates a potential
loss of N544.72 million (31 Dec 2017: N544.72 million) upon conclusion of the cases. A provision for the potential loss of N544.72
million is shown in Note 29.
Unsettled transactions are transaction that the Bank has entered into, but is either yet to make payment or receive payment in respect of
these transactions.
In the normal course of business the Bank is a party to financial instruments with off-statement of financial position risk. These
instruments are issued to meet the credit and other financial requirements of customers. The contractual amounts of the off-balance sheet
financial instruments are:
125

FIDELITY BANK PLC
NOTES TO THE INTERIM FINANCIAL STATEMENTS - continued
35 Related party transactions with Key Management Personnel
The related party transactions in respect of Entity controlled by Key Management Personnel has been disclosed in compliance with Central Bank of Nigeria circular BSD/1/2004.
35.1 Deposits/ Interest expense from related parties
Transactions with related entities
Deposits at Interest expense Deposits at Interest expense
30 June 2018 30 June 2018 31 Dec 2017 31 Dec 2017
N N N N
Geoelis and Co Nig Ltd (HM) (DP) Insider related 15,988,004 - 63,779 -
Cy Incorporated Nig Ltd (DSRA) Insider related 23,426 - 23,501 -
Equipment Solutions and Logistics Services Limited Insider related 59,371 - 48,548 -
The Genesis Restaurant Limited Insider related 4,088,186 - 1,802,850 -
Next International Insider related 22,780,536 98,094 2,402,084 98,094
Namjid. Com Limited Insider related 3,697,966 - 54,632 -
John Holt Plc Insider related 29,733,309 - 12,060,739 -
A-Z Petroleum Products Limited Insider related 1,605,118 - 2,643,014 -
Transcorp Power Limited Insider related - 9,418,999 470,949,975 9,418,999
Tower Aluminium Nigeria Plc Insider related 14,604,409 - 1,549,013 -
Tenderville Ltd Insider related - - - -
Rosies Textile Insider related 345,205 - - -
Ass. Haulages (Nig) Ltd 2 Insider related 10,153 - - -
Neconde Energy Limited Insider related 437,599,144 - -
Dangote Industries Limited Insider related 26,939,738 - -
Damos Practice Limited Insider related 12,563 - -
Alcon Nigeria Limited Insider related 12,755,035 - -
Emeka Unachukwu Insider related 26,482 - -
Congregation of Holy Spirit (Spiritan University Nneochi)Insider related 186,984 - -
SUB-TOTAL 570,455,629 9,517,093 491,598,135 9,517,093
Transactions with Key Management Personnel Insider related 837,114,499 16,418,641 792,418,921 7,746,615
TOTAL 1,407,570,128 25,935,734 1,284,017,057 17,263,709
Entity Controlled by Key
Management Personnel
Related party
125
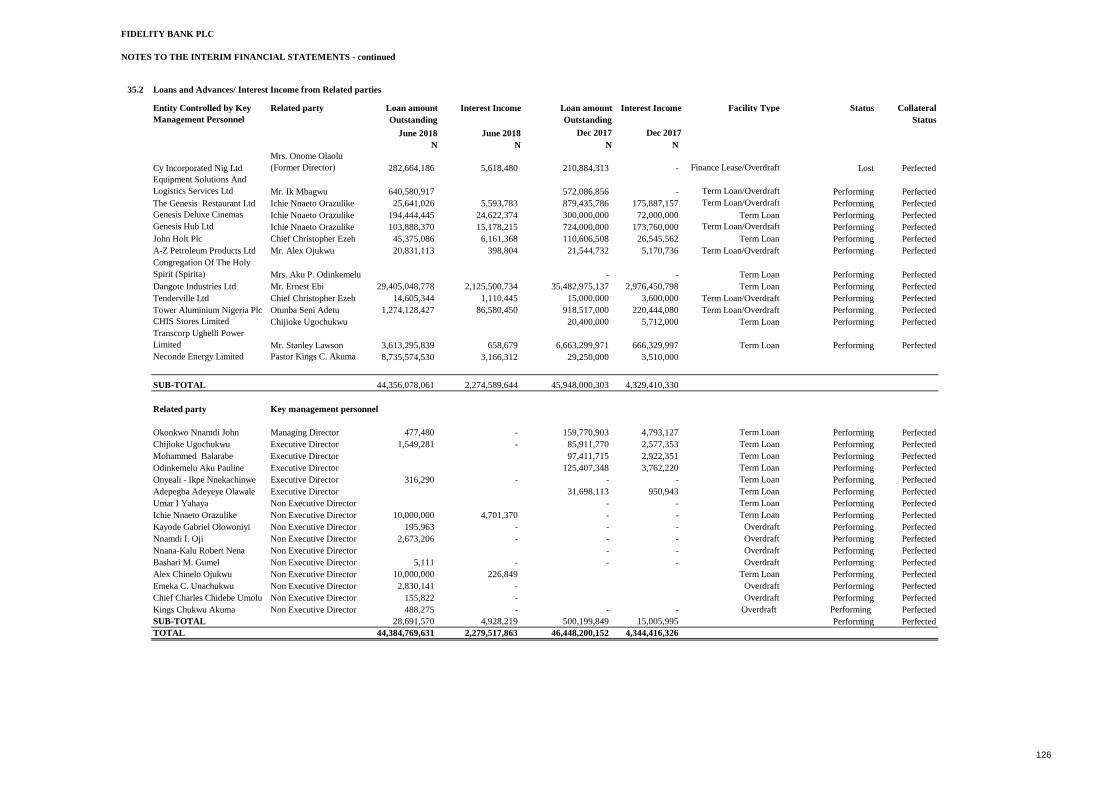
FIDELITY BANK PLC
NOTES TO THE INTERIM FINANCIAL STATEMENTS - continued
35.2 Loans and Advances/ Interest Income from Related parties
Loan amount Interest Income Loan amount Interest Income Facility Type Status Collateral
Outstanding Outstanding Status
June 2018 June 2018 Dec 2017 Dec 2017
N N N N
Cy Incorporated Nig Ltd
Mrs. Onome Olaolu
(Former Director) 282,664,186 5,618,480 210,884,313 - Finance Lease/Overdraft Lost Perfected
Equipment Solutions And
Logistics Services Ltd Mr. Ik Mbagwu 640,580,917 572,086,856 - Term Loan/Overdraft Performing Perfected
The Genesis Restaurant Ltd Ichie Nnaeto Orazulike 25,641,026 5,593,783 879,435,786 175,887,157 Term Loan/Overdraft Performing Perfected
Genesis Deluxe Cinemas Ichie Nnaeto Orazulike 194,444,445 24,622,374 300,000,000 72,000,000 Term Loan Performing Perfected
Genesis Hub Ltd Ichie Nnaeto Orazulike 103,888,370 15,178,215 724,000,000 173,760,000 Term Loan/Overdraft Performing Perfected
John Holt Plc Chief Christopher Ezeh 45,375,086 6,161,368 110,606,508 26,545,562 Term Loan Performing Perfected
A-Z Petroleum Products Ltd Mr. Alex Ojukwu 20,831,113 398,804 21,544,732 5,170,736 Term Loan/Overdraft Performing Perfected
Congregation Of The Holy
Spirit (Spirita) Mrs. Aku P. Odinkemelu - - Term Loan Performing Perfected
Dangote Industries Ltd Mr. Ernest Ebi 29,405,048,778 2,125,500,734 35,482,975,137 2,976,450,798 Term Loan Performing Perfected
Tenderville Ltd Chief Christopher Ezeh 14,605,344 1,110,445 15,000,000 3,600,000 Term Loan/Overdraft Performing Perfected
Tower Aluminium Nigeria Plc Otunba Seni Adetu 1,274,128,427 86,580,450 918,517,000 220,444,080 Term Loan/Overdraft Performing Perfected
CHIS Stores Limited Chijioke Ugochukwu 20,400,000 5,712,000 Term Loan Performing Perfected
Transcorp Ughelli Power
Limited Mr. Stanley Lawson 3,613,295,839 658,679 6,663,299,971 666,329,997 Term Loan Performing Perfected
Neconde Energy Limited Pastor Kings C. Akuma 8,735,574,530 3,166,312 29,250,000 3,510,000
SUB-TOTAL 44,356,078,061 2,274,589,644 45,948,000,303 4,329,410,330
Related party Key management personnel
Okonkwo Nnamdi John Managing Director 477,480 - 159,770,903 4,793,127 Term Loan Performing Perfected
Chijioke Ugochukwu Executive Director 1,549,281 - 85,911,770 2,577,353 Term Loan Performing Perfected
Mohammed Balarabe Executive Director 97,411,715 2,922,351 Term Loan Performing Perfected
Odinkemelu Aku Pauline Executive Director 125,407,348 3,762,220 Term Loan Performing Perfected
Onyeali - Ikpe Nnekachinwe Executive Director 316,290 - - - Term Loan Performing Perfected
Adepegba Adeyeye Olawale Executive Director 31,698,113 950,943 Term Loan Performing Perfected
Umar I Yahaya Non Executive Director - - Term Loan Performing Perfected
Ichie Nnaeto Orazulike Non Executive Director 10,000,000 4,701,370 - - Term Loan Performing Perfected
Kayode Gabriel Olowoniyi Non Executive Director 195,963 - - - Overdraft Performing Perfected
Nnamdi I. Oji Non Executive Director 2,673,206 - - - Overdraft Performing Perfected
Nnana-Kalu Robert Nena Non Executive Director - - Overdraft Performing Perfected
Bashari M. Gumel Non Executive Director 5,111 - - - Overdraft Performing Perfected
Alex Chinelo Ojukwu Non Executive Director 10,000,000 226,849 Term Loan Performing Perfected
Emeka C. Unachukwu Non Executive Director 2,830,141 - Overdraft Performing Perfected
Chief Charles Chidebe Umolu Non Executive Director 155,822 - Overdraft Performing Perfected
Kings Chukwu Akuma Non Executive Director 488,275 - - - Overdraft Performing Perfected
SUB-TOTAL 28,691,570 4,928,219 500,199,849 15,005,995 Performing Perfected
TOTAL 44,384,769,631 2,279,517,863 46,448,200,152 4,344,416,326
Entity Controlled by Key
Management Personnel
Related party
126

FIDELITY BANK PLC
NOTES TO THE INTERIM FINANCIAL STATEMENTS - continued
35.3 Bank Gurantees in favour of Key Management Personnel
June 2018
POSITION IN BANK
TOWER ALUMINIUM NIGERIA PLC BANK OF INDUSTRY OTUNBA SENI ADETU DIRECTOR 1,739,561,064
CONGREGATION OF THE HOLY SPIRIT (SPIRITAN UNIVERSITY NNEOCHI)NATIONAL UNIVERSITIES COMMISSION (NUC)ICHIE NNAETO ORAZULIKE / MRS. PAULINE ODINKEMELU FORMER DIRECTOR / EXECUTIVE DIRECTOR200,000,000
GENESIS DELUXE CINEMAS BOI ICHIE NNAETO ORAZULIKE FORMER DIRECTOR 250,000,000
2,189,561,064
December 2017
POSITION IN BANK
BANK OF INDUSTRY TOWER ALUMINIUM NIGERIA PLC OTUNBA SENI ADETU DIRECTOR 2,981,487,000
NATIONAL UNIVERSITIES COMMISSION CHRISTOPHER EZEH CHIEF CHRISTOPHER EZEH FORMER CHAIRMAN 200,000,000
NATIONAL UNIVERSITIES COMMISSION (NUC)FORMER DIRECTOR /
EXECUTIVE DIRECTOR200,000,000
BOI GENESIS DELUXE CINEMAS ICHIE NNAETO ORAZULIKE FORMER DIRECTOR 250,000,000
NIMASA MEKO NIGERIA LIMITED MRS. PAULINE ODINKEMELU EXECUTIVE DIRECTOR 1,000,000
3,632,487,000
35.4 Key management compensation
June December
2018 2017
N'million N'million
Salaries and other short-term employee benefits (Executive directors only) 139 468
Pension cost 10 19
Post-employment benefits paid- Gratuity - -
Post-employment benefits paid- Retirement - -
Other employment benefits paid 62 392
211 879
36 Employees
The number of persons employed by the Bank during the year was as follows:
Number Number
June December
2018 2017
Executive directors 5 6
Management 38 183
Non-management 2,973 3,018
3,016 3,207
The number of employees of the Bank, other than directors, who received emoluments in the following ranges (excluding pension contribtionss and certain benefits) were:
Number Number
2018 2017
N300,000 - N2,000,000 95 104
N2,000,001 - N2,800,000 5 427
N2,800,001 - N3,500,000 486 781
N3,500,001 - N6,500,000 1,533 854
N6,500,001 - N7,800,000 276 510
N7,800,001 - N10,000,000 324 218
N10,000,001 and above 297 313
3,016 3,207
NAME OF RELATED BANK DIRECTORAMOUNT
(N)
BENEFICIARY NAME RELATED ENTITY
BENEFICIARY NAME RELATED ENTITY
NAME OF RELATED BANK DIRECTORAMOUNT
(N)
CONGREGATION OF THE HOLY SPIRIT
(SPIRITAN UNIVERSITY NNEOCHI)ICHIE NNAETO ORAZULIKE / MRS. PAULINE ODINKEMELU
127

FIDELITY BANK PLC
NOTES TO THE INTERIM FINANCIAL STATEMENTS - continued
37 Directors' emoluments
Number Number
Remuneration paid to the Bank's executive and non-executive directors (excluding certain allowances) was: 2018 2017
N'million N'million
Fees and sitting allowances 78 66
Executive compensation - 273
Other director expenses 26 129
104 468
Fees and other emoluments disclosed above include amounts paid to:
Chairman 7 15
Highest paid director 102 102
The number of directors who received fees and other emoluments (excluding pension contributions and certain benefit) in the following ranges was:
Number Number
2018 2017
Below N1,000,000 - -
N1,000,000 - N2,000,000 1 -
N2,000,001 - N3,000,000 - -
N5,500,001 - and above 12 14
13 14
128
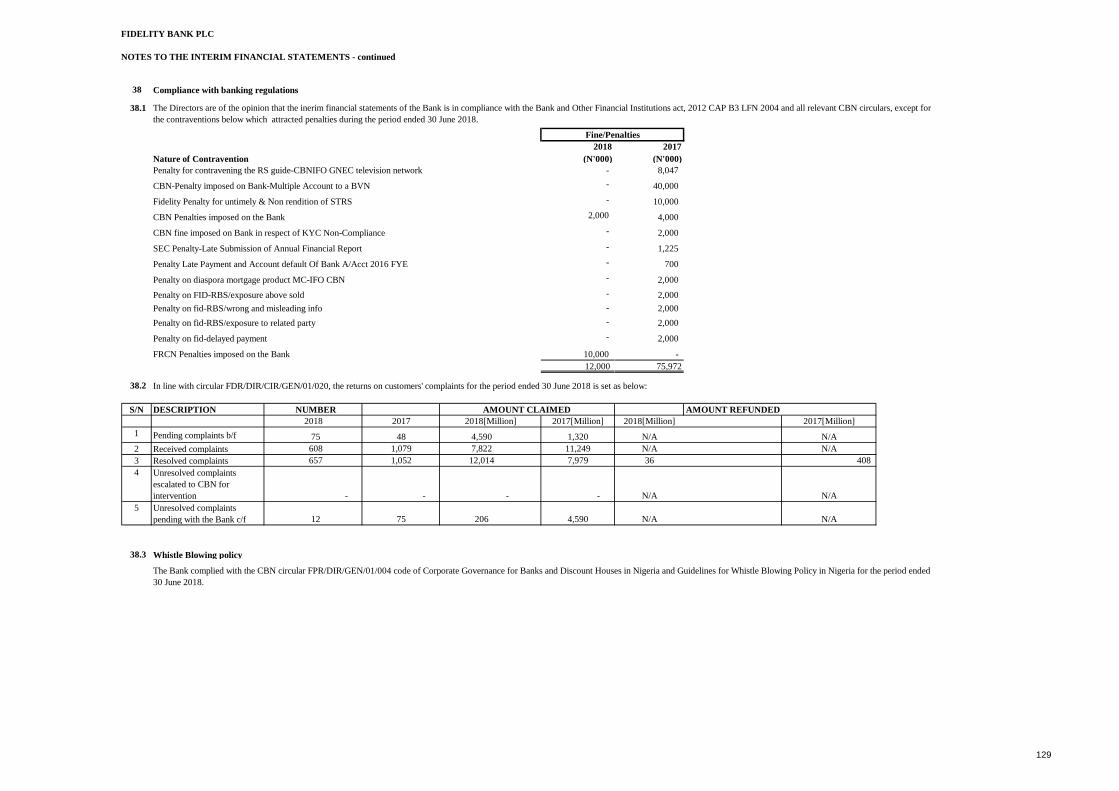
FIDELITY BANK PLC
NOTES TO THE INTERIM FINANCIAL STATEMENTS - continued
38 Compliance with banking regulations
38.1
2018 2017
Nature of Contravention (N'000) (N'000)
Penalty for contravening the RS guide-CBNIFO GNEC television network - 8,047
CBN-Penalty imposed on Bank-Multiple Account to a BVN - 40,000
Fidelity Penalty for untimely & Non rendition of STRS - 10,000
CBN Penalties imposed on the Bank 2,000 4,000
CBN fine imposed on Bank in respect of KYC Non-Compliance - 2,000
SEC Penalty-Late Submission of Annual Financial Report - 1,225
Penalty Late Payment and Account default Of Bank A/Acct 2016 FYE - 700
Penalty on diaspora mortgage product MC-IFO CBN - 2,000
Penalty on FID-RBS/exposure above sold - 2,000
Penalty on fid-RBS/wrong and misleading info - 2,000
Penalty on fid-RBS/exposure to related party - 2,000
Penalty on fid-delayed payment - 2,000
FRCN Penalties imposed on the Bank 10,000 -
12,000 75,972
38.2
S/N DESCRIPTION NUMBER AMOUNT REFUNDED
2017 2017[Million] 2018[Million] 2017[Million]
1 Pending complaints b/f 75 48 4,590 1,320 N/A N/A
2 Received complaints 608 1,079 7,822 11,249 N/A N/A
3 Resolved complaints 657 1,052 12,014 7,979 36 408
4 Unresolved complaints
escalated to CBN for
intervention - - - - N/A N/A
5 Unresolved complaints
pending with the Bank c/f 12 75 206 4,590 N/A N/A
38.3 Whistle Blowing policy
AMOUNT CLAIMED
2018[Million]2018
The Bank complied with the CBN circular FPR/DIR/GEN/01/004 code of Corporate Governance for Banks and Discount Houses in Nigeria and Guidelines for Whistle Blowing Policy in Nigeria for the period ended
30 June 2018.
In line with circular FDR/DIR/CIR/GEN/01/020, the returns on customers' complaints for the period ended 30 June 2018 is set as below:
Fine/Penalties
The Directors are of the opinion that the inerim financial statements of the Bank is in compliance with the Bank and Other Financial Institutions act, 2012 CAP B3 LFN 2004 and all relevant CBN circulars, except for
the contraventions below which attracted penalties during the period ended 30 June 2018.
129
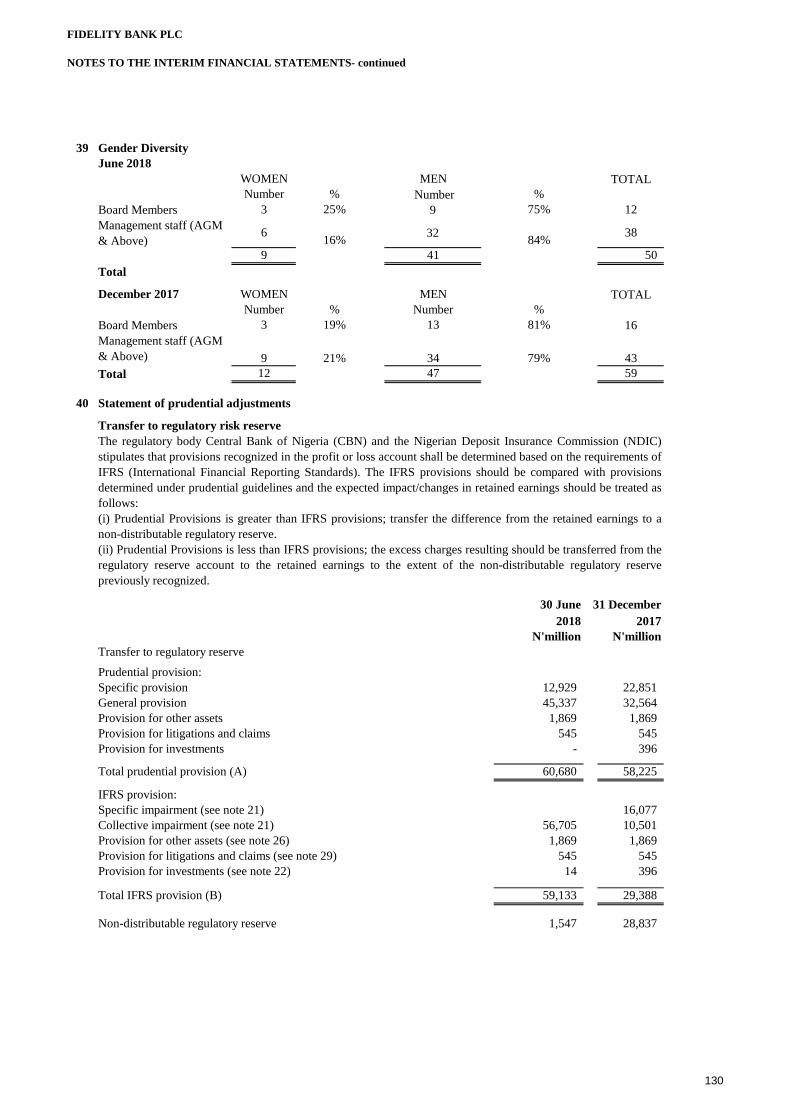
FIDELITY BANK PLC
NOTES TO THE INTERIM FINANCIAL STATEMENTS- continued
39 Gender Diversity
June 2018
WOMEN MEN TOTAL
Number % Number %
Board Members 3 25% 9 75% 12
616%
3284%
38
9 41 50
Total
December 2017 WOMEN MEN TOTAL
Number % Number %
Board Members 3 19% 13 81% 16
9 21% 34 79% 43
Total 12 47 59
40 Statement of prudential adjustments
30 June 31 December
2018 2017
N'million N'million
Transfer to regulatory reserve
Prudential provision:
Specific provision 12,929 22,851
General provision 45,337 32,564
Provision for other assets 1,869 1,869
Provision for litigations and claims 545 545
Provision for investments - 396
Total prudential provision (A) 60,680 58,225
IFRS provision:
Specific impairment (see note 21) 16,077
Collective impairment (see note 21) 56,705 10,501
Provision for other assets (see note 26) 1,869 1,869
Provision for litigations and claims (see note 29) 545 545
Provision for investments (see note 22) 14 396
Total IFRS provision (B) 59,133 29,388
1,547 28,837 Non-distributable regulatory reserve
Transfer to regulatory risk reserve
The regulatory body Central Bank of Nigeria (CBN) and the Nigerian Deposit Insurance Commission (NDIC)
stipulates that provisions recognized in the profit or loss account shall be determined based on the requirements of
IFRS (International Financial Reporting Standards). The IFRS provisions should be compared with provisions
determined under prudential guidelines and the expected impact/changes in retained earnings should be treated as
follows:
(i) Prudential Provisions is greater than IFRS provisions; transfer the difference from the retained earnings to a
non-distributable regulatory reserve.
(ii) Prudential Provisions is less than IFRS provisions; the excess charges resulting should be transferred from the
regulatory reserve account to the retained earnings to the extent of the non-distributable regulatory reserve
previously recognized.
Management staff (AGM
& Above)
Management staff (AGM
& Above)
130
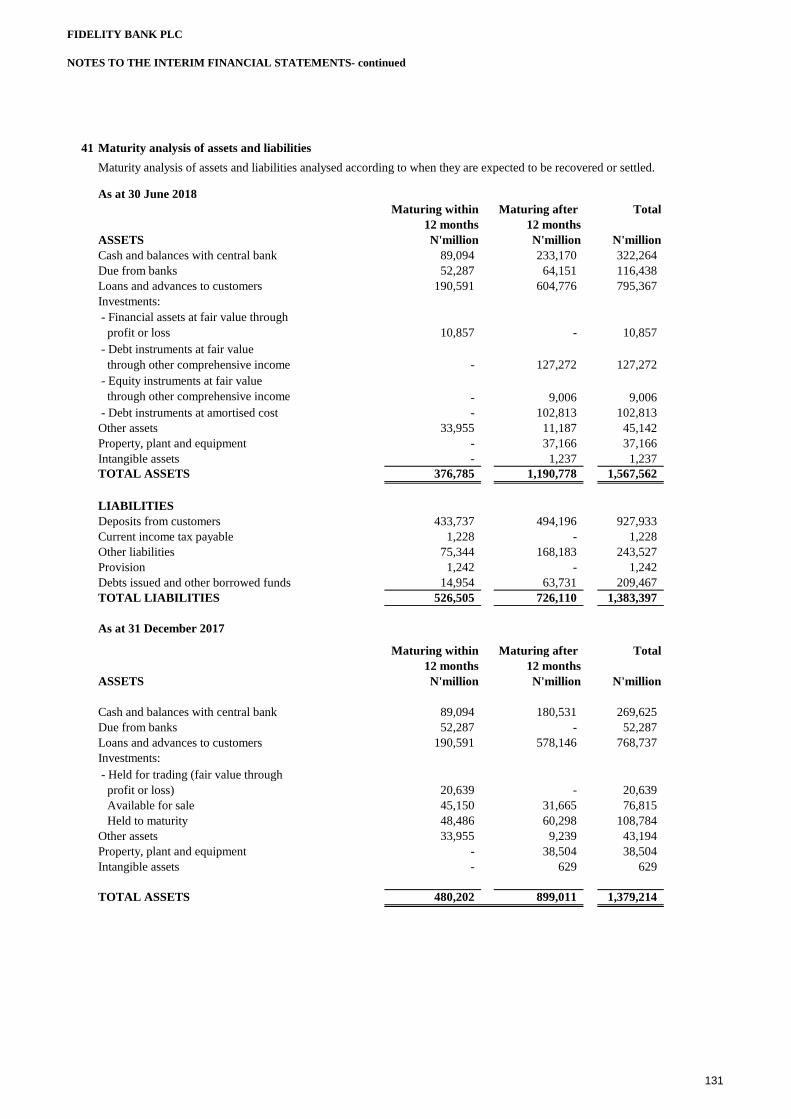
FIDELITY BANK PLC
NOTES TO THE INTERIM FINANCIAL STATEMENTS- continued
41 Maturity analysis of assets and liabilities
Maturity analysis of assets and liabilities analysed according to when they are expected to be recovered or settled.
As at 30 June 2018
Maturing within Maturing after Total
12 months 12 months
ASSETS N'million N'million N'million
Cash and balances with central bank 89,094 233,170 322,264
Due from banks 52,287 64,151 116,438
Loans and advances to customers 190,591 604,776 795,367
Investments:
10,857 - 10,857
- 127,272 127,272
- 9,006 9,006
- Debt instruments at amortised cost - 102,813 102,813
Other assets 33,955 11,187 45,142
Property, plant and equipment - 37,166 37,166
Intangible assets - 1,237 1,237
TOTAL ASSETS 376,785 1,190,778 1,567,562
LIABILITIES
Deposits from customers 433,737 494,196 927,933
Current income tax payable 1,228 - 1,228
Other liabilities 75,344 168,183 243,527
Provision 1,242 - 1,242
Debts issued and other borrowed funds 14,954 63,731 209,467
TOTAL LIABILITIES 526,505 726,110 1,383,397
As at 31 December 2017
Maturing within Maturing after Total
12 months 12 months
ASSETS N'million N'million N'million
Cash and balances with central bank 89,094 180,531 269,625
Due from banks 52,287 - 52,287
Loans and advances to customers 190,591 578,146 768,737
Investments:
20,639 - 20,639
Available for sale 45,150 31,665 76,815
Held to maturity 48,486 60,298 108,784
Other assets 33,955 9,239 43,194
Property, plant and equipment - 38,504 38,504
Intangible assets - 629 629
TOTAL ASSETS 480,202 899,011 1,379,214
- Held for trading (fair value through
profit or loss)
- Debt instruments at fair value
through other comprehensive income
- Equity instruments at fair value
through other comprehensive income
- Financial assets at fair value through
profit or loss
131
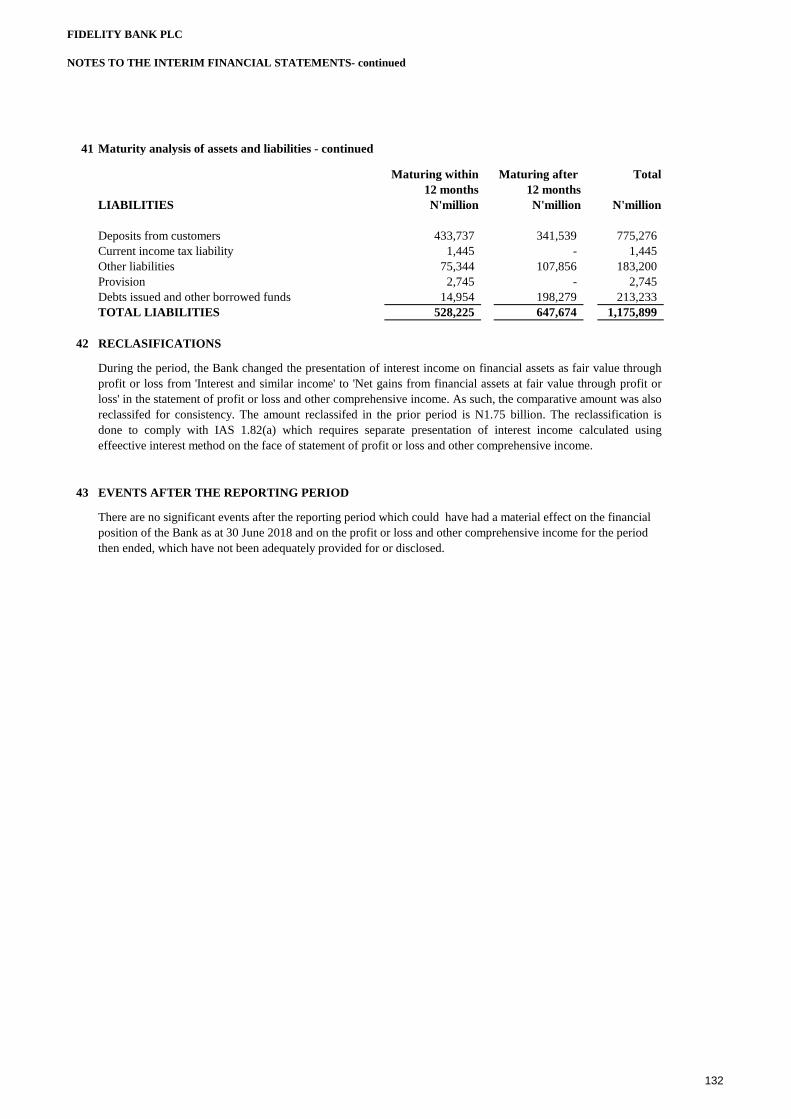
FIDELITY BANK PLC
NOTES TO THE INTERIM FINANCIAL STATEMENTS- continued
41 Maturity analysis of assets and liabilities - continued
Maturing within Maturing after Total
12 months 12 months
LIABILITIES N'million N'million N'million
Deposits from customers 433,737 341,539 775,276
Current income tax liability 1,445 - 1,445
Other liabilities 75,344 107,856 183,200
Provision 2,745 - 2,745
Debts issued and other borrowed funds 14,954 198,279 213,233
TOTAL LIABILITIES 528,225 647,674 1,175,899
42 RECLASIFICATIONS
43 EVENTS AFTER THE REPORTING PERIOD
There are no significant events after the reporting period which could have had a material effect on the financial
position of the Bank as at 30 June 2018 and on the profit or loss and other comprehensive income for the period
then ended, which have not been adequately provided for or disclosed.
During the period, the Bank changed the presentation of interest income on financial assets as fair value through
profit or loss from 'Interest and similar income' to 'Net gains from financial assets at fair value through profit or
loss' in the statement of profit or loss and other comprehensive income. As such, the comparative amount was also
reclassifed for consistency. The amount reclassifed in the prior period is N1.75 billion. The reclassification is
done to comply with IAS 1.82(a) which requires separate presentation of interest income calculated using
effeective interest method on the face of statement of profit or loss and other comprehensive income.
132
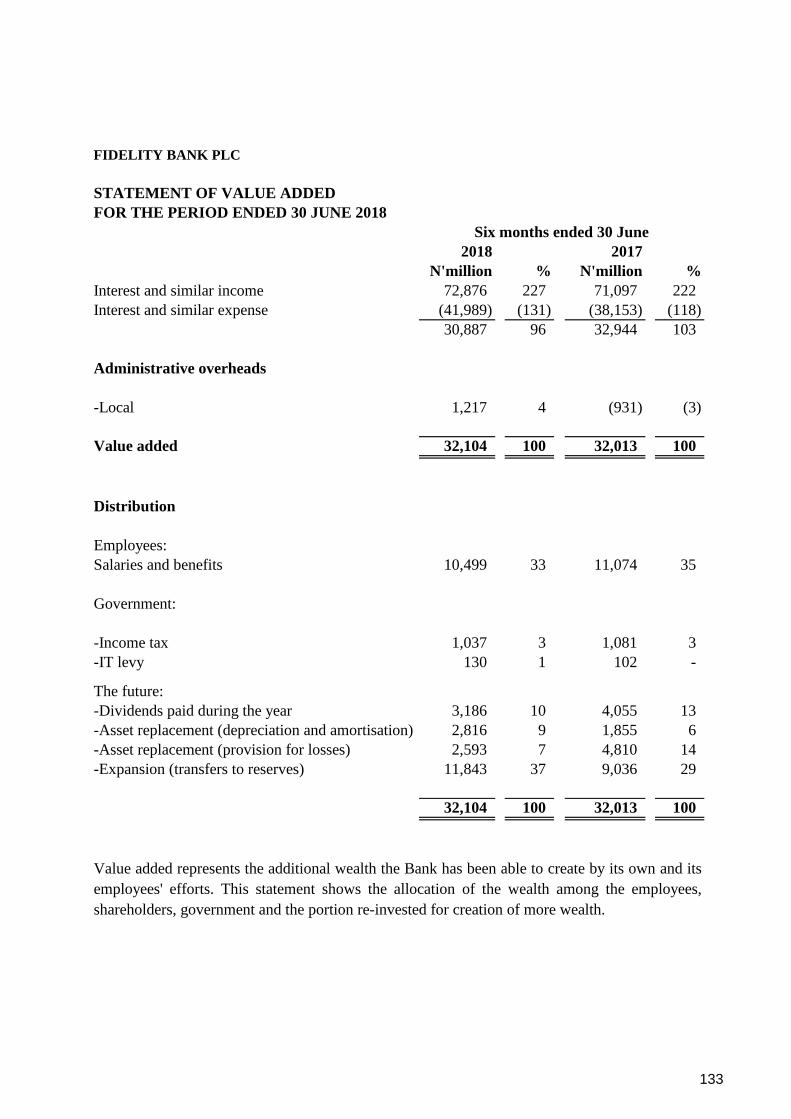
FIDELITY BANK PLC
STATEMENT OF VALUE ADDED
FOR THE PERIOD ENDED 30 JUNE 2018
2018 2017
N'million % N'million %
Interest and similar income 72,876 227 71,097 222
Interest and similar expense (41,989) (131) (38,153) (118)
30,887 96 32,944 103
Administrative overheads
-Local 1,217 4 (931) (3)
Value added 32,104 100 32,013 100
Distribution
Employees:
Salaries and benefits 10,499 33 11,074 35
Government:
-Income tax 1,037 3 1,081 3
-IT levy 130 1 102 -
The future:
-Dividends paid during the year 3,186 10 4,055 13
-Asset replacement (depreciation and amortisation) 2,816 9 1,855 6
-Asset replacement (provision for losses) 2,593 7 4,810 14
-Expansion (transfers to reserves) 11,843 37 9,036 29
32,104 100 32,013 100
Six months ended 30 June
Value added represents the additional wealth the Bank has been able to create by its own and its
employees' efforts. This statement shows the allocation of the wealth among the employees,
shareholders, government and the portion re-invested for creation of more wealth.
133
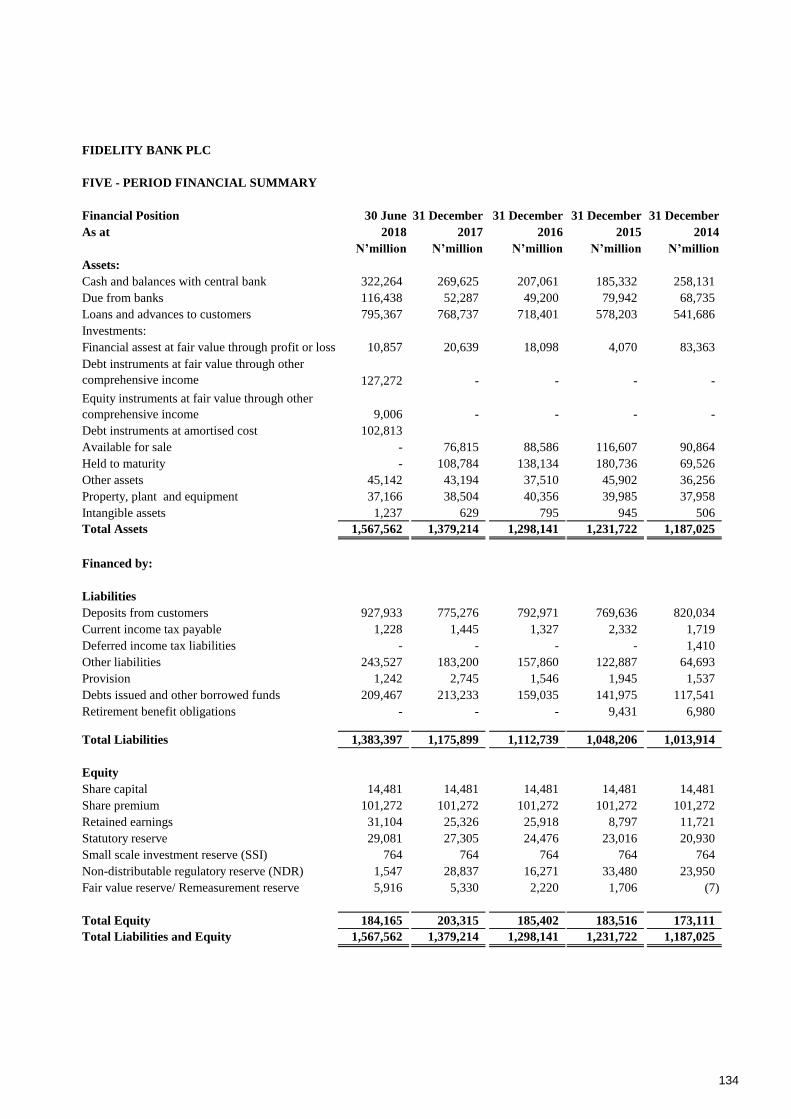
FIDELITY BANK PLC
FIVE - PERIOD FINANCIAL SUMMARY
Financial Position 30 June 31 December 31 December 31 December 31 December
As at 2018 2017 2016 2015 2014
N’million N’million N’million N’million N’million
Assets:
Cash and balances with central bank 322,264 269,625 207,061 185,332 258,131
Due from banks 116,438 52,287 49,200 79,942 68,735
Loans and advances to customers 795,367 768,737 718,401 578,203 541,686
Investments:
10,857 20,639 18,098 4,070 83,363
127,272 - - - -
9,006 - - - -
102,813
- 76,815 88,586 116,607 90,864
Held to maturity - 108,784 138,134 180,736 69,526
Other assets 45,142 43,194 37,510 45,902 36,256
Property, plant and equipment 37,166 38,504 40,356 39,985 37,958
Intangible assets 1,237 629 795 945 506
Total Assets 1,567,562 1,379,214 1,298,141 1,231,722 1,187,025
Financed by:
Liabilities
Deposits from customers 927,933 775,276 792,971 769,636 820,034
Current income tax payable 1,228 1,445 1,327 2,332 1,719
Deferred income tax liabilities - - - - 1,410
Other liabilities 243,527 183,200 157,860 122,887 64,693
Provision 1,242 2,745 1,546 1,945 1,537
Debts issued and other borrowed funds 209,467 213,233 159,035 141,975 117,541
Retirement benefit obligations - - - 9,431 6,980
Total Liabilities 1,383,397 1,175,899 1,112,739 1,048,206 1,013,914
Equity
Share capital 14,481 14,481 14,481 14,481 14,481
Share premium 101,272 101,272 101,272 101,272 101,272
Retained earnings 31,104 25,326 25,918 8,797 11,721
Statutory reserve 29,081 27,305 24,476 23,016 20,930
Small scale investment reserve (SSI) 764 764 764 764 764
Non-distributable regulatory reserve (NDR) 1,547 28,837 16,271 33,480 23,950
Fair value reserve/ Remeasurement reserve 5,916 5,330 2,220 1,706 (7)
Total Equity 184,165 203,315 185,402 183,516 173,111
Total Liabilities and Equity 1,567,562 1,379,214 1,298,141 1,231,722 1,187,025
Financial assest at fair value through profit or loss
Debt instruments at fair value through other
comprehensive income
Equity instruments at fair value through other
comprehensive income
Debt instruments at amortised cost
Available for sale
134
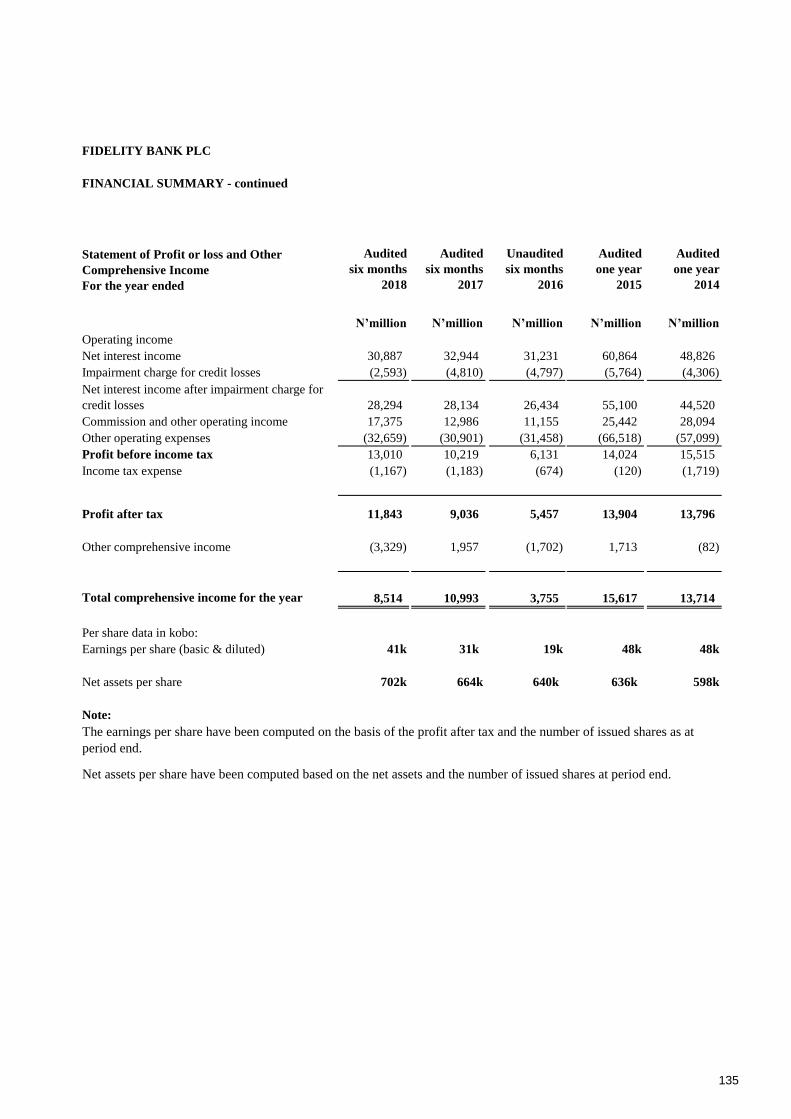
FIDELITY BANK PLC
FINANCIAL SUMMARY - continued
Audited
six months
2018
Audited
six months
2017
Unaudited
six months
2016
Audited
one year
2015
Audited
one year
2014
N’million N’million N’million N’million N’million
Operating income
Net interest income 30,887 32,944 31,231 60,864 48,826
Impairment charge for credit losses (2,593) (4,810) (4,797) (5,764) (4,306)
28,294 28,134 26,434 55,100 44,520
Commission and other operating income 17,375 12,986 11,155 25,442 28,094
Other operating expenses (32,659) (30,901) (31,458) (66,518) (57,099)
Profit before income tax 13,010 10,219 6,131 14,024 15,515
Income tax expense (1,167) (1,183) (674) (120) (1,719)
Profit after tax 11,843 9,036 5,457 13,904 13,796
Other comprehensive income (3,329) 1,957 (1,702) 1,713 (82)
8,514 10,993 3,755 15,617 13,714
Per share data in kobo:
Earnings per share (basic & diluted) 41k 31k 19k 48k 48k
Net assets per share 702k 664k 640k 636k 598k
Note:
The earnings per share have been computed on the basis of the profit after tax and the number of issued shares as at
period end.
Net assets per share have been computed based on the net assets and the number of issued shares at period end.
Total comprehensive income for the year
Net interest income after impairment charge for
credit losses
Statement of Profit or loss and Other
Comprehensive Income
For the year ended
135

136

137