Fiber Repositioning System NanoDrop December 11, 2006 Chris Czech Charles Dielmann Mark Howe Dana...
30
Fiber Repositioning Fiber Repositioning System System NanoDrop NanoDrop December 11, 2006 December 11, 2006 Chris Czech Charles Dielmann Mark Howe Dana Kimpton Christopher Sherman
-
date post
19-Dec-2015 -
Category
Documents
-
view
214 -
download
0
Transcript of Fiber Repositioning System NanoDrop December 11, 2006 Chris Czech Charles Dielmann Mark Howe Dana...

Fiber Repositioning Fiber Repositioning SystemSystem
NanoDropNanoDropDecember 11, 2006December 11, 2006
Chris CzechCharles DielmannMark HoweDana KimptonChristopher
Sherman

Who is NanoDrop?Who is NanoDrop?
Manufacture and sell analytical Manufacture and sell analytical laboratory equipment worldwidelaboratory equipment worldwide
Used in biotechnology, Used in biotechnology, pharmaceutical, and life science pharmaceutical, and life science fieldsfields
ND-1000 Spectrophotometer is best ND-1000 Spectrophotometer is best known small liquid sample known small liquid sample instrumentinstrument

The ND-1000The ND-1000
Uses a flash lamp, Uses a flash lamp, photospectrometephotospectrometer and proprietary r and proprietary software to software to quantify nucleic quantify nucleic acid, protein, and acid, protein, and other biological other biological compound liquid compound liquid samplessamples

Current OperationCurrent Operation Requires manual labor to reposition Requires manual labor to reposition
the fibers and place the samplethe fibers and place the sample Sample is loaded in the open Sample is loaded in the open
positionposition Sample is tested in the closed Sample is tested in the closed
positionposition 96 samples analyzed in a typical96 samples analyzed in a typical test test
setset
Open Position
Closed Position

Current OperationCurrent Operation1 to 2 uL sample loading, liquid 1 to 2 uL sample loading, liquid column formed for test, sample column formed for test, sample
wiped clean for next test wiped clean for next test

Project PurposeProject Purpose Purpose: To expand customer market by
eliminating human interaction to test samples by automating the ND-1000 and using a liquid handling robot to place the samples
Objective: Miniaturize and automate the ND-1000's operations for integration into a robotic testing environment.
Secondary Objective: Allow for future Secondary Objective: Allow for future development of a liquid sample wiping development of a liquid sample wiping system within the design.system within the design.

Customer WantsCustomer Wants
Repeatable vertical and horizontal Repeatable vertical and horizontal alignment alignment
No unprotected fibers that could No unprotected fibers that could interfere with motion of robotinterfere with motion of robot
Compatible with LabviewCompatible with Labview Potential for future liquid sample Potential for future liquid sample
wiping systemwiping system Ease of loading the liquid sampleEase of loading the liquid sample

Project MetricsProject Metrics
1) Repeatability: within 1/1001) Repeatability: within 1/100thth of an inch of an inch vertical and horizontal alignmentvertical and horizontal alignment
2) Distance between top and bottom 2) Distance between top and bottom pedestals:pedestals:
2/10,0002/10,000thth of an inch of an inch
3) Miniaturize: base dimensions to match 3) Miniaturize: base dimensions to match the the footprint of a 96 well uL sample footprint of a 96 well uL sample plateplate

Design ConceptDesign ConceptLinear-Actuated Translating Arm
DesignUpper arm assembly kept down close to the rest of the device, not rotated into path of robot.
Uses a linear actuator to provide back and forth motion suited to addition of a wiping system.

Subsystem DesignSubsystem Design
Five subsystems within the overall Five subsystems within the overall designdesign
Each is critical to the success of the Each is critical to the success of the designdesign

Housing SubsystemHousing Subsystem
Dimensions: 5” long 3.5” wide 4” tall
Houses circuit boards and spectrometer
Mechanism components mounted on top.

Lamp and Lamp Lamp and Lamp MountingMounting
Keeps center of gravity over linear actuator.
Arm mounts to actuator via existing holes in actuator slide.
End of arm has rolled edge for fiber protection.

Arm Movement and Arm Movement and AlignmentAlignment
Flash Lamp attached to linear actuator via arm.
Total of three inches of travel for loading and wiping cycle.
Upper Sample Pedestal / Fiber

Lower Arm AssemblyLower Arm Assembly
Moved by solenoid
Uses ball slide assembly to allow vertical motion while constraining other degrees of freedom.
Lower Sample Pedestal

Control and Data Control and Data AcquisitionAcquisition
Controlled via Labview software.
Communicates via USB.
Actuator controlled by Allmotion component.Lower arm assembly and lamp controlled by Spectrometer.

Wiping SystemWiping System
Suggested possible design for future development
Continuous strip of material pulled forward by hook on arm
Prototype includes a pair of pads for temporary wiping system.

Completed AssemblyCompleted AssemblyPicture (left) of Upper Arm assembly in sample testing (middle) position
Picture (right) of Housing assembly

Video of PrototypeVideo of Prototype

Prototype ValidationPrototype Validation
Two validation tests performed to Two validation tests performed to determine the accuracy of the prototype determine the accuracy of the prototype in the x, y, and z alignment of pedestalsin the x, y, and z alignment of pedestals Test 1: alignment pin used to determine the Test 1: alignment pin used to determine the
accuracy in the x and y directions (dropped accuracy in the x and y directions (dropped through bushings)through bushings)
Test 2: capacitance meter used to Test 2: capacitance meter used to determine the accuracy in the z directiondetermine the accuracy in the z direction
Third test to determine the signal Third test to determine the signal strength through the samplestrength through the sample

Data AnalysisData Analysis Test 1: 96 trialsTest 1: 96 trials
Alignment pin slid through two bushings 96 out of Alignment pin slid through two bushings 96 out of 96 times without adjustment96 times without adjustment
100% accuracy in the x and y directions100% accuracy in the x and y directions Test 2: 48 trialsTest 2: 48 trials
Reference voltage for 0.2 mm: 4.0 Reference voltage for 0.2 mm: 4.0 Average voltage: 4.057 Average voltage: 4.057 Required range: 3.8-4.2 to be within 1/100Required range: 3.8-4.2 to be within 1/100thth of a of a
mmmm Well within rangeWell within range
Signal test: 24 trials for each solenoid Signal test: 24 trials for each solenoid positionposition Most accurate when the solenoid in down position Most accurate when the solenoid in down position
(compared to the up position)(compared to the up position) Standard deviation between signals: 40.0Standard deviation between signals: 40.0
Due to variation in size of the sample tested (close to 1 Due to variation in size of the sample tested (close to 1 microliter)microliter)

Cost AnalysisCost Analysis
Total cost: $3,874Total cost: $3,874 Total UD cost: $959Total UD cost: $959

Path ForwardPath Forward
Deliver prototype to NanoDrop on Friday (December 15, 2006)
This marks end of team involvement
Continued development of the wiping system by NanoDrop
Modifications to design to make it easier to mass produce
Integration testing with a laboratory robot

Questions?Questions?

Benefit to CompanyBenefit to Company
Appeal to a broader range of Appeal to a broader range of customers by eliminating human customers by eliminating human interaction when testing samplesinteraction when testing samples
Automated instrument integrates Automated instrument integrates with x-y-z robot used to dispense with x-y-z robot used to dispense samplessamples

Labview Main ControllerLabview Main Controller

Testing Procedure 1Testing Procedure 1 Test 1: x-y alignment accuracyTest 1: x-y alignment accuracy
Remove fiber optics from bushings.Remove fiber optics from bushings. Start actuator motion.Start actuator motion. Pause motion at testing position.Pause motion at testing position. Drop alignment pin (0.125” diameter through top Drop alignment pin (0.125” diameter through top
bushing (0.126” diameter).bushing (0.126” diameter). If alignment pin does not drop through bottom If alignment pin does not drop through bottom
bushing, loosen screws that attach the solenoid to bushing, loosen screws that attach the solenoid to the base until pin drops through. Tighten pins in the base until pin drops through. Tighten pins in this new position. this new position.
Record whether pin dropped without adjustment Record whether pin dropped without adjustment or if adjustment was needed.or if adjustment was needed.
Resume motion of actuator.Resume motion of actuator. Repeat 96 times to simulate a typical testing set.Repeat 96 times to simulate a typical testing set.
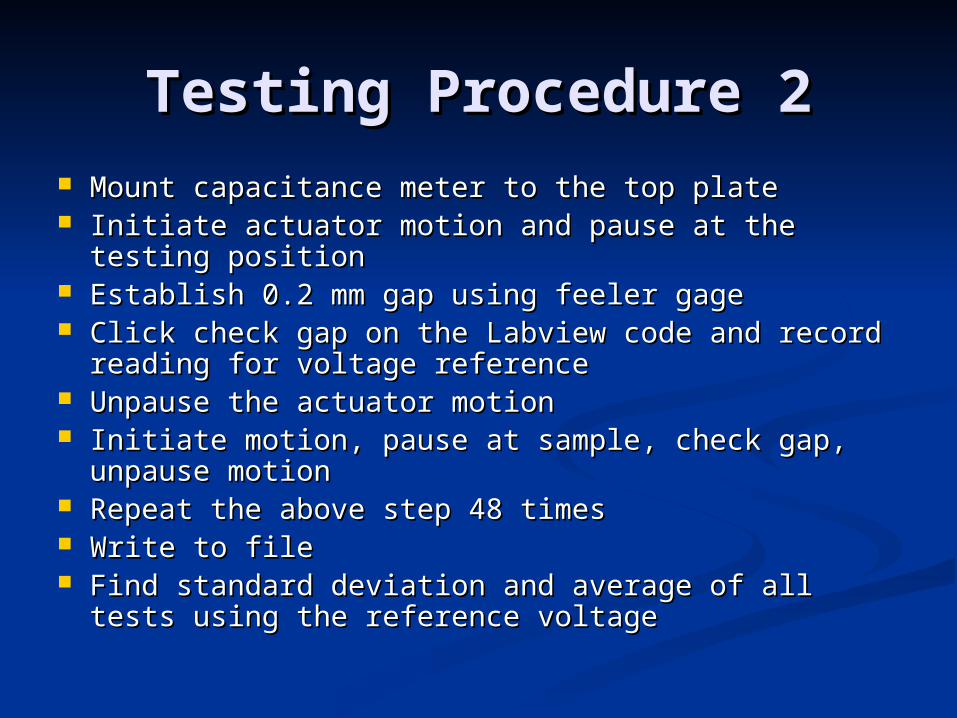
Testing Procedure 2Testing Procedure 2 Mount capacitance meter to the top plateMount capacitance meter to the top plate Initiate actuator motion and pause at the testing Initiate actuator motion and pause at the testing
positionposition Establish 0.2 mm gap using feeler gageEstablish 0.2 mm gap using feeler gage Click check gap on the Labview code and record Click check gap on the Labview code and record
reading for voltage referencereading for voltage reference Unpause the actuator motionUnpause the actuator motion Initiate motion, pause at sample, check gap, unpause Initiate motion, pause at sample, check gap, unpause
motionmotion Repeat the above step 48 timesRepeat the above step 48 times Write to fileWrite to file Find standard deviation and average of all tests Find standard deviation and average of all tests
using the reference voltage using the reference voltage

Signal Strength TestSignal Strength Test 24 tests run with water sample 24 tests run with water sample
Place sample on bottom pedestal in popped up Place sample on bottom pedestal in popped up positionposition
Record the signal strength from the Record the signal strength from the photospectrometerphotospectrometer
24 tests run with water sample24 tests run with water sample Place sample on bottom pedestal in popped down Place sample on bottom pedestal in popped down
positionposition Record the signal strength from the Record the signal strength from the
photospectrometerphotospectrometer 20 tests run without water sample in popped 20 tests run without water sample in popped
down positiondown position Find the standard deviation of the testsFind the standard deviation of the tests

Exploded View of Exploded View of PrototypePrototype

Flow ChartFlow Chart