Fiber By: Team Yellow September 15,2010 Forensic Application of Fluorescence.
15
Fiber By: Team Yellow September 15,2010 Forensic Application of Fluorescence
-
Upload
florence-wilkinson -
Category
Documents
-
view
216 -
download
3
Transcript of Fiber By: Team Yellow September 15,2010 Forensic Application of Fluorescence.
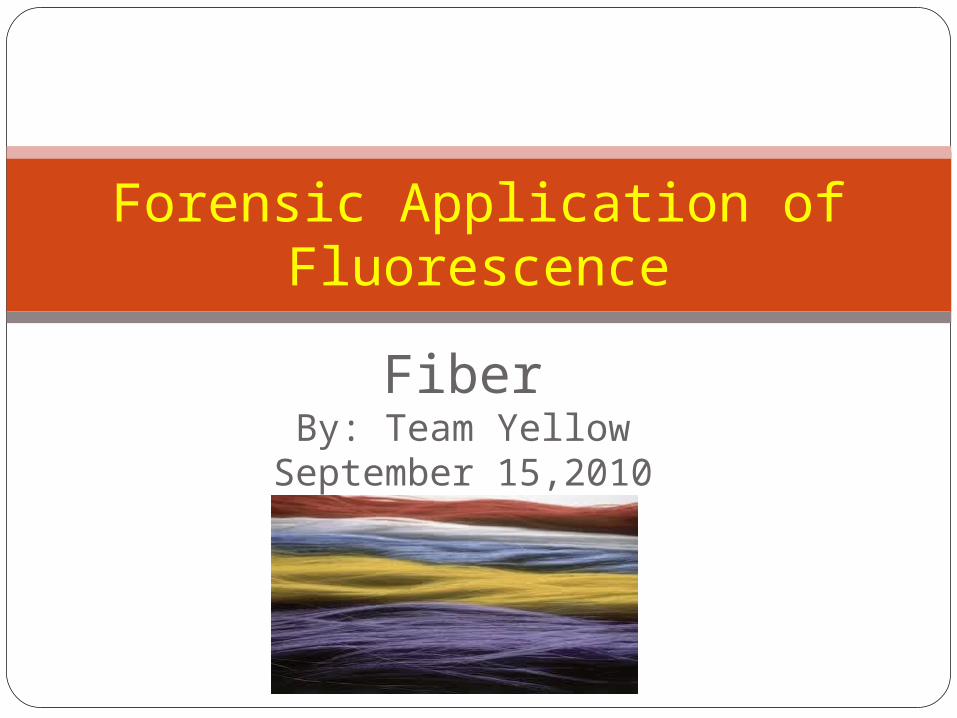
FiberBy: Team Yellow
September 15,2010
Forensic Application of Fluorescence
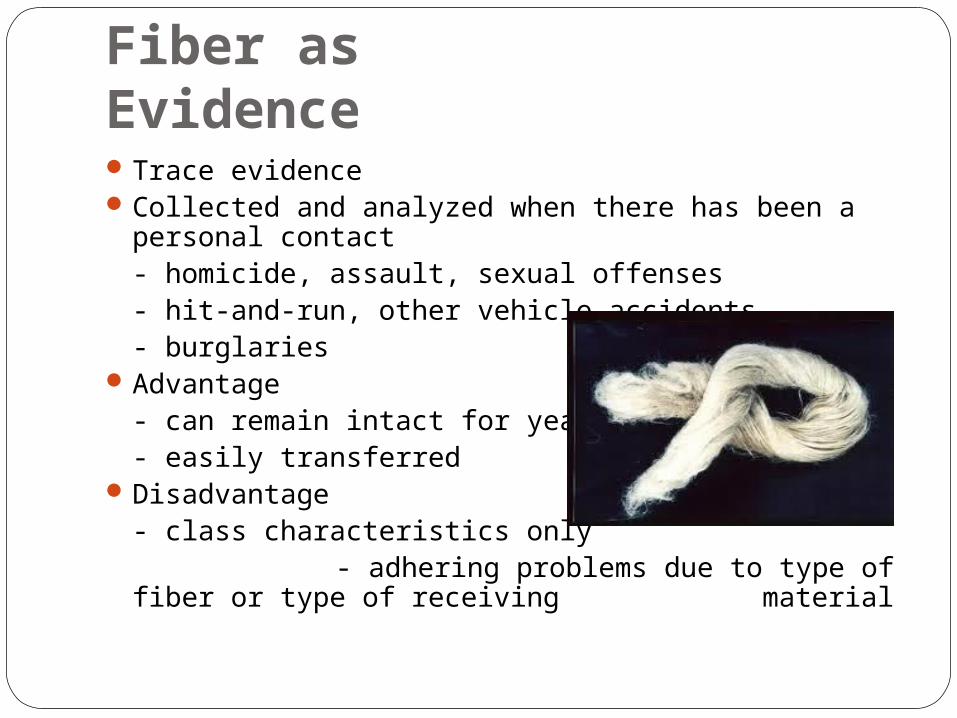
Fiber as EvidenceTrace evidenceCollected and analyzed when there has been a
personal contact- homicide, assault, sexual offenses- hit-and-run, other vehicle accidents- burglaries
Advantage- can remain intact for years- easily transferred
Disadvantage- class characteristics only
- adhering problems due to type of fiber or type of receiving material
Uses in forensic science labsExamine transferred fibers and compare them to a
known or reference fiber to find its originFluorescence of the dyes are added to fibersIdentification/Comparison: 1) Type e.g. synthetic
polymer and 2) Subtype e.g. nylon Main classification scheme: method of dye
application Ex) acid (wool or silk), basic (polyester), direct
(cotton or rayon), disperse (polyester or acetate) dyes
Cannot identify a particular dye or mixture of dyes
Analytical MethodsPolarized light microscopy (PLM)Energy dispersive X-ray analysisThin layer chromatography (TLC)High performance liquid chromatography (HPLC)Pyrolysis gas chromatography (PGC)Fourier transform infrared spectroscopyRaman spectroscopyUV-VIS & Fluorescence MSP:
nondestructive, prevent contamination, decrease overall analysis, are direct, and inexpensive
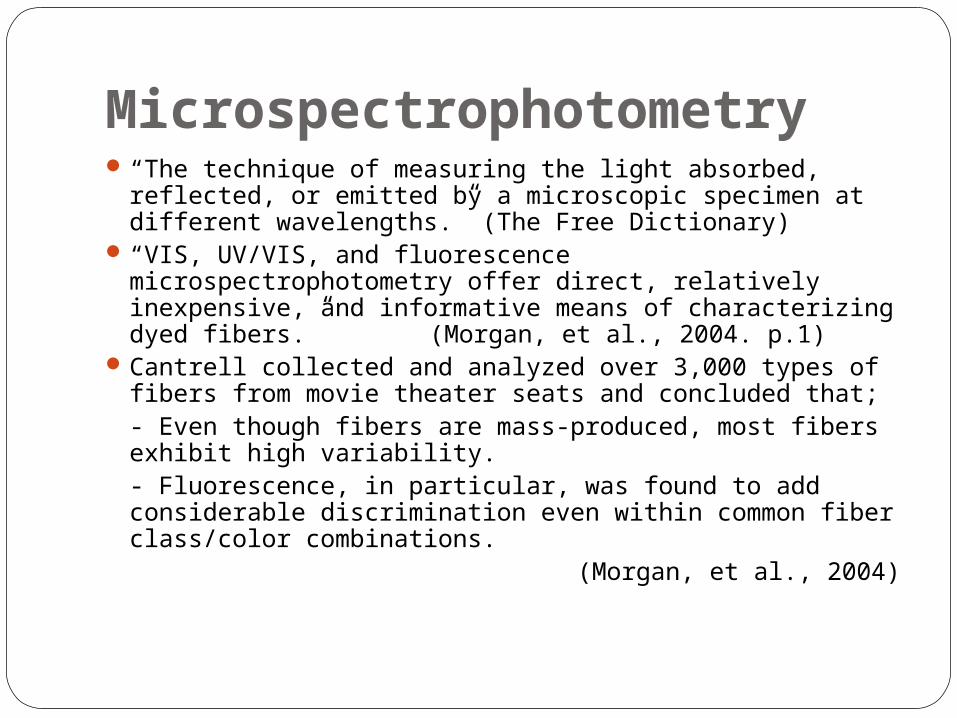
Microspectrophotometry“The technique of measuring the light absorbed,
reflected, or emitted by a microscopic specimen at different wavelengths.” (The Free Dictionary)
“VIS, UV/VIS, and fluorescence microspectrophotometry offer direct, relatively inexpensive, and informative means of characterizing dyed fibers.”
(Morgan, et al., 2004. p.1)Cantrell collected and analyzed over 3,000 types of
fibers from movie theater seats and concluded that;- Even though fibers are mass-produced, most
fibers exhibit high variability.- Fluorescence, in particular, was found to add
considerable discrimination even within common fiber class/color combinations.
(Morgan, et al., 2004)

InstrumentLight Source: UV-VIS uses Xenon,
Fluorescence MSP uses Mercury lampDetector: QDI 1000
Microspectrophotometer (MSP) using GRAMS/AI 7.00 software for data acquisition

Detector 100 scans of four different yellow fibers where taken and
averaged over a spectrum range of 200-850nm Two multivarient data analysis to record and obtain
numerous spectra with more than one feature
1. Principle Component Analysis (PCA)
--Unsupervised technique
--Determines linear combinations between original variations and maximum variations of data set
2. Linear Discrimination Analysis (LDA)
--Supervised technique
--Determine linear combinations of features that best separate the data into two or more predefined
groups

UV-VIS using PCA vs. LDA
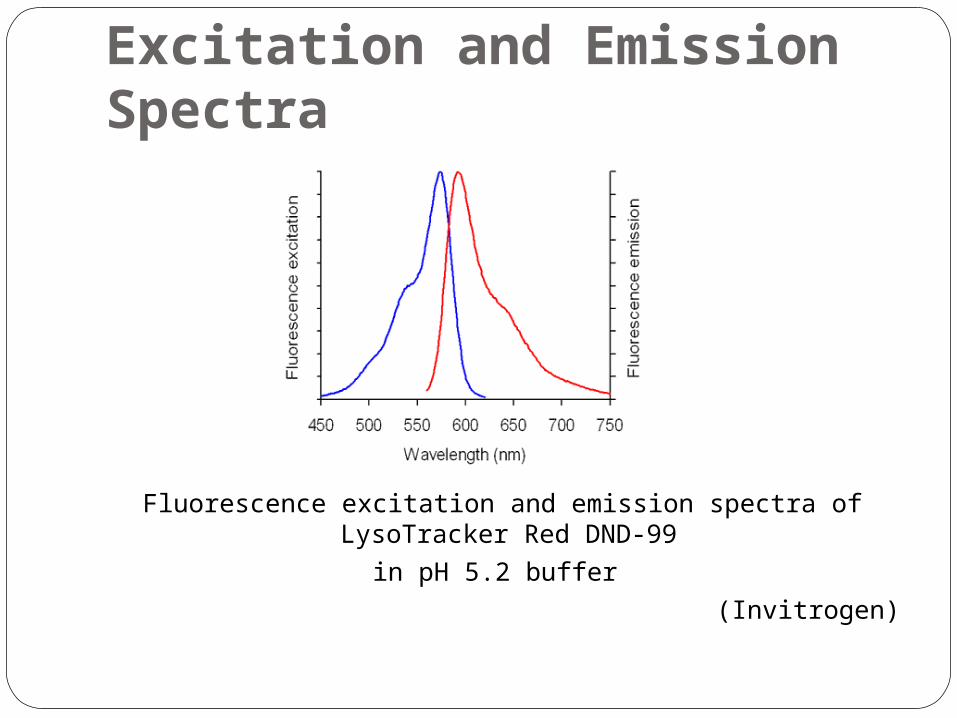
Excitation and Emission Spectra
Fluorescence excitation and emission spectra of LysoTracker Red DND-99
in pH 5.2 buffer
(Invitrogen)
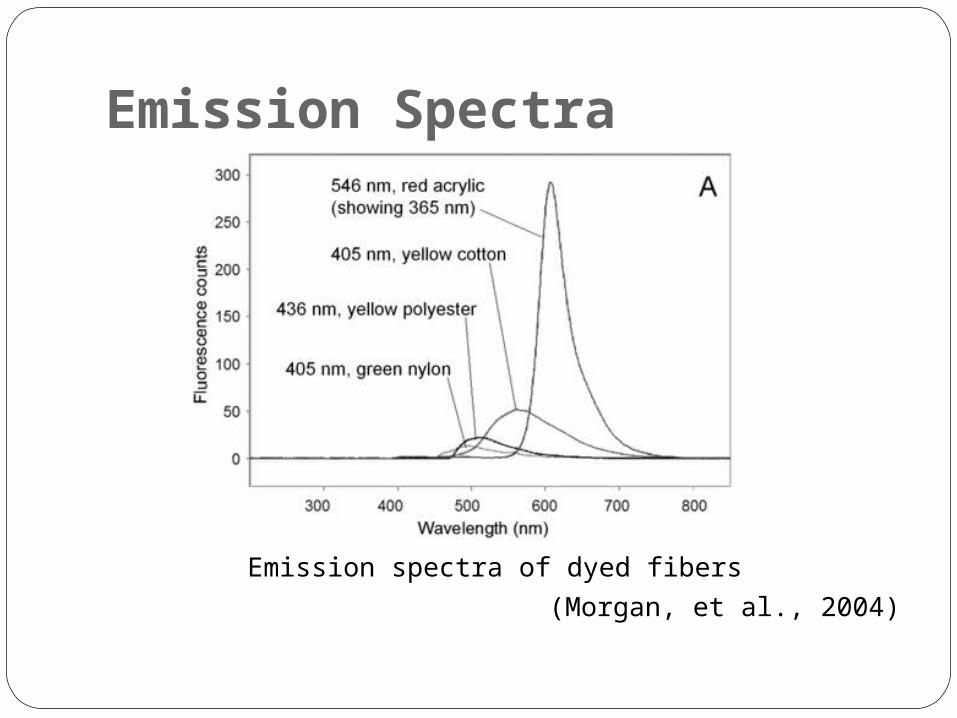
Emission Spectra
Emission spectra of dyed fibers
(Morgan, et al., 2004)

Emission Spectra
Emission spectra of red acrylic fiber using different excitation wavelengths
(Morgan, et al., 2004)

Absorption vs. Fluorescence spectrum of 3 red polyester fibers (at excitation 546nm)
Potential problems, InterferencesWhen dealing with fibers you must know a
head of time the general chemical nature, i.e.: Acidic, basic, or neutral
Two other types of interference are: extraction solvents & possible degradations e.g. organic solvents used in the extraction of the fiber dye can either negatively impact the separation or present interferences to a UV–visible detector
Solution: Antioxidants, prompt analysis, and low extraction temperatures are used to combat against dyes that have been degraded
Conclusion1. The groups of fluorescence spectra can
be visually distinguished from one another, which cannot be done with the UV-VIS spectra
2. At least for certain fiber/dye combinations, fluorescence spectra appear to exhibit higher discrimination power than UV-VIS absorbance spectra
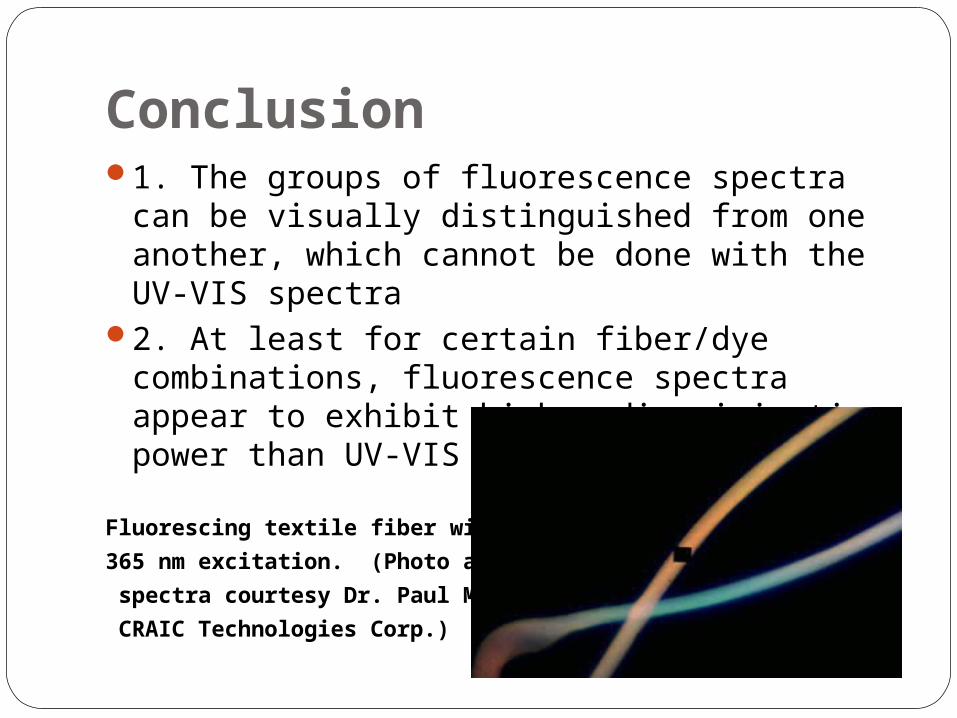
Fluorescing textile fiber with
365 nm excitation. (Photo and
spectra courtesy Dr. Paul Martin,
CRAIC Technologies Corp.)
References Invitrogen. (2010). Product spectra. Retrieved from
http://www.invitrogen.com/site/us/en/home/support/Product-Technical-Resources/Product-Spectra.7528p52.html
Microspectrophotometry. The American Heritage® Medical Dictionary. (2007). Retrieved from http://medical-dictionary.thefreedictionary.com/microspectrophotometry
Morgan, S. L., Nieuwland, A. A., Mubarak, C. R., Hendrix, J. E., Enlow, E. M., & Vasser, B. J. (2004). Forensic discrimination of dyed textile fibers using UV-VIS and fluorescence microspectrophotometry. Proceedings of the European Fibres Group, 25 May 2004. Retrieved from http://www.chem.sc.edu/faculty/morgan/pubs/Bartick_et_al_EuropeanFibresGroup_2004.pdf